Article

Effects of Fertilizer Level and Intercropping Planting Pattern with Corn on the Yield-Related Traits and Insect Community of Soybean

1
Department of Entomology, College of Plant Protection, Nanjing Agricultural University, Nanjing 210095, China
2
Soybean Research Institute, MARA National Center for Soybean Improvement , MARA Key Laboratory of Biology and Genetic Improvement of Soybean, National Key Laboratory for Crop Genetics and Germplasm Enhancement, Jiangsu Collaborative Innovation Center for Modern Crop Production, Nanjing Agricultural University, Nanjing 210095, China
*
Author to whom correspondence should be addressed.
Agronomy 2022, 12(12), 3080; https://doi.org/10.3390/agronomy12123080
Submission received: 29 September 2022 / Revised: 7 November 2022 / Accepted: 20 November 2022 / Published: 5 December 2022
(This article belongs to the Special Issue Frontier Studies in Legumes Genetic Breeding and Production)

Abstract

:
Intercropping of corn and soybean is widely practiced in agricultural production. However, few studies have investigated the effect of intercropping and fertilizer reduction on soybean yield. In the present study, corn and soybean were interplanted in 2:2, 2:3 and 2:4 ratios. Two fertilizer levels (normal: 600 kg/ha VS. reduced: 375 kg/ha) were set. The effects of fertilizer levels and intercropping planting patterns on the growth and yield of intercropping soybeans were studied based on the changes in enzyme activities related to nitrogen metabolism and insect community in the field. The results show that fertilizer reduction significantly reduced the biomass, 100-seed weight and yield of soybean. Intercropping also reduced these yield-related traits; a decreasing trend was more obvious with a decrease in soybean ratio. Intercropping had greater effect on soybean plant biomass, 100-seed weight and yield than fertilizer reduction. Reduction in fertilizer reduced the activities of nitrogen-metabolism-related enzymes in soybean. In addition to increased NR (nitrate reductase) enzyme activity in R5, intercropping planting pattern also had negative effect on the activities of nitrogen-metabolism-related enzymes in soybean. Reduced fertilizer only significantly reduced the Pielou evenness index. Reduced fertilizer application was beneficial with respect to the outbreak of greenhouse whitefly. However, an intercropping planting pattern can significantly increase the number of species, as well as the Shannon–Wiener diversity index and the Pielou evenness index of the insect community, and significantly reduce the Simpson dominance index and the population of the important pest, green leafhopper. In conclusion, C2S4 (two corn rows with four rows of soybean) is a scientific intercropping planting pattern that can reduce the occurrence of pests through ecological regulation and does not significantly reduce the activity of enzymes-related to nitrogen metabolism in most cases, ensuring soybean yield.

1. Introduction

Soybean (Glycine Max L.) is a leguminous crop with a strong ability to fix nitrogen, the growth of which does not extensively depend on soil nitrogen sources [1]. Soybean has high nutritional value. It can be used as human food or animal feed. As one of the top agricultural commodities worldwide, the development of soybean has a strong impact on society and the environment [2]. Therefore, it is of considerable significance to increase soybean yield.
In agricultural production, intercropping can improve the efficiency of resource utilization, increase yield and reduce pests and diseases [3,4,5]. Legume–cereal combinations are the most common intercropping systems [6]. The corn–soybean intercropping mode is widely used in China, with increasing planting area [7]. At present, corn–soybean intercropping mainly adopts 2:2 and 2:3 modes, and 2:4 and 2:6 modes are still in the exploratory stage [8,9]. Some studies have shown that under intercropping modes, the row ratio of corn and soybean should be 2:4, which is the optimal planting mode for soybean [10]. However, some intercropping planting patterns have been reported to have negative effects on soybean yield and seriously affect soybean yield and quality when intercropping with cereal crops [11]. The biomass and seed yield of soybean were decreased under intercropping [12]. In the intercropping mode of corn and soybean, the growth of soybean was inhibited as a subordinate crop [10]. Under the intercropping mode of corn and soybean, the problem of soybean lodging was aggravated by the influence of shading [13], biomass and seed number decreased and yield decreased [7]. Shading can also increase isoflavone and fatty acid contents in soybean, which can partially improve soybean flavor quality and lipid nutrition [14]. Intercropping yields can also exceed the sum of the corresponding single-crop yields, with an increased yield advantage [15,16,17]. Wheat and broad bean intercropping were reported to increase the root dry weight of broad bean, promote nutrient absorption and increase yield [18].
On the other hand, the excessive use of pesticides and fertilizers in agricultural production is a serious issue. Excessive application of chemical nitrogen fertilizer in intercropping systems can reduce fertilizer efficiency and even reduce yield, in addition to causing environmental problems [19,20,21]. Fertilizer is related to the activity of enzymes associated with crop nitrogen metabolism, such as soil proteases, which affect the nitrogen supply capacity of soil [22]. Nitrate reductase participates in nitrogen assimilation and promotes nitrogen uptake by plants [23]. The intercropping planting pattern of corn and soybean plays an important role in the growth and yield improvement of corn, which has been comprehensively studied with respect to the nutrient absorption and light conditions of corn [24,25,26,27]. An appropriate reduction in nitrogen fertilizer input is beneficial to increase the number of seeds per pod and the 100-seed weight of soybean [14].
Furthermore, intercropping can increase insect diversity and the number of natural enemies [28], thus reducing the occurrence of pests [29,30,31,32]. Intercropping of mung bean and garlic can increase the number of natural enemies of mites and reduce the number of mites, with a positive control effect on wheat heraldry blight [33]. Windbreaks can increase the abundance of natural enemies of soybean [34]. Accordingly, it has also been suggested that corn can influence wind turbulence in intercropping soybean belts, thereby increasing the abundance of predatory insects in soybeans [35]. Additionally, intercropping with wheat was reported to significantly reduce the incidence of fusarium wilt of broad bean [18].
At present, research on intercropping of soybean is lacking. In the context of global advocacy for sustainable development, reducing the use of chemical fertilizers and pesticides in agricultural production is of considerable significance. In the present study, we assume that the yield and insect community of soybean are affected by intercropping mode with corn and fertilizer reduction and that the nitrogen-fixing capacity of soybean may reduce the impact of fertilizer reduction on seed yield. The purpose of the present study was to investigate the effects of intercropping and fertilizer reduction on soybean growth and yield from two perspectives: the activity of nitrogen metabolism enzymes under corn and soybean interaction and the regulation of insect community. Our goal was to establish a scientific mode of corn and soybean intercropping and elucidate the mechanism of its high yield.

2. Materials and Methods

2.1. Experimental Location and Crop Cultivars

The experiment was conducted in the Jiyang district of Shandong province, China (36°58′ N, 117°13′ E). The forecrop is winter wheat, and the same variety and planting pattern with unified management of water and fertilizer was applied. The soil type in this area is mud-silt sand white soil, which belongs to tidal sand soil, and the cultivated layer is about 20 cm. The soil PH was 7.96, and the basic fertility parameters were as follows: total carbon, 0.67 g/kg; total nitrogen, 0.76 g/kg; available phosphorus, 28.97 mg/kg; available potassium, 99.84 mg/kg; and organic carbon, 6.63 g/kg. Corn (cv. Liangyu 99) was provided by Dandong Denghai Liangyu Seed Industry Co., Ltd. (Dandong city, Liaoning province, China), and soybean (cv. Xindou 1) was provided by Jinan Zhaohui Seed Industry Co., Ltd. (Jinan city, Shandong province, China). This variety is of high quality, with good taste and high oil and protein contents. The local climate conditions during the test period are shown in Figure 1. The test period lasted from June to October in 2018 and 2019. The variation trend of monthly mean temperature was similar for the two years, but the monthly mean precipitation and monthly mean relative humidity differed considerably (Figure 1). The average monthly precipitation from March to October 2018 was significantly higher than that of the same period in 2019 (Figure 1).

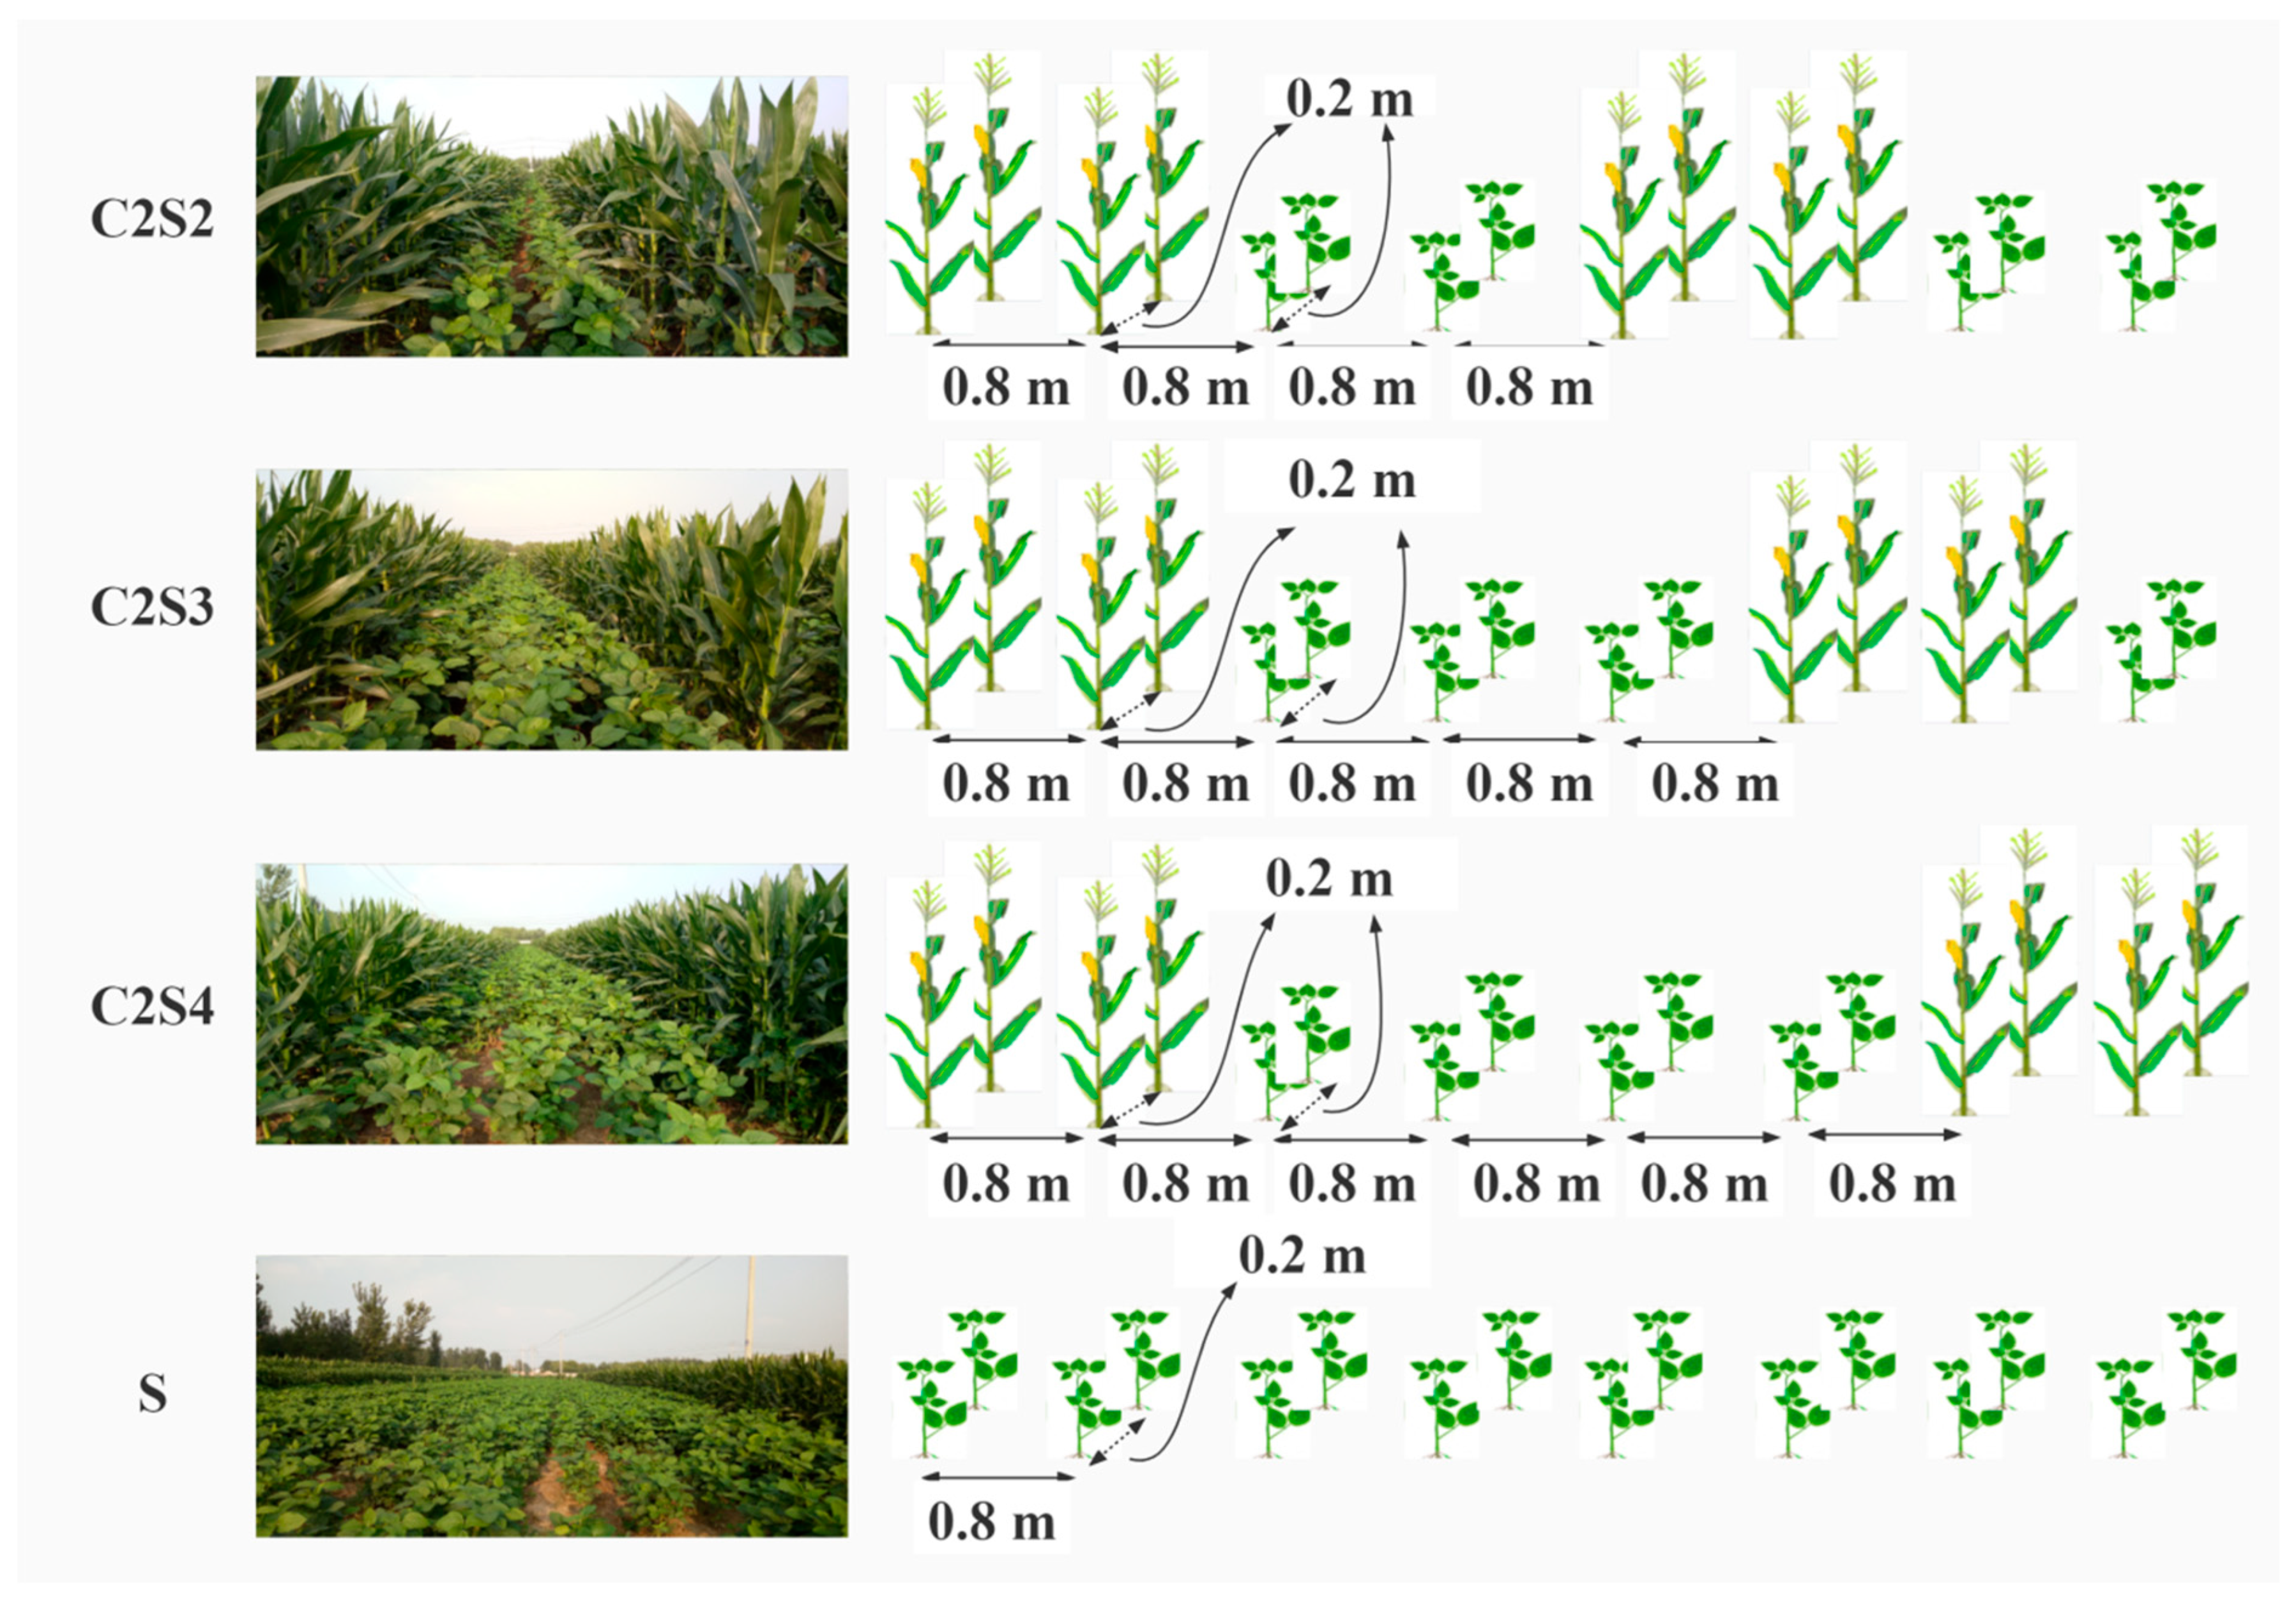
2.2. Experimental Design and Field Management

In the present experiment, the Snaydon [36] method was for replacement intercropping. Four planting patterns were adopted, including three intercropping planting patterns of corn intercropped with soybean as two corn rows to two, three and four rows of soybean and one sole-crop planting pattern of soybean. Two fertilizer levels were set in the experiment (i.e., normal (600 kg/ha) and reduced (375 kg/ha) levels of NPK (N: P2O5: K2O = 15:15:15) fertilizer). The normal fertilizer level used in present study was based on the fertilizer levels applied by local farmers when growing their crops. A total of 4 planting patterns (P) × 2 fertilizer levels (F) = 8 treatments was included in a completely random design with 3 repetitions. Moreover, the length and width of each plot were 28.8 m and 15.5 m, respectively, with 1.0 m spacing between neighboring plots. In addition, the row spacing and hill spacing of corn and soybean was 0.8 m and 0.2 m, respectively. The spacing between corn rows and soybean rows was also 0.8 m. The planting density of corn and soybean was about 6.25 and 12.5 plants /m2, respectively [37], with one corn plant per hill and two soybean plants per hill (Figure 2). Before sowing, a compound fertilizer was applied to the field while plowing the soil. Corn (C) and soybean (S) were sown on June 16 of 2018 and 2019. Plants were sprayed with herbicides once before planting: acetochlor (Monsanto, St. Louis, MO, USA) and atrazine (Chevron Phillips Chemical Company LP, TX, USA) for corn and soybean, respectively, with one-time irrigation before planting, and no insecticides were sprayed during the whole growing seasons.

2.3. Sample Collection and Determination

On July 25 (R2) and Sept 10 (R5) [38] in 2018 and 2019, the first upper leaves of soybean were collected for a plant assay. All the collected plants samples were stored on dry ice and brought to the laboratory immediately for detection of the activity of N-metabolism-related enzymes in soybean leaves (including glutamine oxoglutarate aminotransferase (GOGAT), glutamate synthetase (GS) and nitrate reductase (NR). The activity of N-metabolism-related enzymes in soybean rhizosphere soil (i.e., soil alkaline protease (S-ALPT) were also assayed using reagent kits [37]. During the harvest period, 10 adjacent soybean plants were randomly selected from each plot and dried in the sun to constant weight, and the biomass and seed yield of each plant were measured by electronic balance (accuracy: 0.1 g; range: 0–5 kg; Shanghai Yaohua Weighing System Co., Ltd., Shanghai, China). The seed yield per hectare was obtained according to the following formula: yield per hectare (kg) = number of plants at sample point/area of sample point (m2) * 10,000 * seed yield per plant (g)/1000. A sample of 100 seeds per plot was randomly selected to weigh to obtain the 100-seed weight (accuracy: 0.1 g; range: 0–5 kg; Shanghai Yaohua Weighing System Co., Ltd., Shanghai, China).

2.4. Insect Investigation

Using the five-point sampling method, ten plants were randomly selected from all of the sole-crop soybean and intercropping treatments with normal fertilizer and reduced fertilizer, respectively. Insect surveys were conducted 7 times each year for all 3 repetitions, the first of which began on July 25, with subsequent inspections conducted every 10 days. All insects on the soybean plants were surveyed, including pests and natural enemies. Insect diversity indices were calculated as described by Li et al. [37], including the species number (S), Shannon–Wiener diversity index (H), Pielou evenness index (E) and Simpson dominance index (D). These diversity indices were calculated based on the species and number of sampled insects for each evaluation. The following formulae were used:
Shannon–Wiener diversity index:
H = i = 1 S P i × ln ( P i ) P i = N i / N
Pielou evenness index:
E = H / H max H max = ln S
Simpson dominance index:
D = i = 1 S ( P i ) 2 P i = N i / N
where Pi is the relative abundance of insect species i, Ni is the number of individuals of species i, N is the total number of individuals of all species in the community, H is the Shannon–Wiener diversity index, S is the number of species in the community and Hmax is the maximum species diversity index.

2.5. Statistical Data Analysis

All data were analyzed with SPSS 20. (IBM, Armonk, NY, USA), and three-way ANOVAs were used to analyze the effects of sampling year (Y), fertilizer level (F), intercropping planting pattern (P) and their interactions on the biomass per plant, 100-seed weight and yield per ha. Four-way ANOVAs were used to analyze the effects of sampling year (Y), fertilizer level (F), intercropping planting pattern (P), growth stage (G) and their interactions on the activity of N-metabolism-related enzymes. Three-way repeated-measure ANOVAs were used to analyze the effects of sampling year (Y), fertilizer level (F), intercropping planting pattern (P) and their interactions on insect community diversity and major pest on soybean. Significant differences between different fertilizer levels or among different intercropping planting patterns were analyzed by using LSD test at p < 0.05.

3. Results

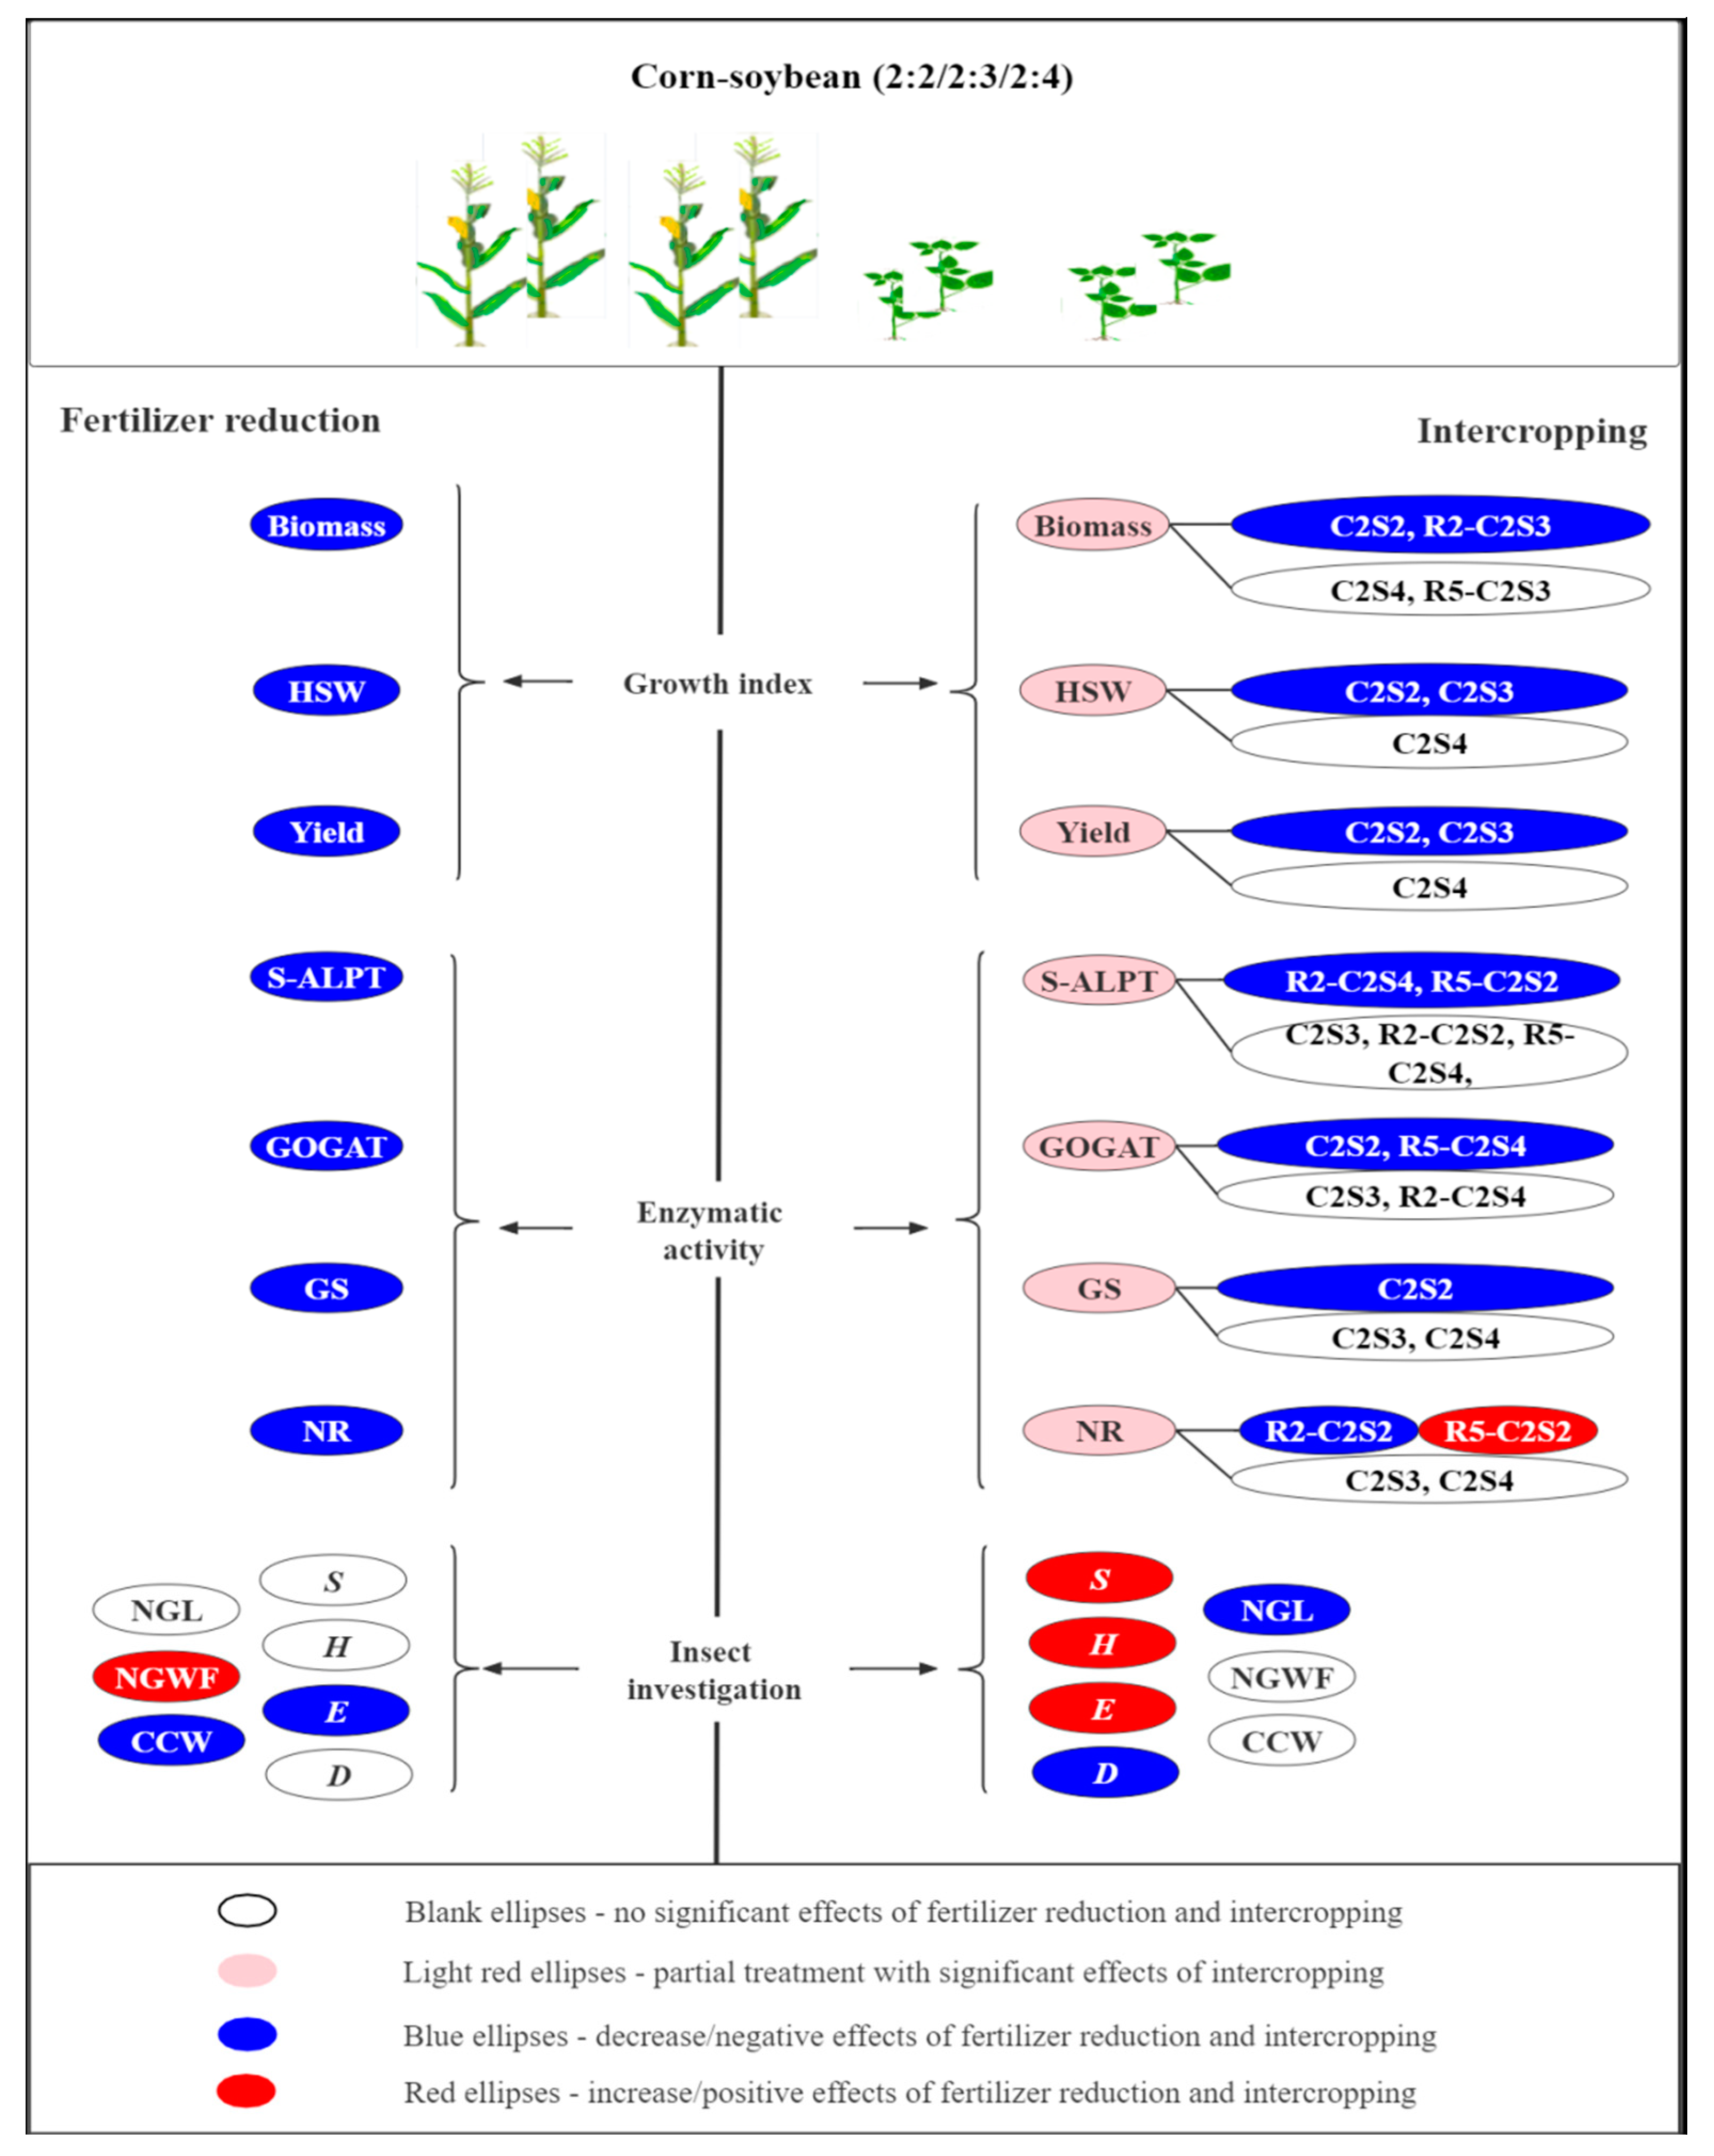
3.1. Effects of Fertilizer Reduction and Intercropping on Soybean Biomass, 100-Seed Weight and Yield

The three-way ANOVAs showed that fertilizer level and intercropping planting pattern had significant effects on biomass per plant at both the R2 and R5 stages, as well as on 100-seed weight and yield of soybean (Table 1). In addition, the biomass of soybean plants in the R2 stage was differed significantly between years and among the interaction of years and fertilizer levels. The interaction of years and intercropping planting patterns significantly affected the biomass per soybean plant (p < 0.01) in both the R2 and R5 stages. The interaction of fertilizer level and intercropping planting pattern significantly affected the biomass per plant at R5, as well as the 100-seed weight of soybean (p < 0.01, Table 1). The interaction of the three factors only significantly affected the biomass per plant of soybean in the R5 stage (p < 0.01, Table 1).
Data analysis showed that each yield-related indicator was consistent in the two-year experiment. As shown in Table 2, the biomass per plant of soybean decreased significantly with reductions in fertilizer level (−11.9%, R2; −11.9%, R5). Intercropping panting patterns also reduced biomass per plant compared with sole-crop soybean. In the R2 stage, the intercropping planting patterns decreased the biomass per plant by −35.8% (C2S2), −27.8% (C2S3) and −20.4% (C2S4), respectively, among which C2S3 and C2S2 reached a significant level. In the R5 stage, the intercropping planting pattern decreased the biomass per plant by −46.7% (C2S2), −28.9% (C2S3) and −25.4% (C2S4), respectively, with C2S2 reaching significance level (Table 2). The effect of intercropping on biomass in the R5 stage was greater than that during the R2 growth stage, with a more considerable effect than that of fertilizer reduction.
Fertilizer reduction also reduced the 100-seed weight of soybean (−7.0%). Compared with sole-crop soybean, the 100-seed weight of soybean in intercropping also decreased (−22.0%, C2S2; −16.0%, C2S3; −8.9%, C2S4), among which C2S3 and C2S2 reached significant levels (Table 2). The effect of intercropping on 100-seed weight was more consideration than that of fertilizer reduction.
Similarly, fertilizer reduction significantly reduced soybean yield (−6.1%). As expected, soybean yields were also lower under intercropping planting patterns compared with sole-crop soybean (−40.2%, C2S2; −31.6%, C2S3; −14.4%, C2S4), among which C2S2 and C2S3 reached a significant level (Table 2). Similar to biomass and 100-seed weight, intercropping had a more considerable effect on yield than fertilizer reduction (Table 2).

3.2. Effects of Fertilizer Reduction and Intercropping on Enzyme Activities Related to Nitrogen Metabolism

According to four-factor analysis of variance, fertilizer level (F), intercropping planting pattern (P), growth stage (G) and the interaction between P and G have a significant impact on the activities of four enzymes (Table 3). Only GS and NR were significantly affected by sampling year (Y). In addition, Y × F had a significant effect on GOGAT. Y × P had a significant effect on GOGAT, GS and NR. Y × G had a significant influence on S-ALPT, GOGAT and NR. F × G had a significant influence on S-ALPT and GOGAT. Y × F × G had a significant effect on GOGAT and GS. Y × P × G had a significant influence on S-ALPT and NR.
Compared with the normal fertilizer level, the activities of the four enzymes were significantly decreased during the R2 (−7.0~−26.0%) and R5 (−15.8~−25.4%) stages under reduced fertilizer application (Table 4). Compared with sole-crop soybean, except for SALPT in the R2 stage and NR in the R5 stage, the activities of all four enzymes showed a decreasing trend with decreased soybean planting ratio; among them, C2S2 decreased to a significant level compared with sole-crop soybean (Table 4). Compared with sole-crop soybean, S-ALPT activity decreased under intercropping during the R2 stage, and C2S4 decreased the most (−9.8%), reaching a significant level. Compared with sole-crop soybean, NR activity increased under intercropping in the R5 stage, and C2S2 increased the most (+17.9%), reaching a significant level.
The activities of GOGAT in the R5 stage were reduced substantially compared with the R2 stage, both under normal fertilizer (16.5 vs. 26.1) and under reduced fertilizer (13.6 vs. 23.2) (Table 4). However, the activity of the other three enzymes showed relatively little reduction in either period (Table 4). In general, GS activity was lower in 2019 (25.1) than in 2018 (26.2), whereas NR activity was higher in 2019 (6.2) than in 2018 (5.7).

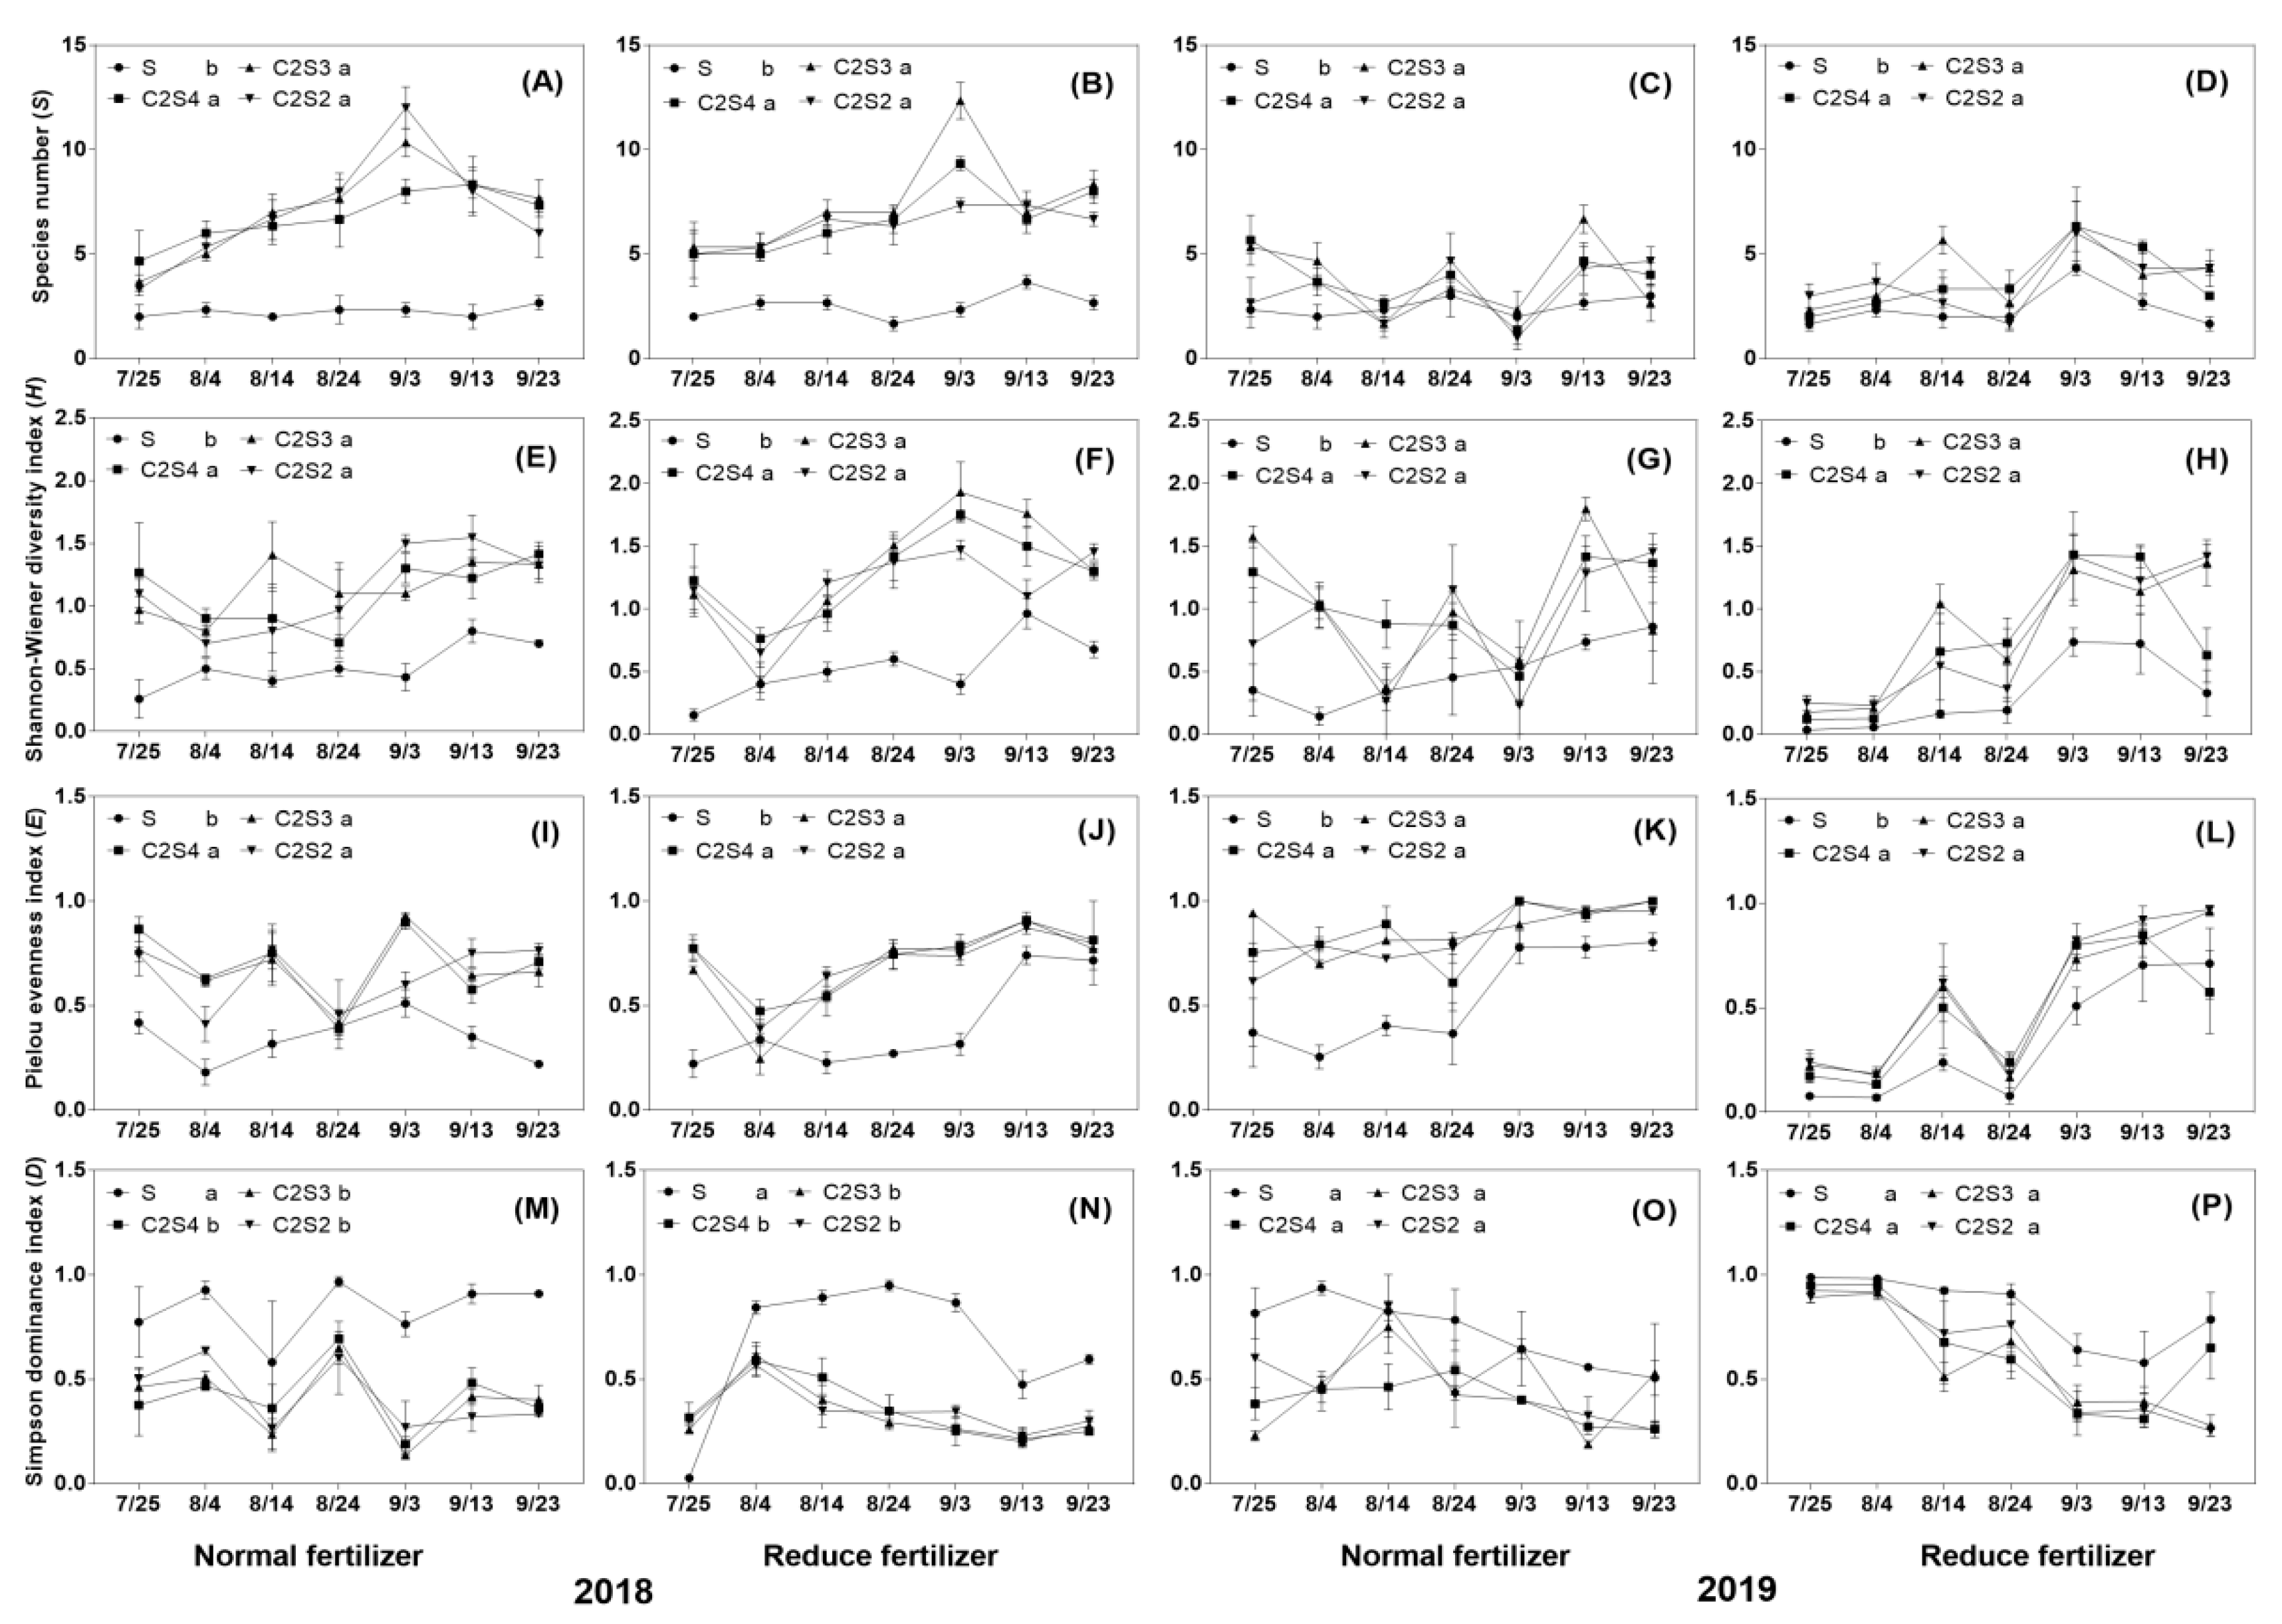
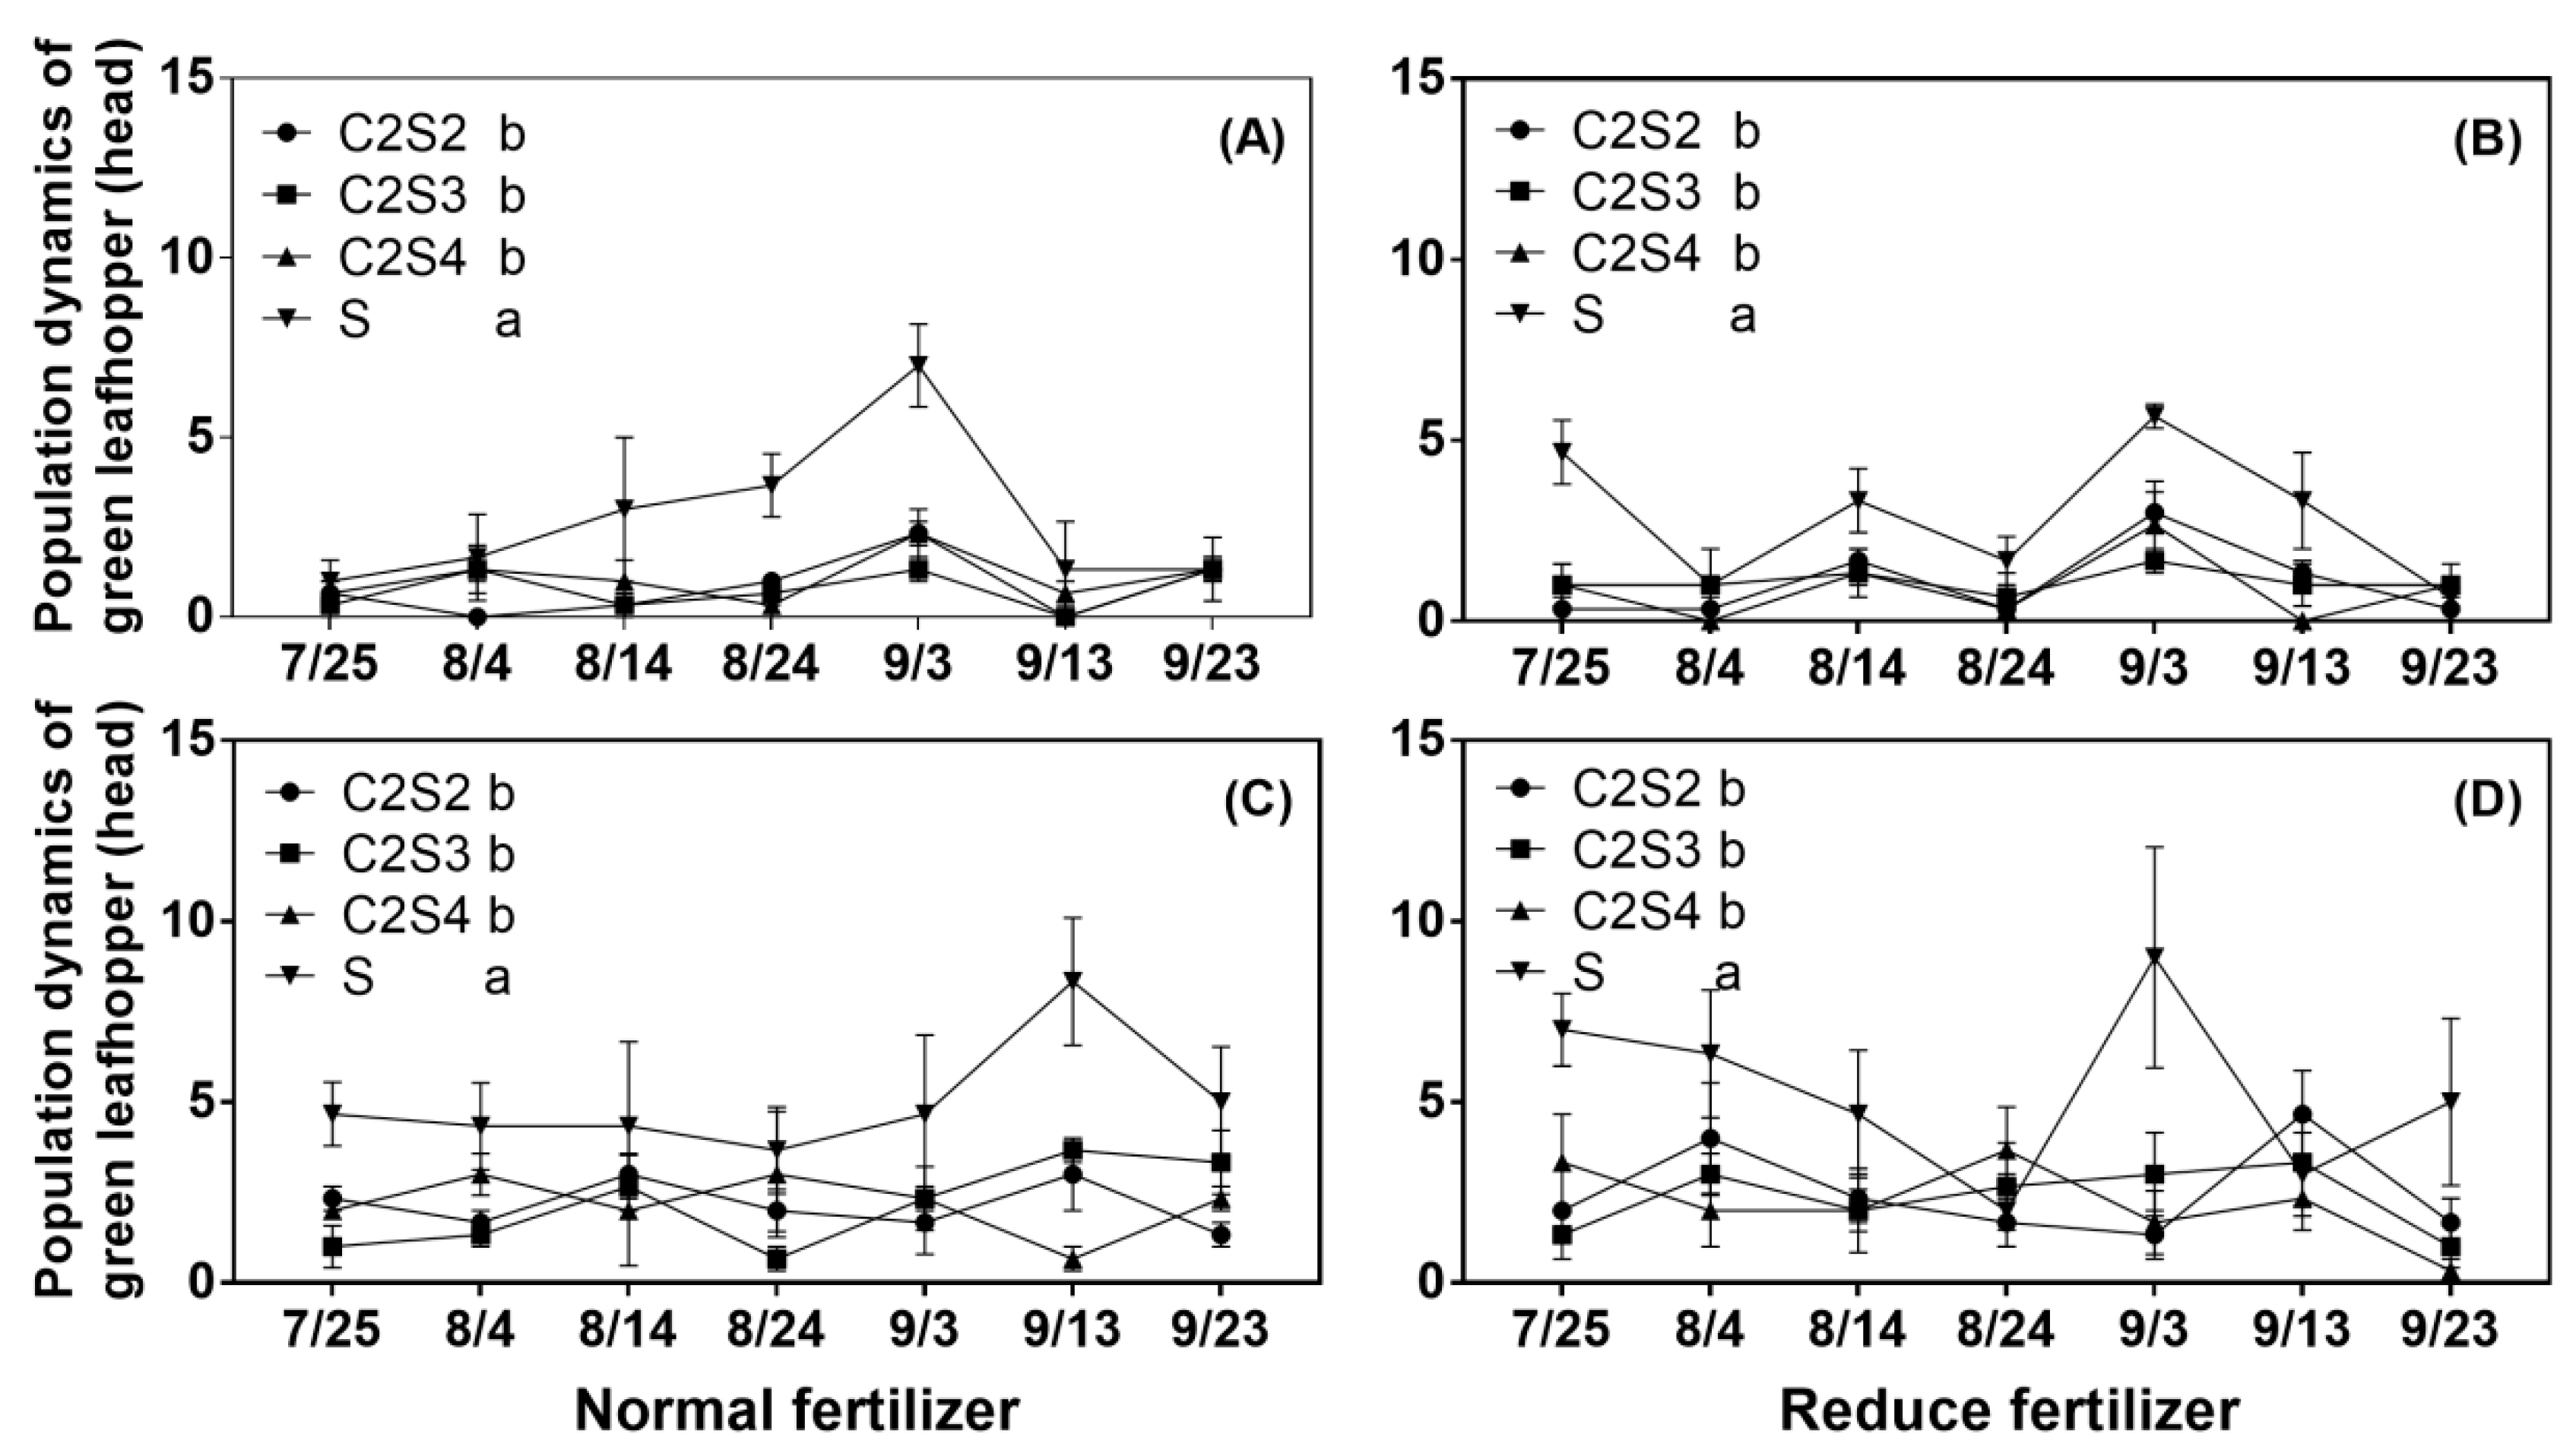
3.3. Effects of Fertilizer Reduction and Intercropping on Insect Diversity Index and Population Dynamics of Major Pests

In the two-year insect survey, a total of 19 insect pest species were investigated, among which the number of greenhouse whitefly (NGWF) was the largest in each treatment. The number of green leafhoppers (GL) was much higher than that of other pests, except for greenhouse whiteflies. A total of five species of natural enemies were investigated, and with the largest population corresponding to the green river long-legged fly (Dolichopus qinghensis) (Table 5).
Insect species differ in terms of requirements for ambient temperature and humidity, resulting in differences in the number of pests in the two years under study. The number of greenhouse whiteflies was higher in 2018 than in 2019, although with a large population in both years. The number of greenhouse whiteflies that occurred under both intercropping and sole-crop soybean under a normal fertilizer level was smaller than that under the fertilizer reduction condition (Table 5). The number of bean bugs (Riptortus pedestris) in 2018 was significantly higher than that in 2019, but was not significantly affected by the fertilizer level. The interannual occurrences of common cutworm (Spodoptera litura Fabricius) in 2018 was also higher than that in 2019 (Table 5). In contrast, the number of green leafhopper (Cicadella viridis) in 2019 was significantly higher than that in 2018. Asiatic migratory locust (Locusta migratoria) occurred in greater numbers in 2019. The number of major natural enemy insects, i.e., green river long fly (Dolichopus qinghensis), was higher in 2018 than in 2019 (Table 5). The effect of fertilizer reduction was not significant.
Three-way repeated-measure ANOVAs on the four diversity indices (S, H, E and D) of insects revealed significant differences in every index across years. Fertilizer level only had a significant impact on the E index of the insect community on soybean plants (p < 0.001, Table 6). Intercropping planting pattern had a significant impact on S, H, E and D. H, E and D were significantly affected by the interaction between sampling year and fertilizer level. The interaction between sampling year and intercropping planting pattern has a significant influence on S, H, E and D. The interaction between fertilizer level and intercropping planting pattern only had a significant effect on E (p = 0.003, Table 6).
Many kinds of pests were found to occur in the soybean field, among which five kinds of pests (greenhouse whitefly (Trialeurodes vaporarioru), green leafhopper (Cicadella viridis), bean bug (Riptortus pedestris), Asiatic migratory locust (Locusta migratoria manilensis), common cutworm (Spodoptera litura Fabricius)) occurred most frequently and were analyzed by three-factor repeated-measure analysis of variance according to the number of pests. The results showed that there were significant differences in the number of the five pests between years (p < 0.05, Table 7). In addition, fertilizer level had a significant effect on greenhouse whitefly (p < 0.001, Table 7) and common cutworm (p = 0.035, Table 7), whereas intercropping planting pattern had a significant effect on green leafhopper (p < 0.001, Table 7).
As shown in Table 6 and Table 8, fertilizer level had no significant effect on S, H or D. However, fertilizer reduction can significantly reduce E (−19.1%) (Table 8), and intercropping planting patterns have significant effects on the four insect diversity indicators. Compared with sole-crop soybean, S (+111.7~+133.8%), H (+117.4~+134.8%) and E (+65.9~+68.3%) increased significantly under all three intercropping planting patterns, whereas D (−39.5~−40.8%) decreased significantly (Table 8, Figure 3). There was no significant difference among the three intercropping planting patterns for S, H, E and D (Table 8, Figure 3). In addition, fertilizer reduction had no significant effect on the main insect green leafhopper (Table 7 and Table 8), whereas intercropping planting patterns had a significant effect on this insect population. Compared with sole-crop soybean, the number of green leafhoppers per 10 plants decreased significantly under all three intercropping planting patterns (−56.1~−59.6%). There was no significant difference among the three intercropping planting modes (Table 8, Figure 4). In addition, the intercropping planting pattern had no significant effect on the greenhouse whitefly. However, fertilizer reduction had a significant effect on this insect population. Compared with normal fertilizer, the number of greenhouse whiteflies per 10 plants increased significantly (+115.2%) (Table 8). The results show that reduced fertilizer application was beneficial with respect to the outbreak of greenhouse whitefly infestation. However, the effect of fertilizer level on common cutworm was the opposite. Compared with normal fertilizer, the number of common cutworms per 10 plants decreased significantly (−83.3%) under the fertilizer reduction condition (Table 8).

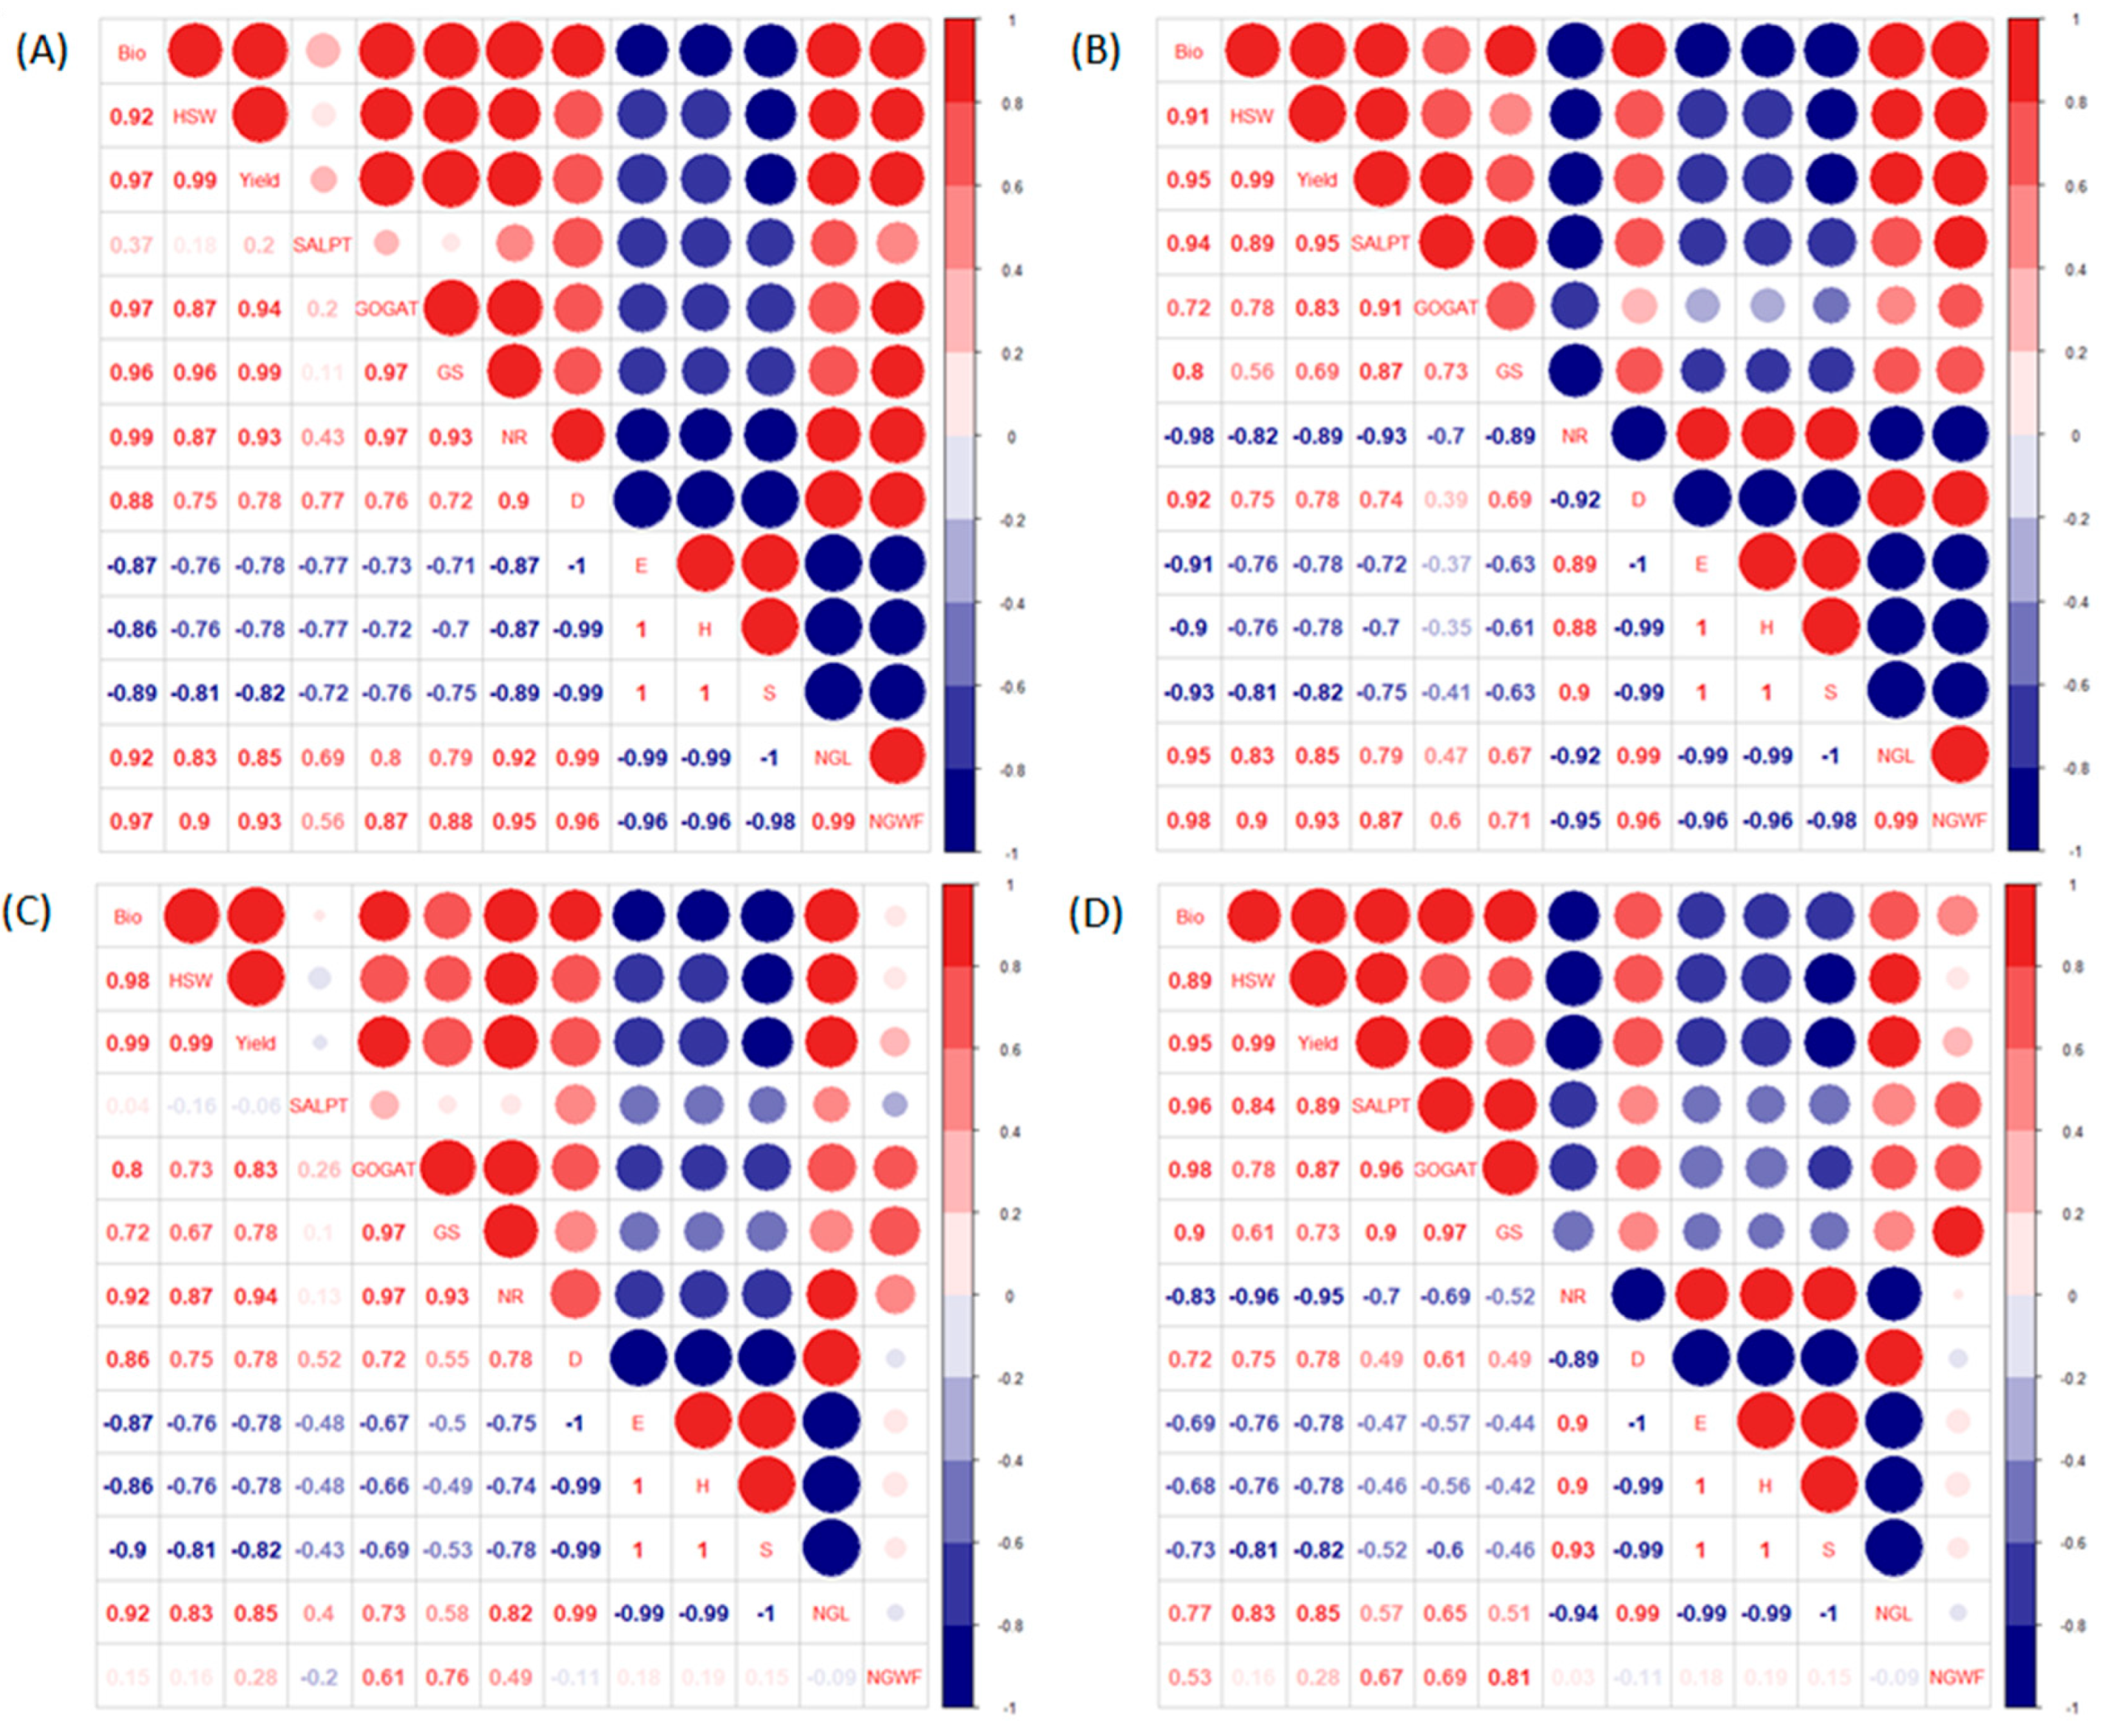
3.4. Correlation Analysis among Agronomic Traits, Nitrogen Metabolism Enzymatic Activity and Insect Community in Soybean

Correlation analysis showed that the correlation under normal fertilizer and fertilizer reduction conditions was consistent in the same soybean growth stage (Figure 5). During the R2 stage, S, H and E were significantly positively correlated, with highly negative correlation with other indicators. Except for SALPT, the agronomic traits, nitrogen metabolism enzymatic activity, dominance index of insect community D and population number green leafhoppers on soybean were higher positively correlated (Figure 5A,C), showing that enzyme activity was beneficial with respect to the promotion of biomass, 100-seed weight and yield. Furthermore, increased dominance of a particular species was not conducive to the diversity and stability of the insect community. The R5 stage is similar to the R2 stage, but the correlations with other indicators of NR are completely opposite (Figure 5B,D). In addition, the positive correlation between SALPT and agronomic traits, as well as with other nitrogen metabolism enzymatic activity in the R5 stage, increased. Under the normal fertilizer condition, NGWF was significantly positively correlated with agronomic traits, the dominance index of the insect community and NGL and significantly negatively correlated with biodiversity indices S, H and E. In the R2 stage, NGWF was significantly positively correlated with the activities of GOCAT, GS and NR. In the R5 stage, NGWF was also significantly positively correlated with SALPT and GS and significantly negatively correlated with NR. Under the reduced fertilizer condition, owing to the explosion of NGWF, its correlation with other traits was relatively limited. During R2, NGWF was significantly positively correlated with GS; during R5, NGWF was significantly positively correlated with SALPT, GOCAT and GS (Figure 6).

4. Discussion

4.1. Effects of Fertilizer Level and Intercropping Planting Pattern on Insect Communities

Two years of experimental data showed that intercropping increased the species diversity of insect communities, similar to previous studies [37]. However, there was no significant difference among the three intercropping planting patterns. Therefore, intercropping of corn and soybean can increase the stability of the insect community and reduce the occurrence of insect pests, which is consistent with the results of other related studies [25,26,27], also supporting Root’s hypothesis [39] that there are more natural enemies in diversified agro-ecosystems. The same conclusion can be drawn in the present study, that is, the population dynamics of green leafhopper decreased significantly under intercropping mode (Figure 5). According to the correlation analysis, the increase in the population number of green leafhoppers did not reduce soybean yield. It was assumed that there was no serious outbreak of green leafhopper in 2018 and 2019, and the population number of green leafhoppers did not result in yield loss, consistent with the research conclusion reported by Tang [40]. However, in theory, intercropping of corn and soybean can effectively reduce the amount of pests and guarantee the yield of soybean. In addition, the peak of S in the field under normal fertilizer and reduced fertilizer conditions in 2018 occurred on September 3, but there was no significant trend in 2019. We speculate that interannual climate and other factors have more influence on insect community than fertilizer level. According to the insect survey results of the present study, 210 plant times were surveyed per year in each treatment, and the average number of pests on each soybean plant was low. Therefore, from the point of view of intercropping pests, intercropping can reduce the number of pests, but it does not represent a major safeguard of soybean yield, which requires further research. In view of the progress in insect resistance evaluation, the selection of insect-resistant soybean varieties in the intercropping mode may increase the output value, as reported by Lamar [41].

4.2. Effects of Fertilizer Level and Intercropping Planting Pattern on Enzyme Activities Related to Nitrogen Metabolism

Correlation analysis showed that the activities of four enzymes related to nitrogen metabolism in the R2 stage were positively correlated with biomass per plant, 100-seed weight and economic yield of soybean (Figure 5), indicating that an increase in enzyme activities related to nitrogen metabolism can promote soybean yield increase, which is consistent with the results of previous studies [22,23]. The present study showed that fertilizer reduction reduced the activity of enzymes related to nitrogen metabolism to a certain extent (−7.0% ~ −26.0%), which was similar to the results of previous studies [42,43]. Intercropping and fertilizer reduction induced similar changes in nitrogen metabolism enzymatic activity. Compared with R2 stage, the nitrogen metabolism enzymatic activity decreased during R5 stage that under both intercropping and sole-crop soybean conditions, regardless of the fertilizer level, especially in GOGAT, the metabolism enzymatic activity of which decreased as much as 41.9%. However, compared with previously published studies, nitrogen-metabolism-related enzyme activities and yield of corn were increased under corn–soybean intercropping [44], whereas the trend was opposite for soybean. Therefore, corn–soybean intercropping has a negative effect on soybean.
A reduction in fertilizer has a negative effect on soybean yield. In addition, the activities of enzymes related to nitrogen metabolism of soybean increased in sole-crop soybean relative to the intercropping. Therefore, corn and soybean intercropping is not conducive to the improvement of enzyme activities related to nitrogen metabolism in soybean, that is, intercropping has a negative effect on soybean yield, in contrast to intercropping of sugarcane and soybean, which increased soil microbial diversity and therefore enzyme activities in the soil [45]. However, the results of present study are consistent with intercropping potato and soybean, which leads to a decrease in soil urease activity and yield [46]. Therefore, soil microorganisms should be added into the experimental plan in a follow-up study in order to explore the relationship between microbial diversity and enzyme activity of nitrogen metabolism under corn and soybean intercropping. The reasons for the decrease in nitrogen metabolism enzyme activity of soybean under intercropping need should be investigated in future studies.

4.3. Effects of Fertilizer Level and Intercropping Planting Pattern on Soybean Yield

Corn and soybean intercropping can reduce the occurrence of soybean pests, although this condition is not sufficient to compensate for the negative effects of intercropping on soybean yield. Analysis of soybean yield data shows that the effects of fertilizer level and intercropping planting pattern on soybean yield were consistent with nitrogen metabolism enzyme activity. The decrease in soybean yield under intercropping may also be caused by a shading effect when intercropping with tall cereal crops [47,48]. However, no significant difference was observed between C2S4 and S, indicating that corn and soybean can be planted in a reasonable intercropping mode with a set row ratio to minimize the loss of soybean yield and ensure soybean production. According to the results of the present study, we suggest corn/soybean row ratio of 2:4 for practical field production. Additionally, as a typical nitrogen-fixing crop, leguminous plants can obtain additional nitrogen fertilizer from the atmosphere through rhizobia [49], which reduces the negative impact of fertilizer reduction.

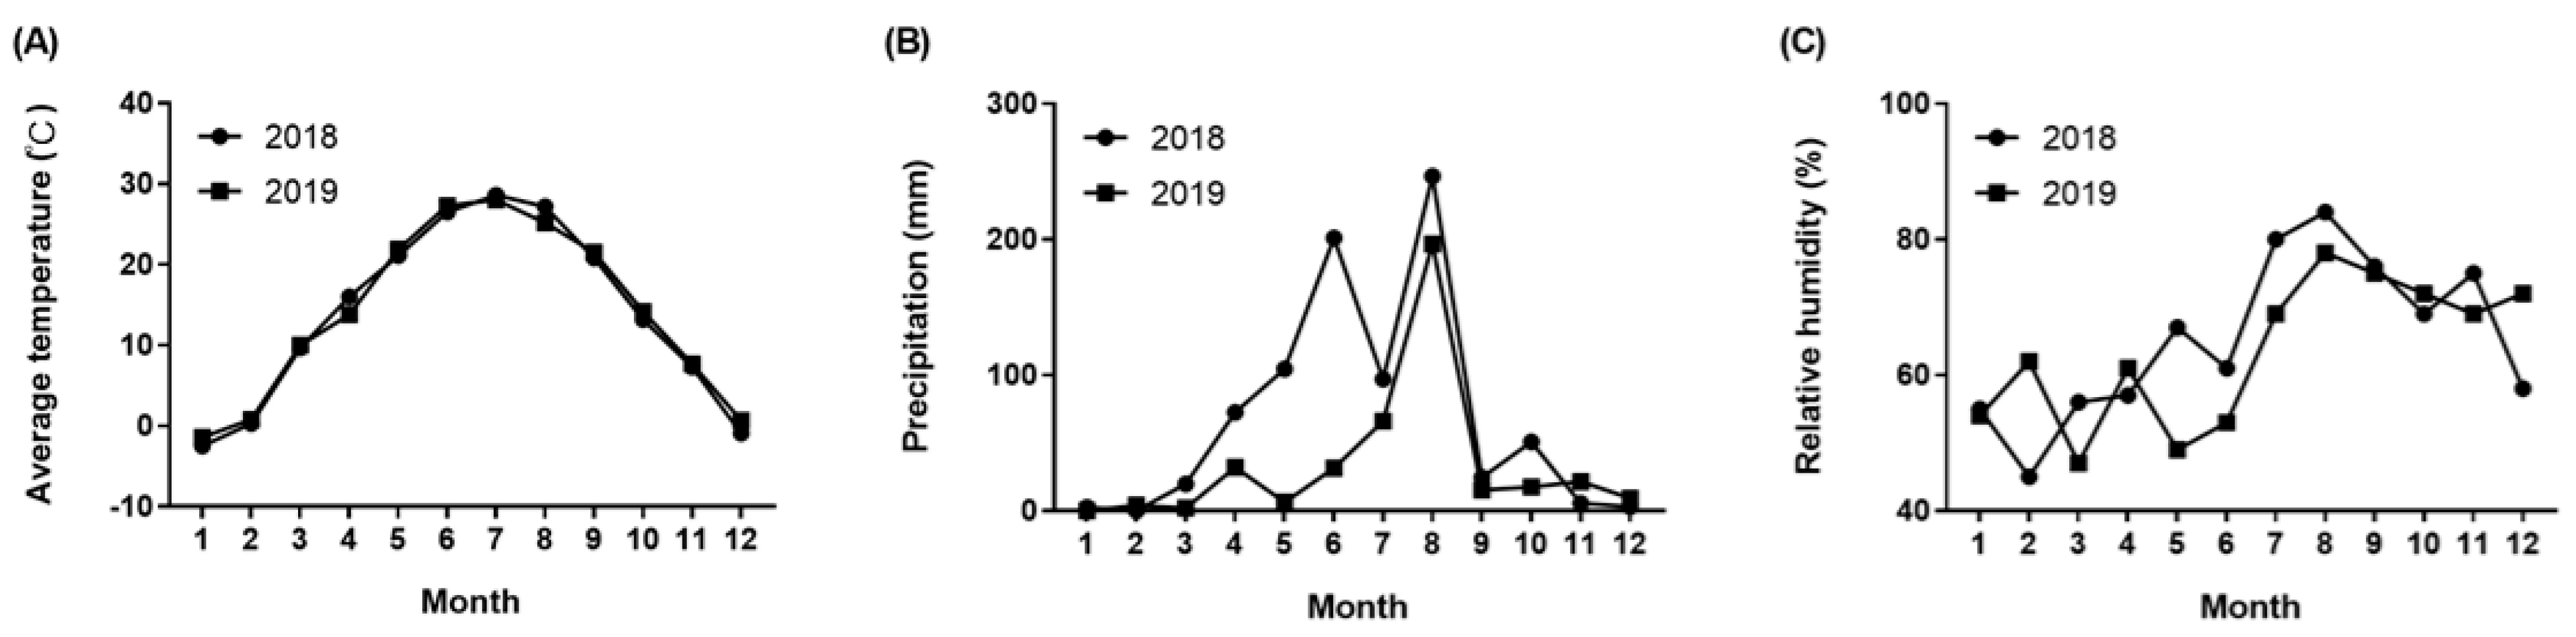
4.4. Effects of Weather Conditions on the Growth and Development of Soybean and Insect Communities

With respect to the difference in biomass between years (Table 1) suggests that it may have been caused by excessive precipitation or insufficient light during the early growth period of soybeans in 2018, as supported by studies on the effects of excessive rainfall on photosynthesis in tropical rainforests [50]. In addition, the activities of GS and NR differed between years due to the differences in weather conditions, such as precipitation. Insect activity is strongly influenced by weather conditions. The differences in temperature and precipitation between years inevitably lead to differences in the insect population and other aspects. For example, in the present study, we found that the number of GL per 10 soybean plants was higher in 2019 (3.0) than in 2018 (1.5), as reported in a butterfly study [51]. Therefore, additional precipitation may limit the growth and activities of GL.

4.5. Prospects for Corn–Soybean Strip Compound Planting

The grain weight per plant and grain yield of corn intercropped with soybean were significantly increased with an increased row ratio of soybean, even under the reduced fertilizer condition [39]. Corn yields can be treated as additional profit from an intercropping planting pattern. The yield of intercropping corn was significantly higher than that of sole-crop corn under both normal fertilizer level and reduced fertilizer application. Corn yield was the highest under C2S4. Therefore, reasonable intercropping of corn and soybean can increase corn yield and minimize the adverse effects of intercropping on soybean to achieve the ideal condition for overall production increase, as supported by similar research [52].
In addition, compact corn varieties enable improved light transmittance through the intercropping canopy and can improve the growth and development of lower crops [53]. Accordingly, compact corn varieties and shade-tolerant soybean varieties can be used in an intercropping mode. However, there are still areas if the present study that can be optimized. For example, soybean growth can be explored with more comprehensive indicators, such as root-to-shoot ratio, number of pods, etc.

5. Conclusions

In general, soybean yield, 100-seed weight, biomass, the enzyme activities of GOGAT and GS, the insect dominance index (D) and the number of green leafhoppers were significantly positively correlated, whereas these indices were significantly negatively correlated with insect diversity indices S, H and E. Regardless of the fertilizer level, during the R2 and R5 stages, NGWF was significantly positively correlated with the enzyme activities of GS. The effect of an intercropping planting pattern with corn and fertilizer reduction on the yield-related traits and insect communities of soybean is summarized in Figure 6. In conclusion, intercropping resulted in similar reductions in enzymatic activity as fertilizer reduction, whereas intercropping resulted in greater changes in soybean yield, 100-seed weight, biomass and insect community diversity than fertilizer reduction. The planting pattern of C2S4 minimizes the negative impact of intercropping on soybean plants and increases insect diversity (Figure 6). On the basis of present experiment, soybean and corn varieties suitable for compound strip planting of soybean with corn should be screened to increase soybean seed yield.

Author Contributions

Conceptualization and methodology, L.L., G.X. and F.C.; data collection, L.L.; data analysis, L.L. and G.X.; data presentation and writing—reviewing and editing, L.L., G.X. and F.C. All authors have read and agreed to the published version of the manuscript.

Funding

This research was funded by the National Key R&D Program of China (2021YFD1201604, 2017YFD0200400), the Natural Science Foundation of China (31571694) and the Jiangsu JCIC-MCP Program.

Institutional Review Board Statement

Not applicable.

Informed Consent Statement

Not applicable.

Data Availability Statement

Not applicable.

Conflicts of Interest

The authors declare no conflict of interest.

References

  1. Zakharchenko, I.G.; Pirozhenko, G.S. Nitrogen Fixation by Legumes. Agrokhimiya 1970. Guide A-129. [Google Scholar]
  2. Gudynas, E. The new bonfire of vanities: Soybean cultivation and globalization in South America. Development 2008, 51, 512–518. [Google Scholar] [CrossRef]
  3. Mao, L.; Zhang, L.; Li, W.; Werf, W.V.D.; Sun, J.; Spiertz, H.; Long, L. Yield advantage and water saving in maize/pea intercrop. Field Crops Res. 2012, 138, 11–20. [Google Scholar] [CrossRef]
  4. Raza, M.A.; Khalid, M.H.B.; Zhang, X.; Feng, L.Y.; Khan, I.; Hassan, M.J.; Ahmed, M.; Ansar, M.; Chen, Y.K.; Fan, Y.F.; et al. Effect of planting patterns on yield, nutrient accumulation and distribution in maize and soybean under relay intercropping systems. Sci. Rep. 2019, 9, 4947. [Google Scholar] [CrossRef] [PubMed] [Green Version]
  5. Rahman, T.; Liu, X.; Hussain, S.; Ahmed, S.; Chen, G.; Yang, F.; Chen, L.; Du, J.; Liu, W.; Yang, W. Water use efficiency and evapotranspiration in maize-soybean relay strip intercrop systems as affected by planting geometries. PLoS ONE 2017, 12, e0178332. [Google Scholar] [CrossRef] [Green Version]
  6. Loreau, N.; Inchaussti, B.; Grime, J.P. Biodiversity and ecosystem functioning: Current knowledge and future challenges. Science 2001, 294, 804–808. [Google Scholar] [CrossRef] [Green Version]
  7. Liu, X.; Rahman, T.; Song, C.; Su, B.; Yang, F.; Yong, T.; Wu, Y.; Zhang, C.; Yang, W. Changes in light environment, morphology, growth and yield of soybean in maize-soybean intercropping systems. Field Crops Res. 2017, 200, 38–46. [Google Scholar] [CrossRef]
  8. Xu, W.; Chang, Z.; Dian, F.F.; Nai, J.L.; Xiao, Y.; Yang, L. Effects of the strip compound planting system on photosynthetic characteristics and grain yield of maize and soybean. Soybean Sci. 2017, 36, 540–546. [Google Scholar]
  9. Yang, W.Y.; Yang, X.C.; Liu, W.G.; Yang, F.; Wang, H. High yield and high efficiency integrated cultivation technology of maize interplanting soybean. Soybean Sci. Technol. 2011, 2, 52–53. [Google Scholar]
  10. Rashwan, E.; Zeneldin, A. Effect of two patterns of intercropping soybean with maize on yield and its components under different nitrogen fertilizer levels. Egypt. J. Agron. 2017, 39, 449–466. [Google Scholar] [CrossRef] [Green Version]
  11. Iqbal, M.A.I.; Abbas, A.; Nadeem, R. Spatio-temporal reconciliation to lessen losses in yield and quality of forage soybean (Glycine max L.) in soybean-sorghum intercropping systems. Bragantia 2018, 77, 283–291. [Google Scholar] [CrossRef] [Green Version]
  12. Dolijanovic, Z.; Oljaca, S.; Kovacevic, D.; Simic, M.; Jovanovic, Z. Dependence of the productivity of maize and soybean intercropping systems on hybrid type and plant arrangement pattern. Genetika 2013, 45, 135–144. [Google Scholar] [CrossRef]
  13. Cheng, B.; Raza, A.; Wang, L.; Xu, M.; Lu, J.; Gao, Y.; Qin, S.; Zhang, Y.; Ahmad, I.; Zhou, T.; et al. Effects of multiple planting densities on lignin metabolism and lodging resistance of the strip intercropped soybean stem. Agronomy 2020, 10, 1177. [Google Scholar] [CrossRef]
  14. Liu, J.; Yang, C.Q.; Zhang, Q.; Lou, Y.; Wu, H.J.; Deng, J.C.; Yang, F.; Yang, W.Y. Partial improvements in the flavor quality of soybean seeds using intercropping systems with appropriate shading. Food Chem. 2016, 207, 107–114. [Google Scholar] [CrossRef] [PubMed]
  15. Miyazawa, K.; Murakami, T.; Takeda, M.; Murayama, T. Intercropping green manure crops—Effects on rooting patterns. Plant Soil 2009, 331, 231–239. [Google Scholar] [CrossRef]
  16. Kebebew, S.; Belete, K.; Tana, T. Productivity evaluation of maize—Soybean intercropping system under rain fed condition at Bench-Maji Zone, Ethiopia. Eur. Res. 2014, 79, 1301–1309. [Google Scholar]
  17. Sani, G.K.; Jamshidi, K.; Moghadam, M. Evaluation of quality and quantity of corn and soybean grain yield in intercropping under deficit irrigation. J. Biol. Agric. Healthc. 2014, 4, 133–139. [Google Scholar]
  18. Lv, J.; Xiao, J.; Guo, Z.; Dong, K.; Dong, Y. Nitrogen supply and intercropping control of Fusarium wilt in faba bean depend on organic acids exuded from the roots. Sci. Rep. 2021, 11, 9589. [Google Scholar] [CrossRef]
  19. Ye, C.; Chen, D.; Hall, S.J.; Pan, S.; Yan, X.; Bai, T.; Guo, H.; Zhang, Y.; Bai, Y.; Hu, S. Reconciling multiple impacts of nitrogen enrichment on soil carbon: Plant, microbial and geochemical controls. Ecol. Lett. 2018, 21, 1162–1173. [Google Scholar] [CrossRef] [Green Version]
  20. Zhang, S.; Shen, T.; Yang, Y.; Li, Y.C.; Wan, Y.; Zhang, M.; Tang, Y.; Allen, S.C. Controlled-release urea reduced nitrogen leaching and improved nitrogen use efficiency and yield of direct-seeded rice. J. Environ. Manag. 2018, 220, 191–197. [Google Scholar] [CrossRef]
  21. Wang, X.; Liu, Q.; Meissle, M.; Peng, Y.; Wu, K.; Romeis, J.; Li, Y. Bt rice could provide ecological resistance against nontarget planthoppers. Plant Biotechnol. J. 2018, 16, 1748–1755. [Google Scholar] [CrossRef] [Green Version]
  22. Du, E.; Terrer, C.; Pellegrini, A.F.A.; Ahlström, A.; van Lissa, C.J.; Zhao, X.; Xia, N.; Wu, X.; Jackson, R.B. Global patterns of terrestrial nitrogen and phosphorus limitation. Nat. Geosci. 2020, 13, 221–226. [Google Scholar] [CrossRef]
  23. Miflin, L. The pathway of nitrogen assimilation in plants. Phytochemistry 1976, 15, 873–885. [Google Scholar] [CrossRef]
  24. Zhou, T.; Wang, L.; Sun, X.; Wang, X.; Pu, T.; Yang, H.; Rengel, Z.; Liu, W.; Yang, W. Improved post-silking light interception increases yield and P-use efficiency of maize in maize/soybean relay strip intercropping. Field Crops Res. 2021, 262, 108054. [Google Scholar] [CrossRef]
  25. Du, J.B.; Han, T.F.; Gai, J.Y.; Yong, T.W.; Sun, X.; Wang, X.C.; Yang, F.; Liu, J.; Shu, K.; Liu, W.G.; et al. Maize-soybean strip intercropping: Achieved a balance between high productivity and sustainability. J. Integr. Agric. 2018, 17, 747–754. [Google Scholar] [CrossRef]
  26. Chen, P.; Song, C.; Liu, X.M.; Zhou, L.; Yang, H.; Zhang, X.; Zhou, Y.; Du, Q.; Pang, T.; Fu, Z.D.; et al. Yield advantage and nitrogen fate in an additive maize-soybean relay intercropping system. Sci. Total Environ. 2019, 657, 987–999. [Google Scholar] [CrossRef] [PubMed]
  27. Zhou, T.; Wang, L.; Yang, H.; Gao, Y.; Liu, W.; Yang, W. Ameliorated light conditions increase the P uptake capability of soybean in a relay-strip intercropping system by altering root morphology and physiology in the areas with low solar radiation. Sci. Total Environ. 2019, 688, 1069–1080. [Google Scholar] [CrossRef]
  28. Liu, X.; Rahman, T.; Song, C.; Yang, F.; Su, B.; Cui, L.; Bu, W.; Yang, W. Relationships among light distribution, radiation use efficiency and land equivalent ratio in maize-soybean strip intercropping. Field Crops Res. 2018, 224, 91–101. [Google Scholar] [CrossRef]
  29. Altieri, M.A.; Glaser, D.L.; Schmidt, L.L. Diversification of agroecosystems for insect pest regulation: Experiments with collards. In Agroecology, Esearching the Ecological Basis for Sustainable Agriculture; Gliessman, S.R., Ed.; Springer: New York, NY, USA, 1990; pp. 72–82. [Google Scholar]
  30. Zhou, H.B.; Chen, J.I.; Liu, Y.; Francis, F.; Haubruge, E.; Bragard, C.; Sun, J.R.; Cheng, D.F. Influence of garlic intercropping or active emitted volatiles in releasers on aphid and related beneficial in wheat fields in China. J. Integr. Agric. 2013, 12, 467–473. [Google Scholar] [CrossRef]
  31. Stratton, C.A.; Hodgdon, E.; Rodriguez-Saona, C.; Shelton, A.M.; Chen, Y.H. Odors from phylogenetically-distant plants to Brassicaceae repel an herbivorous Brassica specialist. Sci. Rep. 2019, 9, 10621. [Google Scholar] [CrossRef] [Green Version]
  32. Isman, M.B. Botanical insecticides, deterrents, and repellents in modern agriculture and an increasingly regulated world. Annu. Rev. Entomol. 2006, 51, 45–66. [Google Scholar] [CrossRef] [Green Version]
  33. Mohammadi, K.; Fathi, S.A.A.; Razmjou, J.; Naseri, B. Evaluation of the effect of strip intercropping green bean/garlic on the control of Tetranychus urticae in the field. Exp. Appl. Acarol. 2021, 83, 183–195. [Google Scholar] [CrossRef] [PubMed]
  34. Mayse, M.A.; Price, P.W. Seasonal development of soybean arthropod communities in east central Illinois. Agro-Ecosyst. 1978, 4, 387–405. [Google Scholar] [CrossRef]
  35. Yamamoto, F.C.F. Pests and their natural enemies on soybean and corn grown in diversified systems. Sci. Agric. 2002, 59, 683–687. [Google Scholar]
  36. Snaydon, R.W. Replacement or additive designs for competition studies? J. Appl. Ecol. 1991, 28, 930–946. [Google Scholar] [CrossRef]
  37. Li, L.; Duan, R.C.; Li, R.Z.; Zou, Y.; Liu, J.W.; Chen, F.; Xing, G. Impacts of corn intercropping with soybean, peanut and millet through different planting patterns on population dynamics and community diversity of insects under fertilizer reduction. Front. Plant Sci. 2022, 13, 936039. [Google Scholar] [CrossRef]
  38. Fehr, W.R.; Caviness, C.E.; Burmood, D.T.; Pennington, J.S. Stage of development descriptions for soybeans, Glycine max (L) merrill. Crop Sci. 1971, 11, 929–931. [Google Scholar] [CrossRef]
  39. Root, R.B. Organization of a plant-arthropod association in simple and diverse habitats: The fauna of collards (Brassica Oleracea). Ecol. Monogr. 1973, 43, 95–124. [Google Scholar] [CrossRef]
  40. Tang, S.; Tang, G.; Qin, W. Codimension-1 sliding bifurcations of a filippov pest growth model with threshold policy. Int. J. Bifurc. Chaos 2014, 24, 1450122. [Google Scholar] [CrossRef]
  41. Xing, G.; Liu, K.; Gai, J. A high-throughput phenotyping procedure for evaluation of antixenosis against common cutworm at early seedling stage in soybean. Plant Methods 2017, 13, 66. [Google Scholar] [CrossRef] [Green Version]
  42. Chang, E.H.; Chung, R.S.; Tsai, Y.H. Effect of different application rates of organic fertilizer on soil enzyme activity and microbial population. Soil Sci. Plant Nutr. 2007, 53, 132–140. [Google Scholar] [CrossRef]
  43. Wei, J.; Zhou, H.P.; Xie, W.Y.; Guan, C.L.; Gao, C.H.; Shi, Y.Q. Effects of long-term inorganic fertilizer combined with organic manure on microbial biomass C, N and enzyme activity in cinnamon soil. J. Plant Nutr. Fertil. 2008, 14, 700–705. [Google Scholar]
  44. Li, L.; Zou, Y.; Wang, Y.; Chen, F.; Xing, G. Effects of corn intercropping with soybean/peanut/millet on the biomass and yield of corn under fertilizer reduction. Agriculture 2022, 12, 151. [Google Scholar] [CrossRef]
  45. Li, X.; Mu, Y.; Cheng, Y.; Liu, X.; Nian, H. Effects of intercropping sugarcane and soybean on growth, rhizosphere soil microbes, nitrogen and phosphorus availability. Acta Physiol. Plant. 2012, 35, 1113–1119. [Google Scholar] [CrossRef]
  46. Tan, X.; Guo, T.; Zhang, G.; Chen, G. Effects of rotation and intercropping on soil microbial and enzyme activity in the rhizosphere of potato. J. Irrig. Drain. 2016, 35, 45–50. [Google Scholar]
  47. Dapaah, H.K.; Asafu-Agyei, J.N.; Ennin, S.A.; Yamoah, C. Yield stability of cassava, maize, soya bean and cowpea intercrops. J. Agric. Sci. 2003, 140, 73–82. [Google Scholar] [CrossRef]
  48. Li, L.; Sun, J.; Zhang, F.; Li, X.; Yang, S.; Rengel, Z. Wheat/maize or wheat/soybean strip intercropping I. Yield advantage and interspecific interactions on nutrients. Field Crops Res. 2001, 71, 123–137. [Google Scholar] [CrossRef]
  49. Ferguson, B.J.; Indrasumunar, A.; Hayashi, S.; Lin, M.H.; Lin, Y.H.; Reid, D.E.; Gresshoff, P.M. Molecular analysis of legume nodule development and autoregulation. J. Integr. Plant Biol. 2010, 52, 61–76. [Google Scholar] [CrossRef]
  50. Chen, R.; Liu, L.; Liu, X. The negative impact of excessive moisture contributes to the seasonal dynamics of photosynthesis in Amazon moist forests. Earths Future 2022, 10, e2021EF002306. [Google Scholar] [CrossRef]
  51. Davies, Z.G.; Wilson, R.J.; Coles, S.; Thomas, C.D. Changing habitat associations of a thermally constrained species, the sliver-spotted skipper butterfly, in response to climate warming. J. Anim. Ecol. 2006, 75, 247–256. [Google Scholar] [CrossRef] [Green Version]
  52. Zheng, B.C.; Zhou, Y.; Chen, P.; Zhang, X.N.; Du, Q.; Yang, H.; Wang, X.C.; Yang, F.; Xiao, T.; Li, L.; et al. Maize-legume intercropping promote N uptake through changing the root spatial distribution, legume nodulation capacity, and soil N availability. J. Integr. Agric. 2022, 21, 1755–1771. [Google Scholar]
  53. Raza, M.A.; Cui, L.; Khan, I.; Din, A.M.U.; Chen, G.; Ansar, M.; Ahmed, M.; Ahmad, S.; Manaf, A.; Titriku, J.K.; et al. Compact maize canopy improves radiation use efficiency and grain yield of maize/soybean relay intercropping system. Environ. Sci. Pollut. Res. 2021, 28, 41135–41148. [Google Scholar] [CrossRef] [PubMed]
Figure 1. Meteorological data of the Jiyang area in 2018 and 2019 (Note: (A) average temperature; (B) precipitation; (C) relative humidity; data from the Jiyang Statistical Yearbook for 2018 and 2019, respectively; numbers 1 to 12 in the header row represent January to December).
Agronomy 12 03080 g001
Figure 2. Diagram of different planting patterns of corn with soybean used in the present study (Note: S: sole-crop soybean; C2S2, C2S3, and C2S4: intercropping of 2 corn rows with 2, 3, and 4 rows of soybean, respectively. The row spacing and hill distance of corn and soybean were 0.8 m and 0.2 m, respectively. The spacing between corn rows and soybean rows was also 0.8 m. Two soybean plants were planted in each hill, although only one plant is shown in every soybean hill in the figure owing to the difficulty of drawing).
Agronomy 12 03080 g002
Figure 3. Community diversity indices of insects on soybean plants in 2018 and 2019 (Note: S: species number of insect; H: Shannon–Wiener diversity index; E: Pielou evenness index; D: Simpson dominance index; lowercase letters represent significant differences among different intercropping planting patterns by LSD test at p < 0.05; (A,E,I,M): S, H, E and D, respectively, of normal fertilizer in 2018; (C,G,K,O): S, H, E and D, respectively, of normal fertilizer in 2019; (B,F,J,N): S, H, E and D, respectively, of reduced fertilizer in 2018, respectively; (D,H,L,P): S, H, E and D, respectively, of reduced fertilizer in 2019).
Agronomy 12 03080 g003
Figure 4. Population dynamics of green leafhoppers on soybean plants in 2018 (A,B) and 2019 (C,D) (Note: lowercase letters represent significant differences among different intercropping planting patterns by LSD test at p < 0.05).
Agronomy 12 03080 g004
Figure 5. Correlation among biomass, 100-seed weight, yield and enzyme activities related to nitrogen metabolism and the insect diversity index of soybean based on averages from 2018 to 2019 (Note: (A) normal fertilizer, R2; (B) normal fertilizer, R5; (C) reduced fertilizer, R2; (D) reduced fertilizer, R5; Bio: biomass; HSW: 100-seed weight; SALPT: soil alkaline protease; GOGAT: glutamine oxoglutarate aminotransferase; GS: glutamate synthetase; NR: nitrate reductase; D: Simpson dominance index; E: Pielou evenness index; H: Shannon–Wiener diversity index; S: species number of insect; NGL: number of green leafhoppers; NGWF: number of greenhouse whiteflies; brick red represents a positive correlation; blue represents a negative correlation; the darker the color, the more significant the correlation. The degree of freedom for correlation analysis is 7, and |r| > 0.66 is considered significant).
Agronomy 12 03080 g005
Figure 6. Patterns of intercropping planting pattern and fertilizer levels affecting soybean yield-related traits, enzymatic activity and insect communities (Note: HSW: 100-seed weight; R2/5: R2/5 growth stage; S: sole-crop soybean; C2S2, C2S3 and C2S4: intercropping of two corn rows with two, three and four rows of soybean, respectively; SALPT: soil alkaline protease; GOGAT: glutamine oxoglutarate aminotransferase; GS: glutamate synthetase; NR: nitrate reductase; S: species number; H: Shannon–Wiener diversity index; E: Pielou evenness index; D: Simpson dominance index; NGL: number of green leafhoppers; NGWF: number of greenhouse whiteflies; CCW: common cutworm. The growth stage was added before the intercropping mode to indicate that it was significant only during this growth stage, and the absence of the growth stage indicates that it was significant in both the R2 and R5 stages).
Agronomy 12 03080 g006
Table 1. Three-factor analysis of variance of soybean plant biomass, 100-seed weight and yield between/among different sampling years (Y; 2018 vs. 2019), fertilizer levels (F; normal vs. reduced), intercropping planting patterns (P; sole-crop soybean and three soybean intercropping planting patterns with corn) and their bi-/tri-interactions (F/p value).
Source of VariationBiomass Per Plant (g)100-Seed Weight (g)Yield (kg/hm2)
R2R5
Sampling year (Y)157.3/<0.001 ***0.9/0.3440.6/0.4382.1/0.154
Fertilizer level (F)18.9/<0.001 ***15.5/<0.001 ***40.6/<0.001 ***8.4/0.005 **
Planting pattern (P)42.8/<0.001 ***64.0/<0.001 ***80.3/<0.001 ***111.4/<0.001 ***
Y × F7.8/0.007 **2.5/0.1160.3/0.5991.4/0.247
Y × P5.7/0.002 **6.9/<0.001 ***0.4/0.7730.8/0.512
F × P1.0/0.3835.4/0.002 **9.7/<0.001 ***1.5/0.223
Y × F × P0.1/0.9349.1/<0.001 ***0.2/0.8850.5/0.690
Note: ** p < 0.01; *** p < 0.001.
Table 2. Mean biomass per plant (g), 100-seed weight (g) and yield (kg/hm2) of soybean with normal and reduces fertilizer levels in four intercropping planting patterns.
IndicatorGrowth StageFertilizerIntercropping Planting Pattern
NormalReduction (%)C2S2 (%)C2S3 (%)C2S4 (%)S
Biomass (g)R2270.2 a238.1 (−11.9) b206.5 (−35.8) b232.3 (−27.8) b256.1 (−20.4) ab321.7 a
R5423.9 a373.5 (−11.9) b284.5 (−46.7) b379.0 (−28.9) ab398.0 (−25.4) ab533.4 a
HSW (g) 25.8 a24.0 (−7.0) b22.0 (−22.0) b23.7 (−16.0) b25.7 (−8.9) ab28.2 a
Yield (kg/hm2)3879.7 a3643.3 (−6.1) b2867.0 (−40.2) b3279.3 (−31.6) b4104.4 (−14.4) ab4795.3 a
Note: HSW: 100-seed weight. Different lowercase letters between fertilizer levels and among soybeans under different intercropping planting patterns indicate significant differences at p < 0.05. The numbers in parentheses under fertilizer reduction indicate the reduction relative to normal fertilization (%) = (Normal-Reduce)/Normal × 100%. The numbers in parentheses under soybean under different intercropping planting patterns indicate the reduction relative to sole-crop soybean = (S-C2S2/3/4)/S × 100%.
Table 3. Four-factor analysis of variance (ANOVA) of the effects of sampling years (Y; 2018 vs. 2019), fertilizer levels (F; normal vs. reduced), intercropping planting pattern (P; sole-crop soybean and three intercropping planting patterns of soybean with corn), growth stage (G; R2 vs. R5) and their bi-/tri-/quad-interactions on nitrogen-metabolization-related enzymes in soil (S-ALPT) and soybean leaves (GOGAT, GS and NR) (F/p value).
Source of VariationS-ALPTGOGATGSNR
Sampling year (Y)2.4/0.1272.1/0.15520.7/<0.001 ***149.4/<0.001 ***
Fertilizer level (F)35.3/<0.001 ***79.0/<0.001 ***87.5/<0.001 ***46.7/<0.001 ***
Planting pattern (P)7.0/<0.001 ***32.5/<0.001 ***54.7/<0.001 ***7.0/<0.001 ***
Growth stage (G)261.5/<0.001 ***5614.9/<0.001 ***6.2/0.015 *263.5/<0.001 ***
Y × F<0.01/0.93110.6/0.002 **0.6/0.4351.7/0.193
Y × P1.8/0.1497.0/<0.001 ***15.2/<0.001 ***6.2/<0.001 ***
Y × G15.7/<0.001 ***10.3/0.002 **<0.1/0.907179.6/<0.001 ***
F × P0.3/0.8340.5/0.0672.3/0.0870.4/0.763
F × G4.1/0.048 *8.6/0.005 **<0.01/0.9391.5/0.220
P × G7.6/<0.001 ***8.5/<0.001 ***3.2/0.029 *33.4/<0.001 ***
Y × F × P0.9/0.4450.7/0.5530.2/0.8960.5/0.654
Y × F × G0.3/0.6018.5/0.005 **4.1/0.046 *0.2/0.656
Y × P × G4.0/0.011 *1.9/0.1371.8/0.15019.2/<0.001 ***
F × P × G0.3/0.8340.4/0.7722.6/0.0580.6/0.642
Y × F × P × G0.6/0.6420.6/0.6441.2/0.3190.1/0.958
Note: S-ALPT: soil alkaline protease; GOGAT: glutamine oxoglutarate aminotransferase; GS: glutamate synthetase; NR: nitrate reductase; * p < 0.05; ** p < 0.01; *** p < 0.001.
Table 4. Mean of nitrogen-metabolization-related enzymatic activity under normal and reduce fertilizer in four intercropping planting patterns.
Growth
Stage
IndicatorFertilizerIntercropping Planting Pattern
NormalReduce (%)C2S2 (%)C2S3 (%)C2S4 (%)S
R2SALPT5.7 a5.3 (−7.0) b5.6 (−1.8) a5.5 (−3.3) ab5.2 (−9.8) b5.7 a
GOGAT26.1 a23.2 (−11.1) b22.0 (−18.8) b25.1 (−7.6) ab24.5 (−9.8) ab27.2 a
GS28.4 a24.0 (−15.4) b21.2 (−30.2) b26.3 (−13.6) ab27.1 (−10.9) ab30.4 a
NR7.2 a5.3 (−26.0) b5.8 (−27.4) b6.7 (−15.8) a6.7 (−16.3) a8.0 a
R5SALPT4.3 a3.5 (−18.4) b3.3 (−26.1) b3.9 (−11.4) ab4.1 (−7.5) ab4.4 a
GOGAT16.5 a13.6 (−17.7) b12.8 (−24.1) c15.6 (−7.4) ab14.9 (−11.6) b16.9 a
GS27.2 a22.9 (−15.8) b20.8 (−26.0) b27.0 (−3.9) a24.3 (−13.8) ab28.1 a
NR6.4 a4.7 (−25.4) b5.3 (+17.9) a5.2 (+14.6) ab5.1 (+12.6) ab4.5 b
Note: Different lowercase letters between fertilizer levels and among soybeans under intercropping patterns indicate significant differences within each factor at p < 0.05. Numbers in parentheses represent the changes resulting from normal fertilizer ((Normal-Reduce)/Normal × 100%) or sole-crop soybean ((S-C2S2/3/4)/S × 100%).
Table 5. The total number of main pests and natural enemies of insects was recorded in seven surveys per year under each treatment.
Insect SpeciesC2S4C2S3C2S2S
18+18−19+19−18+18−19+19−18+18−19+19−18+18−19+19−
Pest
Greenhouse whitefly
(Trialeurodes vaporarioru)
481686811504577592614533662111474669928323308
Green leafhopper
(Cicadella viridis)
2323455717234549211946465861102111
Bean bug
(Riptortus pedestris)
18101122192129161193431
Slender rice bug
(Cletus trigonus)
2000030002000000
Yellow–brown stink bug
(Halyomorpha halys)
7201101100560071100
Cotton red bearded blind bug
(Trigonotylus coelestialium)
0400280068105100
Black striped plant bug
(Adelphocoris suturalis)
2100110013001200
Three-pointed bug
(Adelphocoris fasciaticollis)
2101100023005401
Weevil
(Sympiezomias velatus)
1015001413001315008910
Chinese grasshopper
(Acrida cinerea)
3975287010123102910
Yellow-shank locust
(Oedaleus infernalis Sauss)
1106113720718504355
Strychia breviflora
(Xenocatantops brachycerus)
1301129411115244
Cricket
(Gryllulus)
44188048613310214
Asiatic migratory locust
(Locusta migratoria manilensis)
321517381153101844623
Corn borer
(Pyrausta nubilalis)
489461361333791641
Common cutworm
(Spodoptera litura Fabricius)
28613242022650014701
Beet armyworm
(Spodoptera exigua)
510110201330014802
Bean bump night moth
(Bomolocha tristalis Lederer)
180020200200014800
Small brown planthopper
(Laodelphax striatellus)
00005000210016000
Natural enemy insect
Green river long fly
(Dolichopus qinghensis)
232501302600262110293502
Pilose three-pronged insect fly
(Trichomachimus pubescens)
4411431233011311
Hoverfly
(Episyrphus balteatus)
3240221045102112
Harlequin ladybird
(Harmonia axyridis)
27112100049101230
Moire ladybird
(Propylaea japonica Thunberg)
0600060004001000
Note: S: soybean; C2S2, C2S3 and C2S4: intercropping of two corn rows with two, three and four rows of soybean, respectively; 18+: normal fertilizer level in 2018; 18-: reduced fertilizer condition in 2018; 19+: normal fertilizer level in 2019; 19-: reduced fertilizer condition in 2019. Main pests are indicated in bold.
Table 6. Three-way repeated-measure analysis of variance (ANOVA) of the effects of sampling years (Y; 2018 vs. 2019), fertilizer levels (F; normal vs. reduced), intercropping planting patterns (P; sole-crop soybean and three intercropping planting patterns of soybean with corn) and their bi-/tri-interactions on community diversity indices of insects (F/p value).
Source of VariationSHED
Sampling year (Y)274.7/<0.001 ***62.1/<0.001 ***5.7/0.023 *43.7/<0.001 ***
Fertilizer level (F)0.1/0.8132.4/0.12968.9/<0.001 ***2.3/0.142
Planting pattern (P)90.2/<0.001 ***96.2/<0.001 ***102.6/<0.001 ***73.7/<0.001 ***
Y × F<0.01/0.93712.4/0.001 **129.0/<0.001 ***44.9/<0.001 ***
Y × P32.7/<0.001 ***12.3/<0.001 ***6.8/0.001 **3.0/0.044 *
F × P0.5/0.7100.4/0.7485.7/0.003 **2.0/0.129
Y × F × P0.8/0.4770.7/0.5451.0/0.3990.8/0.526
Note: S: species number of insect; H: Shannon–Wiener diversity index; E: Pielou evenness index; D: Simpson dominance index. * p < 0.05; ** p < 0.01; *** p < 0.001.
Table 7. Three-way repeated-measure analysis of variance (ANOVA) on the effects of sampling years (Y; 2018 vs. 2019), fertilizer levels (F; normal vs. reduced), intercropping planting patterns (P; sole-crop soybean and three intercropping planting patterns of soybean intercropping with corn) and their bi-/tri-interactions on five major pests in terms of quantity on soybean plants (F/p value).
Source of VariationGreenhouse
Whitefly
Green
Leafhopper
Bean
Bug
Asiatic
Migratory Locust
Common
Cutworm
Sampling year (Y)5.9/0.017 *23.2/<0.001 ***12.2/<0.001 ***6.5/0.013 *7.6/0.007 **
Fertilizer level (F)11.7/<0.001 ***1.1/0.2950.1/0.7732.9/0.0944.6/0.035 *
Planting pattern (P)0.5/0.6797.5/<0.001 ***0.2/0.9030.2/0.9100.2/0.927
Y×F0.6/0.4282.3/0.1370.1/0.8132.4/0.1243.7/0.058
Y×P0.3/0.7943.1/0.0310.2/0.8870.4/0.7880.2/0.924
F×P0.5/0.6700.3/0.7930.9/0.4080.3/0.8360.2/0.883
Y×F×P0.5/0.6851.0/0.4050.6/0.5830.3/0.8600.2/0.915
Note: * p < 0.05; ** p < 0.01; *** p < 0.001.
Table 8. Mean community diversity indices of each survey and the number of green leafhoppers, greenhouse whiteflies and common cutworms per 10 plants in every survey under normal and reduced fertilizer conditions under four intercropping planting patterns.
IndicatorFertilizerIntercropping Planting Pattern
NormalReduce (%)C2S2 (%)C2S3 (%)C2S4 (%)S
S4.6 a4.6 (+1.3) a5.1 (+111.7) a5.6 (+133.8) a5.2 (+117.1) a2.4 b
H0.9 a0.9 (−4.4) a1.0 (+117.4) a1.1 (+134.8) a1.0 (+126.1) a0.5 b
E0.7 a0.6 (−19.1) b0.7 (+65.9) a0.7 (+68.3) a0.7 (+65.9) a0.4 b
D0.5 a0.5 (+3.8) a0.5 (−39.5) b0.5 (−40.8) b0.5 (−40.8) b0.8 a
NGL2.1 a2.3 (+8.9) a1.7 (−56.1) b1.6 (−59.6) b1.6 (−59.6) b4.0 a
NGWF29.3 b63.1 (+115.2) a36.1 (−33.3) a48.0 (−11.3) a46.6 (−13.8) a54.1 a
CCW0.6 a0.1 (−83.3) b0.4 (+33.3) a0.4 (+33.3) a0.5 (+66.7) a0.3 a
Note: Different lowercase letters between fertilizer levels and among soybean under different intercropping planting patterns indicate significant differences at p < 0.05 within each factor. Numbers in parentheses represent the change from normal fertilizer ((Normal-Reduce)/Normal × 100%) or sole-crop soybean ((S-C2S2/3/4)/S × 100%). S: species number of insects; H: Shannon–Wiener diversity index; E: Pielou evenness index; D: Simpson dominance index; NGL: number of green leafhoppers; NGWF: number of greenhouse whiteflies; CCW: common cutworm.
Publisher’s Note: MDPI stays neutral with regard to jurisdictional claims in published maps and institutional affiliations.

