Article

Detection of Hub QTLs Underlying the Genetic Basis of Three Modules Covering Nine Agronomic Traits in an F2 Soybean Population

1
Huaiyin Institute of Agricultural Sciences of Xuhuai Region in Jiangsu, Huai’an 223001, China
2
Huai’an Key Laboratory for Agricultural Biotechnology, Huai’an 223001, China
3
Key Laboratory of Germplasm Innovation in Lower Reaches of the Huaihe River, Ministry of Agriculture and Rural Affairs, Huai’an 223001, China
4
Huaiyin Institute of Technology, Huai’an 223003, China
*
Authors to whom correspondence should be addressed.
These authors contributed to the study equally.
Agronomy 2022, 12(12), 3135; https://doi.org/10.3390/agronomy12123135
Submission received: 14 October 2022 / Revised: 5 December 2022 / Accepted: 5 December 2022 / Published: 10 December 2022
(This article belongs to the Special Issue Frontier Studies in Legumes Genetic Breeding and Production)

Abstract

:
Deciphering the genetic basis underlying agronomic traits is of importance for soybean improvement. However, covariation, modulated by genetic correlations between complicated traits via hub QTLs, commonly affects the efficiency and accuracy of soybean improvement. The goals of soybean improvement have nearly all focused on agronomic traits, including yield, plant type traits, and seed-related traits especially. To decipher the hub QTLs of yield, plant type, and seed, nine pertinent traits of an F2 population (181 plants) derived from a cross between KeXin No.03 and JiDou 17, which were different in multiple traits such as plant height, seed protein, and 100-seed weight, were investigated with a high-density genetic map covering 2708.63 cM. A highly significant negative phenotypic correlation (−0.95) was found between seed protein (Pro) and seed oil (Oil). A total of 35 final QTLs after combining the ones closely linked physically were identified for eight traits explaining from 0.10% to 24.63% of the phenotypic variance explained (PVE) using composite interval mapping (CIM) and inclusive composite interval mapping (ICIM) procedures, and 13 QTLs were novel genes. A genomic region on chromosome 14 (qPro14, qOil14.2, and qSw14) was associated with three seed-related traits based on the relationship within and among the three trait modules. In addition, four genomic regions were detected as hub QTLs which linked to the seed-related module and plant-type model, including the E loci (E1 and E2). From the QTL results, 31 candidate genes were annotated, including the verified genes E1, E2, and QNE1, and they were grouped into three categories of biological processes. These results illustrate the genetic architecture as correlations among various soybean traits, and the hub QTLs should provide insights into the genetic improvement of complex traits in soybean.

1. Introduction

Soybean [Glycine max (L.) Merr.] is a vital oilseed crop and a major source of protein in the daily human diet. Variety improvement has urgently sparked the global development of soybeans. For example, soybean production areas have extended from the temperate zone northward to the cold zone and southward to the subtropical and tropical zones due to the improvement in days to maturity [1].
However, complex correlations between agronomic traits often affect the efficiency and accuracy of improving target traits in soybeans. For instance, yield is the primary target of soybean breeding, but it is the result of the comprehensive expression of multiple traits. Yield is directly determined by yield-component traits, but strongly influenced by plant type traits with changing photosynthetic efficiency and some seed-related traits [2,3,4,5,6,7]. Notably, yield correlates positively with plant height, the number of pods per plant, and oil content, but it negatively correlates with protein content and seed weight; branch number is positively correlated with pod number per plant and seed weight per plant, but it is negatively correlated with 100-seed weight, oil content; and seed protein and oil content are significantly negatively correlated [6,8,9,10,11].
To meet the demands of the rapidly growing world population, conventional plant improvement characterized by phenotypic selection is joined with powerful and efficient molecular breeding that provides a more thorough dissection of the genetic basis of the traits of interest [12,13]. In conjunction with the development of sequencing technology, the genetic foundations of many interested traits in crops have been re-investigated, providing valuable resources for molecular breeding. For example, the discovery and utilization of semi-dwarf genes in rice and wheat triggered the “green revolution”, as the semi-dwarf crops exhibit multiple beneficial characteristics, including an improved response to fertilizer input, lodging resistance and enhanced light utilization, and increased yield and yield stability. The dwarfing mechanisms have been exploited efficiently in many crops [14,15]. Another notable example is the Ideal Plant Architecture 1 (IPA1) gene in rice, which has the ability to reduce unproductive tillers while increasing grains per panicle [16]. This gene is considered as a novel gene for the next green revolution and is already being utilized in rice breeding [17,18].
Actually, many targeted traits show continuous phenotypic variation and are controlled by multiple quantitative trait loci (QTLs). For example, as many as 239 QTLs for plant height have been identified in SoyBase (https://www.soybase.org/, accessed on 21 April 2021). Some studies have confirmed that the function or candidate genes of those QTLs involves different biological processes [1,19,20]. Therefore, comprehensive analysis of multiple traits is important for molecular breeding due to some loci/genes having pleiotropic effects on different traits or being tightly integrated. For instance, 245 loci governing 84 agronomic traits of soybean have been confirmed, of which 23 loci have pleiotropic effects on various traits [21]. The soybean gene of GmST05 was observed to regulate seed thickness and seed size and influence protein and oil content [22]; the POWR1 soybean gene was discovered to increase yield, seed weight, and oil content but reduce protein content [23]. Therefore, understanding trait covariation is essential for genetic improvement of multiple complex traits. With the development of biological technology, scientists are paying more and more attention to the relationship between complex traits. A wealth of literature supporting network thinking has arisen from medical research in the first few studies [24,25], but in recent years consensus has been reached on the necessity of using holistic, system-oriented approaches to study plant complex traits [26]. The hub QTLs in the QTL/genetic network for different traits have been constructed in many studies, for example in rice and cotton [27,28]. The hub QTLs connect the genetic relationship between multiple traits, which facilitate the mining and application of the genes with multiple effects subsequently.
Linkage mapping and association mapping are common approaches for quantitative trait loci (QTL) mapping. Linkage mapping is mainly applied to segregating populations such as F2 population and recombinant inbred lines (RILs). Different approaches have been developed to map QTLs for complex traits, including single marker analysis (SMA), simple interval mapping (SIM) [29], composite interval mapping (CIM) [30], inclusive composite interval mapping (ICIM) [31], and mixed-model based composite interval mapping (MCIM) [32]. However, there are still some deficiencies in these procedures, such as low detection efficiency, a high false-positive rate, and the missing or overflowing heritability problem. In addition to the CIM procedure which represents one of the most commonly used methods [33], a combination of several QTL mapping procedures is the most commonly used strategy to increase the persuasiveness and reproducibility of QTL results. Association mapping applied in diverse populations is convenient to directly find out candidate genes with sufficient markers and sample sizes, but high levels of linkage disequilibrium (LD) and indistinct population structures generate lots of problems which need to be solved [34]. These methods have been widely used in the QTL detection of different traits in soybean [35,36,37].
The present study aimed to (i) construct a high-density genetic map and identify the QTLs of nine agronomic traits associated with plant-type, yield-component, and seed-related traits; and (ii) explore the hubs of QTLs within the same trait modules and between different modules and the genetic foundation for molecular breeding in soybean.

2. Materials and Methods

2.1. Population Mapping

An F2 population named KJ was derived from a cross between KeXin No.03 (KX03, P1, released in Beijing, China) and JiDou 17 (JD17, P2, released in Hebei, China) by the Huaiyin Institute of Agricultural Sciences of Xuhuai Region in Jiangsu, Huai’an, China. The F2 population is expected to combine the difference in multiple traits between the two parents, such as plant height, seed protein content, and 100-seed weight. The F1 seeds were obtained in the summer of 2016 at the Modern Agricultural Hi-Tech Park in Huai’an, Jiangsu. Each one was sown and self-pollinated to produce the F2 population after removing false hybrid seeds in the winter of 2016 in Hainan Base, China. Finally, the 181 F2 plants and the two original parents were tested in hill-drop while planting each parent in a row in the summer of 2017 at the Modern Agricultural Hi-Tech Park in Huai’an, Jiangsu (33°53′ N, 119°04′ E). The single row plot was defined with a length of 2 m and a spacing of 0.5 m. The 181 F2 plants and 2 parents were used for the construction of a genetic linkage map and the evaluation of hub QTL detection among nine agronomic traits.

2.2. Trait Evaluation and Statistical Analysis

A total of nine agronomic traits were recorded from all 181 plants and the 2 parents, including plant height (Ph), the number of main stem nodes (Nms), branch number (Bn), pod number per plant (Pnp), seed number per plant (Snp), seed weight per plant (Swp), protein content (Pro), oil content (Oil), and 100-seed weight (Sw). Ph was measured as the length from the cotyledonary node to the terminal bud of a plant in “cm” units; Nms was recorded by counting the number of nodes from the cotyledonary node to the tip of the main stem; Bn was quantified by counting the number of primary branches; Pnp was the total number of pods per plant; Snp was measured as total seed number per plant; Swp was evaluated by weighting the total seeds per plant in “g” units; Pro and Oil were measured by the relative percentage of seed protein and oil content, respectively, to seed weight (%), which were quantified by near-infrared reflectance (NIR) spectroscopy DA-7200 (Perten Instruments, Huddinge, Sweden). Sw was calculated by weighting 100 seeds in “g” units.
According to their characteristics, these traits were divided into three categories: plant-type module harboring Ph, Nms, and Bn, yield-component module harboring Pnp, Snp, and Swp, and seed-related module harboring Pro, Oil, and Sw.
The phenotypic data were analyzed by the SAS 9.1 software package (SAS Institute, Cary, NC, USA) to obtain descriptive statistics, including differences between parents, frequency distributions of lines, and population means. The Pearson’s correlation coefficient calculated with the SAS 9.1 software package was used to assess the correlation between the pairs of traits among the nine agronomic traits.

2.3. Molecular Marker Identification and Genetic Map Construction

Genomic DNA was isolated from young leaves from two parents and 181 lines using the CTAB method [38]. The F2 mapping population and two parents were used to construct the DNA library which was sequenced based on a genotyping-by-sequencing (GBS) strategy [39]. Genomic DNA from each of the F2 individuals and parents was incubated at 37 °C with MseI and NlaIII (New England Biolabs, NEB). The restriction ligation probes were purified with Agencourt AMPure XP (Beckman). The PCR amplifications were performed utilizing purified samples and Phusion primer and index primers for each sample. The PCR productions were purified and pooled using Agencourt AMPure XP (Beckman) and then screened on a 2% agarose gel. Fragments of 400–425 bp in size (with indexes and adaptors) were isolated using a gel extraction kit (Qiagen, Valencia, CA). These fragment products were then purified using Agencourt AMPure XP (Beckman) and further diluted for sequencing. Finally, the 150-bp pair-end reads with insert sizes of 265–290 bp were attached to the selected tags using an Illumina high-throughput sequencing platform Illumina HiseqTM from the Novogene Bioinformatics Institute, Beijing, China. The clean reads of each F2 individual were aligned against the reference genome with the Burrows–Wheeler Aligner (BWA) [40]. Alignment files were converted to BAM files utilizing sorting in the SAMtools software [41]. In the case of several read pairs with identical coordinates, the pair with the highest mapping quality was retained. Variants calling was performed on all samples using SAMtools software. SNPs were filtered with a Perl script. The software tool snpEff [42] was used to annotate the SNPs of the two parents based on the GFF3 files from the Williams82v2.1 sequence (https://data.jgi.doe.gov/refine-download/phytozome?q=Glycine+max&expanded=Phytozome-275, accessed on 15 April 2018).
The SNPs were tested and selected with a segregation distortion test p < 0.01 by Chi-square (χ2) tests and with filtering out the abnormal base. In order to strictly ensure the quality of the molecular markers, SNPs were deleted with a missing rate of more than 20%. Finally, 137,715 high-quality SNPs were used for linkage map construction. The genetic linkage map was constructed using JoinMap version 4.0 with a minimum logarithm of odds (LOD) score of 6. The map was generated for each linkage group with a recombination frequency below 0.40 and LOD values above 0.5 for all markers within each linkage group. The recombination rate was converted into linkage distances (cM) using the Kosambi function [43]. Due to the recombination rate between some markers being low and a considerable number of markers being abandoned, the 3188 SNPs were grouped into 20 linkage groups.

2.4. QTL Analysis

The QTL analysis was performed using two methods: (1) the composite interval mapping (CIM) model in the WinQTL Cartographer v2.5 software was used along with cofactors to identify control markers in a stepwise (forward and backward) selection (α = 0.05). The selected markers were used as covariates to control the genetic background noise in the CIM procedure. The genome walk speed was 1 cM with a window size of 1 cM, while the LOD value was determined by 1000 permutation tests [44]; and (2) The inclusive composite interval mapping (ICIM) procedure using QTL IciMapping 4.1 software was used [45,46]. ICIM was performed at every 1 cM. The significant LOD threshold for QTLs of each trait was determined using a permutation test (3000 permutations) at p = 0.05. In order to analyze these QTLs of different traits more intuitively, the QTLs with a physical distance shorter than 1 Mb were merged into one QTL. The QTL interval (QTL/QTL cluster) was fixed and defined as the final QTL. The hub QTLs were found when the QTL was connected with another QTL located in a confident region (500 Kb) in a same trait module or between different trait modules. The software programs Mapchart 2.20, Cytoscape 3.5, and Circos were used to visualize the QTL collinear relationships. MapChart (https://www.wageningenur.nl, accessed on 5 April 2015) generates chain relationships between chromosome and QTL data charts. Cytoscape (https://www.cytoscape.org/, accessed on 5 June 2017) presents the QTL data in the form of a network and was used to show the collinear relationships of QTLs with lines.

2.5. Prediction of Candidate Genes

The candidate genes of these QTLs detected for nine traits were predicted based on the SoyBase (https://soybase.org, accessed on 15 June 2022) and the annotation of SNPs from the two parents using snpEff software. Firstly, the genes distributed in the confident interval regions of the detected QTLs were identified from the SoyBase. Then, the annotation of the SNPs detected from the two parents in these genes were scanned and the genes with SNPs annotated as “variants impact high” and “variants impact low” were considered as the candidate genes. The gene ontology annotations of the candidate genes were picked up from the SoyBase. Singular enrichment analysis (SEA) was used for the gene ontology (GO) analysis of the candidate genes [47].

3. Results

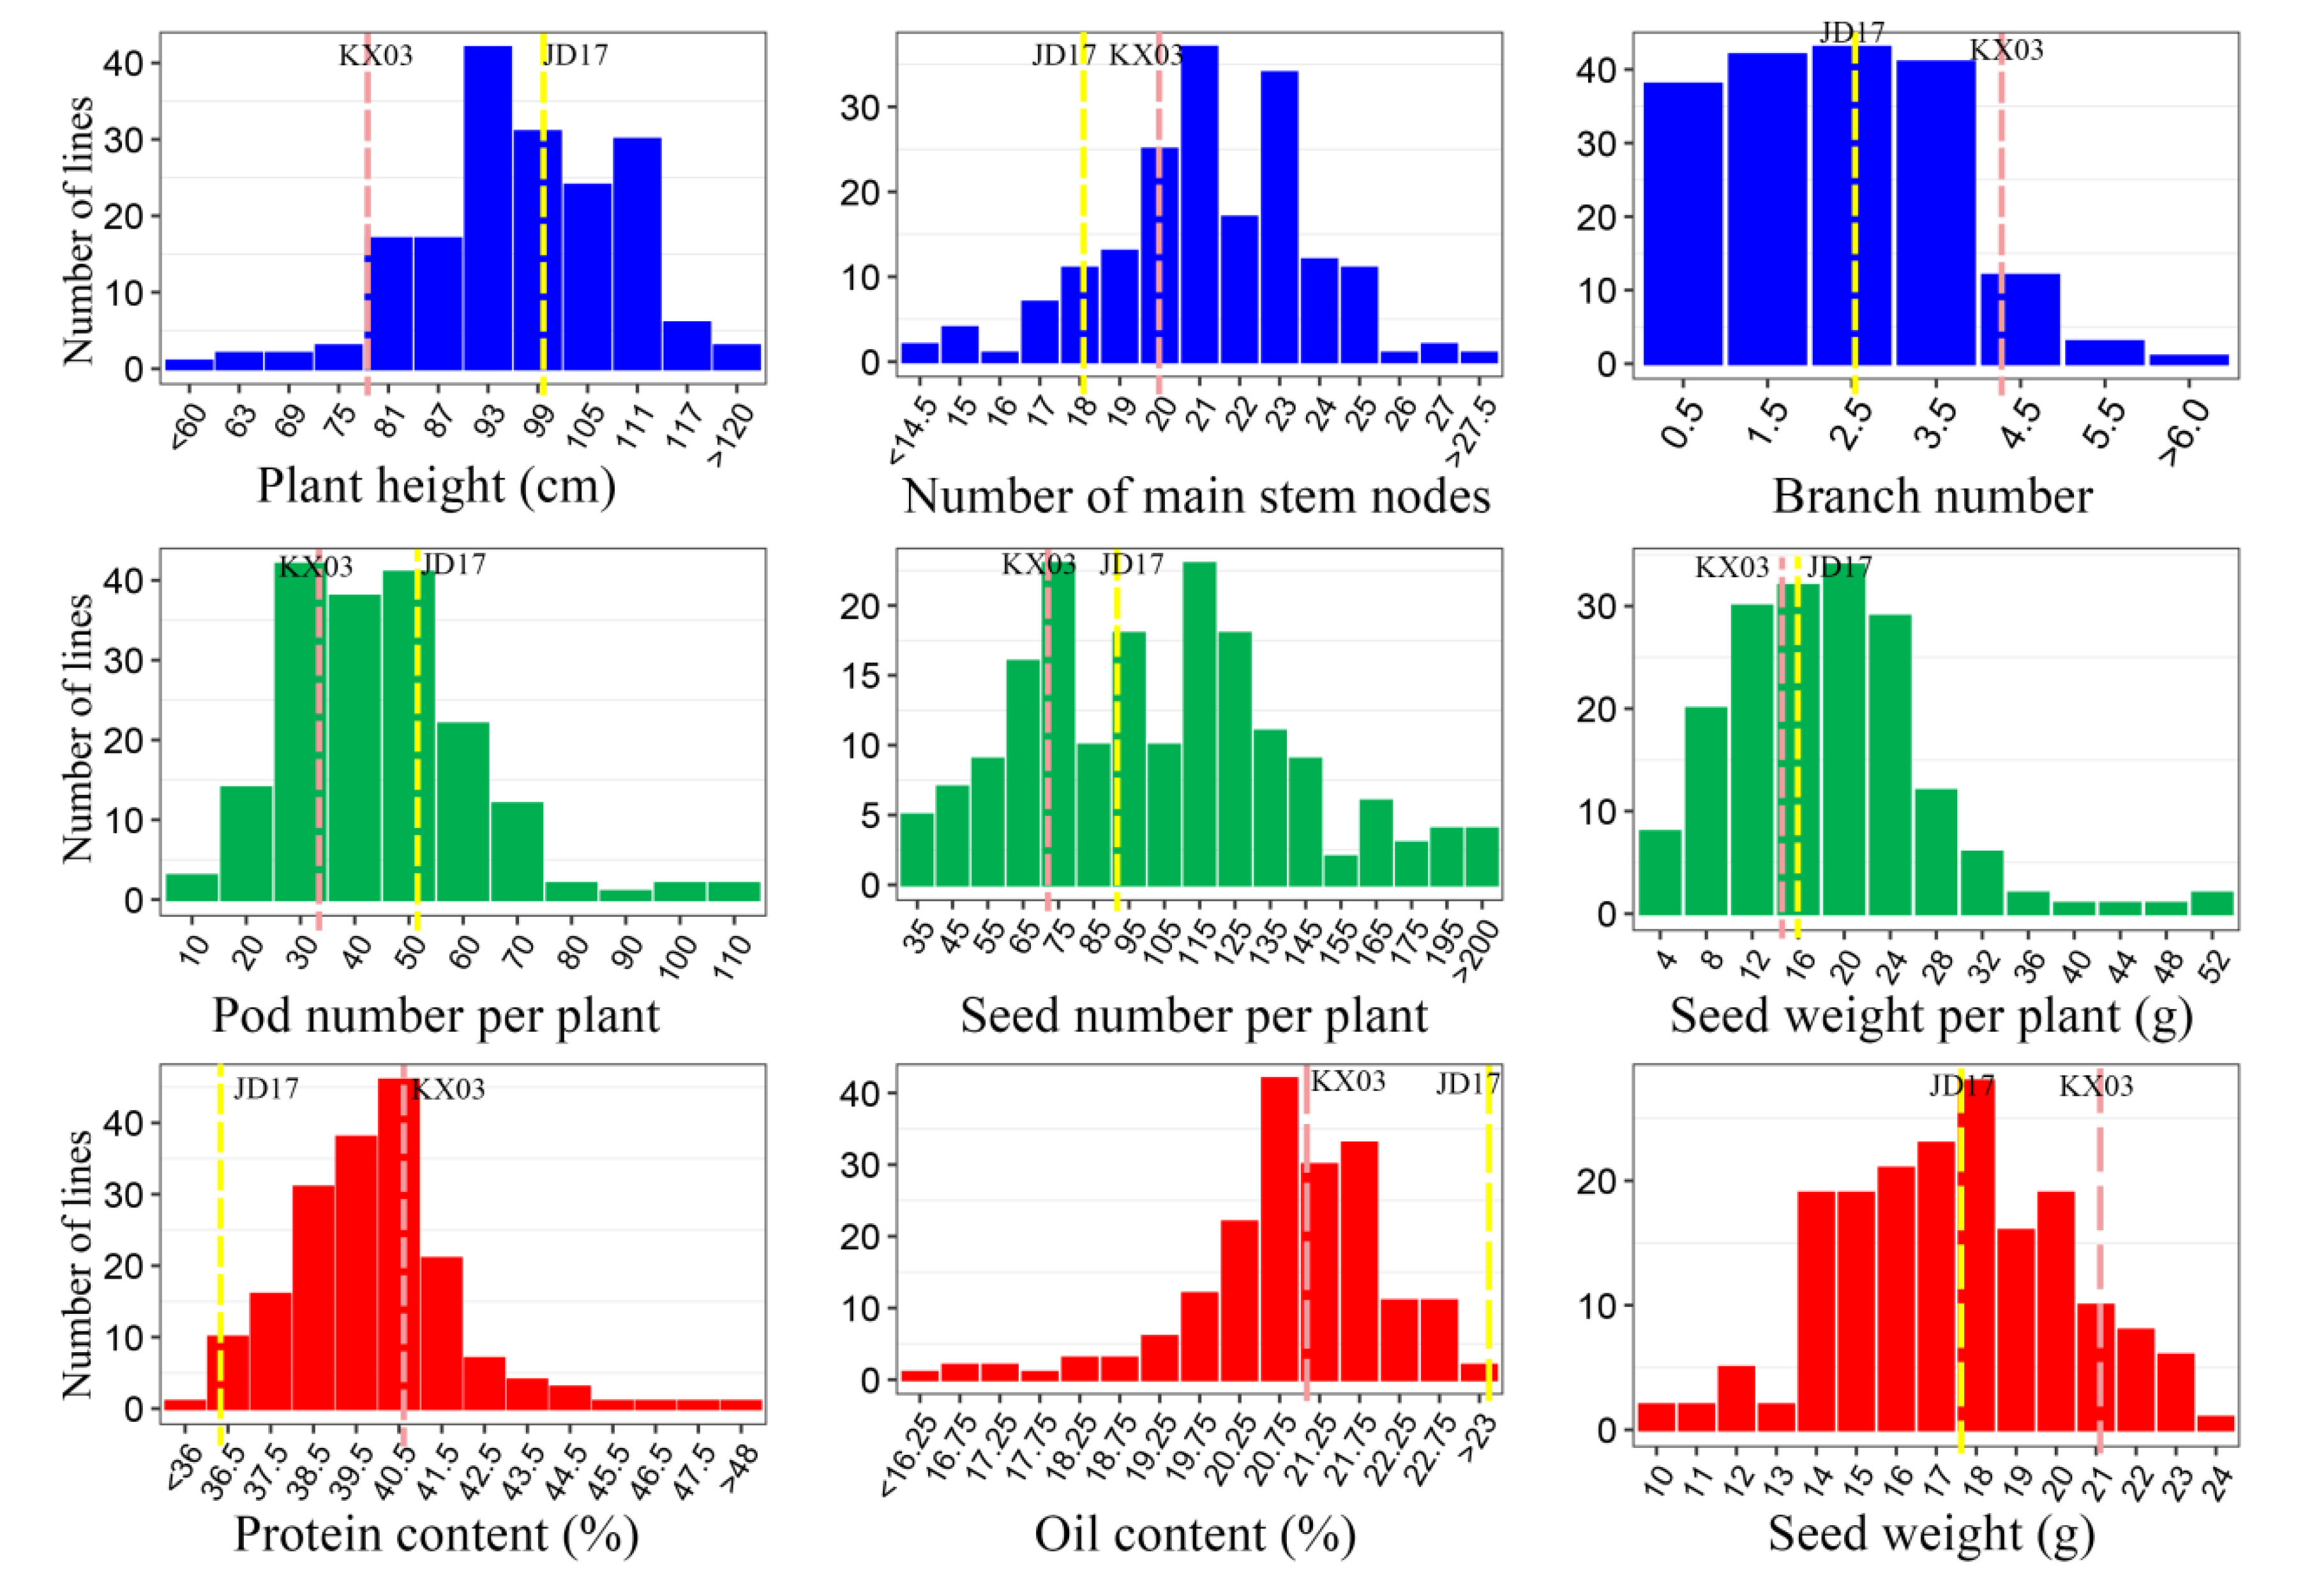
3.1. Variation of Three Trait Modules from Nine Agronomic Traits in the F2 Population

The phenotypes of nine traits in the KJ F2 population and their parents were analyzed (Table 1, Figure 1). Considerable and universal differences were found between the parents, KeXin No.03 (KX03) and JiDou 17 (JD17). KX03 showed lower Ph (78.00 cm vs. 99.50 cm) and higher Nms and Bn (20.00 vs. 18.00; 4.20 vs. 2.50) than JD17 in the plant-type module; lower Pnp, Snp, and Swp at 34.20, 73.80, and 15.50, respectively, in comparison to JD17 in the yield-component module; higher Pro and Sw than JD17 (40.76% vs. 36.36%; 21.00 g vs. 17.50 g) in the seed-related module. The phenotypic variations for each trait in the KJ F2 population showed a wide range and exhibited an obvious transgressive segregation (Figure 1). The coefficient of variation for each trait was relatively large, ranging from 5.02~54.09. The coefficient of variation of most traits was greater than 10, with the exception of Pro and Oil, indicating that these traits have great potential for genetic improvement. The segregation of nine traits in the KJ F2 population generally conformed to a normal distribution and showed strong transgressive inheritance, indicating that these traits were suitable for QTL mapping.

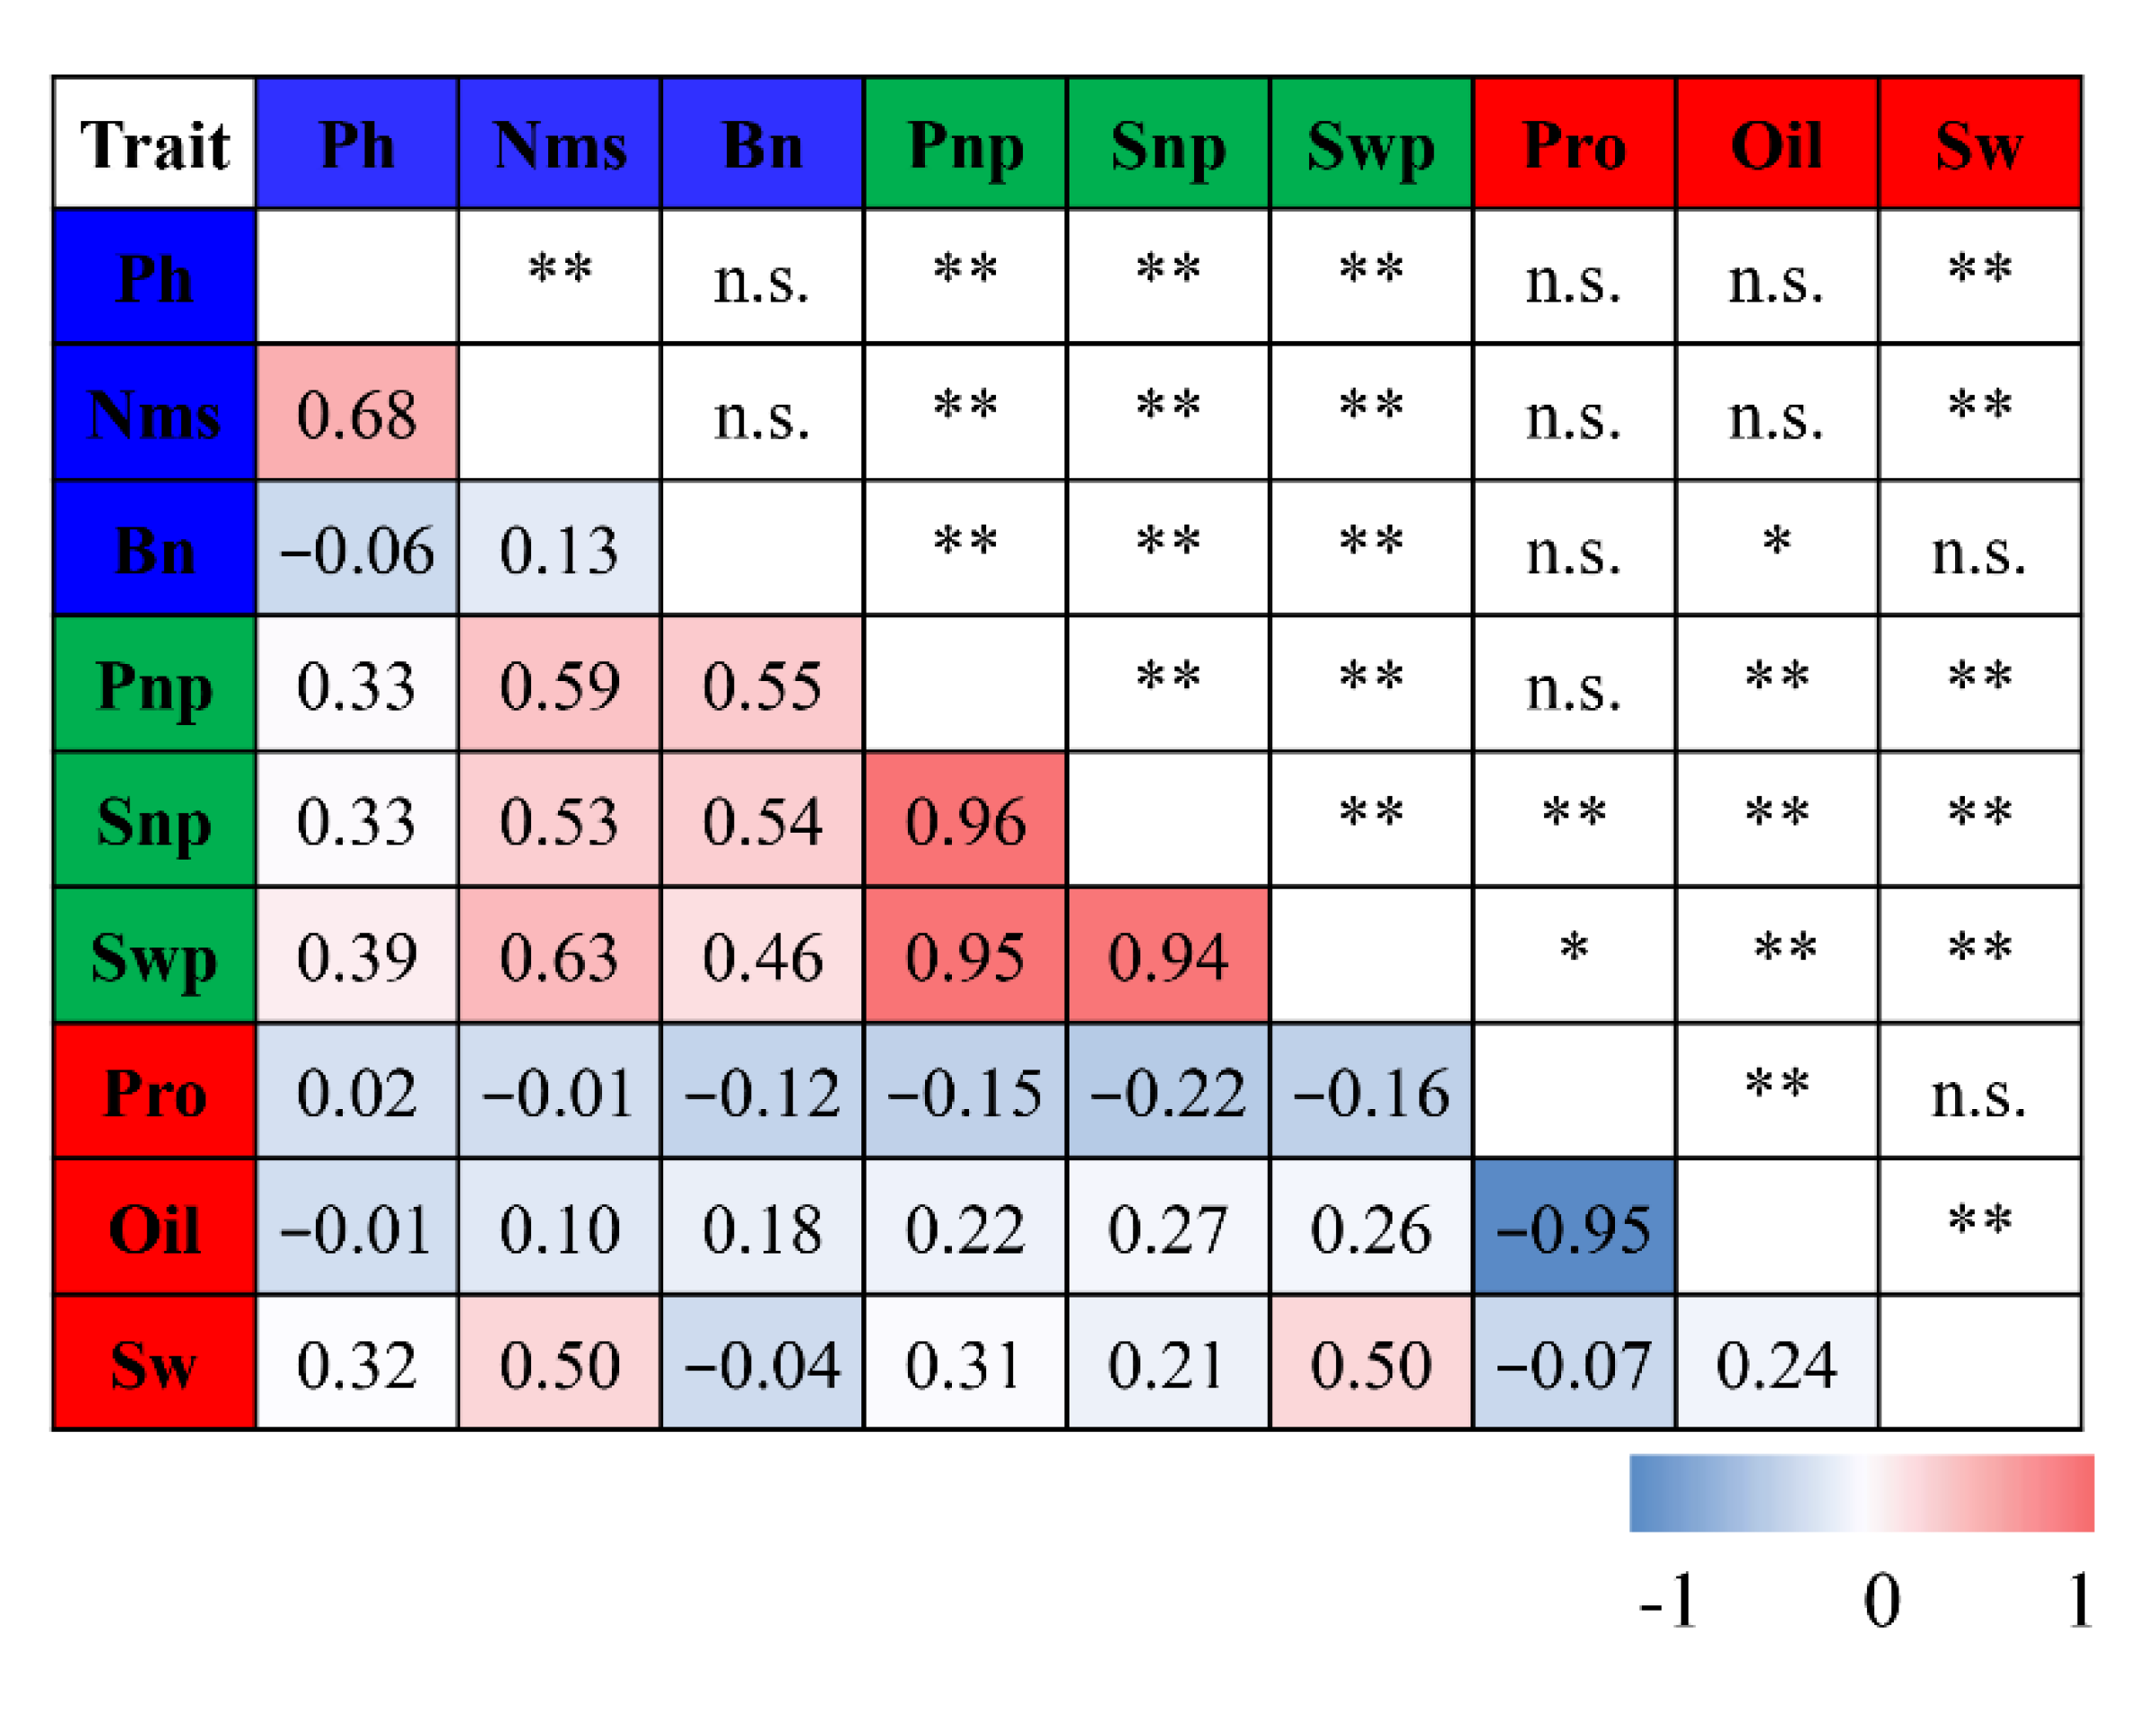
3.2. Correlation Analysis between Different Agronomic Traits

The Pearson’s correlation coefficient with bilateral detection was used to examine the correlation between the nine traits with a continuous variation in the KJ F2 population (Figure 2). The correlations between traits in the yield-component module were highly positively correlated, while those in other specific modules varied widely. The correlation between Ph and Nms was positively significant with 0.68 but no other plant-type traits showed any statistical correlation. All of the correlations (0.94~0.96) between the traits in the yield-component module were statistically significant. The most significant correlation (−0.95) in the seed-related module was Pro and Oil, while the correlations between the remaining traits were insignificant or significant at low levels (r = 0.24 between Oil and Sw). While trait correlations in other modules varied greatly, those between plant-type and yield-component modules were moderate and positive (R-values ranged from 0.33 to 0.63). For example, a positive and significant correlation of 0.50 was estimated between Sw and Nms, whereas the correlation between Pro and traits in plant-type and yield-component modules was not significant or significant with the correlation coefficients smaller than 0.25 (the correlation coefficients ranged from −0.22 to −0.16). The results showed that there were significant correlations between most of the nine traits and that some traits with a strong correlation to each other might be affected by the same loci or closely linked loci.

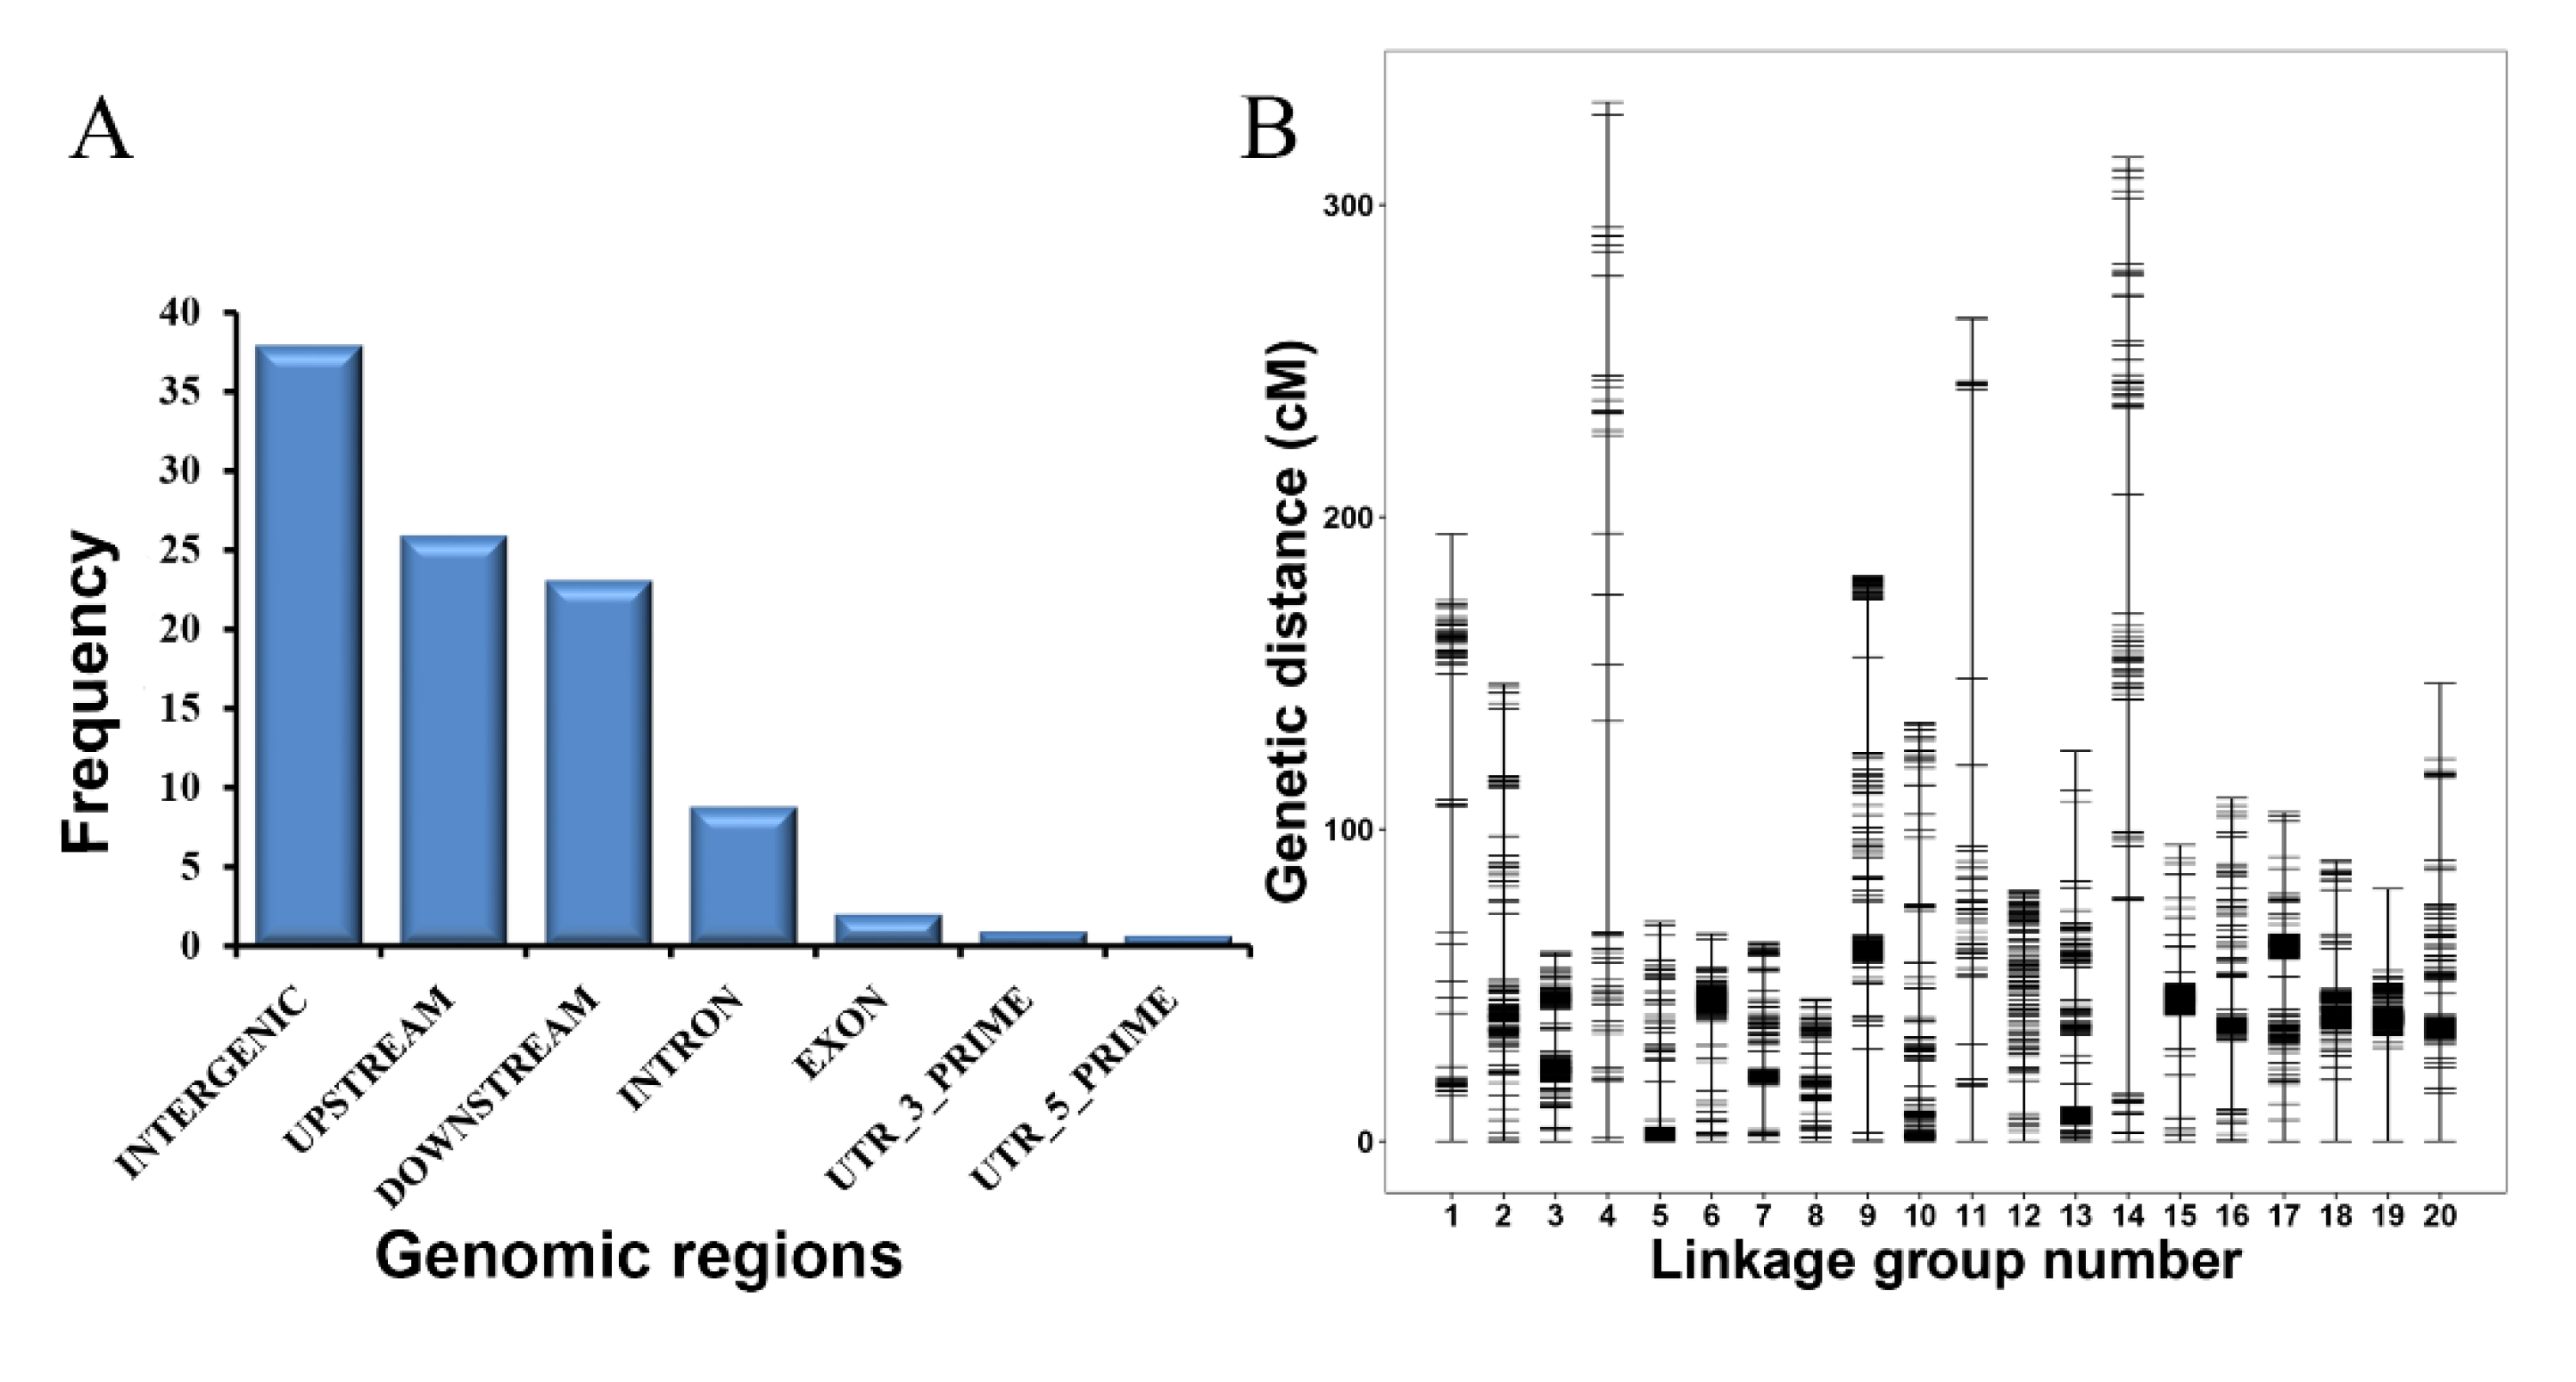
3.3. High-Quality SNP Linkage Map Construction for the KJ F2 Population

Based on the GBS-seq (genotyping-by-sequencing) of the KJ F2 population, 58.25 Gb of sequence reads were obtained. According to these data, a total of 1,380,677 high-quality polymorphic SNP sites were detected between the two parents, KX03 and JD17. By annotating these SNPs, a total of 1,371,579 SNPs were located in the genomic regions: intergenic, upstream, downstream, intron, exon, and UTRs. One third (37.97%) of the SNPs were located in intergenic regions (Figure 3A). Of the remaining, the largest number of SNPs were detected around genes (49.17%), followed by upstream (25.99%) and downstream (23.18%). Meanwhile, a small portion of the SNPs were in the gene region (3.06%), followed by the exon region (2.01%), 3′ UTR region (0.98%), and 5′UTR region (0.71%).
A total of 137,715 SNPs were selected for the construction of genetic linkage groups in the 181 lines after filtering out the SNPs with significant segregation and missing values across the genotyped individual of more than 20%. Subsequently, a total of 3188 high-quality SNPs were grouped into 20 linkage groups after filtering out the SNPs with co-separation, a low recombination rate, or those that were ungrouped (Figure 3B). The total length of the linkage map is 2708.63 cM, with LG04 (332.88 cM) being the largest and LG08 (45.58 cM) being the smallest (Table 2). The average distance between the two adjacent markers was 0.85 cM, varying from 0.27 cM (LG19) to 4.21 cM (LG04). The number of markers per linkage group varied from 74 (LG01) to 300 (LG19), with an average of 159.4 markers per linkage group. The average percentage of gaps smaller than 5 cM across the genetic map was 96.02%, with the largest at LG04 being 83.54%. In all, the overall marker density was relatively high and the marker distribution was relatively uniform, except for those on Chr. 01, 04, 07, 08, and 11. The genetic linkage map was suitable for the genetic analysis of subsequent traits in the population.

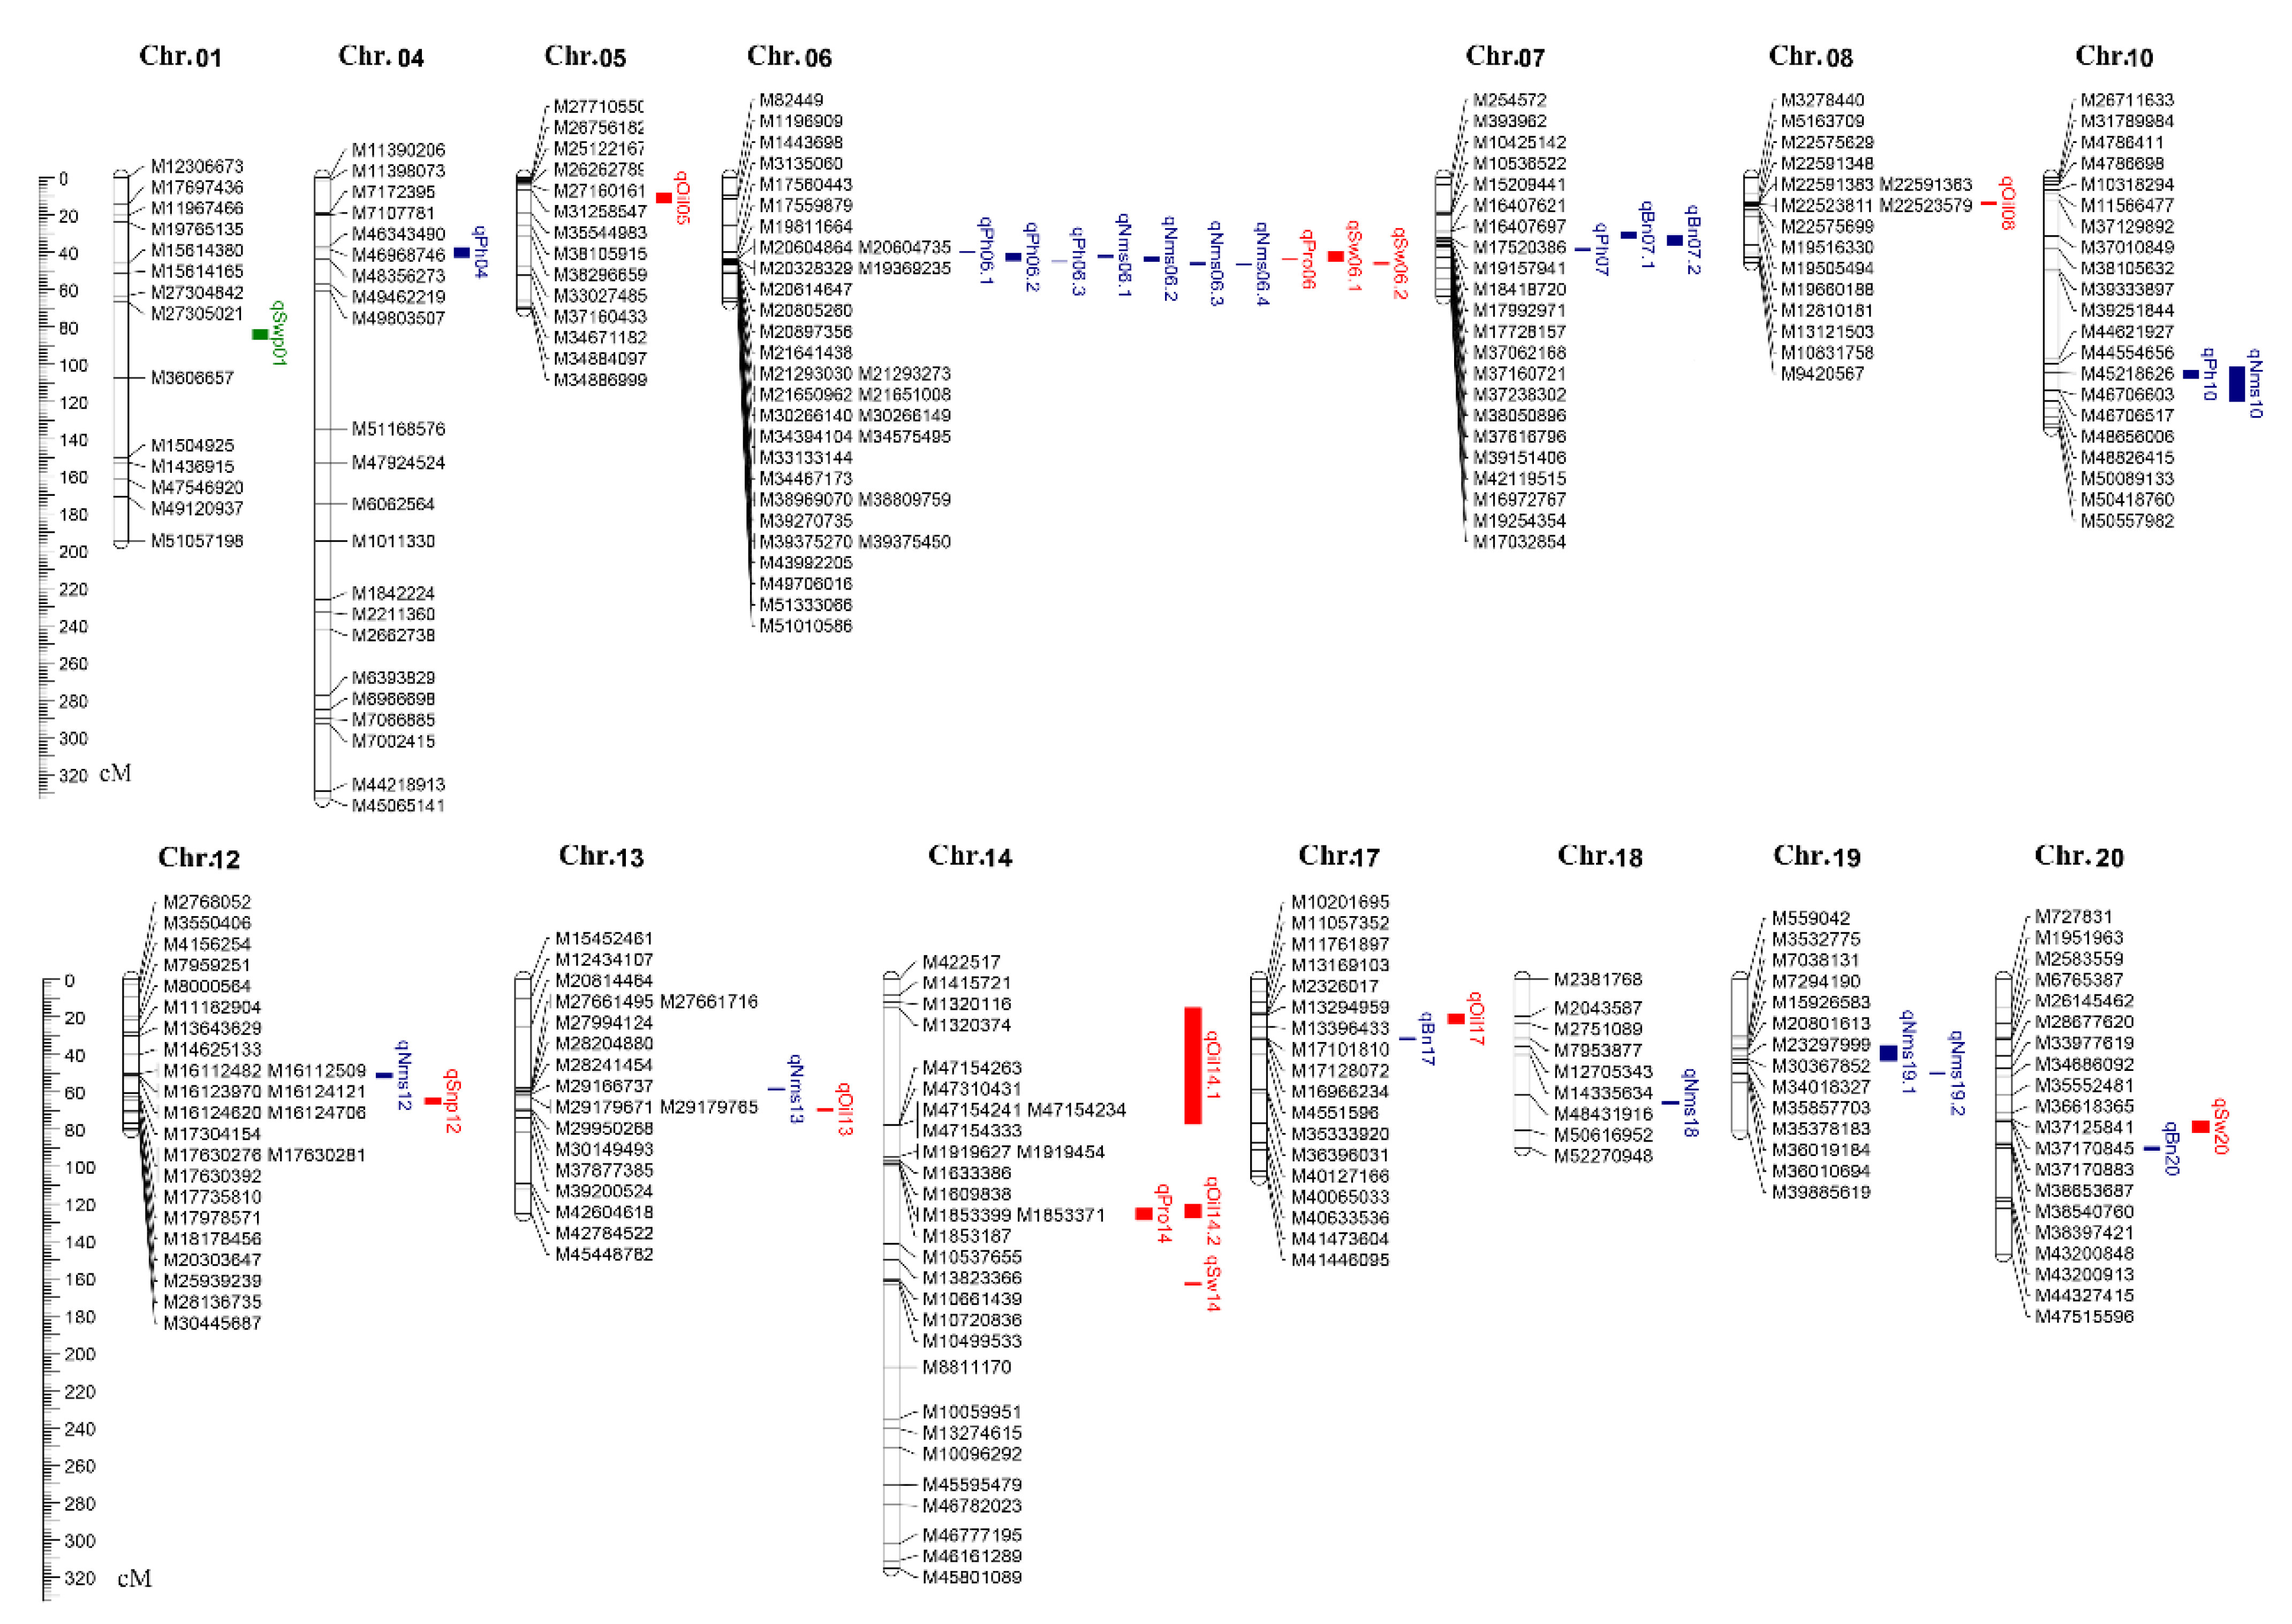
3.4. Identification of QTLs over Multiple Agronomic Traits

The QTL detection for nine traits was performed by composite interval mapping (CIM) and inclusive composite interval mapping (ICIM) using the 3188 SNPs mapped on the genetic linkage map (Table 3). Forty-two QTLs across nine chromosomes were identified from the CIM procedure for the following six traits: Ph, Nms, Bn, Pro, Oil, and Sw, while no QTLs were detected for the yield-component module traits. The number of QTLs detected in traits varied greatly. There were 9 to 18 QTLs detected for Ph, Sw, and Nms, but only one to three were found for Bn, Pro, and Oil. Of these, nine QTLs associated with Ph were mapped to Chr. 06 and 07, 18 QTLs for Nms were mapped to Chr. 10, 12, 13, 18, and 19, one QTL was identified for Bn to Chr. 07, one QTL was associated with Pro to Chr. 06, three QTLs confirmed Oil to Chr. 08, 13 and 14, and ten QTLs associated with Sw to Chr. 06 and 10. The confidence intervals for these 42 QTLs spanned physical distances from 242 bp to 4.5 Mb by comparison to the Williams 82 genome. The phenotypic variation explained (PVE) by each QTL ranged from 0.10 to 24.63%, of which 30 QTLs explained more than 3% of the phenotypic variation.
From the ICIM method, a total of 21 QTLs distributed over ten chromosomes were detected for eight traits. Of these, four QTLs associated with Ph were mapped to Chr. 04 and 10, three QTLs confirmed Nms to Chr. 06 and 10, three QTLs confirmed Bn to Chr. 07, 17, and 20, two QTLs associated with Snp to Chr. 12, one QTL confirmed Swp to Chr. 01, one QTL associated with Pro to Chr. 14, three QTLs confirmed Oil to Chr. 05, 14 and 17, and four QTLs associated with Sw to Chr. 10, 14 and 20. The confidence intervals for these 21 QTLs spanned physical distances from 103.6 Kb to 23.7 Mb, with an average distance of 3.3 Mb. The PVE by each QTL ranged from 3.43 to 27.90%.

3.5. Co-Localization of QTLs Detected from Different Methods

A total of 63 raw QTLs were detected by CIM and ICIM methods, some of which were QTLs in a close physical position. From the CIM results, many QTLs were shown as clusters distributed on the chromosome. In order to analyze these QTLs of different traits more intuitively, the QTLs with a physical distance shorter than 1 Mb were merged into one QTL. Finally, the QTL interval (QTL/QTL cluster) was fixed and defined as final-QTL. A total of 35 final-QTLs were detected for eight traits excluding Pnp and distributed across 14 chromosomes (Table 4, Figure 4). Six of the QTL detected for Ph were distributed on Chr. 04, 06, 07 and 10. Ten QTLs identified for Nms were on Chr. 06, 10, 12, 13, 18, and 19. Four QTLs detected for Bn were distributed on Chr. 07, 17, and 20. One QTL identified for Snp was located on Chr. 12 and one Swp QTL was located on Chr. 01. Two QTLs identified for Pro were distributed on Chr. 06 and 14. Six QTLs detected for Oil were located on Chr. 05, 08, 13, 14, and 17. Five Sw QTLs were distributed on Chr. 06, 10, 14, and 20. Three final-QTLs were identified by both CIM and ICIM methods, named qNms06.1, qNms10, and qSw10, with PVE values ranging from 9.87 to 20.31%. qNms10 and qSw10 have the same physical positions as previously reported as E2 locus [48]. Compared to the 71 reported QTLs on SoyBase, 22 of the QTLs detected in this study were located in the same physical regions, 15 other QTLs from this population were novel, such as the four QTLs identified for Bn, which contributed 5.78~9.69% of the phenotypic variation. These novel QTLs with large PVE values have the potential to establish the foundation for exploring the genetic basis of these traits.

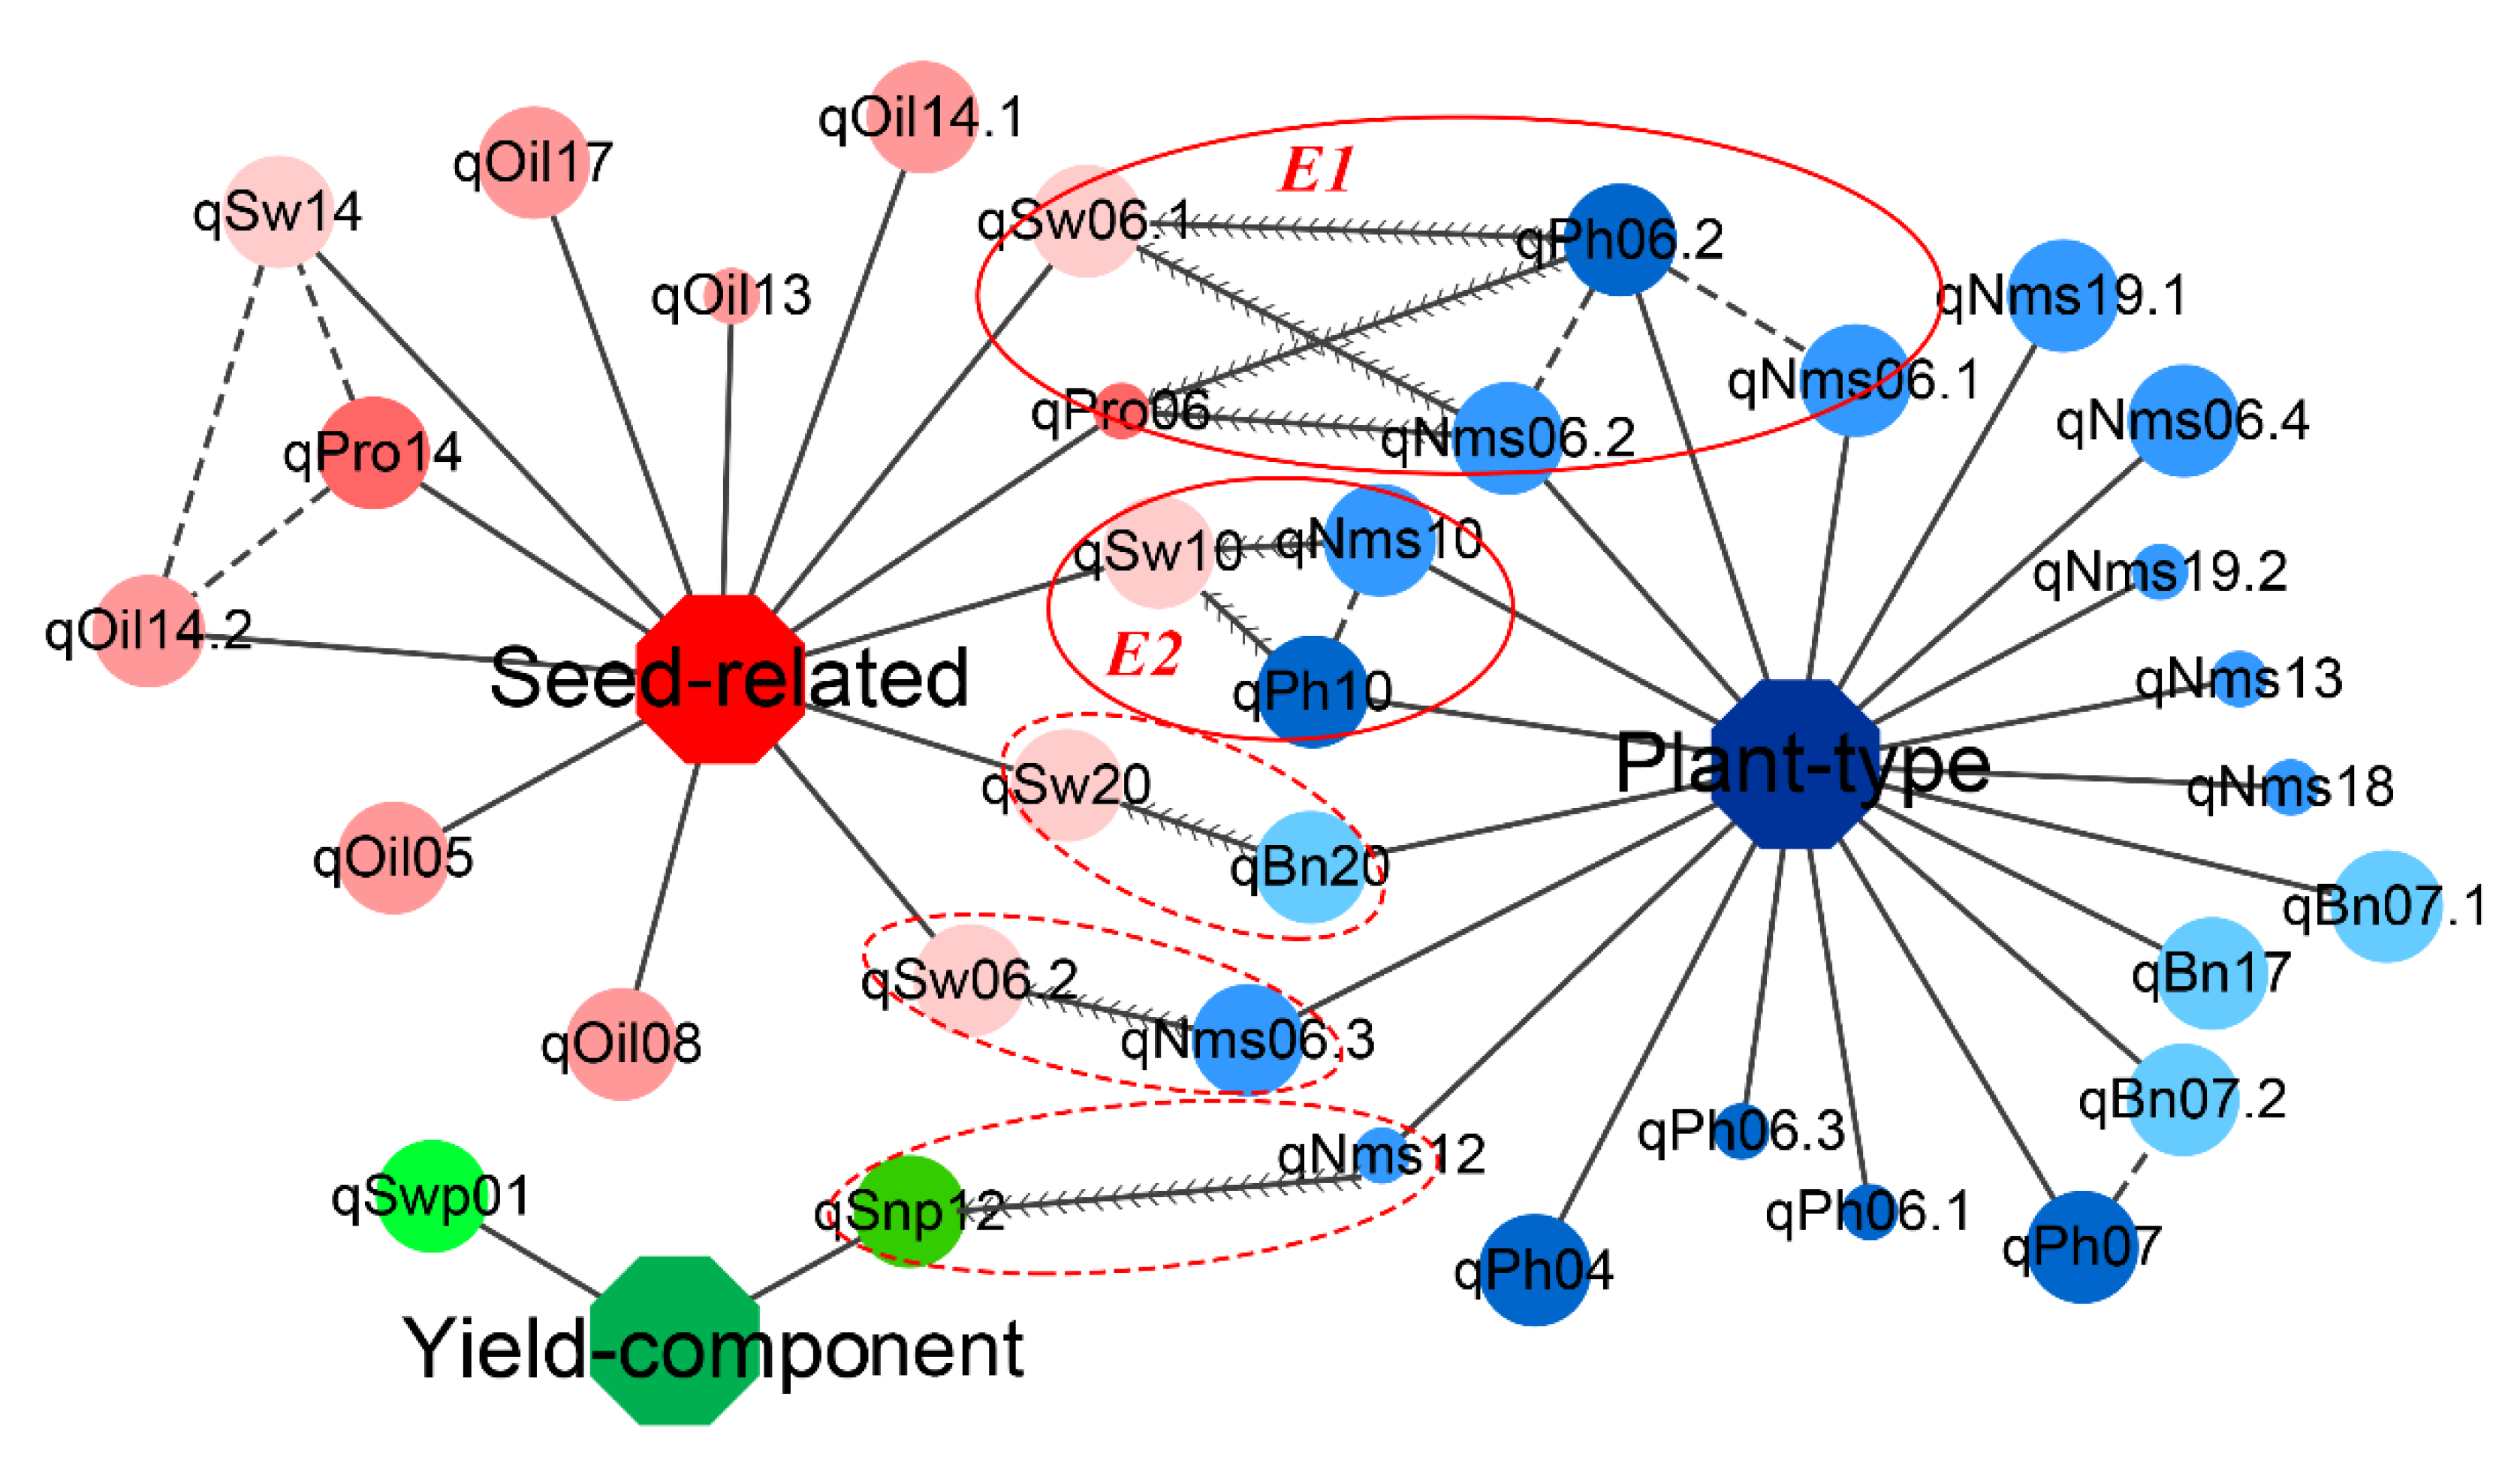
3.6. Exploration of Hub QTLs among Three Trait Modules in the KJ Population

Most of the nine traits had significant correlations, and some QTLs tended to cluster together, indicating that some of the nine traits may be controlled by the same or closely linked loci. In order to dig out the most important hot loci from the different traits or modules with multiple effects, 35 final-QTLs were further analyzed by comparing their physical position.
In the same trait module, a total of four QTL hotspots were mapped on four chromosomes, including Chr. 06, 07, 10, and 14 (Figure 5). In the plant-type module, three QTL hotspots were found, one between 17,699,008 and 20,805,260 bp on Chr.06 harboring three QTLs affecting the expression of Ph and Nms, the second one between 35,251,457 and 38,050,866 bp on Chr.07 harboring two QTLs controlling Ph and Bn, and the third one between 44,554,656 to 46,706,603 bp on Chr.10 harboring two QTLs affecting the expression of Ph and Nms. In the seed-related module, two QTL hotspots were detected, one between 17,559,879 and 20,897,356 bp on Chr. 06 harboring two QTLs controlling Pro and Sw, and the other located between 1,320,374 and 47,154,263 bp on Chr. 14 containing three QTLs associated with Pro, Oil, and Sw. These QTL hotspots were recognized by 12 QTLs, 11 of which were large contribution QTLs, with the exception of qPro06. It was noteworthy that the QTL hotspot on Chr.07 associated with both Ph and Bn, explaining 5.90~8.89% of the phenotypic variation, was a novel region.
Among the different trait modules, a total of 5 regions defined as hub QTLs out of 14 final QTLs associated with six traits and distributed on four chromosomes were examined, such as Chr. 06, 10, 12, and 20 (Figure 5). From the plant-type and seed-related module, a total of four hub QTLs were identified on Chr. 06, 10, and 20; the first physical region from 17,559,879 to 20,897,356 bp on Chr.06 harboring five QTLs associated with Ph, Nms, Pro, and Sw, the second physical region between 30,266,140 and 38,969,070 bp on Chr.06 harboring two QTLs affecting the expression of Nms and Sw, the third physical region from 44,554,656 to 48,656,006 bp on Chr.10 harboring three QTLs associated with Ph, Nms, and Sw, and the last physical region between 37,170,883 and 38,653,687 bp on Chr.20 harboring two QTLs associated with Bn and Sw. Only one hub QTL related with the plant-type and yield-component module was identified from 16,112,509 to 17,839,525 bp on Chr.12 associated with Nms and Snp.

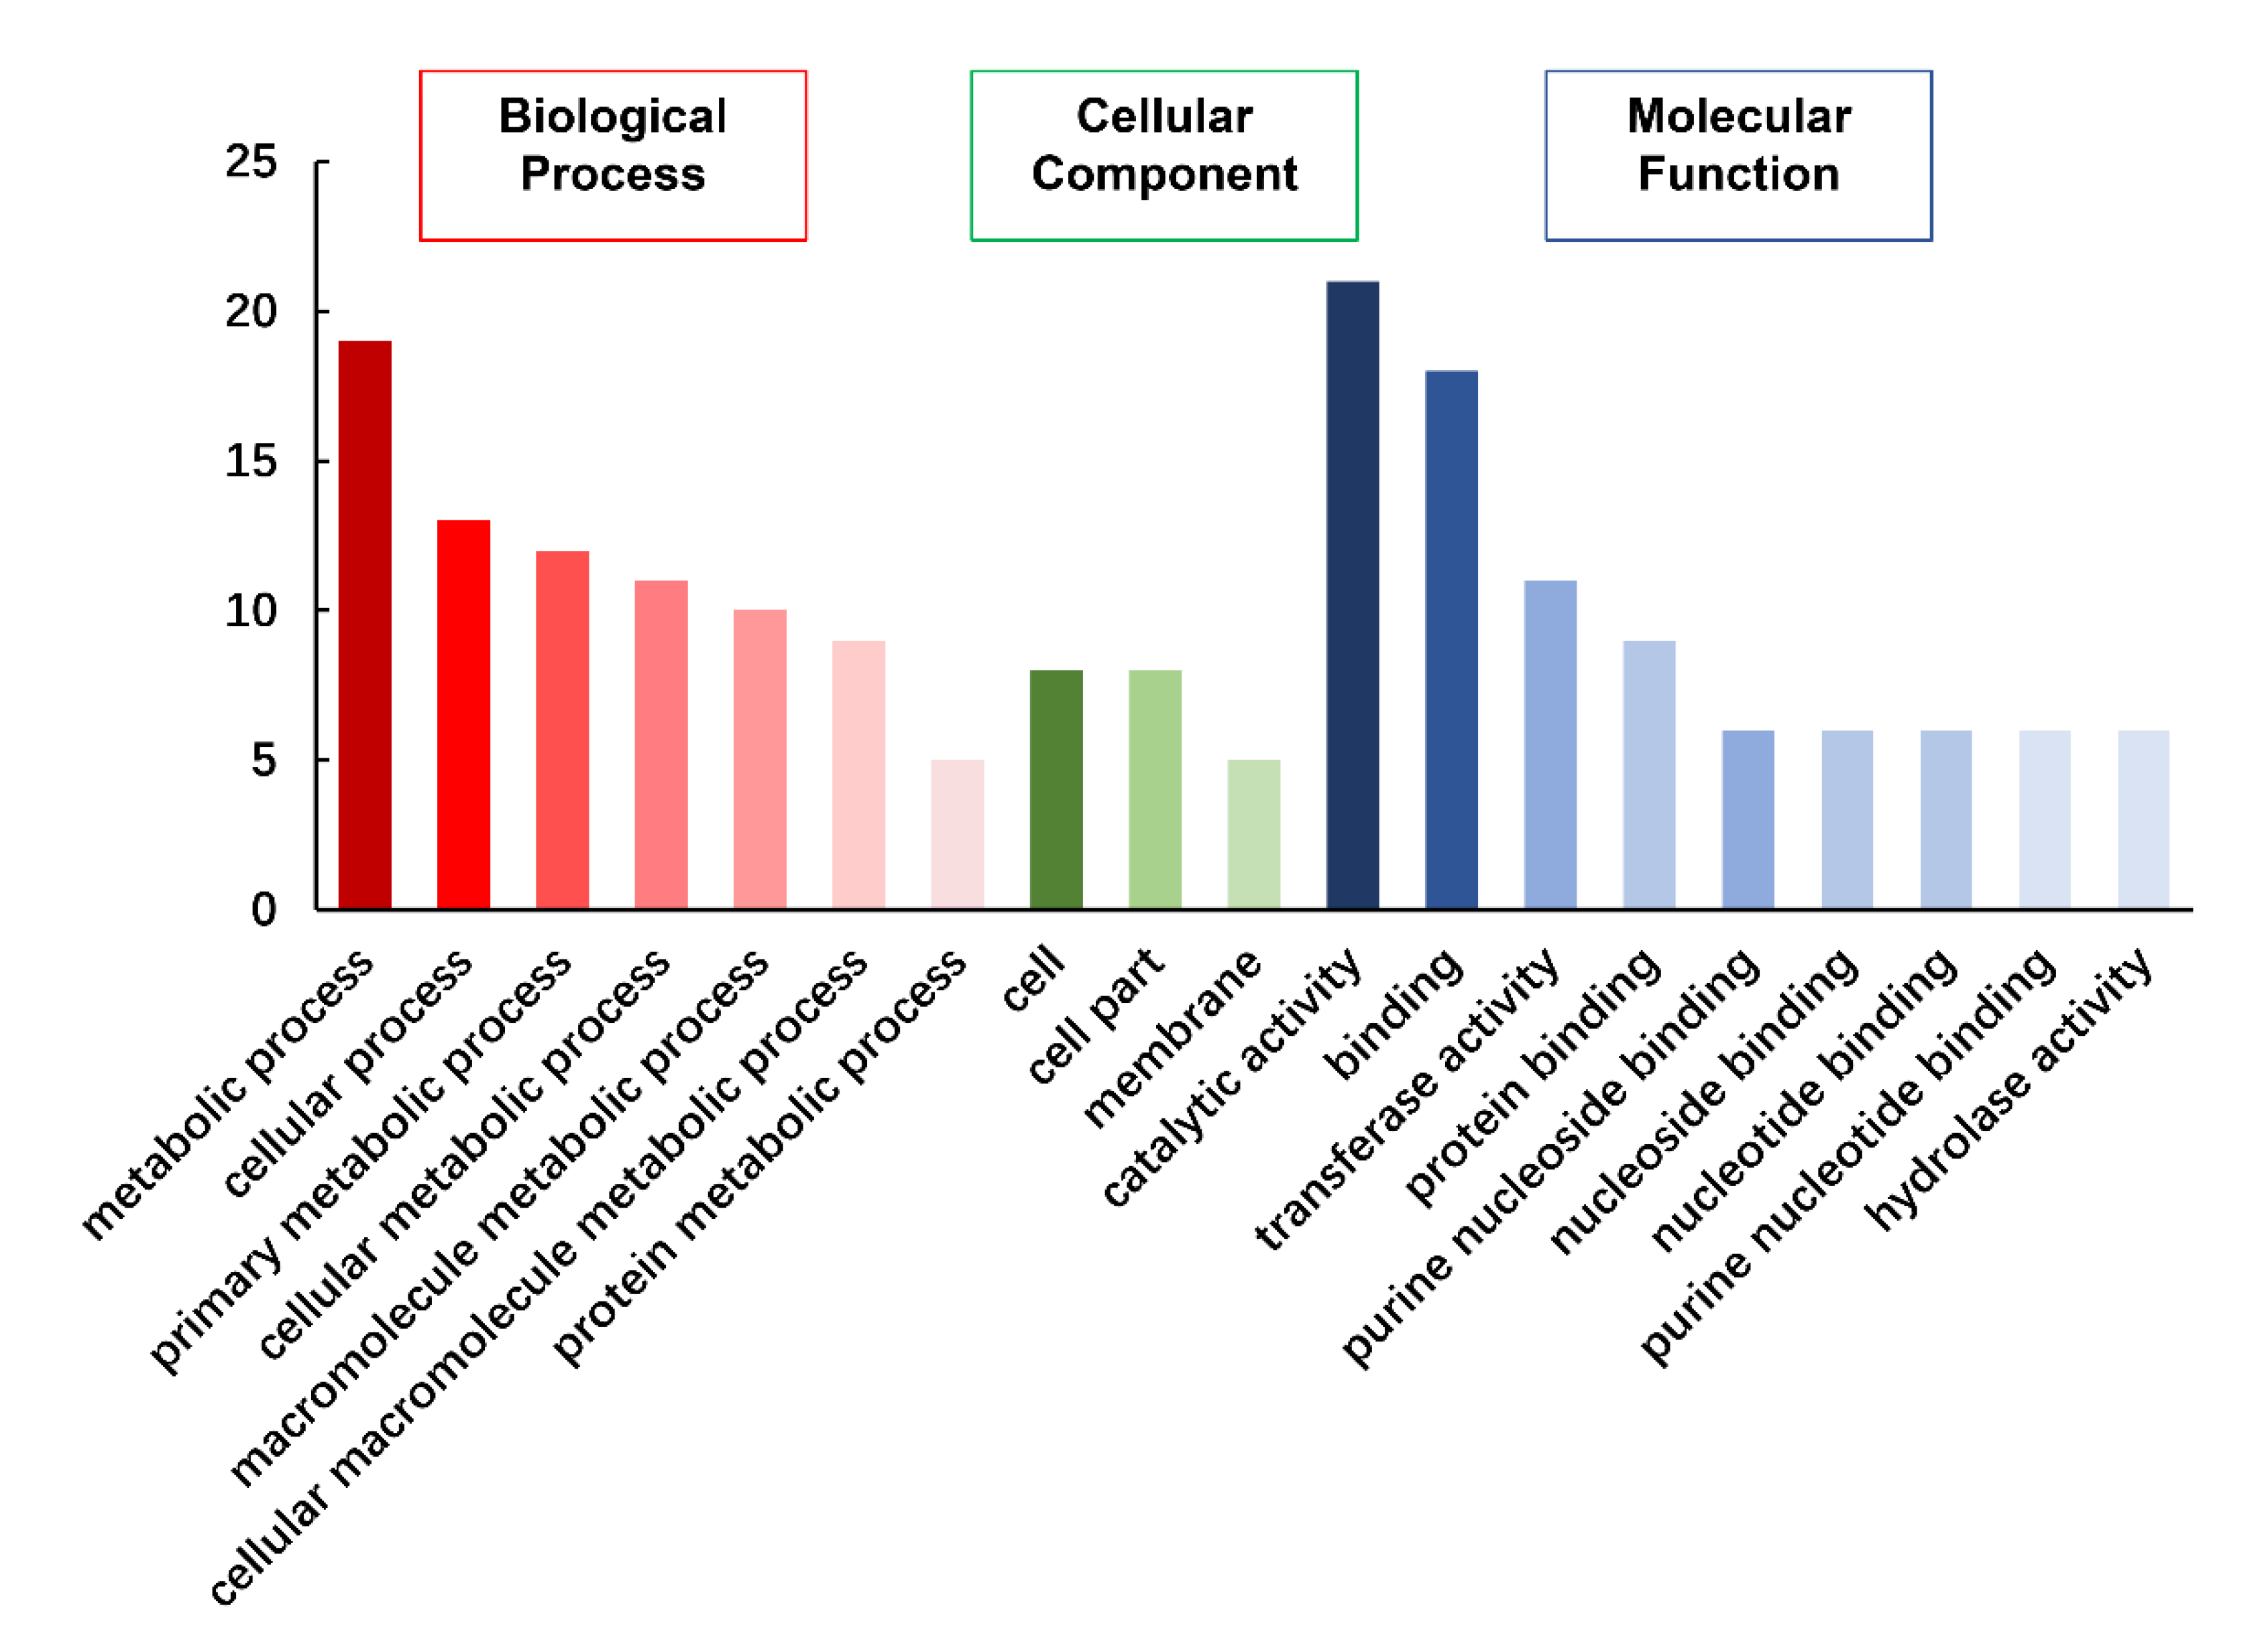
3.7. Exploration of Candidate Genes for Different Traits in the KJ Population

A total of 140 candidate genes involved in 22 out of the 35 QTLs were identified, with 31 located in 12 major QTLs with large contribution and 109 located in 33 major QTLs with a small contribution (Table 5). To ensure the reliability of candidate genes, the other 13 QTLs with confidence intervals larger than 1 Mb were ignored. The candidate genes harboring 1075 SNPs were verified from 1 SNP to 113 SNPs of the two parents. These candidate genes, including the previously reported E1, E2, and QNE1 genes [48,49,50], were identified for seven traits, except Pnp and Swp.
The GO enrichment results showed that 34 of the 140 candidate genes were grouped into three GO categories, which could be subdivided into 19 subgroups, while the remaining 106 candidate genes were excluded from the the GO enrichment results (Figure 6). To gain insight into the GO categories, among the 34 candidate genes, seven genes were annotated in a protein metabolic process which was indirectly related to yield. In addition, three candidate genes (Glyma.06G207800, Glyma.10G221500, and Glyma.06G204300) verified as E1, E2, and QNE1 were involved in the control of photoperiodic flowering directly which was related to plant height and number of main stems.

4. Discussion

4.1. The Factors Affecting QTL Mapping Analysis

The preliminary locations of major QTLs can be inferred when the average distance of genetic map markers is 10–20 cM [51]. The marker density, however, has little influence on QTL detection [52]. In fact, a high-density linkage map can improve the accuracy of major QTL mapping and play a crucial role in identifying minor QTLs. Along with the development of molecular sequencing technology, a larger number of molecular markers are available than before and can be utilized to identity genetic difference in an F2 population. For example, 3129 Bin markers from 48,790 SNPs were used in the QTL detection of 11 various traits in a foxtail millet F2 population [53]. However, as the marker density increased, the genetic information decreased as a result of linkage disequilibrium between the molecular markers [54]. At present, the scale of molecular markers under various studies is similar to the number of markers used in this one. For example, 3108 SNPs were used to map the homologous transformation sterility gene in wheat using a F2 population [55]; a functional gene controlling the length of the vegetative period in soybean was successfully mapped using two F2 populations with about 3000 polymorphic SNPs, revealing the size of polymorphic SNPs in F2 populations [50]. In this study, a genetic map was constructed by mapping 3188 high-quality SNPs selected from 137,715 SNPs covering 2708.63 cM on 20 chromosomes. In addition, the average distance between two adjacent markers was 0.85 cM, which corresponds to a physical distance of about 0.31 Mb. The QTL result has shown that the detection efficiency of QTL would be greatly improved based on a high-density genetic map, for example, a large contribution QTL named qPh07 located between a 38.23 to 39.37 cM span, corresponding from 37,616,796 to 38,050,866 bp covered a confidence interval with about 430 Kb. In the CIM method, 18 major effect QTLs identified from Nms and Sw traits, with a PVE greater than 10%, were detected and the mapping intervals of 11 QTLs were less than 1 cM (Table 3). In addition, a number of QTLs with medium or minor effects were detected, of which 12 QTLs were identified with a PVE of less than 3%. These results indicated that this map contenting the QTL mapping requirements has broad applicability, not only because of the number of markers, marker distribution, and map saturation, but also because of the detection efficiency for QTLs.
QTL mapping results depend on many factors, e.g., the type of population, characteristics of traits, sample size, marker density, QTL mapping procedures, and so on. Understanding these factors can help investigators choose an optimal experiment design and procedure for data analysis. For example, QTL for traits with low heritability were often difficult to detect. The Bn, Pnp, and Snp trait showed a low heritability in other studies [2,56]. QTL mapping for these traits may be hard. For example, no QTLs for the yield-component traits were identified in the CIM method of this study and only three QTLs were identified from Snp and Swp traits in the ICIM method. In order to improve the detection efficiency, two QTL mapping methods, CIM and ICIM, were used for comprehensive QTL mapping. In the current study, 42 QTLs were detected with CIM and 21 were detected with ICIM. In the CIM, a large number of noisy markers in a one-step analysis might reduce QTL detection and efficiency, while too few markers may fail to control the genetic background [57]. In order to detect QTL more effectively, a total of 35 QTLs were completed through a two-step process that first involved the consolidation of QTLs from the same method and a combination of the QTLs from different methods.

4.2. The Novel QTL Loci and the Exploration of Candidate Genes from Hub QTLs

Notably, 27 major QTLs with a PVE greater than 3% were identified in this study, ten of which might be novel loci. For Ph, all four major QTLs have been reported in other populations (Table 4). For Nms, qNms06.2 was located on Chr.06 with a PVE greater than 10% in the same location with Node number 2-2 derived from the RIL population derived from Kefeng No.1 and Nannong 1138-2, which was located near E1 loci [19,58,59]. qNms06.3 and qNms06.4 on Chr.06 were detected in the same confident region with Node number 4-2 collected in SoyBase. qNms10 on Chr.10 has not been reported in other populations but it is located near the E2 loci [59]. qNms06.1 on Chr.06 and qNms19.1 on Chr.19 were new loci. For Bn, qBn07.1, qBn07.2, qBn17, and qBn20 were new loci that contributed over 5% of the phenotypic variation. For Snp, qSnp12 was a new locus. For Pro, qPro14 shared the same confident region with three QTLs (Seed protein 1-6, 4-10, 21-8) collected in SoyBase. For Oil, qOil05 was located near the reported QTL named Seed oil 4-1 [60]. qOil14.1, qOil14.2 and qOil17 were in the same confident region with several reported QTLs including mqSeed Oil-005 and mqSeed Oil-011 [61]. qOil08 was a new locus which contributed more than 5% of the phenotypic variation. For Sw, qSw06.1, qSw06.2, qSw10, and qSw20 shared the same confident region notably with more than two reported QTLs. In the present study, the detected 35 QTLs contributed differently to phenotypic variation, from which the candidate genes involved many of the verified genes and numerous new ones. In the 12 large contribution major QTLs, 3 harbored the known loci of E1, E2, and QNE1 while the other 9 loci might be novel ones. After screening, these novel QTLs were more focused on the plant-type and yield-component modules due to these traits possibly being less investigated in the past. For example, all four QTLs identified for Bn and the two QTLs detected from the yield-component module were novel ones. The candidate genes were found in the qBn07.1, qBn17, qBn20, and qSnp12. These candidate genes were annotated as PIF1 helicase, zinc finger related to flowering [62], aminotransferase class genes, the cupin family protein, and indole-3-acetyl-tyrosine synthetase as a member of the GH3 family of early auxin-responsive genes [63], which are related to plant growth. The candidate genes screened in this study could be used in molecular biology research in the future and help to elucidate the genetic mechanism of soybean growth metabolism.
The hub QTLs influenced multiple traits which were confirmed after co-localization analysis. The co-localization analysis was widely utilized to co-localize detected QTLs with the others or previous ones to make sure what new or exact results they have obtained. However, the standard quantitative approaches for co-localization of QTLs are issues to be further studied. In early studies, the co-localization threshold of 5–10 cM was used for rare density SSR markers. While the high-density SNP and SNP-derived markers were used, the co-localization threshold was narrowed down and the physical size threshold was used. Scientists still have to find a balance in choosing their co-localization criterion; no co-localized QTLs can be identified with too small of a threshold, while the different QTLs may be misclassified as the same QTL with too large of a threshold.
Although the accuracy of the mapping results in soybean has improved with the development of DNA sequencing technology and mapping methods, the co-localization threshold is still a difficult issue and is variable among researchers. For example, Hyten et al. (2004) reported 17 QTLs with a physical position ranging from 1.7 Mb to 48.6 Mb, of which there were 15 QTLs over 3 Mb and 5 QTLs over 10 Mb [64]. Jiao et al. (2015) reported 25 QTLs with a physical range which changed from 0.22 to 36.4 Mb, of which 11 QTLs were over 3 Mb and 1 was over 10 Mb [65]. Zhang et al. (2015) and Oki et al. (2019) treated the novel QTL as the reported QTL when the physical distance between the novel and reported QTLs was within about 2 Mb [66,67]. From these results, a novel QTL was considered to be the same QTL when the physical position of the novel QTL was within an appropriate physical distance. In this study, a relatively stringent criterion was used for co-localization analysis, and five hubs of QTLs were discovered among plant-type, yield-component, and seed-related modules (Figure 5). Two hubs of QTLs between plant-type and seed-related modules were located near E1 and E2 loci harboring five and three QTLs, respectively [48,49]. This result is consistent with the recent finding that E1 regulates the expression of traits such as the number of nodes in the main stem and plant height [68,69]. These results suggest that flowering genes affect not only the photoperiod but also the whole developmental stage. Another three hub QTLs were predicted based on the corresponding candidate genes. qBn20 and qSw20 were predicted based on six candidate genes, which were annotated into the cupin family, frigida-like protein [70], and histidine biosynthesis. These candidate genes were related to flower development, storage proteins, and plant growth [71]. qSw06.2 and qNms06.3 were identified for four candidate genes, which were annotated to the cytochrome P450 gene and ARM family gene. These genes were related to glycyrrhetinate biosynthesis and plant U-box type E3 ubiquitin ligase [72]. qSnp12 and qNms12 were predicted based on four candidate genes, which were members of the GH3 family of early auxin-responsive genes, PRP17 as a splicing factor which functions in embryo development by regulating embryonic patterning, and NAD(P)-linked oxidoreductase superfamily protein [63,73,74]. However, these hub QTLs related to three type modules required further fine mapping through the construction of several secondary mapping populations. These hubs of QTLs may have pleiotropic effects and they need to be focused on and more genetic excavation needs to take place.

Author Contributions

J.Y. provided the mapping population and sequence data. B.Q., S.L., H.X., Y.W., Z.Z. and X.Y. performed the field experiments. L.P. analyzed and interpreted the results. L.P. and M.F. drafted the manuscript. All authors have read and agreed to the published version of the manuscript.

Funding

This work was supported by the National Natural Science Foundation of China (Grant No. 31571695), the Collaborative Innovation Center for Modern Crop Production co-sponsored by Province and Ministry (CIC-MCP), Postdoctoral research funding project of Jiangsu Province (1701008C), the National Natural Science research program of Huan’an, China (Grant No. HAB202168), and the Dean’s Foundation of the Huai’an Academy of Agricultural Sciences (Grant No. HNY201501, HNY201607).

Institutional Review Board Statement

Not applicable.

Informed Consent Statement

Not applicable.

Data Availability Statement

The data presented in this study are available in the main text.

Conflicts of Interest

The authors declare no conflict of interest.

References

  1. Fu, M.; Wang, Y.; Ren, H.; Du, W.; Wang, D.; Bao, R.; Yang, X.; Tian, Z.; Fu, L.; Cheng, Y.; et al. Genetic dynamics of earlier maturity group emergence in south-to-north extension of Northeast China soybeans. Theor. Appl. Genet. 2020, 133, 1839–1857. [Google Scholar] [CrossRef] [PubMed]
  2. Zhang, H.; Hao, D.; Sitoe, H.M.; Yin, Z.; Hu, Z.; Zhang, G.; Yu, D.; Singh, R. Genetic dissection of the relationship between plant architecture and yield component traits in soybean (Glycine max) by association analysis across multiple environments. Plant Breed. 2015, 134, 564–572. [Google Scholar] [CrossRef]
  3. Chang, F.; Guo, C.; Sun, F.; Zhang, J.; Wang, Z.; Kong, J.; He, Q.; Sharmin, R.A.; Zhao, T. Genome-Wide Association Studies for Dynamic Plant Height and Number of Nodes on the Main Stem in Summer Sowing Soybeans. Front. Plant Sci. 2018, 9, 1184. [Google Scholar] [CrossRef] [PubMed] [Green Version]
  4. Jin, J.; Liu, X.; Wang, G.; Mi, L.; Shen, Z.; Chen, X.; Herbert, S.J. Agronomic and physiological contributions to the yield improvement of soybean cultivars released from 1950 to 2006 in Northeast China. Field Crops Res. 2010, 115, 116–123. [Google Scholar] [CrossRef]
  5. Li, R.; Li, J.; Li, S.; Qin, G.; Novak, O.; Pencik, A.; Ljung, K.; Aoyama, T.; Liu, J.; Murphy, A.; et al. ADP1 Affects Plant Architecture by Regulating Local Auxin Biosynthesis. PLoS Genet. 2014, 10, e1003954. [Google Scholar] [CrossRef] [Green Version]
  6. Li, Y.-h.; Reif, J.C.; Hong, H.-l.; Li, H.-h.; Liu, Z.-x.; Ma, Y.-s.; Li, J.; Tian, Y.; Li, Y.-f.; Li, W.-b.; et al. Genome-wide association mapping of QTL underlying seed oil and protein contents of a diverse panel of soybean accessions. Plant Sci. 2018, 266, 95–101. [Google Scholar] [CrossRef]
  7. Sun, Y.-n.; Pan, J.-b.; Shi, X.-l.; Du, X.-y.; Wu, Q.; Qi, Z.-m.; Jiang, H.-w.; Xin, D.-w.; Liu, C.-y.; Hu, G.-h.; et al. Multi-environment mapping and meta-analysis of 100-seed weight in soybean. Mol. Biol. Rep. 2012, 39, 9435–9443. [Google Scholar] [CrossRef]
  8. Hartwig, E.E.; Hinson, K. Association between chemical composition of seed and seed yield of soybeans 1. Crop Sci. 1972, 12, 829–830. [Google Scholar] [CrossRef]
  9. Iqbal, Z.; Arshad, M.; Ashraf, M.; Naeem, R.; Malik, M.F.; Waheed, A. Genetic divergence and correlation studies of soybean (Glycine max (L.) Merrill.) genotypes. Pak. J. Bot. 2010, 42, 971–976. [Google Scholar]
  10. Mansur, L.M.; Orf, J.H.; Chase, K.; Jarvik, T.; Cregan, P.B.; Lark, K.G. Genetic mapping of agronomic traits using recombinant inbred lines of soybean. Crop Sci. 1996, 36, 1327–1336. [Google Scholar] [CrossRef]
  11. Panthee, D.; Pantalone, V.; West, D.; Saxton, A.; Sams, C. Quantitative trait loci for seed protein and oil concentration, and seed size in soybean. Crop Sci. 2005, 45, 2015–2022. [Google Scholar] [CrossRef]
  12. Ehrlich, P.R.; Harte, J. To feed the world in 2050 will require a global revolution. Proc. Natl. Acad. Sci. USA 2015, 112, 14743–14744. [Google Scholar] [CrossRef] [Green Version]
  13. Pandey, K.; Dangi, R.; Prajapati, U.; Kumar, S.; Maurya, N.K.; Singh, A.V.; Pandey, A.K.; Singh, J.; Rajan, R. Advance breeding and biotechnological approaches for crop improvement: A review. Int. J. Chem. Stud. 2019, 7, 837–841. [Google Scholar]
  14. Peng, J.; Richards, D.E.; Hartley, N.M.; Murphy, G.P.; Devos, K.M.; Flintham, J.E.; Beales, J.; Fish, L.J.; Worland, A.J.; Pelica, F. ‘Green revolution’ genes encode mutant gibberellin response modulators. Nature 1999, 400, 256–261. [Google Scholar] [CrossRef]
  15. Sasaki, A.; Ashikari, M.; Ueguchi-Tanaka, M.; Itoh, H.; Nishimura, A.; Swapan, D.; Ishiyama, K.; Saito, T.; Kobayashi, M.; Khush, G.S. A mutant gibberellin-synthesis gene in rice. Nature 2002, 416, 701–702. [Google Scholar] [CrossRef]
  16. Wang, J.; Zhou, L.; Shi, H.; Chern, M.; Yu, H.; Yi, H.; He, M.; Yin, J.; Zhu, X.; Li, Y. A single transcription factor promotes both yield and immunity in rice. Science 2018, 361, 1026–1028. [Google Scholar] [CrossRef] [PubMed] [Green Version]
  17. Wang, B.; Wang, H. IPA1: A new “green revolution” gene? Mol. Plant 2017, 10, 779–781. [Google Scholar] [CrossRef] [PubMed] [Green Version]
  18. Zhang, L.; Yu, H.; Ma, B.; Liu, G.; Wang, J.; Wang, J.; Gao, R.; Li, J.; Liu, J.; Xu, J. A natural tandem array alleviates epigenetic repression of IPA1 and leads to superior yielding rice. Nat. Commun. 2017, 8, 14789. [Google Scholar] [CrossRef] [PubMed] [Green Version]
  19. Pan, L.; He, J.; Zhao, T.; Xing, G.; Wang, Y.; Yu, D.; Chen, S.; Gai, J. Efficient QTL detection of flowering date in a soybean RIL population using the novel restricted two-stage multi-locus GWAS procedure. TAG Theor. Appl. Genet. Theor. Angew. Genet. 2018, 131, 2581–2599. [Google Scholar] [CrossRef]
  20. Li, S.; Cao, Y.; He, J.; Zhao, T.; Gai, J. Detecting the QTL-allele system conferring flowering date in a nested association mapping population of soybean using a novel procedure. TAG Theor. Appl. Genet. Theor. Angew. Genet. 2017, 130, 2297–2314. [Google Scholar] [CrossRef]
  21. Fang, C.; Ma, Y.; Wu, S.; Liu, Z.; Wang, Z.; Yang, R.; Hu, G.; Zhou, Z.; Yu, H.; Zhang, M.; et al. Genome-wide association studies dissect the genetic networks underlying agronomical traits in soybean. Genome Biol. 2017, 18, 161. [Google Scholar] [CrossRef] [PubMed] [Green Version]
  22. Duan, Z.; Zhang, M.; Zhang, Z.; Liang, S.; Fan, L.; Yang, X.; Yuan, Y.; Pan, Y.; Zhou, G.; Liu, S.; et al. Natural allelic variation of GmST05 controlling seed size and quality in soybean. Plant Biotechnol. J. 2022, 20, 1807–1818. [Google Scholar] [CrossRef] [PubMed]
  23. Goettel, W.; Zhang, H.; Li, Y.; Qiao, Z.; Jiang, H.; Hou, D.; Song, Q.; Pantalone, V.R.; Song, B.-H.; Yu, D.; et al. POWR1 is a domestication gene pleiotropically regulating seed quality and yield in soybean. Nat. Commun. 2022, 13, 3051. [Google Scholar] [CrossRef]
  24. Barabási, A.-L.; Gulbahce, N.; Loscalzo, J. Network medicine: A network-based approach to human disease. Nat. Rev. Genet. 2011, 12, 56–68. [Google Scholar] [CrossRef] [Green Version]
  25. Chan, S.Y.; Loscalzo, J. The emerging paradigm of network medicine in the study of human disease. Circ. Res. 2012, 111, 359–374. [Google Scholar] [CrossRef] [PubMed] [Green Version]
  26. Lavarenne, J.; Guyomarc’h, S.; Sallaud, C.; Gantet, P.; Lucas, M. The spring of systems biology-driven breeding. Trends Plant Sci. 2018, 23, 706–720. [Google Scholar] [CrossRef] [PubMed]
  27. Hafeez, A.; Razzaq, A.; Ahmed, A.; Liu, A.; Qun, G.; Junwen, L.; Shi, Y.; Deng, X.; Zafar, M.M.; Ali, A. Identification of hub genes through co-expression network of major QTLs of fiber length and strength traits in multiple RIL populations of cotton. Genomics 2021, 113, 1325–1337. [Google Scholar] [CrossRef]
  28. Feng, L.; Ma, A.; Song, B.; Yu, S.; Qi, X.J.G. Mapping causal genes and genetic interactions for agronomic traits using a large F2 population in rice. G3 2021, 11, jkab318. [Google Scholar] [CrossRef]
  29. Lander, E.S.; Botstein, D. Mapping Mendelian Factors Underlying Quantitative Traits Using Rflp Linkage Maps. Genetics 1989, 121, 185–199. [Google Scholar] [CrossRef] [PubMed]
  30. Zeng, Z.B. Precision mapping of quantitative trait loci. Genetics 1994, 136, 1457–1468. [Google Scholar] [CrossRef] [PubMed]
  31. Li, H.; Ribaut, J.M.; Li, Z.; Wang, J. Inclusive composite interval mapping (ICIM) for digenic epistasis of quantitative traits in biparental populations. TAG Theor. Appl. Genet. Theor. Angew. Genet. 2008, 116, 243–260. [Google Scholar] [CrossRef] [PubMed]
  32. Yang, J.; Hu, C.C.; Hu, H.; Yu, R.D.; Xia, Z.; Ye, X.Z.; Zhu, J. QTLNetwork: Mapping and visualizing genetic architecture of complex traits in experimental populations. Bioinformatics 2008, 24, 721–723. [Google Scholar] [CrossRef]
  33. Li, H.; Hearne, S.; Banziger, M.; Li, Z.; Wang, J. Statistical properties of QTL linkage mapping in biparental genetic populations. Heredity 2010, 105, 257–267. [Google Scholar] [CrossRef] [PubMed] [Green Version]
  34. Zhu, C.S.; Gore, M.; Buckler, E.S.; Yu, J.M. Status and Prospects of Association Mapping in Plants. Plant Genome 2008, 1, 5–20. [Google Scholar] [CrossRef]
  35. Sonah, H.; O’Donoughue, L.; Cober, E.; Rajcan, I.; Belzile, F. Identification of loci governing eight agronomic traits using a GBS-GWAS approach and validation by QTL mapping in soya bean. Plant Biotechnol. J. 2015, 13, 211–221. [Google Scholar] [CrossRef]
  36. Tardivel, A.; Sonah, H.; Belzile, F.; O’Donoughue, L.S. Rapid identification of alleles at the soybean maturity gene E3 using genotyping by sequencing and a haplotype-based approach. Plant Genome 2014, 7, plantgenome2013-10. [Google Scholar] [CrossRef]
  37. St-Amour, V.T.B.; Mimee, B.; Torkamaneh, D.; Jean, M.; Belzile, F.; O’Donoughue, L.S. Characterizing resistance to soybean cyst nematode in PI 494182, an early maturing soybean accession. Crop Sci. 2020, 60, 2053–2069. [Google Scholar] [CrossRef]
  38. Murray, M.G.; Thompson, W.F. Rapid isolation of high molecular weight plant DNA. Nucleic Acids Res. 1980, 8, 4321–4325. [Google Scholar] [CrossRef] [Green Version]
  39. Su, C.; Wang, W.; Gong, S.; Zuo, J.; Li, S.; Xu, S. High Density Linkage Map Construction and Mapping of Yield Trait QTLs in Maize (Zea mays) Using the Genotyping-by-Sequencing (GBS) Technology. Front. Plant Sci. 2017, 8, 706. [Google Scholar] [CrossRef] [Green Version]
  40. Li, H.; Durbin, R. Fast and accurate short read alignment with Burrows-Wheeler transform. Bioinformatics 2009, 25, 1754–1760. [Google Scholar] [CrossRef] [PubMed] [Green Version]
  41. Li, H.; Handsaker, B.; Wysoker, A.; Fennell, T.; Ruan, J.; Homer, N.; Marth, G.; Abecasis, G.; Durbin, R.; Genome Project Data Processing, S. The Sequence Alignment/Map format and SAMtools. Bioinformatics 2009, 25, 2078–2079. [Google Scholar] [CrossRef] [PubMed] [Green Version]
  42. Cingolani, P.; Platts, A.; Wang, L.L.; Coon, M.; Nguyen, T.; Wang, L.; Land, S.J.; Lu, X.; Ruden, D.M. A program for annotating and predicting the effects of single nucleotide polymorphisms, SnpEff: SNPs in the genome of Drosophila melanogaster strain w1118; iso-2; iso-3. Fly 2012, 6, 80–92. [Google Scholar] [CrossRef] [PubMed]
  43. Ooijen, J.W.V. JoinMap® 4.0: Software for the Calculation of Genetic Linkage Maps in Experimental Population; Kyazma BV: Wageningen, The Netherlands, 2006. [Google Scholar]
  44. Churchill, G.A.; Doerge, R.W. Empirical threshold values for quantitative trait mapping. Genetics 1994, 138, 963–971. [Google Scholar] [CrossRef] [PubMed]
  45. Li, H.; Ye, G.; Wang, J. A Modified Algorithm for the Improvement of Composite Interval Mapping. Genetics 2006, 175, 361–374. [Google Scholar] [CrossRef] [PubMed] [Green Version]
  46. Meng, L.; Li, H.; Zhang, L.; Wang, J. QTL IciMapping: Integrated software for genetic linkage map construction and quantitative trait locus mapping in biparental populations. Crop J. 2015, 3, 269–283. [Google Scholar] [CrossRef] [Green Version]
  47. Du, Z.; Zhou, X.; Ling, Y.; Zhang, Z.; Su, Z. agriGO: A GO analysis toolkit for the agricultural community. Nucleic Acids Res. 2010, 38, W64–W70. [Google Scholar] [CrossRef] [Green Version]
  48. Watanabe, S.; Xia, Z.; Hideshima, R.; Tsubokura, Y.; Sato, S.; Yamanaka, N.; Takahashi, R.; Anai, T.; Tabata, S.; Kitamura, K.; et al. A map-based cloning strategy employing a residual heterozygous line reveals that the GIGANTEA gene is involved in soybean maturity and flowering. Genetics 2011, 188, 395–407. [Google Scholar] [CrossRef] [Green Version]
  49. Xia, Z.; Watanabe, S.; Yamada, T.; Tsubokura, Y.; Nakashima, H.; Zhai, H.; Anai, T.; Sato, S.; Yamazaki, T.; Lu, S.; et al. Positional cloning and characterization reveal the molecular basis for soybean maturity locus E1 that regulates photoperiodic flowering. Proc. Natl. Acad. Sci. USA 2012, 109, E2155–E2164. [Google Scholar] [CrossRef] [Green Version]
  50. Xia, Z.; Zhai, H.; Zhang, Y.; Wang, Y.; Wang, L.; Xu, K.; Wu, H.; Zhu, J.; Jiao, S.; Wan, Z. QNE1 is a key flowering regulator determining the length of the vegetative period in soybean cultivars. Sci. China Life Sci. 2022, 65, 2472–2490. [Google Scholar] [CrossRef] [PubMed]
  51. Charmet, G. Power and accuracy of QTL detection: Simulation stusdies of one-QTL models. Agronomie 2000, 20, 309–323. [Google Scholar] [CrossRef] [Green Version]
  52. Chuanzao, M.; Shihua, C. Analysis of accuracy and influence factor in QTL mapping about agronomic traits in rice (Oryza sativa L.). J. Agric. Biotechnol. 1999, 7, 386–394. [Google Scholar]
  53. Wang, Z.; Wang, J.; Peng, J.; Du, X.; Jiang, M.; Li, Y.; Han, F.; Du, G.; Yang, H.; Lian, S.; et al. QTL mapping for 11 agronomic traits based on a genome-wide Bin-map in a large F2 population of foxtail millet (Setaria italica (L.) P. Beauv). Mol. Breed. 2019, 39, 18. [Google Scholar] [CrossRef]
  54. Mackay, I.; Powell, W. Methods for linkage disequilibrium mapping in crops. Trends Plant Sci. 2007, 12, 57–63. [Google Scholar] [CrossRef] [PubMed]
  55. Yang, Q.; Yang, Z.; Tang, H.; Yu, Y.; Chen, Z.; Wei, S.; Sun, Q.; Peng, Z. High-density genetic map construction and mapping of the homologous transformation sterility gene (hts) in wheat using GBS markers. BMC Plant Biol. 2018, 18, 301. [Google Scholar] [CrossRef] [PubMed]
  56. Liu, N.; Li, M.; Hu, X.; Ma, Q.; Mu, Y.; Tan, Z.; Xia, Q.; Zhang, G.; Nian, H. Construction of high-density genetic map and QTL mapping of yield-related and two quality traits in soybean RILs population by RAD-sequencing. BMC Genom. 2017, 18, 466. [Google Scholar] [CrossRef] [Green Version]
  57. Li, H.-H.; Zhang, L.-Y.; Wang, J.-K. Analysis and Answers to Frequently Asked Questions in Quantitative Trait Locus Mapping. Acta Agron. Sin. 2010, 36, 918–931. [Google Scholar] [CrossRef] [Green Version]
  58. Zhang, W.K.; Wang, Y.J.; Luo, G.Z.; Zhang, J.S.; He, C.Y.; Wu, X.L.; Gai, J.Y.; Chen, S.Y. QTL mapping of ten agronomic traits on the soybean (Glycine max L. Merr.) genetic map and their association with EST markers. Theor. Appl. Genet. 2004, 108, 1131–1139. [Google Scholar] [CrossRef]
  59. Buzzell, R. Inheritance of a soybean flowering response to fluorescent-daylength conditions. Can. J. Genet. Cytol. 1971, 13, 703–707. [Google Scholar] [CrossRef]
  60. Brummer, E.; Graef, G.; Orf, J.; Wilcox, J.; Shoemaker, R. Mapping QTL for seed protein and oil content in eight soybean populations. Crop Sci. 1997, 37, 370–378. [Google Scholar] [CrossRef]
  61. Qi, Z.-m.; Wu, Q.; Han, X.; Sun, Y.-n.; Du, X.-y.; Liu, C.-y.; Jiang, H.-w.; Hu, G.-h.; Chen, Q.-s. Soybean oil content QTL mapping and integrating with meta-analysis method for mining genes. Euphytica 2011, 179, 499–514. [Google Scholar] [CrossRef]
  62. Iñigo, S.; Giraldez, A.N.; Chory, J.; Cerdán, P.D. Proteasome-mediated turnover of Arabidopsis MED25 is coupled to the activation of FLOWERING LOCUS T transcription. Plant Physiol. 2012, 160, 1662–1673. [Google Scholar] [CrossRef] [PubMed] [Green Version]
  63. Zhang, Z.; Li, Q.; Li, Z.; Staswick, P.E.; Wang, M.; Zhu, Y.; He, Z. Dual regulation role of GH3. 5 in salicylic acid and auxin signaling during Arabidopsis-Pseudomonas syringae interaction. Plant Physiol. 2007, 145, 450–464. [Google Scholar] [CrossRef] [Green Version]
  64. Hyten, D.L.; Pantalone, V.R.; Sams, C.E.; Saxton, A.M.; Landau-Ellis, D.; Stefaniak, T.R.; Schmidt, M.E. Seed quality QTL in a prominent soybean population. Theor. Appl. Genet. 2004, 109, 552–561. [Google Scholar] [CrossRef]
  65. Jiao, Y.; Vuong, T.D.; Liu, Y.; Meinhardt, C.; Liu, Y.; Joshi, T.; Cregan, P.B.; Xu, D.; Shannon, J.G.; Nguyen, H.T.J.T.; et al. Identification and evaluation of quantitative trait loci underlying resistance to multiple HG types of soybean cyst nematode in soybean PI 437655. Theor. Appl. Genet. 2015, 128, 15–23. [Google Scholar] [CrossRef] [Green Version]
  66. Zhang, Y.; He, J.; Wang, Y.; Xing, G.; Zhao, J.; Li, Y.; Yang, S.; Palmer, R.G.; Zhao, T.; Gai, J. Establishment of a 100-seed weight quantitative trait locus-allele matrix of the germplasm population for optimal recombination design in soybean breeding programmes. J. Exp. Bot. 2015, 66, 6311–6325. [Google Scholar] [CrossRef] [Green Version]
  67. Oki, N.; Takagi, K.; Ishimoto, M.; Takahashi, M.; Takahashi, M. Evaluation of the resistance effect of QTLs derived from wild soybean (Glycine soja) to common cutworm (Spodoptera litura Fabricius). Breed. Sci. 2019, 69, 529–535. [Google Scholar] [CrossRef] [PubMed] [Green Version]
  68. Zhai, H.; Wan, Z.; Jiao, S.; Zhou, J.; Xu, K.; Nan, H.; Liu, Y.; Xiong, S.; Fan, R.; Zhu, J.; et al. GmMDE genes bridge the maturity gene E1 and florigens in photoperiodic regulation of flowering in soybean. Plant Physiol. 2022, 189, 1021–1036. [Google Scholar] [CrossRef]
  69. Fahim, A.M.; Pan, L.; Li, C.; He, J.; Xing, G.; Wang, W.; Zhang, F.; Li, N.; Gai, J. QTL-allele system of main stem node number in recombinant inbred lines of soybean (Glycine max) using association versus linkage mapping. Plant Breed. 2021, 140, 870–883. [Google Scholar] [CrossRef]
  70. Thieme, C.J.; Rojas-Triana, M.; Stecyk, E.; Schudoma, C.; Zhang, W.; Yang, L.; Miñambres, M.; Walther, D.; Schulze, W.X.; Paz-Ares, J. Endogenous Arabidopsis messenger RNAs transported to distant tissues. Nat. Plants 2015, 1, 15025. [Google Scholar] [CrossRef]
  71. Huang, S.; Yu, J.; Li, Y.; Wang, J.; Wang, X.; Qi, H.; Xu, M.; Qin, H.; Yin, Z.; Mei, H. Identification of soybean genes related to soybean seed protein content based on quantitative trait loci collinearity analysis. J. Agric. Food Chem. 2018, 67, 258–274. [Google Scholar] [CrossRef] [PubMed]
  72. Dekkers, B.J.; Pearce, S.; van Bolderen-Veldkamp, R.; Marshall, A.; Widera, P.; Gilbert, J.; Drost, H.-G.; Bassel, G.W.; Müller, K.; King, J.R. Transcriptional dynamics of two seed compartments with opposing roles in Arabidopsis seed germination. Plant Physiol. 2013, 163, 205–215. [Google Scholar] [CrossRef] [PubMed] [Green Version]
  73. Shao, D.J.; Wei, Y.M.; Yu, Z.Q.; Dai, X.; Gao, X.-Q. Arabidopsis AtPRP17 functions in embryo development by regulating embryonic patterning. Planta 2021, 254, 58. [Google Scholar] [CrossRef] [PubMed]
  74. Bassel, G.W.; Lan, H.; Glaab, E.; Gibbs, D.J.; Gerjets, T.; Krasnogor, N.; Bonner, A.J.; Holdsworth, M.J.; Provart, N.J. Genome-wide network model capturing seed germination reveals coordinated regulation of plant cellular phase transitions. Proc. Natl. Acad. Sci. USA 2011, 108, 9709–9714. [Google Scholar] [CrossRef] [PubMed]
Figure 1. The phenotypic distribution of the nine traits conferring from three modules for the F2 population and parents. The phenotypic distribution of the nine traits conferring from three modules for the F2 population and parents. The nine traits were divided into three modules with three colors, of which plant height, the number of main stem nodes, and the branch number were represented in blue in the plant-type trait module; pod number per plant, seed number per plant, and seed weight per plant were green in the yield-component trait module; and protein content, oil content, and seed weight were displayed in red in the seed-related trait module. The pink dashed lines indicate the different trait values from KeXin No.03 (KX03), and yellow dashed lines show the different trait values from JiDou 17 (JD17).
Agronomy 12 03135 g001
Figure 2. The Pearson’s correlation between phenotypic data for nine traits in the F2 population. All nine traits were separated into three modules with three colors, of which plant height (Ph), number of main stem nodes (Nms), and branch number (Bn) were blue in the plant-type trait module; pod number per plant (Pnp), seed number per plant (Snp), and seed weight per plant (Swp) were green in the yield-component trait module; and protein content (Pro), oil content (Oil), and seed weight (Sw) were displayed in red in the seed-related trait module. The lower left part shows the Pearson’s correlation values between phenotypic traits from lowest to highest with a gradual change from blue to red. The upper right part shows the significance level among these traits. ** indicates the level of significance at p < 0.01, * indicates the level of significance at p < 0.05, n.s. means no significance.
Agronomy 12 03135 g002
Figure 3. The SNP distribution in different genomic regions (A) and the genetic linkage map (B) in the F2 population. (A) The ratio of SNPs identified between two parents located in the different genomic regions. INTERGENIC means the variation was in an intergenic region; UPSTREAM indicates that the SNPs were located upstream of a gene within 5 Kb in length by default; DOWNSTREAM means the variation happened downstream of a gene within 5 Kb length in default; INTRON means the SNP was in an intronic region or hit no exon in the transcript; EXON indicates that the variation was in an exonic region; UTR_3_PRIME and UTR_5_PRIME means the variation hit the 3’UTR region and the 5’UTR region, respectively. The different genomic regions on the X-axis have been arranged in descending order of the ratio values; and (B) linkage group numbers corresponding to the chromosome number of the Williams 82 reference genome is shown on the X-axis and the genetic distance is shown on the y-axis in cM units.
Agronomy 12 03135 g003
Figure 4. The overview of final QTLs located on 14 chromosomes conferring from eight traits of three modules using CIM and ICIM procedure.The eight traits were divided into three modules in different colors along with the plant-type trait module in blue, yield-component trait module in green, and seed-related trait module in red. Chr., chromosome; Ph, plant height; Nms, number of main stem nodes; Bn, branch number; Snp, seed number per plant; Swp, seed weight per plant; Pro, protein content; Oil, oil content; and Sw, 100-seed weight.
Agronomy 12 03135 g004
Figure 5. The network relationship conferring from eight traits of three modules for the F2 population. The nodes represent final QTLs detected in different traits with a round shape and three traits with an octagon shape. The QTLs are divided into two types of QTLs, where the major QTL with a large contribution and its PVE more than or equal to 3% holds a larger size, and the major QTL with a small contribution and its PVE less than 3% has a smaller size. The nodes match the trait modules and QTL names in Table 1 and Table 3, respectively. The edges between these nodes were shown in different line styles, where a solid line means the QTL was associated with the particular trait module, a dashed line indicates that the QTL was connected with another QTL located in a confident region (500 Kb) in a same trait module, and the fishbone line suggests that these QTLs, designated hub QTLs, were located in a confident region (nearby 500 Kb) between different modules. These hub QTLs covering E1 and E2 are indicated by the actual circles, while other hub-QTLs are show with dashed circles.
Agronomy 12 03135 g005
Figure 6. Gene ontology classifications of the candidate genes for nine traits in the KJ population.The results were summarized from the database in https://soybase.org (accessed on 15 September 2022) and https://bioinfo.cau.edu.cn/agriGO (accessed on 15 September 2022).
Agronomy 12 03135 g006
Table 1. The description of phenotypic data in three trait modules in the soybean F2 population.
ModuleTraitParentsF2 Population
KX03JD17NumberMeanMin.Max.CV
Plant-typePh(cm)78.00 99.50 17896.62 48.00 122.00 12.66
Nms20.00 18.00 17821.18 13.00 28.00 12.10
Bn4.20 2.50 1802.71 0.00 8.00 54.09
Yield-componentPnp34.20 51.70 17944.33 12.00 113.00 39.53
Snp73.80 91.20 178104.12 30.00 271.00 39.93
Swp (g)15.50 15.96 17818.34 3.87 51.36 45.52
Seed-relatedPro (%)40.76 36.36 18139.91 35.86 48.36 5.02
Oil (%)21.19 23.67 18120.87 15.47 23.18 5.86
Sw (g)21.00 17.50 18117.35 9.07 23.99 16.34
Trait: Ph (cm), plant height in “cm” unit; Nms, number of main stem nodes; Bn, branch number; Pnp, pod number per plant; Snp, seed number per plant; Swp (g), seed weight per plant in “g” unit; Pro (%), protein content; Oil (%), oil content; and Sw (g), 100-seed weight in “g” unit. Parents: KX03, KeXin No.03; JD17, JiDou 17. Mean, Min. and Max., mean average value, minimum value, and maximum of the trait of interest across the population, respectively; and CV indicates the coefficient of variation of the trait of interest across the population.
Table 2. The basic characteristics of the genetic map in the soybean F2 population.
Linkage GroupTotal Number of MarkersTotal Size (cM)Average Distance (cM)Gap > 5 cM (%)
LG0174194.532.63 9.46
LG02136146.61.08 2.94
LG0313560.680.45 1.48
LG0479332.884.21 16.46
LG0514370.340.49 2.10
LG0622566.610.30 1.33
LG079363.690.68 3.23
LG089745.580.47 0.00
LG09259181.050.70 2.70
LG10134134.181.00 5.22
LG1178263.813.38 8.97
LG1214780.320.55 0.68
LG13246125.040.51 2.85
LG14110315.202.87 8.18
LG1520894.990.46 2.88
LG16136109.930.81 2.21
LG17209105.460.50 3.35
LG1820990.010.43 1.44
LG1930080.960.27 0.67
LG20170146.770.86 3.53
Total31882708.630.853.98
“Gap > 5 cM” indicates that the percentage of gaps in which the interval size between the adjacent markers was large than 5 cM.
Table 3. The QTL detected in the CIM and ICIM model.
Raw QTLChr.Marker intervalGenetic Distance (cM)LODAdditive EffectDominant EffectPVE
(%)
q-c-Ph-06-16M5316720-M534473939.67–39.808.92 −6.34 5.98 1.95
q-c-Ph-06-26M17853562-M1794475540.94–41.088.27 6.01 8.72 2.08
q-c-Ph-06-36M18032241-M1803248341.75–41.7611.59 5.79 7.62 2.10
q-c-Ph-06-46M18905749-M1927602942.79–42.939.47 5.81 7.46 3.22
q-c-Ph-06-56M19121776-M1981167043.21–43.389.46 5.77 7.09 2.50
q-c-Ph-06-66M19667942-M2073592643.58–43.829.32 6.57 7.26 2.86
q-c-Ph-06-76M19369196-M2070967744.16–44.4010.35 5.98 7.24 4.28
q-c-Ph-06-86M21293030-M2165116345.00–45.138.55 5.85 7.44 2.93
q-c-Ph-077M37616796-M3805086638.23–39.374.44 1.50 −6.34 8.89
q-c-Nms-06-16M17699008-M1796767541.30–41.6411.68 1.60 0.34 16.13
q-c-Nms-06-26M19560132-M1972074742.46–42.6811.31 1.60 0.61 12.88
q-c-Nms-06-36M19369235-M2073300643.91–44.1210.70 1.63 0.59 11.64
q-c-Nms-06-46M20177466-M2080526044.55–44.638.26 1.57 0.37 12.83
q-c-Nms-06-56M33133144-M3457549545.77–45.909.30 1.49 0.51 12.81
q-c-Nms-06-66M39270735-M3937545046.53–46.618.23 1.49 0.60 12.54
q-c-Nms-10-110M45218626-M46706603104.75–114.016.37 −1.18 0.57 15.94
q-c-Nms-10-210M46706431-M48656006114.10–119.635.60 −1.07 0.73 14.88
q-c-Nms-1212M16112509-M1612462050.21–52.522.52 −0.38 1.48 1.88
q-c-Nms-1313M27661716 -M2799412458.09–59.061.44 0.94 0.79 2.48
q-c-Nms-1818M48705140-M4957919265.25–66.403.31 0.59 0.88 0.10
q-c-Nms-19-119M6070412-M2772000235.41–36.432.39 0.85 0.24 5.09
q-c-Nms-19-219M8911580-M2368902738.91–39.002.45 0.84 0.07 3.46
q-c-Nms-19-319M9387990-M2755860139.61–39.723.27 0.84 0.20 4.73
q-c-Nms-19-419M22949928-M2594277739.89–39.952.38 0.89 0.15 3.40
q-c-Nms-19-519M11105426-M2890131141.82–41.902.00 0.82 0.28 3.76
q-c-Nms-19-619M9388566-M3036785242.27–43.173.17 0.82 −0.15 6.19
q-c-Nms-19-719M35378183-M3601918449.66–50.412.73 0.78 0.46 1.97
q-c-Bn-077M35251457-M3706216830.93–36.015.05 −0.73 −0.40 5.90
q-c-Pro-066M19369235-M2060486443.85–44.041.43 −0.05 −1.00 2.16
q-c-Oil-088M22523579-M2259140413.38–14.342.91 −0.15 0.56 6.00
q-c-Oil-1313M29950268-M3014949368.90–70.002.67 0.30 −0.42 0.80
q-c-Oil-1414M1320374-M4715426315.27–77.192.65 −1.19 1.26 5.49
q-c-Sw-06-16M17559879-M1910562439.66–40.6615.97 2.13 0.63 19.42
q-c-Sw-06-26M17905562-M1796767541.30–41.5718.55 2.19 0.48 24.63
q-c-Sw-06-36M18905658-M1955999852.11–42.3318.70 2.17 0.74 21.39
q-c-Sw-06-46M19667942-M2073592643.58–43.8217.66 2.17 0.85 21.50
q-c-Sw-06-56M20805260-M2089735644.63–44.6814.27 2.15 0.81 21.14
q-c-Sw-06-66M30266140-M3439410445.71–45.7917.88 2.09 0.78 20.95
q-c-Sw-06-76M34575638-M3896907046.24–46.3019.38 2.17 0.75 21.98
q-c-Sw-10-110M44554656-M4521862699.56–104.758.62 −1.44 0.46 17.26
q-c-Sw-10-210M45218626-M46706603104.75–114.018.80 −1.53 0.27 17.54
q-c-Sw-10-310M46706431-M48656006114.10–119.636.65 −1.40 0.02 11.42
q-i-Ph-04-14M46343490-M4696874637.50–40.503.60 4.40 0.64 6.39
q-i-Ph-04-24M46968746-M4835627338.50–42.503.65 4.41 0.56 6.42
q-i-Ph-10-110M44554656-M45218626103.50–105.503.71 −3.90 2.67 6.50
q-i-Ph-10-210M45218626-M46706603104.50–107.503.76 −3.97 2.51 6.56
q-i-Nms-066M18032483-M1890564241.50–42.5011.20 1.57 0.47 20.31
q-i-Nms-10-110M44554656-M45218626101.50–104.505.46 −1.05 0.56 9.87
q-i-Nms-10-210M45218626-M46706603108.50–110.505.59 −1.10 0.59 11.24
q-i-Bn-077M16407697-M1757860829.50–32.504.81 −0.64 −0.49 9.69
q-i-Bn-1717M16966234-M1712807231.50–32.503.16 0.19 0.67 6.27
q-i-Bn-2020M38397421-M3854076089.50–91.502.92 −0.47 −0.15 5.78
q-i-Snp-12-112M17630392-M1773581063.50–64.5031.50 0.10 117.49 7.40
q-i-Snp-12-212M17735938-M1783952564.50–66.5022.52 −0.26 −94.98 7.18
q-i-Swp-011M3606657-M2730502181.50–86.502.57 −7.89 −9.14 27.90
q-i-Pro-1414M1853187-M10537655122.50–128.505.74 2.45 −2.71 8.60
q-i-Oil-055M31258547-M355449838.50–13.503.41 −0.48 0.09 9.67
q-i-Oil-1414M1853187-M10537655120.50–127.508.92 −1.60 1.77 11.14
q-i-Oil-1717M2326017- M1329495918.50–23.502.82 −0.24 0.65 9.33
q-i-Sw-10-110M44554656-M45218626102.50–105.509.90 −1.54 0.26 15.85
q-i-Sw-10-210M45218626-M46706603108.50–110.5010.40 −1.61 0.23 17.94
q-i-Sw-1414M10499533-M10720836162.50–163.502.69 −0.80 0.24 3.82
q-i-Sw-2020M37170883-M3865368775.50–81.502.57 −0.42 0.82 3.43
Raw QTL indicates the QTL identified from two methods, including composite interval mapping (CIM) and inclusive composite interval mapping (ICIM), in “q-c-Ph06-1”, “c” means the QTL detected from CIM method, while “i” means that from ICIM method, “Ph” represents the Ph trait, “06”is the chromosome number, and “1” is the QTL order in this chromosome. PVE (%): phenotypic variance explained by the QTL. The number in boldface in the PVE (%) column indicates the PVE of the QTL was larger than 3%.
Table 4. The QTL detected for three modules comprising nine traits in the F2 soybean population and as compared with reported QTL in SoyBase.
Final-QTLQTLChr.Genetic Distance (cM)Physical Region
(bp)
Raw QTLReported QTLs
StartEndStartEnd
qPh04q-i-Ph10437.5042.5046,343,490 48,356,273 q-i-Ph-04-(1~2) (6.39~6.42)Plant height 5-4,38-3
qPh06.1q-c-Ph10639.6739.805,316,720 5,344,739 q-c-Ph-06-1 (1.95)
qPh06.2q-c-Ph20640.9444.4017,853,562 20,735,926 q-c-Ph-06-(2~7) (2.08~4.28)Plant height 2-3,8-1,10-1,13-2,
17-6,17-9,18-4,19-3,21-2,30-2,
35-1;mqPlant height-004
qPh06.3q-c-Ph30645.0045.1321,293,030 21,651,163 q-c-Ph-06-8 (2.93)Plant height 19-3
qPh07q-c-Ph40738.2339.3737,616,796 38,050,866 q-c-Ph-07 (8.89)Plant height 37-5
qPh10q-i-Ph210103.50107.5044,554,656 46,706,603 q-i-Ph-10-(1~2) (6.50~6.56)Plant height 18-2,23-4,29-3,31-2
qNms06.1q-c-Nms10641.3041.6417,699,008 17,967,675 q-c-Nms-06-1 (16.13)
q-i-Nms10641.5042.5018,032,483 18,905,642 q-i-Nms-06 (20.31)
qNms06.2q-c-Nms20642.4644.6319,369,235 20,805,260 q-c-Nms-06-(2~4) (11.64~12.88)Node number 2-2
qNms06.3q-c-Nms30645.7746.6133,133,144 34,575,495 q-c-Nms-06-5 (12.81)Node number 4-2
qNms06.4q-c-Nms40646.5346.6139,270,735 39,375,450 q-c-Nms-06-6 (12.54)Node number 4-2
qNms10q-i-Nms210101.50110.5044,554,656 46,706,603 q-i-Nms-10-(1~2) (9.87~11.24)
q-c-Nms510104.75119.6345,218,626 48,656,006 q-c-Nms-10-(1~2) (14.88~15.94)
qNms12q-c-Nms61250.2152.5216,112,509 16,124,620 q-c-Nms-12 (1.88)
qNms13q-c-Nms71358.0959.0627,661,716 27,994,124 q-c-Nms-13 (2.48)Node number 2-3
qNms18q-c-Nms81865.2566.4048,705,140 49,579,192 q-c-Nms-18 (0.10)
qNms19.1q-c-Nms91935.4143.176,070,412 30,367,852 q-c-Nms-19-(1~6) (3.40~6.19)
qNms19.2q-c-Nms101949.6650.4135,378,183 36,019,184 q-c-Nms-19-7 (1.97)
qBn07.1q-i-Bn10729.5032.5016,407,697 17,578,608 q-i-Bn-07 (9.69)
qBn07.2q-c-Bn10730.9336.0135,251,457 37,062,168 q-c-Bn-07 (5.90)
qBn17q-i-Bn21731.5032.5016,966,234 17,128,072 q-i-Bn-17 (6.27)
qBn20q-i-Bn32089.5091.5038,397,421 38,540,760 q-i-Bn-20 (5.78)
qSnp12q-i-Snp11263.5066.5017,630,392 17,839,525 q-i-Snp-12-(1~2) (7.18~7.40)
qSwp01q-i-Swp10181.5086.503,606,657 27,305,021 q-i-Swp-01 (27.90)
qPro06q-c-Pro10643.8544.0419,369,235 20,604,864 q-c-Pro-06 (2.16)Seed protein 36-7
qPro14q-i-Pro114122.50128.501,853,187 10,537,655 q-i-Pro-14 (8.60)Seed protein 1-6,4-10,21-8
qOil05q-i-Oil1058.5013.5031,258,547 35,544,983 q-i-Oil-05 (9.67)Seed oil 4-1
qOil08q-c-Oil10813.3814.3422,523,579 22,591,404 q-c-Oil-08 (6.00)
qOil13q-c-Oil21368.9070.0029,950,268 30,149,493 q-c-Oil-13 (0.80)Seed oil 13-3,38-4
qOil14.1q-c-Oil31415.2777.191,320,374 47,154,263 q-c-Oil-14 (5.49)Seed oil 30-4,34-2,37-4,42-11,
42-27,42-28,43-2;mqSeed Oil-005
qOil14.2q-i-Oil214120.50127.501,853,187 10,537,655 q-i-Oil-14 (11.14)Seed oil 2-6,14-1,42-10,42-28
qOil17q-i-Oil31718.5023.502,326,017 13,294,959 q-i-Oil-17 (9.33)Seed oil 5-5,23-3,24-22,37-1,39-7,
42-12,43-12;mqSeed Oil-011
qSw06.1q-c-Sw10639.6644.6817,559,879 20,897,356 q-c-Sw-06-(1~5) (19.42~24.63)Seed weight 6-5,15-1,16-1,
31-2,34-15,36-7,40-2,49-6
qSw06.2q-c-Sw20645.7146.3030,266,140 38,969,070 q-c-Sw-06-(6~7) (20.95~21.98)Seed weight 15-1,16-1,19-1,31-1,
34-16,34-2,35-2,40-3,49-6
qSw10q-c-Sw31099.56119.6344,554,656 48,656,006 q-c-Sw-10-(1~3) (11.42~17.54)Seed weight 34-8,35-8,36-8
q-i-Sw110102.50110.5044,554,656 46,706,603 q-i-Sw-10-(1~2) (15.85~17.94)Seed weight 34-8,35-8,36-8
qSw14q-i-Sw214162.50163.5010,499,533 10,720,836 q-i-Sw-14 (3.82)Seed weight 3-8,4-10,13-2,23-1,
29-1,36-14
qSw20q-i-Sw32075.5081.5037,170,883 38,653,687 q-i-Sw-20 (3.43)Seed weight 36-5,37-11
Total37 (3)14 6371 (22)
Final-QTL represents the final QTL name, in “qPh06.1”, “qPh” means the Ph QTL, “06” is its chromosome number, and “1” is its physical positional order. Ph, plant height; Nms, number of main stem nodes; Bn, branch number; Snp, seed number per plant; Swp, seed weight per plant; Pro, protein content; Oil, oil content; and Sw, 100-seed weight. QTL indicates the QTL or QTL cluster identified by two methods including composite interval mapping (CIM) and inclusive composite interval mapping (ICIM), in “q-i-Ph1”, “i” means the QTL detected by ICIM method, while “c” means that from CIM method, “Ph” represents the Ph trait, and “1” is the QTL order in this trait. The “37(3)” in the “Total” row indicates that a total of 37 QTLs/QTL clusters were detected in nine traits by the CIM and ICIM method, of which three QTLs were detected in both of the two methods. Raw QTL: the QTLs detected by CIM and ICIM without a merger, in which “q-i-Ph-04-(1~2)” means the “q-i-Ph1” was a QTL cluster harboring “q-i-Ph-04-1” and “q-i-Ph-04-2”. The number in the parentheses is the minimum and maximum PVE (%) of the QTLs. The “63” in the “Total” row means that a total of 63 QTLs were detected in the eight traits using CIM and ICIM methods. The details of the QTLs were shown in Table 3. Reported QTLs: the QTL recorded in SoyBase, which is close to the present detected QTL in the CIM and ICIM procedure, according to the physical position within 1 Mb, “71(22)” means 22 QTLs or QTL clusters shared same confidence regions with 71 SoyBase QTLs. The QTL name was the same in SoyBase. The number in boldface indicates that the PVE of the QTL was greater than 3%.
Table 5. The candidate genes from the detected QTLs in the nine traits under KJ population.
Final-QTLCandidate GeneNo. of SNPsStart (bp)End (bp)Gene Ontology Descriptions
hGlyma.06G0695009 (0;4)5,332,544 5,337,158 Mitochondrial solute carrier protein
Glyma.06G06960012 (0;3)5,338,316 5,344,365 Cellulose synthase (UDP-forming) activity
qPh06.2Glyma.06G2078001 (0;1)20,207,077 20,207,940 AP2/B3-like transcriptional factor family protein (E1)
qPh06.3Glyma.06G2132001 (0;1)21,523,690 21,524,859
Glyma.06G21330058 (0;6)21,548,690 21,565,666 Translation initiation factor 2C and related proteins
qPh07Glyma.07G2071003 (1;1)37,628,251 37,629,081 zinc ion binding nucleic acid binding
Glyma.07G20970018 (1;7)38,049,934 38,051,000
qPh10Glyma.10G22150044 (0;2)45,294,735 45,316,121 Regulation of photoperiodism, flowering (E2)
qNms06.1Glyma.06G19690017 (0;4)17,770,435 17,777,991 Protein kinase superfamily protein
Glyma.06G1971002 (0;2)17,811,461 17,812,510 F-box family protein
Glyma.06G1972005 (0;5)17,904,627 17,905,751 F-box family protein
Glyma.06G19750017 (0;9)17,936,612 17,939,493
Glyma.06G19760010 (0;6)17,957,916 17,962,068 Leucine-rich repeat protein kinase family protein
Glyma.06G1977005 (0;2)17,964,387 17,965,751 Glycosyl hydrolase with C2H2-type zinc finger domain
qNms06.2Glyma.06G20430023 (0;5)19,210,586 19,213,448 Transcription factor TCP (QNE1)
qNms06.3Glyma.06G2271003 (0;1)34,252,103 34,254,142
Glyma.06G2273007 (0;1)34,434,861 34,440,448 Cytochrome P450 family 72 subfamily
Glyma.06G2274001 (0;1)34,446,404 34,449,305 Cytochrome P450 family 72 subfamily
Glyma.06G2278001 (0;1)34,521,336 34,523,081 ARM repeat superfamily protein
qNms06.4Glyma.06G2393003 (0;1)39,282,844 39,284,164 Polynucleotidyl transferase protein
Glyma.06G2395002 (0;1)39,371,341 39,373,375 UDP-glucosyl transferase
qNms10Glyma.10G22150044 (0;2)45,294,735 45,316,121 Regulation of photoperiodism, flowering (E2)
qNms12Glyma.12G13670028 (0;1)16,135,929 16,145,471 NB-ARC domain-containing disease resistance protein
qNms13Glyma.13G1613007 (1;1)27,692,430 27,693,744 Exostosin family protein
Glyma.13G16420020 (1;5)27,922,878 27,924,801 Transferring glycosyl groups
qNms18Glyma.18G20820015 (1;0)49,300,656 49,305,096 Methyltransferases
Glyma.18G2086004 (1;1)49,333,194 49,334,690 UDP-glucosyl transferase 73B3
qNms19.2Glyma.19G1047005 (0;2)35,430,695 35,431,194 Nucleotidyltransferase activity
Glyma.19G10480024 (0;1)35,437,052 35,439,310 Beta carbonic anhydrase
Glyma.19G10500012 (0;12)35,452,898 35,454,069 Hydroxyproline-rich glycoprotein family protein
Glyma.19G1052001 (0;1)35,492,974 35,493,519 Polynucleotidyl transferase
Glyma.19G1054007 (0;1)35,541,994 35,545,213 GRF zinc finger / Zinc knuckle protein
Glyma.19G1060005 (0;2)35,670,523 35,692,261 ATP-dependent helicase activity
Glyma.19G10610011 (0;2)35,706,447 35,708,388 Syntaxin/t-SNARE family protein
Glyma.19G10630056 (0;25)35,715,363 35,719,116 DNA repair metallo-beta-lactamase family protein
Glyma.19G1066003 (0;3)35,767,221 35,768,987 Xyloglucan endotransglucosylase
Glyma.19G1070004 (0;2)35,829,932 35,832,106 Tetratricopeptide repeat (TPR)-like superfamily protein
Glyma.19G1071002 (0;2)35,840,827 35,841,117
Glyma.19G10720047 (0;8)35,854,636 35,862,179 Alpha/beta-Hydrolases superfamily protein
Glyma.19G1073007 (0;1)35,879,955 35,888,760 Acetyl-CoA synthetase
Glyma.19G1074001 (0;1)35,897,479 35,898,781 Eukaryotic release factor
Glyma.19G10750073 (0;5)35,912,141 35,948,323 ARM repeat superfamily protein
Glyma.19G10770014 (0;4)35,968,969 35,973,494 Transferase family
Glyma.19G10780014 (0;9)35,979,733 35,982,244 Replication factor-A C terminal domain
Glyma.19G1079002 (0;1)35,983,072 35,985,032 DNA helicase PIF1/RRM3
qBn07.1Glyma.07G14670030 (2;3)17,539,245 17,544,317 PIF1 helicase
qBn17Glyma.17G17210019 (0;2)16,767,027 16,775,605 RING/U-box superfamily protein
qBn20Glyma.20G1457007 (0;1)38,418,866 38,424,142 PLP-dependent enzymes superfamily protein
Glyma.20G14590014 (0;3)38,437,905 38,441,537 Imidazoleglycerol-phosphate dehydratase
Glyma.20G1461003 (0;3)38,458,216 38,461,226 FRIGIDA-like protein
Glyma.20G14630015 (0;2)38,475,899 38,478,861 Cupin family protein
Glyma.20G1464002 (0;1)38,481,091 38,481,770
Glyma.20G1468004 (0;4)38,522,343 38,523,748 Seed storage 2S albumin superfamily protein
qSnp12Glyma.12G1410002 (0;1)17,640,979 17,644,117 Auxin-responsive GH3 family protein
Glyma.12g14110010 (0;1)17,692,581 17,701,361 Transducin/WD40 repeat-like superfamily protein
Glyma.12G1413008 (0;5)17,716,009 17,716,447 DNAJ heat shock N-terminal domain-containing protein
Glyma.12G14160029 (0;3)17,823,834 17,827,414 NAD(P)-linked oxidoreductase superfamily protein
qPro06Glyma.06G2078001 (0;1)20,207,077 20,207,940 AP2/B3-like transcriptional factor family protein (E1)
qOil08Glyma.08G2548001 (0;1)22,526,073 22,526,867 Glutamine dumper 1
Glyma.08G2550007 (0;1)22,565,075 22,569,279 Ribosomal RNA processing Brix domain protein
qOil13Glyma.13G1856003 (0;1)29,952,863 29,953,496
Glyma.13G18610013 (0;5)29,985,014 29,988,798 Root hair specific
Glyma.13g18640036 (0;5)30,001,282 30,008,506 Zinc induced facilitator
Glyma.13G1865007 (0;1)30,016,526 30,025,554 Zinc induced facilitator
Glyma.13G18680026 (0;3)30,049,481 30,055,924 SU(VAR)3-9 homolog
Glyma.13G1869002 (0;2)30,050,935 30,051,293
Glyma.13G187000113 (0;3)30,060,197 30,072,759 Subtilisin-like serine endopeptidase family protein
Glyma.13G1873006 (0;1)30,113,847 30,118,165 Conserved developmentally regulated protein
Glyma.13G1875009 (0;2)30,128,663 30,133,972 Myb-like DNA-binding domain
Glyma.13G1876009 (0;5)30,134,637 30,143,817 Protein kinase superfamily protein
Glyma.13G18770019 (0;1)30,149,058 30,152,110
qSw14Glyma.14G1039002 (0;1)10,508,303 10,509,092 EamA-like transporter family protein
Glyma.14G10400011 (0;1)10,624,617 10,628,567 EamA-like transporter family
Glyma.14G1041007 (0;1)10,634,347 10,639,492 Monogalactosyl diacylglycerol synthase
Glyma.14G1042007 (0;3)10,674,108 10,675,950 DnaJ/Hsp40 cysteine-rich domain superfamily protein
Glyma.14G1045001 (0;1)10,701,801 10,702,697
Glyma.14G1047004 (0;1)10,710,985 10,712,566 CemA-like proton extrusion protein-related
Final-QTL represents the final QTL name shown in Table 4. No. of SNP indicates the number of SNPs identified from the parents. The “9 (0;4)” in the row indicates that a total of 9 SNPs were detected in this gene, of which none were annotated as “variation impact high” and four were annotated as “variation impact low“. Here, 31 candidate genes were annotated from the 12 large contribution major QTLs (PVE ≥ 3%) while 109 candidate genes were annotated from 33 small contribution major QTLs (PVE < 3%). The candidate genes in boldface mean their gene ontology description was associated with flower development or photo-periodism. The QTL in boldface indicates that the PVE of the QTL was greater than 3%.
Publisher’s Note: MDPI stays neutral with regard to jurisdictional claims in published maps and institutional affiliations.

