Article

Coupling Relationship and Influencing Factors of the Water–Energy–Cotton System in Tarim River Basin

1
College of Economics and Management, Tarim University, Alar 843300, China
2
College of Economics and Management, Huazhong Agricultural University, Wuhan 430077, China
3
College of Economics and Management, Xinjiang Agricultural University, Urumqi 830052, China
4
Business School, Yulin Normal University, Yulin 537000, China
*
Authors to whom correspondence should be addressed.
Agronomy 2022, 12(10), 2333; https://doi.org/10.3390/agronomy12102333
Submission received: 3 August 2022 / Revised: 5 September 2022 / Accepted: 23 September 2022 / Published: 28 September 2022

Abstract

:
As the largest inland river basin in China, the Tarim River Basin is an important energy base and a key cotton-producing area in China. Therefore, the harmonious development of water resources, energy resources and cotton resources in the Tarim River Basin is a lifeline for stable quality and efficient development in this region. In this paper, the water–energy–cotton system of the Tarim River Basin is constructed and the weight of each index in the system is determined by using the entropy method. On this basis, the comprehensive development index of each subsystem and the water–energy–cotton system is calculated to measure the comprehensive development level of each system. Then, the coupling relationship between the three resources is quantitatively analyzed by using the coupling coordination degree model, and the mutual influence and strength of interaction between each system are calculated. Finally, a fractional regression model is established to analyze the factors affecting the coordinated development of the water–energy–cotton system in the Tarim River Basin. The results show that the comprehensive development index of the Tarim River Basin fluctuates obviously and the comprehensive development level of water resource systems is higher than that of the cotton resource and energy resource systems, and there are regional differences between each subsystem and the comprehensive development index of water–energy–cotton system. The coupling coordination degree of the basin is the primary coordination on the whole; however, there are significant differences in the coupling coordination degree of each region. In terms of influencing factors, the area of soil erosion treatment and water consumption in ecological environments both play a positive role in promoting the coupling coordination degree, and population size and GDP will hinder the development of the coupling coordination degree to a certain extent.

1. Introduction

With the development of society and economy, the traditional extensive development mode with high resource consumption, damage to environmental safety, and neglect of ecological health is gradually changing to an intensive development mode centered on resource-saving, environmental friendliness, and ecological conservation. The pursuit of resource conservation, environmental friendliness, and ecological conservation has become an inevitable requirement on the road of sustainable development. Realizing resource conservation is the basic link. In industrial systems, water and energy resources are indispensable and are closely related to consumption. Improving the utilization efficiency of water and energy resources, saving water resources, and efficient use of energy resources have become the target of current research [1], and promoting coordinated development of water and energy resources is becoming a key ring on the road to China’s sustainable development. This means that the analysis and research on separating water and energy resources can no longer meet the current development needs. Due to the inextricable connections and complex cyclic relationships between resources, changes in any resource system will have an impact on the other resource systems [2]. Therefore, scholars began to pay attention to the influence of different factors on water and energy resources and the internal relationship between them [3]. The essence of this kind of research is from the perspective of the management of sustainable development of water resources, from the single core of water resources to the dual core of water resources and energy resources to the three cores of water resources, energy resources and third resources. This comprehensive approach allows us to coordinate the utilization of various elements of agricultural production and promote the continuous improvement of agricultural industry clusters to achieve efficient and sustainable development [4,5,6,7]. Food resources were first included in the system for research. Under the interwoven background of population growth, resource shortage, and rising demand for water, energy, and food in different degrees [8,9,10], the water–energy–food system risk group was identified as one of the world’s three major risk groups. The water–energy–food system has been attracted extensive attention from scholars; however, as an effective tool, the water–energy–food system also provides effective suggestions for formulating strategies to continuously promote regional sustainable development [11,12,13]. As for the research on the water–energy–food system, the existing research is divided into spatial and temporal scales [9,14]. Foreign research levels range from Brazil, East Asia, and other countries and regions to the Southern African Development Community, the Organization for Economic Cooperation and Development, and other organizations [15,16,17,18]. In China, the study area is from Liaoning Province, Jiangsu Province and Gansu Province to the Beijing-Tianjin-Hebei region, the Yellow River basin and interprovince [19,20,21,22,23,24]. The research method has gradually changed from a single qualitative study of water–energy–food system analysis [9,25,26,27,28], turning to the quantitative research of the coupling coordination degree model as the main analysis method [23,24,29,30,31]. With the continuous deepening of research, ecological factors have been incorporated into the water–energy–food system for consideration of their own uniqueness. Scholars Melo et al. pointed out that forest security will constitute the fourth dimension of the water–energy–food system framework [31,32].
The predecessors took water resources as the core and linked water resources with energy resources. On this basis, they included food factors to build a comprehensive research system, which laid a solid research foundation and brought new thinking. In terms of regional particularity, the Tarim River Basin is an important oasis agricultural area, energy strategic base and high-quality cotton production area in China. The healthy and sustainable development of the Tarim River Basin is related to the ecological environment, economic development, and people’s production and life in the Tarim Basin. At present, water resources in the Tarim River Basin are facing great challenges: excessive development of water resources [33], the obvious decreasing trend of water resource carrying capacity and mild overload [34,35,36], the low utilization efficiency of water resources [37], weak adaptability of water resources [38], effective development and protection of groundwater resources [39], a severe shortage of water resources [40,41,42], etc. The coordinated development of energy and water resources is an important measure to promote regional economic development and maintain its ecological environment [43]. At the same time, as a cash crop with high water consumption, cotton brings great agricultural water pressure. Optimizing cotton planting can effectively optimize the water resource allocation in the Tarim River Basin, promote the oasis of the region and promote the development of its ecological environment [44,45,46,47].
Water, energy and cotton resources are related to the survival of human beings and are also the lifeblood of social and economic development, representing the road to sustainable development. At present, China is in the middle and late stages of industrialization, and the consumption of water, energy and cotton resources ranks the top in the world in the world. Therefore, water resource shortage, energy resource shortage, cotton supply uncertainty and other issues are increasingly prominent. At the same time, the ecological environment of the Tarim River Basin is fragile. In the matter of water, energy and cotton resources, how to achieve sustainable management of water resources, rational and efficient use of energy, and high quality and high yield of cotton are urgent problems to be solved on the road to sustainable development in the Tarim River Basin. Therefore, this paper takes the Tarim River Basin as the research area, constructs the water–energy–cotton system, explores the coupling relationship and influencing factors of the water–energy–cotton system, and makes contributions to promoting the sustainable and coordinated development of the Tarim River Basin.
Based on previous research results Zhao et al. put forward, such as the Yellow River water–energy subsystem system as a whole negative pressure caused by slight negative situation [23], Li et al. determined the coupling coordination degree of regional differences and the ecological environment factors, demographic factors and economic factors are significant effects on the system coupling coordination degree [24,48]. Therefore, this paper puts forward the following hypotheses: (1) Tarim River Basin is an agricultural, economic, and social system dominated by water resources. The fluctuation of the comprehensive development index of the water–energy–cotton system coincides with the fluctuation of the water resource subsystem to the highest degree, followed by the cotton resource subsystem and energy subsystem. (2) There are obvious regional differences in the coupling coordination degree of the water–energy–cotton system in the Tarim River Basin, however, the overall coordination degree is not high. (3) Water environment, water ecology, population, and economic development level have significant effects on the coupling coordination degree of the water–energy–cotton system.

2. Data Selection and Processing

2.1. Overview of the Study Area

The Tarim River Basin is located in the south of Xinjiang, China, between the Tianshan Mountains and the Kunlun Mountains, covering Bayingoleng Mongolian Autonomous Prefecture (Ba Prefecture), Aksu Prefecture, Kizilsu Kirgiz Autonomous Prefecture (Ke Prefecture), Kashgar Prefecture and Hetian Prefecture. The Tarim River Basin consists of one main stream of the Tarim River and nine main stream systems, including the Aksu River, the Yarqiang River and the Hetian River, totaling 144 rivers, see Figure 1. As the largest inland river basin in China, the Tarim River Basin has a vast basin area and abundant water resource reserves, but the total water resources vary significantly by season and region. At the same time, along with the exploration and development of the Tarim River Basin, there are abundant reserves of petroleum, natural gas, coal, and other energy resources in the basin, making it an important strategic energy base for China. At present, 30 million tons of oil and gas fields have been fully built in the Tarim River Basin, with an annual production capacity of 31.5 billion cubic meters of natural gas. At the same time, the Tarim River Basin is also an important oasis-irrigated agricultural production area and a high-quality cotton production base in China. By 2020, the cotton planting area in the Tarim River Basin was 1097.09 thousand hectares, and the cotton output reached 2,010,830.18 tons. It has a population of 11,951,200 and a GDP of 412,712 billion yuan. Therefore, the harmonious development of water, energy and cotton resources in the Tarim River Basin is key to the reproduction of all ethnic groups in the region.

2.2. Data Selection

Considering the uniqueness of the Tarim River Basin, this paper takes 2005–2020 the general Bayingoleng Mongolia autonomous Prefecture (Ba Prefecture), Aksu, Kizilsu Kirgiz Autonomous Prefecture (Ke Prefecture), Kashgar and Hetian regions as the research object, on the basis of related research, a total of 13 indicators were selected to create the water—energy—cotton system. The data in this paper are from the Xinjiang Statistical Yearbook and Xinjiang Statistical Bulletin of National Economic and Social Development.

2.3. Data Processing

2.3.1. Construction of Water–Energy–Cotton System

Scientific and effective indicators can accurately reflect the actual situation of research problems therefore, a scientific and reasonable indicator system is particularly important. Table 1 shows the index system construction of the water resource system, energy resource system and cotton resource system based on the actual situation of the five prefectures in the Tarim River Basin.

2.3.2. Standardized Processing of Data

Due to the disunity of data units, data should be standardized, indicators with positive properties should be processed forward and indicators with negative properties should be processed backward, as shown in the formula below. Where i indicates the year; j represents the index; xij represents raw data; X’ij represents standardized data; maxXij is the maximum value; and minxij represents the minimum value [48,49].
Positive indicator:
X i j = X i j m a x X i j m i n X i j m i n X i j
Negative indicator:
X i j = m a x X i j m a x X i j X i j m i n X i j

2.3.3. Determination of Index Weight

The entropy method in SPSS24.0 software is used to determine the corresponding weight of each indicator of the system and the output is shown in Table 2. There is a negative relationship between the information entropy value and the information utility value. The lower the information entropy value is, the lower the uncertainty is and the higher the information utility value is; therefore, the weight coefficient value is higher. Among them, the information utility degree of total water supply to the water resource subsystem is the highest, therefore, the weight coefficient value is high, reaching 14.34%. In the energy resource subsystem, the weight coefficient of comprehensive energy consumption intensity is higher than that of comprehensive energy consumption, meaning the information utility value of comprehensive energy consumption intensity is higher than that of comprehensive energy consumption. In the cotton resource subsystem, the weight coefficient of the proportion of cotton sown area was 3.08% and 5.06% higher than the weight coefficient of cotton yield per unit area and fertilizer usage, respectively. In the water–energy–cotton system, the weight coefficient of total water supply is the highest, followed by water production modulus, total water resources, water consumption of primary industries, and the proportion of cotton sown area. The weight coefficient of household water consumption is the lowest at only 1.72%.

3. Study on Coupling Relationship of Water–Energy–Cotton System

3.1. Building a Comprehensive Development Index Model

The comprehensive development index of the water resource system, energy resource system and cotton resource system was constructed, respectively, and the formula of the construction method was as follows.
Comprehensive development index of water resource system:
f x = i = 1 16 W i X i t
Comprehensive development index of energy resource system:
g y = i = 1 16 W j Y j t
Comprehensive development index of cotton resource system:
h z = i = 1 16 W k Z k t
System of water resources, energy resources, and cotton resources comprehensive development index:
T = αf(x) + βg(y) + γh(z)
where, Wi, Wj and Wk represent the weight of each index of the water resource system, energy resource system and cotton resource system. X′it, Y′jt and Z′kt are the normalized values of each index, and T represents the year. Referring to relevant research points of view, it is believed that there is no strong or weak difference in the impact degree of the water resource system, energy resource system or cotton resource system on society. Therefore, it is considered that the weight of the impact degree of each subsystem on social development is equal, that is, α = β = γ = 1/3.

3.1.1. Analysis of Comprehensive Development Index of Tarim River Basin

The comprehensive development index reflects the development level of each system, and the higher the comprehensive development index, the better the development level of the system. As shown in Table 3, the comprehensive development index data of the Tarim River Basin from 2005 to 2020 show that the comprehensive development index level of the water resource system is higher than that of energy and cotton resource systems. Although the development level of water resources is at the forefront, the comprehensive development index of water resources in the Tarim River Basin fluctuates obviously and is unstable. The comprehensive development index of water resource systems in the Tarim River Basin rose rapidly from 2005 to 2006 and then fell back after 2007. The comprehensive development index of water resources fluctuated from high to low in the following four years. In 2010, the comprehensive development index of water resource systems reached the lowest value. In 2011, the comprehensive development coefficient of water resources rose rapidly and reached its peak, and the development degree of water resource systems increased unprecedentedly. From 2012 to 2020, the comprehensive development index of the water resource system fluctuated greatly on the whole but the local fluctuation was stable. The comprehensive development index of water resource systems shows that the development level of water resources in the Tarim River Basin is still in the primary stage and has huge development space. The comprehensive development index of energy resources in the Tarim River Basin is low, far lower than that of other subsystems and the water–energy–cotton system. The numerical fluctuation range is around 0.2 to 0.3 and the development is relatively stable, but the development trend is rising steadily and the development prospects are good. The comprehensive development index of cotton systems in the Tarim River Basin was stable on the whole, and its value range fluctuated around 0.6, indicating that the development level of the cotton resource system was coordinated and stable. The comprehensive development index of the water–energy–cotton system in the Tarim River Basin increased from 2005 to 2007, showing a good development trend. From 2008 to 2011, the composite development index was extremely unstable. In 2009, the composite development index increased slightly compared with 2008 and then declined rapidly, falling to the lowest value in nearly 16 years. In 2011, it increased to the highest value of the comprehensive development index of the water–energy–cotton system in the past 16 years. Most of this is the result of drastic changes in water systems. After that, from 2012 to 2016, the comprehensive development index presented an M-shaped distribution. With the exception of 2014, the comprehensive development index fluctuated between 0.85 and 0.88 in other years and was in a relatively steady development state. In 2017, the comprehensive development index was at the highest value in the study period, because the comprehensive development index of each subsystem of water, energy and cotton resource systems in that year was at a historic high. In the following three years, the comprehensive development index gradually returned to the mean value and began to improve slightly. Visible water–energy–cotton system integrated development index volatility in conformity with the water resource subsystems of volatility, cotton and energy. Resource subsystem fluctuation anastomosis was relatively weak, which reflects the Tarim River Basin water resources as the core of sustainable management.

3.1.2. Analysis of Regional Comprehensive Development Index in Tarim River Basin

As shown in Table 4, consistent results are reflected by the comprehensive development index of each subsystem and water–energy–cotton system in the Tarim River Basin. The comprehensive development index of the water resource system is at the highest level regardless of time measurement or regional perspective. From the regional perspective, Ba Prefecture ranks first in the comprehensive development index of water–energy–cotton system, followed by Ke Prefecture, followed by Hetian and Kashgar, respectively, in the third and fourth place. Aksu is the lowest among regions in the comprehensive development index. The reason for this lies in Ba Prefecture’s abundant water resources and good cotton planting foundation, meaning the development level of the water and cotton resource subsystems are better; Ke Prefecture has abundant water resources and sufficient energy resources, meaning the development level of the water and energy resource subsystems are better. The comprehensive development index of the water resource systems in Ke Prefecture and Hetian is higher than the average regional comprehensive development index of water resources. From the perspective of energy resource systems, the comprehensive development index of Hetian, Ke Prefecture and Kashgar is high, indicating that as important strategic energy bases, Hetian, Ke Prefecture and Kashgar have a good energy foundation and are at a high level of development, therefore, the comprehensive development index is high. The comprehensive development index of cotton resources in Ba Prefecture and Aksu is among the best, which indicates that the high development level of cotton resources is closely related to the higher yield per unit area and the larger proportion of cotton sown area in the two regions. To summarize, considering the index system can be useful in cases of uneven regional distribution of water resources. Different water use efficiency factors are related to the development level of water resource systems. A good industrial base will inevitably have a positive role in energy resources and an improved cotton industry becoming important factors for the sustainable development of cotton resources per unit of production.

3.2. Coupled Coordination Model

3.2.1. Analysis of Coupling Coordination Degree in Tarim River Basin

On the basis of standardized data processing, SPSS24.0 software was used to analyze the coupling coordination degree of the water–energy–cotton system in Tarim River Basin, so as to quantitatively reflect the coupling relationship of water–energy–cotton systems. By calculating the coupling coordination degree model, the interaction degree of the water, energy and cotton resource systems can be reflected effectively. Referring to the division of the coupling coordination degree by Wang et al. [48], the coupling coordination degree is divided into 10 levels, which correspond to 10 levels of coupling coordination degree from extreme imbalance to excellent coordination, as shown in Table 5. The analysis results are displayed in Table 6, demonstrating that the coupling coordination degree of the water–energy–cotton system in the Tarim River Basin from 2005 to 2020 is generally at the primary coordination degree and 56.25% of the years’ coupling coordination degree value exceeds the mean value of the coupling coordination degree. A few years reached intermediate coordination, such as 2011, 2015 and 2016. The coupling coordination degree of the Tarim River Basin fluctuates greatly. From 2005 to 2007, the coupling coordination degree rose steadily, but after 2008, the value of the coupling coordination degree fluctuates sharply, resulting in the coupling coordination degree being both high and low. Although the coupling coordination degree of the Tarim River Basin reaches the primary coordination level, the coordination level is at a lower level and the coupling coordination degree fluctuates obviously.

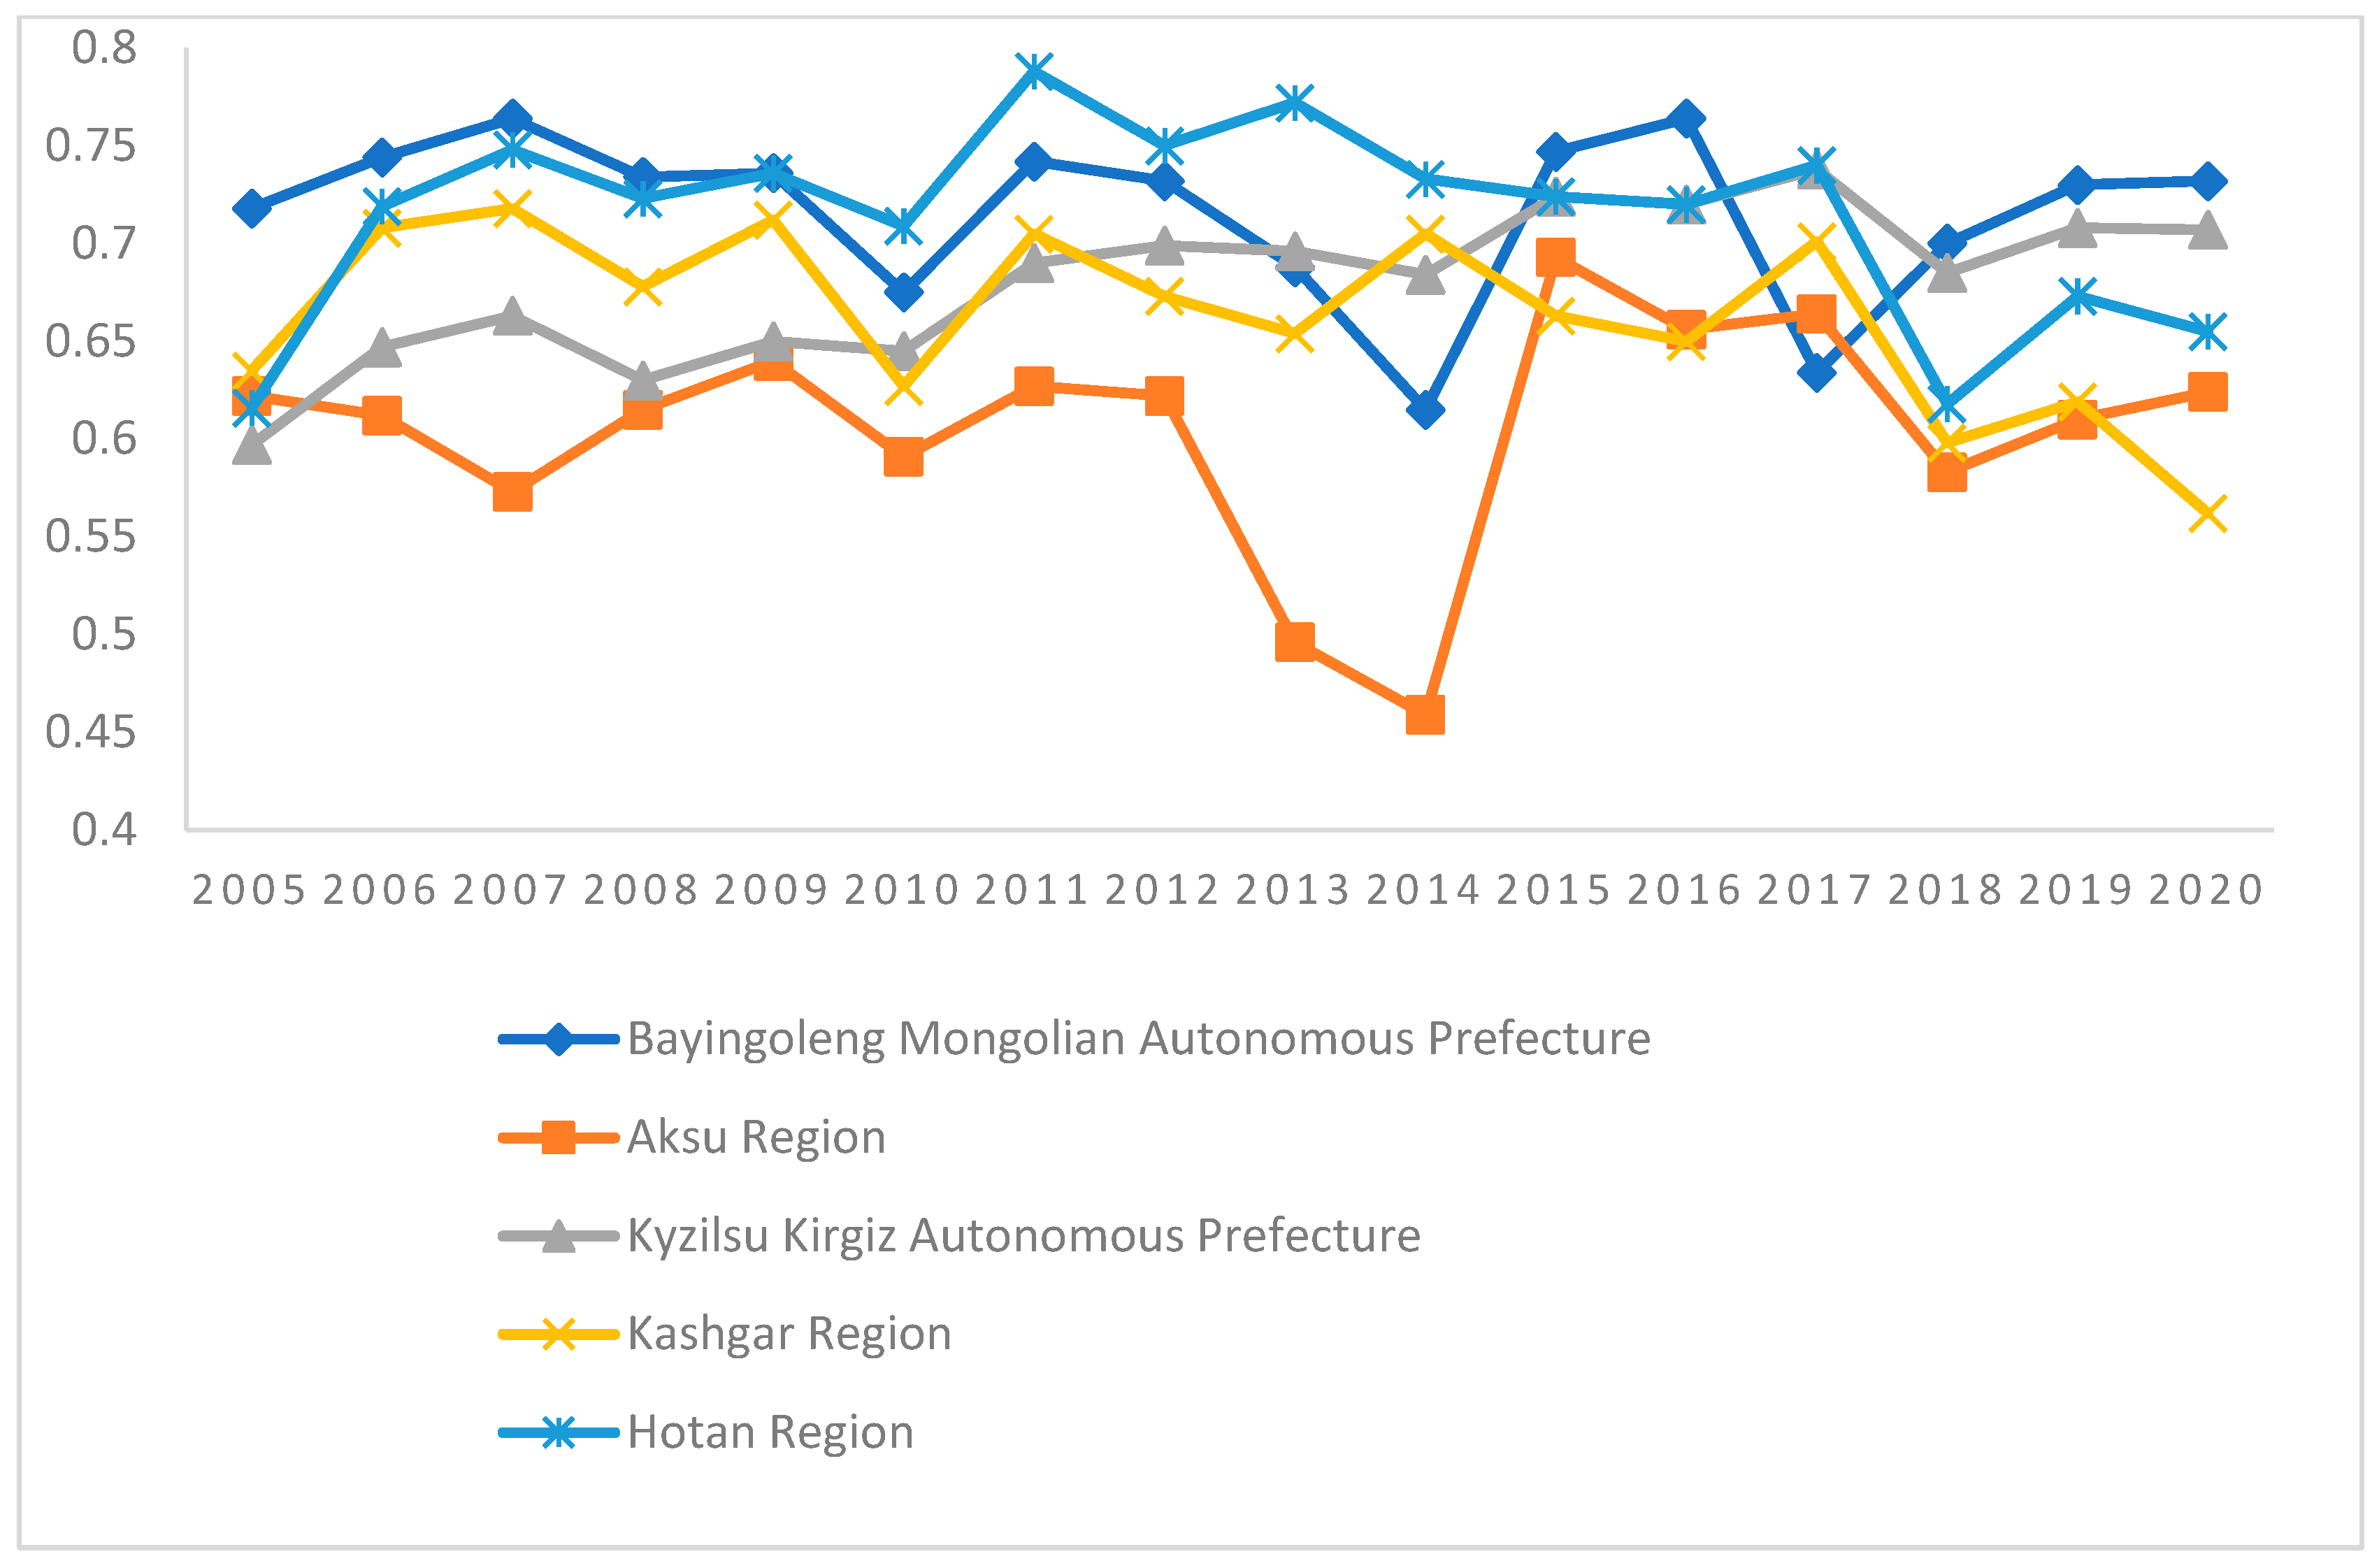
3.2.2. Analysis of Coupling Coordination Degree in Different Regions of Tarim River Basin

As shown in Figure 2, Ba Prefecture has a high degree of coupling coordination, both at the primary coordination level and intermediate coordination level, with the intermediate coordination rate reaching 68.75%. In general, the coupling coordination degree of Ba Prefecture is relatively stable but fluctuates obviously. From 2005 to 2007, with the continuous development of Ba Prefecture the connection between the subsystems of the water–energy–cotton system is increasingly close, and the degree of mutual influence is deepening. Therefore, the coupling coordination degree continues to rise. In 2008, the coupling coordination degree of Ba Prefecture decreased compared with 2007, but the situation improved again in 2009. Before 2009, the coupling coordination degree of Ba Prefecture was relatively stable, and the value fluctuated slightly between 0.71 and 0.77. However, after 2009, the coupling coordination degree of Ba Prefecture changed strongly. In 2010, the coupling coordination degree of Ba Prefecture dropped significantly and the coordination degree fell to the primary coordination level. In 2011, the coupling coordination degree returned to the normal level. Afterward, the coupling coordination degree showed a downward trend for three consecutive years and gradually rose to a historical peak in the following two years, although soon the coupling coordination degree dropped again. After 2018, the coupling coordination degree of Ba Prefecture has been steadily improved and the development trend is good. The coupling coordination degree of the water–energy–cotton system in Aksu is low and only barely in the primary coordination stage. From 2005 to 2012, the coupling coordination degree of Aksu has been hovering between the primary coordination degree and the reluctant coordination degree, but the primary coordination can be achieved most of the time. In 2013 and 2014, the coupling coordination degree was lower than the red line value of 0.5, and the water–energy–cotton system was on the verge of disorder. As measures are taken to optimize and improve the water–energy–cotton system, the water resource system, energy resource system and cotton resource system are gradually coordinated, and the coupling coordination degree is restored and improved. In general, compared with other areas, the coordinated development of the water–energy–cotton system in Aksu is low and needs to be further optimized and improved. The degree of coupling coordination in Croatia is in a stage of steady development, from the barely coordinated level in 2005 to the primary coordination level for nine consecutive years. In recent years, it has reached the intermediate coordination level, with the intermediate coordination rate reaching 31.25%. This shows that the coordinated development level of the water–energy–cotton system in Croatia is slowly and steadily improving. The coupling coordination degree in Kashgar is in the primary coordination degree and intermediate coordination degree on the whole. The primary coordination degree is the normal coupling coordination degree of the water–energy–cotton resource system in Kashgar, but the coupling coordination degree has been declining since 2014 and barely achieved coordination in 2018 and 2020. The coupling coordination degree of the water–energy–cotton resource system in Hetian has a good development level, reaching the intermediate coordination degree most of the time, and the intermediate coordination rate is as high as 75%. Compared with other areas in the Tarim River Basin, the coupling coordination degree in the Hetian area is at a higher development level. However, the level of coordination in the last three years (2018, 2019 and 2020) has declined. Based on the coupling coordination degree of the Tarim River basin in the past calendar year, it is not difficult to find areas of dry climate; water resources are relatively scarce and water use efficiency is low. The effects of high pressure, low energy use efficiency, agricultural development relative lag, etc. on different degrees of water resources may prevent system–energy–cotton coupling coordination from reaching an ideal state.

4. Influencing Factors of Coupling Coordination Degree of Water–Energy–Cotton System

4.1. Spatial Autocorrelation Test

The spatial autocorrelation test is the prerequisite to determining whether a spatial econometric model can be established. Stata software is used to analyze Moran’s I to determine whether there is a spatial effect. Generally, the value range of the Moran index is between (−1 and 1). When the value of the Moran index is positive, it indicates that there is a positive spatial correlation and the closer the value is to 1, the higher the aggregation degree is. When the value of the Moran index is 0, there is no correlation between the model, and it is random distribution. When the value of the Moran index is negative, it indicates that the neighboring regions are dispersed. Based on the coupling coordination degree of different regions in the Tarim River Basin from 2005 to 2020 combined with the spatial weight matrix, the Moran index is calculated. As shown in Table 7, the analysis results showed that the Moran index was negative with p values greater than 0.05, and the significance test failed. In the sample data, there was no spatial agglomeration effect in the relevant areas of Tarim River Basin, which is in the situation of random distribution, therefore, the spatial econometric model is not applicable. Therefore, the regression model was selected to analyze the influencing factors of coupling coordination degree in the Tarim River Basin. Considering that the value range of coupling coordination degree was between 0 and 1 and there was no accumulation, the Fractional regression model, namely, the Fractional Logit model, was selected.
Compared with traditional regression models, the Fractional Logit model can not only solve the common cases where the value range of the coupling coordination degree of the explained variables is between 0 and 1, it can also deal with the special cases where the coupling coordination degree is 0 or 1. When the value of the coupling coordination degree is 0 or 1, it means that the coordination degree is in a state of extreme maladjustment and excellent coordination, which is worth paying special attention to. The Fractional Logit model is utilized to take the extreme cases into account in this paper. Therefore, the Fractional Logit model is more suitable for analyzing the influencing factors of the coupling relationship in the Tarim River Basin.

4.2. Analysis of Influencing Factors

4.2.1. Selection of Variables

According to the analysis of the coupling coordination degree of the water–energy–cotton system in the Tarim River Basin, the relevant studies of scholars Li and Wang [24,50,51], and the actual situation of the Tarim River Basin, the coupling coordination degree of the Tarim River Basin is selected as the explained variable. Soil erosion control area, water consumption for ecological environment, population and gross regional product were the explanatory variables that affected the coupling coordination degree of the Tarim River Basin.
(1)
Coupling coordination degree (Y): The coupling coordination degree is an important index to measure the coupling relationship between water, energy, and cotton systems. The quantitative analysis of the factors affecting the coupling relationship between the water, energy and cotton systems in the Tarim River Basin requires the coupling coordination degree.
(2)
Area of soil and water loss control (X1): Area of soil and water loss control is of great significance to climate change, ecological environment optimization and the economic development of a region. The water–energy–cotton system is a comprehensive consideration of climate change factors, ecological environmental factors, and economic factors. Therefore, the area of soil erosion control has an impact on the water–energy–cotton system.
(3)
Ecological and environmental water consumption (X2): Ecological and environmental water consumption, namely, ecological and environmental compensation water consumption is of great significance for maintaining or optimizing the regional ecological environment. Water resources, energy resources and cotton resources are all indispensable parts of the ecological environment.
(4)
Population (X3): With the continuous increase in population, the demand for water, energy and cotton resources will increase by varying degrees, resulting in water resource shortages, energy resource shortages and increased uncertainty in the supply of cotton resources. Therefore, the population changes will directly affect the coordination degree of the water–energy–cotton system.
(5)
Gross Regional Product (X4): The continuous growth of gross regional product brings continuous economic development, which inevitably has an impact on the environment. Therefore, it is very important to consider the influence of GDP on the coupling coordination degree of water–energy–cotton systems.

4.2.2. Establishment of Fractional Logit Model

The coupling coordination degree reflects the strength of coordinated development among subsystems; therefore, the measured value of the coupling coordination degree is between 0 and 1. Considering the measurement method of the coupling coordination degree, there is no value less than 0 or greater than 1 and the value range of the coupling coordination degree must be between 0 and 1. The model coefficient estimates are considered to have better statistical characteristics. Therefore, this paper constructs the Fractional Logit model, which is proposed by Papke and Wooldridge (1996). The final model is as follows:
Y/(1 − Y) = exp(α + β1lnX1 + β2lnX2 + β3lnX3 + β4lnX4 + ε)
Y is the coupling coordination degree of Tarim River Basin, α represents the constant term, β1, β2, β3, and β4 represent the coefficient before each influencing factor, respectively, X1, X2, X3, and X4, govern the area of soil and water loss, water ecological environment, population and GDP, respectively. In addition to representing the influencing factors of indicators and doing log processing to ensure the stability of the data, ε represents the random disturbance term.

4.2.3. Analysis of Results of Influencing Factors

Stata software is used to set up the Fractional Logit model. The influencing factor data are logarithmically processed to increase the data stability. The significance level was set at 0.05, and the analysis results were shown in Table 8.
(1)
lnX1 passed the significance level test and the regression coefficient was positive, indicating that the coupling coordination degree between the soil erosion treatment area and the water–energy–cotton system presented a positive promoting effect. Its economic significance is that every 1000 ha increase of soil erosion control area will bring a 9.4% increase in the coupling coordination degree of the water–energy–cotton system. The expansion of the water loss and soil erosion control area is important for improving the regional ecological environment. Water resources play a positive role in promoting the virtuous circle of increased agricultural production in the region, providing good planting conditions. The increase of the soil erosion control area promoted the Tarim River Basin’s water–energy–cotton system coupling coordination degree of ascension.
(2)
lnX2 passes the significance level test, and the regression coefficient is positive. This result indicates that eco-environmental water consumption can promote the coupling coordination degree of the water–energy–cotton system. Its economic significance is that every 100 million cubic meters of ecological water consumption increases the coupling coordination degree of the water–energy–cotton system by 6.1%. As ecological environment compensation water, ecological environment water consumption is of great significance for maintaining and improving regional ecological environment quality. The quality of the regional ecological environment directly affects the development level of water resources, energy resources and cotton resources.
(3)
lnX3 passes the significance level test, and the regression coefficient is negative. The results show that population is the limiting factor of the coupling coordination degree in the water–energy–cotton resource system. Its economic significance is that every 10,000 people increase in population causes a 10.9% decrease in the coupling coordination degree of the water–energy–cotton system. Population growth is not conducive to improving the coupling coordination degree of the system. Due to the rise in population, the total amount of water, energy and cotton resources are limited, and the demand will lead to water resource carrying capacity becoming too large, the excessive development of energy resources, damage to the ecological balance, and a series of other problems. These factors are not conducive to the development of the water–energy–cotton system, not to mention the coordinated development.
(4)
lnX4 passed the significance level test, and the regression coefficient was negative. The results show that GDP will restrain the coupling coordination degree of the water–energy–cotton system. The economic significance is that every 100 million yuan of GDP increase will cause a 10.8% decrease in the coupling coordination degree of the water–energy–cotton system. In the initial stage of GDP, to some extent, ecological health is neglected at the cost of destroying the ecological environment. Although GDP is on the rise, the low utilization efficiency of resources will inevitably lead to a large amount of unnecessary waste of resources, which will not bring about a healthy water resource system. Energy and cotton resource systems are developed in good coordination, therefore, the coupling coordination degree of the system is not high.

5. Robustness Test

In order to investigate the robustness of the interpretation ability of the Fractional Logit model and the four indicators, such as soil erosion control area, ecological environmental water consumption, population number and gross regional product, the robustness test is carried out. This paper adopts the method of changing the regression model to test its robustness. Similarly, considering that the sample data do not include the spatial aggregation effect and present a random distribution state, the spatial econometric model is not adopted but the regression model is adopted. In addition, the value of the coupling coordination degree of the explained variable is special, and the Tobit model and the OLS model are used for the robustness test.

5.1. Tobit Model

The final model is shown in Table 9. When the significance level is 0.05, the p value is <0.05 and the significance level test is passed, indicating the validity of the model.
As shown in Table 10, when the significance level is 0.05, lnX1, lnX2, lnX3 and lnX4 all pass the significance level test. Consistent with the results of the Fractional Logit model, the regression coefficient of soil erosion treatment area and eco-environmental water consumption is positive, indicating that the soil erosion treatment area and eco-environmental water consumption play a positive role in promoting the coupling coordination degree of the water–energy–cotton system in the Tarim River Basin. The regression coefficient between population and GDP is negative, indicating that population and GDP will hinder the improvement of the coupling coordination degree. In summary, the Fractional Logit model and the influencing factor indicators pass the robustness test, which means that the Fractional Logit model and the influencing factor indicators can better reflect the actual situation.

5.2. OLS Model

As shown in Table 11, lnX1, lnX2, lnX3 and lnX4 all passed the significance level test. Following the results of the Fractional Logit model and the Tobit model, the regression coefficient of soil erosion treatment area and ecological water consumption is positive, which indicates that the soil erosion treatment area and ecological water consumption play a positive role in promoting the coupling coordination degree of water–energy–cotton system in the Tarim River Basin. The regression coefficient between population and GDP is negative, indicating that population and GDP will hinder the improvement of the coupling coordination degree. In summary, the Fractional Logit model and the influencing factor indicators pass the robustness test, which means that the Fractional Logit model and the influencing factor indicators can better reflect the actual situation.

5.3. Summary of Robustness Test Results

As shown in Table 12, all the influencing factors have passed the significance test at different significance levels. Under each regression model, the regression coefficient of the soil erosion treatment area and ecological environmental water consumption is always positive, and the regression coefficient of population and the gross regional product is always negative. The results show that the change in the parameter estimation model does not cause a change of significance and the regression coefficient; therefore, the results of the Fractional Logit model and parameter estimation are robust.

6. Discussion

At present, studies on the coupling relationships of comprehensive systems show obvious regional differences, and the comprehensive development index is closely related to regional resource endowment. Taking the Yellow River Basin, which is one of the important river basins in China, as an example, the coupling coordination degree between the Yellow River Basin and the Tarim River Basin is in the primary coordination stage and intermediate coordination stage, however, the trend of coupling coordination degree is different. The fundamental reason lies in the different establishment of the index systems. The water–energy–cotton system is established in the Tarim River Basin, while the water–energy–grain system is established in the Yellow River Basin. The Tarim River Basin is the most important producing area of high-quality cotton in China, and is also one of the regions with the greatest shortage of water resources and the lowest efficiency of water utilization in China, and even in the world. This problem is becoming more and more obvious with the energy shortage and the growing population. Previous studies have focused more on the coordination between water, energy and food systems, while ignoring cotton as an important strategic material. Therefore, this study is a good supplement to previous studies. Second, there are also differences in research methods. At first, previous studies only focused on the coupling relationship and ignored the analysis of influencing factors. Different from previous studies, this study not only considers the coupling relationship of the water–energy–cotton system, but also makes an econometric analysis of the influencing factors of the coupling relationship. The econometric model is different from the traditional OLS and Tobit regression models, but according to the characteristics of the coupling coordination degree data concentration, selecting a more appropriate Fractional Logit model and using OLS and Tobit regression model to test the robustness of the results is a more effective use of these scientific methods. At the same time, the entropy method is used to deal with the index weight, which reduces the subjectivity of the index weight and makes the data processing result more credible. Finally, the study of water–energy–cotton system coupling relationships is conducive to the development of an economic society in the arid area of northwest China and the direction of resource conservation, environmental friendliness, and ecological conservation, which are of great significance for promoting regional economic development and ecological health. The limitation of this paper is that the index system of the water–energy–cotton system needs to be further optimized and perfected, and the amount of sample data should be further expanded. Combined with the research methods in related fields, the research methods of coupling relationships should be enriched and a variety of research methods should be comprehensively used to reflect the actual situation more scientifically and reasonably.

7. Conclusions and Suggestions

7.1. Conclusions

(1)
The comprehensive development level of water resource systems in Tarim River Basin is higher than that of energy resource systems and cotton resource systems, but the development level of water resource systems still fluctuates obviously. This indicates that the level of coordinated development of water resources still has much room for improvement. The comprehensive development index of energy resource systems maintains a good development trend but the development level is low. The development level of the cotton resource system is between the water resource system and the energy resource system, and the development level is unstable. The comprehensive development index of the water–energy–cotton system is most affected by the water resource system, which is higher than other subsystems.
(2)
The comprehensive development index of Tarim River Basin is based on a regional perspective; Ba Prefecture, Ke Prefecture and Hetian regions have higher development levels than the average regional comprehensive development index, ranking in the top three, while the Kashgar and Aksu regions lag behind.
(3)
The coupling coordination degree of the Tarim River Basin has reached the primary coordination degree, however, there is a large fluctuation in the coupling coordination degree and it is necessary to continue to promote the positive influence of the water–energy–cotton system to achieve comprehensive, coordinated, and sustainable development.
(4)
There are obvious regional differences in the coupling coordination degree of the Tarim River Basin. As a whole, all the regions of the Tarim River Basin have reached the level of primary coordination and intermediate coordination, though there are notable differences among regions. For example, Aksu has a situation of near imbalance, while Hetian can reach the level of intermediate coordination in most cases. Uneven resource distribution and low utilization efficiency lead to regional differences in coupling coordination degree.

7.2. Suggestions

On the one hand, improving the coordinated development level of the water–energy–cotton system in the Tarim River Basin provides a good material foundation for the production, living and economic development of all ethnic groups in the Tarim River Basin, and on the other hand, makes an important contribution to the sustainable development of the Tarim River Basin. As an agricultural economic and social system dominated by water resources, the development trend of water resource systems in Tarim River Basin brings pressure to the promotion of the coordinated development level of the whole system. Therefore, we should encourage and strengthen the research and development of water-saving agricultural technologies, support the introduction of drought-tolerant crops, and vigorously promote water-saving irrigation planting methods. In the face of regional differences, each region should combine its own actual situation, formulate targeted solutions, do overall consideration, and learn from each other to promote the coordinated development of water–energy–cotton systems. For regions with a high level of coordinated development, they should continue to optimize industrial layouts based on their resource endowment advantages, upgrade and optimize industries that consume high water and energy, and vigorously develop energy conservation and environmental protection industries. For regions with a low level of coordinated development, we should pay attention to the restrictions on the industries with high water and energy consumption and guide them to develop in the direction of conservation and environmental protection so as to improve the utilization efficiency of all resources and achieve high efficiency and low energy consumption. In addition, water, energy and cotton resources are indispensable parts of the ecological environment, and the situation of the ecological environment will directly affect the development of various subsystems and integrated systems. We should pay attention to protecting the water environment and water ecology in the Tarim River Basin, establish the consciousness of ecological health, take a series of measures such as strengthening the control of soil erosion and desertification, and implement land fallow to improve the quality of the regional ecological environment. It is also necessary to pay attention to the ecological environment compensation water so that the regional ecological environment can be maintained and optimized to promote the healthy and sustainable development of the region. At the same time, as an important influencing factor, the rational allocation of the regional population is also one of the ways to promote coordinated development between systems. Finally, ecological benefits should not be ignored in economic development. It is necessary to change the mode of economic development; change the previous extensive mode of production and operation; develop resource-saving, environment-friendly and ecologically intensive modes of operation and development; and take the road of sustainable development, which is an inevitable requirement of the development road in the new era.

Author Contributions

Conceptualization, Q.L.; methodology, Q.L. and B.L.; writing—original draft preparation, Q.L., B.L. and D.W.; writing—review and editing, Q.L., Y.Y., Y.L. and D.W. All authors have read and agreed to the published version of the manuscript.

Funding

This research was funded by the National Social Science Foundation of China (No. 19BJY139), the Humanities and Social Sciences Fund of the Ministry of Education of China (No. 17YJAZH057 and No. 20XJJCZH001), the first batch of New Humanities and Social Sciences Research and Practice Projects of the Ministry of Education of China (No. 2021090093), Tarim University Team Building for Teaching Project: Marketing Team Teaching (No. TDJXTD2204), and the First-class Undergraduate Major Construction Project of Tarim University—Business Administration (No. YLZYXJ202106).

Data Availability Statement

Data openly available in a public repository.

Conflicts of Interest

The authors declare no conflict of interest.

References

  1. Fan, X.; Zhang, W.; Chen, W.W.; Chen, B. Land-water-energy nexus in agricultural management for greenhouse gas mitigation. Appl. Energy 2020, 265, 114796. [Google Scholar] [CrossRef]
  2. Sun, C.Z.; Hao, S.; Zhao, L.S. Spatial-temporal differentiation characteristics of water resources-energy-food nexus system efficiency in China. Water Resour. Prot. 2021, 37, 61–68, 78. [Google Scholar]
  3. Xie, Z.Q.; Xing, W.L.; Yan, Q. Research on the inter-provincial water-energy-economy coupling Relationship based on DEA and Input-output Model in China. China Min. 2020, 29, 35–41. [Google Scholar]
  4. Zhu, C.J.; Tang, D.S.; Gu, L.G. Analysis of agricultural industrial cluster. J. Agric. Econ. 2012, 1, 57–59. [Google Scholar]
  5. Li, Z.F.; Chen, T. Evolution analysis of standardization production behavior in GI Agricultural product enterprise cluster. In 19th International Conference on Industrial Engineering and Engineering Management; Springer: Berlin/Heidelberg, Germany, 2013; pp. 361–368. [Google Scholar]
  6. Hajiyev, P.; Mingaleva, Z. Main ways of attracting investments into agriculture and agro-industrial complex of Russia. Life Sci. J. 2013, 10, 824–829. [Google Scholar]
  7. Mingaleva, Z.; Shaidurova, N.; Prajová, V. The role of technoparks in technological upgrading of the economy. The example of agricultural production. Manag. Syst. Prod. Eng. 2018, 26, 241–245. [Google Scholar] [CrossRef]
  8. Chai, J.; Shi, H.T.; Lu, Q.Y.; Hu, Y. Quantifying and predicting the Water-Energy-Food-Economy-Society-Environment Nexus based on Bayesian networks—A case study of China. J. Clean. Prod. 2020, 256, 120266. [Google Scholar] [CrossRef]
  9. Zhang, C.; Chen, X.X.; LI, Y.; Ding, W.; Fu, G.T. Water -energy-food nexus: Concepts, questions and methodologies. J. Clean. Prod. 2018, 195, 625–639. [Google Scholar] [CrossRef]
  10. Zuo, Q.T.; Wu, Q.S.; Yu, L.; Li, Y.P.; Fan, Y.R. Optimization of uncertain agricultural management considering the framework of water, energy and food. Agric. Water Manag. 2021, 253, 106907. [Google Scholar] [CrossRef]
  11. Luis, S.P. Water, agriculture and food: Challenges and issues. Water Resour. Manag. 2017, 31, 2985–2999. [Google Scholar]
  12. Getahun, G.T.; Katterer, T.; Munkholm, L.J.; Parvage, M.M.; Keller, T.; Rychel, K.; Kirchmann, H. Short-term effects of loosening and incorporation of straw slurry into the upper subsoil on soil physical properties and crop yield. Soil Tillage Res. 2018, 184, 62–67. [Google Scholar] [CrossRef]
  13. Simpson, G.B.; Jewitt, G.P.W. The development of the water-energy-food nexus as a framework for achieving resource security: A review. Front. Environ. Sci. 2019, 7, 8. [Google Scholar] [CrossRef]
  14. Niva, V.L.; Cai, J.L.; Taka, M.J.; Kummu, M.; Olli, V. China’s sustainable water—Energy—Food nexus by 2030: Impacts of urbanization on sectoral water demand. J. Clean. Prod. 2019, 25l, e119755. [Google Scholar] [CrossRef]
  15. Mercure, J.F.; Paim, M.A.; Bocquillon, P.; Lindner, S.; Salas, P.; Martinelli, P.; Berchin, I.I.; de Andrade Guerra, J.B.S.O.; Derani, C.; de Albuquerque Junior, C.L.; et al. System complexity and policy integration challenges: The Brazilian energy-Water-food nexus. Renew. Sustain. Energy Rev. 2019, 105, 230–243. [Google Scholar] [CrossRef]
  16. White, D.J.; Hubacek, K.; Feng, K.S.; Sun, L.X.; Meng, B. The Water-energy-food nexus in East Asia: A tele-connected value chain analysis using inter-regional input-output analysis. Appl. Energy 2018, 210, 550–567. [Google Scholar] [CrossRef] [Green Version]
  17. Schreiner, B.; Baleta, H. Broadening the lens: A regional perspective on Water, food and energy integration in SADC. Aquat. Procedia 2015, 5, 90–103. [Google Scholar] [CrossRef]
  18. Ibrahim, M.; Ferreira, D.; Daneshvar, S.; Marques, R. Transnational resource generativity: Efficiency analysis and target setting of Water, energy, land, and food nexus for OECD countries. Sci. Total Environ. 2019, 697, 134017. [Google Scholar] [CrossRef]
  19. Bi, B.; Chen, D.; Deng, P.; Zhang, D.; Zhu, L.Y.; Zhang, P. Study on the coupling and coordinated evolution characteristics of regional water-energy-food system. China Rural. Water Hydropower 2018, 2, 72–77. [Google Scholar]
  20. Zhou, L.M.; Xie, X.H.; Zhu, Z.D. Coupling simulation model of water-energy-grain bond and case study. China Rural. Water Hydropower 2020, 10, 1–6. [Google Scholar]
  21. Dang, R.; Zhang, J.; Zhou, D.M.; Liu, Y.; Ma, J.J.; Zhu, X.Y.; Ma, J. Study on coupling coordination characteristics of water-energy-grain in Gansu Province from 2000 to 2016. J. Water Resour. Water Eng. 2020, 31, 115–123. [Google Scholar]
  22. Zhang, H.F.; Zeng, J.J.; Qu, J.S.; Li, H.J.; Liu, L.N.; Wu, J.J.; Xu, L. Study on coupling coordinated development of water, energy and grain in high-intensity resource flow region: A case study of Beijing-Tianjin-Hebei Region. China Rural. Water Hydropower 2019, 5, 17–21, 28. [Google Scholar] [CrossRef]
  23. Zhao, L.S.; Liu, S.J.; Sun, C.Z. Study on coupling and coordinated development of water-energy-food security system in the Yellow River Basin. Water Resour. Prot. 2021, 37, 69–78. [Google Scholar]
  24. Li, C.Y.; Zhang, S.Q. Coupling coordination degree of water-energy-grain and its influencing factors in China. China Popul. Resour. Environ. 2020, 30, 120–128. [Google Scholar]
  25. Wang, D.Z.; Abula, B.W.J.; Lu, Q.; Liu, Y.; Zhou, Y.J. Regional Business Environment, Agricultural Opening-Up and High-Quality Development: Dynamic Empirical Analysis from China’s Agriculture. Agronomy 2022, 12, 974. [Google Scholar] [CrossRef]
  26. Conway, D.; Van, G.E.A.; Deryng, D.; Dorling, S.; Dalin, C. Climate and southern Africa’s Water-energy-food nexus. Nat. Clim. Change 2015, 5, 837–846. [Google Scholar] [CrossRef]
  27. Yu, H.Y. Bond security: Threats to energy-food-water security and its thinking. Reg. Glob. Dev. 2018, 2, 94–110, 157–158. [Google Scholar]
  28. Liu, B. Study on the relationship between water, energy and food. Hebei Water Resour. 2019, 4, 22–23. [Google Scholar]
  29. Duan, W.L.; Chen, Y.N.; Zou, S.; Nover, D. Managing the water-climate-food nexus for sustainable development in Turkmenistan. J. Clean. Prod. 2019, 220, 212–224. [Google Scholar] [CrossRef]
  30. Karamian, F.; Mirakzaden, A.A.; Azari, A. The water-energy-food nexus in farming: Managerial insights for a more efficient consumption of agricultural inputs. Sustain. Prod. Consum. 2021, 27, 1357–1371. [Google Scholar] [CrossRef]
  31. Shi, H.Y.; Luo, G.P.; Zheng, H.W.; Chen, C.B.; Hellwich, O.; Bai, J.; Liu, T.; Liu, S.; Xue, J.; Cai, P.; et al. A novel causal structure-based framework for comparing a basin-wide water-energy-food-ecology nexus applied to the data-limited Amu Darya and Syr Darya river basins. Hydrol. Earth Syst. Sci. 2021, 25, 901–925. [Google Scholar] [CrossRef]
  32. Melo, F.P.L.; Parry, L.; Brancalion, P.H.S.; Pinto, S.R.R.; Freitas, J.; Manhaes, A.P.; Meli, P.; Ganade, G.; Chazdon, R.L. Adding forests to the water–energy–food nexus. Nat. Sustain. 2021, 4, 85–92. [Google Scholar] [CrossRef]
  33. Li, Y.Y.; Li, Y.L.; He, J. Strategic countermeasures of China’s water resources security in the new Development stage. J. Hydraul. Eng. 2021, 52, 1340–1346, 1354. [Google Scholar]
  34. Xie, Y.; Zibibula, S.M.Y.; Zheng, L.; Paziliamu, M.L.T.J. Analysis of water resources carrying capacity and its driving forces in Tarim River Basin. Hubei Agric. Sci. 2016, 55, 4685–4690, 4734. [Google Scholar]
  35. Chen, L.; Liang, X.P. Evaluation of water resources carrying capacity of “Three sources and one trunk” in Tarim River Basin based on improved comprehensive weighting method. Water Sav. Irrig. 2019, 1, 72–75, 83. [Google Scholar] [CrossRef]
  36. Liu, X.; Zhang, M.; Xu, J.H.; Guo, Y.; Duan, W.L.; Shen, Y.J. Study on water resources carrying capacity of Tarim River Basin based on system dynamics model. Arid. Land Geogr. 2021, 44, 1407–1416. [Google Scholar]
  37. Ekhermu, A.B.L.; Wang, Y.J.; Ling, H.B.; Xu, H.L.; Zhou, H.Y. Water resources change trend and water use efficiency analysis in Tarim river basin. J. Shihezi Univ. (Nat. Sci. Ed.) 2019, 37, 112–120. [Google Scholar]
  38. Li, X.; Zuo, Q.T.; Han, S.Y.; Li, D.L.; Ma, J.X. Evaluation and regulation of water resources adaptive utilization capacity in Tarim River Basin. Water Resour. Prot. 2021, 37, 63–68. [Google Scholar]
  39. Wang, G.Y.; Wang, Y.J.; Gui, D.W. Research progress of water resources in Tarim river basin. Arid Land Geogr. 2018, 41, 1151–1159. [Google Scholar]
  40. Gleick, P.H. Water strategies for the next administration. Science 2016, 354, 555–556. [Google Scholar] [CrossRef]
  41. Chen, J.F.; Yu, X.Y.; Qiu, L.; Deng, M.H.; Dong, R. Study on vulnerability and coordination of Water-Energy-Food system in Northwest China. Sustainability 2018, 10, 3712. [Google Scholar] [CrossRef]
  42. Lu, Q.; Liu, F.J.; Li, Y.J.; Wang, D.Z. Study on the Relationship between Water Resources Utilization and Economic Growth in Tarim River basin from the Perspective of Water Footprint. Water 2022, 14, 1655. [Google Scholar] [CrossRef]
  43. Guan, W.; Zhao, X.N.; Zou, X.Y. Spatial pattern and gravity center evolution of energy-water resources in China. J. Liaoning Norm. Univ. (Nat. Sci.) 2020, 43, 86–94. [Google Scholar]
  44. Ren, C.; Yu, J.W.; Long, A.H.; Zhang, J. Evaluation and analysis of water resources pressure in Tarim basin based on crop water footprint. Water Resour. Hydropower Technol. 2019, 50, 27–37. [Google Scholar]
  45. Wang, Y.Y.; Long, A.H.; Xiang, L.Y.; Yu, J.W.; Su, S.J. Research on optimization of agricultural planting structure in Tarim river basin based on LP-PSO. Water Resour. Hydropower Technol. 2019, 50, 191–197. [Google Scholar]
  46. Li, D.L.; Zuo, Q.T.; Zhang, W.; Ma, J.X. Model of Agricultural water resources allocation in Tarim River Basin based on Nerlove method. Water Resour. Prot. 2021, 37, 75–80. [Google Scholar]
  47. Li, W.W. Study on the imbalance and rebalancing of water ecology in desert-oasis region. Yunnan Soc. Sci. 2021, 2, 165–172. [Google Scholar]
  48. Wang, D.Z.; Abula, B.W.J.; Jizuo, A.N.; Si, J.H.; Zhong, K.Y.; Zhou, Y.J. Agricultural Openness and the Risk of COVID-19 Incidence: Evidence from China. Int. J. Environ. Res. Public Health 2022, 19, 3517. [Google Scholar] [CrossRef]
  49. Wang, D.Z.; Abula, B.W.J. Exploration of High Quality Development Model of Provinces and Regions Along the New Western Land-Sea Corridor. Front. Econ. Manag. 2021, 2, 30–44. [Google Scholar]
  50. Wang, Z.H.; Tian, Y.W. Coupling relationship between water, energy and grain and its influencing factors in China. South-North Water Divers. Water Sci. Technol. (Chin. Engl.) 2021, 20, 243–252. [Google Scholar]
  51. Wang, F.; Chen, Y.N.; Li, Z.; Fang, G.H.; Li, Y.P.; Xia, Z.H. Assessment of the irrigation water requirement and water supply risk in the Tarim River basin, Northwest China. Sustainability 2019, 11, 4941. [Google Scholar] [CrossRef] [Green Version]
Figure 1. Tarim River Basin, Xingjiang, China.
Agronomy 12 02333 g001
Figure 2. Coupling coordination degree of different regions in Tarim River Basin during 2005–2020.
Agronomy 12 02333 g002
Table 1. Index system of water–energy–cotton system in Tarim River Basin.
System NameIndicator NameIndicator UnitIndicator Acquisition MethodIndicator Properties
Water resourceTotal water resourcesHundred million cubic metersStatistic data+
Total water supplyHundred million cubic metersStatistic data+
Water consumption in primary industryHundred million cubic metersStatistic data
Water consumption in secondary industryHundred million cubic metersStatistic data
Household water consumptionHundred million cubic metersStatistic data
Per capita water consumptionCubic meters/per personStatistic data
Modulus of water productionHundred million cubic meters/Ten thousand square kilometersTotal water resources/Area of region+
Water consumption of 100 million Yuan of GDPHundred million cubic meters/Hundred million YuanTotal water content/GDP
Energy resourcesIntegrated energy consumptionTons of standard coalStatistic data
Comprehensive energy consumption intensityTen thousand tons/Hundred million YuanIntegrated energy consumption/GDP
Cotton resourcesFertilizer usageTonStatistic data
Proportion of cotton sown areaPercentageCotton sown area/Crop sown area+
Cotton yield per unit areaKg/haStatistic data+
Table 2. Index weights of water–energy–cotton system in Tarim River Basin.
System NameIndicator NameThe Information Entropy ValueInformation Utility ValueWeight Coefficient (%)
Water resourceTotal water resources0.94250.057512.84
Total water supply0.93580.064214.34
Water consumption in primary industry0.94610.053912.04
Water consumption in secondary industry0.98730.01272.84
Household water consumption0.99230.00771.72
Per capita water consumption0.96720.03287.34
Modulus of water production0.94130.058713.11
Water consumption of 100 million Yuan of GDP0.98450.01553.46
Energy resourcesIntegrated energy consumption0.99010.00992.21
Comprehensive energy consumption intensity0.98030.01974.41
Cotton resourcesFertilizer usage0.97220.02786.22
Proportion of cotton sown area0.94950.050511.28
Cotton yield per unit area0.96330.03678.20
Table 3. System evaluation index of water resources, energy and cotton systems in Tarim River Basin from 2005 to 2020.
YearWater Resources SystemEnergy Resource SystemCotton Resource SystemComprehensive Development Index
20051.4940.2550.6280.792
20061.7100.2500.6830.881
20071.7010.2470.7240.891
20081.5490.2560.6650.824
20091.6360.2500.6400.842
20101.4390.2470.6270.771
20111.8240.2380.6530.905
20121.6520.2390.6690.853
20131.6920.2300.6600.861
20141.5000.2340.6440.793
20151.6930.2940.6370.875
20161.7240.2930.6020.873
20171.7550.2930.6710.906
20181.5630.2960.6170.825
20191.6110.2950.6370.848
20201.5970.2920.6350.841
Table 4. System evaluation index of water resource-energy-cotton system in Tarim River Basin.
RegionWater Resources SystemEnergy Resource SystemCotton Resource SystemComprehensive Development Index
Ba Prefecture5.1790.7183.1203.006
Aksu region4.2690.4812.4372.396
Ke Prefecture6.0061.0021.6202.876
Kashgar region5.0380.9891.6252.551
Hetian region5.6501.0161.5902.752
Table 5. Division standard of coupling coordination degree.
Coordination Level12345
Coupling coordination degree value(0.0~0.1)[0.1~0.2)[0.2~0.3)[0.3~0.4)[0.4~0.5)
Degree of coupling coordinationExtreme disorderSevere disordermoderate disorderMild disorderBorderline disorder
Coordination Level678910
Coupling coordination degree value[0.5~0.6)[0.6~0.7)[0.7~0.8)[0.8~0.9)[0.9~1.0)
Degree of coupling coordinationBarely coordinationPrimary coordinationIntermediate coordinateGood coordinationExcellent coordination
Table 6. Mean value of coupling coordination degree in Tarim River Basin from 2005 to 2020.
YearDegree of Coupling CoordinationCoupling Coordination
2005Primary coordination0.638
2006Primary coordination0.686
2007Primary coordination0.693
2008Primary coordination0.676
2009Primary coordination0.695
2010Primary coordination0.649
2011Intermediate coordinate0.710
2012Primary coordination0.695
2013Primary coordination0.661
2014Primary coordination0.639
2015Intermediate coordinate0.710
2016Intermediate coordinate0.702
2017Primary coordination0.695
2018Primary coordination0.637
2019Primary coordination0.668
2020Primary coordination0.656
Table 7. Global Moran index of coupling coordination degree in Tarim River Basin from 2005 to 2020.
YearIE(I)sd(I)zp-Value
2005−0.178−0.250.1390.5210.301
2006−0.173−0.250.2260.3410.367
2007−0.239−0.250.1940.0580.477
2008−0.003−0.250.2391.0320.151
2009−0.054−0.250.2430.8040.211
2010−0.213−0.250.2090.1780.429
2011−0.163−0.250.1980.4370.331
2012−0.276−0.250.208−0.1250.45
2013−0.382−0.250.161−0.820.206
2014−0.309−0.250.17−0.3460.365
2015−0.205−0.250.2070.2190.413
2016−0.249−0.250.2280.0030.499
2017−0.279−0.250.229−0.1250.45
2018−0.429−0.250.24−0.7460.228
2019−0.399−0.250.237−0.6290.265
2020−0.289−0.250.214−0.1820.428
Table 8. Parameter estimation results of Fractional Logit model.
YCoef.Robust Std. Err.zp > z[95% Conf.][Interval]
lnx10.09423970.03245782.90.0040.03062350.1578558
lnx20.06131430.01965053.120.0020.02280010.0998286
lnx3−0.10934780.0416406−2.630.009−0.1909618−0.0277338
lnx4−0.10808990.0474786−2.280.023−0.2011463−0.0150335
_cons1.6040670.19427818.260.0001.2232891.984845
Table 9. Likelihood ratio test of Tobit regression model.
Model−2 Times Logarithmic LikelihoodChi-Square ValuedfpAIC ValueBIC Value
Only intercept−219.454
Final model−237.15517.70140.001−227.155−215.245
Table 10. Regression analysis results of Tobit model.
Regression ItemRegression CoefficientStandard Errorz Valuep Value95% CI
_cons0.8660.05316.34300.762~0.969
Ln_X10.0210.0092.3840.0170.004~0.037
Ln_X20.0130.0052.7280.0060.004~0.023
Ln_X3−0.0240.011−2.1490.032−0.046~−0.002
Ln_X4−0.0230.01−2.3020.021−0.043~−0.003
log(Sigma)−2.9010.079−36.6970−3.056~−2.746
Table 11. Results of OLS regression analysis.
Regression ItemCoefStd. Errtp95% CIR2Adjusted R2F
_cons0.8660.05515.8240.000 **0.758~0.9730.1980.156F (4,75) = 4.644, p = 0.002
Ln_X10.0210.0092.3090.024 *0.003~0.038
Ln_X20.0130.0052.6410.010 *0.003~0.023
Ln_X3−0.0240.012−2.080.041 *−0.047~−0.001
Ln_X4−0.0230.011−2.2290.029 *−0.044~−0.003
* p < 0.05 ** p < 0.01.
Table 12. Summary of parameter estimation results of each model.
Fractional Logit ModelTobit ModelOLS Model
YCoefStd. Errp ValueCoefStd. Errp ValueCoefStd. Errp Value
lnx10.094 ***0.0320.0040.021 **0.0090.0170.021 **0.0090.024
lnx20.061 ***0.0200.0020.013 ***0.0050.0060.013 **0.0050.010
lnx3−0.109 ***0.0420.009−0.024 **0.0110.032−0.024 **0.0120.041
lnx4−0.108 **0.0470.023−0.023 **0.0100.021−0.023 **0.0110.029
_cons1.604 ***0.1940.0000.866 ***0.0530.0000.866 ***0.0550.000
Note: ** and *** were significant at 0.05 and 0.01 levels respectively.
Publisher’s Note: MDPI stays neutral with regard to jurisdictional claims in published maps and institutional affiliations.

