Article

Estimation of Potato Chlorophyll Content from UAV Multispectral Images with Stacking Ensemble Algorithm

1
College of Mechanical and Electronic Engineering, Northwest A&F University, Yangling 712100, China
2
College of Optical, Mechanical and Electrical Engineering, Zhejiang A&F University, Hangzhou 311300, China
*
Authors to whom correspondence should be addressed.
Agronomy 2022, 12(10), 2318; https://doi.org/10.3390/agronomy12102318
Submission received: 6 September 2022 / Revised: 21 September 2022 / Accepted: 23 September 2022 / Published: 27 September 2022
(This article belongs to the Special Issue Remote Sensing, GIS, and AI in Agriculture)

Abstract

:
Rapid and accurate crop chlorophyll content estimation is crucial for guiding field management and improving crop yields. This study explored the potential for potato chlorophyll content estimation based on unmanned aerial vehicle (UAV) multispectral imagery. To search the optimal estimation method, three parts of research were conducted as following. First, a combination of support vector machines (SVM) and a gaussian mixture model (GMM) thresholding method was proposed to estimate fractional vegetation cover (FVC) during the potato growing period, and the proposed method produced efficient estimates of FVC; among all the selected vegetation indices (VIs), the soil adjusted vegetation index (SAVI) had the highest accuracy. Second, the recursive feature elimination (RFE) algorithm was utilized to screen the VIs and texture features derived from multispectral images: three Vis, including modified simple ratio (MSR), ratio vegetation index (RVI) and normalized difference vegetation index (NDVI); three texture features, including correlation in the NIR band (corr-NIR), correlation in the red-edge band (corr-Red-edge) and homogeneity in the NIR band (hom-NIR), showed higher contribution to chlorophyll content estimation. Finally, a stacking model was constructed with K-Nearest Neighbor (KNN), a light gradient boosting machine (light-GBM), SVM algorithm as the base model and linear fitting as the metamodel, and four machine learning algorithms (SVM, KNN, light-GBM and stacking) were used to build the chlorophyll content estimation model suitable for different growing seasons. The results were: (1) The performance of the estimation model could be improved based on both VIs and texture features over using single-type features, and the stacking algorithm yielded the highest estimation accuracy with an R2 value of 0.694 and an RMSE value of 0.553; (2) When FVC was added, the estimation model accuracy was further improved, and the stacking algorithm also produced the highest estimation accuracy with R2 value of 0.739, RMSE value of 0.511 (3) When comparing modeling algorithms, stacking algorithms had greater advantages in the estimation chlorophyll content with potato plants than using single machine learning algorithms. This study indicates that taking into account the combination of VIs reflecting spectral characteristics, texture features reflecting spatial information and the FVC reflecting canopy structure properties can accomplish higher chlorophyll content estimation accuracy, and the stacking algorithm can integrate the advantages of a single machine learning model, with great potential for estimation of potato chlorophyll content.

1. Introduction

Potato is the fourth largest food crop [1], and the healthy development of the potato industry is of great significance to national food security and personal living standards. The potato planting area of China ranks first in the world, but its yield per unit is lower than the world average [2]. The potato industry is facing huge challenges in how to meet the increasing demand for potato production with limited soil resources. Chlorophyll content is closely related to the ability of crops to intercept incoming photosynthetically active radiation, a key variable in photosynthesis, respiration and transpiration [3], which is commonly applied to crop management. Therefore, achieving rapid and accurate estimation of chlorophyll in potato plants is the key to guide field management and improve yield.
The traditional measurement of chlorophyll content in crop plants based on physical and chemical experiments has the disadvantages of being time-consuming, laborious and limited because of the large amount of crop plants [4,5]. Recently, many studies have obtained crop chlorophyll contents using handheld chlorophyll sensors such as SPAD 502, which is an effective tool for rapidly measuring plant chlorophyll content, and a SPAD reading is confirmed to have significant correlation to the chlorophyll content measured by physicochemical experiments [6,7]. However, the SPAD sensor is not suitable for field-scale chlorophyll content measurements, thus, a SPAD reading generally is taken as the truth value to evaluate other methods suitable for field-scale chlorophyll content measurements. In addition to the handheld chlorophyll sensor, RGB cameras and spectrometers are also commonly used to estimate chlorophyll content in crop plants. For example, Widjaja Putra et al. and Gupta et al. [8,9] successfully estimated the chlorophyll content of crops based on color characteristics derived from an RGB image. However, RGB images include less image information and usually lead to low robusticity estimation model. Compared with RGB images, the spectrometer can obtain a large amount of reflectivity information from the leaves, which can better build the chlorophyll content estimation model for crop plants [10,11]. However, spectral data include a lot of redundant information, which leads to more complex processing. In addition, similar to the handheld chlorophyll sensor, RGB cameras and spectrometers are also not suitable for large-scale crop chlorophyll estimation. Thus, it is necessary to develop methods for chlorophyll content estimation within field-scale crops with procedures that require less time and are non-destructive to crops.
Unmanned aerial vehicles (UAVs) have emerged as promising platforms for crop monitoring due to their rapid and cost-effective manner, which makes it easier to collect high-resolution remote sensing images of field-scale crops under adequate weather conditions [5]. Studies have proven the feasibility of using a UAV hyperspectral system for the estimation of crop chlorophyll content, such as in the potato [12], Spartina alterniflora [13], corn [14] and soybean [15]. However, hyperspectral cameras are expensive, and the processing of crop spectral information is complex; they are not accessible for individual farmers. Moreover, there was also related research based on the airborne RGB camera’s ability to obtain the visible light image of the crop canopy and then extract the image features to construct the estimation model of the chlorophyll content [16]. However, the amount of information in the image restricts the accuracy and robustness of the RGB camera in estimating the chlorophyll content. Airborne multispectral camera systems are a compromise that takes into account the cost of the sensor and the amount of image information.
In general, vegetation indices (VIs) derived from the UAV multispectral imagery reflecting the spectral characteristics of crop canopy show great potential in the monitoring of the crop chlorophyll content [17]. For example, Mao et al. [18] estimated the chlorophyll content of maize in Zhuozhou City, Hebei Province, China, with the highest coefficient of determination (R2) value of 0.8402. Gaurav Singhal [19] estimated the chlorophyll content of turmeric in Northeast Hilly Region, India, with an R2 value of 0.7452 and RMSE value of 0.10 mg/g. Nevertheless, most VIs only take into account the spectral characteristics of the crop canopy, which may be affected by soil background, moisture content and disease stress. To investigate the impact of soil background on crop chlorophyll content estimates, the soil-adjusted vegetation index was applied to remove the effects of soil background and provide more accurate estimates of chlorophyll content at the canopy level [18]. However, these VIs tend to lose sensitivity when the chlorophyll content exceeds a certain amount. Due to the limitation of VIs in chlorophyll content estimation, introducing texture features to estimate the crop chlorophyll content may be a great way to improve estimation accuracy [20]. Regrettably, texture features are often applied for ground classification and rarely used for crop growth monitoring [21].
Fractional vegetation cover (FVC), defined as the proportion of green vegetation on the surface per unit area [22], is one of the most widely used crop structural traits and is taken as a key factor in predicting crop growth and estimating water [23] and fertilizer stress [24]. There is a close relationship between FVC and chlorophyll content; as FVC increased, the chlorophyll content showed a trend of increasing first and then decreasing [25]. Unfortunately, less consideration is given to FVC information for crop chlorophyll content estimation in existing studies. In addition, machine learning is often used to build estimation models of chlorophyll content. For example, Tang et al. [26] built a model to estimate the chlorophyll content of soybeans based on four machine learning algorithms, and radial basis function (RBF) showed the best estimation accuracy with an R2 value of 0.873. Zhang et al. [27] estimated the chlorophyll content of corn in multiple growth stages with methods including a back propagation neural network (BP-NN), support vector regression (SVR) and partial least squares regression (PLS), and results showed that SVR had the greater potential to estimate the chlorophyll content. However, most of the chlorophyll content estimation models established by the above studies were based on a type of machine learning method. Each machine learning method has its own advantages and disadvantages, and a single machine learning method has certain limitations for chlorophyll content estimation.
We considered the fact that few existing studies estimate the chlorophyll content of potato plants through the combination of vegetation index, texture feature and FVC, and that chlorophyll content estimation based on a single machine learning algorithm was insufficient. Therefore, the main goal of this study was to (1) use SVM to select samples and fit the samples selected by SVM based on a gaussian mixture model (GMM) to determine the classification threshold for estimating FVC; (2) construct a stacking algorithm and execute significance analysis on the chlorophyll content in potato plants; and (3) estimate the chlorophyll content for potato plants based on vegetation index, texture features and FVC with the stacking algorithm constructed in this study.

2. Materials

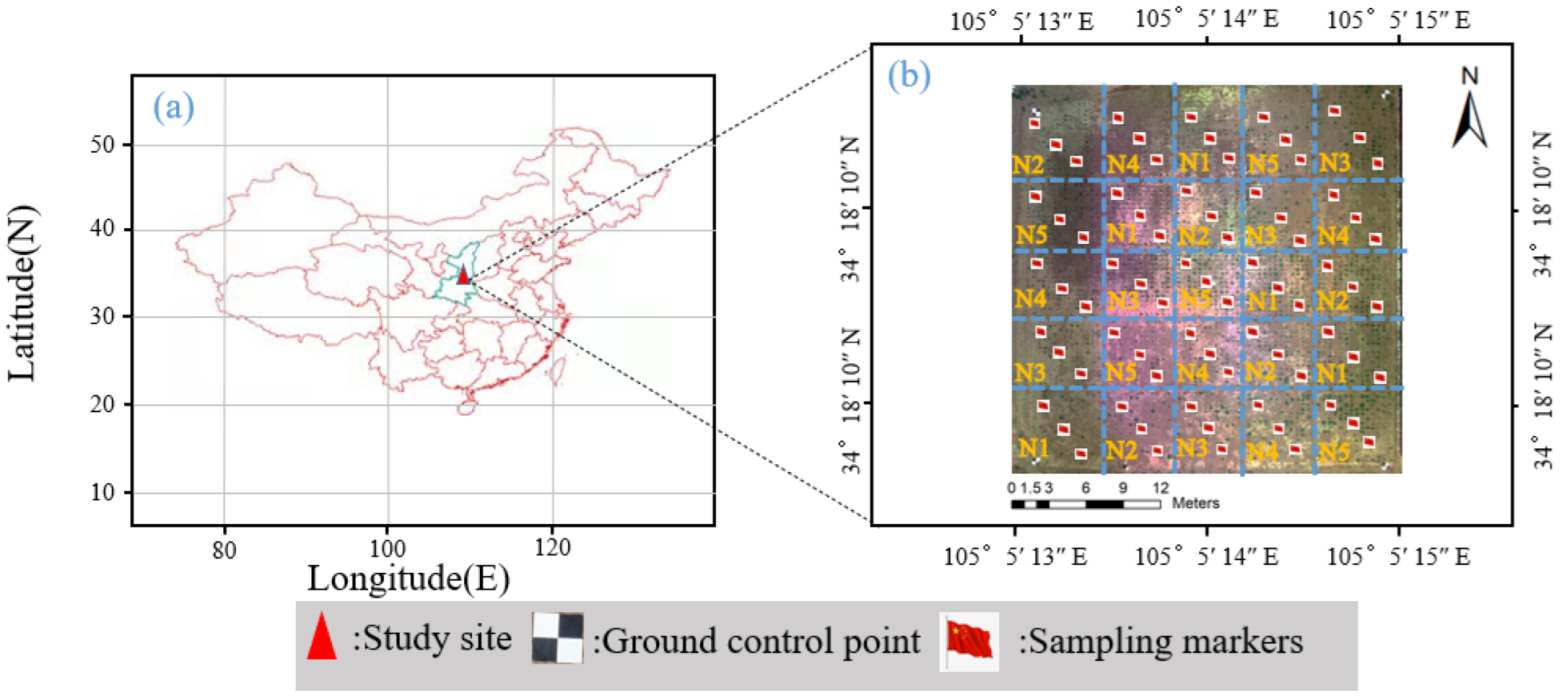
2.1. Study Site and Management

The experiment was carried out on a field in Caoxinzhuang farm, Yangling Demonstration Area, Shaanxi Province (34°18′10″ N, 108°5′14.33″ E). The potato planting area was approximately 1666.6 m2; was divided into 25 plots with 5 nitrogen (N) fertilization rate replications including: A1: (nitrogen 0 kg ha−1), A2: (nitrogen 75 kg ha−1), A3: (nitrogen 150 kg ha−1), A4: (nitrogen 225 kg ha−1), A5: (nitrogen 300 kg ha−1); and each plot had the dimensions of 7.5 m × 7.5 m (Figure 1). The potato mother for the test was Jinshu 16 with a plant spacing of 0.6 m, a row spacing of 0.5 m and a planting depth of 10 cm. The soil pH, organic matter and N content were 7.21, 27.31 g/Kg and 1.96 g/Kg. The potato crop was planted on 1 May 2021, emerged on 29 May, and harvested on 8 September 2021 with a 102-day lifespan.

2.2. Data Collection

2.2.1. Measurement of Potato Chlorophyll Content

A SPAD meter (SPAD-502Plus, Konica Minolta, Osaka, Japan) was used to measure the chlorophyll content of potato plants 50 and 70 days after potato planting. Initially, 50 days after the planting of the potato crop, the number of leaves was small, and 3 leaves at the top and bottom of the potato plant canopy were selected for measurement, respectively (Figure 2a). Then, 70 days after the potato crop was planted, 3 leaves at the top, middle and bottom of the potato plant canopy were selected for measurement, respectively. To make the sampling point correspond with the UAV multispectral imagery, the sampling marker was inserted into soil at the right of the plant sample to be measured (Figure 2b). Every leaf was measured 5 times, and the mean was taken as the chlorophyll content of corresponding leaves. The measurement process followed the instruction manual for measuring the crop (KONICA MINOLTA, Inc., Tokyo, Japan).

2.2.2. Acquisition and Pretreatment of UAV Multispectral Images

On the same day as the measurement of the chlorophyll content in the potato plants, multispectral images were obtained by a self-developed UAV multispectral system with the RedEdge-M (MicaSense, Inc., Seattle, WA, USA) camera lens vertically downward. The RedEdge-M camera is a multispectral sensor that allows for the capture of imagery at 5 specific bands within the visible and infrared electromagnetic spectrum: red (668 nm), green (560 nm), blue (475 nm), red-edge (717 nm), and near infrared (840 nm).
Multispectral imagery acquisition should follow the experience of previous studies and related data acquisition rules [28]. Before the operation of the UAV multispectral platform, the multispectral imagery of the radiation correction plate was first collected, which guaranteed reliable spectral values of ground objects. The data were obtained at 11:30 noon with sunny weather. At this time, the sunlight was perpendicular to the experimental field, which can reduce the influence of shadows on data processing. The Pix4D Capture (Pix4D Inc., Lausanne, Switzerland) was used for planning the operation route, with a height of 30 m, a speed of 3 m/s, a forward and side overlap of 85% and 75% and the camera looking downwards. Detailed information about the multispectral camera and the UAV system are given in Table 1. A too small route planning area led to a low density of point clouds in the boundary area of the experimental field, which did affect the quality of the digital orthophoto map (DOM) within the experimental field. Therefore, complete coverage of the experimental field by the route area should be ensured. According to [29], five ground control points were determined for georeferencing in multi-period images, regularly distributed around the experiment field. Pix4DMapper software (Pix4D Inc., Lausanne, Switzerland) was applied to the performed image mosaic processing, which was designed to process UAV imagery based on the structure from motion (SfM) algorithm. The main flow of processing included: (1) Initializing geolocation images captured within each flight mission based on an automatic feature point matching algorithm; (2) Importing five ground control points into the software for correcting image geographic coordinates, and then ultrahigh precision point cloud data were generated with a 7 × 7 pixels window size; (3) Generating the DOM using the inverse distance weighting method.

3. Methodology

The process consisted of six parts (Figure 3). First, 250 multispectral images were captured by the UAV multispectral remote sensing system, then DOM spliced with Pix4D software were cropped to obtain the experimental area. Second, the common five VIs and eight texture features were calculated. Third, the combination of the GMM threshold method and SVM was applied to estimate the FVC of the potato plants, and a confusion matrix was used to validate the FVC estimates, and furthermore, the best FVC estimation results were taken as input to build the chlorophyll content estimation model. Fourth, a significance analysis was performed to determine the positions of leaves with significant differences to increasing N application rate and taking them as model outputs. Fifth, the VIs and texture features were filtered based on the RFE algorithm to reduce the complexity of the model. Finally, texture features and VIs screened by RFE and FVC were applied to build estimation models of chlorophyll content based on KNN, light-GBM, SVM and the stacking algorithm. For the convenience of readers, the definitions of abbreviations that appear more frequently are explained in Table 2.

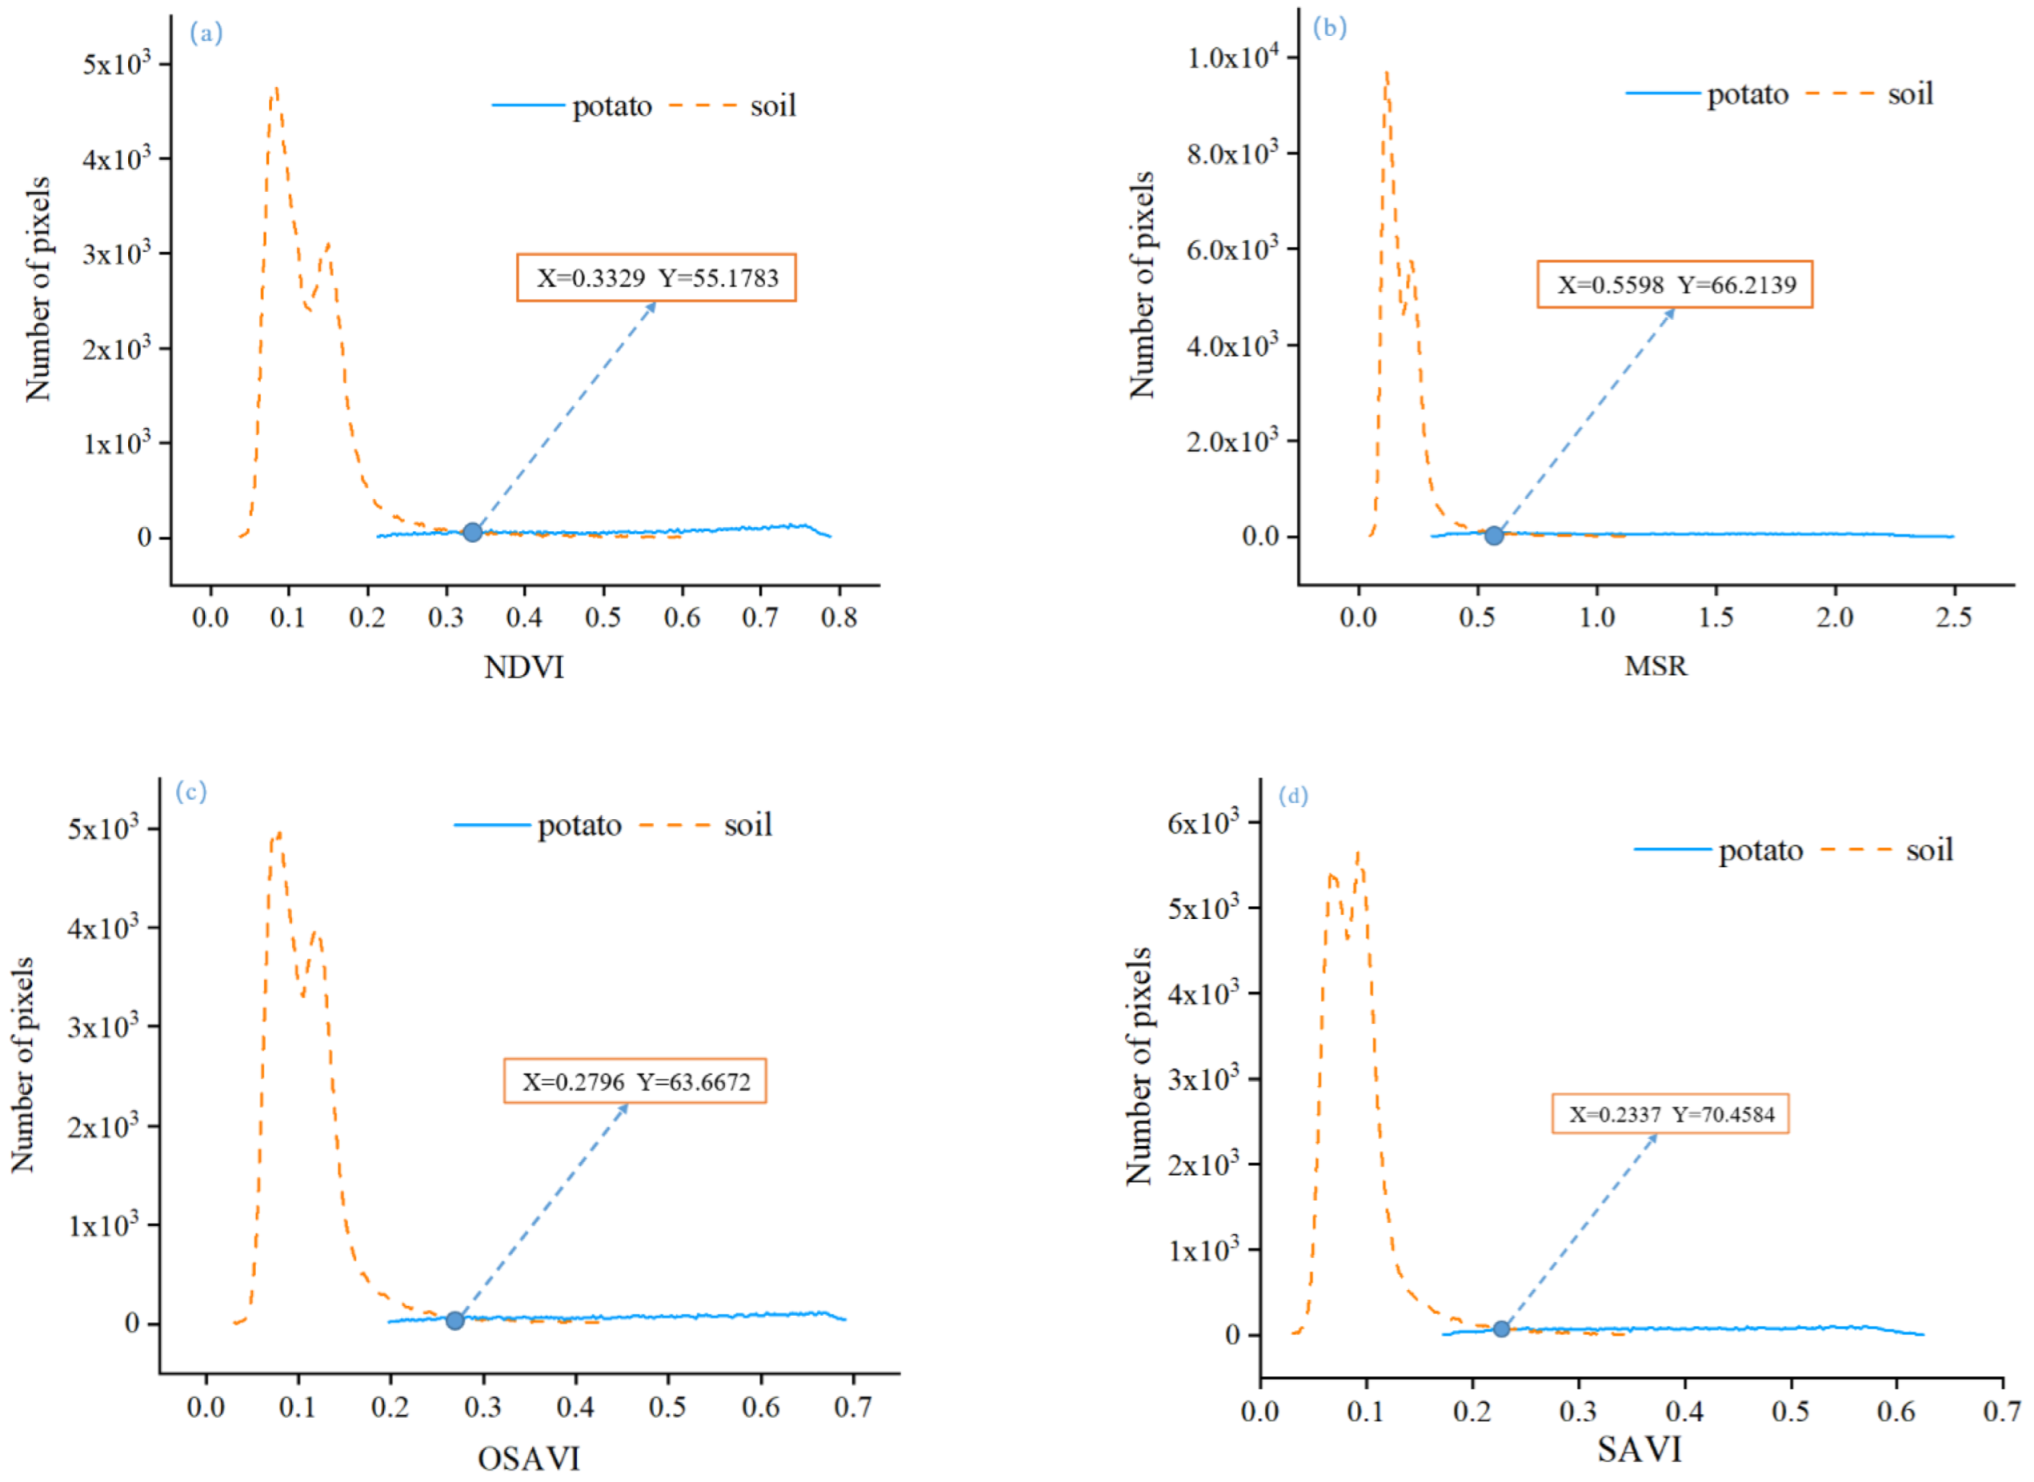
3.1. Estimation of FVC with the Combination of SVM and GMM Thresholding Method

It was confirmed that the experimental field objects conform to a gaussian mixture distribution in a certain band, and great classification accuracy was achieved based on the fixed threshold method [23]. However, the GMM threshold method needs to select a large number of samples for GMM fitting, which becomes time-consuming and leads to inaccuracy in the results. Thus, introducing SVM for sample selection can improve the accuracy and speed of the GMM threshold method; furthermore, the FVC of potato per unit area was calculated. The detailed process mainly included: First, the DOM on the 50th day after potato planting was divided into small areas (Figure 3A(a)). Then, we calculated the vegetation indices of the small area and performed SVM classification. GMM was applied to fit the classification results, and DOM classification thresholds were determined for the entire experimental field at 50 and 70 days after potato planting (Figure 3A(b)). Finally, the FVC of potato per unit area was calculated (Figure 3A(c)).

3.2. The Calculation of Vegetation Indices and Texture Features

The common VIs were calculated by the low reflectance of green plants in the red and blue bands and the high reflectance in the near-infrared band, and band operation was applied to expand the difference between the green vegetation and the background [5]. Commonly, multispectral VIs include NDVI [30], SAVI [31], OSAVI [32], MSR [33] and RVI [34]. Texture features include the commonly used mean, variance, homogeneity, contrast, dissimilarity, entropy, angular second moment and correlation extracted by a gray-level cooccurrence matrix [35]. A total of five vegetation indices and eight texture features were used for analysis to build the chlorophyll content estimation model for potato plants. Their detailed calculation formulas can be found in the corresponding literature.

3.3. RFE Feature Selection

Various potential covariates are available for chlorophyll content estimation, but all available covariates are applied, becoming time consuming and computationally expensive. Therefore, it is necessary to filter out important features prior to building the estimation models. Recursive feature elimination (RFE) was commonly used to select related covariate groups due to its simple and accurate features belonging to the backward selection algorithm, which eliminates the predictors from the model based on the initial predictor importance [36].

3.4. Fusion of VIs and Texture Features Based on Principal Component Analysis

Principal component analysis (PCA) is essentially a Box–Cox transformation, that is, a small number of features are used to describe the sample for reducing the features [37]. VIs and texture features that are significant correlated with chlorophyll content are fused by using PCA to build the chlorophyll content estimation model for potato plants, which we referred to as “PCA datasets”.

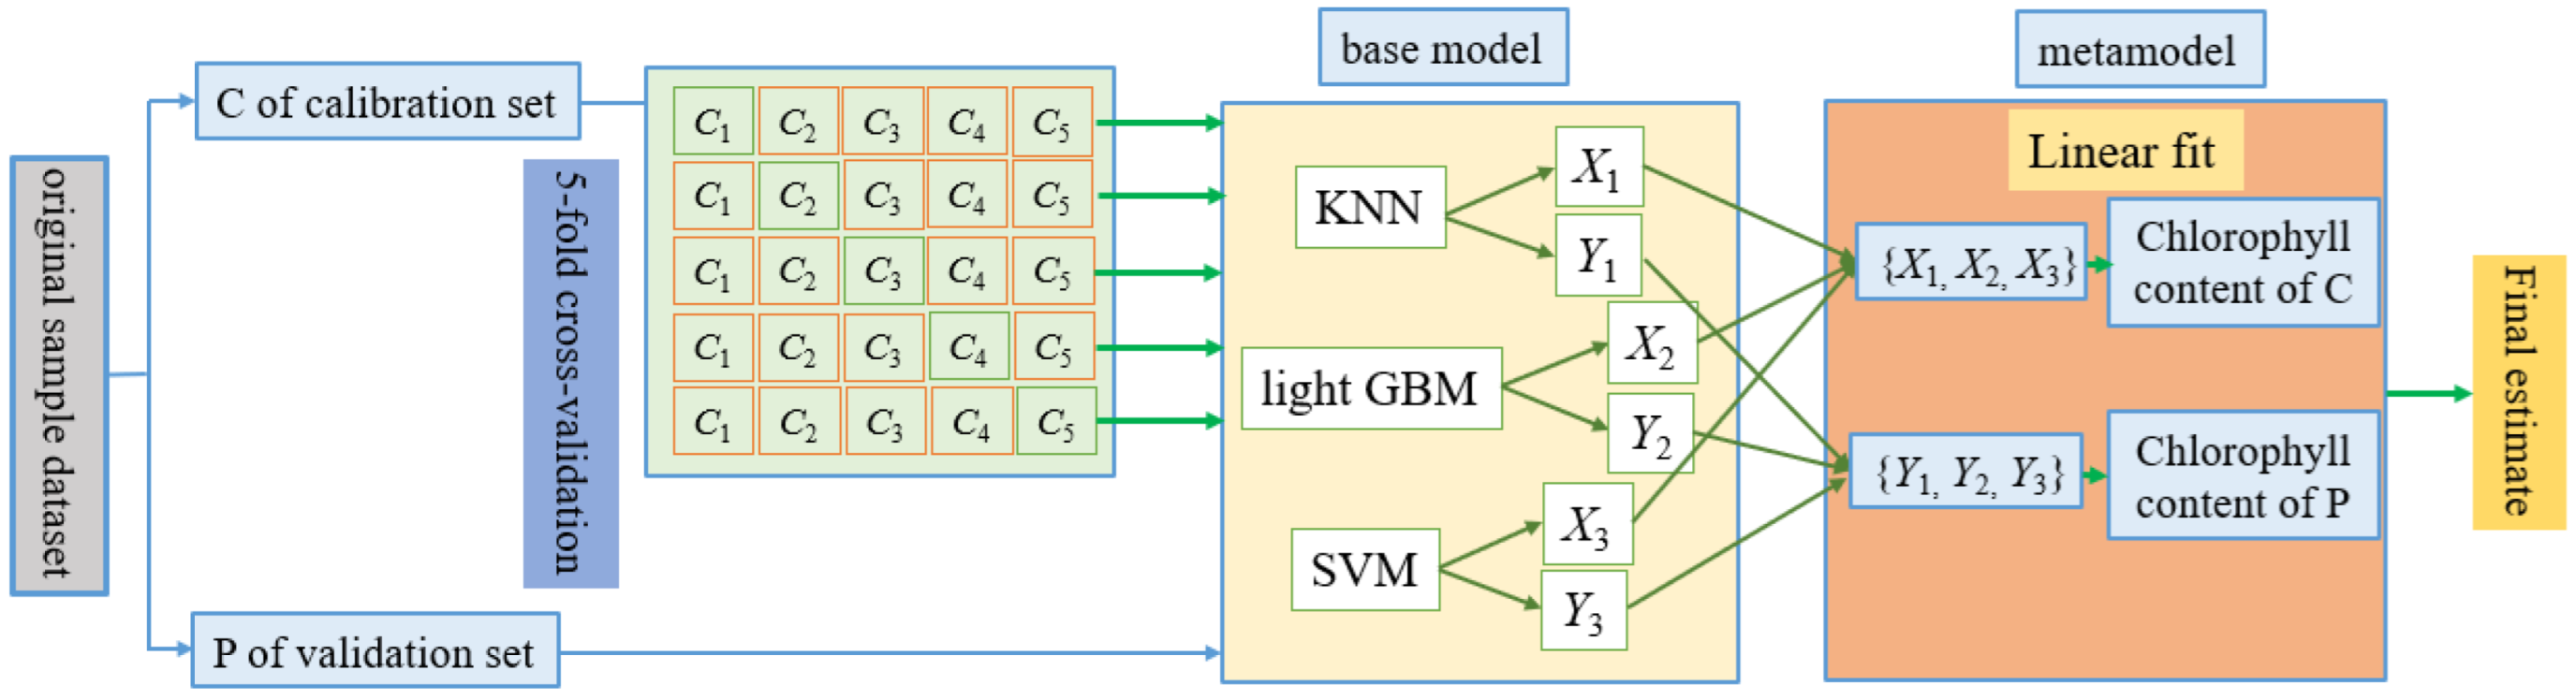
3.5. Estimation of the Chlorophyll Contents Using Machine-Learning Techniques

To precisely predict the chlorophyll contents of potato plants, the advanced machine learning regression algorithms KNN [38], light-GBM [39] and SVM [40] were applied to estimate the chlorophyll content of potato plants. At the same time, a stacking algorithm was constructed based on the above three algorithms to improve the estimation accuracy for the chlorophyll content. As shown in Figure 4, the modelling of stacking contained three parts: (1) We divided the samples into five subsets by using 5-fold cross-validation; selected a basic learner to build a model with the samples with C2, C3, C4, C5 as the training set; and predicted the samples in C1 and P, denoted as x1 and y1. (2) We repeated the above steps to obtain the predicted value X1 of the training sample C obtained by column merging of x1, x2, x3, x4 and x5; the predicted value Y1 of the validation sample P obtained by taking the mean of y1, y2, y3, y4 and y5. (3) We selected other base learners and repeated parts (1) and (2) to obtain X2, X3, Y2, Y3, etc., respectively. Group X included X1, X2 and X3 and group Y included Y1, Y2 and Y3. X and Y were used as the training set and the validation set, respectively. The chlorophyll content of C and the chlorophyll content of P were used as output features, and the metamodel was applied to generate the final results for the chlorophyll content estimates for potato plants. To evaluate the application potential of the four algorithms, VIs, texture features and FVC were applied to estimate the chlorophyll content, and measurements were used to evaluate the model performance.

3.6. Statistical Analysis

Statistical analyses were carried out on the data acquired from potato experiments to estimate the chlorophyll content of potato plants. ENVI software (Exelis, Inc., Boulder, CO, USA) was used to calculate the vegetation indices and select the region of interest (ROI) for the potato plant and statistic information from the vegetation indices of the experimental plot. Python 3.6 libraries (Scikit-Learn package) were used to implement RFE feature selection and the chlorophyll content estimation algorithm.

4. Results

4.1. The Estimation Results of FVC for Potato Plants

Due to the limitations in manual selection of a large number of samples, it is of great significance to introduce a machine learning algorithm to extract the classification threshold with the GMM threshold method. Twenty ROI of soil and plant samples were selected for SVM classification, then the gaussian distribution of potato plants and soil VIs were counted within a 7.5 m × 7.5 m area, respectively. As shown in Figure 5, NDVI, MSR, OSAVI, SAVI fit gaussian mixture distributions with corresponding classification thresholds of 0.3329, 0.5598, 0.2796, 0.2337, respectively, while considering RVI, it had two thresholds that were not applicable for the determination of classification thresholds.
A total of 125 soil and potato plant samples were selected separately, following the 5-point sampling method, to evaluate classification results based on the confusion matrix. As shown in Table 3 and Table 4, the threshold value of 50 days after potato planting determined by the combination of the SVM and GMM threshold methods could better estimate the FVC of potato after 50 and 70 days of potato planting. The four VIs could estimate the FVC of potato plants with high precision and efficiency; in comparison, SAVI had the highest classification accuracy, followed by OSAVI, MSR and NDVI. Then, the ratio of the number of potato plant pixels to the number of all pixels in the area of 26 × 26 pixels was calculated, and furthermore, the FVC of the potato plants was estimated, and the FVC estimated by SAVI was used as an input to establish a model for estimating the chlorophyll content of potato plants

4.2. Response of Leaf Chlorophyll Content to N Application Rate in Potato Plants

Only the chlorophyll content of the third leaf at the bottom of the canopy was significantly different (p < 0.05). As shown in Figure 6a, 50 days after the planting of the potato plants, with the increase in N fertilizer application, the chlorophyll content of potato plant leaves showed an increasing trend. The leaf position exhibited significant differences, and response law of the chlorophyll content to N fertilizer application 70 days after the planting of the potato plants was the same as 50 days after the planting of the potato plants (Figure 6b). In contrast, the chlorophyll content for the potato plants decreased at 70 days after the planting of the potato plants. According to the leaf position exhibiting significant differences, the chlorophyll content for the third leaf at the bottom of the canopy was regarded as the output for building models.

4.3. The Results of Feature Selection

When considering VIs, the screening results of the RFE algorithm showed MSR had the highest contribution rate, followed by RVI, NDVI, OSAVI and SAVI. Many features led to redundant models, and VIs with importance higher than 0.14 were selected (Figure 7a). Compared with the VIs, there were a total of 40 texture features, which cannot be displayed in full, and texture features with importance higher than 0.050 were selected (Figure 7b). Finally, three VIs, including MSR, RVI and NDVI; three texture features, including corr-NIR, corr-Red-edge and hom-NIR, were selected to establish the model for estimating the chlorophyll content of the potato plants.

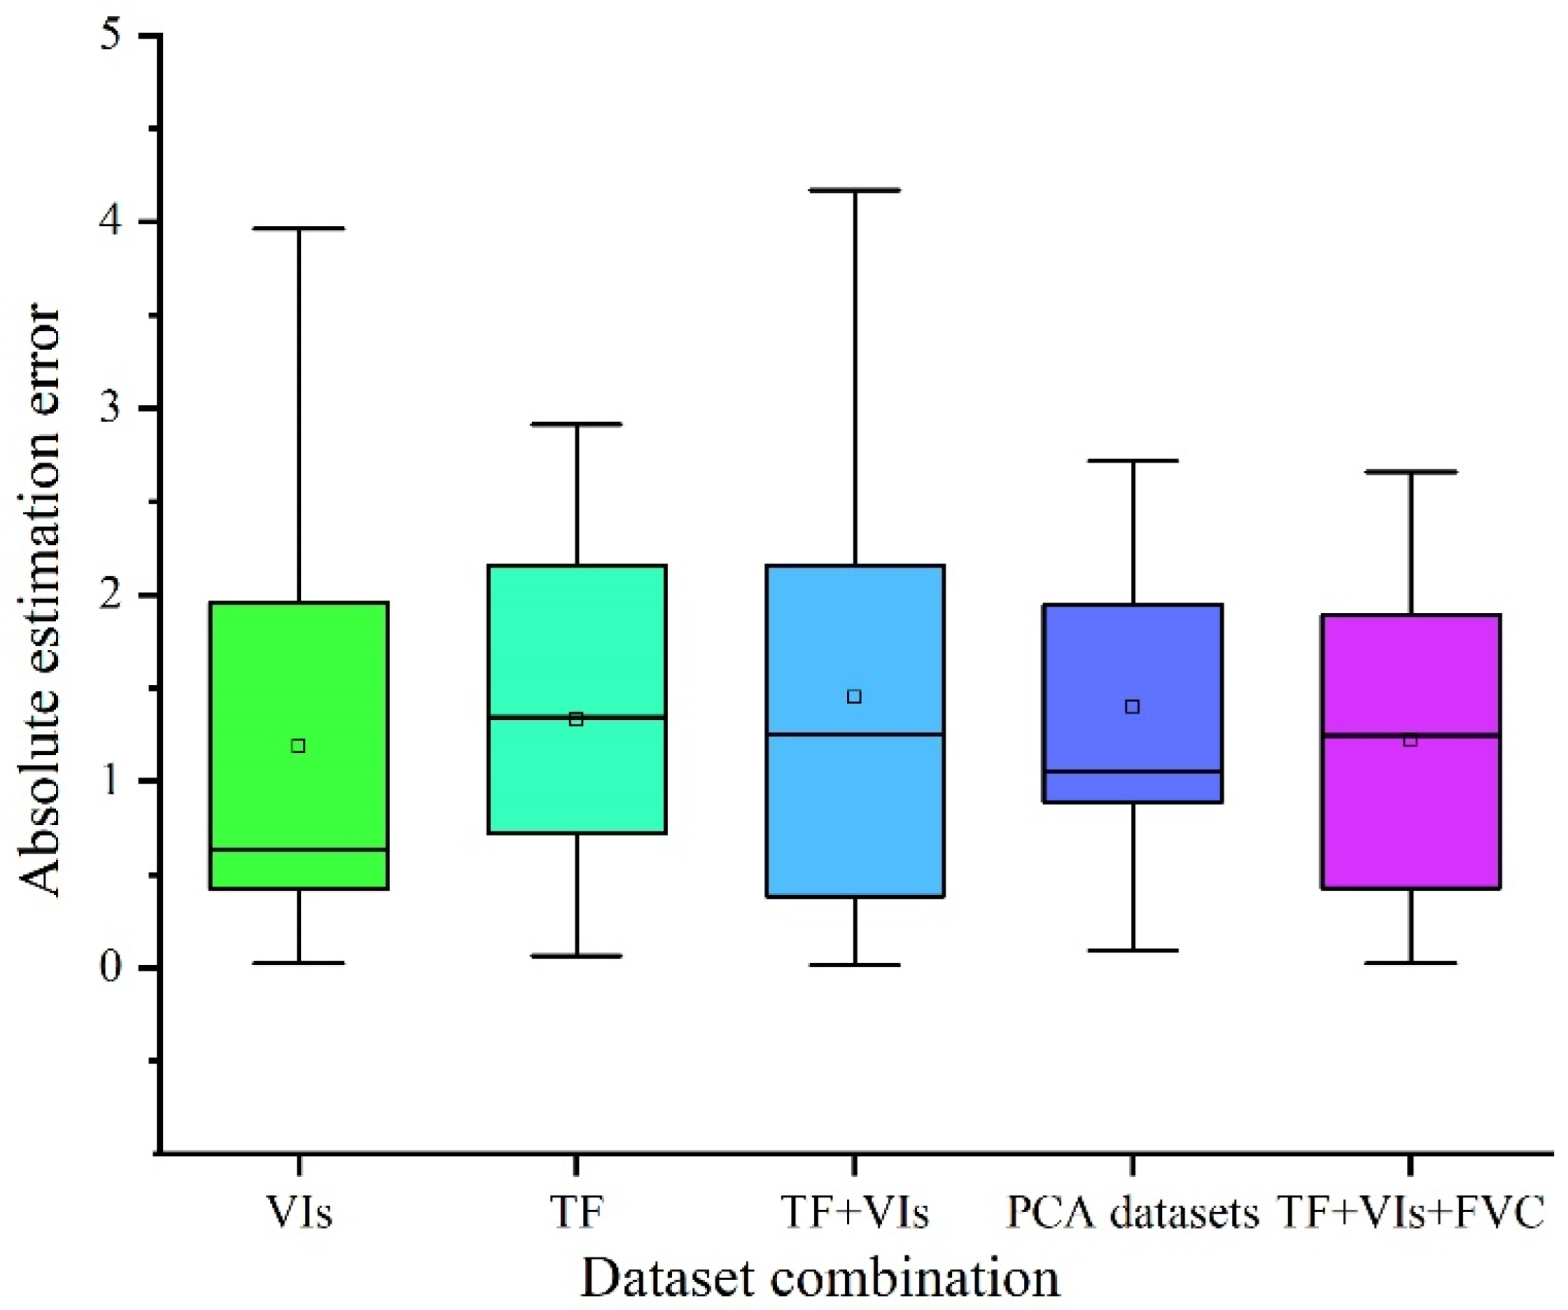
4.4. Performance of Different Chlorophyll Content Regression Models

A total of 120 measured chlorophyll content samples were selected through outlier analysis; among them, we randomly selected 72 samples as the training sample and the other 48 as the test sample. In this study, three VIs after RFE screening, MSR, RVI and NDVI, derived from UAV multispectral imagery, were used to establish regression models for potato chlorophyll content estimation. As shown in Table 4, stacking had the highest correlations with an R2 value of 0.672 and an RMSE value of 0.573, followed by light-GBM, and SVM. However, the lowest correlations were observed by using KNN, with R2 values no less than 0.5 and RMSE values more than 0.7. When it came to texture features, light-GBM had the highest correlations with an R2 value of 0.670 and an RMSE value of 0.574, followed by SVM, stacking and KNN. After estimating chlorophyll content by using VIs or texture features alone, four machine learning regression analyses were adopted based on both VIs and texture features. When texture features and VIs were combined, the highest model accuracy obtained by stacking was improved with an R2 value increase of 0.022 and 0.024 and an RMSE value decrease of 0.02 and 0.021, compared with the estimation model established by VIs alone and texture features alone, respectively. However, compared with the estimation model established by the combination of texture features and VIs, the accuracy of the model based on the fusion of texture features and VIs executed with the PCA algorithm actually decreased. When FVC was added, the performance of the chlorophyll content estimation accuracy further improved, with an R2 value of 0.739 and an RMSE value of 0.261. In addition, as shown in Figure 8, the estimates of the chlorophyll content with VIs+texture features+FVC, based on stacking were closest to the chlorophyll measurement.

5. Discussion

The rapid advances in UAV remote sensing technology have boosted the development of the estimation of crop growth information [15,41]. Generally, The UAV multi-spectral remote sensing platform is a compromise because it takes into account the spectral information of the image and the price of the sensor and was proven to achieve better chlorophyll content estimation accuracy [42]. FVC, an important indicator of agroecosystems, usually provides guidance for field management, such as fertilization [24] and irrigation [23]. Two methods are commonly used to estimate the FVC of crops, namely, machine learning and threshold-based methods [23]. Among them, machine learning needs to select a large number of samples for training [43,44] within large-scale crops and is highly influenced by human sample selection. Threshold-based methods have the advantage of being simple, efficient and accurate and, therefore, have successful application in crop FVC estimation based on UAV remote sensing imagery [17]. Threshold is the key to ensure the accuracy of FVC estimation. Otsu’s method is a commonly used technique for determining thresholds and has been widely used in crop classification [45]. However, this method regularly produces under-segmentation in some circumstances [46]. Moreover, the resolution of UAV multispectral remote sensing images is low, which is not suitable for the use of Otsu’s method. Another method widely used to determine the threshold is the GMM threshold method, which assumes features follow GMM on one color feature, and the intersection of the GMM is taken as the classification threshold, and it achieves great FVC estimation results [23]. However, the GMM threshold method also needs suitable samples to determine the classification threshold and only relying on manual sample selection reduces the efficiency of the algorithm. Combining machine learning with the GMM threshold method can quickly estimate FVC and produce higher estimation accuracy (Table 3 and Table 4). Interestingly, the combination of the SVM and GMM methods obtained higher accuracy in measuring FVC 50 days after potato planting. The main reason for this phenomenon is that the spectrum of the canopy changed after 70 days of potato planting, and the shaded part of the field increased, resulting in lower accuracy for FVC estimation. The same phenomenon was also found in the study of [47]. Chlorophyll content was shown to be significantly related to nitrogen concentration [48,49]. Therefore, chlorophyll can be used as a diagnostic indicator of nitrogen stress for nitrogen fertilizer management [50]. When potato plants are under nitrogen stress, due to the strong ability of cell division in the top and middle leaves of the potato plant canopy, most of the nitrogen is supplied to the growth of its upper leaves, resulting in a lower nitrogen concentration in the new leaves at the bottom of the canopy. Therefore, the chlorophyll content of the new leaves at the bottom of the potato canopy is lower. This also explains the significant difference in the chlorophyll content of the third leaf at the bottom of the canopy (Figure 6), similar to that found in [51].
At present, various VIs based on the red-edge and near-infrared band were con-structed, and these VIs were proven to have potential to better monitor crop growth under certain conditions [20]. However, common VIs are greatly affected by the density of the crop canopy and tend to lose their sensitivity when the crop canopy exceeds a certain amount [25]. Texture features are a typical spatial feature that can reveal more regional structural details but are mostly used in forest structure estimation models; a few are used in the estimation of agricultural physical and chemical parameters [21]. Compared with other vegetation indices, NDVI had a higher contribution in the estimation of chlorophyll content (Figure 7a), which was similar to the study in [10]. This study also found the texture features extracted from the near-infrared band and the red-edge band have a higher contribution after RFE screening (Figure 7b). The chlorophyll content estimation model of potato plants based on texture features produced similar accuracy to VIs (Table 5). Therefore, the texture feature is proven as an effective parameter to estimate the chlorophyll content of potato plants. Furthermore, both VIs and texture features can further improve the estimation accuracy of chlorophyll content over using VIs or texture features alone due to the diversity of the information space. In addition, canopy structure was shown to influence the performance of crop chlorophyll content estimates. However, existing studies rarely consider FVC when establishing chlorophyll estimation models, resulting in low model stability. Among all the algorithms in this study, adding FVC can better improve the prediction accuracy of the chlorophyll content. Considering with [52], better chlorophyll content accuracy was obtained under similar nitrogen application control with an R2 value of 0.77. However, the UAV hyperspectral system used in [52] had the disadvantage of expensive and complex data processing, which was not suitable for most scientific researchers.
It is imperative to employ appropriate estimation methods to correlate the extracted features with crop chlorophyll content. A single machine learning model often has the disadvantage of poor generalization performance due to individual plant differences and the canopy changes with the seasons. Some scholars have proposed a stacking method that integrates multiple weak predictors into a strong predictor to complete high-precision prediction tasks, and studies have shown that integrating multiple single machine learning models can effectively improve the estimation accuracy, especially the ensemble learning model based on the stacking strategy. Currently, although the ensemble learning model based on the stacking algorithm is widely used in the fields of machine vision and natural language processing, the ensemble learning model based on the stacking strategy has not yet explored the application in the chlorophyll content of potatoes. In this study, the stacking based estimation of chlorophyll content in potato plants produced higher accuracy, with an R2 value of 0.739 and an RMSR value of 0.511, than other three algorithms. Therefore, the stacking algorithm has great advantages in the estimation of potato chlorophyll content.

6. Conclusions

UAV multispectral imagery was demonstrated to have great application potential for accurate, rapid and economic chlorophyll content estimation. Our results confirmed that the combination of the SVM and GMM threshold methods can effectively estimate the FVC of potato, and SAVI had the highest accuracy among the selected VIs. Three VIs, including MSR, RVI and NDVI, and three texture features, including corr-NIR, corr-red-edge and hom-NIR, had greater contributions to the estimation of the chlorophyll content based on RFE screening. In five sample sets, VIs+texture features+FVC had the highest estimation accuracy based on the stacking algorithm with R2 value of 0.739 and RMSR value of 0.511, followed by VIs+texture features based on the stacking algorithm with an R2 value of 0.694 and an RMSR value of 0.553, VIs based on the stacking algorithm with an R2 value of 0.672 and an RMSR value of 0.573, texture features based on light-GBM with an R2 value of 0.670 and an RMSR value of 0.574, and PCA datasets based on SVM with an R2 value of 0.669 and an RMSR value of 0.575. Therefore, the ensemble learning algorithm constructed in this paper has great potential to produce high chlorophyll estimation accuracy in potato plants. Furthermore, texture features and FVC contain spatial information and structural information on crops, respectively, thus, when two features are added, the estimation accuracy of the chlorophyll content in potato plants can be better improved.

Author Contributions

Data curation, H.Y., Z.Z., K.Z. and T.G.; funding acquisition, Y.H.; investigation, H.Y.; methodology, H.Y. and J.C.; project administration, Y.H.; validation, Y.H., J.C., Z.Z. and Y.Q.; writing—original draft, H.Y.; writing—review and editing, Y.H., Z.Z., Y.Q., K.Z. and J.C. All authors have read and agreed to the published version of the manuscript.

Funding

This study was supported by the National Natural Science Foundation of China (C0043619, C0043628).

Institutional Review Board Statement

Not applicable.

Informed Consent Statement

Not applicable.

Data Availability Statement

Not applicable.

Acknowledgments

We are grateful to Xiaofeng Cao, Peng Zhang, Zhanghao Qu and Shaoxiang Wang for data collection.

Conflicts of Interest

The authors declare that they have no conflict of interest in this research.

References

  1. Zhang, H.; Fen, X.; Yu, W.; Hu, H.; Dai, X. Progress of potato staple food research and industry development in China. J. Integr. Agric. 2017, 16, 2924–2932. [Google Scholar] [CrossRef]
  2. Jia, J.; Yang, D.; Li, J.; Yang, L. Research and Comparative Analysis about Potato Production Situation between China and Continents in the World. Agric. Eng. 2011, 1, 84–86. [Google Scholar]
  3. Wang, L.; Chen, S.; Peng, Z.; Huang, J.; Wang, C.; Jiang, H.; Zheng, Q.; Li, D. Phenology Effects on Physically Based Estimation of Paddy Rice Canopy Traits from UAV Hyperspectral Imagery. Remote Sens. 2021, 13, 1792. [Google Scholar] [CrossRef]
  4. Ye, H.; Huang, W.; Huang, S.; Cui, B.; Jin, Y. Recognition of Banana Fusarium Wilt Based on UAV Remote Sensing. Remote Sens. 2020, 12, 938. [Google Scholar] [CrossRef]
  5. Gu, O.Y.; Wang, H.; Wu, Z.; Wang, S.; Fu, Y. Modified Red Blue Vegetation Index for Chlorophyll Estimation and Yield Prediction of Maize from Visible Images Captured by UAV. Sensors 2020, 20, 5055. [Google Scholar] [CrossRef]
  6. Rigon, J.P.G.; Capuani, S.; Fernandes, D.M.; Guimarães, T.M. A novel method for the estimation of soybean chlorophyll content using a smartphone and image analysis. Photosynthetica 2016, 54, 559–566. [Google Scholar] [CrossRef]
  7. Fernandes, F.M.; Soratto, R.P.; Fernandes, A.M.; Souza, E. Chlorophyll meter–based leaf nitrogen status to manage nitrogen in tropical potato production. Agron. J. 2021, 113, 1733–1746. [Google Scholar] [CrossRef]
  8. Widjaja Putra, B.T.; Soni, P. Enhanced broadband greenness in assessing Chlorophyll a and b, Carotenoid, and Nitrogen in Robusta coffee plantations using a digital camera. Precis. Agric. 2018, 19, 238–256. [Google Scholar] [CrossRef]
  9. Gupta, S.D.; Pattanayak, A.K. Intelligent image analysis (IIA) using artificial neural network (ANN) for non-invasive estimation of chlorophyll content in micropropagated plants of potato. In Vitro Cell. Dev. Biol. Plant 2017, 53, 520–526. [Google Scholar] [CrossRef]
  10. Sims, D.A.; Gamon, J.A. Relationships between leaf pigment content and spectral reflectance across a wide range of species, leaf structures and developmental stages. Remote Sens. Environ. 2002, 81, 337–354. [Google Scholar] [CrossRef]
  11. Blackburn, G.A. Quantifying Chlorophylls and Caroteniods at Leaf and Canopy Scales: An Evaluation of Some Hyperspectral Approaches. Remote Sens. Environ. 1998, 66, 273–285. [Google Scholar] [CrossRef]
  12. Yin, H.; Li, F.; Yang, H.; Li, Y. Estimation of canopy chlorophyll in potato based on UAV hyperspectral images. J. Plant Nutr. Fertil. 2021, 27, 2184–2195. [Google Scholar]
  13. Li, C.; Chen, P.; Ma, C.; Feng, H.; Wei, F.; Wang, Y.; Shi, J.; Cui, Y. Estimation of potato chlorophyll content using composite hyperspectral index parameters collected by an unmanned aerial vehicle. Int. J. Remote Sens. 2020, 41, 8176–8197. [Google Scholar] [CrossRef]
  14. Zhuo, W.; Wu, N.; Shi, R.; Wang, Z. UAV Mapping of the Chlorophyll Content in a Tidal Flat Wetland Using a Combination of Spectral and Frequency Indices. Remote Sens. 2022, 14, 827. [Google Scholar] [CrossRef]
  15. Shu, M.; Zuo, J.; Shen, M.; Yin, P.; Wang, M.; Yang, X.; Tang, J.; Li, B.; Ma, Y. Improving the estimation accuracy of SPAD values for maize leaves by removing UAV hyperspectral image backgrounds. Int. J. Remote Sens. 2021, 42, 5862–5881. [Google Scholar] [CrossRef]
  16. Guo, Y.; Yin, G.; Sun, H.; Wang, H.; Chen, S.; Senthilnath, J.; Wang, J.; Fu, Y. Scaling effects on chlorophyll content estimations with RGB camera mounted on a UAV platform using machine-learning methods. Sensors 2020, 20, 5130. [Google Scholar] [CrossRef]
  17. Jay, S.; Baret, F.; Dutartre, D.; Malatesta, G.; Héno, S.; Comar, A.; Weiss, M.; Maupas, F. Exploiting the centimeter resolution of UAV multispectral imagery to improve remote-sensing estimates of canopy structure and biochemistry in sugar beet crops. Remote Sens. Environ. 2018, 231, 110898. [Google Scholar] [CrossRef]
  18. Mao, Z.; Deng, L.; Sun, J.; Zhang, A.; Chen, X.; Zhao, Y. Research on the application of UAV multispectral remote sensing in the maize chlorophyll prediction. Spectrosc. Spectr. Anal. 2018, 38, 2923–2931. [Google Scholar]
  19. Singhal, G.; Bansod, B.S.; Mathew, L.; Goswami, J.; Raju, P. Comparison of Parametric and Non-Parametric Methods for Chlorophyll Estimation based on High Resolution UAV Imagery. Curr. Sci. 2019, 117, 1874–1879. [Google Scholar] [CrossRef]
  20. Yue, J.; Feng, H.; Tian, Q.; Zhou, C. A robust spectral angle index for remotely assessing soybean canopy chlorophyll content in different growing stages. Plant Methods 2020, 16, 104. [Google Scholar] [CrossRef]
  21. Chen, P.; Feng, H.; Li, C.; Yang, G.; Yang, J.; Yang, W.; Liu, S. Estimation of chlorophyll content in potato using fusion of texture and spectral features derived from UAV multispectral image. Trans. Chin. Soc. Agric. Eng. 2019, 35, 63–74. [Google Scholar]
  22. Purevdorj, T.; Tateishi, R.; Ishiyama, T.; Honda, Y. Relationships between percent vegetation cover and vegetation indices. Int. J. Remote Sens. 1998, 19, 3519–3535. [Google Scholar] [CrossRef]
  23. Niu, Y.; Han, W.; Zhang, H.; Zhang, L.; Chen, H. Estimating fractional vegetation cover of maize under water stress from UAV multispectral imagery using machine learning algorithms. Comput. Electron. Agric. 2021, 189, 106414. [Google Scholar] [CrossRef]
  24. Zhang, D.; Mansaray, L.R.; Jin, H.; Han, S.; Kuang, Z.; Huang, J. A universal estimation model of fractional vegetation cover for different crops based on time series digital photographs. Comput. Electron. Agric. 2018, 151, 93–103. [Google Scholar] [CrossRef]
  25. Qiao, L.; Tang, W.; Gao, D.; Zhao, R.; Song, D. UAV-based chlorophyll content estimation by evaluating vegetation index responses under different crop coverages. Comput. Electron. Agric. 2022, 196, 106775. [Google Scholar] [CrossRef]
  26. Tang, X.G.; Song, K.S.; Liu, D.W.; Wang, Z.M.; Wang, Y.D. Comparison of Methods for Estimating Soybean Chlorophyll Content Based on Visual/Near Infrared Reflection Spectra. Spectrosc. Spectr. Anal. 2011, 31, 371–374. [Google Scholar]
  27. Zhang, S.; Zhao, G.; Lang, K.; Su, B.; Zhang, H. Integrated Satellite, Unmanned Aerial Vehicle (UAV) and Ground Inversion of the SPAD of Winter Wheat in the Reviving Stage. Sensors 2019, 19, 1485. [Google Scholar] [CrossRef]
  28. Li, G.; Han, W.; Huang, S.; Ma, W.; Ma, Q.; Cui, X. Extraction of Sunflower Lodging Information Based on UAV Multi-Spectral Remote Sensing and Deep Learning. Remote Sens. 2021, 13, 2721. [Google Scholar] [CrossRef]
  29. González-Jaramillo, V.; Fries, A.; Bendix, J. AGB Estimation in a Tropical Mountain Forest (TMF) by Means of RGB and Multispectral Images Using an Unmanned Aerial Vehicle (UAV). Remote Sens. 2019, 11, 1413. [Google Scholar] [CrossRef]
  30. Li, F.; Miao, Y.; Feng, G.; Yuan, F.; Yue, S.; Gao, X.; Liu, Y.; Liu, B.; Ustin, S.L.; Chen, X. Improving estimation of summer maize nitrogen status with red edge-based spectral vegetation indices. Field Crops Res. 2014, 157, 111–123. [Google Scholar] [CrossRef]
  31. Huete, A.R. A soil-adjusted vegetation index (SAVI). Remote Sens. Environ. 1988, 25, 295–309. [Google Scholar] [CrossRef]
  32. Wan, L.; Cen, H.; Zhu, J.; Li, Y.; Zhu, Y.; Li, Y.; Zhu, Y.; Sun, D.; Weng, H.; He, Y. Combining UAV-based vegetation indices, canopy height and canopy coverage to improve rice yield prediction under different nitrogen levels. In Proceedings of the 2019 ASABE Annual International Meeting, Boston, MA, USA, 7–10 July 2019. [Google Scholar]
  33. Chen, J.M. Evaluation of Vegetation Indices and a Modified Simple Ratio for Boreal Applications. Can. J. Remote Sens. 1996, 22, 229–242. [Google Scholar] [CrossRef]
  34. He, Y.; Peng, J.; Liu, F.; Zhang, C.; Kong, W. Critical review of fast detection of crop nutrient and physiological information with spectral and imaging technology. Trans. Chin. Soc. Agric. Eng. 2015, 31, 174–189. [Google Scholar]
  35. Haralick, R.M.; Shanmugam, K.; Dinstein, I. Textural Features for Image Classification. IEEE Trans. Syst. Man Cybern. 1973, SMC-3, 610–621. [Google Scholar] [CrossRef]
  36. Gomes, L.C.; Faria, R.M.; De Souza, E.; Veloso, G.V.; Schaefer, C.E.G.R.; Filho, E.I.F. Modelling and mapping soil organic carbon stocks in Brazil. Geoderma 2019, 340, 337–350. [Google Scholar] [CrossRef]
  37. Stamate, D.; Katrinecz, A.; Stahl, D.; Verhagen, S.; Guloksuz, S. Identifying psychosis spectrum disorder from experience sampling data using machine learning approaches. Schizophr. Res. 2019, 209, 156–163. [Google Scholar] [CrossRef]
  38. Pue, J.D.; Botula, Y.D.; Nguyen, P.M.; Meirvenne, M.V.; Cornelis, W.M. Introducing a Kriging-based Gaussian Process approach in pedotransfer functions: Evaluation for the prediction of soil water retention with temperate and tropical datasets. J. Hydrol. 2020, 597, 125770. [Google Scholar] [CrossRef]
  39. Chami, S.; Tavakolian, K. In Comparative Study of Light-GBM and LSTM for Early Prediction of Sepsis from Clinical Data. In Proceedings of the 2019 Computing in Cardiology Conference, Singapore, 8–11 September 2019. [Google Scholar]
  40. Wang, C.; Wang, S.; He, X.; Wu, L.; Guo, J. Combination of spectra and texture data of hyperspectral imaging for prediction and visualization of palmitic acid and oleic acid contents in lamb meat. Meat Sci. 2020, 169, 108194. [Google Scholar] [CrossRef]
  41. Sun, Q.; Gu, X.; Chen, L.; Xu, X.; Wei, Z.; Pan, Y.; Gao, Y. Monitoring maize canopy chlorophyll density under lodging stress based on UAV hyperspectral imagery. Comput. Electron. Agric. 2022, 193, 106671. [Google Scholar] [CrossRef]
  42. Qiao, L.; Gao, D.; Zhang, J.; Li, M.; Sun, H.; Ma, J. Dynamic influence elimination and chlorophyll content diagnosis of maize using UAV spectral imagery. Remote Sens. 2020, 12, 2650. [Google Scholar] [CrossRef]
  43. Zhao, M.; Jha, A.; Liu, Q.; Millis, B.A.; Mahadevan-Jansen, A.; Lu, L.; Landman, B.A.; Tyska, M.J.; Huo, Y. Faster Mean-shift: GPU-accelerated clustering for cosine embedding-based cell segmentation and tracking. Med. Image Anal. 2021, 71, 102048. [Google Scholar] [CrossRef] [PubMed]
  44. Zhao, M.; Liu, Q.; Jha, A.; Deng, R.; Yao, T.; Mahadevan-Jansen, A.; Tyska, M.J.; Millis, B.A.; Huo, Y. In VoxelEmbed: 3D instance segmentation and tracking with voxel embedding based deep learning. In International Workshop on Machine Learning in Medical Imaging; Springer: Berlin/Heidelberg, Germany, 2021; pp. 437–446. [Google Scholar]
  45. Guijarro, M.; Pajares, G.; Riomoros, I.; Herrera, P.; Burgos-Artizzu, X.; Ribeiro, A. Automatic segmentation of relevant textures in agricultural images. Comput. Electron. Agric. 2011, 75, 75–83. [Google Scholar] [CrossRef]
  46. Hamuda, E.; Glavin, M.; Jones, E. A survey of image processing techniques for plant extraction and segmentation in the field. Comput. Electron. Agric. 2016, 125, 184–199. [Google Scholar] [CrossRef]
  47. Yang, H.; Lan, Y.; Lu, L.; Gong, D.; Miao, J.; Zhao, J. New method for cotton fractional vegetation cover extraction based on UAV RGB images. Int. J. Agric. Biol. Eng. 2022, 15, 172–180. [Google Scholar] [CrossRef]
  48. Padilla, F.M.; Gallardo, M.; Peña-Fleitas, M.T.; De Souza, R.; Thompson, R.B. Proximal optical sensors for nitrogen management of vegetable crops: A review. Sensors 2018, 18, 2083. [Google Scholar] [CrossRef] [PubMed]
  49. Padilla, F.M.; Peña-Fleitas, M.T.; Gallardo, M.; Giménez, C.; Thompson, R.B. Derivation of sufficiency values of a chlorophyll meter to estimate cucumber nitrogen status and yield. Comput. Electron. Agric. 2017, 141, 54–64. [Google Scholar] [CrossRef]
  50. Zhao, B.; Ata-Ul-Karim, S.T.; Liu, Z.; Zhang, J.; Xiao, J.; Liu, Z.; Qin, A.; Ning, D.; Yang, Q.; Zhang, Y. Simple assessment of nitrogen nutrition index in summer maize by using chlorophyll meter readings. Front. Plant Sci. 2018, 9, 11. [Google Scholar] [CrossRef]
  51. Li, R.; Chen, J.; Qin, Y.; Fan, M. Possibility of using a SPAD chlorophyll meter to establish a normalized threshold index of nitrogen status in different potato cultivars. J. Plant Nutr. 2019, 42, 834–841. [Google Scholar] [CrossRef]
  52. Kanning, M.; Kühling, I.; Trautz, D.; Jarmer, T. High-resolution UAV-based hyperspectral imagery for LAI and chlorophyll estimations from wheat for yield prediction. Remote Sens. 2018, 10, 2000. [Google Scholar] [CrossRef] [Green Version]
Figure 1. Location and division of the research field based on N fertilizer rates: (a) location of the research field in China; (b) aerial view of research field indicating the control of N fertilizer rate, the location of the ground control points and sampling plots.
Agronomy 12 02318 g001
Figure 2. The location of the leaves measured for chlorophyll content. (a) The location of the leaves measured for chlorophyll content 50 days after potato planting; (b) The location of the leaves measured for chlorophyll content 70 days after potato planting. Note: ①, ② and ③ represent the first leaf, the second leaf and the third leaf at the top of the canopy, respectively; ④, ⑤ and ⑥ represent the first leaf, the second leaf and the third leaf at the bottom of canopy, respectively; ⑦, ⑧ and ⑨ represent the first leaf, the second leaf and the third leaf at the top of the canopy, respectively; ⑩, ⑪ and ⑫ represent the first leaf, the second leaf and the third leaf at the middle of the canopy, respectively; and ⑬, ⑭ and ⑮ represent the first leaf, the second leaf and the third leaf at the bottom of the canopy, respectively.
Agronomy 12 02318 g002
Figure 3. Process for (A): The estimation of FVC in potato plants from UAV multispectral imagery, and (B): The estimation of potato plant chlorophyll content.
Agronomy 12 02318 g003
Figure 4. The building process of the stacking learning model.
Agronomy 12 02318 g004
Figure 5. Threshold determination based on the combination of the SVM and GMM threshold methods. Thresholds were determined by using NDVI (a); MSR (b); OSAVI (c); SAVI (d).
Agronomy 12 02318 g005
Figure 6. The response of the chlorophyll content to the N application rate for potato plants at different growth stages. (a). The effect of the N application rate on chlorophyll content 50 days after the planting of the potatoes. (b). The effect of the N application rate on the chlorophyll content 70 days after the planting of the potatoes. Different letters represent significant differences (p < 0.05).
Agronomy 12 02318 g006
Figure 7. Feature screening results. (a) Importance ranking of VIs;(b) Importance ranking of texture features.
Agronomy 12 02318 g007
Figure 8. Distributions of the absolute estimation error of the chlorophyll content estimated by different sample combinations.
Agronomy 12 02318 g008
Table 1. Specific parameter list of mobilenetv2 network.
UAVCamera
ParametersValuesParametersValues
Product typeQuadcopterColor outputGlobal shutter and all spectral bands aligned
Longest flight time/min27Focal length/mm5.5
Maximum takeoff weight/kg6.140Field of view/(°)47.2
Operating temperature/°C−20–45Pixels1280 × 960
Digital communication distance/km7Wavelength/mm400–900
Maximum withstand wind speed (m/s)12Capture rate (time/s)1
Table 2. Explanation of abbreviations.
NomenclatureDefinition
UAVunmanned aerial vehicle
SVMsupport vector machines
GMMgaussian mixture model
FVCfractional vegetation cover
VIvegetation index
SAVIsoil-adjusted vegetation index
RFErecursive feature elimination
MSRmodified simple ratio
RVIratio vegetation index
NDVInormalized difference vegetation index
correlation-NIRcorrelation in NIR band
corr-Red-edgecorrelation in red-edge band
hom-NIRhomogeneity in NIR band
KNNK-Nearest Neighbor
light-GBMlight gradient boosting machine
OSAVIoptimized soil-adjusted vegetation index
PCAprincipal component analysis
ROIregion of interest
Table 3. Confusion matrix validation for FVC estimated based on a combination of SVM and GMM threshold classification 50 days after potato planting.
Vegetation IndexTypical ObjectsOverall Accuracy (%)Kappa CoefficientProducer Accuracy (%)User Accuracy (%)
MSRPotato plants99.670.9999.0598.92
soil99.7999.82
NDVIPotato plants99.640.9998.7699.01
soil99.8199.76
OSAVIPotato plants99.780.9999.3899.28
soil99.8699.88
SAVIPotato plants99.810.9999.6599.20
soil99.8599.93
Table 4. Confusion matrix validation for FVC estimated based on a combination of SVM and GMM threshold classification 70 days after potato planting.
Vegetation IndexTypical ObjectsOverall Accuracy (%)Kappa CoefficientProducer Accuracy (%)User Accuracy (%)
MSRPotato plants99.340.9899.8897.70
soil99.1499.96
NDVIPotato plants99.320.9899.9197.63
soil99.1199.97
OSAVIPotato plants99.490.9999.9098.21
soil99.3399.96
SAVIPotato plants99.660.9999.9098.84
soil99.5799.96
Table 5. Estimation results of chlorophyll content in potato plants with different sample combinations based on four above machine learning algorithms.
Regression AlgorithmsVIsTexture FeaturesVIs+Texture FeaturesPCA DatasetsVIs+Texture Features+FVC
Evaluation IndicatorsR2RMSER2RMSER2RMSER2RMSER2RMSE
KNN0.4850.7180.5810.6470.6420.5980.5470.6730.6720.573
light-GBM0.6370.6020.6700.5740.6370.6020.6080.6260.6950.552
SVM0.5790.6490.6160.6190.6770.5680.6690.5750.6890.558
Stacking0.6720.5730.5870.6420.6940.5530.6270.6110.7390.511
Publisher’s Note: MDPI stays neutral with regard to jurisdictional claims in published maps and institutional affiliations.

