
Compost Quality Indexes (CQIs) of Biosolids Using Physicochemical, Biological and Ecophysiological Indicators: C and N Mineralization Dynamics

 , , and
Abstract
:
1. Introduction
2. Material and Methods
2.1. Obtaining and Conditioning of BS, BM and Rice Husk Samples
2.2. Physicochemical Characterization of BS and BM
2.3. Experimental Design
2.4. Dynamics of C and N Mineralization in Composting Systems
2.4.1. Physicochemical Indicators
2.4.2. Biological Indicators
Enzyme Indicators
Microbiological and Ecophysiological Indicators
2.5. Statistical Analysis
2.6. Development of Compost Quality Indexes (CQIs)
3. Results and Discussion
3.1. Physicochemical Characterization of BS and BM
3.2. Dynamics of C and N Mineralization in Composting Systems
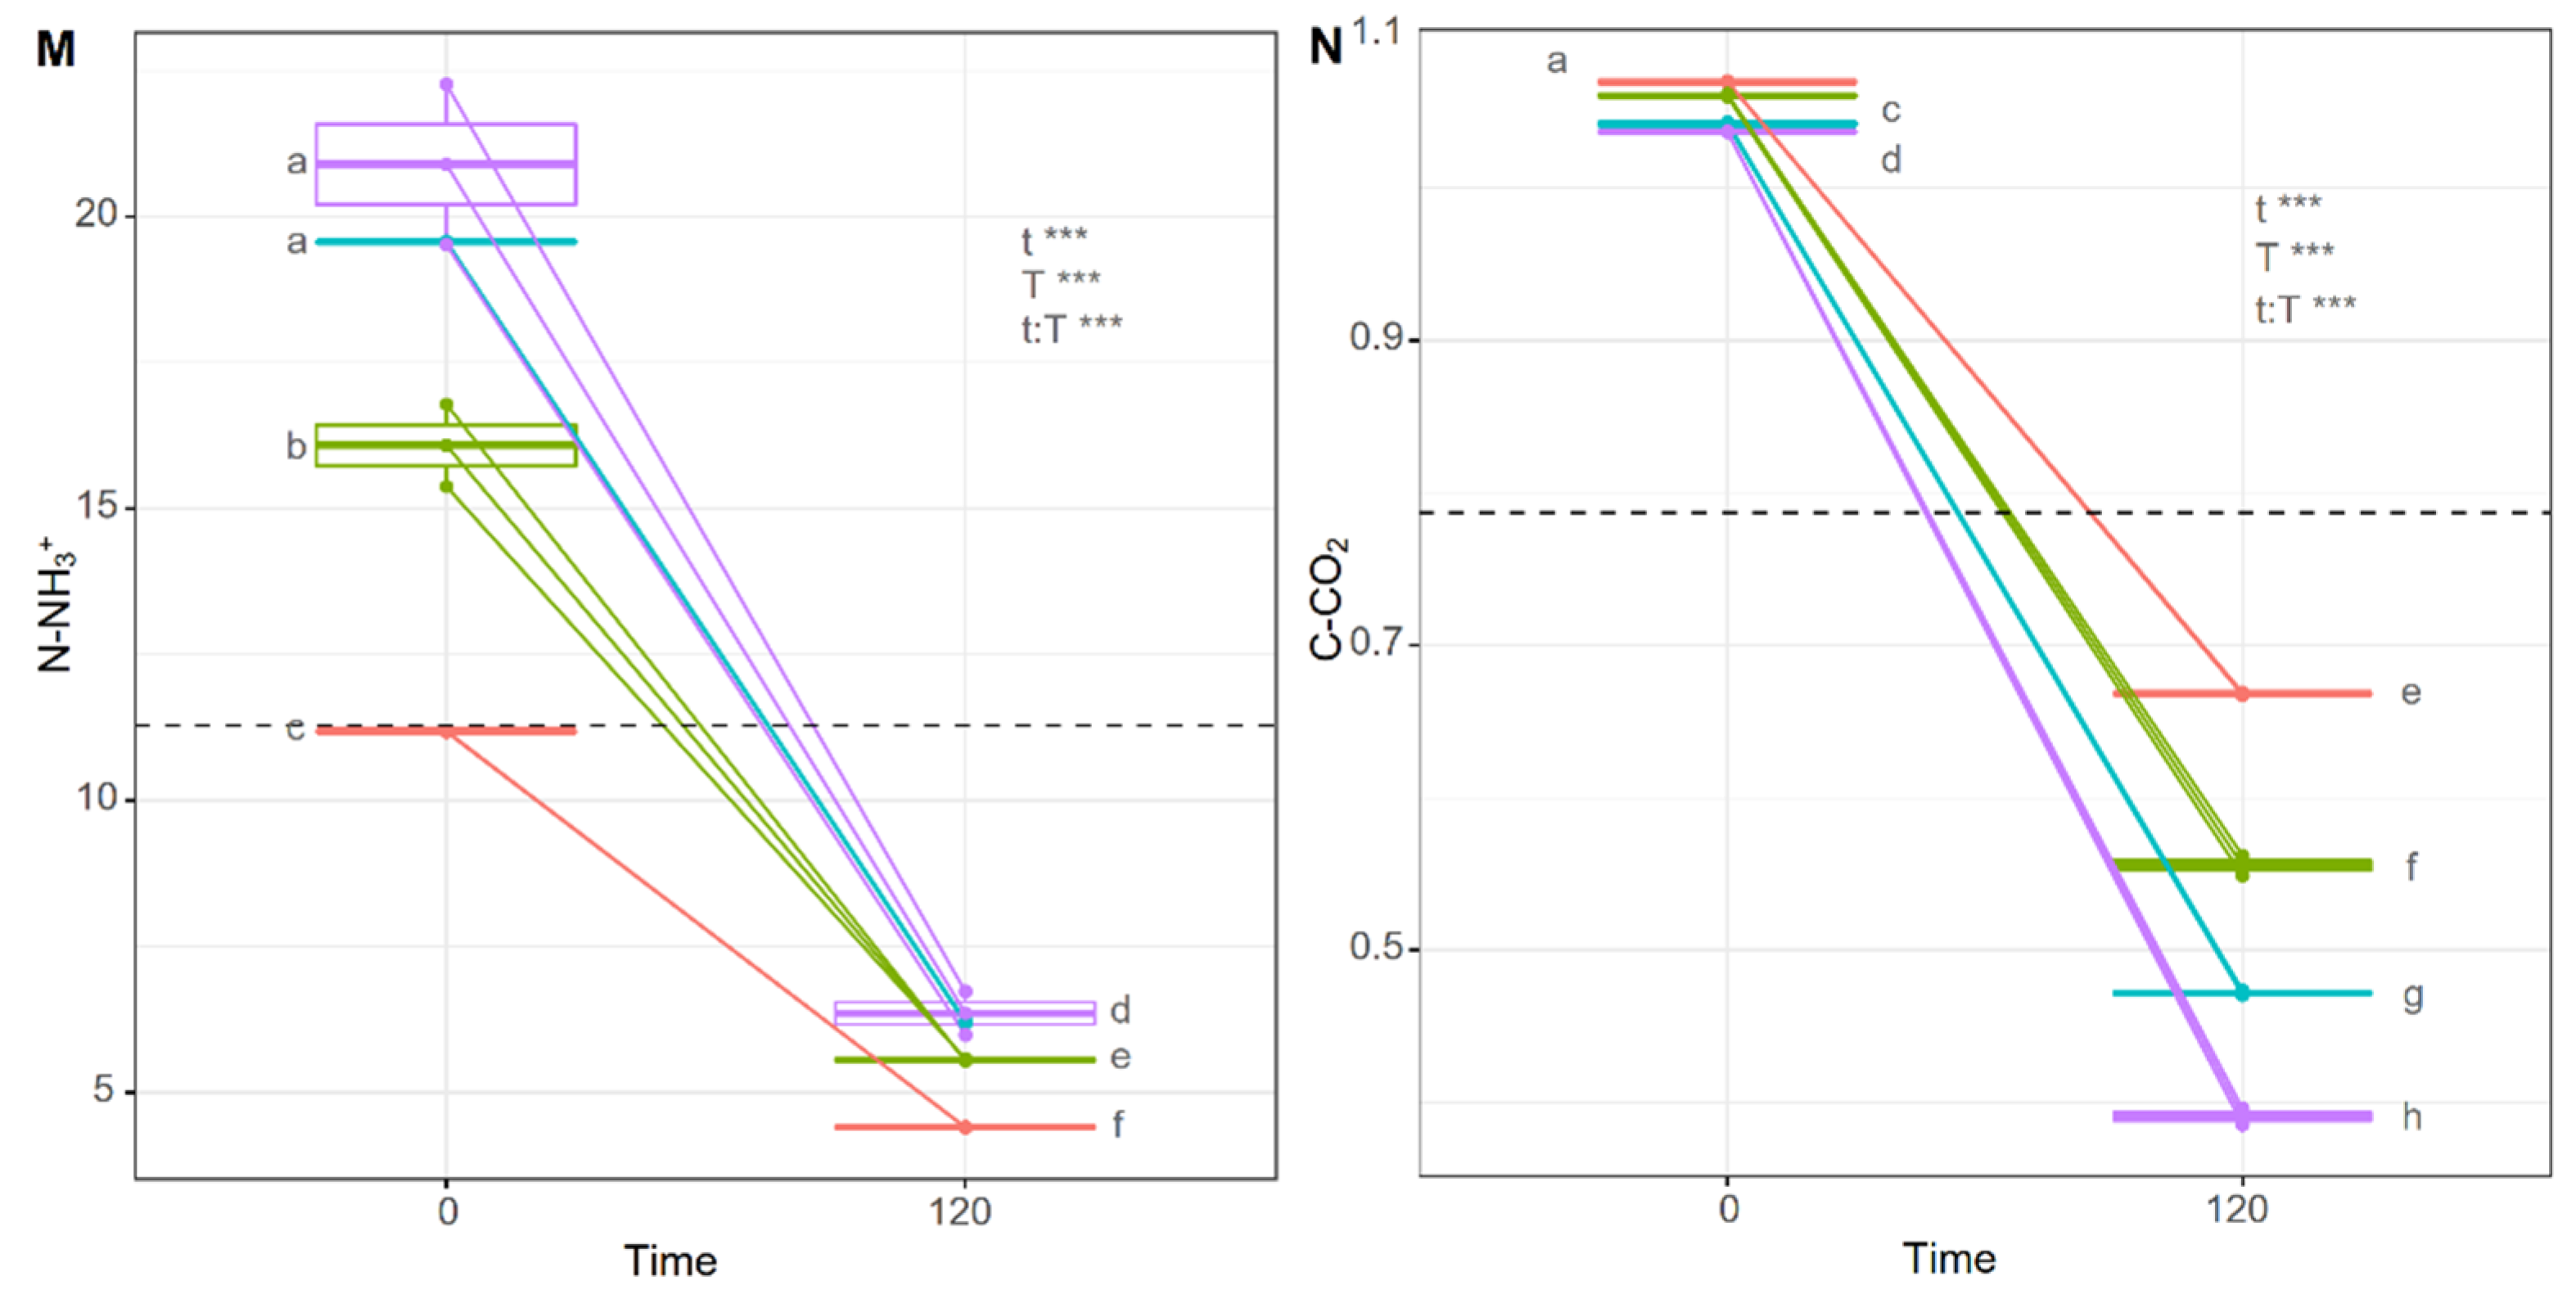
Physicochemical Indicators
3.3. Biological Characterization
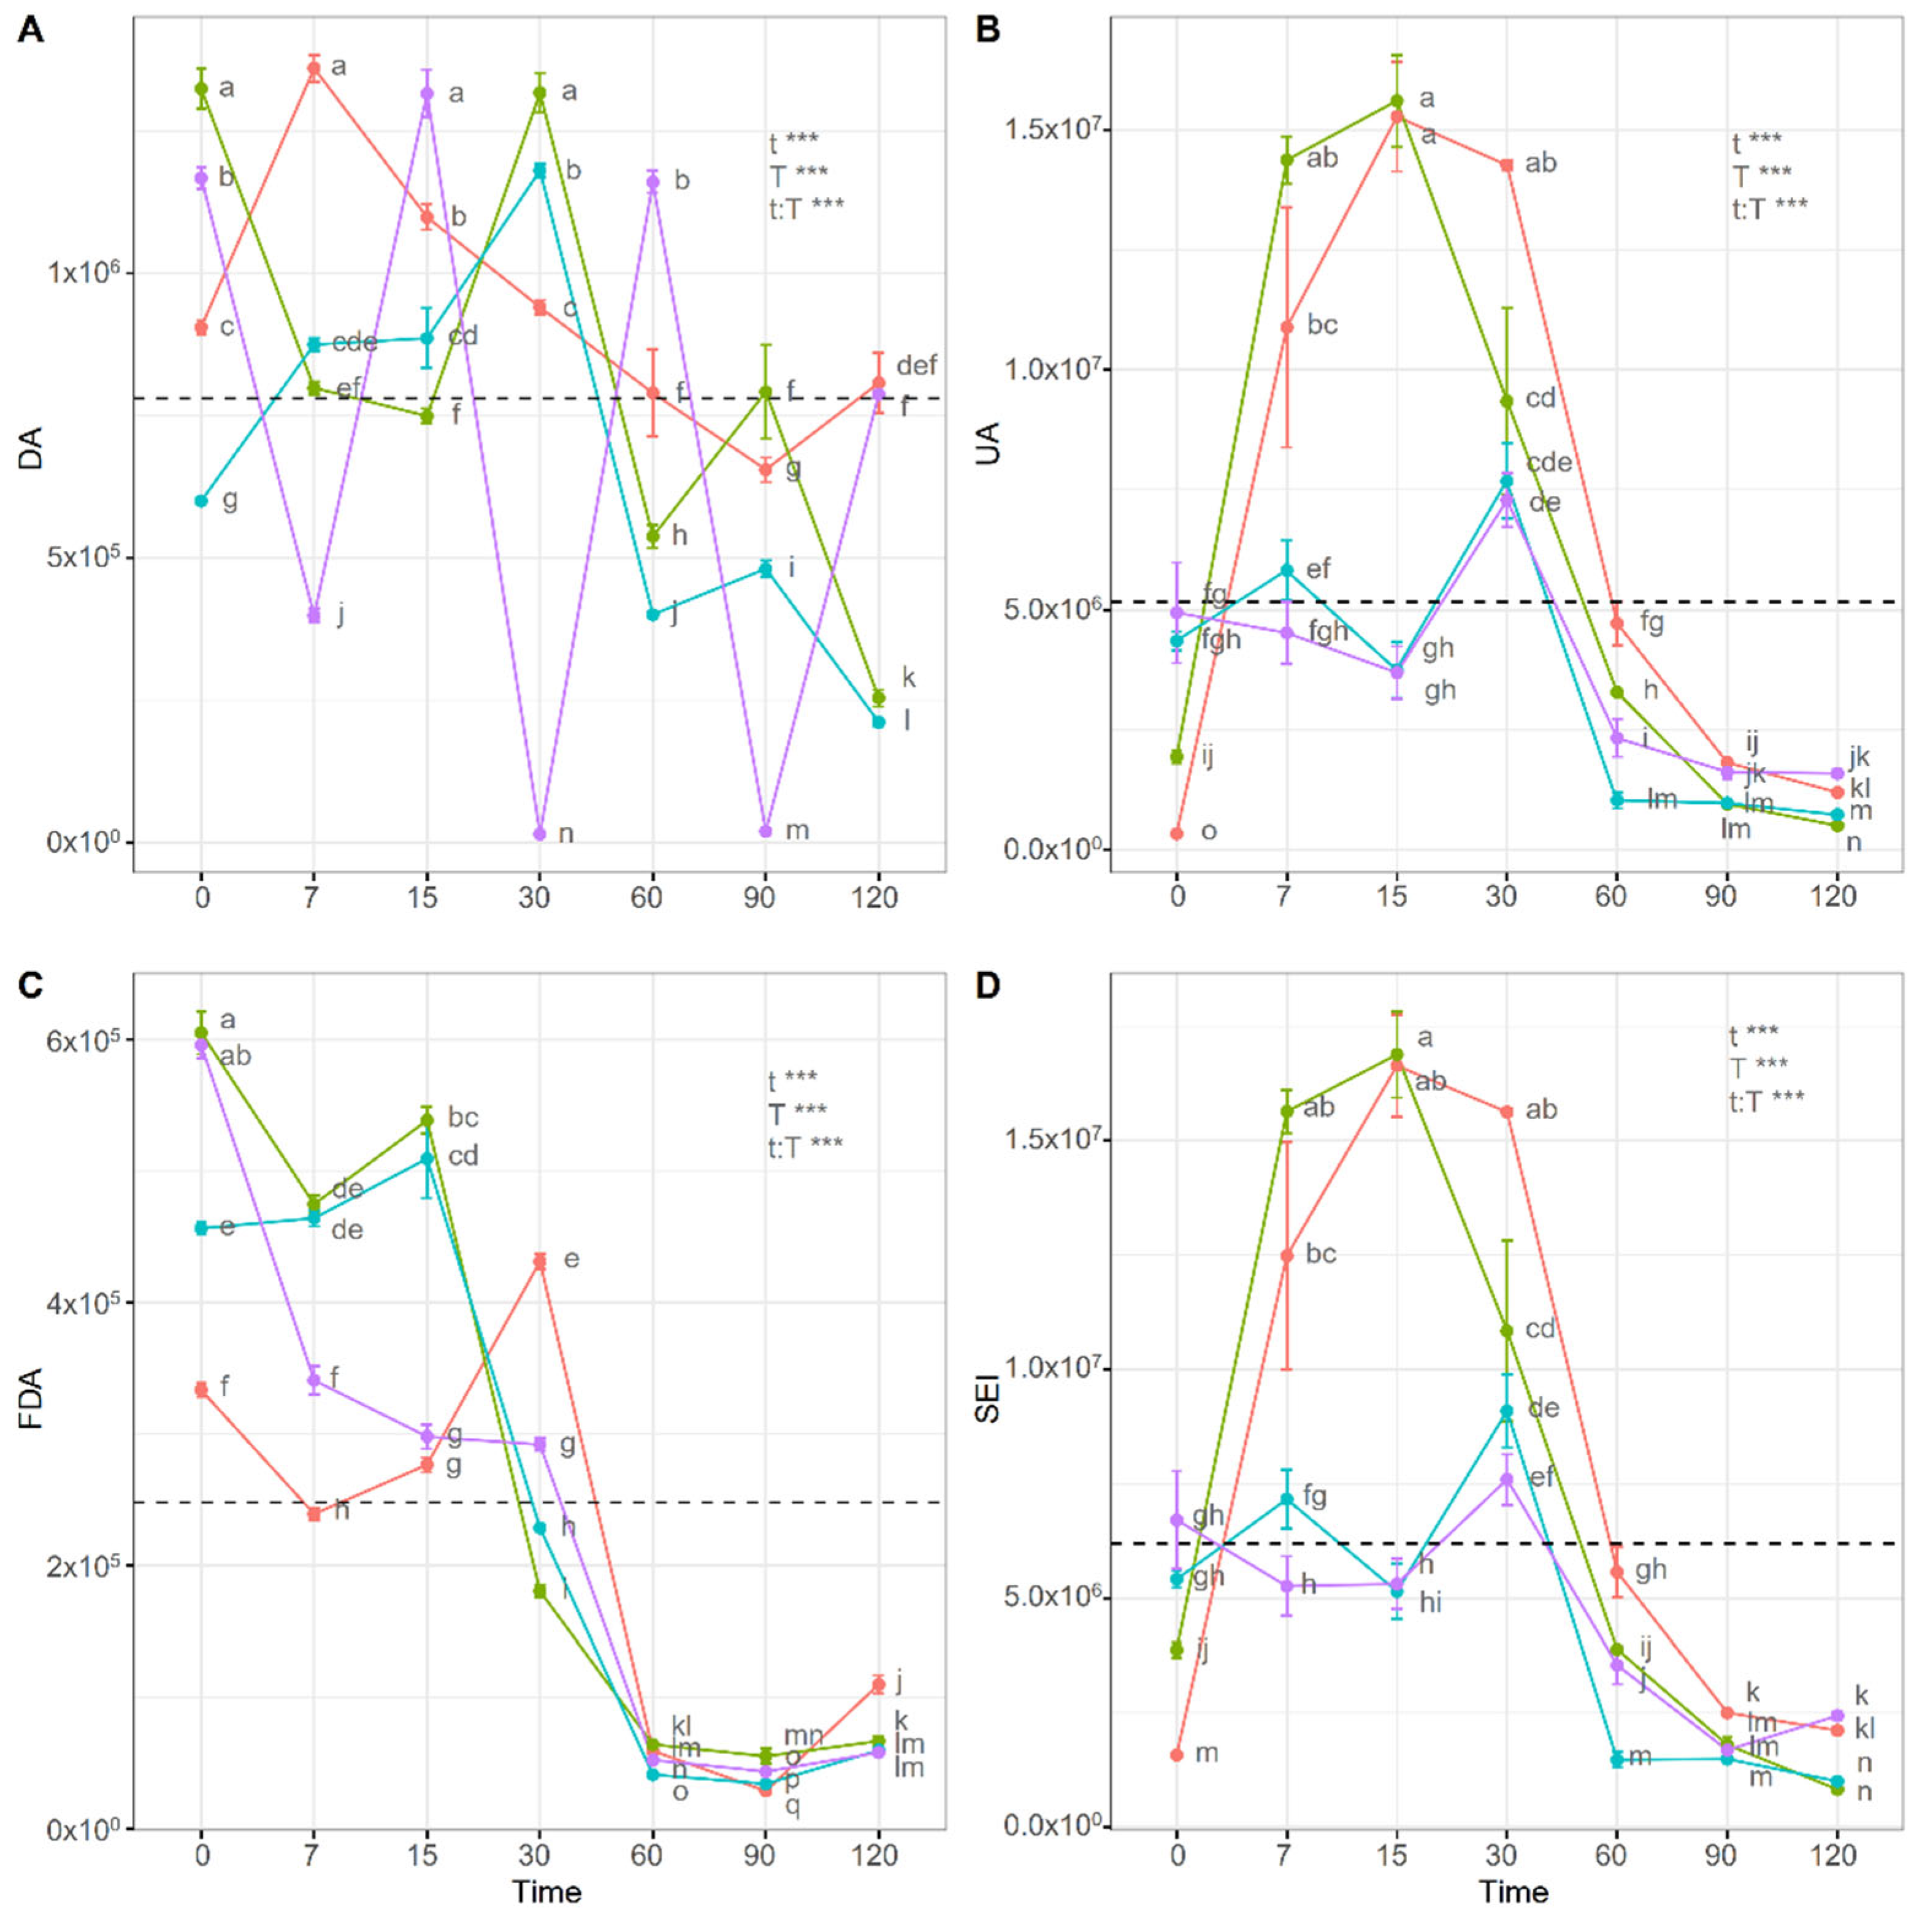
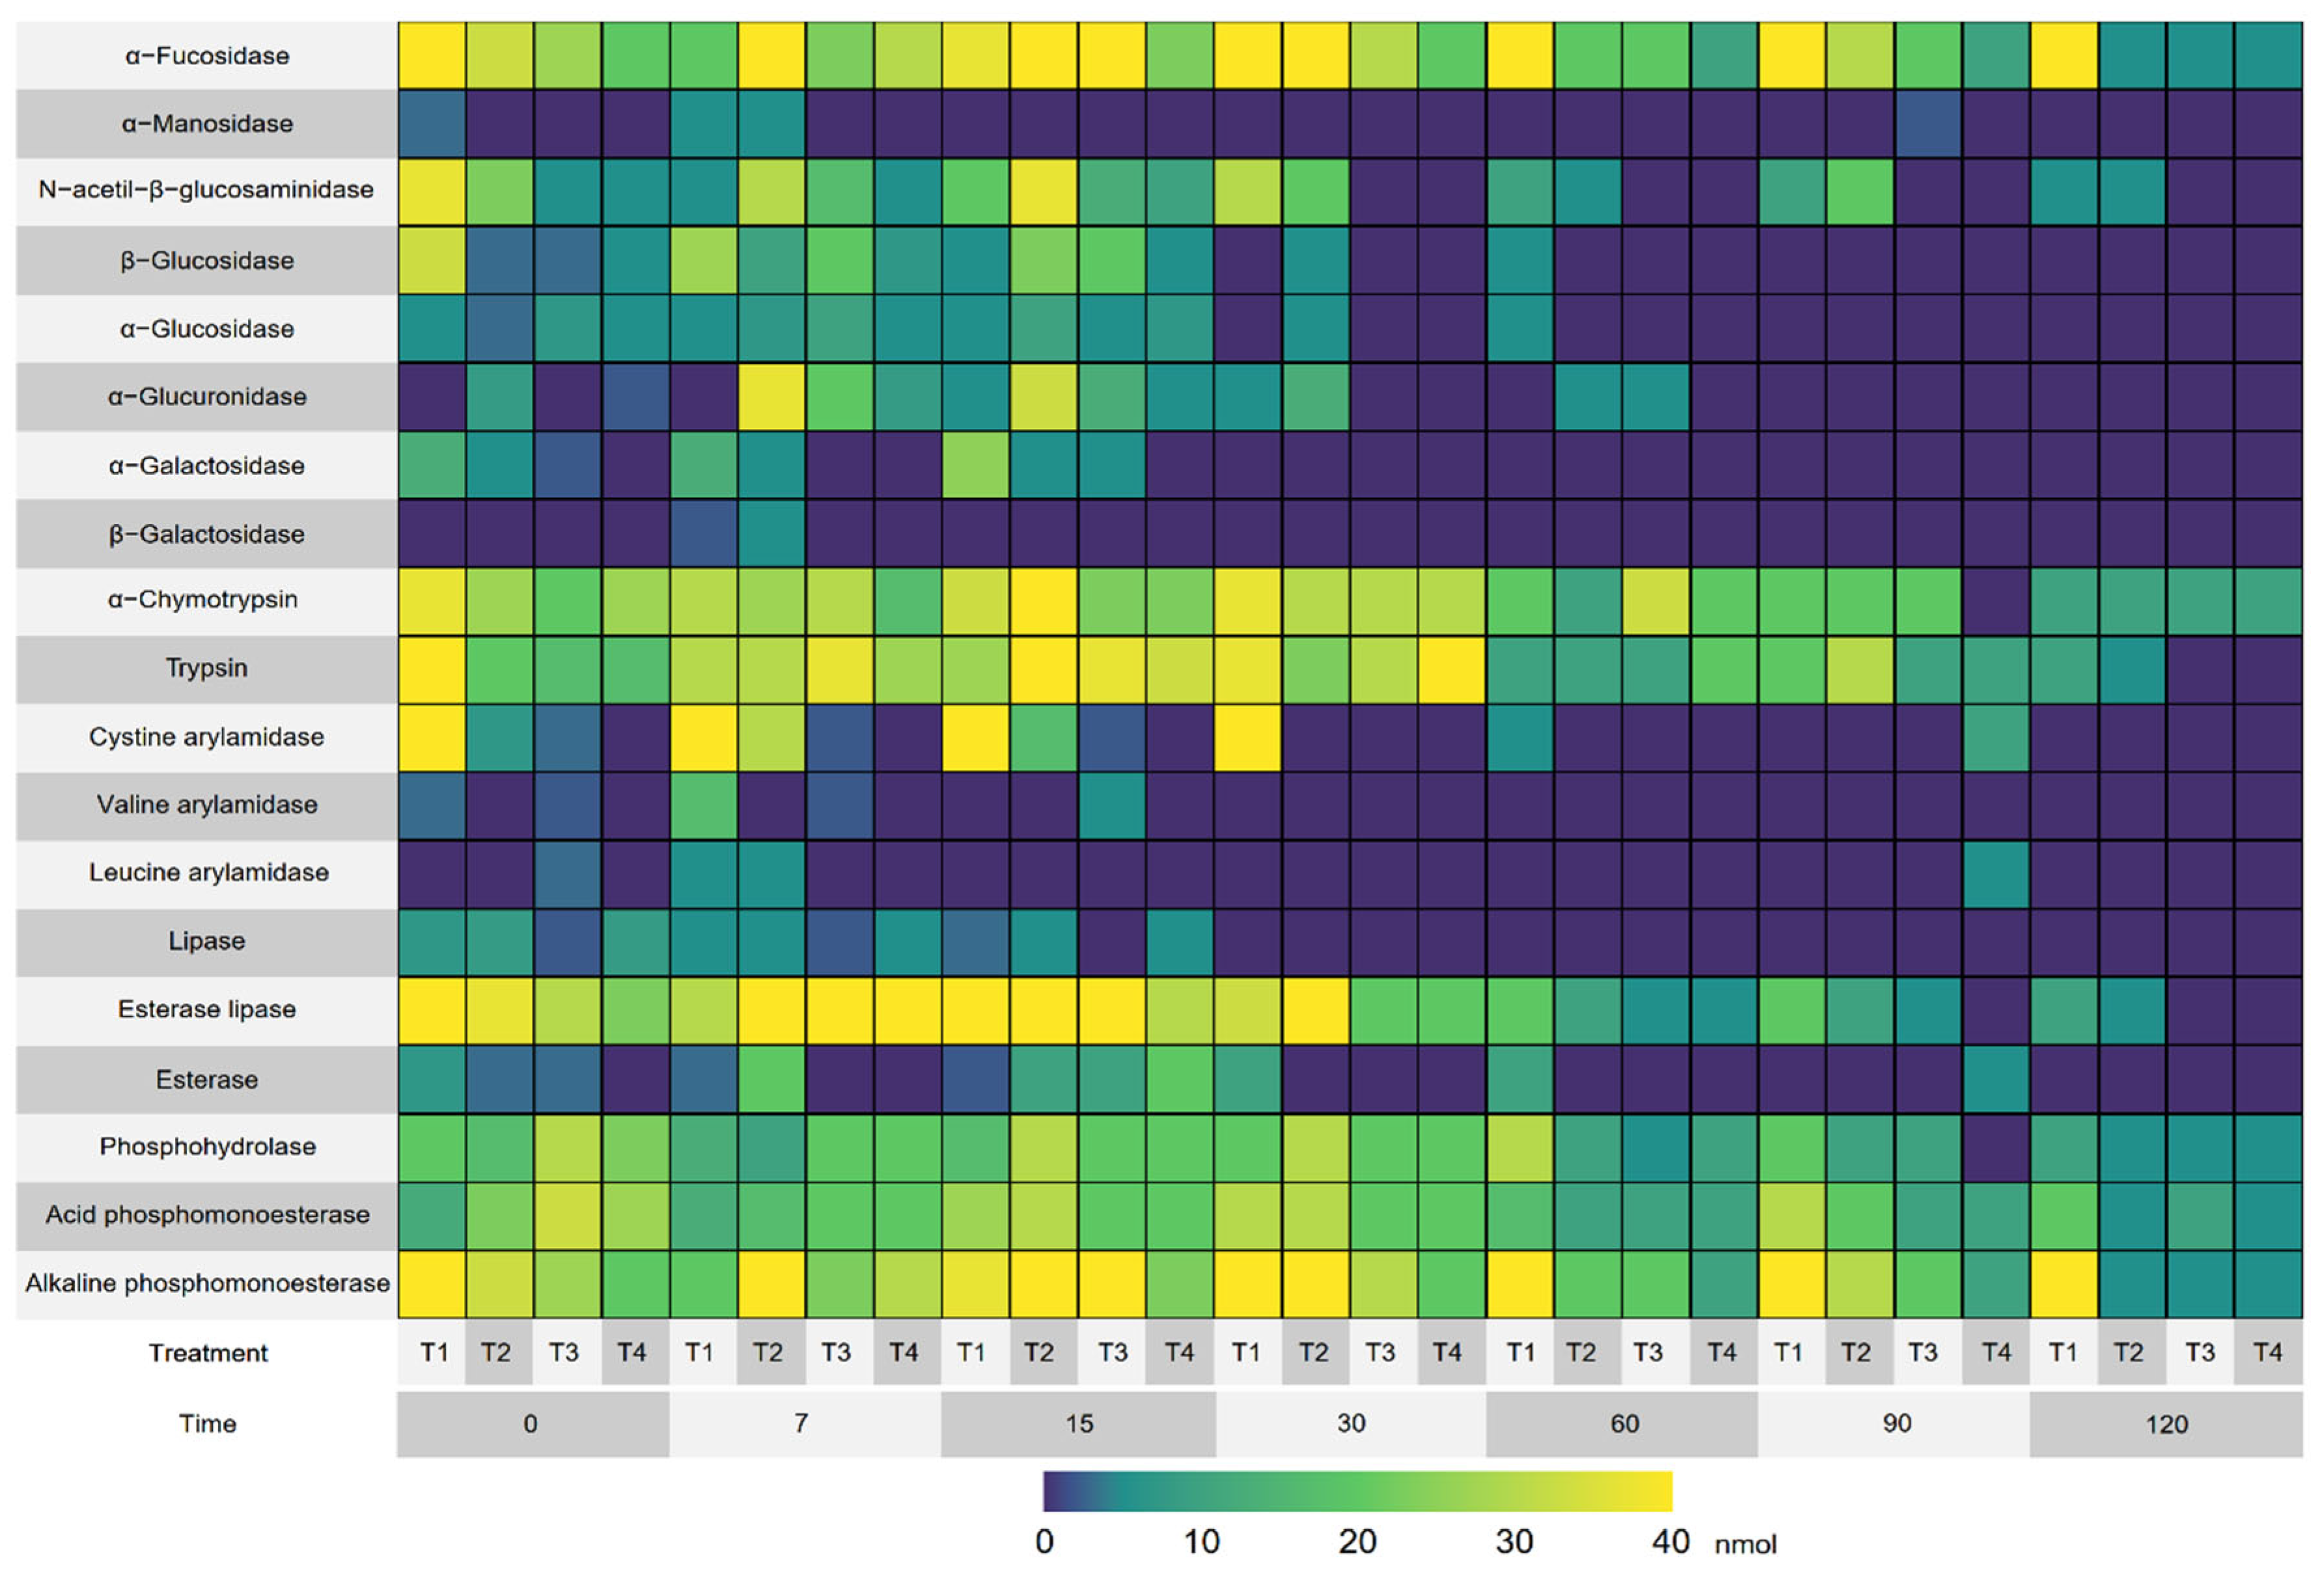
3.3.1. Enzymatic Indicators
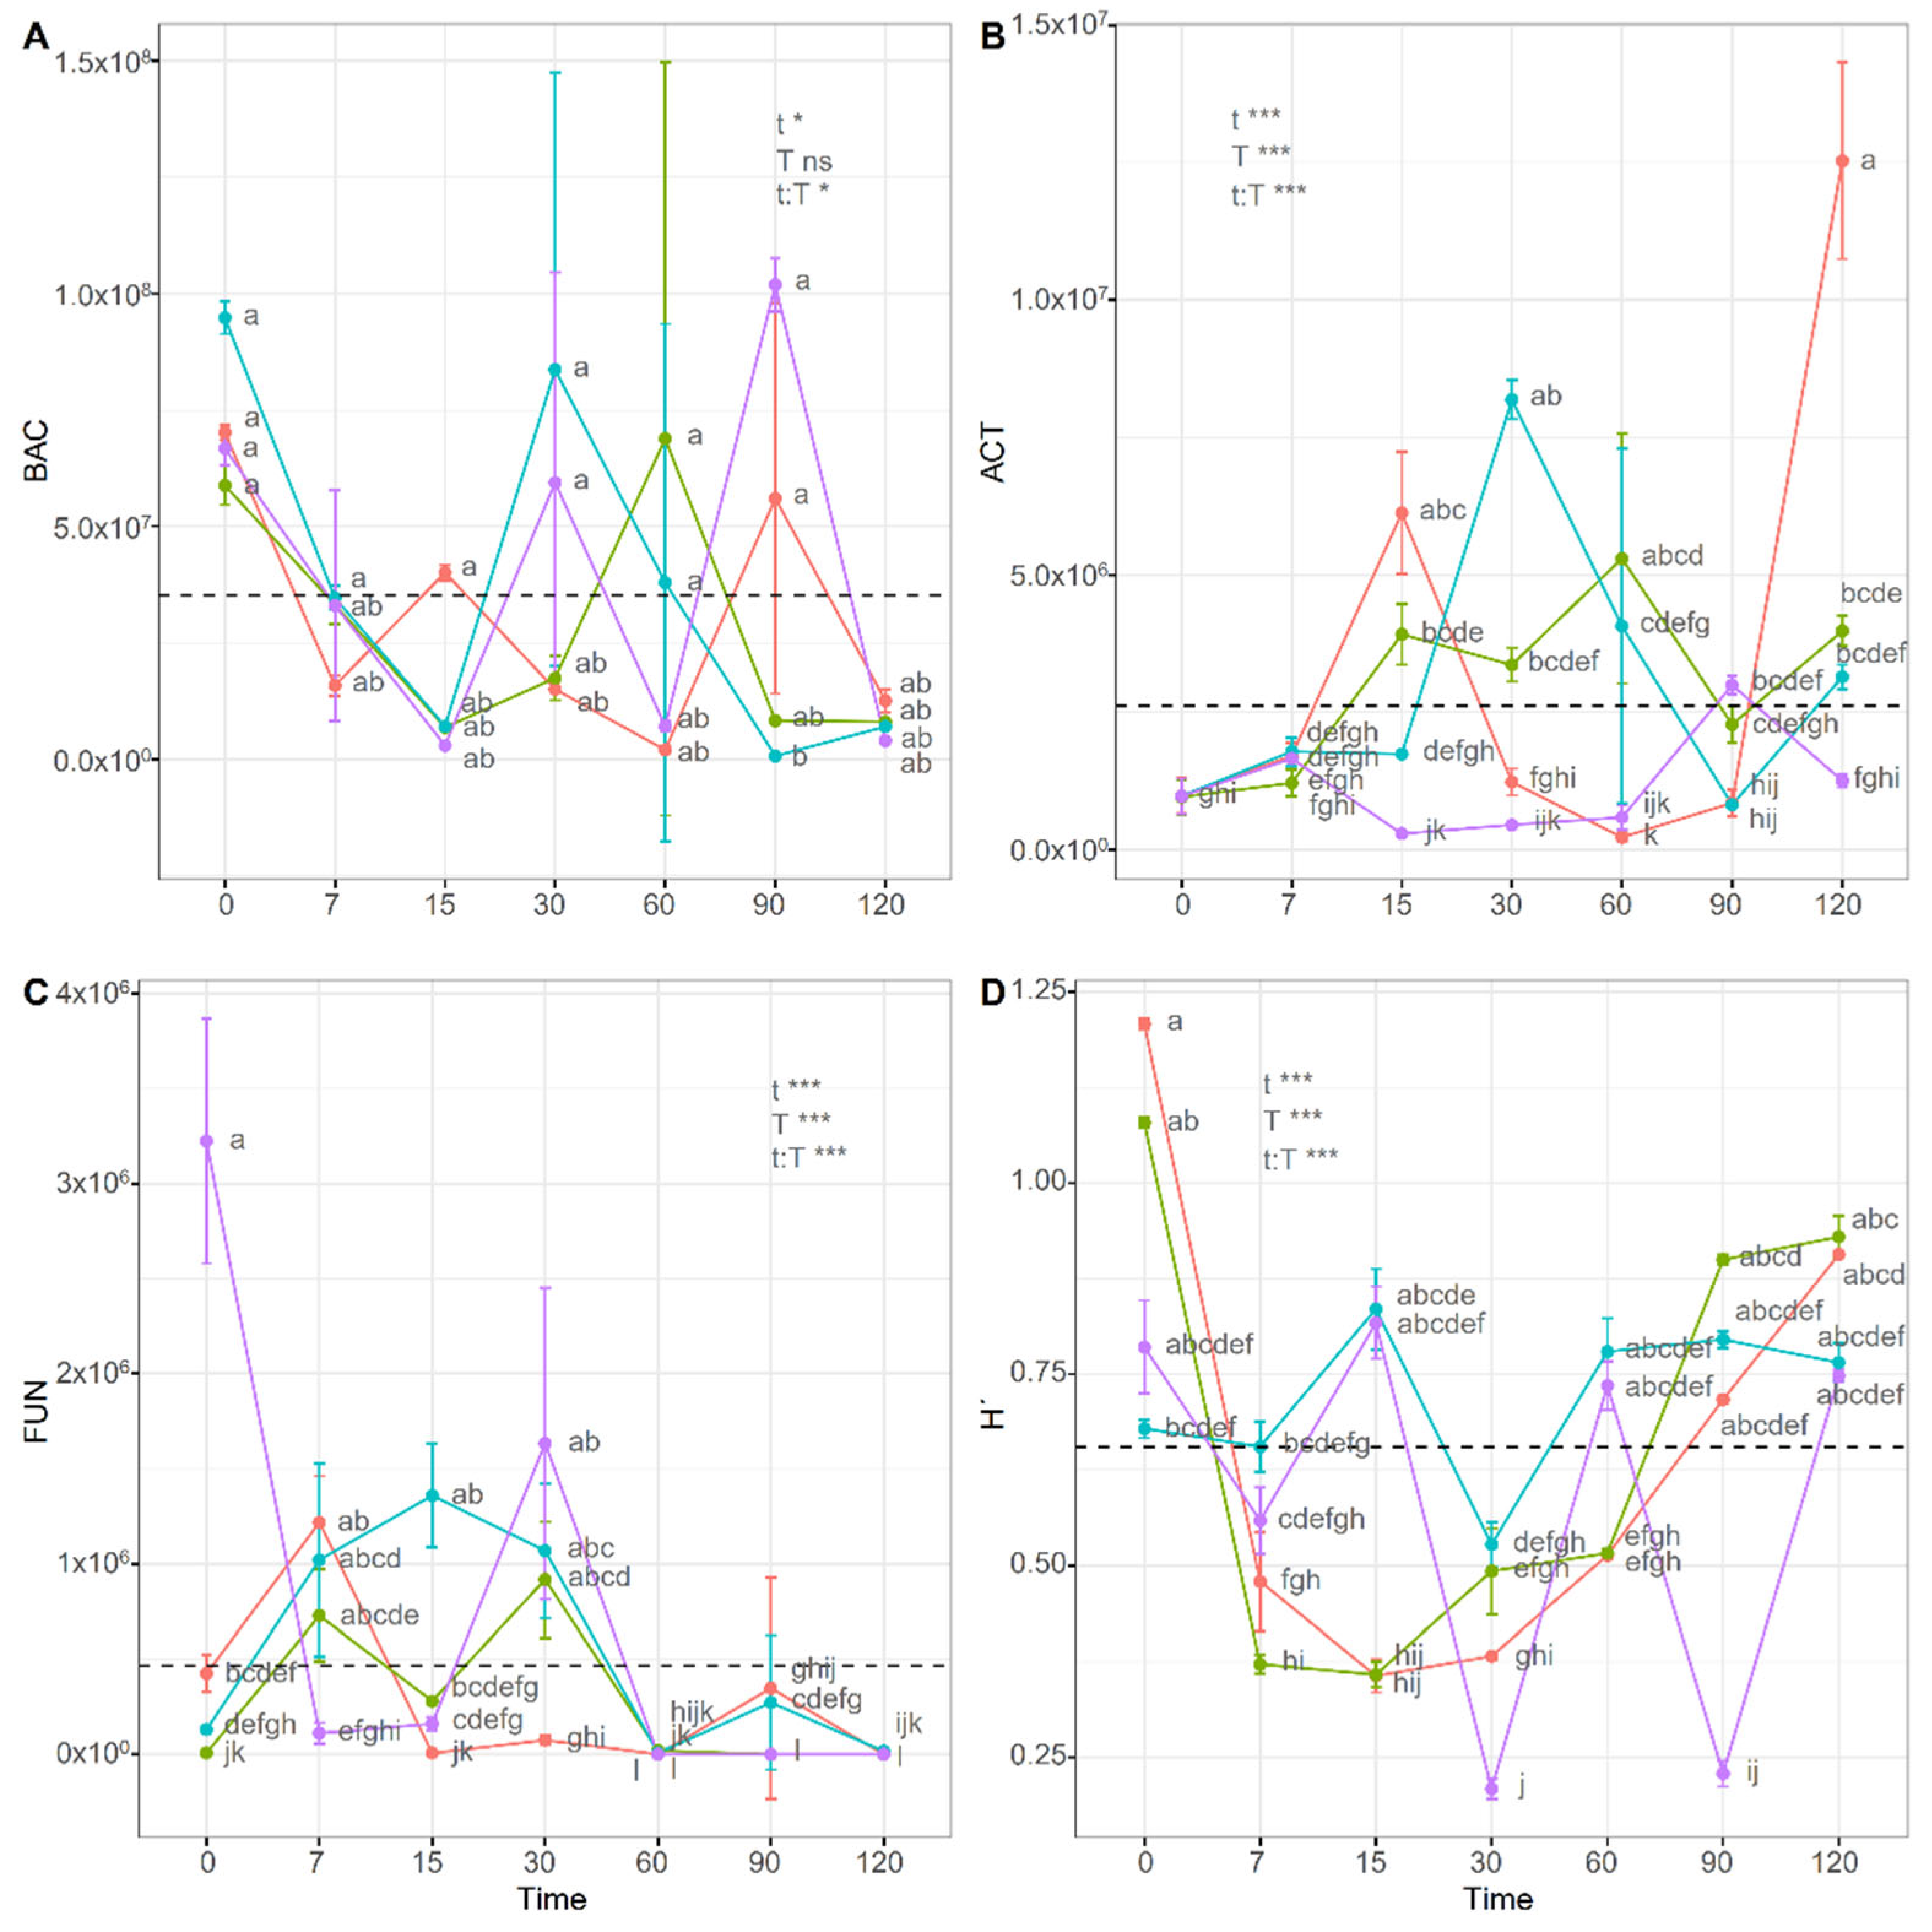
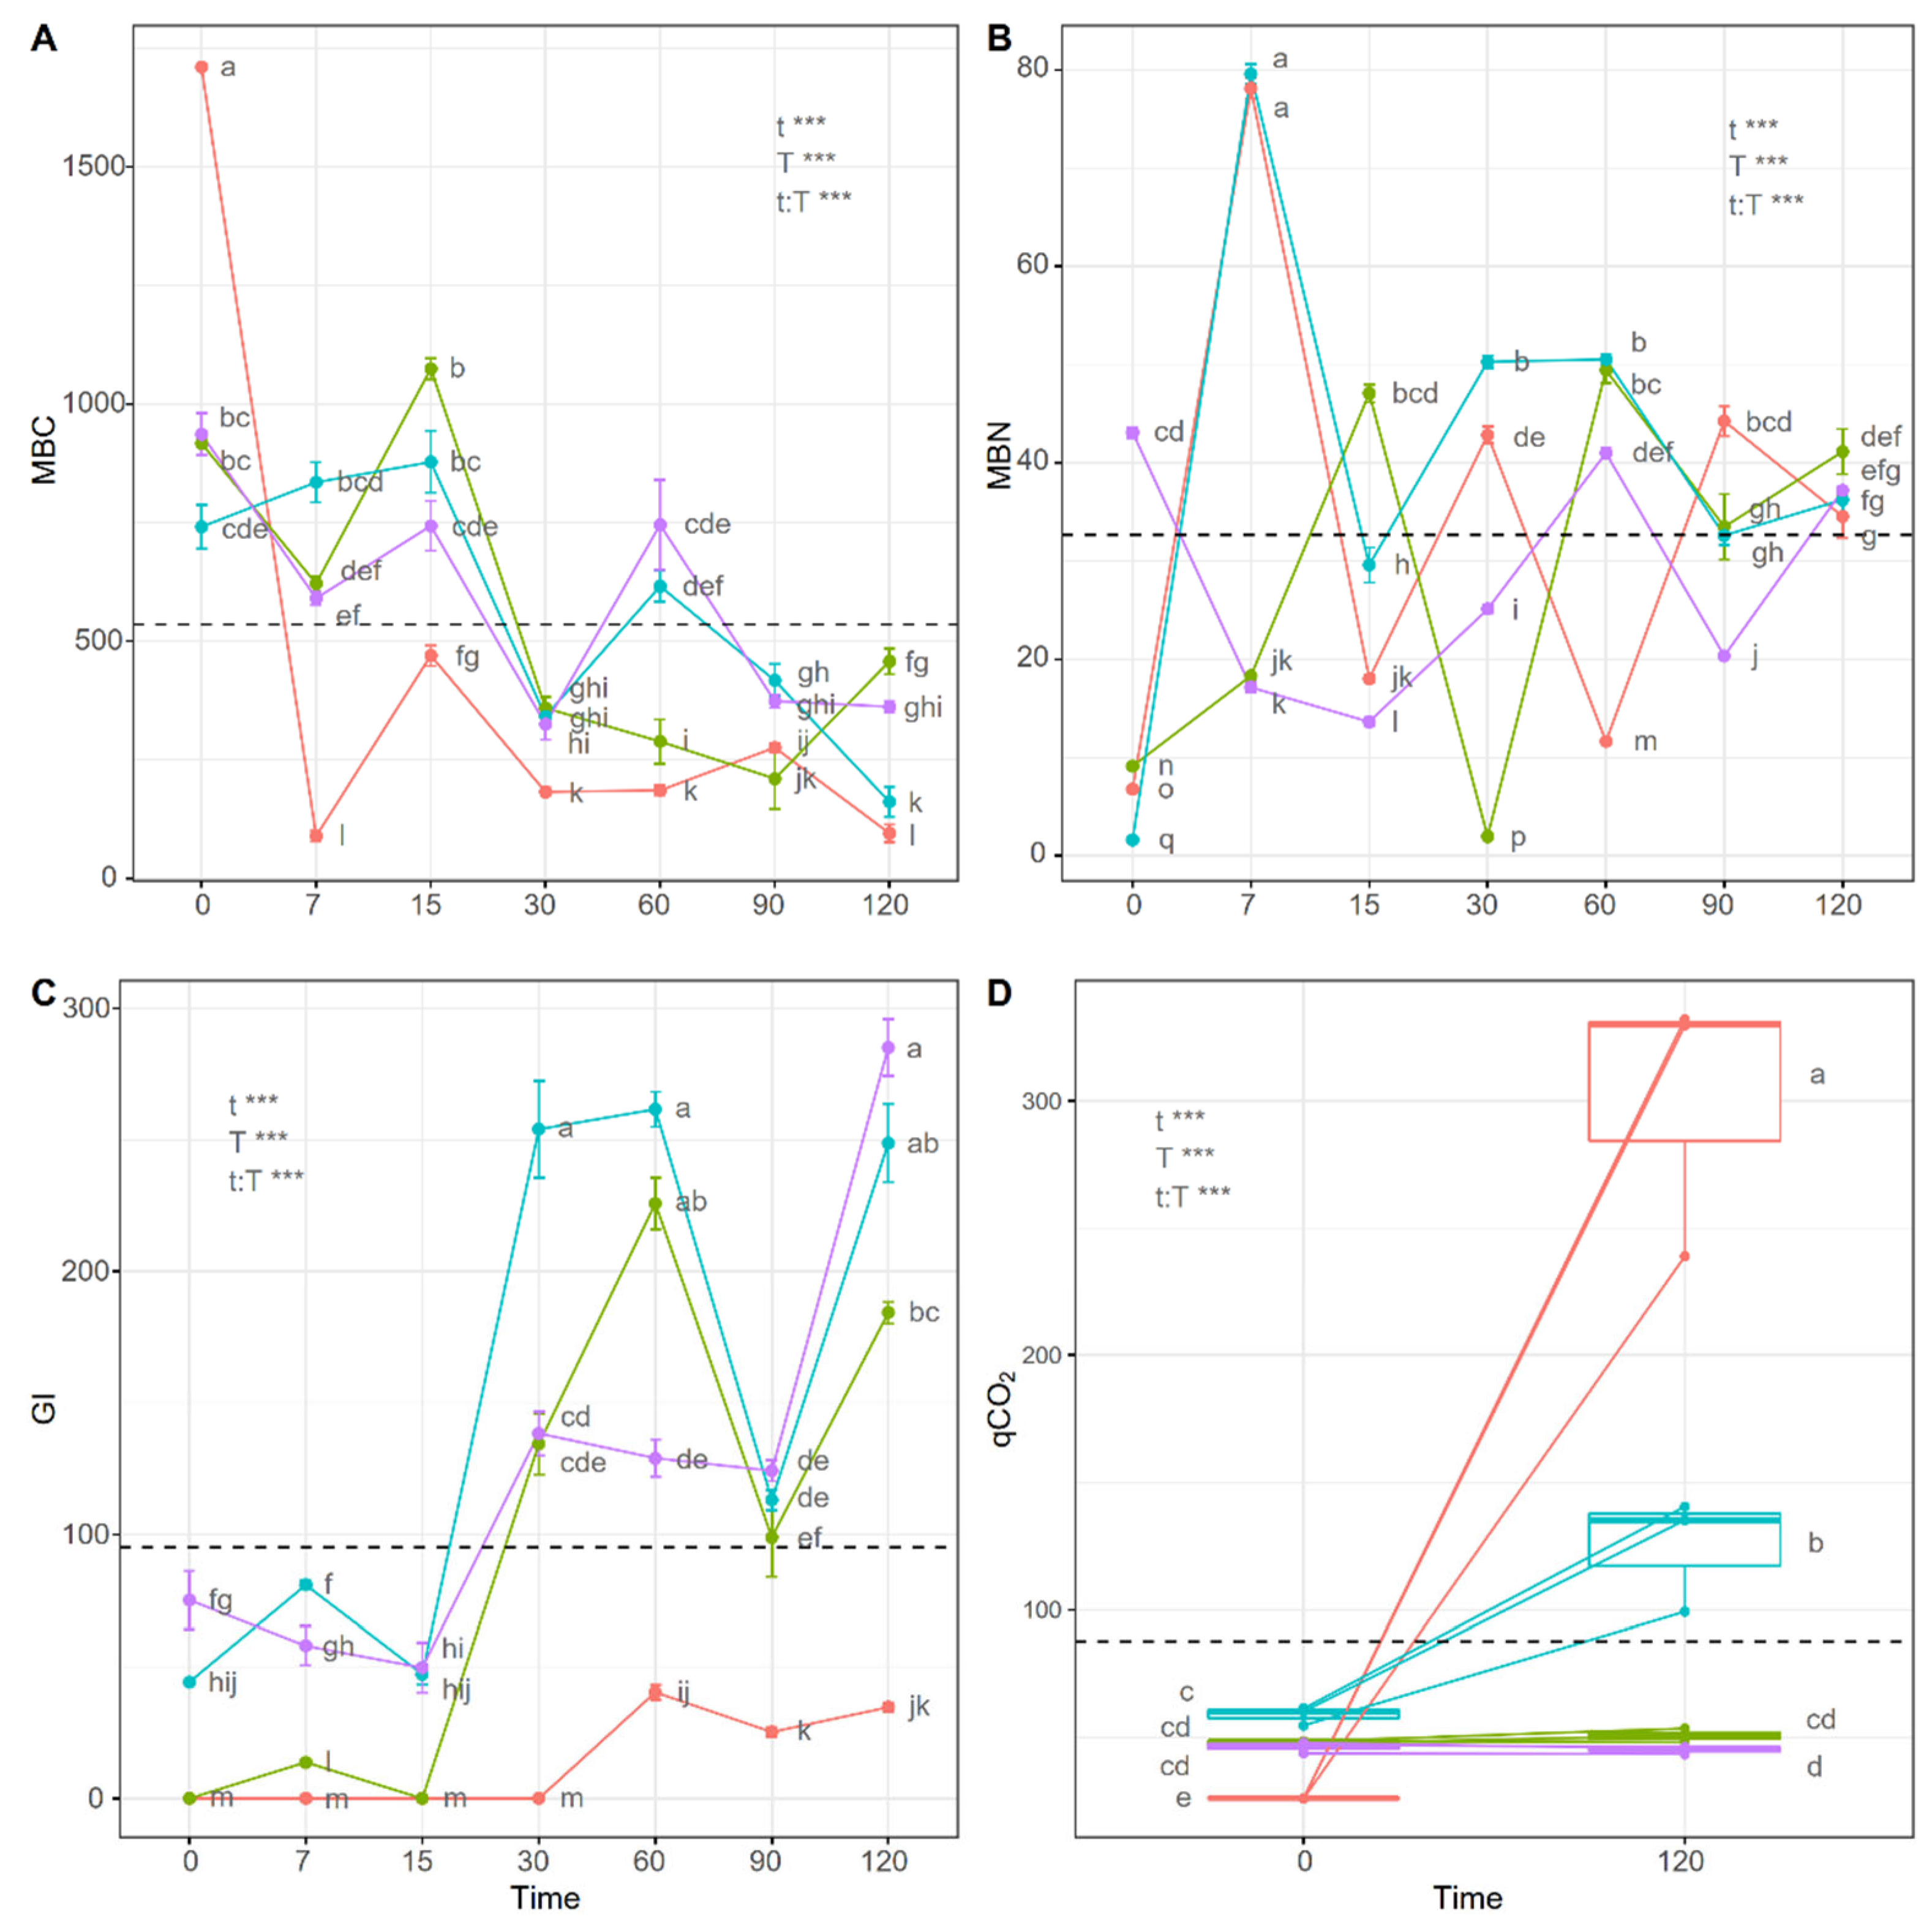
3.3.2. Microbiological and Ecophysiological Indicators
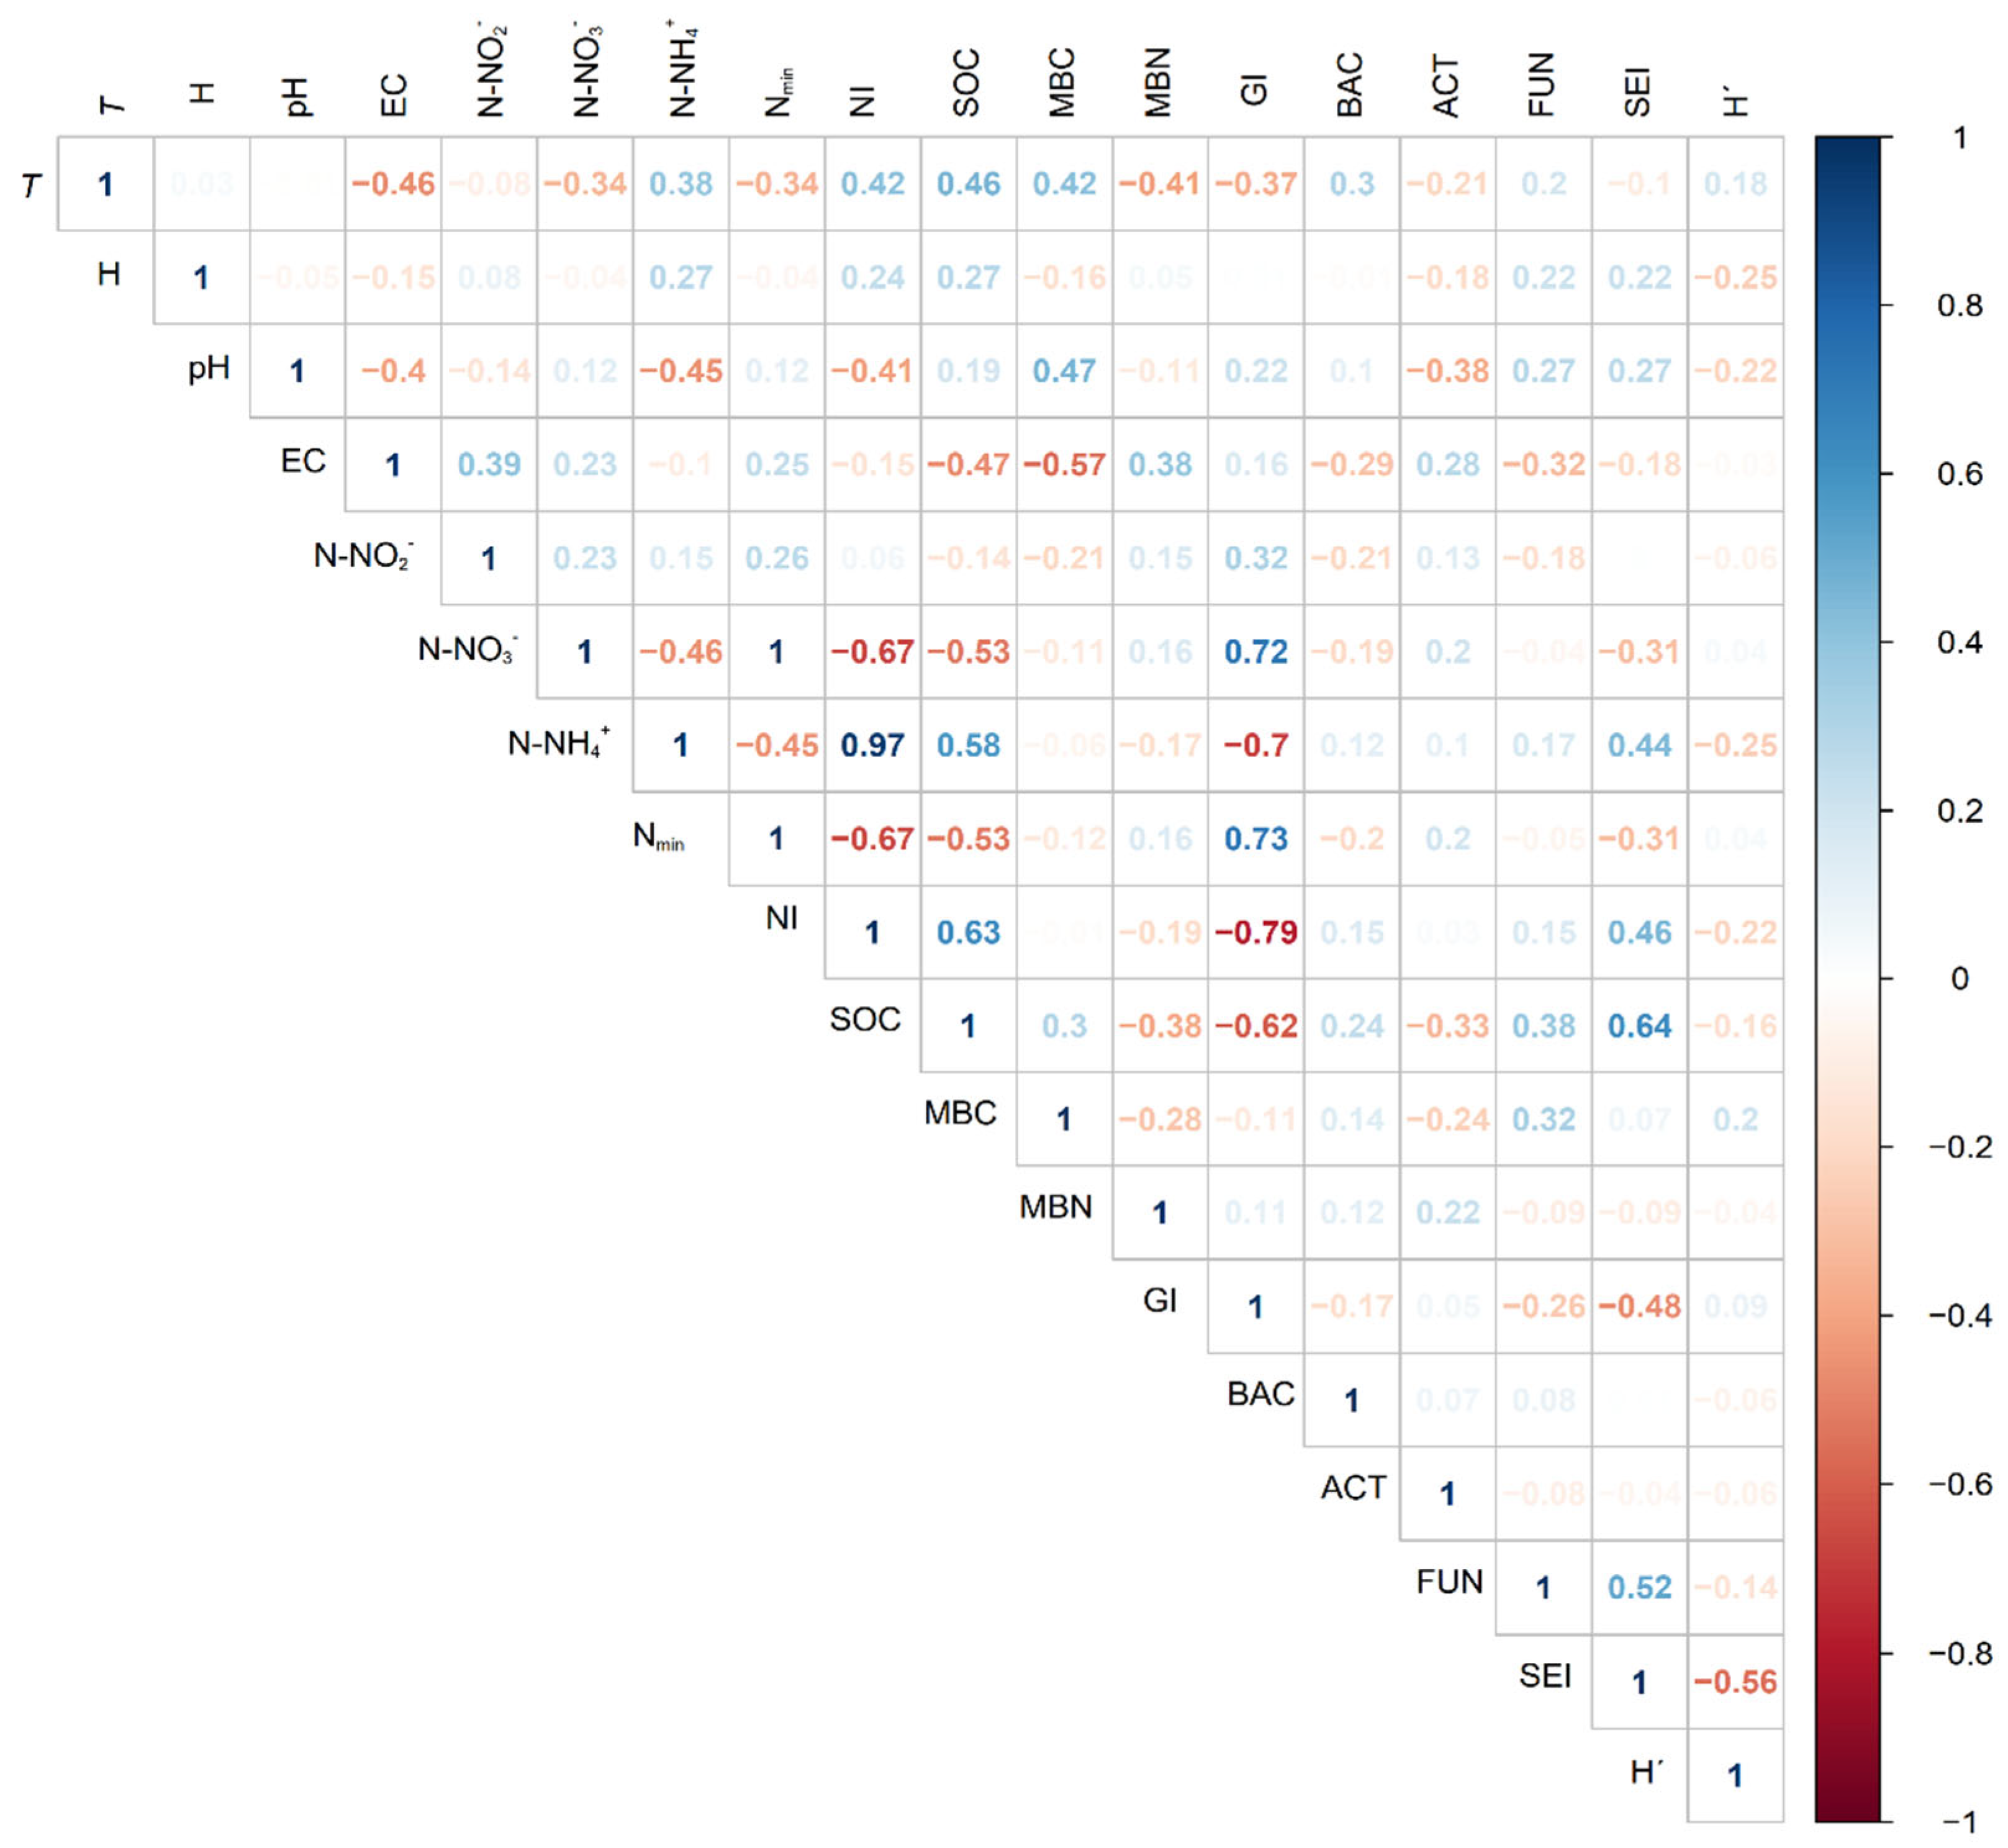
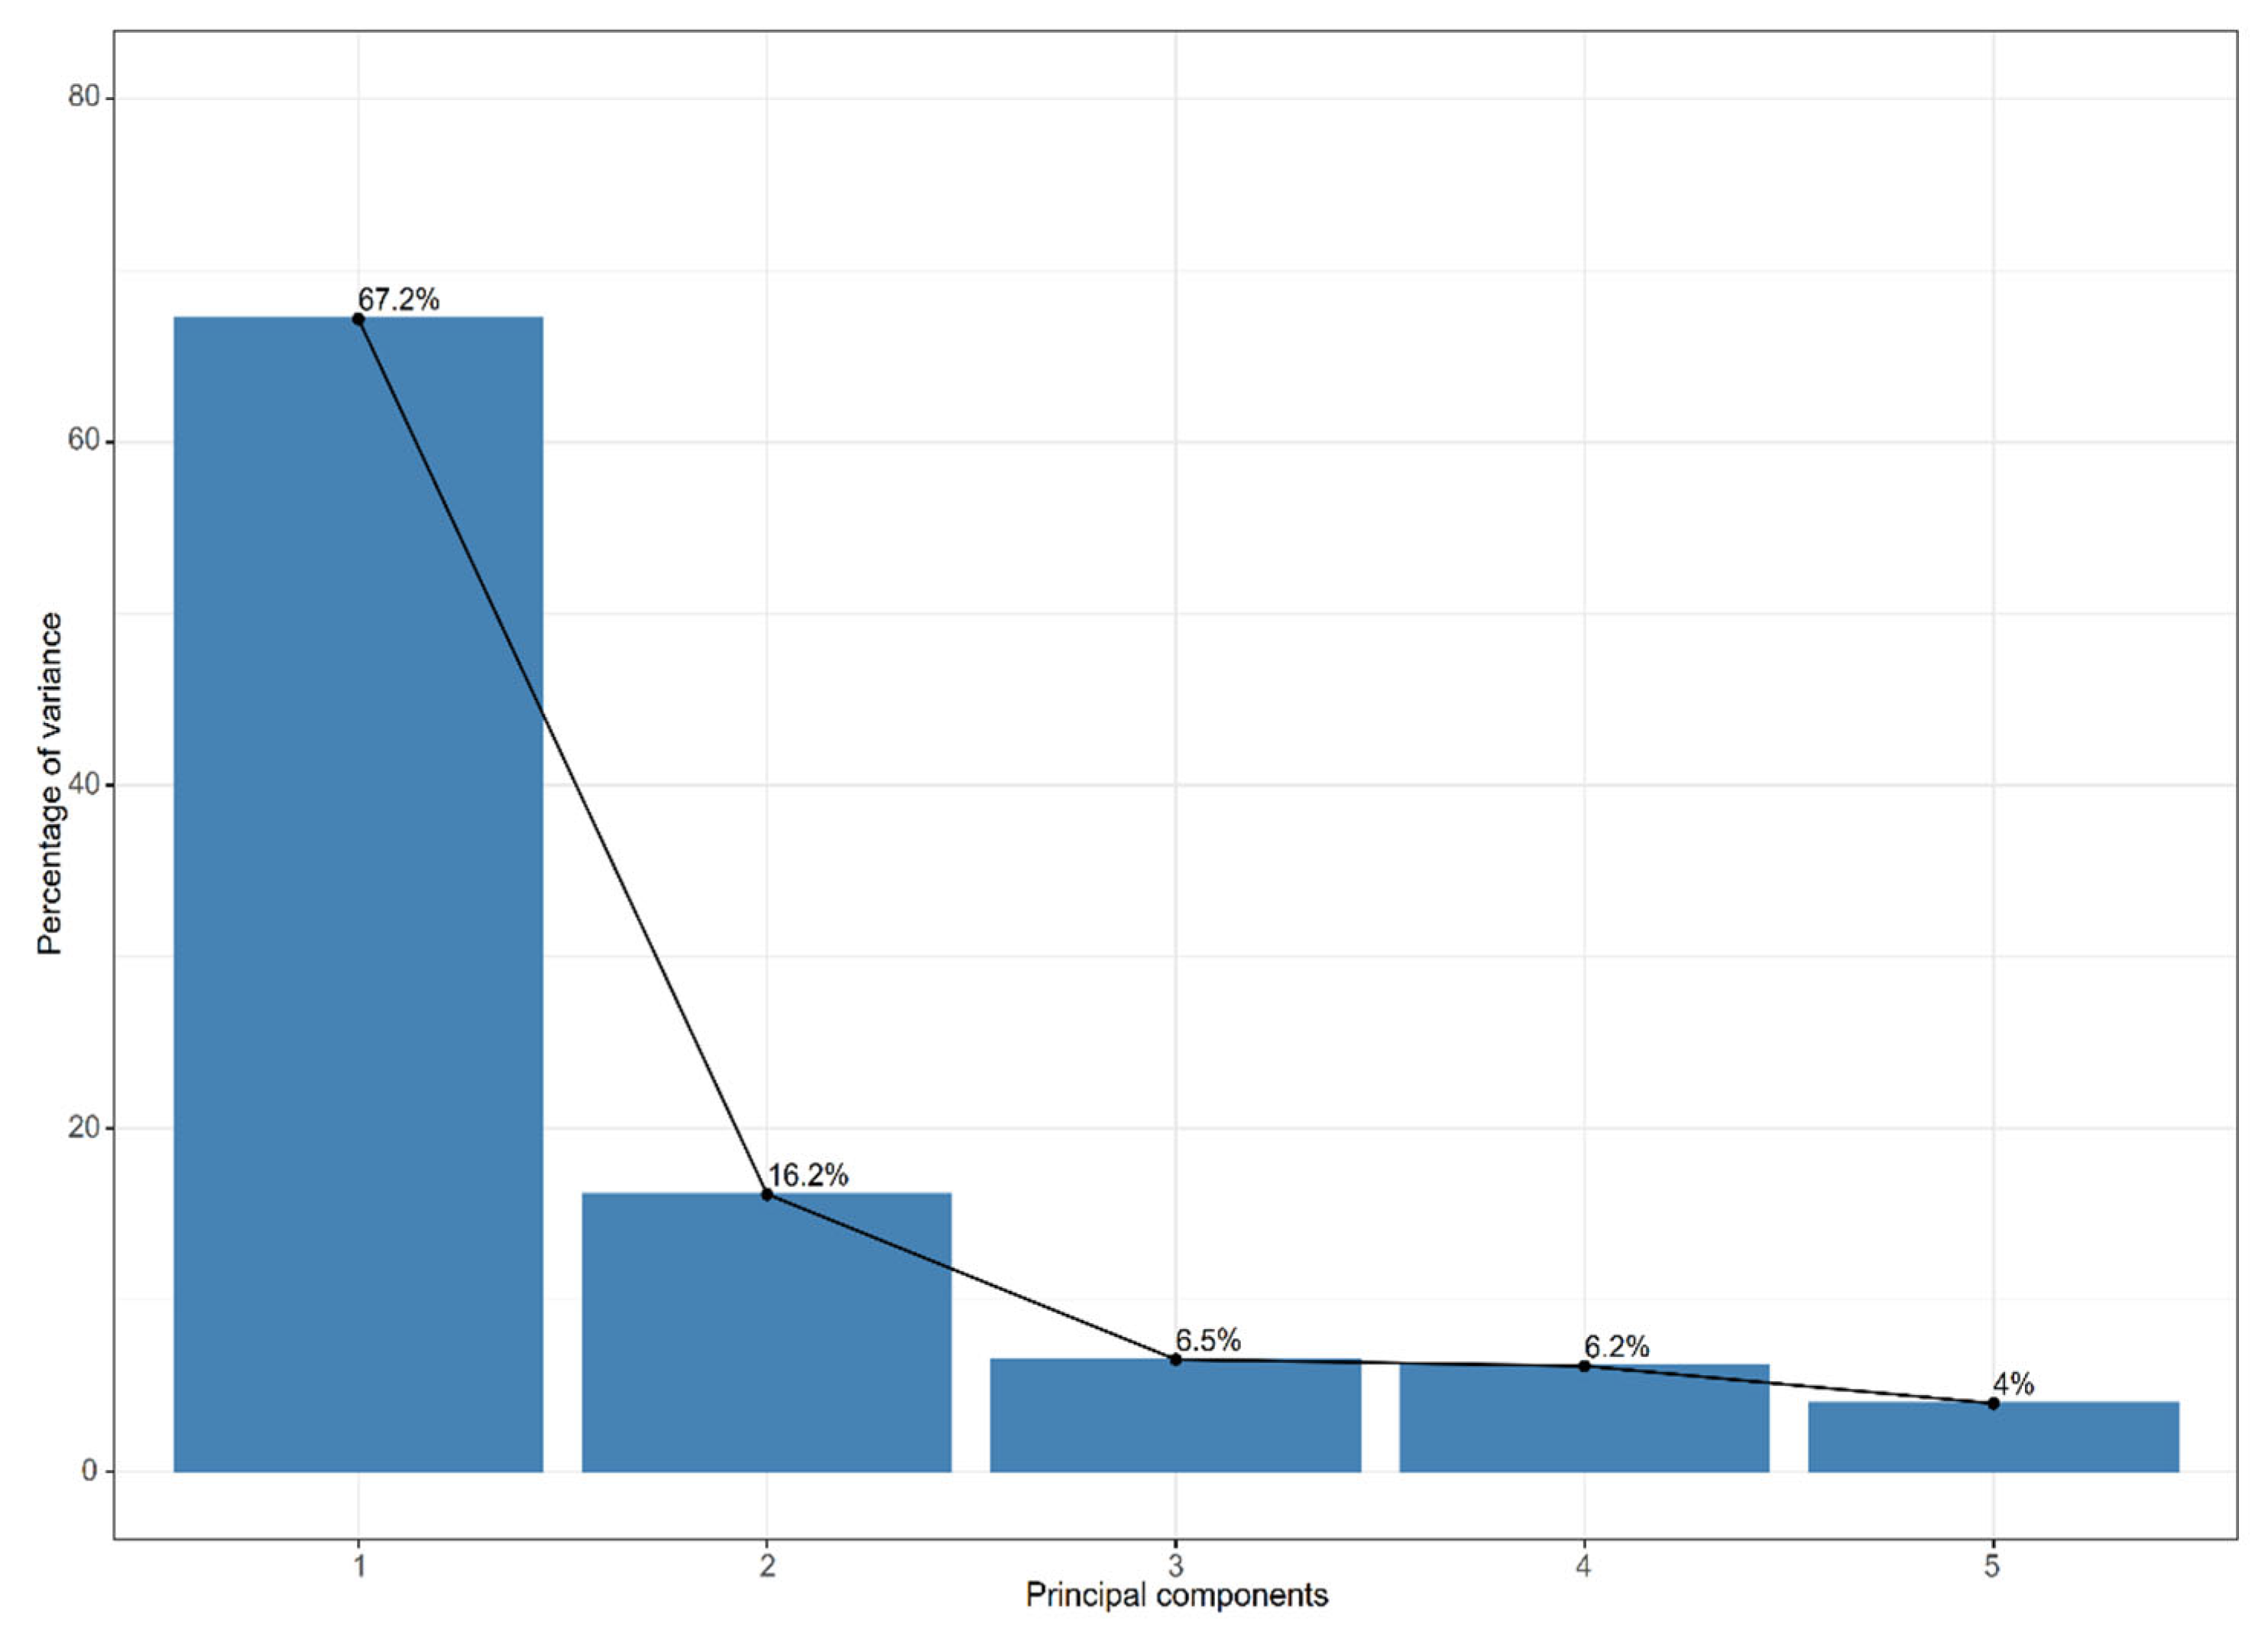
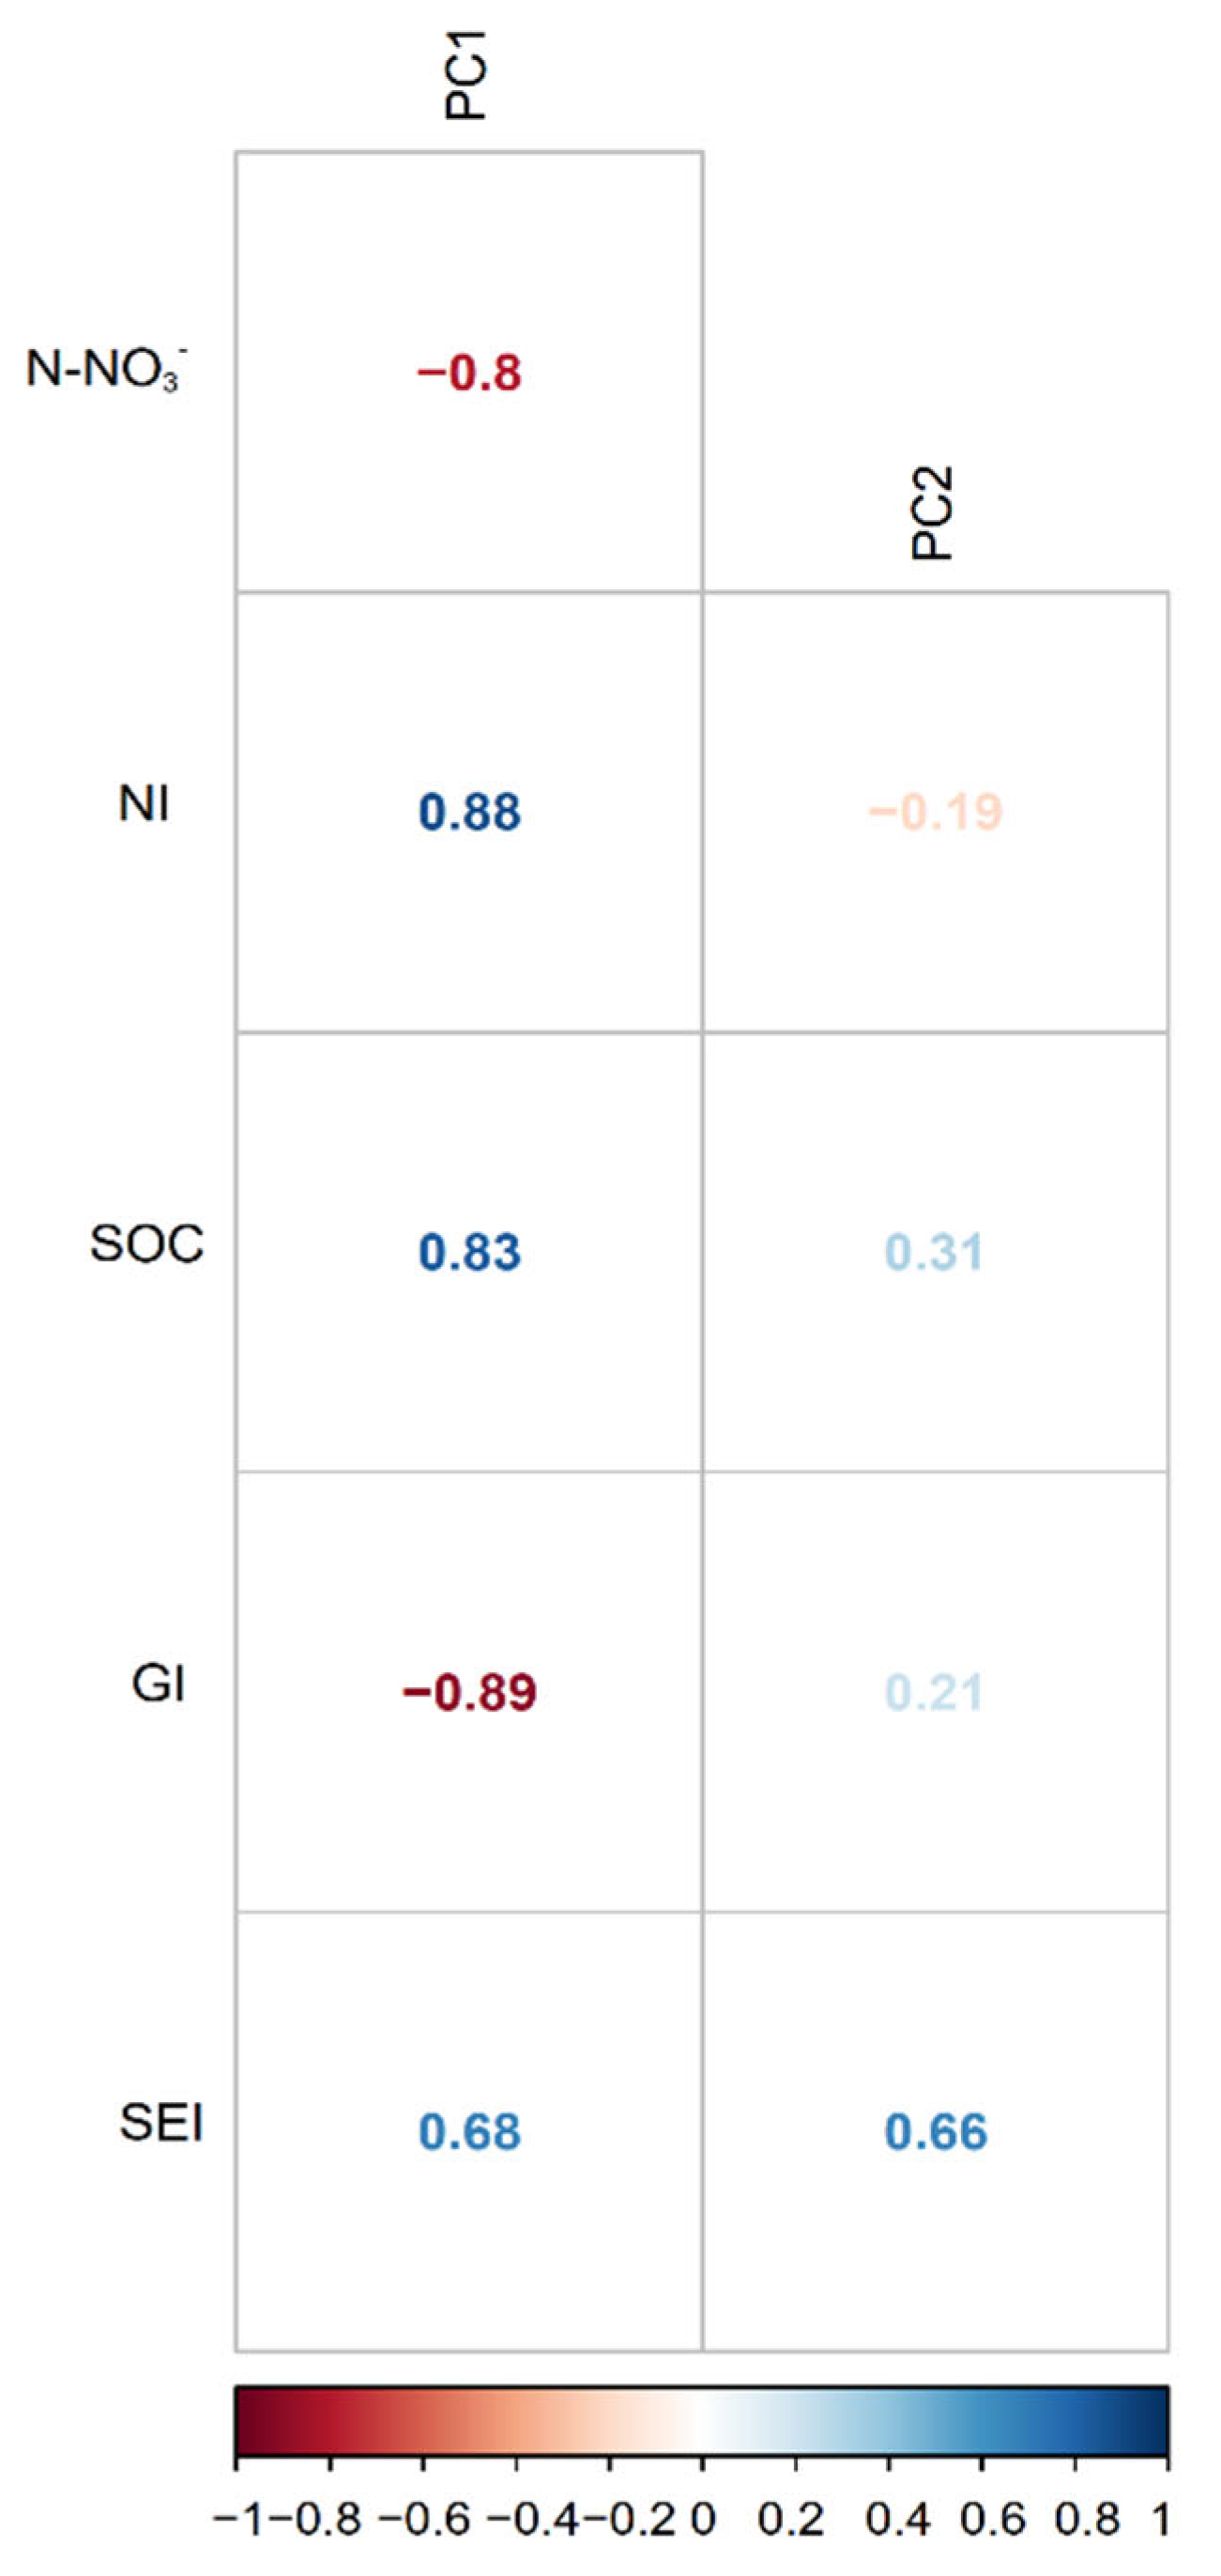
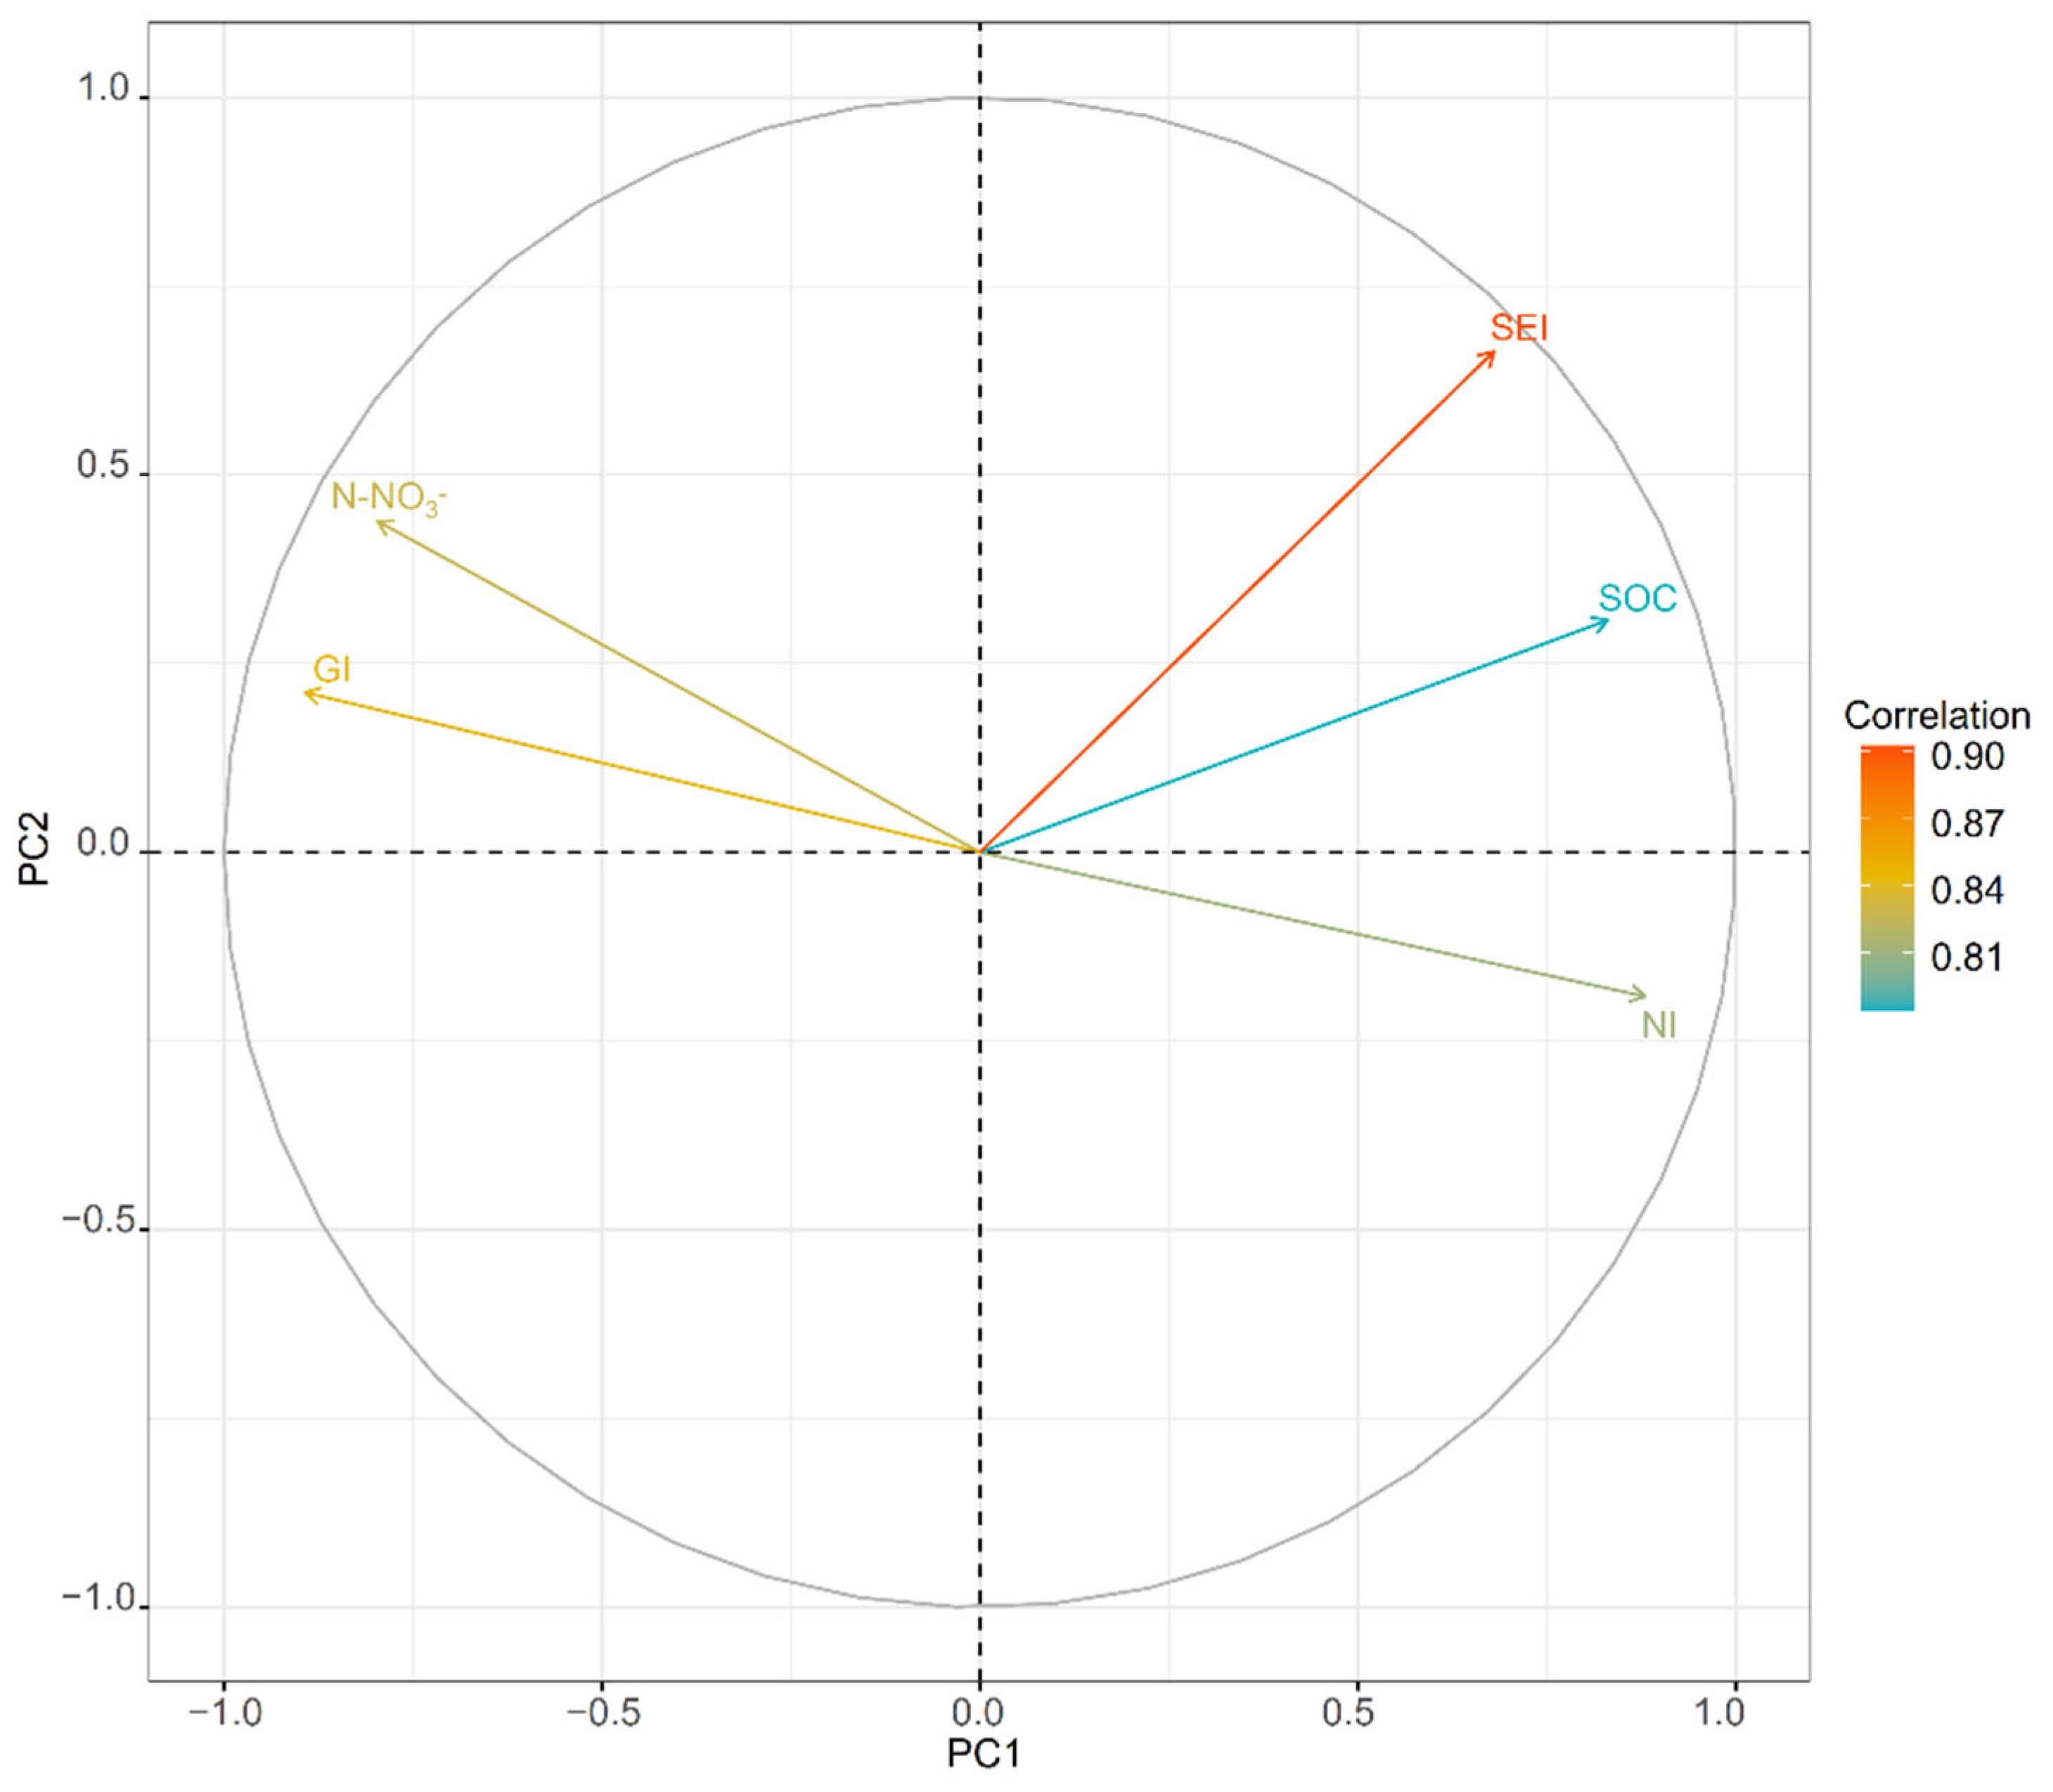
3.4. PCA
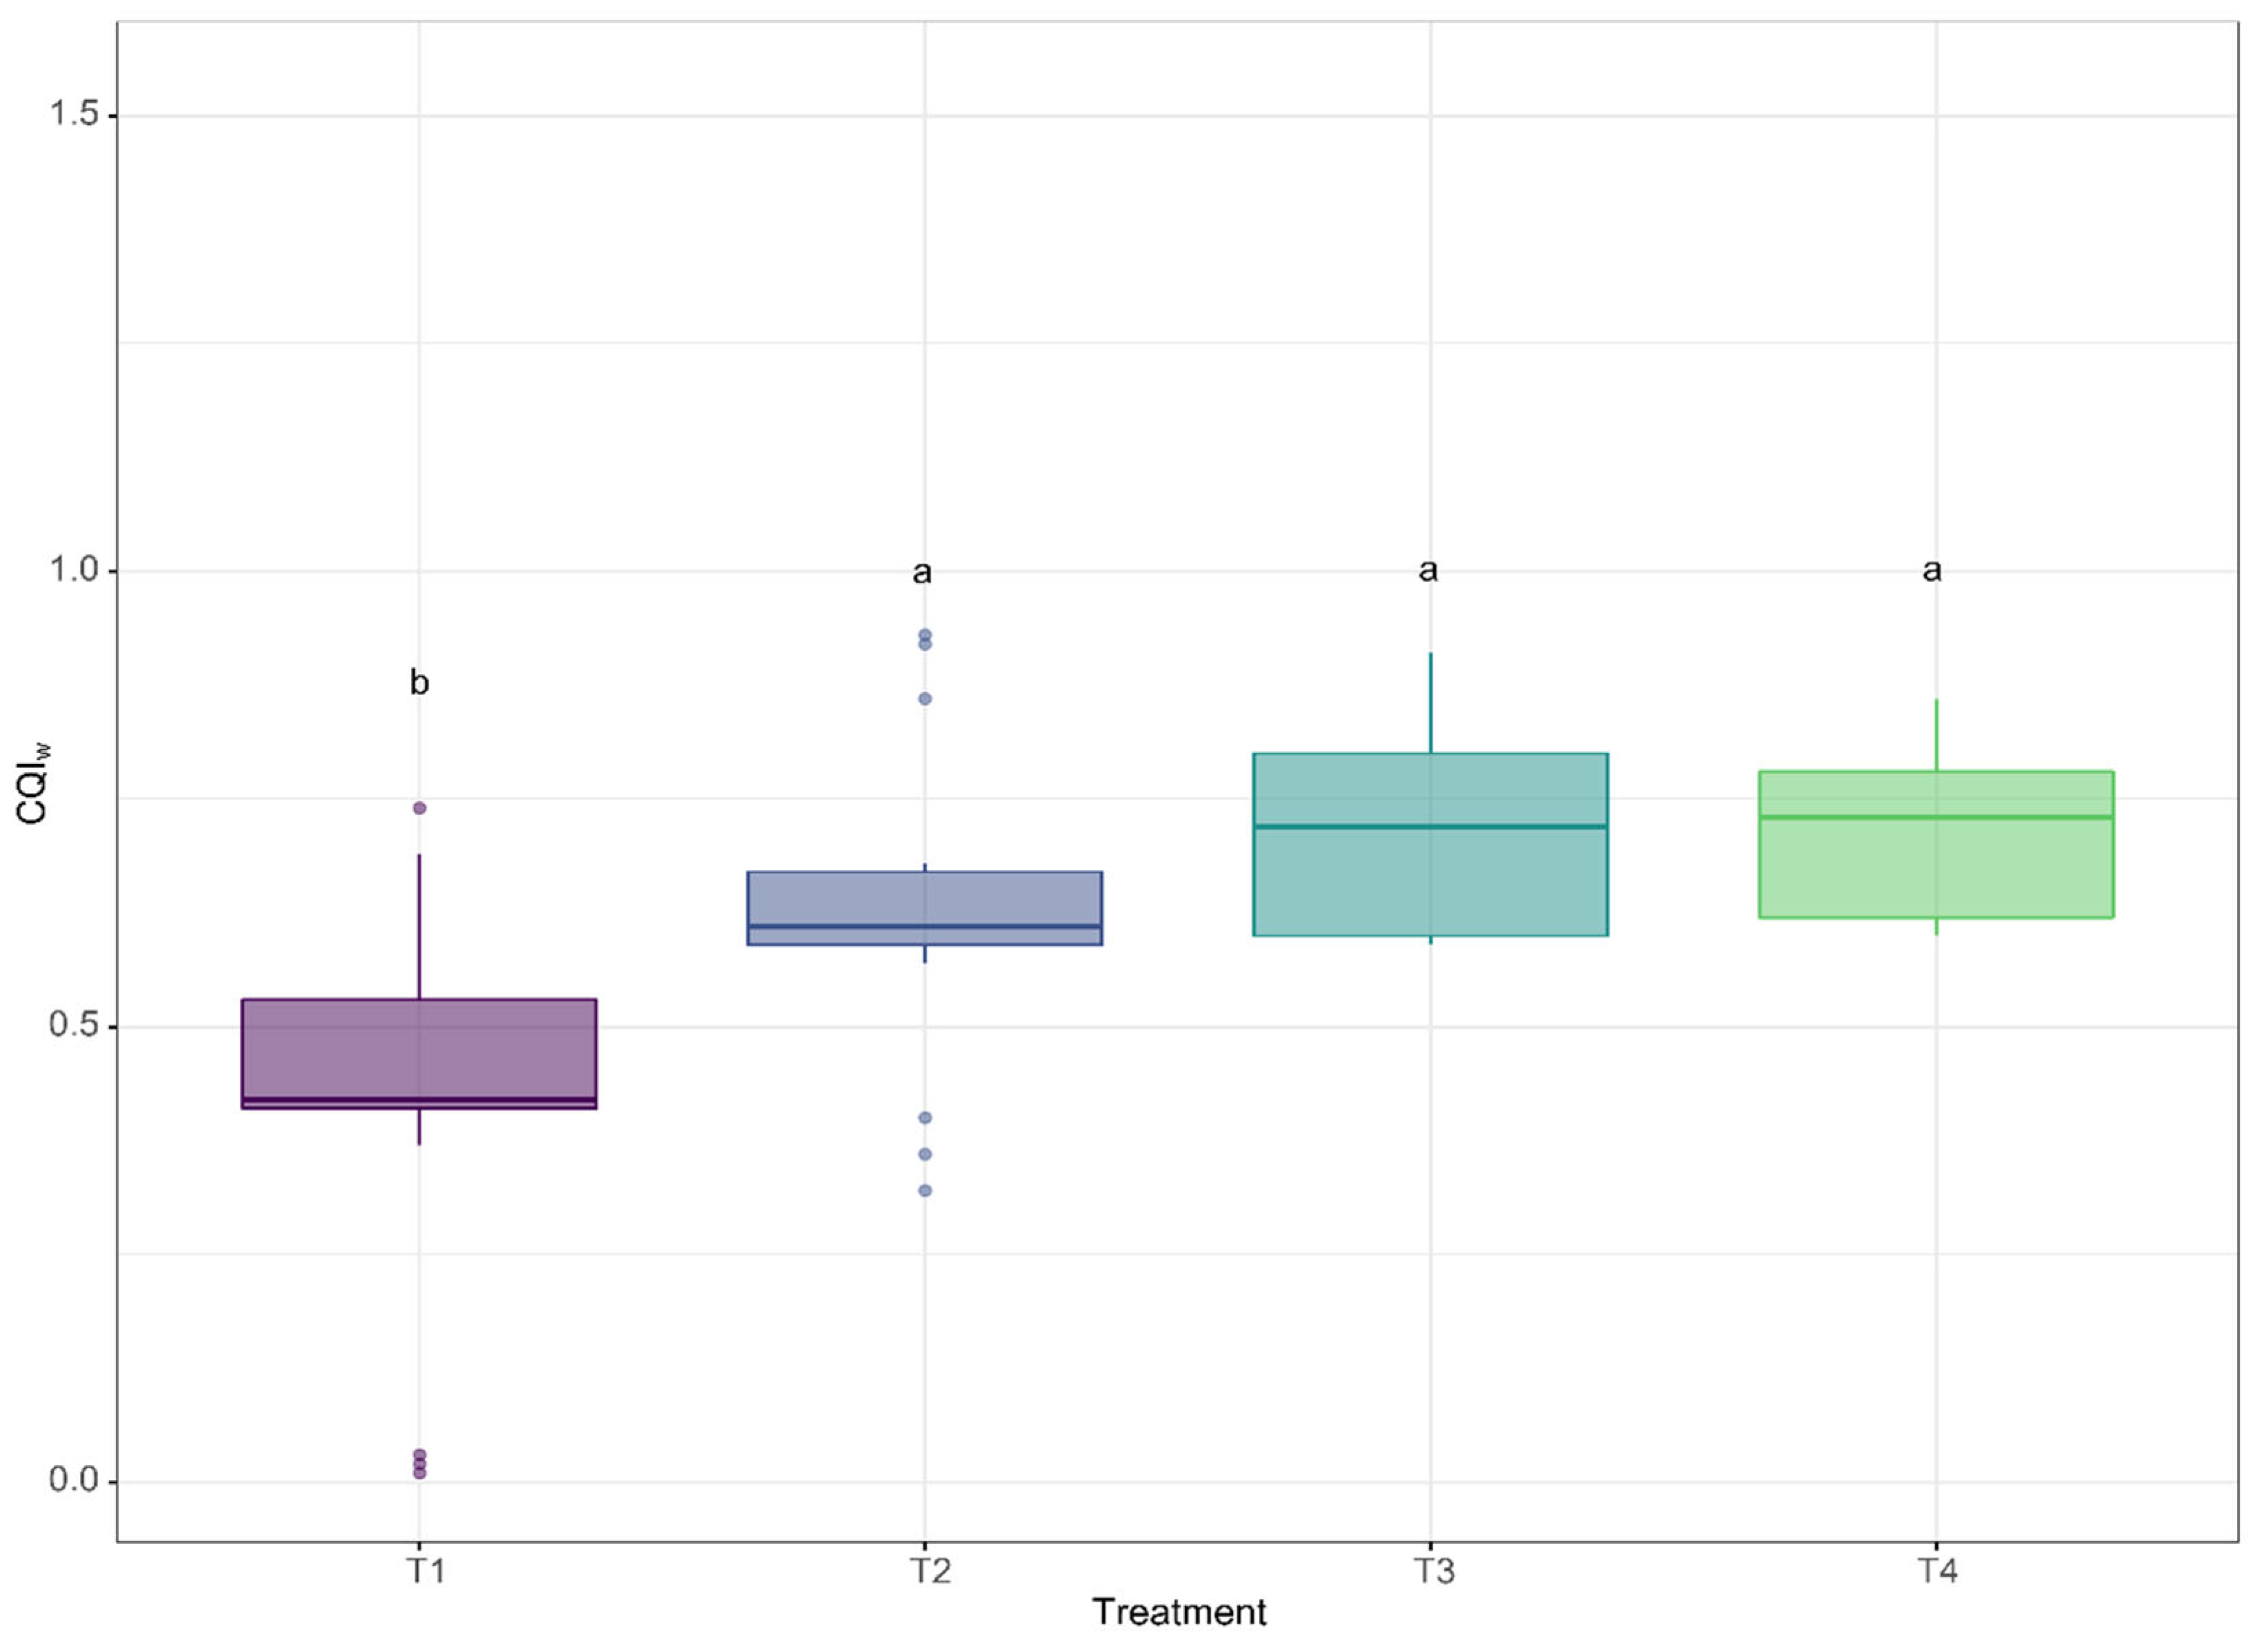
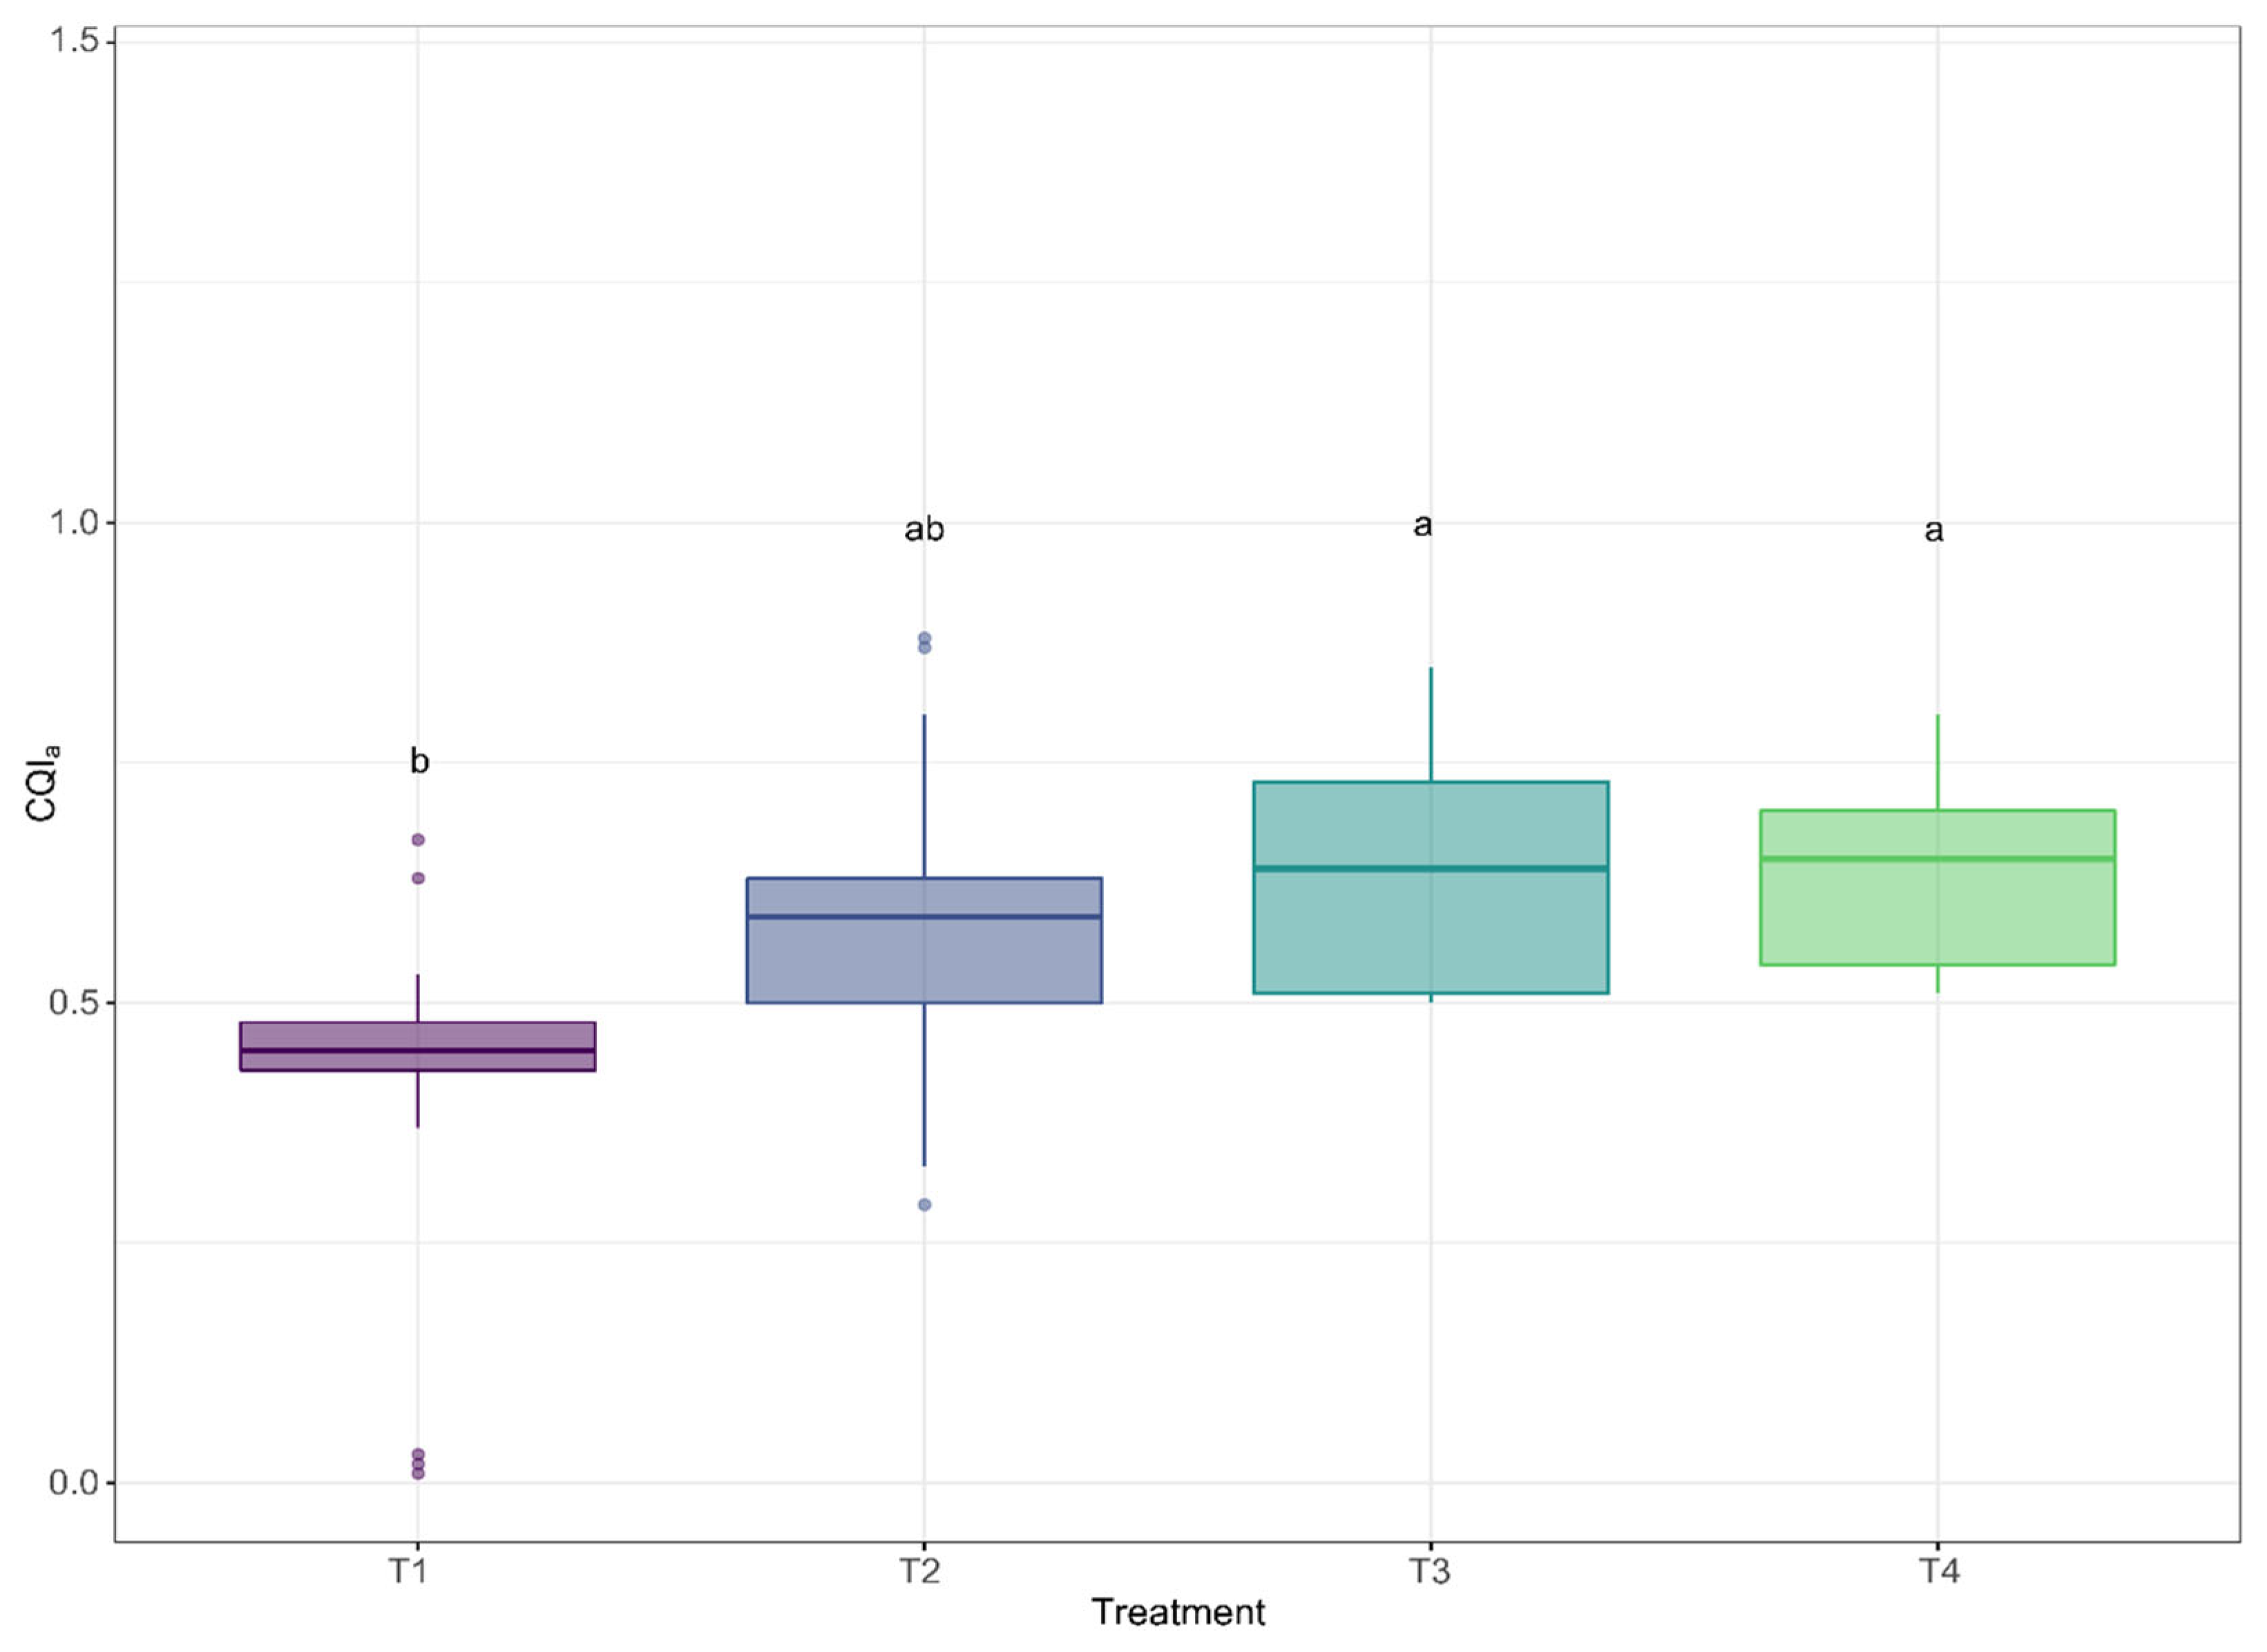
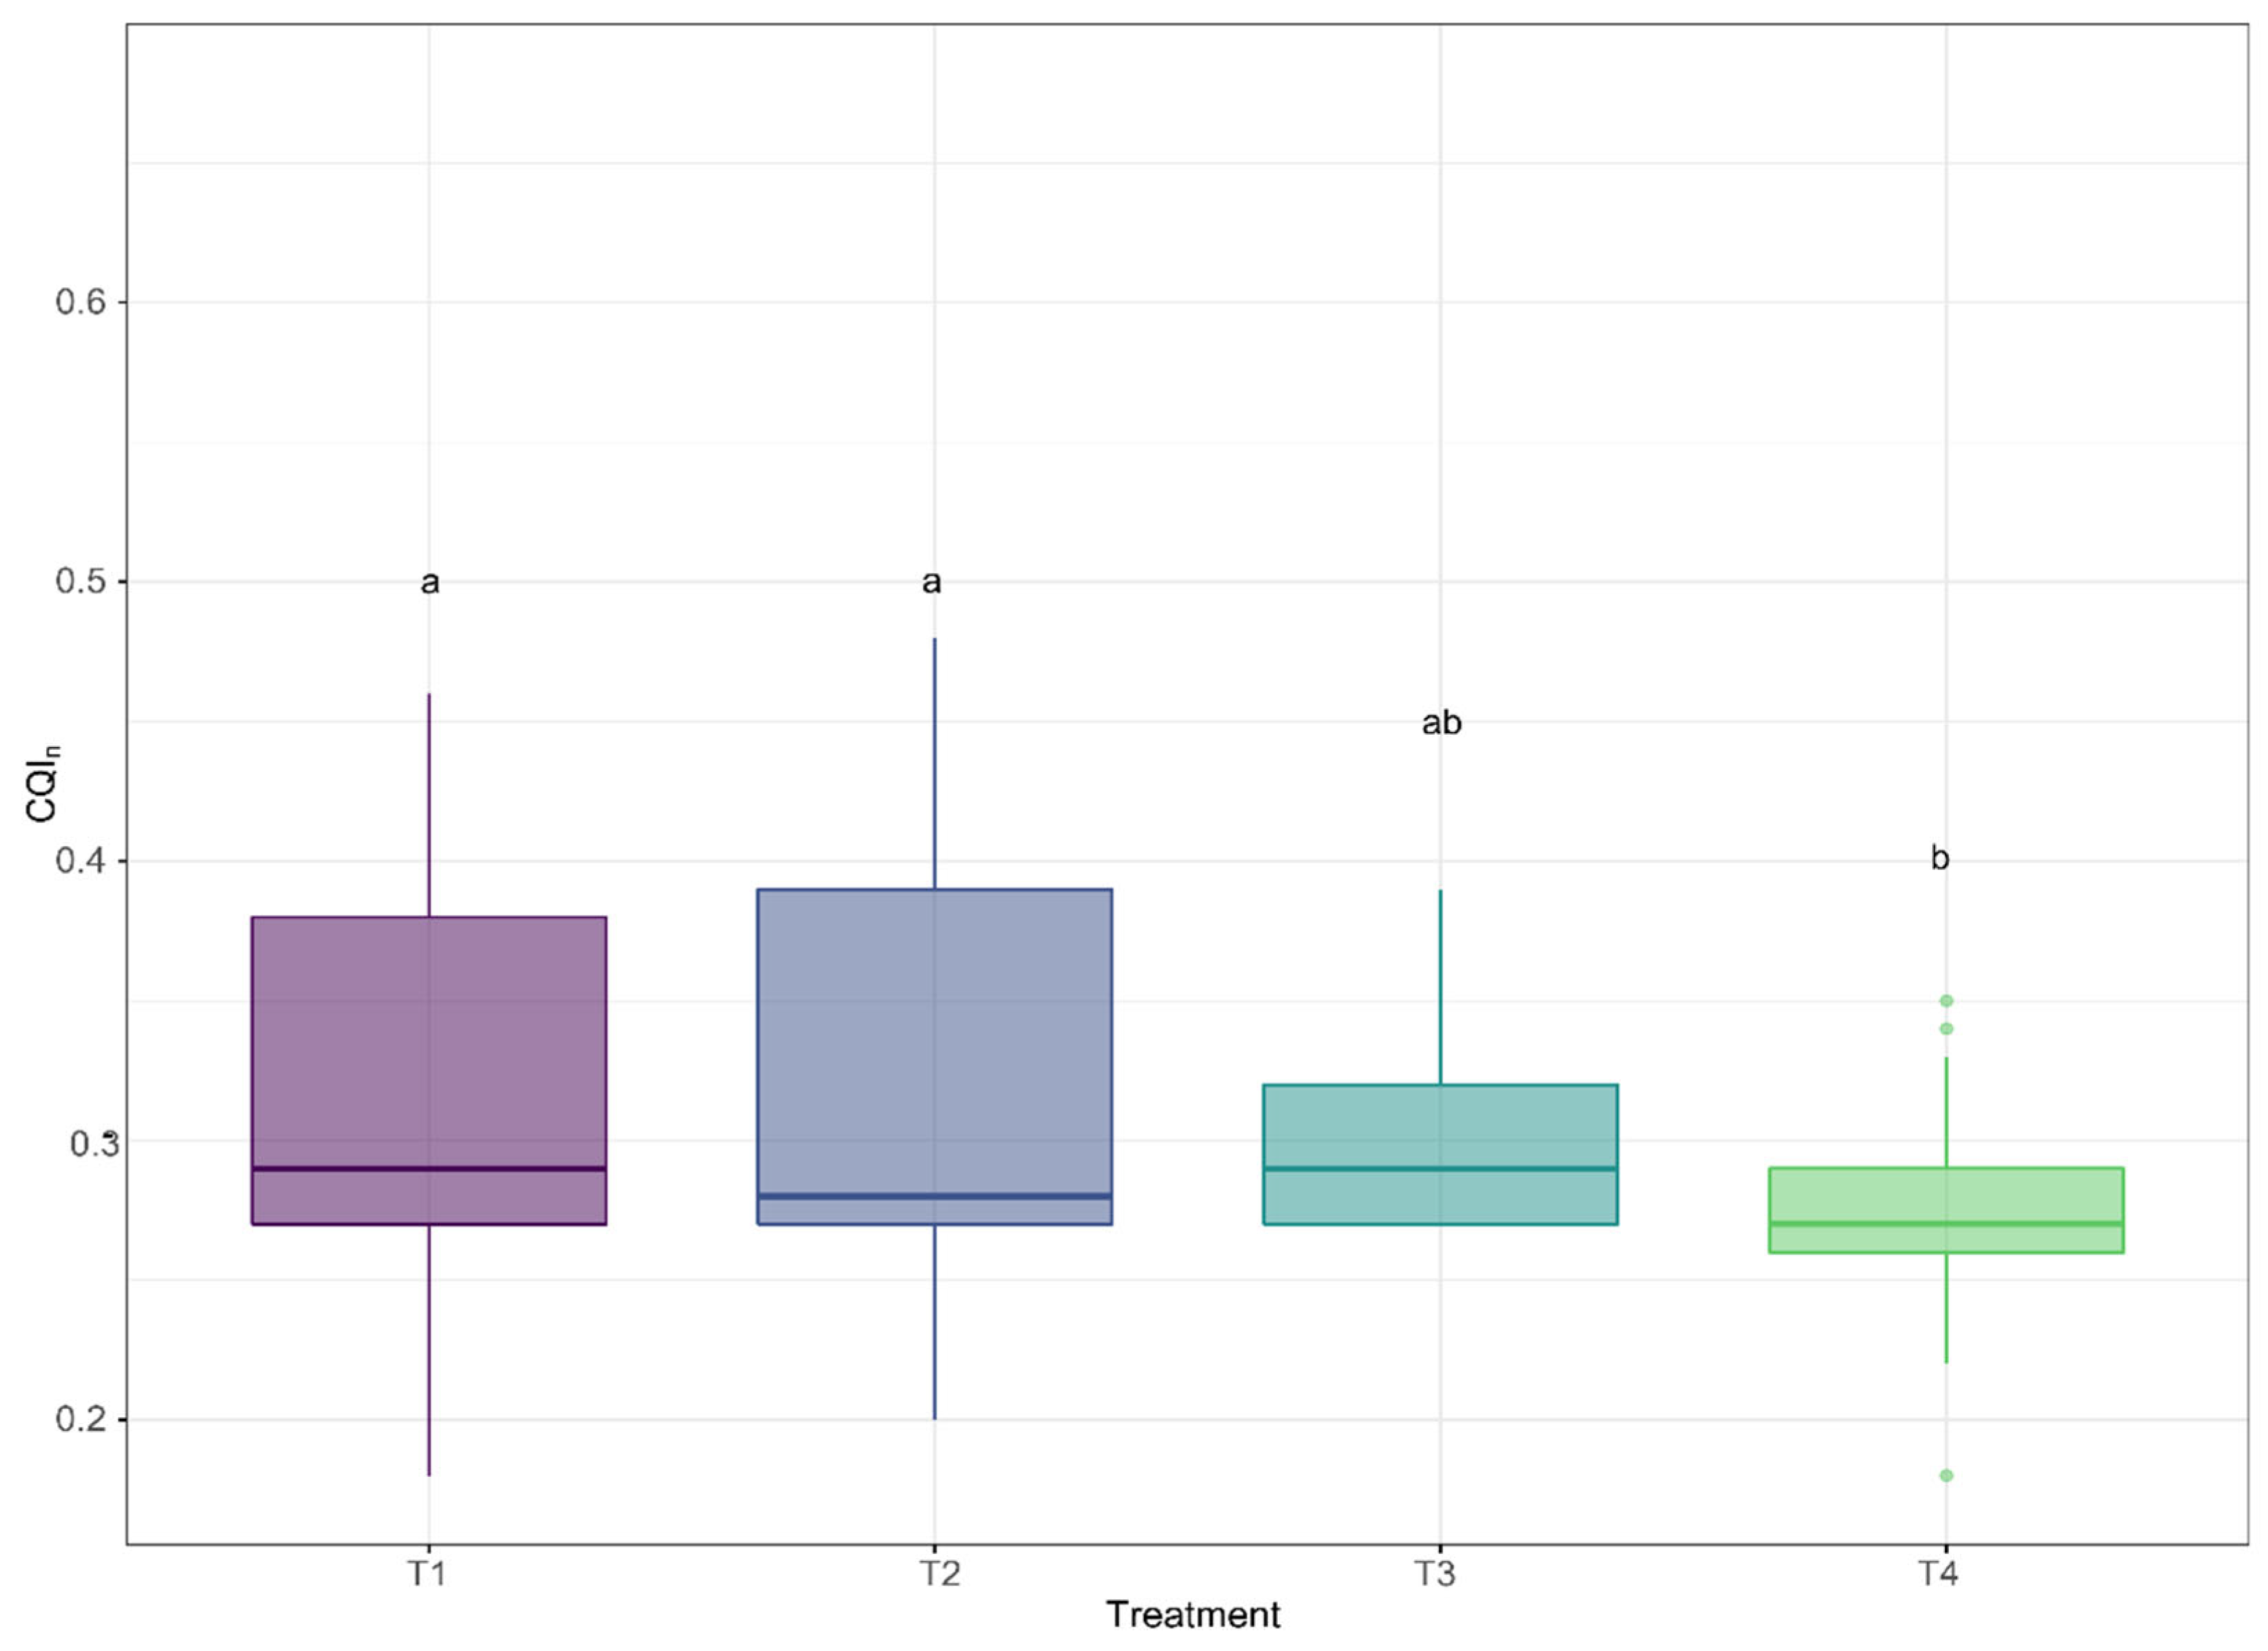
3.5. Establishment of CQIs
3.6. Applications, Challenges and Perspectives
4. Conclusions
Author Contributions
Funding
Institutional Review Board Statement
Informed Consent Statement
Acknowledgments
Conflicts of Interest
References
- Lu, Q.; He, Z.L.; Stoffella, P.J. Land Application of Biosolids in the USA: A Review. Appl. Environ. Soil Sci. 2012, 2012, 201462. [Google Scholar] [CrossRef]
- Ammar, E.; Maury, H.; Morin, L.; Sghir, A. Environmental, Economic, and Ethical Assessment of the Treated Wastewater and Sewage Sludge Valorization in Agriculture. In Interaction and Fate of Pharmaceuticals in Soil-Crop Systems; Pérez Solsona, S., Montemurro, N., Chiron, S., Barceló, D., Eds.; Springer Nature Switzerland: Cham, Switzerland, 2020; Volume 103, pp. 49–78. [Google Scholar]
- Comisión Nacional del Agua [CONAGUA]. Inventario Nacional de Plantas Municipales de Potabilización y de Tratamiento de Aguas Residuales En Operación; CONAGUA, 2020; Available online: https://files.conagua.gob.mx/conagua/publicaciones/Publicaciones/SGAPDS-2-22-a.pdf (accessed on 20 September 2022).
- Vergara Cid, C.; Ferreyroa, G.V.; Pignata, M.L.; Rodriguez, J.H. Biosolid Compost Amendment Increases Soil Fertility and Soybean Growth. J. Plant Nutr. 2021, 44, 1131–1140. [Google Scholar] [CrossRef]
- Medina-Herrera, M.D.R.; Negrete-Rodríguez, M.D.L.L.X.; Álvarez-Trejo, J.L.; Samaniego-Hernández, M.; González-Cruz, L.; Bernardino-Nicanor, A.; Conde-Barajas, E. Evaluation of Non-Conventional Biological and Molecular Parameters as Potential Indicators of Quality and Functionality of Urban Biosolids Used as Organic Amendments of Agricultural Soils. Appl. Sci. 2020, 10, 517. [Google Scholar] [CrossRef]
- Ploughe, L.W.; Akin-Fajiye, M.; Gagnon, A.; Gardner, W.C.; Fraser, L.H. Revegetation of Degraded Ecosystems into Grasslands Using Biosolids as an Organic Amendment: A Meta-analysis. Appl. Veg. Sci. 2021, 24, e12558. [Google Scholar] [CrossRef]
- Wijesekara, H.; Colyvas, K.; Rippon, P.; Hoang, S.A.; Bolan, N.S.; Manna, M.C.; Thangavel, R.; Seshadri, B.; Vithanage, M.; Awad, Y.M.; et al. Carbon Sequestration Value of Biosolids Applied to Soil: A Global Meta-Analysis. J. Environ. Manag. 2021, 284, 112008. [Google Scholar] [CrossRef]
- Bedolla-Rivera, H.I.; Negrete-Rodríguez, M.D.L.L.X.; Gámez-Vázquez, F.P.; Álvarez-Bernal, D.; Conde-Barajas, E. Comparison of Methodolgies of Soil Quality Indices (SQI) for Sodic Soil. Rev. Int. Contam. Ambient. 2022, 38, 317–334. [Google Scholar] [CrossRef]
- Medina-Herrera, M.D.R.; Negrete-Rodríguez, M.D.L.L.X.; Gámez Vázquez, F.P.; Álvarez Bernal, D.; Conde Barajas, E. La Aplicación de Lodos Residuales Afecta, a Corto Plazo, Biomasa Microbiana y Su Actividad En Suelos Sódicos. Rev. Int. Contam. Ambient. 2020, 36, 577–591. [Google Scholar] [CrossRef]
- Medina-Herrera, M.d.R.; Negrete-Rodríguez, M.d.l.L.X.; Bedolla-Rivera, H.I.; Prieto-Rojas, M.A.; Conde-Barajas, E. Short-Term Amendment of Biosolid on Agricultural Soil: Effects on C and N Mineralization and Microbial Activity. Acta Univ. 2022, 32, 1–16. [Google Scholar] [CrossRef]
- Secretaría de Medio Ambiente y Recursos Naturales [SEMARNAT]. NOM-004-SEMARNAT-2002; Diario Oficial de la Federación, 2003; Available online: http://dof.gob.mx/nota_detalle.php?codigo=%20691939&fecha=15/08/2003 (accessed on 20 September 2022).
- U.S. Environmental Protection Agency [US EPA]. Part 503—Standards for the Use or Disposal of Sewage Sludge. Electron. Code Fed. Regul. E-CFR 1993, 32, 839–871. [Google Scholar]
- Pan, J.; Li, R.; Zhai, L.; Zhang, Z.; Ma, J.; Liu, H. Influence of Palygorskite Addition on Biosolids Composting Process Enhancement. J. Clean. Prod. 2019, 217, 371–379. [Google Scholar] [CrossRef]
- Saldarriaga, J.F.; Gallego, J.L.; López, J.E.; Aguado, R.; Olazar, M. Selecting Monitoring Variables in the Manual Composting of Municipal Solid Waste Based on Principal Component Analysis. Waste Biomass Valorization 2019, 10, 1811–1819. [Google Scholar] [CrossRef]
- Peña, H.; Mendoza, H.; Diánez, F.; Santos, M. Parameter Selection for the Evaluation of Compost Quality. Agronomy 2020, 10, 1567. [Google Scholar] [CrossRef]
- Meena, M.D.; Dotaniya, M.L.; Meena, M.K.; Meena, B.L.; Meena, K.N.; Doutaniya, R.K.; Meena, H.S.; Moharana, P.C.; Rai, P.K. Maturity Indices as an Index to Evaluate the Quality of Sulphur Enriched Municipal Solid Waste Compost Using Variable Byproduct of Sulphur. Waste Manag. 2021, 126, 180–190. [Google Scholar] [CrossRef] [PubMed]
- Sekifuji, R.; Van Chieu, L.; Tateda, M. Investigation of Negative Effects of Rice Husk Silica on Komatsuna Growth Using Three Experiments. Int. J. Recycl. Org. Waste Agric. 2019, 8, 311–319. [Google Scholar] [CrossRef]
- Thomas, G.W. Soil PH and Soil Acidity. In Chemical Methods; Sparks, D.L., Page, A.L., Helmke, P.A., Loeppert, R.H., Soltanpour, P.N., Tabatabai, M.A., Johnston, C.T., Summer, M.E., Eds.; Soil Science Society of America: Madison, WI, USA, 2018; pp. 475–490. [Google Scholar]
- Hendrickx, J.M.H.; Das, B.; Corwin, D.L.; Wraith, J.M.; Kachanoski, R.G. Relationship Between Soil Water Solute Concentration and Apparent Soil Electrical Conductivity. In Methods of Soil Analysis: Part 4; Dane, J.H., Topp, G.C., Eds.; Soil Science Society of America: Madison, WI, USA, 2002; pp. 1275–1282. [Google Scholar]
- González-Arqueros, M.L.; Domínguez-Vázquez, G.; Alfaro-Cuevas-Villanueva, R.; Israde-Alcántara, I.; Buenrostro-Delgado, O. Hazardous Solid Waste Confined in Closed Dump of Morelia: An Urgent Environmental Liability to Attend in Developing Countries. Sustainability 2021, 13, 2557. [Google Scholar] [CrossRef]
- Tiquia, S.M.; Tam, N.F.Y.; Hodgkiss, I.J. Salmonella Elimination during Composting of Spent Pig Litter. Bioresour. Technol. 1998, 63, 193–196. [Google Scholar] [CrossRef]
- Khater, E.S.G. Some Physical and Chemical Properties of Compost. Int. J. Waste Resour. 2015, 5, 72–79. [Google Scholar] [CrossRef]
- Bremner, J.M. Nitrogen-Total. In Methods of Soil Analysis: Chemical Methods; Sparks, D.L., Page, A.L., Helmke, P.A., Loeppert, R.H., Soltanpour, P.N., Tabatabai, M.A., Johnston, C.T., Summer, M.E., Eds.; Soil Science Society of America: Madison, WI, USA, 2018; pp. 1085–1121. [Google Scholar]
- Conde, E.; Cardenas, M.; Ponce-Mendoza, A.; Luna-Guido, M.; Cruz-Mondragon, C.; Dendooven, L. The Impacts of Inorganic Nitrogen Application on Mineralization of C-Labelled Maize and Glucose, and on Priming Effect in Saline Alkaline Soil. Soil Biol. Biochem. 2005, 37, 681–691. [Google Scholar] [CrossRef]
- Alef, K.; Nannipieri, P. Methods in Applied Soil Microbiology and Biochemistry; Elsevier: London, UK, 1995; ISBN 978-0-12-513840-6. [Google Scholar]
- Walkley, A.; Black, I.A. An Examination of Different Methods for Determining Soil Organic Matter and a Proposed Modification of the Chromic Acid Titration Method. Soil Sci. 1934, 37, 29–38. [Google Scholar] [CrossRef]
- Yakovchenko, V.P.; Sikora, L.J.; Millner, P.D. Carbon and Nitrogen Mineralization of Added Particulate and Macroorganic Matter. Soil Biol. Biochem. 1998, 30, 2139–2146. [Google Scholar] [CrossRef]
- López, J.A.D. Optimización de la Fertilización Nitrogenada: Procedimientos de Análisis de Suelo, Toma de Muestra y Elección de Tipo de Fertilizante. Edafología 1999, 6, 73–84. [Google Scholar]
- Klute, A.; Page, A.L. (Eds.) . Methods of Soil Analysis, 2nd ed.; Agronomy; American Society of Agronomy: Soil Science Society of America: Madison, WI, USA, 1982; ISBN 978-0-89118-088-3. [Google Scholar]
- von Mersi, W.; Schinner, F. An Improved and Accurate Method for Determining the Dehydrogenase Activity of Soils with Iodonitrotetrazolium Chloride. Biol. Fertil. Soils 1991, 11, 216–220. [Google Scholar] [CrossRef]
- Kandeler, E.; Gerber, H. Short-Term Assay of Soil Urease Activity Using Colorimetric Determination of Ammonium. Biol. Fertil. Soils 1988, 6, 68–72. [Google Scholar] [CrossRef]
- Green, V.S.; Stott, D.E.; Diack, M. Assay for Fluorescein Diacetate Hydrolytic Activity: Optimization for Soil Samples. Soil Biol. Biochem. 2006, 38, 693–701. [Google Scholar] [CrossRef]
- Bedolla-Rivera, H.I.; Negrete-Rodríguez, M.d.l.L.X.; Medina-Herrera, M.d.R.; Gámez-Vázquez, F.P.; Álvarez-Bernal, D.; Samaniego-Hernández, M.; Gámez-Vázquez, A.J.; Conde-Barajas, E. Development of a Soil Quality Index for Soils under Different Agricultural Management Conditions in the Central Lowlands of Mexico: Physicochemical, Biological and Ecophysiological Indicators. Sustainability 2020, 12, 9754. [Google Scholar] [CrossRef]
- Tiquia, S.M.; Wan, H.C.; Tam, N.F.Y. Microbial Population Dynamics and Enzyme Activities during Composting. Compos. Sci. Util. 2002, 10, 150–161. [Google Scholar] [CrossRef]
- Patel, D.; Gismondi, R.; Alsaffar, A.; Tiquia-Arashiro, S.M. Applicability of API ZYM to Capture Seasonal and Spatial Variabilities in Lake and River Sediments. Environ. Technol. 2019, 40, 3227–3239. [Google Scholar] [CrossRef]
- Zuberer, D.A. Recovery and Enumeration of Viable Bacteria. In Methods of Soil Analysis; John Wiley & Sons, Ltd.: Hoboken, NJ, USA, 1994; pp. 119–144. ISBN 978-0-89118-865-0. [Google Scholar]
- Scheu, S.; Parkinson, D. Changes in Bacterial and Fungal Biomass C, Bacterial and Fungal Biovolume and Ergosterol Content after Drying, Remoistening and Incubation of Different Layers of Cool Temperate Forest Soils. Soil Biol. Biochem. 1994, 26, 1515–1525. [Google Scholar] [CrossRef]
- Wellington, E.M.H.; Toth, I.k. Actinomycetes. In Methods of Soil Analysis; John Wiley & Sons, Ltd.: Hoboken, NJ, USA, 1994; pp. 269–290. ISBN 978-0-89118-865-0. [Google Scholar]
- Sparling, G.P.; Williams, B.L. Microbial Biomas in Organic Soils: Estimation of Biomass C, and Effect of Glucose or Cellulose Amendments on the Amounts of N and P by Fumigation. Soil Biol. Biochem. 1986, 18, 507–513. [Google Scholar] [CrossRef]
- Jenkinson, D.S.; Powlson, D.S. The Effects of Biocidal Treatments on Metabolism in Soil—V. Soil Biol. Biochem. 1976, 8, 209–213. [Google Scholar] [CrossRef]
- Joergensen, R.G.; Brookes, P.C. Ninhydrin-Reactive Nitrogen Measurements of Microbial Biomass in 0.5 m K2SO4 Soil Extracts. Soil Biol. Biochem. 1990, 22, 1023–1027. [Google Scholar] [CrossRef]
- Anderson, T.H.; Domsch, K.M. Ratios of Microbial Biomass Carbon to Total Organic-C in Arable Soils. Soil Biol. Biochem. 1989, 21, 471–479. [Google Scholar] [CrossRef]
- Tiquia, S.M.; Tam, N.F.Y.; Hodgkiss, I.J. Effects of Composting on Phytotoxicity of Spent Pig-Manure Sawdust Litter. Environ. Pollut. 1996, 93, 249–256. [Google Scholar] [CrossRef]
- R Core Team R: Language and Environment for Statistical Computing 2021. Available online: https://www.r-project.org/index.html (accessed on 20 September 2022).
- Johnson, R.; Wichern, D. Applied Multivariate Statistical Analysis, 6th ed.; Pearson Education Limited: Edinburgh, UK, 2014; ISBN 978-1-292-02494-3. [Google Scholar]
- Muñoz-Rojas, M.; Erickson, T.E.; Dixon, K.W.; Merritt, D.J. Soil Quality Indicators to Assess Functionality of Restored Soils in Degraded Semiarid Ecosystems. Restor. Ecol. 2016, 24, S43–S52. [Google Scholar] [CrossRef]
- Mahajan, G.; Das, B.; Morajkar, S.; Desai, A.; Murgaokar, D.; Kulkarni, R.; Sale, R.; Patel, K. Soil Quality Assessment of Coastal Salt-Affected Acid Soils of India. Environ. Sci. Pollut. Res. 2020, 27, 26221–26238. [Google Scholar] [CrossRef]
- Zeraatpisheh, M.; Bakhshandeh, E.; Hosseini, M.; Alavi, S.M. Assessing the Effects of Deforestation and Intensive Agriculture on the Soil Quality through Digital Soil Mapping. Geoderma 2020, 363, 114139. [Google Scholar] [CrossRef]
- Villazón Gómez, J.; Martín-Gutiérrez, G.; Cobo-Vidal, Y. Análisis Multivariado de Las Propiedades Químicas de Los Suelos Pardos Erosionados. Cent. Agric. 2017, 44, 56–62. [Google Scholar]
- Bai, Z.; Caspari, T.; Gonzalez, M.R.; Batjes, N.H.; Mäder, P.; Bünemann, E.K.; de Goede, R.; Brussaard, L.; Xu, M.; Ferreira, C.S.S.; et al. Effects of Agricultural Management Practices on Soil Quality: A Review of Long-Term Experiments for Europe and China. Agric. Ecosyst. Environ. 2018, 265, 1–7. [Google Scholar] [CrossRef]
- Nabiollahi, K.; Taghizadeh-Mehrjardi, R.; Eskandari, S. Assessing and Monitoring the Soil Quality of Forested and Agricultural Areas Using Soil-Quality Indices and Digital Soil-Mapping in a Semi-Arid Environment. Arch. Agron. Soil Sci. 2018, 64, 696–707. [Google Scholar] [CrossRef]
- Yu, P.; Liu, S.; Zhang, L.; Li, Q.; Zhou, D. Selecting the Minimum Data Set and Quantitative Soil Quality Indexing of Alkaline Soils Under Different Land Sses in Northeastern China. Sci. Total Environ. 2018, 616, 564–571. [Google Scholar] [CrossRef]
- Lima, A.C.R.; Brussaard, L.; Totola, M.R.; Hoogmoed, W.B.; de Goede, R.G.M. A Functional Evaluation of Three Indicator Sets for Assessing Soil Quality. Appl. Soil Ecol. 2013, 64, 194–200. [Google Scholar] [CrossRef]
- Awasthi, M.K.; Wang, Q.; Chen, H.; Wang, M.; Awasthi, S.K.; Ren, X.; Cai, H.; Li, R.; Zhang, Z. In-Vessel Co-Composting of Biosolid: Focusing on Mitigation of Greenhouse Gases Emissions and Nutrients Conservation. Renew. Energy 2018, 129, 814–823. [Google Scholar] [CrossRef]
- Luo, G.; Li, L.; Friman, V.-P.; Guo, J.; Guo, S.; Shen, Q.; Ling, N. Organic Amendments Increase Crop Yields by Improving Microbe-Mediated Soil Functioning of Agroecosystems: A Meta-Analysis. Soil Biol. Biochem. 2018, 124, 105–115. [Google Scholar] [CrossRef]
- Zanor, G.A.; López Pérez, M.E.; Martínez Yáñez, R.; Ramírez Santoyo, L.F.; Gutiérrez Vargas, S.; León Galván, M.F. Mejoramiento de Las Propiedades Físicas y Químicas de Un Suelo Agrícola Mezclado Con Lombricompostas de Dos Efluentes de Biodigestor. Ing. Investig. Tecnol. 2018, 19, 1–10. [Google Scholar] [CrossRef]
- Jauregi, L.; Epelde, L.; Alkorta, I.; Garbisu, C. Antibiotic Resistance in Agricultural Soil and Crops Associated to the Application of Cow Manure-Derived Amendments From Conventional and Organic Livestock Farms. Front. Vet. Sci. 2021, 8, 633858. [Google Scholar] [CrossRef] [PubMed]
- Neubauer, M.E.; Miranda, J.P.; Ramírez, F.; Esquerra, A.; Vidal, G. Performance of the Kraft Mill Biosolids Compost and Their Quality Evaluation. Compos. Sci. Util. 2020, 28, 136–146. [Google Scholar] [CrossRef]
- Kacprzak, M.; Kupich, I.; Jasinska, A.; Fijalkowski, K. Bio-Based Waste’ Substrates for Degraded Soil Improvement—Advantages and Challenges in European Context. Energies 2022, 15, 385. [Google Scholar] [CrossRef]
- Batjiaka, R.; Brown, S. Creating Topsoils and Soil Conditioners from Biosolids and Urban Residuals. J. Environ. Qual. 2020, 49, 1020–1031. [Google Scholar] [CrossRef] [PubMed]
- Renuka, N.; Guldhe, A.; Prasanna, R.; Singh, P.; Bux, F. Microalgae as Multi-Functional Options in Modern Agriculture: Current Trends, Prospects and Challenges. Biotechnol. Adv. 2018, 36, 1255–1273. [Google Scholar] [CrossRef]
- Taiwo, A.M.; Gbadebo, A.M.; Oyedepo, J.A.; Ojekunle, Z.O.; Alo, O.M.; Oyeniran, A.A.; Onalaja, O.J.; Ogunjimi, D.; Taiwo, O.T. Bioremediation of Industrially Contaminated Soil Using Compost and Plant Technology. J. Hazard. Mater. 2016, 304, 166–172. [Google Scholar] [CrossRef]
- Rastogi, M.; Nandal, M.; Nain, L. Seasonal Variation Induced Stability of Municipal Solid Waste Compost: An Enzyme Kinetics Study. SN Appl. Sci. 2019, 1, 1–16. [Google Scholar] [CrossRef]
- Marzi, M.; Shahbazi, K.; Kharazi, N.; Rezaei, M. The Influence of Organic Amendment Source on Carbon and Nitrogen Mineralization in Different Soils. J. Soil Sci. Plant Nutr. 2020, 20, 177–191. [Google Scholar] [CrossRef]
- Han, S.; Luo, X.; Tan, S.; Wang, J.; Chen, W.; Huang, Q. Soil Aggregates Impact Nitrifying Microorganisms in a Vertisol Under Diverse Fertilization Regimes. Eur. J. Soil Sci. 2020, 71, 536–547. [Google Scholar] [CrossRef]
- Tao, R.; Li, J.; Hu, B.; Shah, J.A.; Chu, G. A 2-year Study of the Impact of Reduced Nitrogen Application Combined with Double Inhibitors on Soil Nitrogen Transformation and Wheat Productivity under Drip Irrigation. J. Sci. Food Agric. 2021, 101, 1772–1781. [Google Scholar] [CrossRef] [PubMed]
- Wendeborn, S. The Chemistry, Biology, and Modulation of Ammonium Nitrification in Soil. Angew. Chem. Int. Ed. 2020, 59, 2182–2202. [Google Scholar] [CrossRef]
- Awasthi, M.K.; Wang, Q.; Chen, H.; Awasthi, S.K.; Wang, M.; Ren, X.; Zhao, J.; Zhang, Z. Beneficial Effect of Mixture of Additives Amendment on Enzymatic Activities, Organic Matter Degradation and Humification during Biosolids Co-Composting. Bioresour. Technol. 2018, 247, 138–146. [Google Scholar] [CrossRef] [PubMed]
- Lamizadeh, E.; Enayatizamir, N.; Motamedi, H. Difference in Some Biological Properties of Saline and Non-Saline Soil under Sugarcane Cultivation. Eurasian Soil Sci. 2019, 52, 690–695. [Google Scholar] [CrossRef]
- Li, Y.; Chen, Y.; Chen, Y.; Wu, Y.; Zhang, C.; Peng, Z.; Liu, Y.; Wang, S.; Xu, R.; Zeng, Z. Effects of Physico-Chemical Parameters on Actinomycetes Communities during Composting of Agricultural Waste. Sustainability 2019, 11, 2229. [Google Scholar] [CrossRef]
- Cáceres, R.; Malińska, K.; Marfà, O. Nitrification within Composting: A Review. Waste Manag. 2018, 72, 119–137. [Google Scholar] [CrossRef]
- Domeizel, M.; Khalil, A.; Prudent, P. UV Spectroscopy: A Tool for Monitoring Humification and for Proposing an Index of the Maturity of Compost. Bioresour. Technol. 2004, 94, 177–184. [Google Scholar] [CrossRef] [PubMed]
- Robledo-Mahón, T.; Martín, M.A.; Gutiérrez, M.C.; Toledo, M.; González, I.; Aranda, E.; Chica, A.F.; Calvo, C. Sewage Sludge Composting under Semi-Permeable Film at Full-Scale: Evaluation of Odour Emissions and Relationships between Microbiological Activities and Physico-Chemical Variables. Environ. Res. 2019, 177, 108624. [Google Scholar] [CrossRef] [PubMed]


| Heavy Metal (mg kg−1) | Samples | NOM-004-SEMARNAT-2002 and EPA 503 | |
|---|---|---|---|
| BS | BM | ||
| As | 8.401 | 1.475 | 41 |
| Cd | 0.638 | <0.005 | 39 |
| Cr | 33.22 | 3.46 | 1200 |
| Cu | 123.00 | 19.00 | 1500 |
| Hg | <1.00 | <1.00 | 17 |
| Ni | <0.25 | <0.25 | 420 |
| Pb | 215.20 | 135.9 | 300 |
| Zn | 714.00 | 116.0 | 2800 |
| Indicators | BS | BM |
|---|---|---|
| T | 44.4 | 25.6 |
| M | 47.1 | 41.1 |
| pH | 7.2 | 9.9 |
| EC | 1.9 | 2.3 |
| BD | 0.09 | --- |
| N-NO2− | 0.014 | 0.019 |
| N-NO3− | 0.474 | 3.103 |
| N-NH4+ | 0.006 | 0.000 |
| Nmin | 1.36 | 4.86 |
| NI | 0.0168 | 0.0001 |
| N-NH3+ | 11.2 | 20.9 |
| TN | 0.32 | 0.08 |
| SOC | 35.0 | 56.0 |
| TOC | 7.8 | 4.26 |
Publisher’s Note: MDPI stays neutral with regard to jurisdictional claims in published maps and institutional affiliations. |
© 2022 by the authors. Licensee MDPI, Basel, Switzerland. This article is an open access article distributed under the terms and conditions of the Creative Commons Attribution (CC BY) license (https://creativecommons.org/licenses/by/4.0/).
Share and Cite
Bedolla-Rivera, H.I.; Conde-Barajas, E.; Galván-Díaz, S.L.; Gámez-Vázquez, F.P.; Álvarez-Bernal, D.; Xochilt Negrete-Rodríguez, M.d.l.L. Compost Quality Indexes (CQIs) of Biosolids Using Physicochemical, Biological and Ecophysiological Indicators: C and N Mineralization Dynamics. Agronomy 2022, 12, 2290. https://doi.org/10.3390/agronomy12102290
Bedolla-Rivera HI, Conde-Barajas E, Galván-Díaz SL, Gámez-Vázquez FP, Álvarez-Bernal D, Xochilt Negrete-Rodríguez MdlL. Compost Quality Indexes (CQIs) of Biosolids Using Physicochemical, Biological and Ecophysiological Indicators: C and N Mineralization Dynamics. Agronomy. 2022; 12(10):2290. https://doi.org/10.3390/agronomy12102290
Chicago/Turabian StyleBedolla-Rivera, Héctor Iván, Eloy Conde-Barajas, Sandra Lizeth Galván-Díaz, Francisco Paúl Gámez-Vázquez, Dioselina Álvarez-Bernal, and María de la Luz Xochilt Negrete-Rodríguez. 2022. "Compost Quality Indexes (CQIs) of Biosolids Using Physicochemical, Biological and Ecophysiological Indicators: C and N Mineralization Dynamics" Agronomy 12, no. 10: 2290. https://doi.org/10.3390/agronomy12102290