Article

Low Outcrossing from an Apple Field Trial Protected with Nets

1
Breeding Research, Research Division Plant Breeding, Agroscope, Mueller-Thurgau-Strasse 29, 8820 Waedenswil, Switzerland
2
Molecular Plant Breeding, Institute of Agricultural Sciences, ETH Zurich, Universitaetstrasse 2, 8092 Zurich, Switzerland
3
Biosafety Research Group, Research Division Agroecology and Environment, Agroscope, Reckenholzstrasse 191, 8046 Zurich, Switzerland
*
Author to whom correspondence should be addressed.
These authors contributed equally to this work.
Agronomy 2021, 11(9), 1754; https://doi.org/10.3390/agronomy11091754
Submission received: 30 June 2021 / Revised: 20 August 2021 / Accepted: 30 August 2021 / Published: 31 August 2021
(This article belongs to the Special Issue Biotechnological Tools Applied to Fruit Trees Breeding)

Abstract

:
Regulatory compliance of experimental releases into the environment of not yet approved genetically modified plants often requires implementation of measures to reduce the dispersal of reproductive material. To study the impact of nets on pollen flow in an experimental field site in Switzerland, non-GM apple varieties ‘Ladina’ and ’Nicogreen’ were planted inside and outside a netted plot, respectively. Seeds harvested from mature fruits were germinated and the paternal variety of the seedlings was determined using simple sequence repeat (SSR) molecular markers. We demonstrate that pollination frequency from trees inside the netted plot to trees outside over a two-year (2018 and 2019) study of 4500 seedlings is 0.6% (26 seedlings). Moreover, these outcrossing events decreased with increasing distance from the pollen donor. Over the study period, we found on average 0.9%, 0.5%, 0.4% and 0.09% of the seedlings derived from apples of ‘Nicogreen’ trees at 8 m, 15 m, 72 m and 117 m being generated by fertilisations of ‘Ladina’ pollen, respectively. In comparison, 48.3% (2018 season) and 75.1% (2019 season) of examined ‘Ladina’ seedlings in the netted plot originated from ‘Nicogreen’ tree pollen outside the netted plot. The results suggest that insect netting is effective in minimizing egress of apple pollen from an experimental site and that the likelihood of outcrossing is reduced further (<0.1%) when there are no compatible apple trees within a radius of 100 m of the pollen donor. These data are important for biosafety research/regulation to aid understanding of pollen flow in experimental field sites.

1. Introduction

The genetic modification of apple is particularly convenient as it reduces the time and resources needed to introduce novel traits (e.g., disease resistance), while retaining the valuable consumer-driven characteristics of the variety. However, the transmission of genetically modified (GM) material outside of the experimental stand needs to be minimized with lines not approved for unconfined release. Simple practices such as collection of wood after pruning and the disposal of apples approaching maturity are effective at managing the dispersal of material. Minimising pollen dispersal, however, is more difficult to accomplish. Apple pollen is spread mainly by the honeybee [1] but also by other insects including wild bees, bumblebees, hoverflies and owl moths [2,3] and also by wind on short distances. Pollinating insects can travel several kilometers [4,5] and the pollen can remain viable for up to several weeks [3]; thus, limiting insect movement with nets could minimise pollen transfer. Additionally, other measures such as distancing experimental plots from commercial orchards, or by the removal of flowers prior to opening could further aid in reducing pollen spread.
Few studies have quantified apple pollen dispersal in orchards without differentiating between wind- and insect-mediated pollen flow. For example, Reim et al. [6] used the hybrid TNR 31–35 (which carries the homozygous dominant gene responsible for red pigmentation of all parts of the tree) to study the dispersal of pollen in an open apple tree collection by gathering data of seedlings that have the red TNR 31–35 phenotype. Compiling data from two years, Reim et al. [6] found on average 4% of red seedlings among all the seedlings derived from the apples of trees between 0 m to 10 m from TNR 31–35 Thereafter, 1.3%, 0.3% and 0.4% of the red seedlings were found at 11 m to 30 m, 31 m to 60 m and 61 m to 105 m, respectively. Considering only the distribution of the red seedlings, 69% resp. 91% were found within 10 or 60 m from TNR 31–35. At distances between 61 m and 105 m, only 9% of all the red seedlings were found. Notably, by using TNR 31–35 as a pollen donor for pollen flow studies, the measured cross-fertilisation rate, defined by Kron et al. [7] realised pollen dispersal, would be double compared to that of a pollen donor that is hemizygous for the trait.
In another experiment, Soejima [8] used crabapples that are heterozygous for the red-leaf phenotype and observed that about 75% of the red-leafed seedlings were derived from trees within just 10 m or about 95% within 60 m from the pollen donor. The maximal realised pollen dispersal was at 150 m. Tyson et al. [9] monitored the dispersal of pollen from GM ‘Gala’ carrying the GUS marker gene (at heterozygous state) and found a steep decline in the occurrence of transgenic seedlings within the first 30 m surrounding the GM ‘Gala’ tree. The maximal realised pollen dispersal was at 137 m accounting for 0.24% of the 1234 analysed seedlings derived from the GM donor. Kron et al. [7] also examined pollen dispersal in two different orchards and showed that 44% (1st orchard) and 80% (2nd orchard) of all seeds produced by the pollen donor were found within approximately 14.5 m of the donor. At 73.5 m and 86 m from the pollen donor, approximately 20% and 1% of seedlings were transgenic in the two orchards, respectively. The variation in realised pollen dispersal was attributed to the different recipient apple varieties in the two orchards that had asynchronous flowering times compared to the pollen donor. Rather than using transgenic markers to measure pollen flow, Larsen and Kjaer [10] resp. Reim et al. [11] examined the outcrossing in natural populations of crabapple. Both studies concluded that outcrossing within a distance of 50 m from the pollen donor is common but outcrossing at a distance of 300 to 500 m [10] or 10.7 km [11] is possible but infrequent.
Kato and Soejima [12] and Soejima [8] studied the effect of wind on outcrossing in apple. They examined the realised pollen dispersal on trees covered with non-woven fabric cloth, which prevented insects to visit the apple flowers. Under these conditions, realised pollen dispersal was found just up to 1 m and very few fruits developed on the apple trees. Using pollen traps, Reim et al. [6] reported that apple pollen can travel for a maximum of 20 m exclusively by wind.
In this study, we measured pollen flow between non-GM pollen donors and recipient cultivars separated by insect netting. The percentage of seedlings originating from reciprocal fertilisations of ‘Ladina’ (grown in a netted block) and ‘Nicogreen’ (grown outside the net), as well as between these two cultivars and ‘Glockenapfel’ (located outside the experimental area) was determined using simple sequence repeats (SSR) markers. The results provide an insight into the extent that netting and planting distance affect outcrossing. This information will be relevant for the determination of appropriate biosafety measures when growing GM apple trees in the field.

2. Materials and Methods

2.1. Plant Material and Experimental Field Design

The netted block (30 m × 70 m), named “Block 0”, was managed at Agroscope, Zurich—Reckenholz, Switzerland and installed for field trials with GM ‘Gala’ apple trees [13]. In accordance with government regulations, flowers of GM ‘Gala’ trees, as well as non-GM ‘Gala’ control genotypes (‘Gala’ natural sport mutants) were removed and destroyed to avoid GM-pollen dispersal [14]. Two non-GM varieties, ‘Ladina’ (inside Block 0) and ‘Nicogreen’ (outside Block 0) with similar flowering time [15] were used to assess pollen dispersal. They are 100% cross-compatible (the S-alleles of ‘Ladina’ and ‘Nicogreen’ are S5S9 and S3S23, respectively) and ‘Ladina’ is not cultivated in the region of the experimental site. In Spring 2016, five blocks (A to E) that are positioned at different orientations and distances to Block 0 were planted with ten trees each of two-year-old ‘Nicogreen’ trees (supplied by Better3Fruits, Rillaar, Belgium) (Figure 1). Within Block 0, 48 two-year-old ’Ladina’ trees (six rows, each with eight trees supplied by Agroscope, Wädenswil, Switzerland) were interplanted with trial trees at 7.2 m apart and 3.5 m between rows. In Spring 2018, seven ‘Nicogreen’ trees in Block D that had died during the winter were replaced with two-year-old trees. Approximately 260 m from Block 0 were seven, approximately 50-year-old, high-stem ‘Glockenapfel’ trees. The S-genotype of ‘Glockenapfel’ is S11S40 (A. Peil; personal communication), which is 100% cross-compatible with both ‘Ladina’ and ‘Nicogreen’ and all have similar flowering periods. These trees were included in the data collection to assess further the effectiveness of the netting system for reducing pollen flow from outside to inside Block 0.

2.2. Netting of Block 0

The sides of Block 0 comprised insect nets (0.9 mm x 1 mm mesh size), which were buried approximately 30 cm into the ground. The roof consisted of hail-protection nets (3 mm × 7 mm mesh size) that were connected to each other with zippers. Hail-protection and insect nets on the longer sides of Block 0 were sewn together, whereas on the shorter sides, nets were held together by the tension exercised by the fixation of the hail-protection nets. The entrance of Block 0 was a two-door, interlock system comprised of insect nets. Hail nets remained open during the winter to prevent damage by snow and were closed about four (2018) respectively two weeks (2019) before ‘Ladina’ and ‘Nicogreen’ started flowering. During the flowering period, insect trapping stations (blue, white and yellow pots filled with diluted detergent) were placed inside Block 0, as well as close to each of the ‘Nicogreen’ Blocks A to D. Monitoring data of insect populations will be published separately.

2.3. Apple Harvest, Seedling Growth and DNA Extraction

‘Nicogreen’ and ‘Ladina’ seeds were extracted from apples harvested at fruit maturity. ‘Ladina’ seeds were pooled by tree, while ‘Nicogreen’ seeds were pooled by block. Seeds were stratified at 4 °C in humid sand for six to eight weeks prior to sowing in 4 × 6 trays (Quick Pot QP 24 T/13, HerkuPlast, Kubern GmbH, Germany) and maintained in a glasshouse. Due to the large number of seeds available from Blocks A, B (in both years) and C (in 2018), approximately 800 seeds were sown for Blocks A and B and approximately 1100 seeds were sown from Block C, the block furthest from Block 0. A 0.8 mm diameter core borer was used to sample leaf material from seedlings (at the four-leaf stage) and DNA was extracted using the Extract-N-Amp™ Plant PCR Kit following the manufacturer’s protocol (Sigma-Aldrich, Buchs, Switzerland).

2.4. PCR Amplification of SSR Markers

Based on the recommendations of the Malus/Pyrus Working Group of the European Cooperative Programme for Plant Genetic Resources (ECPGR) [16] for fingerprinting and determination of the paternity of the seedlings, seven highly informative markers (from seven different linkage groups) for ‘Ladina’, ‘Nicogreen’ and ‘Glockenapfel’ were selected (Table 1). The SSR markers were PCR-amplified using oligonucleotide primers described previously [17,18]. In 2018, two multiplex reactions (containing a total of seven SSR markers) and template DNA extracted from the seedlings were assembled using the QIAGEN Multiplex PCR Kit (QIAGEN GmbH, Hilden, Germany). In 2019, six of the seven SSR markers used in the previous year were combined into a single multiplex PCR (Table 1). Reactions were performed in a SensoQuest thermocycler (SensoQuest GmbH, Göttingen, Germany) using the following cycling conditions: 15 min at 95 °C, then 35 cycles of 30 s at 94 °C, 90 s at 60 °C, 60 s at 72 °C, and a final 30 min at 60 °C. For fragment analysis, 1 µL of the 1:100 diluted PCR product (2018 samples) or 1 µL of undiluted PCR product (2019 samples) were mixed with Hi-DiTM-Formamide containing the fluorescent size standard GeneScan™ 500 LIZ™ Dye Size Standard, according to the manufacturer’s guidelines (Applied Biosystems, Waltham, MA, USA). These samples were denatured for 5 min at 95 °C before loading on the sequencers. All samples from the 2018 harvest and the ‘Nicogreen’ samples from 2019 were processed on an ABI 3730 DNA Analyzer (Applied Biosystems, Waltham, MA, USA) at the Genetic Diversity Centre of ETH Zurich, Switzerland. ‘Ladina’ samples from the 2019 harvest were processed on a SeqStudioTM Genetic Analyzer (Applied Biosystems, Waltham, MA, USA) at Agroscope Research Station in Wädenswil, Switzerland. GeneMapper™ software, version 5.0 (Applied Biosystems, Waltham, MA, USA) was used for data analysis.

2.5. SSR Data Analysis of Apple Seedlings

Paternity identification of the seedlings was performed. After allele calling, the two 3-digit alleles of each SSR marker (e.g., 174 and 182), ordered for increasing sizes, were concatenated into a 6-digit code (e.g.,174,182). The codes were then compared with the codes obtained from all the hypothetical combinations of alleles of the SSR markers from: ‘Ladina’ × [‘Gala’, ‘Ladina’ (selfing), ‘Nicogreen’, or ‘Glockenapfel’], and ‘Nicogreen’ × [‘Gala’, ‘Ladina’, ‘Nicogreen’ (selfing), or ‘Glockenapfel’]. This analysis was performed using a script in R (Version 4.0.2, [19]).
In this study, the ‘Nicogreen’ seedlings that were derived from ‘Ladina’ pollen were named NL, and the ‘Ladina’ seedling derived from a ‘Nicogreen’ pollination as LN. Similarly, the ‘Nicogreen’ and ‘Ladina’ seedlings that have been derived from a pollination with ‘Glockenapfel’ were named NG and LG, respectively. Two different approaches were used to analyse the seedlings. In 2018, all ‘Ladina’ seedlings were tested with multiplex 1 (M1, 4 SSRs) and 2 (M2, 3 SSRs) (Table 1). The ‘Nicogreen’ seedlings in 2018 were analysed with a two-step approach. First, all seedlings were analysed with M1 and only those that were potential NLs were analysed with the second multiplex. The ‘Ladina’ seedlings that failed to amplify one or more SSR markers of M1 were retested if they were potentially LNs. ‘Nicogreen’ seedlings from blocks with at least 400 seedlings with a full set of M1 markers (i.e., data from all four markers available) were not repeated. Below this threshold, the analysis was repeated for the seedlings showing missing data. On the contrary, analysis with M2 SSR markers was repeated only for all potential NL or LN. For the identification of the NG seedlings of 2018, a subset of seedlings of the Blocks A, B and E (about 800 seedlings in total) were tested with M2. No additional analysis was necessary for the identification of the LG seedlings, as all ‘Ladina’ seedlings were systematically tested with M1 and M2.
All samples of 2019 were analysed with a single multiplex (M3) containing six SSR markers that were also included in M1 or M2. The advantage of this approach is that all data are available in a single step, even though more data needed to be processed and curated compared to the two-step approach. Seedlings with incomplete dataset but potentially NL or LN, were re-analysed (including re-extraction of DNA). The identification of NG and LG seedlings was only performed for seedlings with a complete dataset.
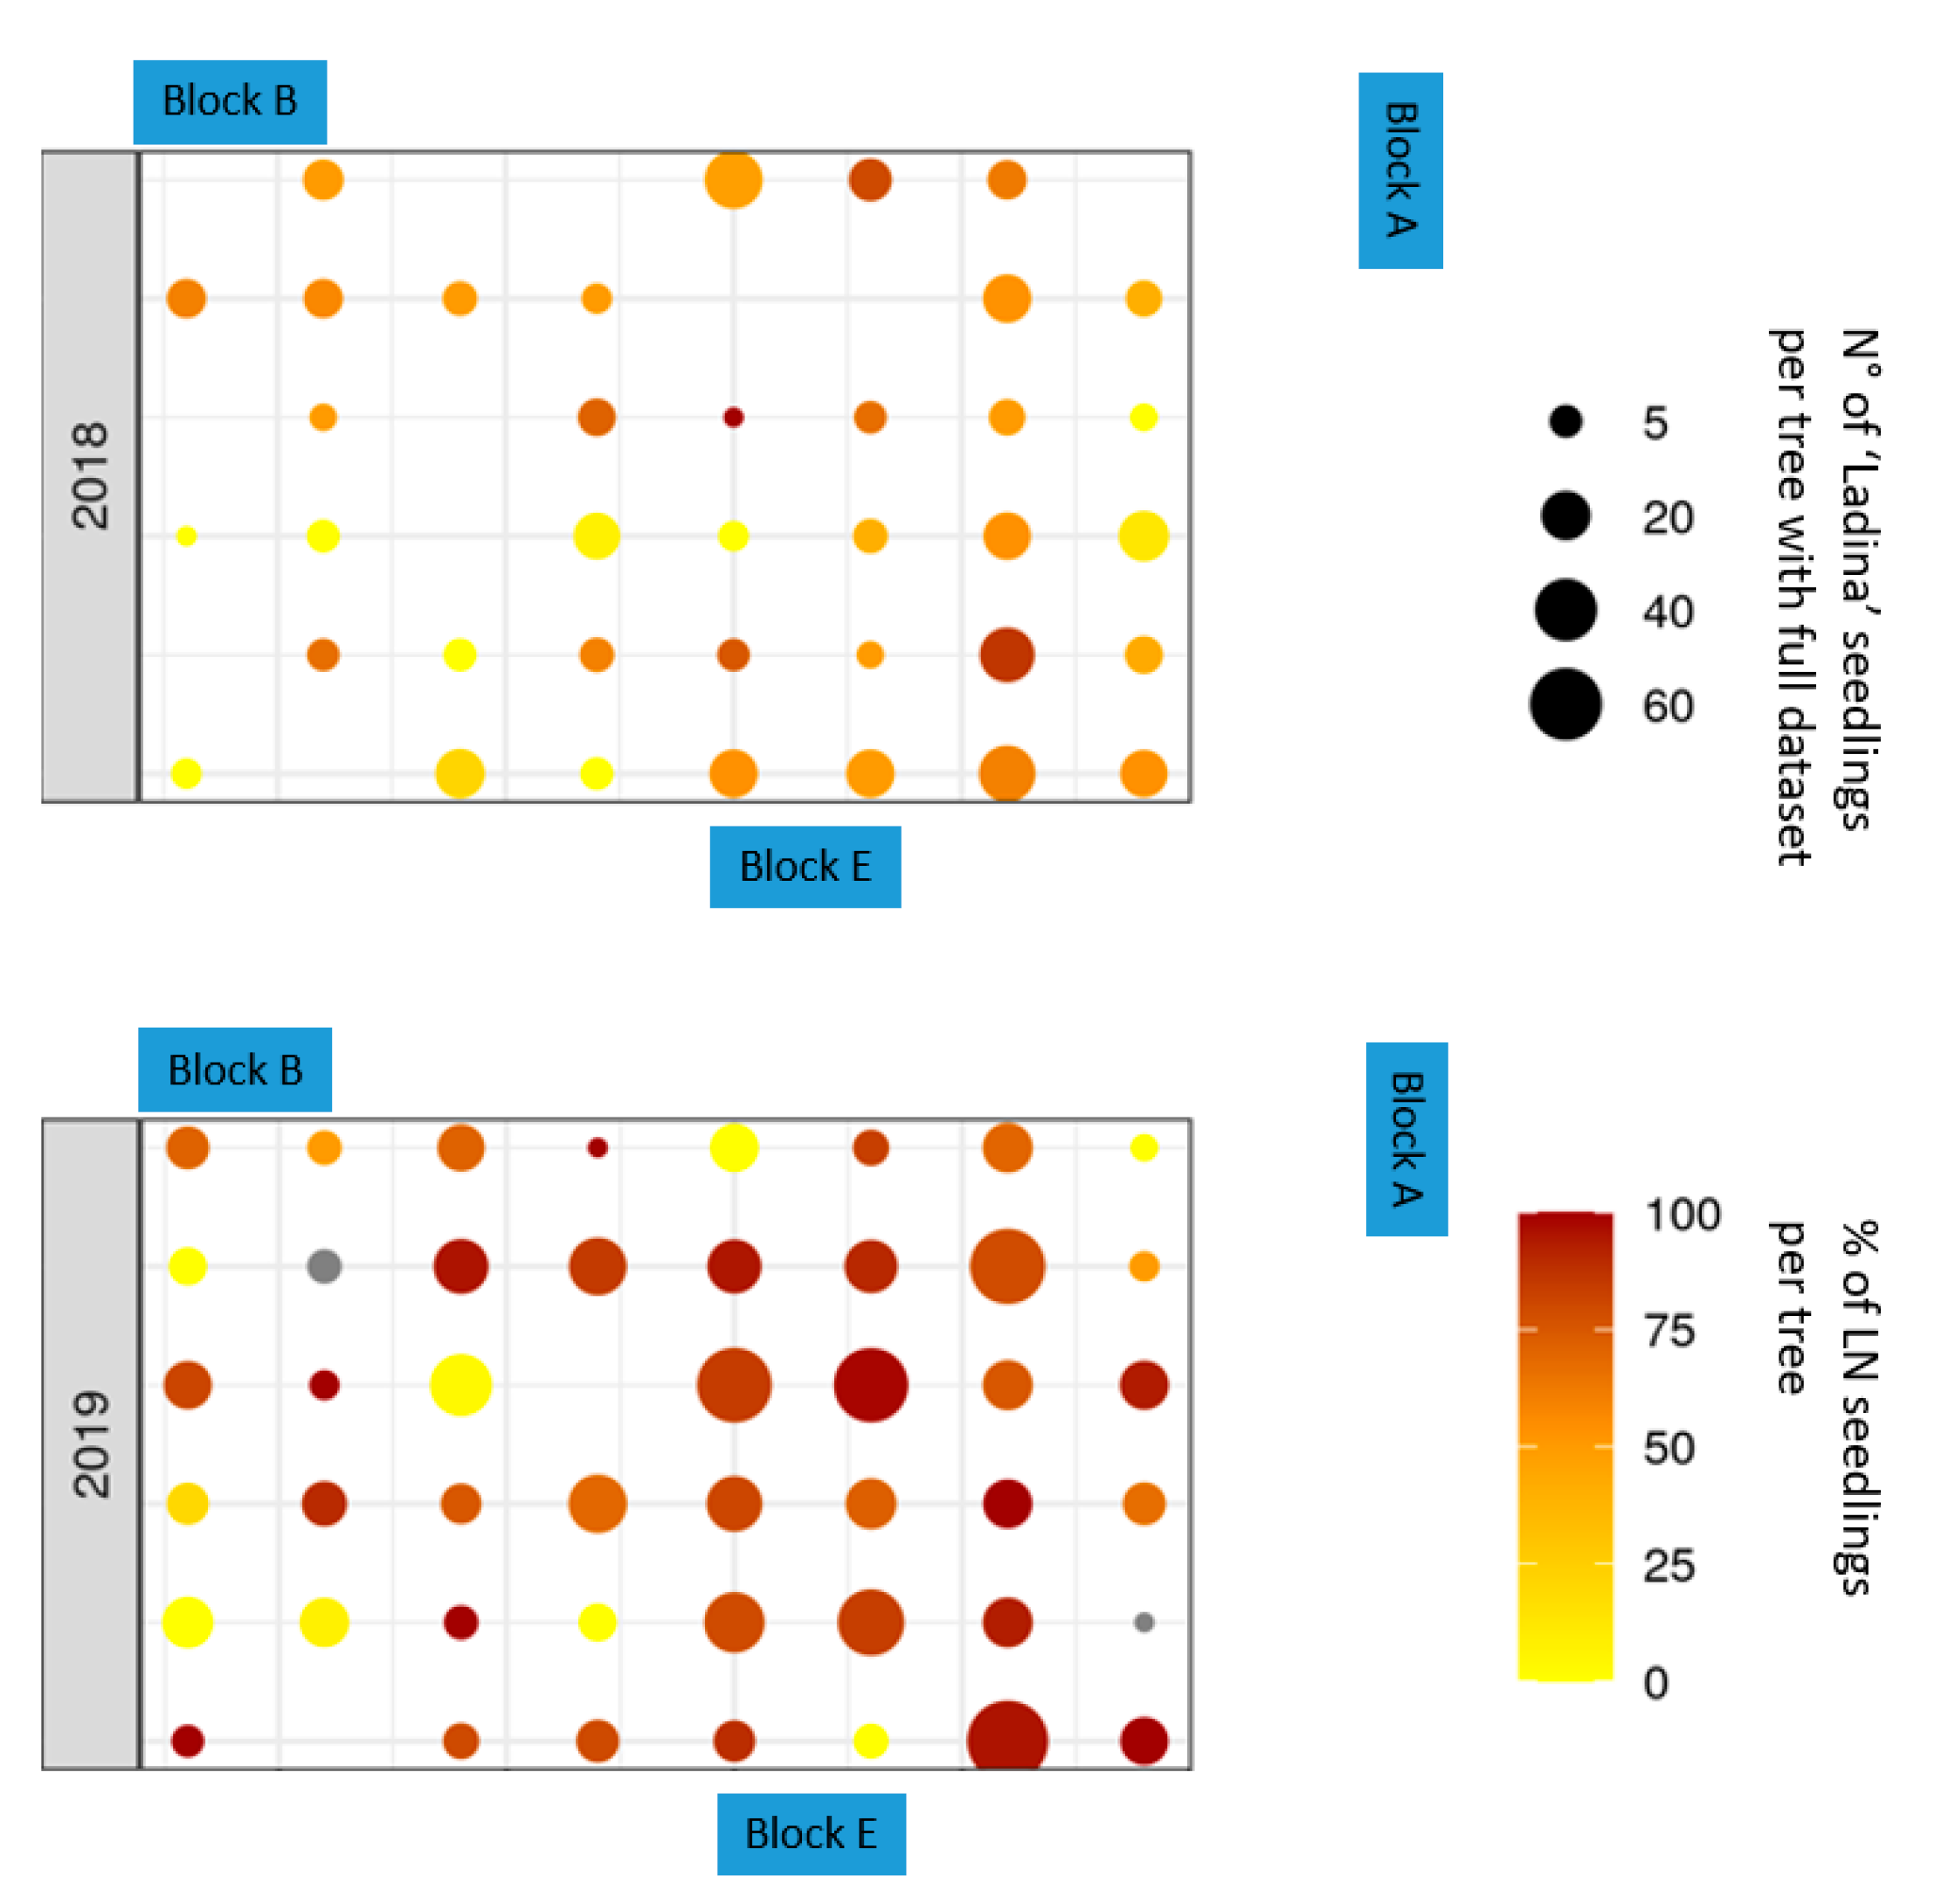
The distribution of the LN seedlings within the netted orchard was graphically investigated to detect potential clustering near the ‘Nicogreen’ blocks. The plots were generated in R software with the ggplot2 package [20].

3. Results

3.1. Egress of Pollen via the Netting System

In 2018, ‘Nicogreen’ trees in Block D produced the fewest apples (98), while Block C produced the most apples (855, Table 2). Due to the large number of apples harvested from Block C, approximately 50% of them were randomly selected for analysis. The seedlings were screened sequentially with two multiplex SSR tests (M1 and M2). From the 3434 available seedlings (Blocks A to E), a complete M1 profile was generated for 3215 samples, of which 490 seedlings (15%) were potentially derived from ‘Nicogreen’ self-pollinations (selfings). These progeny were not analysed with M2 SSR markers. Forty ‘Nicogreen’ seedlings out of the remaining 2725 (1.5%) were predicted to be NL seedlings based on M1 data but this was reduced to 16 seedlings after testing with the additional three SSR markers (M2 set). Block B had the highest number of NL seedlings (10) and the highest realised pollen dispersal at 1.7% followed by Block A with three NL seedlings and a realised pollen dispersal of 0.5%. In each of the remaining three Blocks (C, D and E) only one NL seedling was identified, corresponding to a realised pollen dispersal of 0.1%, 0.4% and 0.2%, respectively (Figure 1).
In 2019, the trees of Block A produced the most apples (545) and Block C the fewest (133, Table 3). A complete profile using M3 SSR markers was generated for 1839 out of 2148 seedlings. Sixty-four seedlings (3.5%) were derived from self-pollination and were therefore removed from the total number of potentially out-crossed seedlings (1775). A total of ten (0.6%) NL seedlings were identified. Block B had the highest number of NL seedlings (5) with a realised pollen dispersal of 1.1%. The Blocks A, D and E had two, one and two NL seedlings, respectively, corresponding to similar realised pollen dispersals of 0.5–0.6%. In Block C, no NL seedlings were identified (Figure 1, Table 3).
SSR marker GD12 was excluded from the M3 analysis due to inadequate PCR amplification. Consequently, the 2018 and 2019 seedlings were analysed with a different total number of SSR markers (seven versus six). Retrospectively removing the GD12 SSR marker data from the 2018 dataset of the ‘Nicogreen’ seedlings did not result in an increase of NL outcrossers, indicating that 2018 and 2019 SSR analyses are comparable.
Combining the 2018 and 2019 results of the analysis of the ‘Nicogreen’ seedlings, a decline of the outcrossing frequency with increasing distance from the ‘Ladina’ trees is observed (Table 4). The percentage of realised pollen dispersal of ‘Ladina’ was 0.9% within an 8 m distance (Block B and E combined), while it decreased to 0.5% at 15 m. At 72 m the realised pollen dispersal reduced slightly to 0.4% but dropped to 0.09% at 117 m distance from Block 0. Considering the distribution of the NL seedlings, 69% of them were found within 8 m distance from the closest ‘Ladina’ tree, while 88% and 96% were found within 15 m and 72 m, respectively (Table 4).

3.2. Ingress of Pollen via the Netting System

In 2018, 322 apples were harvested from the 48 ‘Ladina’ trees in the netted Block 0. In total, 371 seedlings were grown from 543 gathered seeds (Table 5). A complete SSR profile was generated for 331 seedlings. Twenty-nine seedlings were the result of selfings of ‘Ladina’ (9%). Four seedlings were derived from a fertilisation with ‘Gala’ pollen (1.2%), trees of which were grown in Block 0. Thus, the total number of seedlings generated by pollen originating from outside Block 0 was corrected to 298. A total of 144 seedlings were determined to be LN, corresponding to a realised pollen dispersal of 48.3%.
In 2019, 369 ‘Ladina’ apples were harvested and 1219 seeds were extracted and sown. A complete SSR marker profile was generated for 846 out of the 979 grown seedlings. One hundred and eleven seedlings were the result of selfings of ‘Ladina’ (13%) and five seedlings were derived from pollinations with ‘Gala’ (0.6%). As in 2018, these were subtracted from the total number of seedlings with a complete marker profile, so that the total number of seedlings originating from pollinations derived from pollen from outside Block 0 was 730. Of these, 548 seedlings originated from ‘Nicogreen’ (LN seedlings), corresponding to a realised pollen dispersal of 75.1%. SSR allele calls are available in Supplementary Material File S1.
The repartition of the LN seedlings inside Block 0 was studied for both years and no clustering near the ‘Nicogreen’ blocks was evident (Figure 2). A graphical summary of the in- and egress of pollen in/from Block 0 is shown in Figure 3A.
The efficiency of the netting system to prevent the ingress of pollen into the experimental area was estimated by comparing the realised pollen dispersal from the ‘Glo-ckenapfel’ trees, which were situated approximately 300 m from the centre of Block 0 and the ‘Nicogreen’ trees of Blocks A, B and E combined. Two out of 298 ‘Ladina’ seedlings (0.7%) and 45 out of 357 (12.6%) ‘Nicogreen’ seedlings in Blocks A, B and E were derived from fertilisation by ‘Glockenapfel’ in 2018 (Figure 3B). This corresponds to an 18-fold reduction of realised pollen dispersal by the netting system.
In 2019, 13 of the 730 ‘Ladina’ seedlings (1.8%) were LG while 90 out of 1266 ‘Nicogreen’ seedlings (7.1%) in Block A, B and E were NG. This corresponds to a four-fold reduction of ‘Glockenapfel’ fertilisations inside the netting system compared to fertilisations outside the netted Block 0.

4. Discussion

Our study suggests that the netting system allows little ingress/egress of pollen in Block 0. Within the netted Block 0, an average of 350 apples developed each year, corresponding to approximately seven apples per ‘Ladina’ tree. Moreover, some apples developed parthenogenetically and did not contain seeds (Table 5), while others contained seeds from selfing events. For comparison, ‘Ladina’ trees of similar age at a different experimental site (open orchard), where pollinator movement was unrestricted, yielded approximately ten-times more apples. Apples from this open orchard contained on average 13.2 seeds, corresponding to four- to six-times more seeds than in our experiment (S. Bühlmann-Schütz, Research Division Plant Breeding, Agroscope, 2021, personal communication). This indicates that the netting system substantially reduced pollination of the ‘Ladina’ trees by limiting pollen flow.
Molecular analyses of the ‘Ladina’ seedlings revealed that approximately 50% (from 2018) and 25% (from 2019) were fathered from trees that were neither ‘Nicogreen’ nor ‘Glockenapfel’. The closest commercial orchard was approximately 650 m away, but several large high-stem trees were present at about 500 m to Block 0. According to previous studies, apple pollen typically disperses only up to 1 m when insect pollinators are excluded [8,12]. Even if transported by wind over longer distances, fertilisations are highly unlikely [6,8,12]. We studied the distribution of the ‘Nicogreen’ pollinations within the grid of ‘Ladina’ trees and we hypothesised that wind-driven pollinations would result in a clustering of ‘Nicogreen’ pollinations close to the corresponding ‘Nicogreen’ blocks. This, however, was not the case as relatively high numbers of LN seedlings were also found in the middle of Block 0 (Figure 2). The results thus suggest that probably small pollinators that carried pollen, partly over large distances, managed to ingress the netting system.
In both 2018 and 2019, only 0.6% of all tested ‘Nicogreen’ seedlings originated from ‘Ladina’ pollinations, indicating that the netting of Block 0 represented a strong pollen flow barrier. Most outcrossed progeny was identified in Block B, which is located 8 m from the closest ‘Ladina’ trees. Block E is also positioned at a similar distance, but fewer NL seedlings were identified here (Table 2 and Table 3). One possible explanation could be that Block B is located close to a hedgerow, which might be a nesting habitat for some apple pollinators. Given the short distance, also southerly winds may have contributed to this result (Figure 1). However, in this latter case, we would expect a high incidence of LN seedlings from the ‘Ladina’ trees close to ‘Nicogreen’ Block E (Figure 2), which was not the case.
The netting system seemed to be very efficient at reducing pollinations outside the net with pollen from inside the net, but less efficient in the other direction. Over the two years, the vast majority of relevant pollinations were LN rather than NL. Different aspects may have contributed to this result. Pollinators in the landscape that likely carried pollen from different compatible apple trees had access to ‘Nicogreen’ flowers, while pollinators carrying ‘Ladina’ pollen needed to overcome once or twice the netting barrier if they had their nests inside or outside Block 0, respectively. Thus, the abundance of ‘Ladina’ pollen outside the net was very low compared to other pollen. On the contrary, almost no pollen compatible to ‘Ladina’ was present inside the net, so pollinations were only possible with pollen that passed the net-barrier. When pollen managed to enter Block 0, many not yet fertilised flowers were present, increasing the chances of even small quantities of pollen to turn in a realised fertilisation. That only small amounts of pollen entered the netted block is also evident from the low number of apples and seeds that were produced in Block 0, indicating that most flowers remained unfertilised. Because ‘Nicogreen’ trees were in proximity to Block 0, it is not surprising that a high percentage of the ‘Ladina’ pollinations were LN. The influence of the insect traps inside the netted orchard remains unclear, but the traps may have reduced the number of pollinators and thus pollinations inside the net.
Our results indicate a decline of the realised pollen dispersal with increasing distance (Table 2, Table 3 and Table 4), which is broadly commensurate to the observations described in previous studies [6,7,8,9]. However, the realised pollen dispersion in our study was lower compared to studies without a net barrier. For instance, Reim et al. [6] found 4% of the seedlings within 10 m of the pollen source (TNR 31–35) they used to assess pollen flow (red seedlings). In our study only 0.9% of the seedlings were NL at a similar distance (8 m), indicating the efficacy of the netting system in reducing the movement of pollen. The results of this study [6] also permit a rough estimation of the efficacy of our netting system, i.e., about 4-fold reduction. This value is similar to the efficacy estimated comparing the percentages of LG and NG seedlings observed in 2019 (4-fold reduction).
The few pollination events through the netting system compared to data from other studies without netting [6,7,8,9] suggest that the netting system effectively reduced the movement of pollinators. However, with the given experimental setup we could not prove this hypothesis directly, as it was not possible to establish an appropriate control setting without netting at the same location and time and with the same apple cultivars. Another limitation of the study is that the ‘Nicogreen‘ blocks could not be replicated at each distance and direction from Block 0. In addition to distance, pollination events might also have been affected by factors associated with direction (e.g., wind, presence of hedgerow, etc.).
Despite those constraints, our study provides evidence that the flow of pollen from an experimental site to genetically compatible, neighboring trees is low when the experimental site is carefully netted. The presented data will assist scientist and biosafety regulators when deciding on potential biosafety measures for future studies with insect-pollinated GM crops in field environments.

Supplementary Materials

The following are available online at https://www.mdpi.com/article/10.3390/agronomy11091754/s1, File S1: Supplementary file 1_ full_data_SSRs_WIRTO_2018-19.

Author Contributions

Conceptualization and funding acquisition, A.P., M.M., J.R., G.A.L.B.; formal analysis, I.S., A.D. (Anna Dalbosco), M.M., B.K.; investigation, I.S., A.D. (Anna Dalbosco), A.K., A.D. (Alex Dallemulle), writing—review and editing, A.P., M.M., J.R., G.A.L.B.; I.S., A.D. (Anna Dalbosco); visualization, B.K., M.M.; supervision, A.P. All authors have read and agreed to the published version of the manuscript.

Funding

This project was funded by the Swiss Expert Committee for Biosafety (Grant number: 04.1240.PZ/Q042-1221).

Data Availability Statement

The data presented in this study, i.e., SSR allele calls of the seedlings with full dataset, are available in supplementary file 1.

Acknowledgments

The authors are thankful to the horticulture team and Daniel Feusi at Agroscope for establishing the netted experimental site and for cultivation of the trees. Thanks also to Luzia Lussi (Agroscope) for supporting the cultivation of seedlings and to Andreas Peil (Julius Kühn Institute, Dresden, Germany) for information regarding the S-alleles of ‘Glockenapfel’. The authors gratefully acknowledge partial financial support from the Molecular Plant Breeding group at ETH Zurich. The data produced and analyzed in this paper were generated in collaboration with the Genetic Diversity Centre (GDC), ETH Zurich.

Conflicts of Interest

The authors declare no conflict of interest.

References

  1. Pickhardt, A.; Fluri, P. Die Bestäubung der Blütenpflanzen durch Bienen. Schweiz. Zent. Bienenforsch. 2000, 38, 75. (In German) [Google Scholar]
  2. Jacquemart, A.L. Methods for determining compatibility and pollinator efficiency in temperate fruit species. Fruit Veg. Cereal Sci. Biotech. 2007, 1, 26–38. [Google Scholar]
  3. Reim, S. Beiträge zur Bewertung der Umweltverträglichkeit Gentechnisch Veränderter Apfelgehölze. Ph.D. Thesis, Martin-Luther-Universität Halle-Wittenberg, Halle, Germany, 2008. (In German). [Google Scholar] [CrossRef]
  4. Osborne, J.L.; Clark, S.J.; Morris, R.J.; Williams, I.H.; Riley, J.R.; Smith, A.D.; Reynolds, D.R.; Edwards, A.S. A landscape-scale study of bumble bee foraging range and constancy, using harmonic radar. J. Appl. Ecol. 1999, 36, 519–533. [Google Scholar] [CrossRef] [Green Version]
  5. Beekman, M.; Ratnieks, F.L.W. Long range foraging by the honey-bee, Apis mellifera L. Funct. Ecol. 2000, 14, 490–496. [Google Scholar] [CrossRef] [Green Version]
  6. Reim, S.; Flachowsky, H.; Michael, M.; Hanke, M.V. Assessing gene flow in apple using a descendant of Malus sieversii var. sieversiif. niedzwetzkyana as an identifier for pollen dispersal. Environ. Biosaf. Res. 2006, 5, 89–104. [Google Scholar] [CrossRef] [Green Version]
  7. Kron, P.; Husband, B.C.; Kevan, P.; Belaousoff, S. Factors affecting pollen dispersal in high-density apple orchards. HortScience 2001, 36, 1039–1046. [Google Scholar] [CrossRef] [Green Version]
  8. Soejima, J. Estimation of gene flow via pollen spread for the orchard layout prior to the field release of apple transformants. Proceedings of the International Symposium on Biotechnology of Temperate Fruit Crops and Tropical Species. Acta Hortic. 2007, 738, 341–342. [Google Scholar] [CrossRef]
  9. Tyson, R.C.; Wilson, J.B.; Lane, W.D. A mechanistic model to predict transgenic seed contamination in bee-pollinated crops validated in an apple orchard. Ecol. Model. 2011, 222, 2084–2092. [Google Scholar] [CrossRef]
  10. Larsen, A.S.; Kjaer, E.D. Pollen mediated gene flow in a native population of Malus sylvestris and its implications for contemporary gene conservation management. Conserv. Genet. 2009, 10, 1637–1646. [Google Scholar] [CrossRef]
  11. Reim, S.; Proft, A.; Heinz, S.; Lochschmidt, F.; Höfer, M.; Tröber, U.; Wolf, H. Pollen movement in a Malus sylvestris population and conclusions for conservation measures. Plant Genet. Res. 2017, 15, 12–20. [Google Scholar] [CrossRef]
  12. Kato, H.; Soejima, J. Environmental safety considerations for field testing genetically modified apples. Report of the workshop on the environmental considerations for genetically modified trees. OECD Environ. Health Saf. Publ. Ser. Harmon. Regul. Overs. Biotechnol. 2001, 19, 79–83. [Google Scholar]
  13. Kost, T.D.; Gessler, C.; Jänsch, M.; Flachowsky, H.; Patocchi, A.; Broggini, G.A.L. Development of the first cisgenic apple with increased resistance to fire blight. PLoS ONE 2015, 10, e0143980. [Google Scholar] [CrossRef] [PubMed] [Green Version]
  14. Schlathölter, I.; Broggini, G.A.L.; Meissle, M.; Romeis, J.; Studer, B.; Patocchi, A. Multi-level assessment of field-grown cisgenic apple trees. Acta Hortic. 2021, 1307, 239–246. [Google Scholar] [CrossRef]
  15. Kellerhals, M.; Schütz, S.; Christen, D.; Mühlenz, I. Befruchtung der Obstsorten. Pflanz. Agroscope Transf. 2014, 41, 8–10. (In German) [Google Scholar]
  16. Fernandez-Fernandez, F. Common set of ECPGR SSR markers for Malus characterization. In Report of a Working Group on Malus/Pyrus; Lateur, M., Ordidge, M., Engels, J., Lipman, E., Eds.; Biodiversity International: Weggis, Switzerland, 2013; pp. 26–27. [Google Scholar]
  17. Liebhard, R.; Gianfranceschi, L.; Koller, B.; Ryder, C.D.; Tarchini, R.; Van de Weg, E.; Gessler, C. Development and characterisation of 140 new microsatellites in apple (Malus x domestica Borkh.). Mol. Breed. 2002, 10, 217–241. [Google Scholar] [CrossRef]
  18. Guilford, P.; Prakash, S.; Zhu, J.M.; Rikkerink, E.; Gardiner, S.; Bassett, H.; Forster, R. Microsatellites in Malus x domestica (apple): Abundance, polymorphism and cultivar identification. Theor. Appl. Genet. 1997, 94, 249–254. [Google Scholar] [CrossRef]
  19. R Core Team. R: A Language and Environment for Statistical Computing. R Foundation for Statistical Computing, Vienna, Austria. 2021. Available online: https://www.R-project.org/ (accessed on 30 June 2021).
  20. Wickham, H. Ggplot2: Elegant Graphics for Data Analysis; Springer: Berlin/Heidelberg, Germany, 2016. [Google Scholar]
Figure 1. Experimental site layout and summary of outcrossing events. The number of ‘Nicogreen’ seedlings derived from a pollination with ‘Ladina’ (NL seedlings) out of the total number of ‘Nicogreen’ seedlings investigated is presented per year. Percentages in parentheses. Blue box: Block 0 with ‘Ladina’ trees (red dots). Green boxes: Blocks A to E of ‘Nicogreen’ trees (ten each). Black arrows: minimal distance (m) between a ‘Ladina’ tree and a ‘Nicogreen’ block. Orange arrow: minimal distance from ‘Glockenapfel’ trees to Block C (circa 140 m). Not to scale.
Agronomy 11 01754 g001
Figure 2. Spatial distribution of the ‘Ladina’ seedlings and relative amount of ‘Ladina’ seedlings originating from ‘Nicogreen’ pollinations (LN seedlings) in the netted Block 0 (grey box) for 2018 (above) and 2019 (below). The dot size indicates the number of ‘Ladina’ seedlings with full SSR dataset per tree and the color the relative proportion of seedlings originating from ‘Nicogreen’ pollinations (LN seedlings). Only Nicogreen blocks (blue boxes) in proximity to the netted Block 0 are indicated.
Agronomy 11 01754 g002
Figure 3. (A) Summary of the detected pollination events between ‘Ladina’ (in Block 0, blue box) and ‘Nicogreen’ (in Blocks A to E outside the netted Block 0), as well as those between unknown trees with ‘Ladina’ and ‘Nicogreen’. The ‘Glockenapfel’ pollinations are included in the “trees >200 m away” group. (B) Summary of the detected pollination events between ‘Glockenapfel’ and ‘Ladina’ as well as ‘Glockenapfel’ and ‘Nicogreen’ (Blocks A, B, and E). ‘Glockenapfel’ trees are located approximately 300 m from the centre of Block 0. The pollination events are displayed per year and as fractions of seedlings with full SSR dataset. Arrow thickness represents importance of the pollination route. The red arrow indicates the ‘Ladina’ outcrossing events.
Agronomy 11 01754 g003
Table 1. SSR markers used in the study and relative allele composition of the apple cultivars ‘Ladina’, ‘Nicogreen’ and ‘Glockenapfel’.
SSR Marker 1Linkage GroupMultiplex 2018 3 Multiplex 2019 3 Fluorochrome
Label
‘Ladina’‘Nico-Green’‘Glocken-Apfel’
GD123M1 HEX150/154150/null 2150/154
CH05f065M1M36FAM164/190170/182172/182
CH02c0915M1M3NED246/258244/256244/256
CH01f03b9M1M3ROX162/174142/182174/182
CH05e032M2M3NED184/190168/184172/null 2
CH01h0117M2M36FAM115/117113/129117/119
CH02c1110M2M3HEX230/234220/232216/238
1 All SSR markers from [17], except GD12 [18]. 2 “null”, presence of a null-allele. 3 M1 to M3, multiplex PCR containing the respective SSR markers.
Table 2. Assessment of ‘Nicogreen’ seedlings originating from ‘Ladina’ pollination in 2018.
BlockABCD 2ETotal
Distance to the nearest ‘Ladina’ tree15 m8 m117 m72 m8 m
Orientation of the blocks in relation to the netted Block 0EastNorthWestSouthSouth
No. of ’Nicogreen‘ apples harvested 536335855985892413
No. of ‘Nicogreen’ apples seeded536335427 1984581854
No. of seeds14161503163735516416552
No. of sown seeds79279211043558163859
No. of seedlings7007139723197303434
No. of seedlings with full dataset
(M1, four SSRs)
6667029242896343215
No. of ‘Nicogreen’ selfing events (M1)9812411047111490
No. of ‘Nicogreen’ seedlings without selfing events 5685788142425232725
No. of seedlings pollinated from ‘Ladina’ (M1) (%)7
(1.2%)
18
(3.1%)
6
(0.7%)
1
(0.4%)
8
(15%)
40
(1.5%)
No. of seedlings with full dataset (M1 + M2) originating from ‘Ladina’ pollinations (% realised pollen dispersal)3 (0.5%)10 (1.7%)1
(0.1%)
1 (0.4%)1 (0.2%)16
(0.6%)
1 Seeds have not been extracted from all available apples. 2 Seven trees were renewed in Spring 2018 with two-year-old trees, which already produced flowers in 2018.
Table 3. Assessment of ‘Nicogreen’ seedlings originating from ‘Ladina’ pollination in 2019.
BlockABCDETotal
Distance to the nearest ‘Ladina’ tree15 m8 m117 m72 m8 m
Orientation of the blocks in relation to the netted Block 0EastNorthWestSouthSouth
No. of ’Nicogreen‘ apples harvested 5453141332811591432
No. of ‘Nicogreen’ apples seededallallallallall1432
No. of seeds1689 11216 14167956764792
No. of sown seeds8508504167956763587
No. of seedlings5516343182244212148
No. of seedlings with full dataset (M3)4494903142173691839
No. of seedlings derived from ‘Nicogreen’ selfing events141812101064
No. of ‘Nicogreen’ seedlings without selfing events4354723022073591775
No. of seedlings with full dataset originating from ‘Ladina’ pollinations
(realised pollen dispersal in %)
2
(0.5%)
5
(1.1%)
0
(0%)
1
(0.5%)
2
(0.6%)
10
(0.6%)
1 Not all available seeds were sown.
Table 4. Realised ‘Ladina’ pollen dispersal at different distances with combined data from 2018 and 2019.
Distance8 m15 m72 m117 m
Block(s)B + EADCTotal
No. of ‘Nicogreen’ seedlings without seedlings originating from selfing events1932100344911164500
No. of ‘Nicogreen’ seedlings pollinated from ‘Ladina’ (%)18
(0.9%)
5
(0.5%)
2
(0.4%)
1
(0.09%)
26
(0.6%)
% of all the NL seedlings found in relation to the distance to the closest ‘Ladina’ tree69%
88%
96%
100%
Table 5. Quantification of ‘Ladina’ seedlings originating from ‘Nicogreen’ pollinations in 2018 and 2019. The ‘Ladina’ trees are inside Block 0, the ‘Nicogreen’ trees are outside.
20182019
No. of ’Ladina’ apples harvested 322369
No. of parthenogenetically developed apples7213
No. of ’Ladina’ apples with seeds250356
Average No. of apples with seeds per tree5.27.4
No. of seeds gained from the apples5431219
Average N° of seeds per apple (with seeds)2.23.4
No. of seedlings371979
No. of seedlings with full dataset
(M1 + M2 in 2018, or M3 in 2019)
331846
No. of seedlings derived from ‘Ladina’ selfing events (%)29 (9%)111 (13%)
No. of seedlings derived from ‘Gala’ pollinations 45
Total No. of seedlings originating from pollinations derived from pollen from outside the netted orchard 298730
No. of seedlings originating from ‘Nicogreen’ pollinations (realised pollen dispersal %) 144
(48.3%)
548
(75.1%)
Publisher’s Note: MDPI stays neutral with regard to jurisdictional claims in published maps and institutional affiliations.

