Article

Soil Test Based Fertilizer Application Improves Productivity, Profitability and Nutrient Use Efficiency of Rice (Oryza sativa L.) under Direct Seeded Condition

1
Department of Soil Science, G.B. Pant University of Agriculture & Technology, Pantnagar 263145, Uttarakhand, India
2
Department of Soil Science, Punjab Agricultural University, Ludhiana 141004, Punjab, India
3
Department of Agronomy, G.B. Pant University of Agriculture & Technology, Pantnagar 263145, Uttarakhand, India
4
Animal Production Research Institute, Rajendra Prasad Central Agricultural University, Pusa 848125, Bihar, India
5
Department of Agronomy, Rajendra Prasad Central Agricultural University, Pusa 848125, Bihar, India
6
Department of Clinical Laboratories Sciences, The Faculty of Applied Medical Sciences, Taif University, P.O. Box 11099, Taif 21944, Saudi Arabia
7
Department of Biology, College of Science, Taif University, P.O. Box 11099, Taif 21944, Saudi Arabia
8
Department of Science and Technology, University College-Ranyah, Taif University, P.O. Box 11099, Taif 21944, Saudi Arabia
9
Bangladesh Wheat and Maize Research Institute, Dinajpur 5200, Bangladesh
*
Authors to whom correspondence should be addressed.
Agronomy 2021, 11(9), 1756; https://doi.org/10.3390/agronomy11091756
Submission received: 10 August 2021 / Revised: 24 August 2021 / Accepted: 28 August 2021 / Published: 31 August 2021
(This article belongs to the Special Issue Cropping Systems and Agronomic Management Practices of Field Crops)

Abstract

:
A field investigation on direct seeded rice (DSR) was carried out in the two consecutive rice growing seasons of 2017 and 2018 at Pantnagar, Uttarakhand, India for the development and validation of soil test crop response (STCR) to fertilizer and for assessing the performance of STCR-treatments as compared to the general recommended dose (GRD) in terms of yield, nutrient uptake and use efficiency, and the economics of DSR. For producing 1 Mg of rice-grain, the required nutrients (N, P, and K) were 2.01 kg, 0.44 kg, and 3.06 kg; the contribution from the soil was 22.05%, 37.34%, and 41.48%; from applied farmyard manure 23.25%, 28.34%, and 16.80%, from fertilizer 38.08%, 49.93%, and 252.98%; and from fertilizer with FYM 44.83%, 60.57%, and 278.70%; for N, P, and K, respectively. The STCR approach, with or without FYM, at both the target yields (4.5 Mg ha−1 and 5.0 Mg ha−1) markedly enhanced the grain yield (20.2% to 32.3%) and production efficiency over the GRD. It also exhibited a higher NPK uptake and use efficiency, along with better profitability, than the GRD. Therefore, the STCR-targeted yield approach could improve the yield, economics, and efficiency of nutrient use for direct seeded rice.

1. Introduction

Rice (Oryza sativa L.) is mostly grown using the transplanting establishment method, which requires more time, water, and labor for nursery preparation. The profit margins of transplanted rice (TPR) have been reduced continuously due to the higher water input and labor intensive transplanting, as well as higher labor costs [1]. The water and labor demand may be reduced by growing direct-seeded rice (DSR) instead of TPR [2]. There has been a shift towards DSR in South East Asia during recent times [3]. In India, DSR produces about 2 to 12 per cent higher GY than TPR [4]. Direct seeding helps in reducing the water consumption by up to 30 per cent, as it does not require seedling raising in a nursery, puddling operations in the main field, transplanting, or maintaining 4 to 5 cm of water in the main field after transplanting. Furthermore, DSR matures about 8 to 10 days earlier than transplanted rice.
According to the conventional estimate, food grain demand will be 355 Mt by 2030 in India; while on the other hand, the response ratio (RR) and factor productivity of crops are continuously declining every year, due to the applied fertilizer in intensive cultivation [5]. The use efficiencies of nitrogen, phosphorus, and potassium are 30–50%, 15–20%, and 60–70%, respectively [5], which is certainly low and increases the cost of cultivation. During the past few decades, the use of fertilizers for enhancing food production has increased many fold, and which, if it exceeds the crop requirements, often causes environmental pollution. The imbalanced use of inorganic fertilizers in India has resulted in a net negative balance of nutrients of about 8 to 10 MT y−1 [6], and by 2025, the extent of this negative balance may rise up to 15 MT y−1. Resource-poor farmers of the nation used to follow an imbalanced fertilization, which disturbs the nutrient availability, leading to a decrease in soil productivity in the long run [7]. Apart from this, increasing fertilizer prices and their availability is one of the main hurdles to balanced fertilization. Excessive chemical fertilizer application has aggravated the deficiencies of secondary and micro-nutrients in different soils. Furthermore, inadequate nutrition of crops worsens the situation, in terms of declined soil fertility.
Organic manures (OM) are a valuable source of nutrients, but their sole application is not sufficient to meet the nutrient requirements of high yielding varieties and often results in poor crop yields [8]. Furthermore, using the generally recommended dose (GRD) of fertilizer is not able to maintain yields vis-à-vis the economic returns of crops, due to fatigue in soil health, and this requires refinement for balanced crop nutrition [7]. Therefore, the sole use of neither OM nor chemical fertilizer can enhance the sustainability of an intensive production system [9]. The use of an appropriate combination of OM and chemical fertilizers [10], depending on soil fertility status [11], is a step forward for providing balanced fertilization to crops. Such integrated nutrient management (INM) can increase the income of farmers [12]. The continuous application of the GRD of fertilizer along with FYM enhances rice grain yields and their sustainability [7,13,14].
Harnessing the potential yields of high yielding varieties of crops requires the application of optimum doses of nutrients [15]. However, an inadequate and imbalanced fertilizer use for crop production, without proper knowledge of the inherent soil capabilities and crop requirements, is also one of the causes that prevent gaining the full yield potential of crops and the deterioration of soil health, as well as economic losses to farmers [8,16], and often resulting in an adverse impact on crops and the soil, in terms of nutrient toxicity and deficiency [8]. Furthermore, fertilizer use requires knowledge of the expected GY response, which depends upon the crop nutrient requirements, nutrient supply from indigenous sources, and the fate of fertilizers applied to the soil in the short and long term [17]. Therefore, a comprehensive approach, considering soil tests, field research, and profitability, could be employed for fertilizer use. Thus, the soil test crop response (STCR) methodology can be adopted for calculating nitrogen (N), phosphorus (P), and potassium (K) requirements as needed. NPK requirements are linearly correlated with the target yield (TY), depending on the soil test values (STVs). In the STCR approach, the fertilizer doses are prescribed according to the developed fertilizer adjustment equations, after the establishment of a significant relationship between STVs, the added fertilizer nutrients, and the crop response [8] for a particular soil type. Thus, precise fertilizer recommendations can be made using this approach, as it involves data of soil and plant analysis [8]. A higher response ratio is also observed along with a higher benefit–cost ratio as the nutrient application is based on demand and the correction of soil nutrient imbalances [18]. There is a need to develop a balanced nutrient management strategy, involving the STCR methodology for the sole use of chemical fertilizers and the integrated use of chemical fertilizers and FYM for DSR. Hence, the present study was carried out to (i) develop fertilizer equations for chemical mode and integrated mode using the STCR methodology; (ii) validate these equations for achieving target yields; and (iii) assess the performance of STCR treatments with the various prevailing nutrient management strategies, in terms of grain and straw yield, economics, nutrient uptake, and use efficiency.

2. Material and Methods

2.1. Experimental Site

The study area falls in the Tarai region, with a sub-tropical-humid climate. Three kinds of field studies, i.e., 1. fertility gradient (FG) experiment with wheat in 2016–17, 2. test crop experimentation with DSR in 2017–18 to develop fertilizer equation, and 3. verification experimentation in 2018–19 were conducted at the B2 block of NEBCRC, Pantnagar University, U.S. Nagar, Uttarakhand, India (29° N latitude, 79°29′ E longitude, 243.84 m above MSL). During the rice-growing season, the total rainfall was 1355.40 mm and 1641.30 mm for 2017 and 2018, respectively. The maximum temperature fluctuated from 30.8 to 38.2 °C, while the minimum temperature fluctuated from 14.5 to 26.4 °C during 2017. During 2018, the maximum temperature fluctuated from 29.6 to 37.2 °C, while the minimum temperature fluctuated from 12.0 to 26.9 °C (Figure 1).
The soil texture of the study area was clay-loam, under the taxonomically categorized great group named, Hapludoll. Before the start of experimentation, soil samples were randomly collected from different spots at a depth of 0–15 cm from the experimental field, and after making a composite; it was shade dried and processed and analyzed for various chemical properties. The results revealed that the values of pH [19], electrical conductivity [19], WBC (Walkley and Black organic C) [20], available N [21], available P [22], and available K [23] were 7.33, 0.41 dS m−1, 0.57%, 150.53, 15.64, and 141.12 kg ha−1, respectively.

2.2. Fertility Gradient (FG) Experiment

A FG experiment was performed in 2016 to nullify the previous effects on soil fertility and create an artificial FG prior to testing crops, as per Ramamoorthy et al. [24]. Strips of 75.0 m × 7.5 m area were made, and these strips were fertilized with three levels of N, P2O5, and K2O (0-0-0, 100-100-100, and 200-200-200 kg ha−1 applied to strip I, II, and III, respectively). A uniform dose of ZnSO4 at 25 kg ha−1 was applied to all strips. An exhaust crop of wheat (variety: UP 2526) was grown during Rabi 2016–17 to stabilize the soil fertility and create an artificial FG. After the harvest of the wheat crop, 24 samples from the surface soil were collected from each strip and were analyzed for available N, P, and K, by the method adopted for analysis of the initial soil sample, in order to assess the development of FG.

2.3. Test Crop (DSR) Study

Three varied fertility gradient strips were again split into twenty-four plots (21 treatments + 3 controls), resulting in a total of 72 (24 × 3) plots with a size of 5 m × 3 m each. The treatments were different identified groupings of 4 levels of N (0, 60, 120 and 180 kg ha−1), P2O5 (0, 30, 60 and 90 kg ha−1), and K2O (0, 20, 40 and 60 kg ha−1), which were randomized in each strip. The treatments (0, 5, and 10 Mg ha−1 FYM) were superimposed across the strips. Details of treatments are given in Table S1.
After the layout, samples were again taken from the soil surface to determine the available N, P, and K of each experimental plot before sowing, as per the procedure mentioned for analysis of the initial soil sample. The sources of N, P, K, and Zn were urea, single super phosphate, muriate of potash, and zinc sulphate, respectively, while the organic source was FYM. Half the amount of N, the full amount of P, K, Zn, and FYM were applied as basal. Healthy rice seeds were sown continuously at a line spacing of 20 cm at 2–3 cm depth on 8 June 2017 and were covered manually. The remaining N was applied in two equal amounts (30 days after sowing (DAS) and 50 DAS) as a top dressing. At harvest (24 October 2017), grain and by-product (straw) samples of DSR were taken from each plot for the estimation of total N, P, and K content. The applied FYM had 25% moisture, 0.63 % total N, 0.13 % total P, and 0.60% total K.

2.4. Plant Analysis

Total N, P, and K contents of the economic plant parts, i.e., grain and by-products were obtained as per the standard procedure [19]. Nutrient uptake by grain and straw was computed by multiplication of GY (kg ha−1) with nutrient content in grain (%) and SY (kg ha−1) with nutrient content in the by-product (%), respectively. The summation of nutrient uptake in the grain and in straw gives the total nutrient uptake by the crop.

2.5. Basic Parameters (NR, CS, and CF)

Calculation of the basic parameters, i.e., NR, CS, and CF was computed following the formulae illustrated by Ramamoorthy et al. [24]. The fertilizer nutrient requisite for targeted productivity was calculated as follows:
Chemical mode:
F N = NR CF   ×   100   T     CS CF   ×   SN
F P 2 O 5 = NR   CF ×   2.29   ×   100 T     CS CF   ×   2.29   ×   SP
F K 2 O = NR CF   ×   1.20   ×   100 T     CS CF   ×   1.20   × SK
Integrated mode:
F N = NR CF   ×   100   T     CS CF   ×   SN     CFYM CF   ×   FYM   N
F P 2 O 5 = NR CF   ×   2.29   ×   100   T     CS CF   ×   2.29   ×   SP     CFYM CF   ×   2.29   ×   FYM   P
F K 2 O = NR CF   ×   1.20   ×   100   T     CS CF   ×   1.20   ×   SK     CFYM CF   ×   1.20   × FYM   K
Here, FN, FP2O5, and FK2O stand for fertilizer nitrogen, phosphorus, and potassium (kg ha−1), respectively. NR denotes the nutrient requirement of nitrogen, phosphorus, and potassium (kg ha−1); CF, CS, and CFYM are %-share of corresponding nutrient (N/P/K) of the total nutrient uptake from fertilizer without FYM, soil, and FYM. CF* represents the % contribution of the corresponding nutrients from fertilizers with FYM. T represents targeted yield (Mg ha−1); SN, SP, and SK correspond to the STVs for the available N, P, and K (kg ha−1) in the soil. FYM-N, FYM-P, and FYM-K correspond to the N, P, and K content added through FYM (kg ha−1).

2.6. Verification Experiment

A field experiment was conducted with DSR (variety: ND 359) during Kharif 2018–19 to assess the performance of STCR treatments with different nutrient management strategies in terms of GY, SY, economics, nutrient uptake, and use efficiency in a randomized block design (RBD) with three replicates. Table 1 contains the treatment details.
An initial soil sample from the surface soil was collected prior to the sowing of DSR. Fertilizer prescription equations developed in test crop experiments on DSR crops were used to calculate the amount of fertilizer nutrients for achieving TYs of 4.5 Mg ha−1 (TY1) and 5.0 Mg ha−1(TY2). The FYM used in this experiment had 0.58 % total N, 0.15 % total P, and 0.54% total K. The sowing operation for this experiment was performed on 12 June 2018, and the crop was harvested at full maturity stage on 25 October 2018. Standard agronomic practices were followed for the growing of the DSR.

2.7. Yield and Nutrient Uptake

The DSR was harvested and threshed manually. Grain yield (GY) (kg) and straw yield (SY) (kg) was recorded from the net plot leaving the border rows and was later converted to Mg ha−1. Harvest index was determined as follows:
Harvest index (HI) = GY × 100/(GY + SY)
PE (kg ha−1 d−1) was calculated by dividing GY (kg ha−1) by the duration of the crop (days), which was constant for all the treatments (136 days). Collected samples of rice grain and by-product (rice-straw) from each treatment were processed and analyzed for total N, P, and K content by adopting the procedure given in the test crop experiment.

2.8. Economic Analysis

The cost of fertilizer (Indian rupee (INR) ha−1) for various treatments in the verification experiment was worked out separately, considering the prevailing prices of fertilizers in INR at the time of their use. Gross return (value of additional yield) was calculated based on the MSP (price for minimum support) of rice set by the Indian government during the year 2018–19 and expressed as INR ha−1. Net return (INR ha−1) was calculated by subtracting the fertilizer cost from the gross return. B:C ratio was worked out as follows:
  • B:C ratio = Net return (INR ha−1)/Fertilizer cost (INR ha−1)
  • Economic efficiency was calculated as follows:
  • Economic efficiency (INR ha−1 d−1) = Net return (INR ha−1)/duration (days).
where the duration of DSR was constant for all the treatments (136 days).

2.9. Nutrient Use Efficiency

Nutrient (N/P/K) use efficiency parameters were calculated using the following formulae, as per [25]:
  • Agronomic efficiency of nutrient (kg grain (kg nutrient)−1)
  • Agronomic efficiency (AE) = (GYF − GYC)/AFN
  • Recovery efficiency of nutrient (%)
  • Recovery efficiency (RE) = (TNUF − TNUC)/AFN × 100
  • Partial factor productivity of nutrient (kg grain (kg nutrient)−1)
  • Partial factor productivity(PFP) of nutrient = (GYF)/AFN
  • Reciprocal internal use efficiency of nutrient (kg Mg−1 grain yield)
  • Reciprocal internal use efficiency (RIUE) of nutrient = GNU/GY
where TNUF is the total nutrient uptake of DSR from the fertilized plot (kg ha−1), TNUC is the total nutrient uptake of DRS from the control plot (kg ha−1), AFN is the amount of applied fertilizer nutrient (kg ha−1), GYF is the grain yield of the fertilized plot (kg ha−1), and GYC is the grain yield of the control plot (kg ha−1). GY is the grain yield (Mg ha−1). GNU is the nutrient uptake by the grain.

2.10. Statistical Analysis

Descriptive statistics was used for the test crop experiment. Data recorded in verification experiments were analyzed using the ANOVA technique [26]. Treatment means were compared with a LSD-test (least significant difference) with a probability level of 0.05.

3. Results and Discussion

3.1. FG Establishment Experiment

To allow maximum deviations in the fertility strips, gradient experiments were conducted to minimize the factors related to soil and other management practices that could affect the crop yields. Table 2 showed the range and average STVs for N, P, and K, indicating significant variation with respect to fertility strips. Strip III is highest in nutrient level, as the maximum fertilizer was applied in comparison to strip I and II. STVs for N, P, and K varied from 125.4 to 200.7 kg N ha−1, 14.4 to 21.7 kg P ha−1, and 122.1 to 173.6 kg K ha−1, with the mean 168.8, 17.8, and 151.7 kg ha−1, respectively. The STVs for N, P, and K increased with increasing fertility levels, from strip I to strip III. Ammal et al. [27] also reported that the average level of N, P, and K STVs increased with increasing fertility level, and the highest STVs were reported in strip III. The highest level STVs of N in strip III might be due to the addition of two folds more NPK fertilizers than the onefold and control [27]. The STVs of P and K in strip III were the highest owing to having a graded fertilization [27]. Dwivedi et al. [28] also explained that the reason behind the higher STVs of P might be due to its fixation, due to its immobile nature in soil.
The multiple linear regression (MLR) study showed that the effect of the strips on the STVs of N, P, and K was highly significant when it was taken as a dependent variable, separately (Table 3). This proved that the experiment created a significant fertility gradient; furthermore, it made the soil suitable for the test crop in the STCR experiment. Similar findings have also been reported by [29,30,31,32].

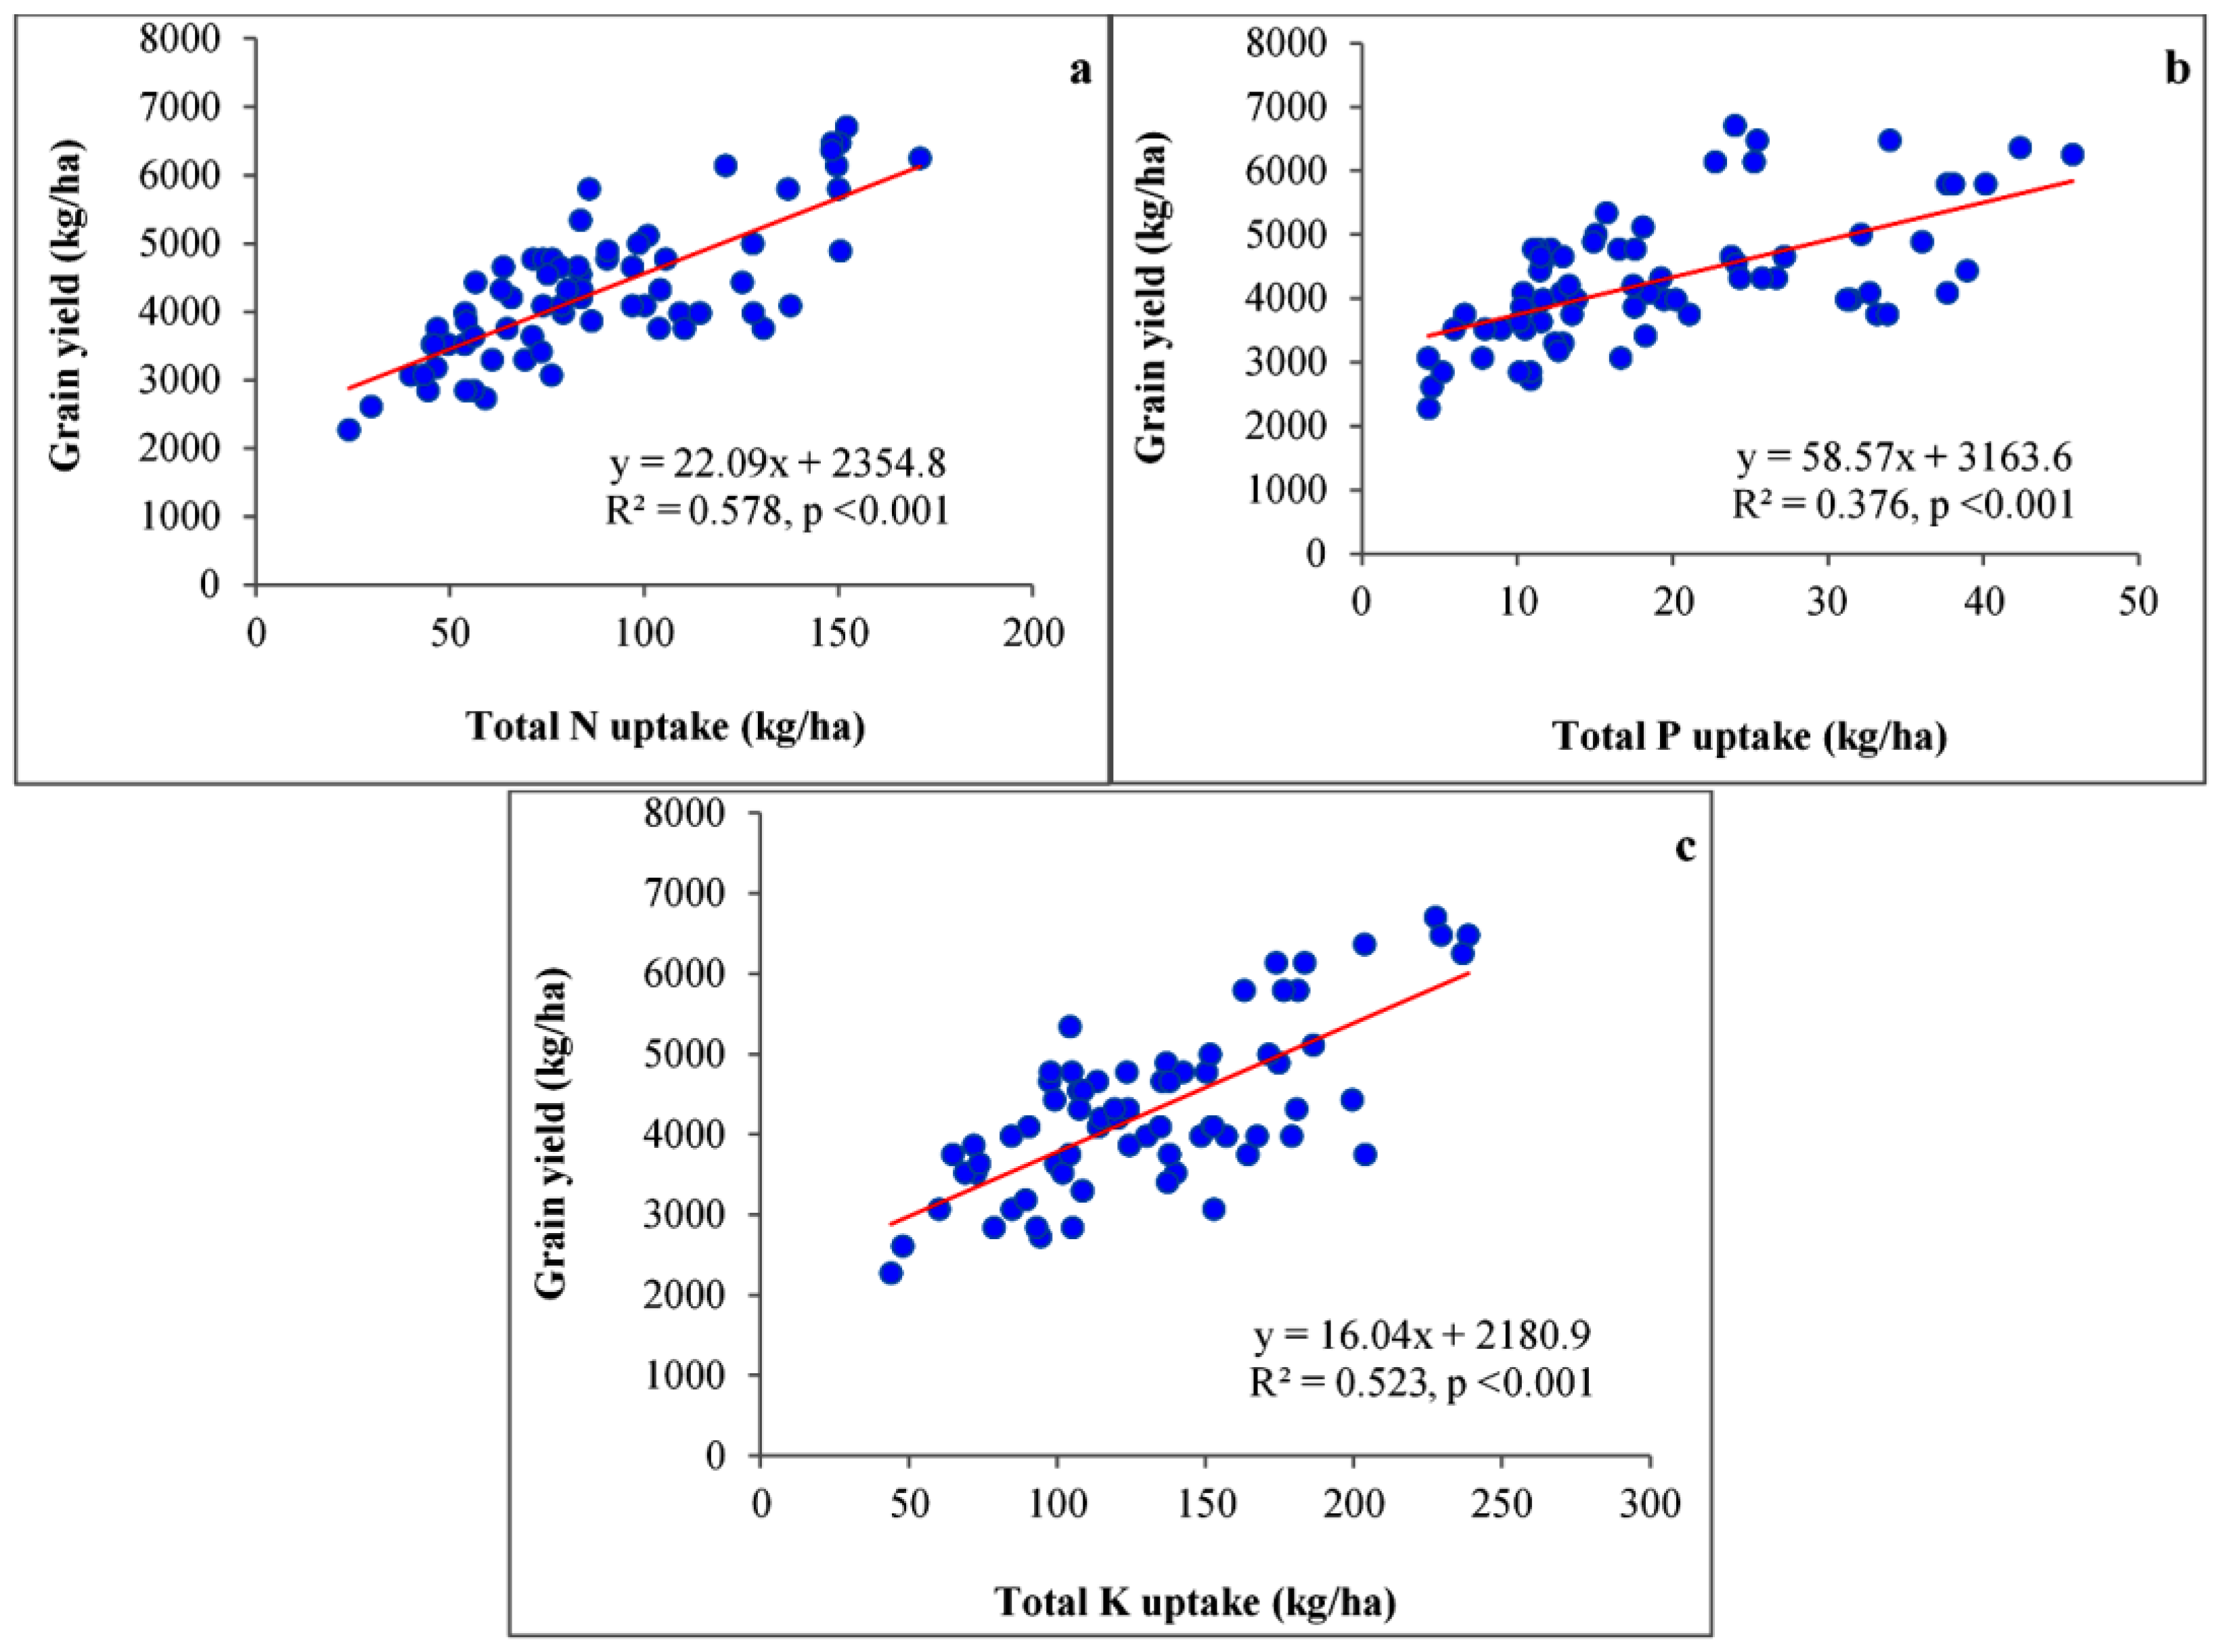
3.2. Yield and Nutrient Uptake

Descriptive statistics for GY, SY, and nutrient uptake for DSR is given in Table 4. The GY and SY of DSR in the whole plot ranged from 2273 to 6705 kg ha−1 and 3750 kg ha−1 to 12,386 kg ha−1, with mean values of 4291 kg ha−1 and 7699 kg ha−1, respectively. The range of GY and SY was 2273–5341 kg ha−1, 3864–11,250 kg ha−1 in strip I; 2841–6705 kg ha−1, 3750–12,273 kg ha−1 in strip II; and 3636–6477 kg ha−1, 4545–12,386 kg ha−1 in strip III. The mean for GY and SY was 3902 kg ha−1 and 7014 kg ha−1, 4276 kg ha−1 and 7869 kg ha−1, and 4697 kg ha−1 and 8215 kg ha−1, respectively, in strips I, II, and III. Likewise, GY and SY, total nitrogen uptake (TUN), phosphorus uptake (TUP), and potassium uptake (TUK) followed the order strip I < strip II < strip III. In the whole plot TUN, TUP, and TUK ranged from 24.0 to 171.0 kg ha−1, 4.3 to 45.7 kg ha−1, and 44.0 to 238.6 kg ha−1, with a mean of 87.6 kg ha−1, 19.3 kg ha−1, and 131.6 kg ha−1, respectively. TUN in strips I, II, and III ranged from 24.0–100.9 kg ha−1, 43.2–152.1 kg ha−1, and 53.9–171.0 kg ha−1, with mean values of 66.2 kg ha−1, 88.2 kg ha−1, and 108.5 kg ha−1, respectively. TUP ranged from 4.3–18.1 kg ha−1, 4.3–25.5 kg ha−1, and 10.1–45.7 kg ha−1, with a mean of 11.4 kg ha−1, 16.0 kg ha−1, and 30.4 kg ha−1, respectively. TUK ranged from 44.0–186.4 kg ha−1, 60.2–238.6 kg ha−1, and 72.0–236.8 kg ha−1, with mean of 106.5 kg ha−1, 136.1 kg ha−1, and 152.1 kg ha−1, respectively.
The grain yield of DSR had a strong correlation (p < 0.001) with total N uptake (r2 = 0.578), followed by total K uptake (r2 = 0.523) and total P uptake (r2 = 0.376) (Figure 2). Variability in FG and the application of variable doses of nitrogenous, phosphorus, and potassium fertilizers gave impactful results on the GY and SY of DSR. The highest GY and SY were obtained in strip III due to the overall highest nutrient application. Plots where NPK fertilizer was applied with the FYM obtained higher GY and SY, as compared to sole NPK fertilizer application. Expected outcomes were also reported by [11] in beetroot, [33] in wheat, [34] in rice, and [35] in maize crops under different conditions. TUN was highest in strips III and II compared to I, as also reported by [36], and it might have been the sufficient availability of N fertilizer in the III strip which created a favorable N uptake. An adequate dose of N application, and enhanced absorption and accumulation resulted in higher GY, SY, and uptake (NPK), as also reported by [37]. The possible reason behind the highest TUP being in strip III was attributed to better root proliferation, having a graded P-application [31,38,39,40,41]. The higher dose of N application stimulated the vegetative and root foraging capacity, meaning the crops require additional P and K, and increased the TUP in the crops [42,43,44]. The highest total potassium uptake by a crop was recorded with strip I to strip III and might be attributed to the higher application of fertilizer potassium [31,41]. Panaullah et al. [45] also reported that the majority of potassium uptake was in straw, as compared to grain. A similar effect of FYM on phosphorus uptake by crop plants has previously been reported [46,47].

3.3. Evolution of Basic Parameters

The basic parameters NR, CS, CFYM, CF, and CF* were required for the computation of prescription equations for the TY of DSR, with and without FYM, which is necessary for developing fertilizer doses. Basic parameters are developed with the help GY, TUN, TUP, TUK, initial STVs of N, P, and K, applied nutrient rates (N, P, and K) through fertilizers, and FYM. These parameters are shown in Table 5.
The NR was 2.01 kg, 0.44 kg, and 3.06 kg for N, P, and K, respectively. The NR for K was 1.52 and 6.95 times higher than N and P, respectively. Similar results were also reported by [48], who observed 1.48 kg N, 1.05 kg P2O5, and 1.86 K2O as required per q of rice grain, respectively. In DSR, CS-22.05, 37.34%, and 41.48%; CF-38.08, 49.93%, and 252.98%; CF*-44.83, 60.57%, and 278.70%; and CFYM- 23.25, 28.34, and 16.80, respectively, for N, P, and K was found. The contribution of nutrients from the fertilizer was high compared to the contribution from the soil, owing to having a higher and rapid nutrient availability in the inorganic form from the fertilizers. CFYM was calculated with the help of data using the FYM treated and control plots, and it followed the order P > N > K. Bera et al. [49] also reported a similar trend. The nutrient supply through a native source in all the plots and their interaction effects might be the reason that the addition of CS, CFYM, CF, and CF* was not equal in percentage. The higher value of CF and CF* for potassium for the uptake in native soil source might be due to the interaction effects of the optimum supply of N and P, combined with the priming effects of potassium; this may increase the release of soil exchangeable and non-exchangeable potassium [50]. Similar findings were also reported by [27,51].

3.4. Prescription Equations in Chemical and Integrated Mode in DSR

Fertilization equations based on STCR were made to get the target yield of DSR with and without FYM by taking fundamental crop-production parameters viz. nutrient requirement (NR), efficiencies of fertilizers (CF and CF*), soil test (CS), and organic source FYM (CFYM) (Table 6).
Sharma and Singh [52], Benbi and Benipal [53], and Verma et al. [39] also developed fertilizer prescription equations based on STCR. Prescription equations are simple to use, and by putting values of the TY and STVs of N, P, and K into the equation, one can find the fertilizer requirement precisely for that crop in certain climatic conditions. Table 2, Table 3 and Table 4 show that the high STVs of NPK require smaller amounts of additional chemical and organic fertilizers. For the range of STVs of N, P, and K and TY of 4000, 4500, and 5000 kg ha−1, ready reckoners were prepared for NPK alone and NPK with 5 Mg ha−1 FYM. It is understandable that in the experimental outcomes the fertilizer N, P2O5, and K2O requirements for the desired TY of DSR decreased with increasing STVs. For the TY of 4000, 4500, and 5000 kg ha−1 of DSR without FYM with STVs of available N, P, and K as 200:20:120 kg ha−1, the amounts of fertilizer N, P2O5, and K2O to be applied are 95.40, 121.80, and 148.20 kg N ha−1; 46.44, 56.53, and 66.62 kg P2O5ha−1 1; and 34.46, 41.72, and 48.98 kg K2O ha−1, respectively. However, when 5 Mg ha−1 FYM was applied along with NPK, the amount of fertilizer N, P2O5, and K2O were reduced to 64.45, 86.85, and 109.25 kg N ha−1; 31.11, 39.42, and 47.73 kg P2O5ha−1; and 29.18, 35.78, and 42.38 kg K2O ha−1, respectively. FYM application in combination with chemical fertilizer resulted in savings of the chemical fertilizer and, ultimately, the cost of cultivation. The requirement of fertilizer when FYM was applied along with chemical fertilizer and when chemical fertilizer was applied alone was worked out separately for a particular STV and TY, and the difference between the two was a fertilizer nutrient equivalent (FNE) to FYM. Applying 5 Mg FYM ha−1 along with chemical fertilizers, on average, saved 36.04 kg N ha−1, 16.62 kg P2O5 ha−1, and 4.60 kg K2O ha−1 at the range of STVs and varying TY. The effect of FYM varied with crops, soil fertility level, and TY. FNE to FYM decreased with increasing STVs, while it increased with increasing TYs. Moreover, in the short term experiments, fertilizer savings were not up to the mark, but in the long term, they might give better results, as OM addition improves the crop sustainability and soil quality by improving the soil physical, chemical, and biological health. A similar finding for FNE and fertilizer savings with FYM was also reported by [54] for rice.

3.5. Verification Experiment

Verification trials are an important way to ascertain the validity of the results acquired from fertilizer prescription equations, before recommendations to farmers for higher profitability and efficiency than the GRD.

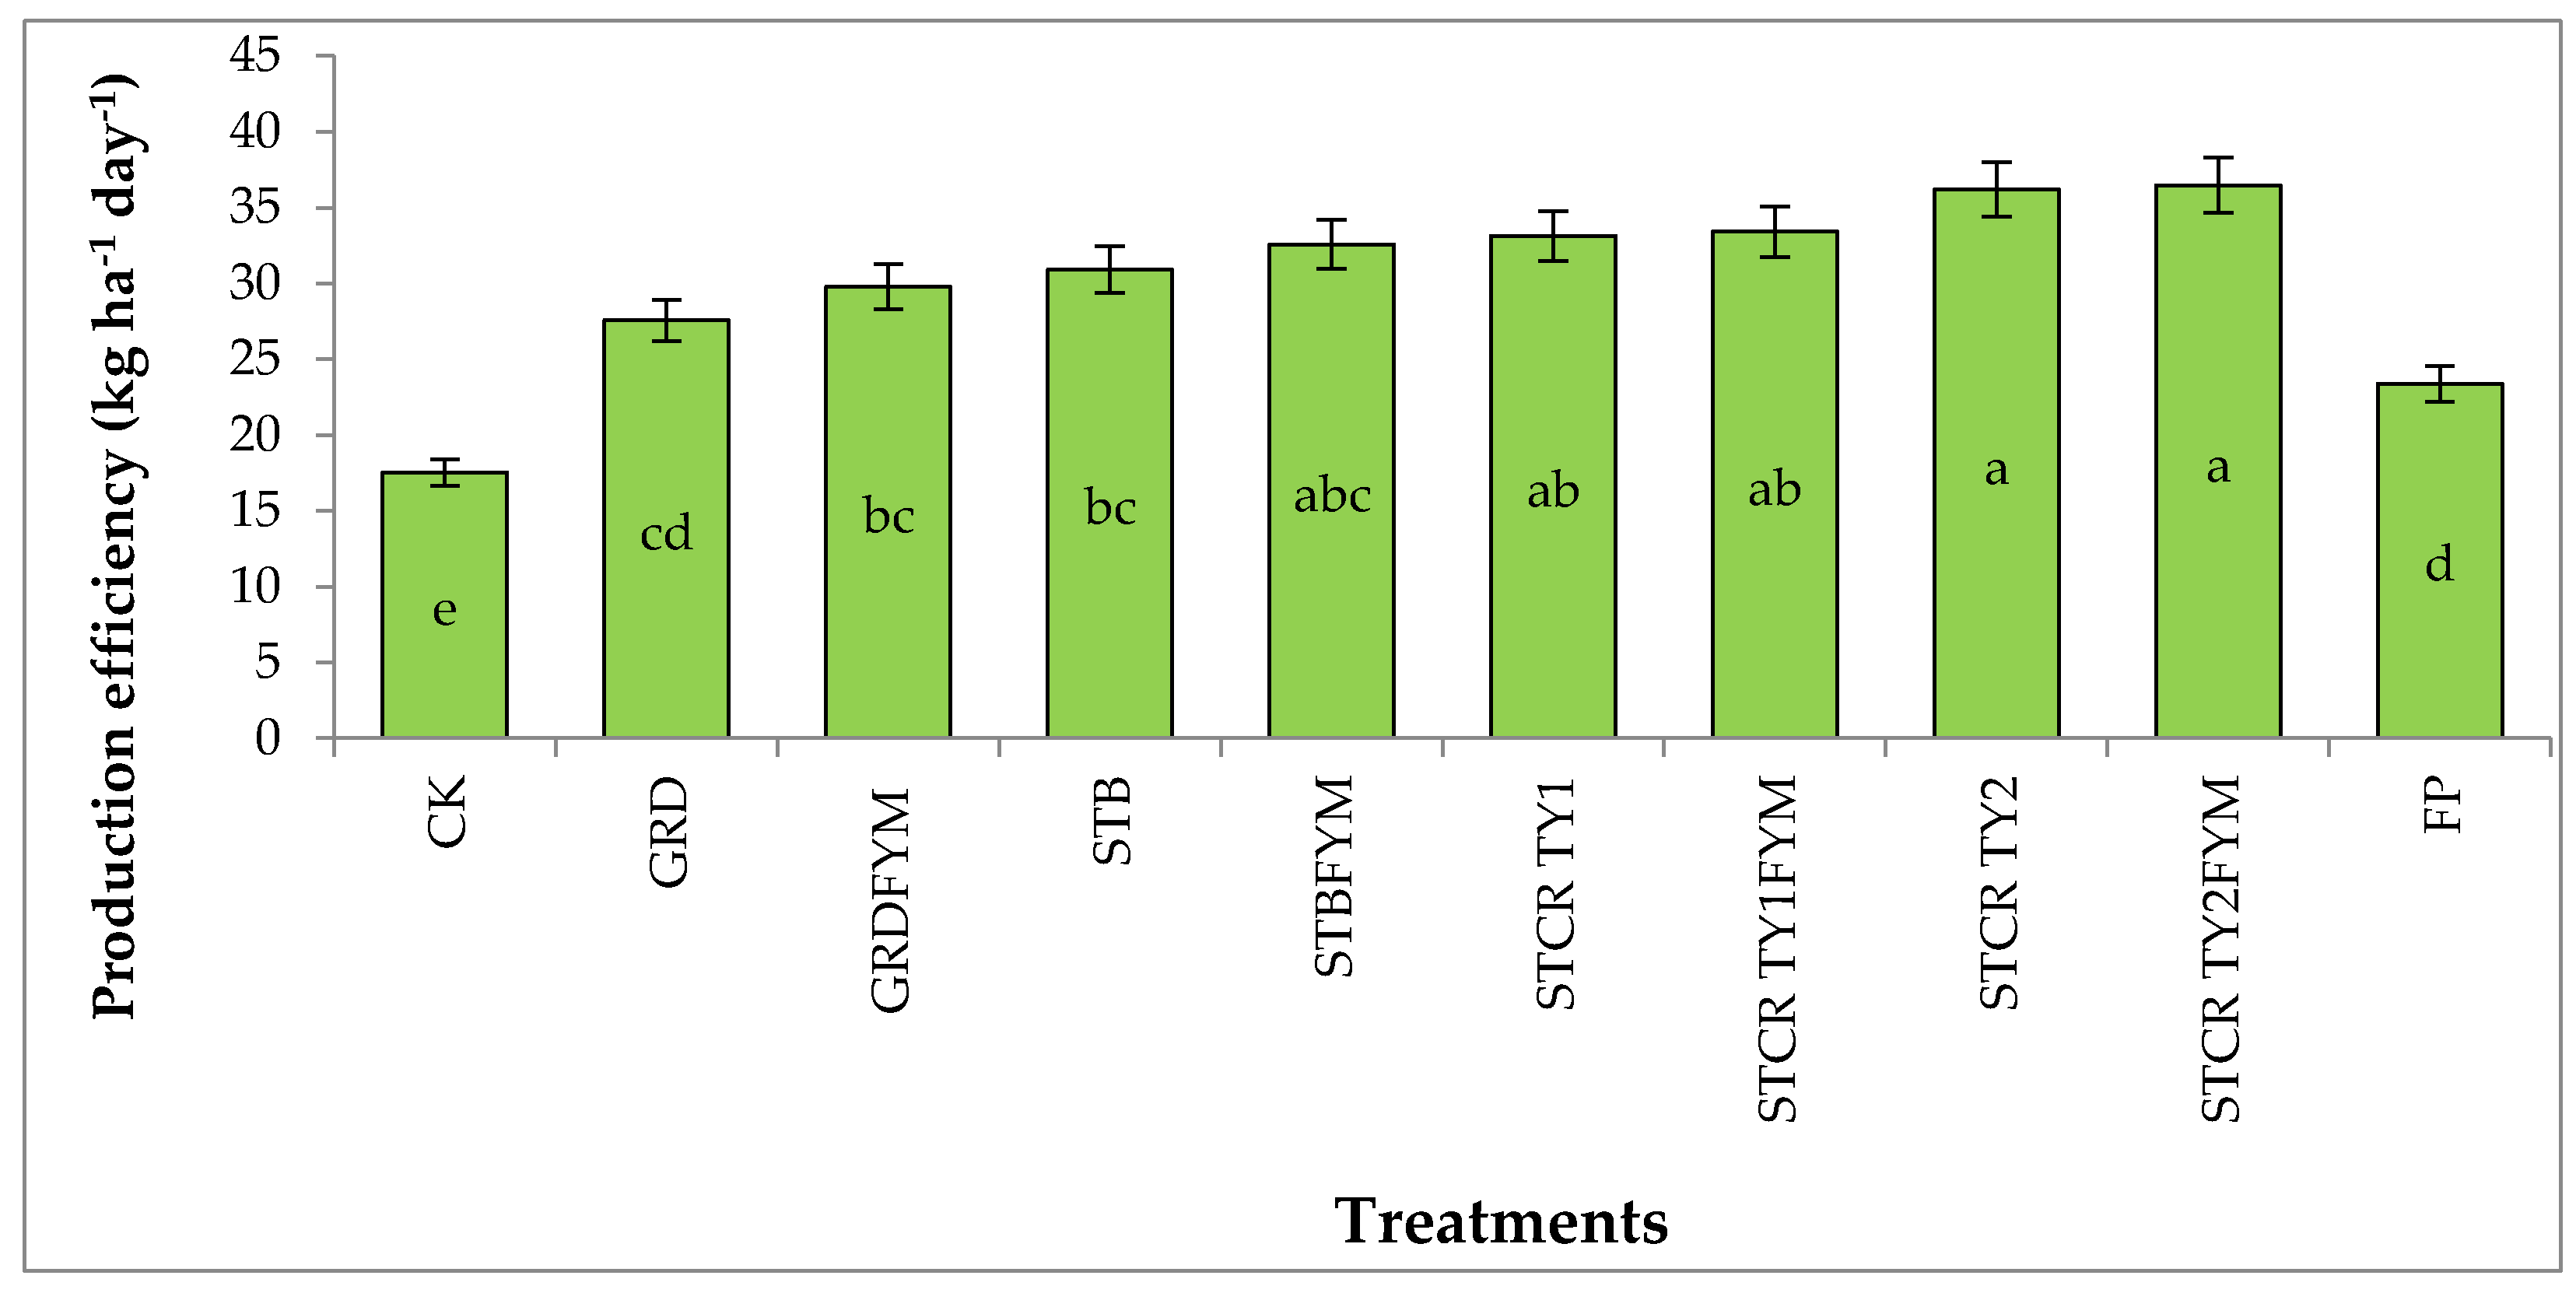
3.6. Yield and Production Efficiency

The production efficiency (PE) was affected by the different nutrient management treatments and are presented in Figure 3. Different nutrient management treatments gave significantly higher GY and SY than the CK (2386 and 3977 kg ha−1). The highest GY and SY were obtained with STCR TY2FYM (4962 kg ha−1 and 6174 kg ha−1), which was comparable with that of STCR TY2 (4924 kg ha−1), STCR TY1FYM (4545 kg ha−1), STCRTY1 (4508 kg ha−1), and STBFYM (4432 kg ha−1) for GY and STBFYM (6250 kg ha−1); and STCR TY2 (6174 kg ha−1), STCR TY1FYM (5795 kg ha−1), GRDFYM (5871 kg ha−1), STCRTY1 (5682 kg ha−1), and GRD (5644 kg ha−1) for SY. The STCR-IPNS based fertilizer recommendations resulted in 21.20 % in TY1 and 32.32 % in TY2 increases in the GY of DSR over the GRD.
The chemical mode of the STCR based fertilizer recommendation also gave a higher GY (20.21% in TY1 and 32.31% in TY2) compared to the GRD. The STCR-based fertilizer recommendation gave markedly higher rice GY than other approaches of fertilizer prescription [55]. In general, organic manures+chemical fertilizers significantly increase the available soil nutrient content and also improve the soil environment [56,57]. The increased yield under the STCR approach, with and without FYM, might have been due to the balanced application of fertilizers, as per the soil test, and the crop demand for growth and development. Furthermore, sufficient nutrient availability might have played a significant role in the rice-physiology for increased dry matter production and resulted in higher SY under the STCR-TY approach. Better vegetative growth, along with high yield attributes, resulted in a higher GY of rice [58]. In a similar experiment with two TYs (4.5 Mg ha−1 and 5.0 Mg ha−1 for maize), Venkatesh et al. [59] reported that a STCR-target yield based fertilizer recommendation with or without FYM led to 13.14–35.38% and 11.67–26% enhancement in GY and SY, respectively, under maize-lentil rotation. However, the integrated nutrient management based-STCR-TY approach led to a higher GY and SY than the sole use of chemical fertilizers. The results of the verification experiment revealed the achievement of attaining the desired TY of DSR was noted as +1.00, +0.17, −0.76, and −1.52 per cent with STCR TY1FYM, STCR TY1, STCR TY2FYM, and STCR TY2, respectively, which were within a variation of ±10%, proving the validity of the equations [60]. In the present study, the STCR-based INM schedule registered a relatively higher percent achievement than the STCR-chemical fertilizer based approach. Furthermore, a lower targeted yield was more easily achieved than the higher ones. Similar findings were also reported by [61]. The maximum HI was recorded in STCRTY1 (44.30%), which differed significantly from CK (37.55%) and FP (37.51%). Higher dry matter partitioning to grain might be the reason for the higher HI under STCRTY1 treatment. The PE was highest in STCRTY2FYM (36.49 kg ha−1d−1), which was comparable with STCRTY2 (36.21 kg ha−1d−1), STCRTY1FYM (33.42 kg ha−1d−1), STCRTY1 (33.14 kg ha−1d−1), and STBFYM (32.59 kg ha−1d−1). The lowest PE was recorded with CK (17.55 kg ha−1d−1), which was markedly lower than the other treatments. The higher PE with STCRTY2FYM was due to the higher GY under this treatment (Table 7). Furthermore, the adoption of the STCR-TY approach led to a significant increase in PE, ranging from 5.57 kg ha−1 d−1 to 8.92 kg ha−1 d−1, over the GRD.

3.7. NPK Uptake

Data on NPK uptake (grain, straw, and total) by DSR under different treatments are given in Table 8. The maximum N uptake by grain, straw, and total N uptake was recorded in STCR TY2FYM, which was significantly higher than all other treatments, except STCR TY2 (79.65 kg ha−1) and STCR TY1FYM (75.30 kg ha−1) for grain N uptake; STCR TY1FYM (39.22 kg ha−1), STBFYM (39.14 kg ha−1), and STCR TY2 (37.47 kg ha−1) for straw N uptake; and STCR TY2 (117.12 kg ha−1) and STCR TY1FYM (114.52 kg ha−1) for total N uptake. The lowest N uptake by grain, straw, and total N uptake was recorded in CK (26.73 kg ha−1, 10.23 kg ha−1, and 36.96 kg ha−1). The highest P uptake in grain, as well as total P uptake, was found with treatment STCR TY2FYM (18.44kg ha−1 and 29.62 kg ha−1), which was significantly higher than the other treatments. However, the maximum P uptake in straw, found in STCR TY2FYM (11.18 kg ha−1), was on par with STCR TY2 (9.97 kg ha−1) and STBFYM (9.56 kg ha−1) and significantly higher than the other treatments.
The highest P uptake in grain, as well as total P uptake, was found with treatment STCR TY2FYM (18.44kg ha−1 and 29.62 kg ha−1) which was significantly higher than other treatments. However, maximum P uptake in straw found in STCR TY2FYM (11.18 kg ha−1) was at par with STCR TY2 (9.97 kg ha−1) and STBFYM (9.56 kg ha−1) and significantly higher than other treatments. The lowest values for P uptake by grain, straw and total P uptake were recorded with CK (4.86 kg ha−1, 3.82 kg ha−1and 8.67 kg ha−1). Maximum rice-grain K-uptake, rice-straw K-uptake and total K-uptake was found in STCR TY2FYM (31.55 kg ha−1, 106.76 kg ha−1and 138.30 kg ha−1) which was at par with STCR TY2 (29.93 kg ha−1, 98.59 kg ha−1and 128.52 kg ha−1). The lowest values for P uptake by grain, straw, and total P uptake were recorded with CK (4.86 kg ha−1, 3.82 kg ha−1, and 8.67 kg ha−1). The maximum rice-grain K-uptake, rice-straw K-uptake, and total K-uptake was found in STCR TY2FYM (31.55 kg ha−1, 106.76 kg ha−1, and 138.30 kg ha−1), which was at par with STCR TY2 (29.93 kg ha−1, 98.59 kg ha−1, and 128.52 kg ha−1). The lowest grain and straw and total K uptake were recorded with CK (7.83 kg ha−1, 49.72 kg ha−1, and 57.55 kg ha−1). The favorable soil conditions with STCR treatments might have paved the way for better absorption and mobilization, in tune with the growth and activity of roots, which may have caused a better production of dry matter and absorption of nutrients and increased grain and straw yield, and N, P, and K contents, which were reflected in their higher uptakes.

3.8. Fertilizer Economics and Economic Efficiency

The data on the fertilizer economics in DSR, as affected by different treatments (Table 9), revealed that the value of the additional yield of DSR over CK was the highest with STCR TY2FYM (2576 kg ha−1), followed by STCR TY2 (2538 kg ha−1), and was the lowest with FP (795 kg ha−1). Similarly, the highest net return was noted in STCR TY2 (INR 38,738 ha−1), followed by STCR TY2FYM (INR 38,293 ha−1), and was the lowest in FP (INR 10,431 ha−1). Similarly, the highest B:C ratio was noted in STCR TY2 (6.83), followed by STCRTY1 (6.68), and was the lowest in FP (2.99). The STCR-based nutrient recommendation net return and B:C cost ratio ranged from INR 31,696–38,738 ha−1 and 5.21–6.83, respectively, higher than the GRD (INR 19,287 ha−1 and 4.21, respectively). The highest B:C ratio with STCR TY2 might have been due to the highest net return with this treatment. Similarly, a higher benefit–cost ratio with STCR-based fertilizer treatments than the GRD or farmer practice has been reported [62]. Net returns from the improved practice (STCR technology) were substantially higher than the FP for DSR. Similarly, higher indices of economic analysis, such as gross and net return and benefit:cost ratio, than the GRD in transplanted rice under rainfed Alfisols have been noticed [15]. The highest economic efficiency was recorded with STCR TY2 (INR 285 ha−1 d−1), which was due to the highest net return being obtained under this treatment (Table 10). The economic efficiency of the DSR was enhanced by INR 91 ha−1 d−1 to INR 143 ha−1 d−1 due to the STCR-target yield based nutrient recommendation, compared to the application of GRD.

3.9. Nutrient Use Efficiency (NUE)

Table 10 shows the NUE as influenced by various nutrition. Nutrient management practices caused a significant variation in NUE under the DSR system of rice. In general, the STCR treatments had a higher AEN compared to the other treatments. The highest AEN occurred with STCR TY2FYM (17.4 kg grain (kg N)−1), which was statistically comparable with STCR TY1FYM (17.1 kg grain (kg N)−1), STCR TY2 (15.0 kg grain (kg N)−1), and STCR TY1 (14.8 kg grain (kg N)−1). STCR TY2FYM increased the AEN significantly by 6.0 kg grain (kg N)−1 compared with GRD. The lowest AEN occurred in FP (6.1 kg grain (kg N)−1). The AEP and AEK were significantly higher in STCR-based nutrient management practices than the application of the GRD alone, except for the AEK in STCR TY2FYM and STCR TY1FYM, where they were at par with the GRD. An AEN of 6.8–34.2 [63] and AEK of 28.4–55.3 [64] in rice crops have been reported. Similarly, the REN, REP, and REK increased significantly with STCR treatments compared to application of the GRD alone, except for REK, where the STCR TY1FYM and GRD were comparable.
The REK in this experiment varied from 73.85–165.05, which is in the range of 65.7–366.2% reported by [65] in a rice crop. Except for STCR TY1FYM, all other STCR-based nutrient management practices were comparable with the GRD in the case of PPFN. Except for STCR TY2FYM and STCR TY1FYM, all other STCR-based nutrient management practices were comparable with the GRD in the case of PPFP. Except for STCR TY2 and STCR TY1, all other STCR-based nutrient management practices were comparable with the GRD in case of PPFK. A PFPK of 62.42–191.33 has been reported [64]. In general, the reciprocal internal use efficiency (RIUE) followed the order RIUEN>RIUEK>RIUEP [25]. The RIUE for nitrogen, phosphorus, and potassium was enhanced markedly with STCR-based nutrient management practices, compared to GRD alone. Significantly lower RIUE for N, P, and K were recorded with CK, which was at par with FP in the case of RIUEP. A balanced application of plant nutrients increases the GY and nutrient use efficiency [66]. The relatively higher AE with a STCR-based application of fertilizers compared to common recommendations might be due to the balanced supply and efficient utilization of nutrients due to synergistic effects of fertilizers and the applied FYM [18].

4. Conclusions

The fertilizer prescription equations and ready reckoners developed in the present experiment, considering the crop NPK demand and soil NPK supply, fertilizer, and FYM, can successfully be used as a guide for implementation of integrated nutrient management in DSR. Fertilizers equations developed for STCR-INM and STCR chemical mode achieved the desired target yields with −1.5 to +1.0 percent, proving the validity of these equations. Nutrient management through the STCR-INM and STCR chemical mode could raise the yield, economic return, and efficiency of applied nutrients in direct-seeded rice over the generally recommended dose and prevailing farmer practices. Therefore, STCR-INM and STCR chemical mode based nutrient management can be recommended as an effective tool for balanced fertilization.

Supplementary Materials

The following are available online at https://www.mdpi.com/article/10.3390/agronomy11091756/s1, Table S1: Detailed N, P and K treatment combinations used for test crop experimentation.

Author Contributions

Conceptualization: V.K.S., P.G., G.N., S.S.D., S.S.M. and B.P.; methodology: V.K.S., P.G. and G.N.; formal analysis: V.K.S., P.G. and G.N.; data curation: V.K.S., P.G. and G.N.; statistical expertise: V.K.S., P.G. and G.N.; writing—original draft preparation: V.K.S., P.G., G.N., S.S.D., S.S.M. and B.P.; writing—review and editing: P.G., G.N., W.F.A., A.G., S.S. and A.H.; visualization: V.K.S., P.G. and G.N.; supervision: P.G. and G.N.; project administration: A.G., S.S. and A.H.; funding acquisition: W.F.A., A.G., S.S. and A.H. All authors have read and agreed to the published version of the manuscript in ‘Agronomy’.

Funding

This research was funded by the ICAR-SRF Fellowship programme of the Government of India. The work was also supported by the Taif University Researchers Supporting Project number (TURSP-2020/53), Taif University, Taif, Saudi Arabia.

Institutional Review Board Statement

Not applicable.

Informed Consent Statement

Not applicable.

Data Availability Statement

Data will be available after request.

Acknowledgments

Authors are grateful to the Head, Department of Soil Science, GBPUAT, Pantnagar for providing the necessary facilities and the researchers associated with the ICAR–AICRP on soil test crop response. The first author is also grateful to the ICAR-SRF Fellowship programme of the Government of India for financial support. The authors appreciated Taif University Researchers Supporting Project number (TURSP-2020/53), Taif University, Taif, Saudi Arabia for providing financial support to conduct the research.

Conflicts of Interest

The authors have no conflict of interest to disclose.

Ethical Statement

No living organism (human or animal) was involved in conducting the present experiments.

References

  1. Pandey, S.; Velasco, L.E. Economics of alternative rice establishment methods in Asia: A strategic analysis. Soc. Sci. Div. Discuss. Pap. Int. Rice Res. Inst. Los Banos Philipp. 1999, 1, 12–18. [Google Scholar]
  2. Gill, G.; Humphreys, E.; Kukal, S.S.; Walia, U.S. Effect of water management on dry seeded and puddled transplanted rice. Part 1: Crop performance. Field Crops Res. 2011, 120, 112–122. [Google Scholar]
  3. Pandey, S.; Velasco, L. Trends in crop establishment methods in Asia and research issues. In Rice Is Life: Scientific Perspectives for the 21st Century; Manila IRRI: Manila, Philippines, 2005; pp. 178–181. [Google Scholar]
  4. Hossain, M.; Lewis, D.; Bose MLChowdhury, A. Rice Research, Technological Progress, and Impacts on the Poor: The Bangladesh Case (Summary Report); International Food Policy Research Institute: Washington, DC, USA, 2003. [Google Scholar]
  5. Dey, P. Soil Health Management. Bull. Indian Soc. Soil Sci. 2016, 30, 79–97. [Google Scholar]
  6. Pramanick, B.; Brahmachari, K.; Ghosh DBera, P.S. Influence of foliar application seaweed (Kappaphycus and Gracilaria) saps in rice (Oryza sativa)–potato (Solanum tuberosum)–blackgram (Vigna mungo) sequence. Indian J. Agron. 2018, 63, 7–12. [Google Scholar]
  7. Singh, D.K.; Pandey, P.C.; Nanda, G.; Gupta, S. Long-term effects of inorganic fertilizer and farmyard manure application on productivity, sustainability and profitability of rice-wheat system in Mollisols. Arch. Agron. Soil Sci. 2019, 65, 139–151. [Google Scholar] [CrossRef]
  8. Sharma, V.K.; Pandey, R.N.; Sarvendra, K.; Chobhe, K.A.; Suresh, C. Soil test crop response based fertilizer recommendations under integrated nutrient management for higher productivity of pearl millet (Pennisetum glaucum) and (Triticum aestivum) wheat under long term experiment. Indian J. Agric. Sci. 2016, 86, 1076–1081. [Google Scholar]
  9. Patel, A.; Neupane, M.P.; Nanda, G.; Singh, S.P. Effect of NPK management and bioinoculants on growth and yield of wetland rice (Oryza sativa L.). Environ. Ecol. 2016, 34, 181–185. [Google Scholar]
  10. Mahajan, A.; Gupta, R.D. Role of INM in Sustainable Rice–Wheat Cropping System. In Integrated Nutrient Management (INM) in a Sustainable Rice-Wheat Cropping System; Mahajan, A., Gupta, R.D., Eds.; Springer: Dordrecht, The Netherlands, 2009. [Google Scholar] [CrossRef]
  11. Santhi, R.; Bhaskaran, A.; Natesan, R. Integrated fertilizer prescriptions for beetroot through inductive cum targeted yield model on an alfisol. Commun. Soil Sci. Plant Anal. 2011, 42, 1905–1912. [Google Scholar] [CrossRef]
  12. Nanda, G.; Sravan, U.S.; Singh, A.; Singh, S.P. Effect of NPK Levels and Bio-Organics on Growth, Yield and Economics of Basmati Rice (Oryza sativa L.) cv HUBR 10-9. Environ. Ecol. 2016, 34, 1530–1534. [Google Scholar]
  13. Majhi, P.; Rout, K.K.; Nanda, G.; Singh, M. Soil quality for rice productivity and yield sustainability under long-term fertilizer and manure application. Commun. Soil Sci. Plant Anal. 2019, 50, 1330–1343. [Google Scholar] [CrossRef]
  14. Majhi, P.; Rout, K.K.; Nanda, G.; Singh, M. Long term effects of fertilizer and manure application on productivity, sustainability and soil properties in a rice-rice system on Inceptisols of Eastern India. Commun. Soil Sci. Plant Anal. 2021, 52, 1631–1644. [Google Scholar] [CrossRef]
  15. Sharma, G.K.; Mishra, V.N.; Maruti Sankar, G.R.; Patil, S.K.; Srivastava, L.K.; Thakur, D.S.; Rao, C.S. Soil-test-based optimum fertilizer doses for attaining yield targets of rice under midland Alfisols of Eastern India. Commun. Soil Sci. Plant Anal. 2015, 46, 2177–2190. [Google Scholar] [CrossRef]
  16. Singh, S.R.; Maitra, D.N.; Kundu, D.K.; Majumdar, B.; Saha, A.R.; Mahapatra, B.S. Integrated fertilizer prescription equations for recommendations of fertilizers in jute–rice–garden pea sequence on alluvial soil of eastern India. Commun. Soil Sci. Plant Anal. 2015, 46, 1–15. [Google Scholar] [CrossRef]
  17. Dobermann, A.; Witt, C.; Abdulrachman, S.; Gines, H.C.; Nagarajan, R.; Son, T.T.; Tan, P.S.; Wang, G.H.; Chien, N.V.; Thoa, V.T.K.; et al. Soil fertility and indigenous nutrient supply in irrigated rice domains of Asia. Agron. J. 2003, 95, 913–923. [Google Scholar] [CrossRef]
  18. Rao, A.S.; Srivastava, S. Soil test based fertiliser use: A must for sustainable agriculture. Fertil. News 2000, 45, 25–38. [Google Scholar]
  19. Jackson, M.L. Soil Chemical Analysis Prentice; Hall of India Private Limited: New Delhi, India, 2000; p. 498. [Google Scholar]
  20. Walkley, A.; Black, I.A. An examination of Degtjareff method for determining soil organic matter and a proposed modification of the chromic acid titration method. Soil Sci. 1934, 37, 29–38. [Google Scholar] [CrossRef]
  21. Subbaiah, B.V.; Asija, G.L. A rapid procedure for the determination of available nitrogen in soil. Curr. Sci. 1956, 25, 259–260. [Google Scholar]
  22. Olsen, S.R.; Cole, C.V.; Watanabe, F.S.; Dean, L.A. Estimation of Available Phosphorus in Soils by Extraction with Sodium Bicarbonate; No. 939; US Dept Agric Circular: Washington, DC, USA, 1954. [Google Scholar]
  23. Hanway, J.J.; Heidel, H. Soil analysis methods as used in Iowa state college soil testing laboratory. Iowa Agric. 1952, 57, 1–31. [Google Scholar]
  24. Ramamoorthy, B.; Narasimham, R.L.; Dinesh, R.S. Fertilizer application for specific yield targets on Sonora 64 (wheat). Indian Farming 1967, 17, 43–45. [Google Scholar]
  25. Singh, P.; Benbi, D.K.; Verma, G. Nutrient Management Impacts on Nutrient Use Efficiency and Energy, Carbon, and Net Ecosystem Economic Budget of a Rice–Wheat Cropping System in Northwestern India. J. Soil Sci. Plant Nutr. 2021, 21, 559–577. [Google Scholar] [CrossRef]
  26. Gomez, K.A.; Gomez, A.A. Statistical Procedures in Agricultural Research, 2nd ed.; Wiley: New York, NY, USA, 1984. [Google Scholar]
  27. Ammal, U.B.; Coumaravel, K.; Sankar, R.; Dey, P. Fertilizer Prescriptions under STCR-IPNS for Rice-Rice Cropping Sequence on An Inceptisol (Typic Ustropept). Indian J. Agric. Res. 2019, 53, 698–702. [Google Scholar] [CrossRef] [Green Version]
  28. Dwivedi, B.S.; Shukla, A.K.; Singh, V.K.; Yadav, R.L. Improving nitrogen and phosphorus use efficiencies through inclusion of forage cowpea in the rice–wheat systems in the Indo-Gangetic Plains of India. Field Crops Res. 2003, 80, 167–193. [Google Scholar] [CrossRef]
  29. Gayathri, A.; Vadivel, A.; Santhi, R.; Boopathi, P.M.; Natesan, R. Soil test based fertilizer recommendation under integrated plant nutrition system for potato (Solanum tuberosum L.) in hilly tracts of Nilgiris district. Indian J. Agric. Res. 2009, 43, 52–56. [Google Scholar]
  30. Mahajan, G.R.; Pandey, R.N.; Datta, S.C.; Kumar, D.; Sahoo, R.N.; Parsad, R. Fertilizer nitrogen, phosphorus and sulphur prescription for aromatic hybrid rice (Oryza sativa L.) using targeted yield approach. Proc. Natl. Acad. Sci. India Sect. B Biol. Sci. 2014, 84, 537–547. [Google Scholar] [CrossRef]
  31. Singh, Y.V. STCR based gradient experiment with sorghum (Sorghum biocolor L.) to NPK fertilizers in the alluvial soil. Indian J. Crop Ecol. 2014, 2, 83–86. [Google Scholar]
  32. Arya, A. Optimization of Fertilizer Doses through STCR Approach for Cauliflower (Brassica oleracea L var. Botrytis) Grown in Mollisols. Doctoral Dissertation, GB Pant University of Agriculture and Technology, Pantnagar, India, 2019. [Google Scholar]
  33. Mahajan, G.R.; Pandey, R.N.; Datta, S.C.; Kumar, D.; Sahoo, R.N.; Parsad, R. Soil test based fertilizer recommendation of nitrogen, phosphorus and sulphur in wheat (Triticum aestivum L.) in an Alluvial soil. Int. J. Agric. Environ. Biotechnol. 2013, 6, 271. [Google Scholar]
  34. Ahmed, S.; Basumatary, A.; Das, K.N.; Medhi, B.K. Targeted yield based fertilizer prescriptions for autumn rice (Oryza sativa L.) in inceptisols of Assam, India. Indian J. Agric. Res. 2015, 49, 437–441. [Google Scholar] [CrossRef] [Green Version]
  35. Luthra, N. STCR Approach for Optimizing Integrated Plant Nutrients Supply to Obtain Better Growth and Yield of Hybrid Maize (Zea mays L.). Ph.D. Dissertation, GB Pant University of Agriculture and Technology, Pantnagar, India, 2019. [Google Scholar]
  36. Radha Madhav, M.; Ravikumar, A.; Venkateswaralu, B. Effect of different sources of nitrogen on growth, yield and nutrient uptake of rice. Agric. J. 1996, 43, 119–122. [Google Scholar]
  37. Sandhu, S.S.; Mahal, S.S. Performance of rice (Oryza sativa) under different planting methods, nitrogen levels and irrigation schedules. Indian J. Agron. 2014, 59, 392–397. [Google Scholar]
  38. Verma, V.S.; Saxena, K.K. Response of french bean to graded doses of nitrogen, phosphorus and potassium in silty-loam soil of central Uttar Pradesh. Indian J. Agron. 1995, 40, 67–71. [Google Scholar]
  39. Verma, T.S.; Suri, V.K.; Paul, J.; Vishavavidyalaya, H.P.K. Prescription-based fertilizer recommendations for rice, maize and wheat in different Agro-climatic zones of Himachal Pradesh. J. Indian Soc. Soil Sci. 2002, 50, 272–277. [Google Scholar]
  40. Verma, M.; Singh, Y.V.; Ajay Babu Verma, S.; Meena, R.; Sahi, S.K. Soil test crop response based gradient experiment on rice (Oryza sativa L.) to NPK fertilizers in the alluvial soil. Indian J. Agric. Allied Sci. 2015, 1, 51–53. [Google Scholar]
  41. Verma, M.; Singh, Y.V.; Dey, P.; Babu, A. Soil test based fertilizer recommendation for mustard (Brassica juncea L.) in Eastern Plain Zone of Uttar Pradesh, India. Int. J. Curr. Microbiol. Appl. Sci. 2017, 6, 155–161. [Google Scholar] [CrossRef] [Green Version]
  42. Surekha, K.; Kumar, R.M.; Nagendra, V.; Sailaja, N.; Satyanarayana, T. 4R Nitrogen Management for Sustainable Rice Production. Better Crop. 2016, 10, 16–19. [Google Scholar]
  43. Pasha, L.M.; Reddy, M.D.; Reddy, M.G.; Devi, M.U. Effect of irrigation schedule, weed management and nitrogen levels on weed growth in rice (Oryza sativa) under aerobic conditions. Indian J. Weed Sci. 2011, 43, 54–60. [Google Scholar]
  44. Singh, A.S.; Pandey, N.; Ahmad, A.; Verma, N. Nutrient Uptake and Economics of Rice under Aerobic Condition in CPE Based Irrigation Schedules and Nutrient Level in Raipur, India; Jawaharlal Nehru Krishi Vishwa Vidyalaya: Jabalpur, India, 2013; p. 42. [Google Scholar]
  45. Panaullah, G.M.; Timsina, J.; Saleque, M.A.; Ishaque, M.; Pathan, A.B.M.B.U.; Connor, D.J.; Saha, P.K.; Quayyum, M.A.; Humphreys, E.; Meisner, C.A. Nutrient uptake and apparent balances for rice-wheat sequences. III. Potassium. J. Plant Nutr. 2006, 29, 173–187. [Google Scholar] [CrossRef]
  46. Pande, J. Soil Test Crop Response Based Balanced Fertilization of Cabbage (Brassica oleracea var. Capitata) Grown in a Mollisol of Uttarakhand; G.B. Pant University of Agriculture and Technology: Pantnagar, India, 2010. [Google Scholar]
  47. Dubey, A.; Tiwari, A.; Pandey, R.L.; Dubey, A. Effect of organic manure in seed yield and seed attributes of rajmash (Phaseolus vulgaris L.) under Vertisols of Chhattisgarh plains, India. Int. J. Curr. Res. 2014, 6, 9469–9472. [Google Scholar]
  48. Chatterjee, D.; Srivastava, A.; Singh, R.K. Fertilizer recommendations based on targeted yield concept involving integrated nutrient management for potato (Solanum tuberosum) in tarai belt of Uttarakhand. Indian J. Agric. Sci. 2010, 80, 1048. [Google Scholar]
  49. Bera, R.; Seal, A.; Bhattacharyya, P.; Das, T.H.; Sarkar, D.; Kangjoo, K. Targeted yield concept and a framework of fertilizer recommendation in irrigated rice domains of subtropical India. J. Zhejiang Univ. Sci. B 2006, 7, 963–968. [Google Scholar] [CrossRef] [PubMed] [Green Version]
  50. Ray, P.; Jana, K.; Maitra, A.K.; Saha, D.N.; Chaudhury, M.N.; Saha, J.S.; Saha, A.R. Fertilizer prescription on soil test basis for jute, rice and wheat in a Typic Ustochrept. J. Indian Soc. Soil Sci. 2000, 48, 79–84. [Google Scholar]
  51. Ammal, U.B.; Sankar, R.; Coumaravel, K.; Dey, P. Fertilizer Prescriptions for Rice Based on STCR–IPNS. Int. J. Curr. Microbiol. App. Sci. 2020, 9, 2517–2522. [Google Scholar] [CrossRef]
  52. Sharma, B.M.; Singh, R.V. Soil-test-based fertilizer use in wheat for economic yield. J. Indian Soc. Soil Sci. 2005, 53, 356–359. [Google Scholar]
  53. Benbi, D.K.; Benipal, D.S. Fertilizer recommendations based on soil tests for yield targets of mustard and rapeseed and their validations under farmers’ field conditions in Punjab. J. Indian Soc. Soil Sci. 2006, 54, 316–321. [Google Scholar]
  54. Basavaraja, P.K.; Mohamed Saqeebulla, H.; Dey, P.; Prakash, S.S. Fertilizer prescription equations for targeted yield of rice (Oryza sativa L.) and their validation under aerobic condition. Int. J of Agri. Sci. 2016, 8, 1003–1008. [Google Scholar]
  55. Mittal, S.; Sharma, S.K. Effect of different approaches of fertilizer recommendations on yield, nutrient uptake and economics of rice under SRI. J. Pharmacogn. Phytochem. 2018, 7, 761–765. [Google Scholar]
  56. Tiwari, A.; Dwivedi, A.K.; Dikshit, P.R. Long-term influence of organic and inorganic fertilization on soil fertility and productivity of soybean–wheat system in a Vertisol. J. Indian Soc. Soil Sci. 2002, 50, 472–475. [Google Scholar]
  57. Anderson, J.; Blackie, M.; Eilitta, M.; Fernandes, E.; Sanginga, N.; Smaling, E.; Spencer, D. A Consultative Review of the Rockefeller Foundation’s Activities to Improve and Sustain Soil Fertility in East and Southern Africa; The Rockefeller Foundation: New York, NY, USA, 2002. [Google Scholar]
  58. Sengar, S.S.; Wade, L.J.; Baghel, S.S.; Singh, R.K.; Singh, G. Effect of nutrient management on rice (Oryza sativa) in rainfed lowland of southeast Madhya Pradesh. Indian J. Agron. 2000, 45, 315–322. [Google Scholar]
  59. Venkatesh, M.S.; Hazra, K.K.; Ghosh, P.K.; Singh, K.K. Improving productivity of maize-lentil rotation in alkaline Fluvisol following soil test crop response (STCR)-targeted yield approach of nutrient management. Arch. Agron. Soil Sci. 2021, 1–15. [Google Scholar] [CrossRef]
  60. Velayutham, M.; Sankar, M.G.R.; Reddy, K.C.K. Soil test-crop response research work in India for fertilizer recommendation. In Proceedings of the International Symposium on Soil Testcrop Response Correlation Studies, Dhaka, Bangladesh, 7–10 February 1984. [Google Scholar]
  61. Katharine, S.P.; Santhi, R.; Maragatham, S.; Natesan, R.; Ravikumar, V.; Dey, P. Soil test based fertilizer prescriptions through inductive cum targeted yield model for transgenic cotton on Inceptisol. IOSR J. Agric. Vet. Sci. 2013, 6, 36–44. [Google Scholar] [CrossRef]
  62. Arunima, G.; Antaryami, M.; Jena, B. Soil test based fertilizer recommendation for targeted yield of pumpkin (Cucurbita moschata) under rice-pumpkin cropping system in an inceptisol of Orissa. Environ. Ecol. 2011, 29, 574–576. [Google Scholar]
  63. Duan, Y.H.; Shi, X.J.; Li, S.L.; Sun, X.F.; He, X.H. Nitrogen use efficiency as affected by phosphorus and potassium in long-term rice and wheat experiments. J. Integr. Agric. 2014, 13, 588–596. [Google Scholar] [CrossRef]
  64. Banerjee, H.; Ray, K.; Dutta, S.K.; Majumdar, K.; Satyanarayana, T.; Timsina, J. Optimizing potassium application for hybrid rice (Oryza sativa L.) in coastal saline soils of West Bengal, India. Agronomy 2018, 8, 292. [Google Scholar] [CrossRef] [Green Version]
  65. Fageria, N.K.; Dos Santos, A.B.; De Moraes, M.F. Yield, potassium uptake, and use efficiency in upland rice genotypes. Commun. Soil Sci. Plant Anal. 2010, 41, 2676–2684. [Google Scholar] [CrossRef]
  66. Selvi, D.; Santhy, P.; Dhakshinamoorthy, M.; Maheshwari, M. Microbial population and biomass in rhizosphere as influenced by continuous intensive cultivation and fertilization in an Inceptisol. J. Indian Soc. Soil Sci. 2004, 52, 254–257. [Google Scholar]
Figure 1. Standard meteorological weekly variation in the weather during the crop growing season.
Agronomy 11 01756 g001
Figure 2. Linear correlations between grain yield and total N (a), P (b), and K (c) uptake in direct-seeded rice in the test crop experiment.
Agronomy 11 01756 g002
Figure 3. DSR production efficiency under different treatment combinations. Bars with the same letter are not different at a 5% probability level; error bars indicate the standard deviation of the respective means.
Agronomy 11 01756 g003
Table 1. Treatment details of the verification experiment.
TreatmentSymbolN-P2O5-K2O-FYM*Applied
(kg ha−1/Mg ha−1 *)
ControlCK0-0-0-0
General recommended fertilizer doseGRD120-60-40-0
GRD + 5 t FYM ha−1GRDFYM120-60-40-5
Soil test based fertilizer dose (STB)STB200-60-40-0
STB + 5 t FYM ha−1STBFYM200-60-40-5
STCR based fertilizer dose for TY1STCR TY1143-62-36-0
STCR TY1 INMSTCR TY1FYM105-44-31-5
STCR based fertilizer dose for TY2STCR TY2169-72-43-0
STCR TY2 INMSTCR TY2FYM127-52-37-5
Farmer’s practiceFP130-40-20-0
Target yield level 1= TY1 = 4.5 Mg ha−1; target yield level 2= TY2 = 5.0 Mg ha−1; * FYM application rate in terms of Mg ha−1 and other fertilizers were applied as kg ha−1.
Table 2. Descriptive statistics of available soil nutrients (0–15), nutrients after the soil fertility gradient experiment.
Strip Soil Available Nutrients (kg ha−1)
NPK
Strip IRange125.4–200.714.4–19.2122.1–172.5
Mean ± SD
(CV %)
165.2 ± 20.2
(12.2)
16.9 ± 1.1
(6.5)
144.3 ± 13.3
(9.2)
Median163.117.0143.4
Strip IIRange125.4–200.715.8–19.5125.4–173.6
Mean ± SD
(CV %)
169.3 ± 21.9
(12.9)
17.7 ± 1.0
(5.5)
154.3 ± 14.1
(9.1)
Median175.617.7156.8
Strip IIIRange150.5–188.116.6–21.7133.3–171.4
Mean ± SD
(CV %)
172.0 ± 13.1
(7.6)
18.9 ± 1.5
(7.8)
156.5 ± 11.0
(7.0)
Median175.618.2157.4
All stripsRange125.4–200.714.4–21.7122.1–173.6
Mean ± SD
(CV %)
168.8 ± 18.7
(11.1)
17.8 ± 1.5
(8.1)
151.7 ± 13.8
(9.1)
Median169.317.7153.4
SD, standard deviation; CV (%), co-efficient of variation (%).
Table 3. R2, CV (%), and SD of whole plots.
Dependent Variablep LevelR2AverageSDCV (%)
SN<0.010.76168.8218.7111.08
SP<0.010.7917.811.427.99
SK<0.010.71151.7313.779.08
SN, SP, and SK denote soil nitrogen, phosphorus, and potassium, correspondingly.
Table 4. Descriptive statistics of DSR GY and nutrient uptake.
Strip Grain Yield
(kg ha−1)
Straw Yield
(kg ha−1)
N Uptake
(kg ha−1)
P Uptake
(kg ha−1)
K Uptake
(kg ha−1)
Strip IRange2273–53413864–11,25024.0–100.94.3–18.144.0–186.4
Mean ± SD (CV%)3902 ± 899 (23.0)7014 ± 1752
(25.0)
66.2 ± 17.3
(24.4)
11.4 ± 3.5
(31.0)
106.5 ± 32.8
(30.8)
Median3864687571.411.5104.7
Strip IIRange2841–67053750–12,27343.2–152.24.3–25.560.2–238.6
Mean ± SD (CV%)4276 ± 1098 (25.7)7869 ± 2254
(28.6)
88.2 ± 30.9
(32.7)
16.0 ± 6.0
(37.4)
136.1 ± 46.1
(33.9)
Median4034772786.617.5135.2
Strip IIIRange3636–64774545–12,38653.9–171.010.1–45.772.0–236.8
Mean ± SD (CV%)4697 ± 897 (19.1)8215 ± 2245
(27.3)
108.5 ± 30.7
(26.4)
30.38 ± 9.6
(31.6)
152.07 ± 45.8
(30.1)
Median43758580125.232.4155.0
All stripsRange2273–67053750–12,38624.0–171.04.3–45.744.0–238.6
Mean ± SD (CV%)4291 ± 1010
(23.5)
7699 ± 2129
(27.6)
87.6 ± 32.5
(34.6)
19.3 ± 10.6
(55.0)
131.6 ± 45.6
(34.7)
Median4091758084.016.6124.2
SD, standard deviation; CV, coefficient of variation (%).
Table 5. Basic parameters for calculating fertilizer requirement, with and without FYM, for the targeted yield of DSR.
Basic ParameterNutrient
NPK
Nutrient requirement (NR) (kg 100 kg−1)2.010.443.06
Soil nutrient-supply (CS) (%)22.0537.3441.48
Nutrients from fertilizers only (CF) (%)38.0849.93252.98
Nutrientsupply by fertilizer with FYM (CF*) (%)44.8360.57278.70
Nutrients from FYM only (CFYM) (%)23.2528.3416.80
Table 6. Fertilizer-prescription equations as per the STCR for the target-yield of DSR.
Nutrient Requirement (kg ha−1)Without FYMWith FYM
Nitrogen (FN)5.28 T—0.579 SN4.48 T—0.492 SN—0.519 FYM-N
Phosphorus (FP2O5)2.02 T—1.71 SP1.66 T—1.41 SP—1.07 FYM-P
Potassium (FK2O)1.45 T—0.200 SK1.32 T—0.179 SK—0.072 FYM-K
T is yield target in q ha−1; 1 quintal (q) = 100 kg; SN, SP, SK are alkaline KMnO4-N, Olsen’s-P and NH4OAc-K in kg ha−1, respectively; FYM-N, FYM-P, and FYM-K are the amounts of N, P, and K in kg ha−1 applied through FYM, respectively.
Table 7. Yield and harvest index of direct-seeded rice under different nutrition.
TreatmentsGrain Yield (kg ha−1)Straw Yield (kg ha−1)Harvest Index (%)
CK2386 e3977 c37.55 b
GRD3750 cd5644 ab39.93 ab
GRDFYM4053 bc5871 ab40.84 ab
STB4205 bc5341 b44.05 a
STBFYM4432 ab6250 a41.45 ab
STCRTY14508 ab5682 ab44.30 a
STCR TY1FYM4545 ab5795 ab44.05 a
STCR TY24924 a6174 ab44.03 a
STCR TY2FYM4962 a6402 a43.91 a
FP3182 d5303 b37.51 b
Significance level***
* Significance at 5% level; values followed by the same letter are not different at a 5% probability level.
Table 8. NPK uptake by DSR under different nutrition.
TreatmentsNitrogen Uptake (kg ha−1)Phosphorus Uptake (kg ha−1)Potassium Uptake (kg ha−1)
GrainStrawTotalGrainStrawTotalGrainStrawTotal
CK26.73 g10.23 e36.96 f4.86 f3.82 g8.67 g7.83 g49.72 e57.55 f
GRD50.75 ef18.38 d69.13 e8.47 e6.55 ef15.02 f16.50 f77.69 cd94.19 de
GRDFYM58.65 cde26.04 bc84.69 d10.81 d7.79 cdef18.60 e19.26 ef82.39 cd101.65 cd
STB57.86 de26.17 bc84.03 d11.53 cd7.40 def18.93 de21.36 de75.15 cd96.51 de
STBFYM67.27 bcd39.14 a106.41 bc12.31 cd9.56 abc21.87 cd22.99 cd89.17 bc112.16 c
STCRTY170.48 bc30.63 b101.10 c12.90 cd7.96 cde20.85 cde25.04 cd82.87 cd107.91 cd
STCR TY1FYM75.30 ab39.22 a114.52 ab13.40 bc8.95 bcd22.35 c26.40 bc88.24 bc114.64 bc
STCR TY279.65 ab37.47 a117.12 ab15.45 b9.97 ab25.42 b29.93 ab98.59 ab128.52 ab
STCR TY2FYM83.50 a43.35 a126.85 a18.44 a11.18 a29.62 a31.55 a106.76 a138.30 a
FP40.83 f20.97 cd61.81 e6.71 e5.95 f12.66 f14.97 f70.19 d85.16 e
Significance level*********
* Significance at 5% level; values followed by the same letter are not different at 5% probability level.
Table 9. Fertilizer-economics in DSR under different treatments.
TreatmentsAdditional Yield
(kg ha−1)
Value of Additional Yield (INR)Fertilizer and FYM Cost
(INR)
Net Return
(INR ha−1)
B:C RatioEconomic Efficiency (INR ha−1 day−1)
CK0-
GRD1364 cd23,864 cd457619,287 de4.21 bcd142 cd
GRDFYM1667 bc29,167 bc707622,090 cd3.12 d162 bcd
STB1818 bc31,818 bc550426,314 bcd4.78 abcd193 bc
STBFYM2045 abc35,795 abc800427,791 abcd3.47 cd204 bc
STCRTY12121 ab37,121 ab483632,286 abc6.68 a237 ab
STCR TY1FYM2159 ab37,784 ab608931,696 abc5.21 abc233 abc
STCR TY22538 a44,413 a567538,738 a6.83 a285 a
STCR TY2FYM2576 a45,076 a678238,293 ab5.65 ab282 a
FP795 d13,920 d348910,431 e2.99 d77 d
Significance level**-***
* Significance at 5% level; N: 11.6, P2O5: 38.89, and K2O:21.27 INR kg−1, FYM: 0.5 INR kg−1, rice grain: 17.50 INR kg−1. values followed by the same letter are not different at a 5% probability level.
Table 10. Nutrient use efficiency in DSR, as influenced by different treatments.
TreatmentsNUEPUEKUE
AEREPFPRIUEAEREPFPRIUEAEREPFPRIUE
CK---11.20 h---2.03 h---3.28 h
GRD11.4 bc26.8 cde31.3 bc13.53 f22.7 de10.6 e62.5 de2.26 g34.1 bc91.6 d93.8 de4.40 g
GRDFYM11.8 bc33.8 c28.7 c14.47 e25.5 cde15.2 d61.9 e2.67 f27.9 c73.9 d67.9 g4.75 fg
STB9.1 cd23.5 de21.0 de13.77 f30.3 cd17.1 d70.1 cde2.74 ef45.5 ab97.4 cd105.1 cd5.08 ef
STBFYM9.2 cd31.4 cd20.0 e15.17 d31.2 cd20.2 cd67.7 de2.78 de34.3 bc91.5 d74.2 fg5.18 de
STCRTY114.8 ab44.9 b31.5 bc15.63 cd34.2 bc19.6 c72.7 cd2.86 d58.9 a139.9 ab125.2 b5.55 cd
STCR TY1FYM17.1 a61.5 a36.0 a16.57 ab43.6 ab27.6 b91.9 a2.95 c42.6 bc112.6 bcd89.6 def5.82 bc
STCR TY215.0 ab47.4 b29.1 c16.10 bc35.2 abc23.3 bc68.4 de3.13 b59.0 a165.1 a114.5 bc6.12 ab
STCR TY2FYM17.4 a60.7 a33.5 ab16.80 a44.8 a36.5 a86.3 ab3.71 a45.4 ab142.4 ab87.5 ef6.37 a
FP6.1 d19.1 e24.5 d12.83 g19.9 e10.0 e79.5 bc2.11 h39.8 bc138.0 abc159.1 a4.70 g
Significance level************
* Significance at 5% level; Values followed by the same letter are not different at 5% probability level.
Publisher’s Note: MDPI stays neutral with regard to jurisdictional claims in published maps and institutional affiliations.

