1. Introduction
In recent years, many European and North American countries have reported severe losses in honeybee populations [
1]; other pollinator populations also appear to be on the decline [
2]. The loss of honey production due to the decline in the health of honeybee colonies [
3] may be more significant in temperate areas where professional beekeeping is fundamentally dedicated to honey production, the main product of the beekeeping industry. In Europe, where the number of beehives is continuously increasing, with more than 16 million hives [
4], Spain is the country with the largest number of honey bee colonies (around 3 million) [
5,
6]. Therefore, the decrease in honey production in Spain is a major concern for professional beekeepers [
7]. Currently,
Nosema ceranae and
Varroa destructor are major pathogens causing health problems in honeybee colonies in Europe. In particular, the worldwide emergence of the problems created by
Varroa destructor has required the use of different mitigating compounds such as acaricides, whose effectiveness is becoming increasingly less due in large part to resistance phenomena [
8] and different alternatives for their use. Both are highly conditioned by the method of application and the climatic conditions and the health status of the hive [
9]. This situation leads to higher doses than those frequently applied, which implies a strong likelihood of residues appearing in the different hive products, mainly pollen and beeswax. This issue has been investigated in many studies, with pesticide residues being found in beeswax in several cases [
10,
11,
12]. For example, in the study carried out in the US [
10], it was reported that more than 60% of the 259 wax and 350 pollen samples contained at least one systemic pesticide, and over 47% had the acaricides fluvalinate and coumaphos.
The situation is quite similar in Europe, as unwanted compounds were confirmed in several studies from different countries. Indeed, the European Commission has since 2018 encouraged investigation into the decline of pollinators, including the causes and consequences [
5,
13,
14,
15,
16,
17,
18,
19,
20,
21,
22,
23], with the aim of preventing it. However, it should be mentioned that pesticide residues in bee products, especially beeswax, were documented in several publications [
24,
25,
26,
27,
28,
29], in which amitraz, coumaphos, chlorfenvinphos, and tau-fluvalinate were detected in many of the analyzed samples. This confirms the significance of acaricide residues as the group of pesticides that are most frequently found in this matrix, including virgin beeswax. These compounds can also resist the wax cleaning and melting temperature; therefore, they can accumulate for a long time. Considering that combs were submitted for wax extraction and the compounds are not eliminated in this procedure, their concentration would increase after recycling the wax in the form of foundations. In fact, it was reported that coumaphos persisted in beeswax for five years [
30]. It is, therefore, essential to have some knowledge of the possible residues of miticidal treatments in the wax sheets to be introduced into the hive as a base for the bees’ production of larvae and storage of honey.
Regarding the determination of pesticides in beeswax, there are no official methods for sample preparation and analysis. There are many methods that can be used, and they are usually selected on the basis of the materials and equipment available in the laboratory. As can be expected, the instruments for performing this task have evolved remarkably in the last few years. The current trend is the use of hybrid techniques combining chromatography with mass spectrometry in its different modalities [
31]. Different solvents have been employed to extract pesticides from beeswax, such as hexane [
10,
22,
24,
25,
26,
32,
33], acetone [
34], or mixtures of acetone with hexane [
35] or water [
36], although in several studies, a water and acetonitrile mixture was selected [
10,
20,
27,
37,
38,
39]. To minimize potential matrix interferences, various clean-up procedures have been proposed, including solid-phase extraction with C
18 and/or florisil-based cartridges [
10,
25,
26,
32,
34], filtration [
40], gel permeation chromatography [
41], or matrix solid dispersion combined with clean-up on C
18 or florisil [
42]. However, the current trend in sample preparation techniques focuses on simplifying these procedures to reduce the number/amount of reagents and time spent on this step. Thus, in recent years, the sample preparation is known to be quick, easy, cheap, effective, rugged, and safe (QuEChERS) has generally been used as sample treatment for determining pesticides in beeswax [
10,
20,
27,
38,
43,
44,
45]. Different modifications of the QuEChERS methodology have been investigated in these studies, such as using a freezing-out step or a dispersive SPE (dSPE) as a final clean-up.
Our aim was to increase knowledge concerning the presence of the most frequently detected pesticides in beeswax by determining their content in laminated beeswax sheets (natural, purified and decontaminated), usually used by Spanish beekeepers for three years. Field trials in different apiaries were conducted in order to confirm their transfer to the wax comb. To this end, we developed and validated an analytical method that allowed the determination of pesticides in beeswax with good recoveries and decreasing as far as possible the potential matrix effect on MS detection.
2. Materials and Methods
2.1. Chemical and Materials
Analytical-grade standard of pesticides (atrazine, Det. Purity 99.5%; chlorpyrifos, Der. Purity 99.6%; chlorfenvinphos, Der. Purity 98.9%; alpha-endosulfan, Der. Purity 99.0%; bromopropylate, Der. Purity 99.6%; coumaphos, Der. Purity 99.5%; tau-fluvalinate, Der. Purity 99.6%; chlorfenvinphos-d10, Der. Purity 99.1%) were purchased from Dr. Ehrenstorfer (Augsburg, Germany). Isotope-labeled standard (chlorfenvinphos-d10) was chosen as the internal standard (IS) since they have the same physical and chemical properties as the unlabeled analytes. Solvents of Pestinorm grade (acetonitrile, ACN; ethyl acetate, ciclohexane) were obtained from VWR Prolabo Chemicals (Fontenay-sous-Bois, France). Solid reagents and acetic acid were obtained of analytical grade from Sigma-Aldrich (Saint Louis, MO, USA), while QhEChERS reagents were purchased from HPC standards GmbH (Cunnersdorf, Germany). QuEChERS dSPE enhanced matrix removal lipid (EMR-Lipid) and Polish (sodium chloride/magnesium sulfate) tubes were supplied by Agilent Technologies (Folsom, CA, USA). A vibromatic mechanical shaker, a thermostated ultrasound bath and a drying oven, supplied by J.P. Selecta S.A. (Barcelona, Spain), a vortex mechanical mixer from Heidolph (Schwabach, Germany), a 5810 R refrigerated bench-top centrifuge from Eppendorf (Hamburg, Germany), a R-3 rotary evaporator from Buchi (Flawil, Switzerland), a M-20 grinder and an Ultra-Turrax® homogenizer T18, both from IKA (Staufen, Germany) were employed for sample treatment. Nylon syringe filters (17 mm, 0.45 μm) were from Nalgene (Rochester, NY, USA), and ultrapure water was obtained using Milipore Milli-RO plus and Milli-Q systems (Bedford, MA, USA).
2.2. Standards
Standard (matrix-free) stock solutions of each pesticide were prepared by dissolving different amounts of each accurately weighed compound (10 mg) in 10 mL of an ethyl acetate and ciclohexane (20:80,
v/
v) mixture (~1000 mg/L). These solutions were further diluted with the ethyl acetate and ciclohexane (20:80,
v/
v) mixture to prepare the intermediate and calibration matrix-free standards. Wax samples (2.0 g) were spiked before (BF samples) or after (AF samples) sample treatment, with different amounts of studied acaracides and with the IS (0.5 µg/kg) to prepare the matrix-matched standards for validation (QC samples calibration curves), matrix effect and sample treatment studies. Purified white wax was used to prepare the standards, and it was necessary to heat the beeswax at 70 °C when spiking with the neonicotinoids to obtain homogenous BF samples. Each QC sample was prepared with 2.0 g of wax spiked with three different concentrations of pesticides within the linear range. These were as follows: low QC, the limit of quantification (LOQ; see
Table 1); medium QC, 500 µg/kg; high QC, 5000 µg/kg. The stock solution was stored in glass containers in darkness at −20 °C; working and matrix-matched solutions were stored in glass containers and kept in the dark at +4 °C. All the solutions were stable for over two weeks (data not shown).
2.3. Sample Procurement and Treatment
2.3.1. Samples
Laminated beeswax sheets that were used by Spanish beekeepers between 2018 and 2020 were obtained from commercial suppliers from Spain, Portugal, France and Germany; there were certain differences in quality, including decontaminated ones. In addition, laminated sheets from old, recycled combs were provided by some beekeepers. It should be noted that the appearance and names of the samples were somewhat varied. Thus, those marketed as decontaminated were usually quite white, while those marketed as purified, pure, commercial, raw, etc., ranged from light to dark yellow. Obviously, the darker they were, the greater the number of residues observed (see
Section 3.3.1). Moreover, the decontamination procedure was not specified as not all the manufacturers/suppliers provided this information; in some cases, however, the liquid wax was filtrated [
46,
47]. Bleached beeswax pellets (Fluka Chemie, Steinheim, Switzerland) were employed as blanks in the assays. These underwent preliminary analysis by gas chromatography coupled to a mass spectrometry detector (GC-MS) to check for the presence of pesticides. Once it was confirmed that there was no residual trace of the compounds under study, sub-samples were used as blanks to prepare matrix-matched standards. Subsequently, the pieces of comb from the same apiary were combined and melted, then cleaned by soaking in heated distilled water (70 °C; three times) so as to remove the residual honey. All the samples were kept at −20 °C until analysis.
2.3.2. Sample Preparation
All the samples were previously crushed with dry ice in a mortar and thoroughly homogenized for analysis. Next, 2.0 g of wax was weighed in a 50 mL centrifuge tube, and 10 mL of 1% acetic acid in an acetonitrile mixture was added. The tube was then shaken for 3 min in a vortex device and homogenized for 2.5 min in an Ultra-Turrax®. The extract was then centrifuged (7500 rpm, 5 °C) for 5 min, after which 5 mL of supernatant was transferred to a QhEChERS dSPE EMR cartridge previously activated with 5 mL of ultrapure water. The mixture was shaken for 1 min a vortex device and centrifuged again (7500 rpm, 5 °C, 5 min). The supernatant (5 mL) was then transferred to the polish tube (sodium chloride/magnesium sulfate), shaken for 1 min a vortex device and centrifuged in the same previously mentioned conditions. Two milliliters of the supernatant were evaporated to dryness in a rotary evaporator (60 °C). The dry extract was reconstituted with 1 mL of ethyl acetate ciclohexane (20:80, v/v) mixture in an ultrasound bath; the resulting solution was passed through a nylon filter. Following this, a 1-µL aliquot was injected into the GC-MS system
2.4. GC-MS Conditions
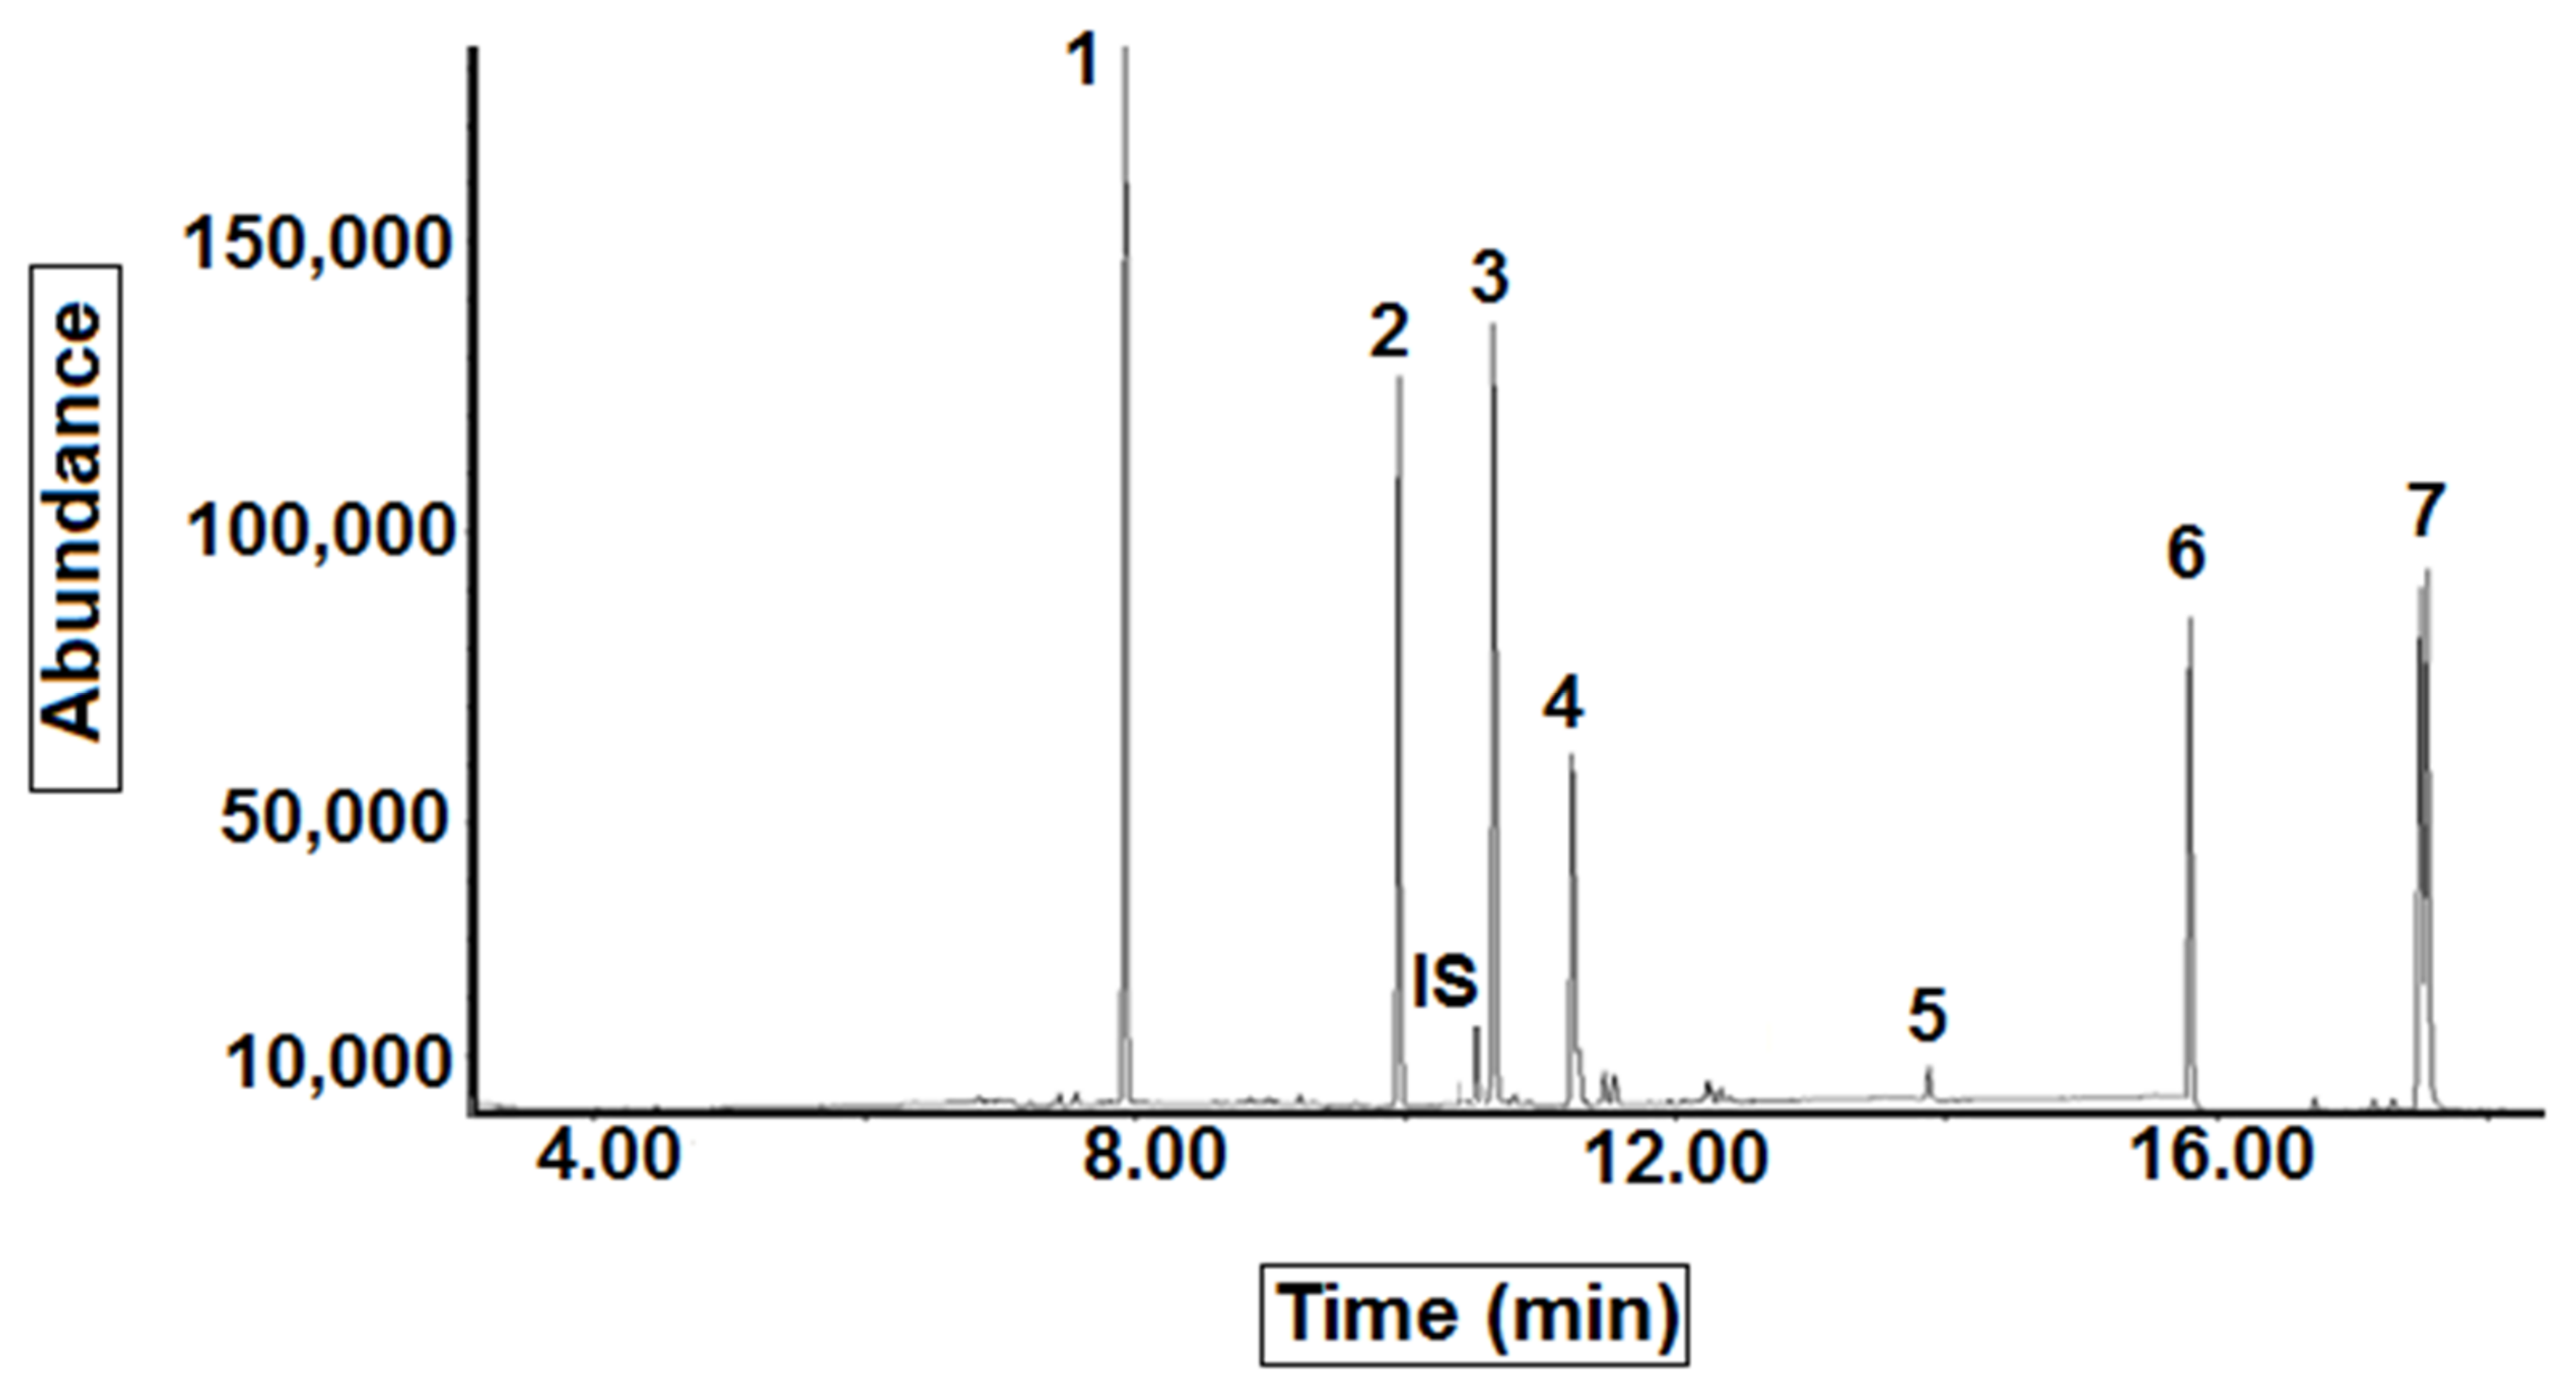
An Agilent Technologies (Palo Alto, CA, USA) 7890A gas chromatograph (GC) coupled to an Agilent Technologies 5975C mass spectrometer (MS), equipped with an ALS 7693B autosampler and an MS ChemStation E 01.00.237 software (Agilent Technologies), was employed. The chromatographic column was an Agilent DB-5MS (30 m × 0.25 mm × 0.2 μm). The GC was operated under programmed temperature conditions, from 60 °C (1 min) to 170 °C (5 min), at 40 °C/min and then increased to 195 °C (10 min) at 9 °C/min. Finally, the temperature was increased to 310 °C (3 min) at 10 °C/min. An injection volume of 1 μL was employed with the autosampler in pulsed splitless mode, the injector temperature set at 280 °C, and helium (Carburos Metálicos, Barcelona, Spain) used as the carrier gas at a flow-rate of 1.2 mL/min. The MS scan parameters included a mass range of 50–400
m/
z, operating in electron impact mode with an ionization energy of 70 eV. The ion source and quadrupole temperatures were 230 °C and 150 °C, respectively. Analyses were performed in selected ion monitoring (SIM) mode, with one target/quantification and two qualifier ions for each of the analytes (see
Table 2 and
Figure 1). The latter were identified and confirmed by comparison of their retention times and mass spectra with a Mass Spectra Library, Wiley 7N edition (Agilent Part No. G1035B) and reference compounds.
2.5. Method Validation
The validation study was performed based on the current European legislation (SANTE guidelines; [
48]). The criteria include selectivity, limits of detection (LODs) and quantification (LOQs), matrix effect, linearity, precision and trueness. Basic but efficient chemometric statistical tools from Excel (Microsoft Office 2010, Microsoft Corporation, Redmond, WA, USA), were employed to analyze the data to validate the method.
To determine the selectivity of the proposed method, a set of extracts from non-spiked samples (
n = 6) together with spiked samples were injected onto the chromatographic system. The LODs and LOQs were experimentally determined by the injection of a number of blank samples (
n = 6), and they were estimated to be, respectively, three and ten times the signal-to-noise (S/N) ratio. In order to ascertain how the matrix influenced MS signal, a comparison was made of the results (analyte peak area/IS peak area) with standard working solutions and blank beeswax samples spiked at three different concentrations (QC levels) following sample treatment (AF samples). The reference standard in the solvent (matrix-free) calibration curves were used to quantify atrazine, chlorpyrifos, chlorfenvinphos, alpha-endosulfan, and bromopropylate, due to the absence of a significant matrix effect. Meanwhile, coumaphos and tau-fluvalinate were quantified with matrix-matched calibration curves as the matrix provoked a significant signal enhancement (see
Section 3.2). Calibration curves (
n = 6) were constructed by plotting the signal on the y-axis (analyte peak area/IS peak area) against the analyte concentration on the x-axis. Standards were prepared as described in
Section 2.2. Precision experiments were performed concurrently by repeated sample analysis using BF samples on the same day (
n = 6; intra-day precision), or over three consecutive days (
n = 6; inter-day precision). Trueness was evaluated by the mean recoveries (as a measure of trueness), calculated by comparing the responses (analyte peak areas/IS peak area) obtained from BF and AF samples.
4. Conclusions
The great diversity of foundation sheets used by beekeepers was evident, and as a result, appreciable amounts of pesticide residues were generally present in the hive. The decontaminated foundation sheets that are currently commercially available displayed a small number of residues and in very low concentrations. Therefore, it is suggested that this material should be used whenever possible. Several commercial foundation sheets and those prepared by the beekeepers revealed large amounts of coumaphos. Almost all of the samples analyzed contained tau-fluvalinate residues; in addition, chlorfenvinphos was commonly detected. It was also observed that when any sheet was placed in the hive, there was a clear transfer to the cell building wax, which undoubtedly poses a risk for the hive’s survival.
For this reason, beekeepers should check for the presence of residues on the sheets they usually insert into their hives. It is recommended, therefore, that they ensure the quality of the sheets and that they do not rely on certain procedures that are commonly used for cleaning waxes. Finally, and regarding the analytical methodology, we have proven that homogenization with Ultra-Turrax® was instrumental in obtaining high rates of recovery with good precision. The use of new sorbents for lipid removal was also seen to be very efficient, contributing to a reduction in sample treatment time.


 and
and 
