Article

Physicochemical Characterization and Functional Potential of Phaseolus vulgaris L. and Phaseolus coccineus L. Landrace Green Beans

by
Elia Nora Aquino-Bolaños
1,
Alma Karina Garzón-García
1,
Jimena Esther Alba-Jiménez
2,*,
José Luis Chávez-Servia
3,
Araceli Minerva Vera-Guzmán
3,
José Cruz Carrillo-Rodríguez
4 and
Manuel Alberto Santos-Basurto
5
1
Centro de Investigación y Desarrollo en Alimentos, Universidad Veracruzana, Xalapa 91190, Mexico
2
Centro de Investigación y Desarrollo en Alimentos, CONACyT-Universidad Veracruzana, Xalapa 91190, Mexico
3
Instituto Politécnico Nacional, CIIDIR-Oaxaca, Oaxaca 71230, Mexico
4
Instituto Tecnológico del Valle de Oaxaca, Oaxaca 71230, Mexico
5
Campus Queretaro, Arkansas State University, Querétaro 76270, Mexico
*
Author to whom correspondence should be addressed.
Agronomy 2021, 11(4), 803; https://doi.org/10.3390/agronomy11040803
Submission received: 25 February 2021 / Revised: 14 April 2021 / Accepted: 14 April 2021 / Published: 19 April 2021
(This article belongs to the Special Issue Phytochemicals of Edible Plants in Human Health)

Abstract

:
The green bean is an important crop worldwide, because it is rich in protein, dietary fiber, vitamins, and minerals, as well as bioactive compounds that provide it with important functional properties; however, the composition of many landraces is still unknown. The purpose of this project was to characterize Phaselus vulgaris and coccineus L. landrace green beans on pH, titratable acidity, total soluble solids, total sugars, color parameters, total phenols, monomeric anthocyanins, and in vitro antioxidant activity (DPPH and FRAP). Regarding the content of total sugars, differences were registered between both species, as opposed to results observed in total soluble solids. Color parameters showed higher reddish tones for P. vulgaris landraces, though P. coccineus had a higher total phenolic content, especially the reddish landraces, which correlated directly to a higher antioxidant activity by DPPH and FRAP. In the protein content, the species P. vulgaris registered the highest content. These results could contribute to a greater use and even promote the genetic improvement of the outstanding pods that serve as one of the main food products in rural regions for higher benefits.

1. Introduction

Legumes are among the most important crops in the world, since they represent one of the main sources of food in developing countries, in addition to being rich sources of vegetable protein and can be used to supplement the deficiency of different cereals, due to their content of essential amino acids, fiber, vitamins, and minerals such as iron, potassium, magnesium, and zinc, among others [1].
Among the cataloged legumes by the FAO is the genus Phaseolus, which includes up to 117 species, considering the Mesoamerican region as the main center of both origin and diversity [2]. Many of them, such as P. vulgaris and P. coccineus L., seem to have been initially domesticated in western Mexico and are among the five most cultivated and consumed species in Mexico by the number of commercial varieties and landraces [3], in addition to being two of the three most relevant species worldwide [4].
In addition to the seed, which would be the bean, the pod, known in Mexico as green beans, is also consumed. Prior to the senescence and dehiscence of the pods, they grow and reach their commercial maturity, in which they can develop shades from yellow and green to reddish and purple, depending on the variety to which they belong [5]. Regarding its nutritional composition, it has a high-water content, which contributes to its characteristic turgor, in addition to minerals and vitamin A. To a lesser extent, it provides protein and fiber [6]. Green bean is classified as a vegetable and is part of the daily diet in many countries, even being considered one of the main sources of phenolic acids (hydroxybenzoic and hydroxycinnamic acids), flavonoids (flavonols, flavones, dihydroflavonols, flavanones, isoflavones, and isoflavanones), lignans, and other polar compounds (Kutkoside) with potential health benefits such as slowing the development of cancerous tumors and providing antibacterial, antiviral, antispasmodic, and anti-inflammatory properties [7,8,9].
It has been shown that the anticancer activity of green beans is mainly related to the presence of high amounts of chlorophyll, resistant starch, soluble and insoluble dietary fiber, and phenolic compound, which suggests that its regular consumption may reduce the risk of breast, colon, and prostate cancer. Likewise, it has been reported that due to its high fiber content, it could help control diabetes by reducing insulin generation and glucose levels that enter the bloodstream; besides, patients suffering from non-insulin dependent diabetes can prevent the need for insulin by up to 40% by eating green beans in their regular diet [10,11,12,13].
In addition to the nutritional aspect, endemic varieties represent a potential source of income for households in rural communities, since small farmers in Latin America and the Caribbean, Asia, and Africa contribute up to 77% of the world production of P. vulgaris [2]. However, a current trend has been observed in which endemic crops are being replaced by commercial outdoor varieties that tend to present a higher demand, harvest yield, and, therefore, commercial value. This leads to a gene pool loss since the landraces are limited to be cultivated in small plots or farmers backyards for self-consumption of the edible parts (flowers, leaves, fruits, and grains) as well as maintaining the germplasm for the next planting [14]. In addition to the biodiversity loss, there is a dependence on external resources that can compromise the economic and food security of these regions.
Part of the reason for the displacement of local varieties may be due to ignorance of their properties, so their study contributes to a better understanding and, in turn, to promoting their consumption. For this reason, the present work focuses on the physicochemical characterization and functional potential, measured through the phenolic compounds quantification and in vitro antioxidant activity, of various P. vulgaris and P. coccineus native varieties from rural regions of Oaxaca, Mexico, in order to know its nutritional and functional composition. This would contribute to promote both cultivation and consumption, with direct benefits in the food and economic security of rural populations, in addition to avoid the loss of unexplored germplasm with potential health benefits and maintaining the local gene pool.

2. Materials and Methods
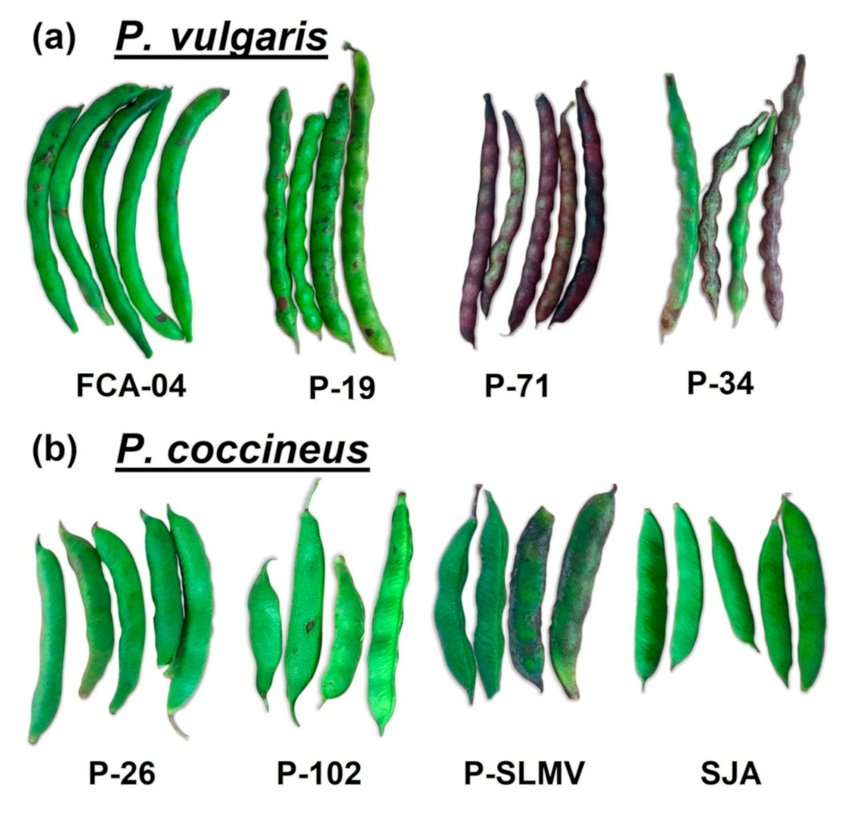
2.1. Plant Material

A total of 18 bean landraces were evaluated; nine from Phaseolus vulgaris L. (common bean) and nine from Phaseolus coccineus (scarlet runner bean), which were collected in different regions of the state of Oaxaca, Mexico where each seed lots correspond to a farmers variety. This means that each farmer preserves one or more native varieties because Oaxaca is part of the Mesoamerican region where P. vulgaris and P. coccineus have their origin center. Seed lots of each landrace were sown and cultivated in an open field plot in the Training Unit for Rural Development (UNCADER2) located in Coatepec, Veracruz, carrying out a basic fertilization (60:60:60 N:P:K). Green bean was harvested at stage 4 of maturity, when the color change was already observed in the dorsal suture and pedicel (Figure 1), since it has been reported that at this stage of development there is a higher phenolic compounds content and in vitro antioxidant activity [15]. The whole fruits in fresh state were used to perform analysis of the physicochemical parameters and compounds with in vitro antioxidant activity.

2.2. Physicochemical Parameters

pH was measured according to the AOAC (Association of Official Analytical Chemists) [16] using a digital potentiometer (OAKTON, 510, Vernon Hills, IL, USA) and the titratable acidity (TA) was determined using the AOAC methodology [17] by acid-base titration, with some modifications. Using NaOH 0.1 N as a titrant agent and phenolphthalein as an endpoint indicator (pH 8.2), results were expressed as grams of citric acid per 100 g of dry weight (dw). Total sugar content (TSC) was determined by the phenol-sulfuric method [18]. Total soluble solids (TSS) were measured in a digital refractometer and expressed in °Brix (ATAGO, PR-32, Tokyo, Japan). Color parameters were determined by the CIEL* a* b* system with a spectrophotometer for solids (Konica Minolta, CM-2600d, Osaka, Japan) and the values of L*, a*, b*, chroma C* = (ɑ*2 + b*2) 1/2 and hue angle h° = tan − 1 (b*/ɑ*) indexes were calculated according to McGuire [19]. Protein content was obtained of the homogeneous sample from each bean sample to measure the protein content according to the method described by Bradford [20]. The quantification was based on a standard curve obtained using samples of bovine albumin (Sigma-Aldrich, Saint Louis, MO, USA) at concentrations ranging from 0.006 to 0.018 mg mL−1.

2.3. Ethanolic Extracts Preparation

An ethanolic extract was obtained with a 5 g sample and 20 mL of ethanol 80% (v/v), which was homogenized for 30 s at 1 g × s (DAIHAN-brand HG-15-A, Gangneung, Korea). Subsequently, it was centrifuged at 35,000 g × s for 20 min at 10 °C (Hettich zentrifuge, Universal 32R, Tuttlingen, Germany) and the supernatant was brought to a volume of 25 mL with ethanol 80% (v/v).

2.4. Total Polyphenols

They were determined by the method described by Singleton and Rossi [21], and the reaction absorbance was measured at 750 nm in a UV-visible spectrophotometer (Jenway 6305, Bibby Scientific Ltd., Dunmow, Essex, UK). The quantification was performed based on a standard curve of gallic acid (0.021 to 0.165 mg mL−1), and the results were expressed in mg equivalents of gallic acid per gram of dry weight (mg GAE g −1 dw).

2.5. Monomeric Anthocyanins

Anthocyanin content was determined by the differential pH method [22]. Two dilutions of the extract were made, one with potassium chloride buffer at pH 1.0 and the second with sodium acetate buffer at pH 4.5, diluting each by the previously determined dilution factor. Subsequently, a spectrophotometer was used to generate an absorption spectrum in the range of 460–710 nm to determine the maximum absorbance. The concentration of monomeric anthocyanins (MA) was calculated according to the following equation: MA = (A*PM*FD*1000)/(ε*I), where the absorbance of sample A corresponds to (Aλ510–Aλ700) pH 1.0 − (Aλ510–Aλ700) pH 4.5; MW = 449.2 is the molecular weight of cyanidin-3-glucoside; ε = 26,900 g/mol is the molar absorptivity of the cyanidin-3-glucoside; FD is the dilution factor used; and I is the cell length (1 cm). The results were expressed as mg of cyanidin-3-glucoside per gram of dry weight (mg C3G g−1 dw).

2.6. Antioxidant Assay Procedures

Antioxidant activity was evaluated by the 2,2-diphenyl-1-picrylhydrazyl (DPPH) method [23]. A 100 μL sample of the extract was reacted with 2.9 mL of DPPH reagent and allowed to stand for 30 min at room temperature. The absorbance was measured using a UV-vis spectrophotometer (Shimadzu UV-1800, Kyoto, Japan) at 517 nm using 80% (v/v) methanol as the target. To quantify the in vitro antioxidant activity, it was performed based on the inhibition percentage of a standard 6-hydroxy-2,5,7,8-tetramethylchroman-2-carboxylic acid (Trolox) curve in a concentration range of 0.13–0.79 μmol equivalents of Trolox (TE) per mL. The results were expressed in micromoles of Trolox equivalents per gram of dry weight (μmol TE g−1 dw). The reducing power of the samples was also evaluated through the FRAP method [24]. The FRAP reagent was prepared by acetate buffer mixture (0.3 M pH 3.6), with a 10 mM TPTZ solution (2, 4, 6-tripyridyl-s-triazine) in 40 mM HCl and a solution of 20 mM FeCl3-6H2O, in a ratio 10:1:1. A 100 μL sample of the extract was reacted with 3 mL of FRAP and incubated at 37 °C during 30 min. The absorbance was measured using a UV-vis spectrophotometer (JENWAY 6305, Sttafordshire, UK) at 593 nm. The in vitro antioxidant activity quantification was performed using a standard 6-hydroxy-2,5,7,8-tetramethylchroman-2-carboxylic acid (Trolox) curve in a concentration range of 0.1 to 1 µmol equivalents of Trolox (TE) per mL. The results were expressed in micromoles of Trolox equivalents per gram of dry weight (μmol TE g−1 dw).

2.7. Statistical Analysis

All samples were analyzed by quadruplicate in each determination, reporting the averages for the samples harvested at two different seasons on the same maturity stage. A database with all results was integrated, and an analysis of variance was performed using a completely random design with the nesting of landraces within species. Comparisons among species and landraces were made by the Tukey method (p ≤ 0.05). Pearson analysis was used to determine the correlation between bioactive compounds, in vitro antioxidant activity, and physicochemical parameters. All statistical analyses were performed using SAS software version 9.0 [25], and the values are reported as the mean of replicates ± standard deviation.

3. Results

In the variance analysis, significant differences were recorded in the genotype/species interaction in the physicochemical parameters, protein, and bioactive components, such as total phenolic compounds (TPC), total anthocyanin content (TAC), and in vitro antioxidant activity by the DPPH and FRAP method, evaluated with a coefficient of variation less than 26.5% (p < 0.01; Table 1). With the exception of pH and titratable acidity, considering the mean squares value, it was estimated that the variance due to the species was greater than in the genotype/species interaction (Table 1). This indicates that, in general, the variation between species is greater than between landraces within each species and reflects part of the evolutionary differences between P. vulgaris and P. Coccineus [26,27]. In addition, statistical differences (p < 0.05; p < 0.01) were observed in the pH parameters, total sugars, L*, protein and in vitro antioxidant activity evaluated by DPPH and FRAP between repetitions of the genotypes sown in the experimental plot (Table 1). This could be attributed to the heterogeneity between same genotype individuals, due to factors such as agronomic practices, sampling randomness, and typical variation of the physical characteristics (color, size, shape) between grains of each accession.

3.1. Physicochemical Parameters

Regarding total sugars content, the P. coccineus species was 1.3 times higher (76.2 mg Glu g−1 dw) compared to the P. vulgaris species (59.3 mg Glu g−1 dw); on the contrary, P. vulgaris presented the highest content of TSS (Table 2). The interspecific variation for total sugars ranged from 47.9–125.5 mg Glu g−1 dw in P. coccineus green beans, and for P. vulgaris from 36.8–81.8 mg Glu g−1 dw, with this latter species being the one that presented the lowest variability (42%).
Among genotypes within each species, the SJA and P-69 landraces of P. coccineus green beans obtained the highest total sugars content (125.5 and 107.1 mg Glu g−1 dw, respectively), while in the case of P. vulgaris green beans, P-19, P-71, P-68, and P-34 landraces showed the highest concentration, not presenting significant differences between them (Table 2). In the TSS content, the FCA-04 green beans landrace of P. vulgaris obtained the highest value (13.2 °Brix) followed by P-58 (10.4 °Brix) and SLMV (10.8 °Brix) of the P. coccineus species.
In the luminosity parameter, significant differences were observed between species and landraces within each species, with P. coccineus being the one that presented the highest value with respect to P. vulgaris (p < 0.05). Furthermore, between landraces of both species, the P-65 green beans (P. vulgaris) registered a lower average value (57.8) in contrast to SJA (P. coccineus) (59.2) (Table 2). In a* and b* color parameters, between species, P. coccineus green beans showed average values with a tendency to yellow-green, while P. vulgaris observed a tendency to red-purple, with variation between landraces of each species, since CAA green beans of P. coccineus obtained a negative value for a* and positive for b* corresponding to the yellow color, on the other hand, in P. vulgaris, beans of P-40 and P-71 presented positive values for a* and b* corresponding to the red color, without statistical differences between them (p < 0.05). For chromaticity parameter (C *), it was observed that P. coccineus species presented a higher average value (10.9) compared to P. vulgaris (8.5), with the landraces P-69 and FCA-04 being those that presented the highest values, respectively (Table 2). Regarding the hue angle parameter (h°), a wide interval (87.5–100.1°) was observed for P. coccineus green beans, where CAA obtained the highest value with a tendency to green; while, for P. vulgaris green beans, hue angle ranged from 57.9–96.5°, with P-71 (57.9°) being the one that presented a value with a tendency to red and P-65 (69.2°) and P-58 (72.5°) with a tendency to yellow (p < 0.05).
Protein content differs significantly between species and landraces within each species (p < 0.05). The species P. vulgaris showed higher protein content (10.1 g protein 100 g−1 dw) compared to P. coccineus (5.6 g protein 100 g−1 dw) (p < 0.05; Table 2). The protein content variation ranged 7.0–12.2 g protein 100 g−1 dw for beans of the species P. vulgaris, and for P. coccineus 3.0–9.6 g protein 100 g−1 dw, the latter being the one that presented the highest variability with 68.8%. Among genotypes, the landraces P-76, P-71, P-58, P-65, and P-16 of the species P. vulgaris, presented the highest protein contents, with respect to the other landraces and the P. coccineus species landraces, likewise, of the fat beans (p < 0.05; Table 2).

3.2. Total Phenols, Anthocyanins, and In Vitro Antioxidant Activity

Total polyphenols content (TPC), total anthocyanins content (TAC), and antioxidant activity by DPPH and FRAP is shown in Table 3. TPC for P. coccineus species was significantly (p < 0.05) higher than P. vulgaris with a value average of 13.4 mg GAE g−1 dw and 7.2 mg GAE g−1 dw, respectively, observing a high variability between results, with a range of 6.0 to 26.5 mg GAE g−1 dw for P. coccineus and 4.2 to 10.1 mg GAE g−1 dw for P. vulgaris, with the landraces with reddish tones being those that presented higher TPC concentrations, probably due to anthocyanins presence.
Regarding TAC, only green beans of three genotypes presented monomeric anthocyanins detectable values, following an order from higher to lower concentration, purple beans of P-16 (2.9 mg C3G g−1 dw) and red beans of P-40 (1.2 mg C3G g−1 dw) from P. vulgaris species, and green beans from SLMV (0.7 mg C3G g−1 dw) from P. coccineus (Table 3).
The close relationship between TPC and antioxidant activity has been documented in various fruits and vegetables, as observed in this study (Table 4). Most of the evaluated green bean landraces showed a strong correlation (p < 0.05) between the phenolic compounds content and the antioxidant activity determined by the DPPH free radical reduction. The P-69 landrace of the P. coccineus species that exhibited a high concentration of phenolic compounds also presented high antioxidant activity (141.4 µmol TE g−1 dw), as well as its ability to reduce iron (141.0 µmol TE g−1 dw). In contrast, P-71 which showed the lowest phenolic compounds concentration (4.2 mg GAE g−1 dw) also showed the lowest antioxidant activity by DPPH and FRAP method (14.3 µmol TE g−1 dw and 14.2 µmol TE g−1 dw, respectively). However, this relationship was not observed in all landraces, since SLMV presented the highest TPC average (26.5 mg GAE g−1 dw), reporting an activity against DPPH of 58.6% lower compared to P-69, probably due to the variability in the individual polyphenols profile and that each compound can exert a different reducing activity.
A similar effect was observed for the antioxidant activity determined by the FRAP technique. Most of the landraces that presented a high DPPH radical reducing activity also showed an ability to reduce the ferric ion, although some landraces, mainly those of the P. vulgaris genus, showed an activity between 15% (P-16) and 46 % (P-58) lower in the FRAP technique compared to DPPH.

4. Discussion

In general, regarding the physicochemical parameters of pH and titratable acidity, there were no differences between P. vulgaris and P. coccineus. Organic acids concentration determines the physiological and commercial fruits maturity such as green beans [28]. In this sense, the state of maturity chosen for this study shows pH values similar to those reported before [29] with a pH value of 6.2 and 6.4 for the Strike and Bina green bean varieties (P. vulgaris L.), respectively, and 5.8–6.4 for green beans (Phaseolus vulgaris L. var. Helda) in an immature state [30]. In titratable acidity, Garzón-García et al. [15] reported a higher value (1.6 g citric acid 100 g−1 dw) in green beans (Phaseolus vulgaris L.) in the same state of maturity as that used in this study. Regarding the sugars content, and color parameters L*, b*, C*, and h°, the P. coccineus species presented the highest average values. It has been reported that the main sugars in green beans are glucose, fructose, and sucrose [31], which could constitute the total sugar content in this study, presenting a lower average value (32.7 mg Glu g−1 dw) compared to green beans (Phaseolus vulgaris L.) from a native bean common accession from Oaxaca [32].
Regarding the luminosity parameter, an interval of 36.5–50.3 lower than that registered in the two species evaluated in this study has been reported [29] in P. vulgaris L. green beans in an advanced stage of development. Regarding the TSS content, P. vulgaris species was higher than P. coccineus, whose values has been reported before [29] on a range of 9.5–20.1 °Brix, in the Strike and Bina green bean varieties (P. vulgaris L.) in different development stages, similar to those obtained in this study. Green beans (Phaseolus vulgaris L. cv. Paulista) irrigated by drip and furrows presented values of 4.37 and 4.60 °Brix, respectively [33], similar to Phaseolus vulgaris ssp. Volubilis grown in soils rich in organic matter and nitrogen fertilization with values of 4.9 to 5.7 °Brix [34], being much lower than that obtained in the two green beans species analyzed. Thus, the total soluble solids content variation, constituted by organic acids, but also total sugars, can be influenced by agricultural practices, its post-harvest handling, as well as the state of maturity in which it is harvested [35,36].
Regarding protein content, Martínez et al. [37] reported a range of 16.9–17.2 g protein 100 g−1 dw in the Cleo, Strike, and Sentry green bean varieties, while for beans of the species P. vulgaris, P. coccineus, Black Horse, Michigan, and Peruvian, a range of 12.6–21.3 g protein 100 g−1 dw is reported [38]. For their part, Bhagya et al. [39], recorded a protein content in tender pods beans of Canavalia cathartica of 21.7 g protein 100 g−1 dw. In contrast, in pea pod (Pisum sativum L.) and broad bean pod (Vicia faba L.), values of 10.8 and 13.6 g protein 100 g−1 dw were obtained [40], respectively, similar to what was observed in this study in the species P. vulgaris.
Phenolic compounds concentration in the evaluated samples registered a high variability, showing the highest values those P. coccineus species reddish landraces, which coincides with that reported in Oaxaca landrace green beans of the P. vulgaris species [15]. Similar results have been observed before [41,42], where the reddish bean landraces presented higher phenolic compounds concentrations, compared to the green landraces. However, in this study, no correlation was found between the reddish landraces of the P. vulgaris species and the content of phenolic compounds, even though these species showed the highest anthocyanin content. Still, the TPC average results in both species were higher than the values reported [43] where concentrations of 3.6 mg GAE g−1 dw were observed for varieties of green beans marketed in Turkey, as well as those recorded of 1.1–2.0 mg GAE g−1 dw [44,45] for other Phaseolus vulgaris varieties, including Emerit, which showed a TPC of 2251 mg GAE g−1 dw [46]. On the other hand, the evaluation of the phenolic compounds content and antioxidant activity for three varieties of green beans has shown values of 14.6 for the green variety and 40.8 µmol TE g−1 dw for the reddish variety [41], which agrees with values reported in the present study. This great variability observed in the phenolic compounds content, anthocyanins, and antioxidant activity in the species P. coccineus and P. vulgaris green beans could be directly related to the phenolic compounds profile, which can vary widely due to the state of maturity, the accession, species, geographic location, and cultural practices within that region [47]. This not only promotes phenotypic differentiation, but also at the genetic level, in the identified phenolic compounds expression and synthesis (gallic acid, chlorogenic, epicatechin, rutin, and more than 72 polyphenols including 10 phenolic acids, 59 flavonoids, 2 lignans, and 1 iridoid) in different green beans landraces (P. vulgaris L. var Perona, Helda and Strike), as well as in different parts of this crop such as flowers [48], leaves and stems [49], and seeds [50,51]. Furthermore, the aqueous extract of Phaseous vulgaris species green beans has been reported to have anti-obesogenic and hypoglycemic activity [52,53,54,55,56], which could help combat the obesity pandemic currently present in Mexico [57] and the world [58], as well as reduce the factors associated with metabolic syndrome, such as cardiovascular diseases, which are the main cause of mortality in the world [59].

5. Conclusions

Based on the two green beans species evaluated, we can conclude that there are significant differences between P. coccineus and P. vulgaris in the content of TS, TSS, and color, as well as in their content of polyphenols, flavonoids, anthocyanins, and antioxidant activity. P. coccineus was higher in phenolic compounds and antioxidant activity, while P. vulgaris was higher in anthocyanins. There was a high variability between the landraces evaluated, and, specifically, P. vulgaris landraces had more than double the anthocyanins compared to those of P. coccineus. Both species are a source of complementary polyphenols, flavonoids, and anthocyanins, and this suggests that their use can be considered a complementary food to improve the rural community’s nutrition or implement a genetic improvement program towards a higher nutritional quality of the prominent pods where their food base is in conjunction with other native crops such as corn, squash, and chili. However, other studies are necessary to determine their potential in preventing some chronic degenerative diseases.

Author Contributions

J.E.A.-J., E.N.A.-B., J.L.C.-S., J.C.C.-R., and M.A.S.-B. performed the research, data analysis, and wrote the paper; A.K.G.-G., A.M.V.-G., and E.N.A.-B. contributed with laboratory analysis. All authors have read and agreed to the published version of the manuscript.

Funding

This research was funded by Consejo Nacional de Ciencia y Tecnología CONACYT Problemas Nacionales (Project no. 2015-1119) and Instituto Politécnico Nacional (Project 20201270). A.K.G.-G. received a scholarship from the CONACyT (No. 478457) to study a Master’s in Food Sciences.

Acknowledgments

Biological material were sown and cultivated by Dionisio Ruíz-Landa in the Training Unit for Rural Development (UNCADER 2) located in Coatepec, Veracruz, Mexico.

Conflicts of Interest

No potential conflict of interest was reported by the authors.

References

  1. Calles, T. The International Year of Pulses: What are they and why are they important. Agric. Dev. 2016, 26, 40–42. [Google Scholar]
  2. FAO. Legumbres. Pequeñas Semillas, Grandes Soluciones; Organización de las Naciones Unidas para la Alimentación y la Agricultura: Ciudad de Panamá, Panama, 2018; p. 292. [Google Scholar]
  3. Dohle, S.; Teran, J.C.B.M.; Egan, A.; Kisha, T.; Khoury, C.K. Wild Beans (Phaseolus L.) of North America. In North American Crop Wild Relatives, 1st ed.; Greene, S.L., Williams, K.A., Eds.; Springer: Cham, Switzerland, 2019; Volume 2, pp. 99–127. [Google Scholar] [CrossRef] [Green Version]
  4. Spataro, G.; Tiranti, B.; Arcaleni, P.; Bellucci, E.; Attene, G.; Papa, R.; Zeuli, P.S.; Negri, V. Genetic diversity and structure of a worldwide collection of Phaseolus coccineus L. Theor. Appl. Genet. 2011, 122, 1281–1291. [Google Scholar] [CrossRef]
  5. Koutsika-Sotiriou, M.; Traka-Mavrona, E. Snap Bean. In Handbook of Plant Breeding. Vegetables II: Fabaceae, Liliaceae, Solanaceae and Umbelliferae; Prohens, J., Nuez, F., Eds.; Springler: New York, NY, USA, 2008; Volume 2, pp. 27–83. [Google Scholar]
  6. Virgilio-Gonzales, M. Guía Técnica: Cultivo del Ejote. Available online: http://centa.gob.sv/docs/guias/hortalizas/Guia%20ejote%202003.pdf (accessed on 20 November 2020).
  7. Abu-Reidah, I.M.; Arráez-Román, D.; Lozano-Sánchez, J.; Segura-Carretero, A.; Fernández-Gutiérrez, A. Phytochemical Characterisation of Green Beans (Phaseolus vulgaris L.) by Using High-performance Liquid Chromatography Coupled with Time-of-flight Mass Spectrometry. Phytochem. Anal. 2013, 24, 105–116. [Google Scholar] [CrossRef] [PubMed]
  8. Dicko, M.H.; Gruppen, H.; Traore, A.S.; Voragen, A.G.J.; Van Berkel, W.J.H. Phenolic compounds and related enzymes as determinants of sorghum for food use. Biotechnol. Mol. Biol. Rev. 2006, 1, 20–37. [Google Scholar] [CrossRef]
  9. Johnson, I. New approaches to the role of diet in the prevention of cancers of the alimentary tract. Mutat. Res. Mol. Mech. Mutagen. 2004, 551, 9–28. [Google Scholar] [CrossRef]
  10. Osowski, A.; Pietrzak, M.; Wieczorek, Z.; Wieczorek, J. Natural compounds in the human diet and their ability to bind mu-tagens prevents DNA–mutagen intercalation. J. Toxicol. Environ. Health Part A 2010, 73, 1141–1149. [Google Scholar] [CrossRef] [PubMed]
  11. Chaurasia, S. Green beans. In Nutritional Composition and Antioxidant Properties of Fruits and Vegetables, 1st ed.; Jaiswal, A., Ed.; Academic Press: San Diego, CA, USA, 2020; pp. 289–300. [Google Scholar]
  12. Chandalia, M.; Garg, A.; Lutjohann, D.; Von Bergmann, K.; Grundy, S.M.; Brinkley, L.J. Beneficial Effects of High Dietary Fiber Intake in Patients with Type 2 Diabetes Mellitus. N. Engl. J. Med. 2000, 342, 1392–1398. [Google Scholar] [CrossRef]
  13. Yokoyama, Y.; Barnard, N.D.; Levin, S.M.; Watanabe, M. Vegetarian diets and glycemic control in diabetes: A systematic review and meta-analysis. Cardiovasc. Diagn. Ther. 2014, 4, 373–382. [Google Scholar]
  14. Chávez-Servia, J.L.; Carrillo-Rodríguez, J.C.; Guzmán, A.M.V.; Aquino-Bolaños, E.N.; Hernández-Delgado, S.; Perez, N.M.; Lobato-Ortiz, R. Traditional family production and nutritional-nutraceutical value of common beans (Phaseolus vulgaris L.) in Southeast Mexico. In Phaseolus vulgaris: Cultivars, Production and Uses, 1st ed.; Nova Science Publishers, Inc.: New York, NY, USA, 2018; pp. 167–198. [Google Scholar]
  15. Garzón-García, A.K.; Acosta-García, M.; Ruiz-Landa, D.; Carrillo-Rodríguez, J.; Vera-Guzmán, A.M.; Aquino-Bolaños, E.N.; Chávez-Servía, J.L. Determinación de índices de cosecha en ejote morado (Phaseolus vulgaris L.). In Desarrollo Científico en México; Vázquez, G.V., Martínez, A., Solano, C.E., Sanchéz, M.E., Ramírez, E.L., Eds.; Centro de Investigaciones en Óptica: León, Guanajuato, Mexico, 2018; pp. 658–664. [Google Scholar]
  16. Association of Official Analytical Chemists. Official Methods of Analysis, 15th ed.; AOAC Official Method 973.41; AOAC: Washington, DC, USA, 1990. [Google Scholar]
  17. Association of Official Analytical Chemists. Official Methods of Analysis, 15th ed.; AOAC Official Method 942.15; AOAC: Washington, DC, USA, 2005. [Google Scholar]
  18. Dubois, M.; Gilles, K.A.; Hamilton, J.K.; Rebers, P.A.; Smith, F. Colorimetric Method for Determination of Sugars and Related Substances. Anal. Chem. 1956, 28, 350–356. [Google Scholar] [CrossRef]
  19. McGuire, R.G. Reporting of Objective Color Measurements. HortScience 1992, 27, 1254–1255. [Google Scholar] [CrossRef] [Green Version]
  20. Bradford, M.M. A rapid and sensitive method for the quantitation of microgram quantities of protein utilizing the principle of protein-dye binding. Anal. Biochem. 1976, 72, 248–254. [Google Scholar] [CrossRef]
  21. Singleton, V.L.; Rossi, L.A. Colorimetry of total phenolics with phosphomolybdic-phosphotungstic acid reagents. Am. J. Enol. Vit. 1965, 16, 144–158. [Google Scholar]
  22. Giusti, M.; Wrolstad, R.E. Characterization and Measurement of Anthocyanins by UV-Visible Spectroscopy. Curr. Protoc. Food Anal. Chem. 2001, 1, F1.2.1–F1.2.13. [Google Scholar] [CrossRef]
  23. Brand-Williams, W.; Cuvelier, M.; Berset, C. Use of a free radical method to evaluate antioxidant activity. LWT 1995, 28, 25–30. [Google Scholar] [CrossRef]
  24. Benzie, I.F.; Strain, J. Ferric reducing/antioxidant power assay: Direct measure of total antioxidant activity of biological fluids and modified version for simultaneous measurement of total antioxidant power and ascorbic acid concentration. Methods Enzymol. 1999, 299, 15–27. [Google Scholar] [CrossRef]
  25. Statistical Analysis System (SAS). SAS/STAT User’s Guides; Release 9.0; SAS Institute Inc.: Cary, NC, USA, 2002; p. 4424. [Google Scholar]
  26. Bitocchi, E.; Nanni, L.; Bellucci, E.; Rossi, M.; Giardini, A.; Zeuli, P.S.; Logozzo, G.; Stougaard, J.; McClean, P.; Attene, G.; et al. Mesoamerican origin of the common bean (Phaseolus vulgaris L.) is revealed by sequence data. Proc. Natl. Acad. Sci. USA 2012, 109, E788–E796. [Google Scholar] [CrossRef] [Green Version]
  27. Guerra-García, A.; Suárez-Atilano, M.; Mastretta-Yanes, A.; Delgado-Salinas, A.; Piñero, D. Domestication Genomics of the Open-Pollinated Scarlet Runner Bean (Phaseolus coccineus L.). Front. Plant Sci. 2017, 8, 1891. [Google Scholar] [CrossRef] [PubMed] [Green Version]
  28. Guo, L.; Ma, Y.; Sun, D.-W.; Wang, P. Effects of controlled freezing-point storage at 0 °C on quality of green bean as compared with cold and room-temperature storages. J. Food Eng. 2008, 86, 25–29. [Google Scholar] [CrossRef]
  29. Martınez, C.; Ros, G.; Periago, M.; López, G.; Ortuño, J.; Rincón, F. Physico-Chemical and Sensory Quality Criteria of Green Beans (Phaseolus vulgaris, L.). LWT 1995, 28, 515–520. [Google Scholar] [CrossRef]
  30. Barbosa, C.; Alves, M.R.; Rocha, S.; Oliveira, M.B.P. Modified atmosphere packaging of precooked vegetables: Effect on physicochemical properties and sensory quality. Food Chem. 2016, 194, 391–398. [Google Scholar] [CrossRef]
  31. Petropoulos, S.A.; Fernandes, Â.; Plexida, S.; Chrysargyris, A.; Tzortzakis, N.; Barreira, J.; Barros, L.; Ferreira, I.C. Biostimu-lants Application Alleviates Water Stress Effects on Yield and Chemical Composition of Greenhouse Green Bean (Phaseolus vulgaris L.). Agronomy 2020, 10, 181. [Google Scholar] [CrossRef] [Green Version]
  32. Acosta-García, M. Caracterización Físico-Química de Ejote de Frijol Común (Phaseolus vulgaris L.) en Diferentes Estados de Desarrollo. Bachelor’s Thesis, Instituto Tecnológico Superior de Misantla, Misantla, Veracruz, Mexico, 2017. [Google Scholar]
  33. El-hamahmy, M.; Elewa, A.; Baz, A. Biochemical and Anatomical Characters of Snap Bean (Phaseolus vulgaris L.) Pods under Furrow and Drip Irrigation System at Harvest and during Postharvest. J. Plant. Prod. Sci. 2016, 5, 13–22. [Google Scholar]
  34. Segura, M.L.; Contreras, J.I.; García, C.; Bueno, I.M. Fertilización nitrogenada de judía verde bajo invernadero con criterios agroecológicos. In VII Congreso; SEAE: Zaragoza, Spain, 2006. [Google Scholar]
  35. Chander, R.; Setia, N.; Parkash, C. The podwall structure and function in relation to seed: Development in some legumes. Phyton 1987, 7, 206–220. [Google Scholar]
  36. Stolle-Smits, T.; Beekhuizen, J.G.; Kok, M.T.; Pijnenburg, M.; Recourt, K.; Derksen, J.; Voragen, A.G. Changes in Cell Wall Polysaccharides of Green Bean Pods during Development. Plant Physiol. 1999, 121, 363–372. [Google Scholar] [CrossRef] [Green Version]
  37. Martinez, C.; Ros, G.; Periago, M.J.; Ortuño, J.; López, G.; Rincón, F. In vitro protein digestibility and mineral availability of green beans (Phaseolus vulgaris L) as influenced by variety and pod size. J. Sci. Food Agric. 1998, 77, 414–420. [Google Scholar] [CrossRef]
  38. Flores-Sosa, Á.R.; Aquino-Bolaños, E.N.; Cardador-Martínez, A.; Chávez-Servia, J.L.; Vera-Guzmán, A.M.; Carrillo-Rodríguez, J.C.; Jiménez, J.E.A. Variation in protein and amino acids content among landraces of common bean (Phaseolus vulgaris L.). Emir. J. Food Agric. 2020, 32, 750. [Google Scholar] [CrossRef]
  39. Bhagya, B.; Sridhar, K.R.; Seena, S. Biochemical and protein quality evaluation of tender pods of wild legume Canavalia ca-thartica of coastal sand dunes. Livest. Res. Rural. Dev. 2006, 18, 1–20. [Google Scholar]
  40. Mateos-Aparicio, I.; Redondo-Cuenca, A.; Villanueva-Suárez, M.-J.; Zapata-Revilla, M.-A.; Tenorio-Sanz, M.-D. Pea pod, broad bean pod and okara, potential sources of functional compounds. LWT 2010, 43, 1467–1470. [Google Scholar] [CrossRef]
  41. Ci, Z.; Jiang, C.; Tsukamoto, C.; Kojima, M. DPPH Radical Scavenging Activity and Polyphenols in the Pods of 3 Common Beans. J. Food Nutr. Res. 2017, 5, 900–907. [Google Scholar] [CrossRef] [Green Version]
  42. Koley, T.K.; Maurya, A.; Tripathi, A.; Singh, B.K.; Singh, M.; Bhutia, T.L.; Tripathi, P.C.; Singh, B. Antioxidant potential of commonly consumed underutilized leguminous vegetables. Int. J. Veg. Sci. 2018, 25, 362–372. [Google Scholar] [CrossRef]
  43. Turkmen, N.; Sari, F.; Velioglu, Y. The effect of cooking methods on total phenolics and antioxidant activity of selected green vegetables. Food Chem. 2005, 93, 713–718. [Google Scholar] [CrossRef]
  44. Wolosiak, R.; Druzynska, B.; Piecyk, M.; Worobiej, E.; Majewska, E.; Lewicki, P.P. Influence of industrial sterilisation, freezing and steam cooking on antioxidant properties of green peas and string beans. Int. J. Food Sci. Technol. 2010, 46, 93–100. [Google Scholar] [CrossRef]
  45. Baardseth, P.; Bjerke, F.; Martinsen, B.K.; Skrede, G. Vitamin C, total phenolics and antioxidative activity in tip-cut green beans (Phaseolus vulgaris) and swede rods (Brassica napusvar.napobrassica) processed by methods used in catering. J. Sci. Food Agric. 2010, 90, 1245–1255. [Google Scholar] [CrossRef] [PubMed]
  46. Patras, A.; Tiwari, B.; Brunton, N. Influence of blanching and low temperature preservation strategies on antioxidant activity and phytochemical content of carrots, green beans and broccoli. LWT 2011, 44, 299–306. [Google Scholar] [CrossRef]
  47. Escarpa, A.; Gonzalez, M.C. Identification and quantitation of phenolics from green beans by high-performance liquid chromatography. Chromatographia 2000, 52, 33–38. [Google Scholar] [CrossRef]
  48. Li, A.-N.; Li, S.; Li, H.-B.; Xu, D.-P.; Xu, X.-R.; Chen, F. Total phenolic contents and antioxidant capacities of 51 edible and wild flowers. J. Funct. Foods 2014, 6, 319–330. [Google Scholar] [CrossRef]
  49. Onyilagha, J.C.; Islam, S. Flavonoids and other polyphenols of the cultivated species of the genus Phaseolus. Int. J. Agric. Biol. 2009, 11, 231–234. [Google Scholar]
  50. Espinosa-Alonso, L.G.; Lygin, A.; Widholm, J.M.; Valverde, M.E.; Paredes-López, O. Polyphenols in Wild and Weedy Mexican Common Beans (Phaseolus vulgaris L.). J. Agric. Food Chem. 2006, 54, 4436–4444. [Google Scholar] [CrossRef]
  51. Parmar, N.; Singh, N.; Kaur, A.; Thakur, S. Comparison of color, anti-nutritional factors, minerals, phenolic profile and protein digestibility between hard-to-cook and easy-to-cook grains from different kidney bean (Phaseolus vulgaris) accessions. J. Food Sci. Technol. 2017, 54, 1023–1034. [Google Scholar] [CrossRef] [Green Version]
  52. Castillo, F.; González, D.R.; Moore-Carrasco, R. Effects of Phaseolus vulgaris Extract on Lipolytic Activity and Differentiation of 3T3-L1 Preadipocytes into Mature Adipocytes: A Strategy to Prevent Obesity. J. Nutr. Metab. 2019, 2019, 1–8. [Google Scholar] [CrossRef]
  53. Ramírez-Jiménez, A.K.; Reynoso-Camacho, R.; Tejero, M.E.; León-Galván, F.; Loarca-Piña, G. Potential role of bioactive compounds of Phaseolus vulgaris L. on lipid-lowering mechanisms. Food Res. Int. 2015, 76, 92–104. [Google Scholar] [CrossRef]
  54. Celleno, L.; Tolaini, M.V.; D’Amore, A.; Perricone, N.V.; Preuss, H.G. A Dietary Supplement Containing Standardized Phaseolus vulgaris Extract Influences Body Composition of Overweight Men and Women. Int. J. Med Sci. 2007, 4, 45–52. [Google Scholar] [CrossRef] [Green Version]
  55. Venkateswaran, S.; Pari, L. Antioxidant effect of Phaseolus vulgaris in streptozotocin-induced diabetic rats. Asia Pac. J. Clin. Nutr. 2002, 11, 206–209. [Google Scholar] [CrossRef] [PubMed] [Green Version]
  56. Wettasinghe, M.; Bölling, B.; Plhak, L.; Parkin, K. Screening for Phase II Enzyme-inducing and Antioxidant Activities of Common Vegetables. J. Food Sci. 2002, 67, 2583–2588. [Google Scholar] [CrossRef]
  57. ENSANUT. Presentación de Resultados. Available online: https://ensanut.insp.mx/encuestas/ensanut2018/doctos/informes/ensanut_2018_presentacion_resultados.pdf (accessed on 18 October 2020).
  58. World Health Organization. Obesity and Overweight. Available online: https://www.who.int/news-room/fact-sheets/detail/obesity-and-overweight#:~:text=Of%20these%20over%20650%20million%20adults%20were%20obese.,tripled%20between%201975%20and%202016 (accessed on 4 July 2020).
  59. WHO. Fact Sheets: The Top Ten Causes of Death. Available online: https://www.who.int/news-room/fact-sheets/detail/the-top-10-causes-of-death (accessed on 18 October 2020).
Figure 1. Landrace green bean samples evaluated of P. vulgaris (a) and P. coccineus (b).
Agronomy 11 00803 g001
Table 1. Mean square values of the variance analysis of the physicochemical parameters in green beans.
VariableVariation Sources
RepetitionSpeciesGenotype/SpeciesErrorCV (%) 4
pH0.1 **0.0 ns0.2 **0.01.8
TA0.0 ns,10.1 ns1.0 **0.123.8
TSC5736.1 **,321802.8 *7394.1 **301.325.8
TSS0.0 ns84.7 **59.4 **1.816.6
Color parametersL*249.4 *,283.1 *42.041.9911.8
a*28.8 **1.4 **0.10.1420.1
b*15.5 **2.1 **0.30.3419.5
C12.1 **1.8 **0.30.3319.0
23,406.2 **1392.6 **92.592.4711.1
Protein48.9 **15.3 **1.91.9417.4
TPC2918.3 **422.9 **7.27.1926.5
TAC10.3 **7.2 **0.10.1415.4
DPPH288.7 **33.2 **0.6 **0.61 **11.7
FRAP458.5 **33.3 **0.80.7614.0
1,ns not significant at p = 0.05, 2,* (p < 0.05), 3,** (p < 0.01), 4 CV% (Coefficient of variation).
Table 2. Physicochemical, color parameters, and protein content in green beans from bean landraces.
Species and GenotypespHTATSTSSL*a*b*C*P
P. coccineus L.6.4 ± 0.1A 10.9 ± 0.3 A76.2 ± 27.1 A7.4 ± 1.9 B55.9 ± 1.9 A−1.4 ± 0.7 B10.8 ± 1.7 A10.9 ± 1.7 A96.3 ± 4.2 A5.6 ± 2.3 B
Fat bean6.4 ± 0.1 a–f 10.8 ± 0.1 e–g48.6 ± 6.4 f–i6.8 ± 0.6 g–i55.0 ± 7.1 ab−1.7 ± 0.9 e–g11.4 ± 3.5 a–d11.6 ± 3.6 a–d98.1 ± 2.1 abc9.6 ± 0.8 c–e
SLMV6.5 ± 0.2 a–e0.9 ± 0.1 c–e56.4 ± 11.3 e–i10.8 ± 2.3 b57.7 ± 4.2 ab−0.8 ± 0.6 d–g7.9 ± 2.2 b–g7.9 ± 2.3 b–f95.2 ± 2.8 a–d6.2 ± 1.1 gh
SJA6.3 ± 0.2 gh1.3 ± 0.4 ab125.5 ± 39.7 a5.3 ± 0.5 ij59.2 ± 8.0 a−0.2 ± 1.6 d–f9.6 ± 6.1 a–f9.7 ± 6.1 a–f87.5 ± 10.9 b–e6.5 ± 1.0 gh
CAA6.3 ± 0.1 f–h1.2 ± 0.1 bc93.5 ± 14.5 bc5.0± 0.0 j57.4 ± 5.7 ab−2.2 ± 0.9 g 11.9 ± 4.0 ab12.1 ± 4.1 ab100.1 ± 1.8 a3.0 ± 1.6 j
P-696.5 ± 0.2 a–d1.4 ± 0.4 a107.1 ± 11.6 ab8.6 ± 2.0 d–f53.9 ± 5.9 ab−2.4 ± 0.7 g13.6 ± 3.3 a13.8 ± 3.3 a99.8 ± 0.9 a3.1 ± 1.7 j
P-266.3 ± 0.1 e–h0.8 ± 0.1 d–f66.8 ± 12.9 d–g6.3 ± 1.0 h–j55.6 ± 5.5 ab−1.7 ± 0.9 e–g10.4 ± 3.7 a–f10.5 ± 3.8 a–e98.8 ± 2.0 ab8.1 ± 0.5 e–g
P-96C26.5 ± 0.1 a–d0.5 ± 0.2 g47.9 ± 7.8 f–i 9.1 ± 3.3 cd56.3 ± 7.7 ab−0.8 ± 1.5 de–g9.4 ± 4.3 a–f9.5 ± 4.4 a–f92.0 ± 9.2 a–d5.3 ± 0.3 hi
P-91C26.5 ± 0.0 a–f0.7 ± 0.2 e–g76.5 ± 14.2 c–e8.0 ± 1.8 d–g53.5 ± 6.9 ab−1.3 ± 1.2 e–g11.0 ± 3.3 a–e11.1 ± 3.4 a–e96.2 ± 4.9 a–d5.4 ± 0.7 h
P-1026.5 ± 0.1 a–e0.8 ± 0.2 ef63.6 ± 11.5 d–g7.1 ± 0.1 f–h54.5 ± 5.6 ab−1.9 ± 0.7 fg11.8 ± 3.2 abc11.9 ± 3.3 a–c98.8 ± 1.4 ab3.3 ± 0.6 ij
P. vulgaris L.6.4 ± 0.1 A1.0 ± 0.2 A59.3 ± 14.8 B8.5 ± 2.0 A54.1 ± 2.6 B1.0 ± 1.4 A8.2 ± 2.4 B8.5 ± 2.2 B78.7 ± 12.2 B10.1 ± 1.8 A
P-346.4 ± 0.1 b–g1.1 ± 0.2 b–d69.8 ± 12.4 d–f7.3 ± 0.9 e–h55.4 ± 8.1 ab0.0 ± 2.4 c–e 9.9 ± 3.7 a–f10.1 ± 3.7 a–e87.0 ± 14.0 b–e10.1 ± 0.6 b–e
P-686.6 ± 0.1 a1.1 ± 0.1 b–d71.7 ± 23.2 c–e8.2 ± 1.0 d–g57.3 ± 6.4 ab−1.5 ± 1.2 e–g 11.8 ± 3.2 a–c11.9 ± 3.3 a–c96.5 ± 5.1 a–c8.7 ± 1.3 d–f
P-766.4 ± 0.1 b–g1.1 ± 0.4 bc59.3 ± 21.1 e–h8.3 ± 1.1 d–g56.8 ± 7.5 ab−0.2 ± 1.0 d–f7.5 ± 3.7 c–g7.6 ± 3.7 c–f86.6 ± 11.1 c–e12.2 ± 2.5 ab
P-196.5 ± 0.1 ab1.2 ± 0.1 ab81.8 ± 25.1 cd6.8 ± 0.4 g–i52.6 ± 6.0 ab0.4 ± 1.6 b–d8.1 ± 2.4 b–g8.3 ± 2.3 b–f84.5 ± 14.1 d–f9.1± 1.2 c–f
P-716.5 ± 0.0 a–c0.6 ± 0.1 fg72.2 ± 18.5 c–e7.1 ± 1.0 f–h53.9 ± 7.6 ab2.6 ± 0.9 a 4.8 ± 2.4 g5.6 ± 2.3 f58.0 ± 13.4 h10.7 ± 3.5 a–d
P-586.5 ± 0.1 a–e0.9 ± 0.2 c–e45.2 ± 3.8 g–i10.4 ± 0.3 bc52.5 ± 7.5 ab 1.9 ± 0.9 ab6.5 ± 2.3 fg6.8 ± 2.3 ef72.6 ± 7.6 fg12.3 ± 1.7 a
P-656.2 ± 0.1 h0.8 ± 0.1 ef36.8 ± 8.6 i7.6 ± 0.4 d–h57.8 ± 8.1 ab2.0 ± 2.8 ab7.4 ± 4.3 d–g8.1 ± 4.3 b–f69.2 ± 20.0 gh11.8 ± 0.9 ab
P-166.4 ± 0.0 d–g0.8 ± 0.2 d–f41.5 ± 14.7 hi7.1 ± 1.4 f–h52.0 ± 6.0 ab1.7 ± 0.7 a–c6.9 ± 2.0 e–g7.1 ± 2.0 ef75.7 ± 5.7 eg10.9 ± 1.1 a–c
P-406.4 ± 0.1 c–g1.2 ± 0.5 ab57.2 ± 13.9 e–i8.8 ± 0.8 c–e51.7 ± 5.7 ab2.8 ± 2.4 a6.5 ± 2.7 fg7.3 ± 2.9 d–f66.4 ± 16.1 gh8.7 ± 0.4 d–f
FCA-046.5 ± 0.1 ab0.9 ± 0.1 c–e57.1 ± 23.1 e–i13.2 ± 1.3 a 50.8 ± 4.5 b−0.2 ± 1.0 d–f12.1 ± 2.8 ab12.2 ± 2.8 ab90.6 ± 4.1 a–d 7.0 ± 0.9 f–h
TA = titratable acidity (g Citric acid 100 g−1 dw), TS = Total sugars (mg Glucose g−1 dw), TSS = Total soluble solids (°Brix), L*: Luminosity, a*: Red/green Coordinates, b*: Yellow/blue Coordinates, C*: Chromaticity, h°: Hue angle, P: Total protein (g 100 g−1 dw). SLMV: Santa Lucia Monte Verde, SJA: San Juan Atepec, CAA: Cerro Amole Ayutla. 1 Between species (capital letter) and among landraces (lowercase letter), means with same letter indicate non-significant differences (Tukey’s test, p < 0.05).
Table 3. Content of total phenols, anthocyanins, and in vitro antioxidant activity in green beans from bean landraces.
Species and LandracesTPCTACDPPHFRAP
P. coccineus L.13.4 ± 8.0 A 10.7 ± 0.0 B62.9 ± 32.5 A60.2 ± 32.3 A
Fat bean7.8 ± 1.2 de–g 1-37.9 ± 12.6 f–j54.3 ± 11.4 b–d
SLMV26.5 ± 8.5 a0.7 ± 0.1 c 58.6 ± 9.9 b–e53.9 ± 17.7 b–d
SJA12.9 ± 3.4 bc-71.0 ± 19.5 b65.6 ± 33.3 b
CAA13.6 ± 1.9 b-67.5 ± 9.5 bc57.4 ± 5.1 bc
P-6923.7 ± 4.9 a-141.4 ± 50.9 a141.0 ± 43.8 a
P-269.3 ± 0.8 de-51.6 ± 6.9 c–f42.4 ± 6.7 c–e
P-96C26.0 ± 0.6 f–h-34.1 ± 7.3 g–j34.3 ± 8.6 e
P-91C27.7 ± 1.2 d–g-39.3 ± 7.8 f–j 33.8 ± 3.9 e
P-10212.9 ± 3.0 bc-65.2 ± 18.5 b–d58.8 ± 10.5 bc
P. vulgaris L.7.2 ± 1.9 B2.2 ± 1.0A34.3 ± 11.3 B27.0 ± 10.9 B
P-346.5 ± 0.3 e–h-31.5 ± 10.8 g–k30.2 ± 8.9 ef
P-687.9 ± 0.4 d–g-40.1 ± 2.7 f–j28.9 ± 4.1 ef
P-766.5 ± 0.9 e–h-45.6 ± 7.5 e–g31.0 ± 10.7 ef
P-1910.1 ± 1.0 cd-45.2 ± 6.3 e–h44.8 ± 7.4 c–e
P-714.2 ± 0.9 h-14.3 ± 1.9 k14.2 ± 5.1 f
P-589.0 ± 4.0 d–f-28.1 ± 9.5 h–k15.2 ± 3.7 f
P-655.7 ± 0.8 gh-26.2 ± 2.0 i–k16.1 ± 3.0 f
P-167.9 ± 1.1 d–g2.9 ± 1.6 a41.0 ± 7.0 f–i34.9 ± 7.0 e
P-409.1 ± 4.1 d–f1.2 ± 0.5 b48.0 ± 15.6 d–g37.8 ± 13.7 de
FCA-044.9 ± 0.6 gh-23.4 ± 3.0 jk16.4 ± 3.7 f
TPC: Total polyphenol content (mg GAE g−1 dw), TAC: Total anthocyanin content (mg C3G g−1 dw), DPPH: Antioxidant activity (µmol TE g−1 dw), FRAP: Antioxidant capacity (µmol TE g−1 dw). SLMV: Santa Lucia Monte Verde, SJA: San Juan Atepec, CAA: Cerro Amole Ayutla. 1 Between species (capital letter) and among landraces (lowercase letter), means with same letter indicate non-significant differences (Tukey’s test, p < 0.05).
Table 4. Correlation coefficients between bioactive compounds, in vitro antioxidant activity, and physicochemical parameters in green beans from bean landraces.
VariableTPCTATSFRAPDPPHC*
TPC1.0
TA0.4 **,21.0
TS0.3 **0.5 **1.0
FRAP0.7 **0.5 **0.5 **1.0
DPPH0.8 **0.5 **0.5 **0.9 **1.0
0.3 **0.1 **0.2 **0.4 **0.4 **1.0
C*0.1 ns,10.1 ns0.1 ns0.2 **0.2 **0.6 **1.0
1,ns not significant at p < 0.05, 2,**significant (Student’s test, p < 0.001).
Publisher’s Note: MDPI stays neutral with regard to jurisdictional claims in published maps and institutional affiliations.

