Article

High Soil Phosphorus Application Significantly Increased Grain Yield, Phosphorus Content but Not Zinc Content of Cowpea Grains

by
Saba B. Mohammed
1,2,*,
Daniel K. Dzidzienyo
2,
Adama Yahaya
3,
Muhammad L. Umar
1,
Mohammad F. Ishiyaku
1,
Pangirayi B. Tongoona
2 and
Vernon Gracen
2,4
1
Institute for Agricultural Research, Ahmadu Bello University, Zaria 800001, Nigeria
2
West Africa Centre for Crop Improvement, University of Ghana, Accra 233, Ghana
3
Department of Botany, Ahmadu Bello University, Zaria 800001, Nigeria
4
Department of Plant Breeding and Genetics, Cornell University, Ithaca, NY 31328, USA
*
Author to whom correspondence should be addressed.
Agronomy 2021, 11(4), 802; https://doi.org/10.3390/agronomy11040802
Submission received: 9 February 2021 / Revised: 8 April 2021 / Accepted: 14 April 2021 / Published: 19 April 2021

Abstract

:
To ameliorate the impact of soil phosphorus (P) deficiency on cowpea, the use of P-based fertilizers is recommended. Plant zinc (Zn) is an essential nutrient required by plants in a wide range of processes, such as growth hormone production and metabolism. However, a negative association between plant Zn content and high P application has been reported in some crops. There are few reports about soil P application and plant Zn content relationship on cowpea. Thus, this study investigated the response of cowpeas to three P rates in the screenhouse (0, 1.5, and 30 mg P/kg) and field (0, 10, and 60 kg P2O5/ha) and their effects on plant P and Zn content, biomass, and grain yield. In the screenhouse, shoot and root dry weights, and shoot P and Zn content were measured. Shoot dry weight, grain yield, grain P, and Zn contents were determined from field plants. Higher rates of P led to increased shoot biomass and grain yield of the field experiment but were not associated with a significant change in shoot or grain Zn content. There was not a significant correlation between grain yield and Zn content in high soil P (p < 0.05). The effect of higher P application on reduced plant Zn contents may be genotype-dependent and could be circumvented if genotypes with high Zn content under high soil P are identified.

1. Introduction

Zinc (Zn) is among the seven most limiting micronutrients in human diets, as over two-thirds of the global diets are deficient in one or more of iron (Fe), zinc, copper, calcium, magnesium, iodine, and selenium [1,2]. Zn is especially needed by pregnant women and children, especially because of its critical roles in pregnancy, enhanced protection from infection, and maintenance of immune system functions. Its deficiency can lead to complications in childbirth, low birth weight, poor growth of children, and reduced tolerance to infectious diseases [3,4,5]. Zn is also an important factor in the prevention and treatment of common diseases such as common cold, malaria, diarrhea, and respiratory infections [4,5].
Cowpea is a pulse crop providing food, nutrition, and cash for its value-chain actors across sub-Saharan Africa (SSA) and beyond [6,7]. Every part of the crop, including leaves, green pods, and grains, are used by humans in making different dishes and its fodder is used for livestock feed [8,9]. Due to its rich protein content, the crop serves as an important supplement for the carbohydrate-rich cereals [9,10]. Cowpea is a strategically important crop capable of providing millions of people with nutritional security owing to its rich nutritional value, especially high protein, Fe, and Zn. This contributes to its increasing popularity [11]. Cowpeas are cultivated by smallholder farmers on soils with low available plant phosphorus (P) with minimal to no P application [12,13,14].
Cereals are the most important source of calories globally but are deficient in Zn and Fe due to the high content of phytic acids in grains that decrease the bioavailability of Zn. Therefore, Zn deficiency is likely to be high in areas where cereals are the dominant food source [4,15]. Legumes, being rich in important micronutrients like Fe and Zn, serve as good complimentary food to micronutrient-deficient cereals [11,16]. P is stored in most legumes including cowpea as phytic acid, which is known to limit the bioavailability of Zn [16,17,18].
Increasing the bioavailability of micronutrients in human diets has become a global priority, particularly for Fe and Zn in developing countries, where many people depend on plant-based food products for nutrition [11,19,20]. Enhancing the bioavailability of micronutrients in food could be achieved through improved agronomic practices such as optimum application of fertilizers with micronutrients, and genetic improvement of elite crop varieties [1,19]. Other ways to remedy micronutrients deficiency in food crops include biofortification, diversity of diet, mineral supplementation, and food fortification [1,15,21,22].
In SSA, micronutrient deficiency is not only found in edible parts of plants, like grains, but also in most soils of growing areas of major crops, including cowpeas. Micronutrient deficiency of grains is further worsened because most farmers do not apply micronutrients such as Zn to crop plants, even when the application of Zn to cowpea is known to increase both grain yield and Zn content [20]. The low P of soils further leads to low productivity of the crop [7,23,24].
Application of fertilizers supplying major nutrients like nitrogen-phosphorus-potassium (NPK), with little or no consideration of micronutrient requirements, may lead to a reduced amount of micronutrients in the edible tissues that serve as food for people [18], since the micronutrient content of grains depends largely on the supply from soil nutrient pool and micronutrients-containing fertilizers [1,18]. Two complementary approaches have been recommended to achieve high cowpea yield on soils with low available P. First is the use of improved agronomic approaches such as application of phosphate fertilizers, and second is the development of elite varieties with high P use efficiency [25,26,27]. Varieties with improved P efficiencies use different mechanisms, including increased solubilization and mobilization of soil P, improved root architecture traits, and increased ability to acquire P and accumulate it in edible tissues [27,28,29,30].
Loneragan and Webb [31] reported that there is confusing literature on plant P–Zn interactions for crop plants and noted that the subject of plant P–Zn interactions remains complex, involving many phenomena in both soils and plants, such as observations that P applications can decrease, or not decrease, Zn content in plant grains and shoots. The application of phosphate fertilizer is required for increased productivity of cowpea in areas with low soil available P. However, its influence on micronutrient availability on the grains and leaves has not been adequately investigated [16,32,33]. The application of P, especially at a high rate, may be counterproductive, if P application negatively affects Zn availability, as has been found in some cereals [15,18,22,34]. Thus, it is important to investigate the influence of P fertilizer applications on cowpea’s growth (root and shoot biomass), grain yield, and the potential relationship between P application in the growth medium and Zn content in shoot and grain at varying levels of P concentrations of the growth environment.

2. Materials and Methods

2.1. Plant Materials

A total of thirty elite cowpea genotypes from four different breeding programs in West Africa (Burkina Faso, Ghana, and Nigeria) and the USA were used. Twenty were parents for recombinant inbred line populations previously studied for mapping of important biotic and abiotic stresses [35,36,37]. The genotypes are presented in Supplementary Table S1.

2.2. Description of the Experiments

Two experiments were conducted: one in the screenhouse and the other under the field environment. In the screenhouse experiment, a river-sand was collected from the bank of a local stream “Rafin Kudingi” at the Ahmadu Bello University Nigeria (11°09′49.6″ N 7°37′13.8″ E) and was acid-washed with 1% HCl. The acid-washed sand used had very low P (3.70 mg/kg), N (0.11 g/kg), and K (0.08 cmol/kg) and organic carbon (0.24 g/kg of soil contents), determined at the Department of Soil Science, Ahmadu Bello University Nigeria, and this appropriately mimics major nutrient-deficient soil [38]. A Hoagland nutrient solution with three different concentrations of P (0, 1.5, and 30 mg P/kg of soil) as described in a previous study on cowpea [39] was used to water the plants during the experiment. The screenhouse experiment used a randomized complete block design in five replications. Cowpea seeds were sown and thinned to one plant per pot at 10 days after sowing (DAS). The pots were watered with the dilute nutrient solution with graduated beakers as follows: 300 mL per pot at planting, and subsequently 300 mL was applied at 3, 6, 9, 16, 23, 30, 37, 44, and 51 DAS for each of the P treatments (0, 1.5, and 30 mg P/kg soil). Reverse osmosis (RO) was used to water the pots periodically to prevent wilting and prevent the accumulation of salts in the soil. Spraying of insecticide (Karate 50 g/L lambda-cyhalothrin, Syngenta Crop Protection AG, Basel, Switzerland) was used to protect the plants against insect pests. Data on plant height (cm), shoot dry weight (g), root dry weight (g), total plant dry weight (g) (shoot and root dry weights), shoot P, root P, and shoot and root Zn content were collected from the screenhouse plants. Plant growth continued until 55 days, at which time the screenhouse experiment was terminated.
A field experiment, comprising the same set of genotypes used in the screenhouse experiment described above, was conducted in a low P field (4.2 mg P/kg—Bray-I method) at the Institute for Agricultural Research farm (11°10′31.7″ N 7°36′43.9″ E), Nigeria. The field used has been left uncultivated for several years and had low P (4.2 mg/kg), N (0.13 g/kg), and K (0.68 cmol/kg) and organic carbon (0.79 g/kg of soil content), as determined by the Department of Soil Science, Ahmadu Bello University, Nigeria. In the field, P was applied using a single super phosphate fertilizer (SSP 18% P2O5, 11% Sulphur, 18% Ca, and 4% moisture (TAK-AGRO, Kaduna, Nigeria)) at the rate of 0, 10, and 60 kg P205 ha−1 based on previous phosphate recommendations for cowpea [7,27]. The field experiment was a factorial arrangement (with two factors, namely: 30 cowpea genotypes and three P levels) in a randomized complete block design laid out in two replications. Plots were one row of 2 m each with a 1 m unplanted walkway between plots, giving a pot size of 1.5 m2 with an intra- and inter-row spacing of 0.20 and 0.75 m, respectively. All the field plots received 30 kg/ha N (46% N, Urea) and K (30% K2O, Muriate of Potash) to avoid any confounding effects of N and K deficiency on the plants. All the single fertilizers were applied as dual banding by placing them below the soil surface five days after sowing. Plants were protected against insect pests by spraying insecticide (Karate 50 g/L lambda-cyhalothrin, Syngenta Crop Protection AG, Basel, Switzerland). Data collected from the field experiment are plant height (cm), shoot dry weight (g), root dry weight (g), total plant dry weight (g) (shoot and root dry weights), grain yield (kg/ha), P concentration, and Zn content of the grains, shoot, and root samples. See Table 1 for the list and abbreviation of the traits measured.

2.3. Determination of Phosphorus Concentration and Zinc Content from Plant Tissues

Samples of shoots and grains were taken from the screenhouse (only shoot samples) and field experiments and analyzed for P concentration and Zn content. Grain samples were ground using mortar and pestle, whereas an electric blender was used to mill shoot samples. From each sample, 0.2 g was then weighed using an electric balance (Scouttm Pro SPU202, Ohaus Corporation, Parsippany, NJ, USA) and digested with 30 mL mixed acids (containing 26 mL nitric acid, 3.2 mL perchloric, and 0.8 mL sulfuric acids), then placed on a digestion block set at 230–300 °C. The digest was then transferred into a 50 mL volumetric flask and brought up to 50 mL with distilled water. Thereafter, 5 mL of the extract for each sample was pipetted into a 25 mL volumetric flask and 5 mL of a color developing agent made up of 50 g ammonium molybdate dissolved in 500 mL distilled water, 2.5 g ammonium metavanadate dissolved in 500 mL distilled water, and 350 mL nitric acid in 1000 mL of distilled water, which were all mixed and made up to 2.5 L with distilled water. To determine P concentration, absorbent readings were taken using a Spectrophotometer (Helios Gamma UVG 875005, Spectronic Unicam, Caerphilly, UK) at a wavelength of 460 nm. The Zn content was determined using an atomic absorption spectrometer (AA280FS, Agilent Technologies, Santa Clara, CA, USA). Zn standard solutions were made using the 1000 µg/mL Zn Standard (1000 µg/mL SpectraScan, Teknolab AS, Verkstedveien, Ski, Norway). The P concentration was determined in mg/kg, whereas the Zn was computed in parts per million (ppm). The formula for Zn content and P concentration computations are presented in Supplementary Table S2.

2.4. Statistical Analyses

2.4.1. Descriptive Analysis

Data from both the screenhouse and field experiments, including shoot parameters, yield (shoot and grain), P concentrations, and Zn content, were analyzed using the linear mixed effect model to generate the best linear unbiased estimator (BLUE) using the lme4 package in R. The BLUE outputs were used to visualize the phenotypic distribution of the measured traits with box plots using the ggplot2 package in R (R Core Team). The relative difference (%) in performance between the high P and low P (control) were computed (Supplementary Table S2).

2.4.2. Relationships among Yield, Phosphorus, and Zinc Content

The relationship among yield (biomass and grain), plant P, and Zn content phenotypes at the different soil P rate were investigated with the Pearson-product moment correlation and correlation matrices were visualized with the corrplot package in R (R Core Team).

2.4.3. Interaction of the Genotype Main Effect Plus Genotype by Environment of the Genotypes

The means of grain yield and grain Zn content were used to run a site regression analysis, also called genotype main effect plus genotype–environment interaction (GGE) [40]. The GGE is a linear-bilinear model that removes the effect of the environment (here, the rates of soil P) and expresses the output as a function of the genotype effects and its interaction with the environment. This model was used since the P rates are the main source of variation concerning the contributions of the genotypes and the interaction of the genotypes × P rates. The varying soil P rates were taken as environments for the analysis to identify the mean performance and stability of the genotypes, determined by their location and proximity to the origin of the biplot [40]. The GGE biplot outputs were used to indicate discrimination of the environments (P rates), and the correlation coefficient between the environments. The model used for the GGE analysis is as below:
Y ij =   μ + e j + n = 1 N T n γ in δ jn + ε ij
where Yij is the grain yield/Zn content of the i-th genotype (i = 1, …, 30) in the j-th P rates (j = 1, …, 3), µ is the grand mean, ej is the P rates’ deviations from the grand mean, Tn is the eigenvalue of the principal component (PC) analysis axis n, γin and δin are the genotype and P rates’ PC scores for axis n, N is the number of PC retained in the model, and εij is the error term.

3. Results

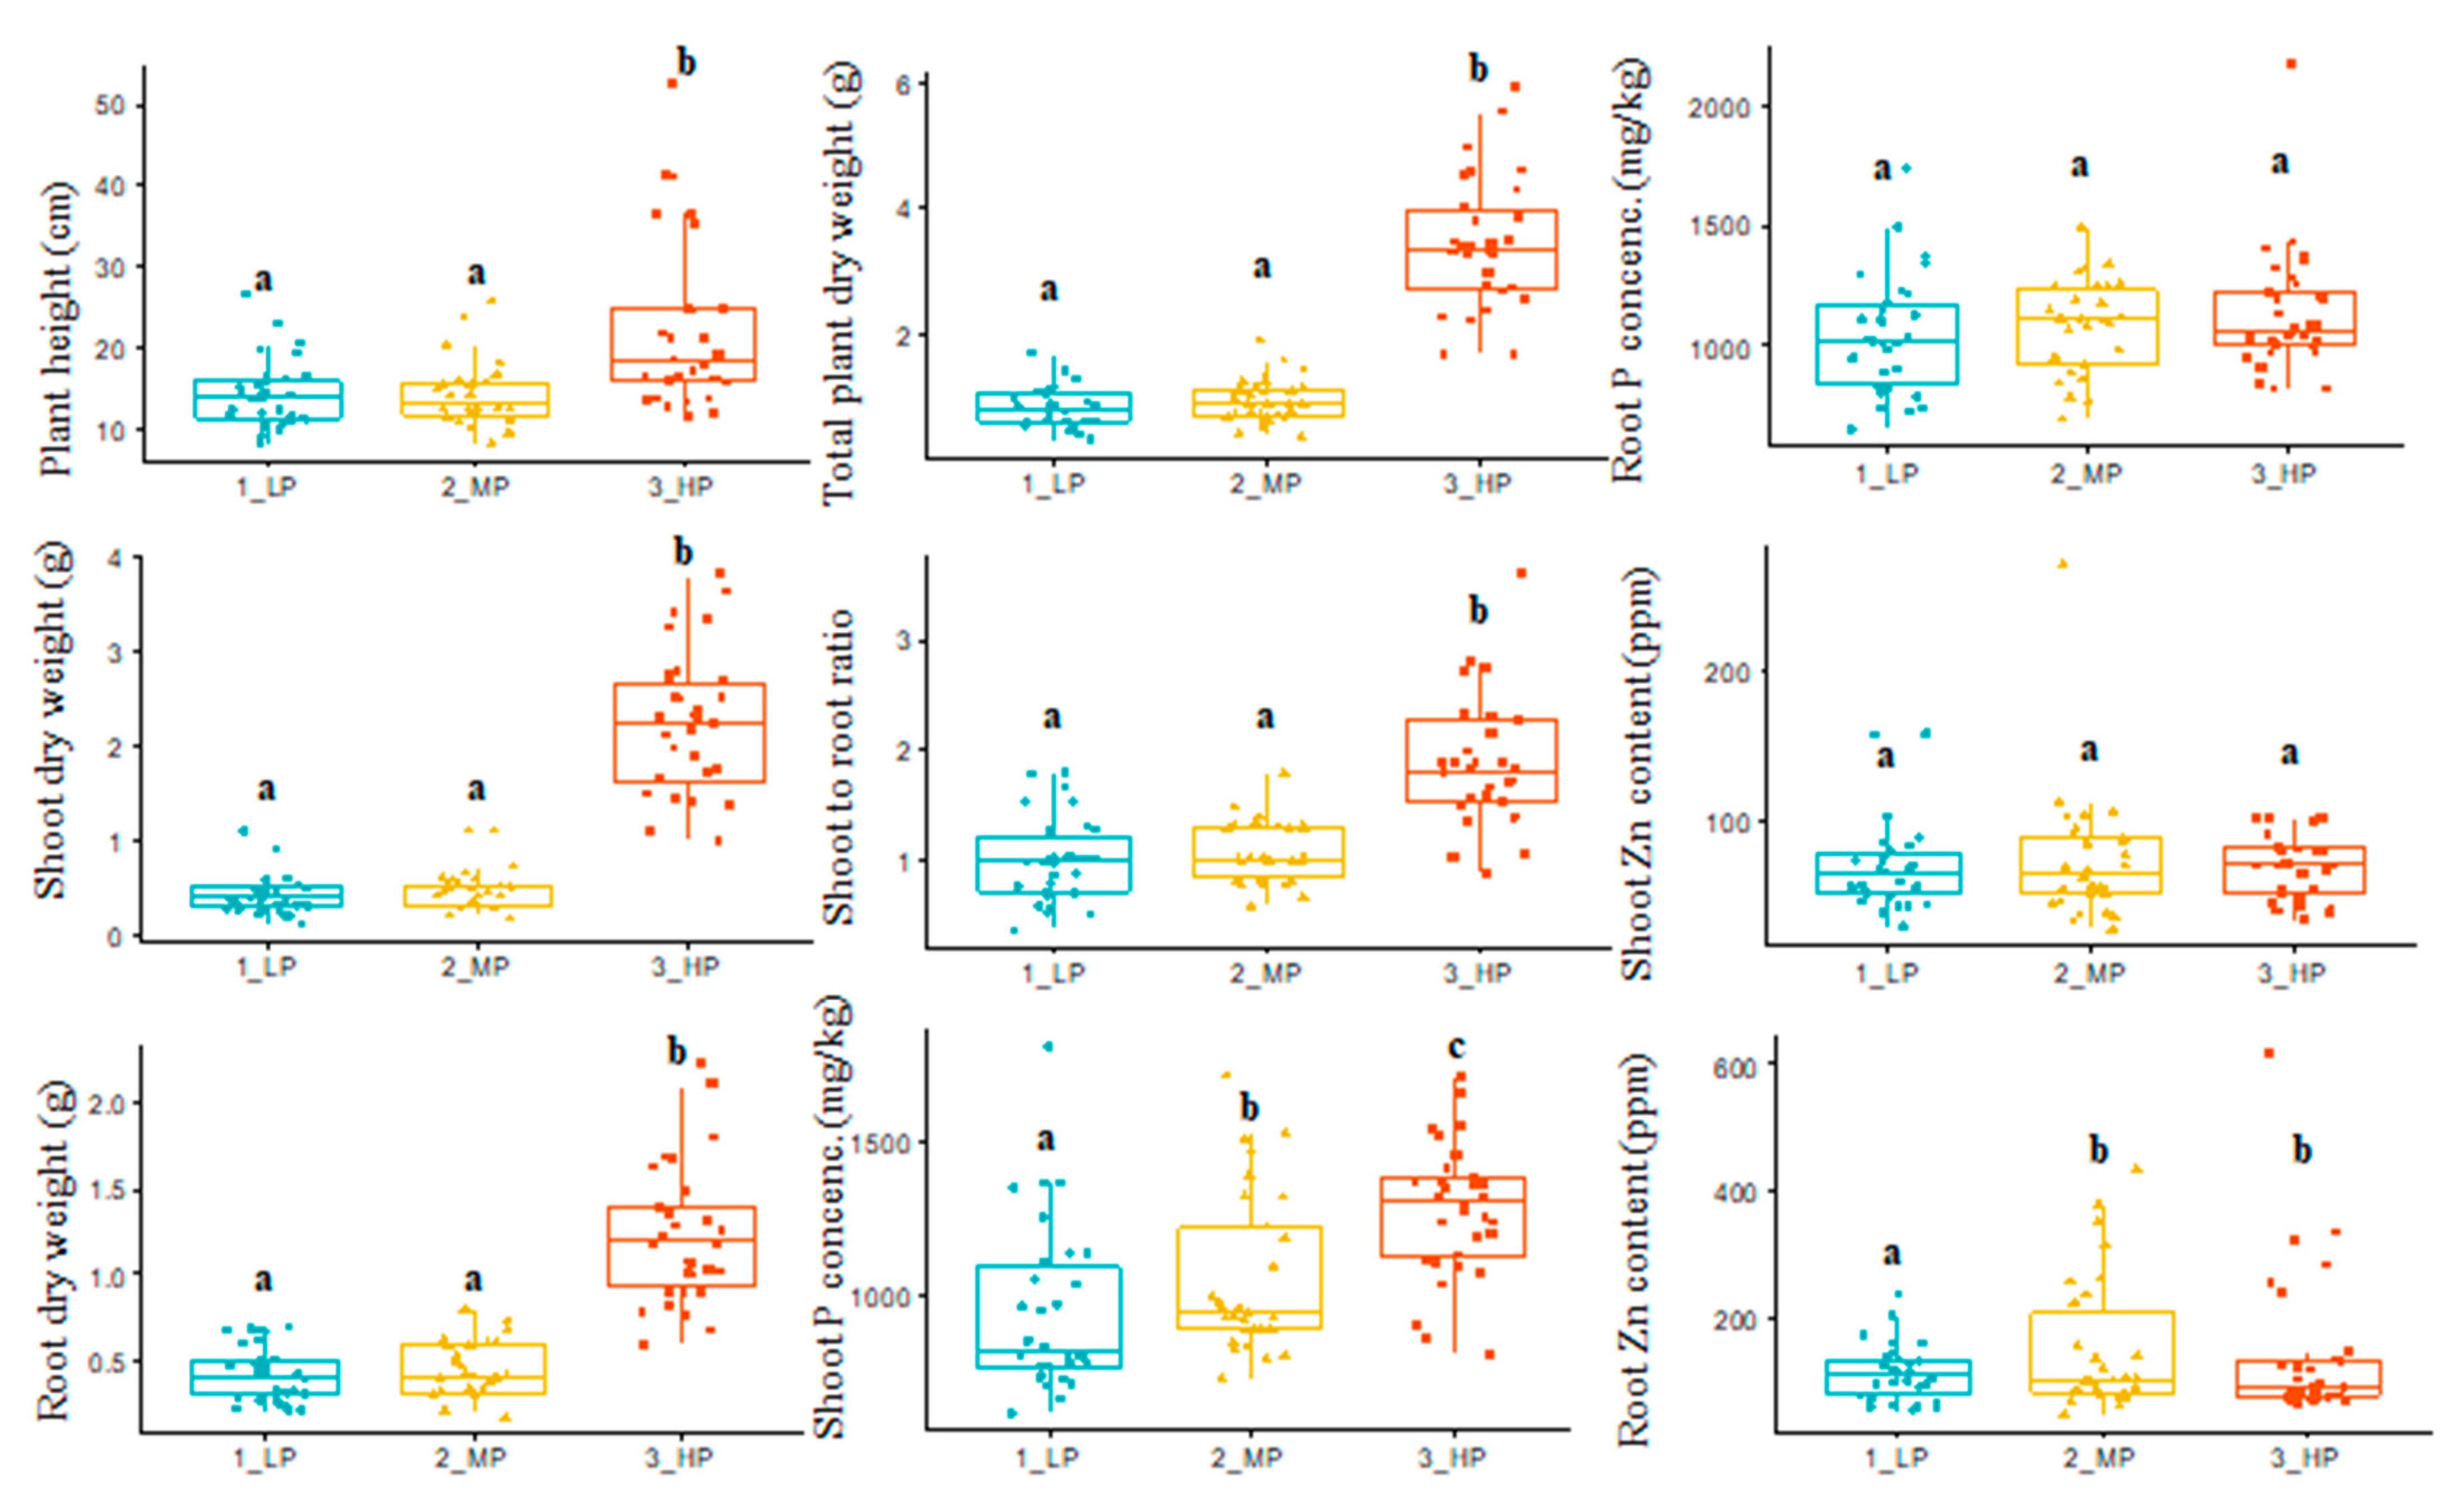
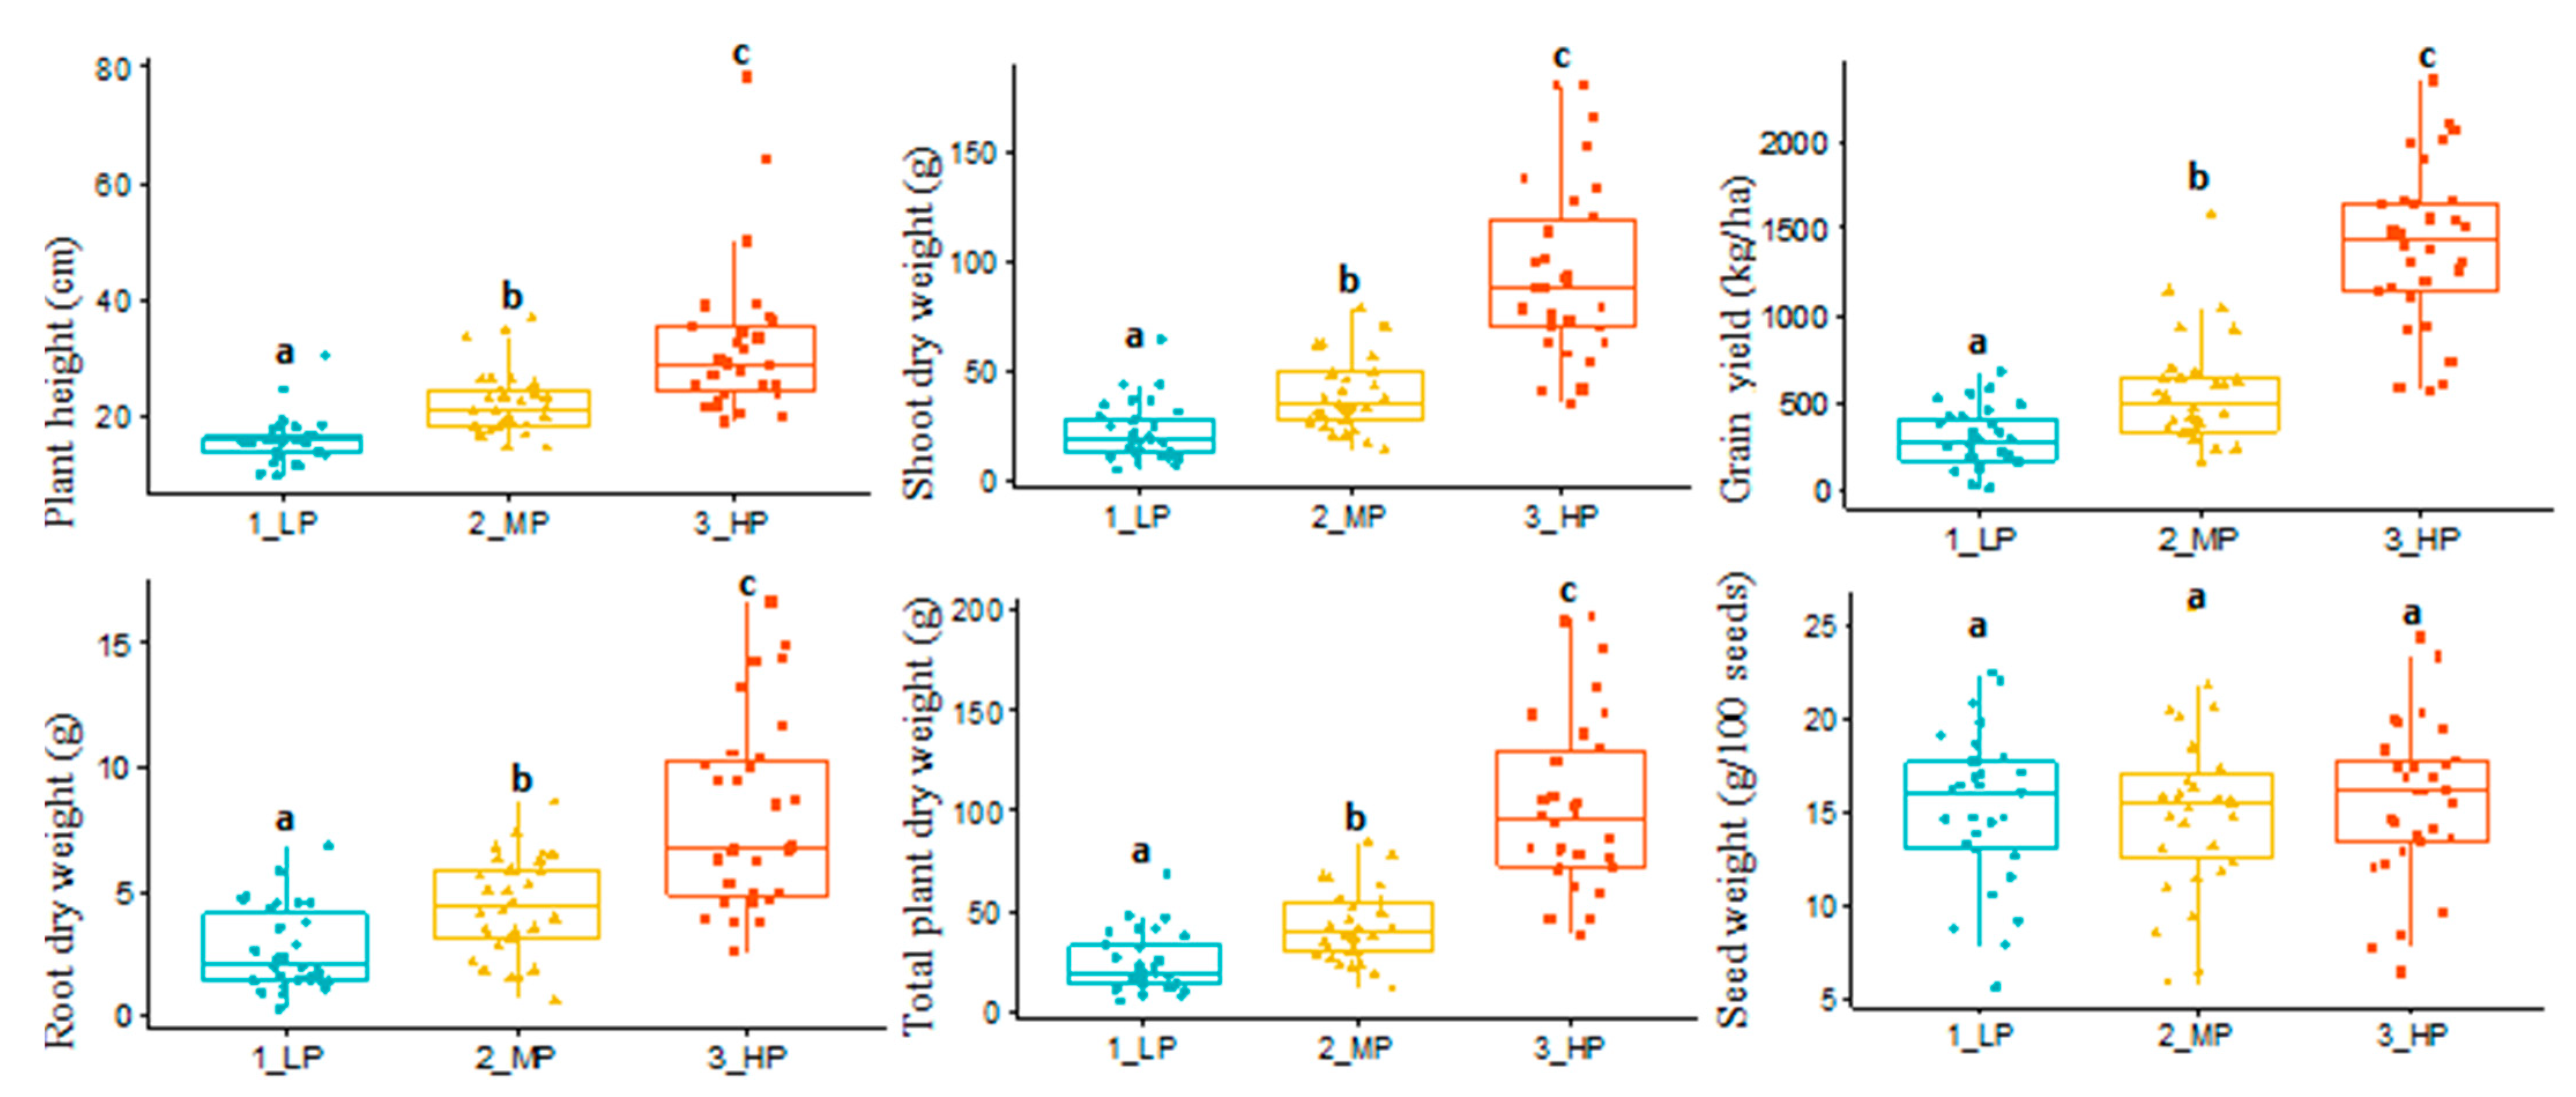
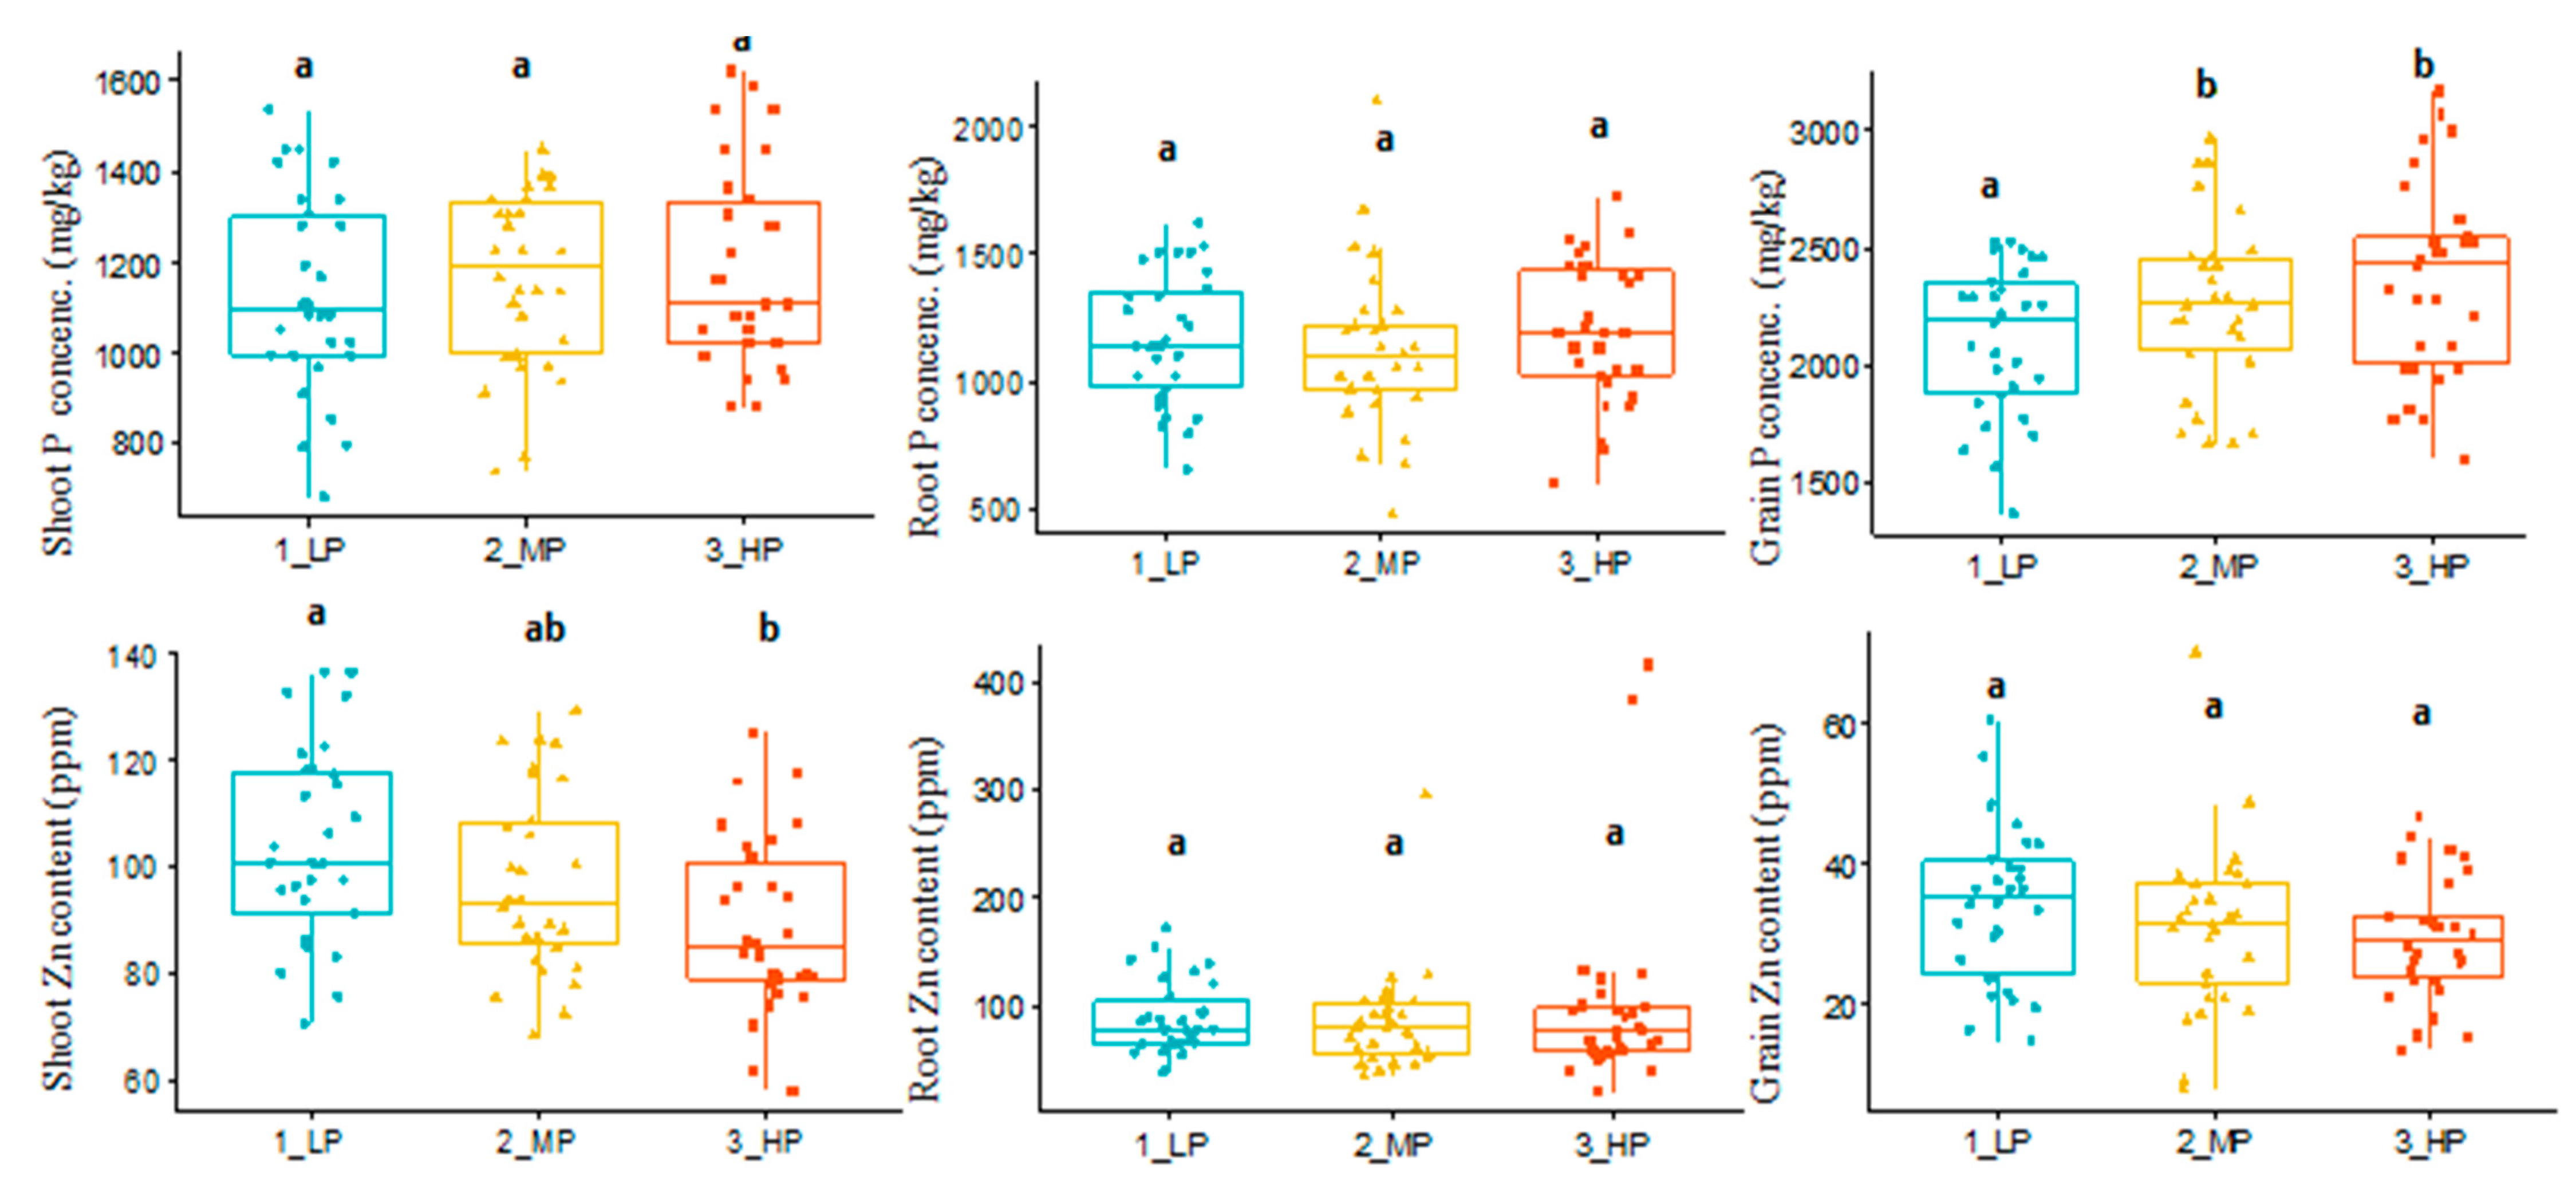
3.1. Variable Soil Phosphorus Effect on Shoot Dry Matter and Content of Phosphorus and Zinc

Phosphorus (P) fertilization was positively associated with increased growth and performance of the plants for most of the measured traits under the screenhouse conditions where plants were grown on acid-washed river-sand soil supplemented with Hoagland nutrients solution with varying P levels. The plant height, shoot dry weight, root dry weight, shoot to root ratio, and shoot P concentrations increased with increasing P supply, but the addition of P to the growth media did not result in increased shoot Zn content of the genotypes (Figure 1). The root Zn content of the MP and HP treatments were similar, though were higher than those of the LP treatment. A similar response was observed for the plants grown in the field with varying P supplied with the addition of SSP fertilizer, where plant height, shoot dry weight, root dry weight, total plant dry weight, grain yield, and P concentration of the grains increased as the P in the soil increased, except shoot P, root P, seed weight (g/100 seeds), root, and grain Zn contents (Figure 2 and Figure 3, Supplementary Figure S1). There was a noticeable increase in shoot Zn content with the varying soil P rates among the genotypes, which were not significantly different between the P treatments (Figure 3). The increase in shoot growth with the addition of more P to the growth media indicates that the soils used were suboptimal in available P. The increase in growth parameters and performance indicators was maximum for many traits when the applied P was highest for most of the parameters measured, except for shoot Zn content in the screenhouse, and shoot Zn, root Zn, and grain Zn contents in the field experiments. It therefore means that high soil P fertilization does not significantly result in reduced grain Zn content. The highest level of P fertilization did slightly, but not significantly, reduce shoot Zn content from the field results (Figure 3). The grain Zn content was relatively higher when P application was low and medium in the growth media compared with high P (Figure 3, see Supplementary Tables S3 and S4 for means of parameters assessed for all genotypes evaluated in the screenhouse and the field environments), though the differences were not significant as determined by the Tukey honestly significant difference test.
The relative increase in plant height, shoot dry weight, shoot P concentration, and shoot Zn content in high P (HP) over the low P (control) was 34.6%, 81.8%, 26.1%, and −3.51% respectively, in the screenhouse (Table 2), where the Zn content in the shoot at the HP (68.3 ppm) was slightly lower than the control (70.7 ppm), corresponding to −3.5% relative reduction in Zn content of HP plants compared to the LP. The results for the field evaluation followed a comparable pattern with the screenhouse in the relative difference in Zn content of HP relative to other P treatments. An increase in grain yield and grain P followed a linear pattern with increasing P fertilizer to the soil, while Zn content was higher in plants evaluated under low and medium soil P vis-à-vis the high P, which had a reduction of 17.1% in the Zn content of the HP over the LP (Table 2).

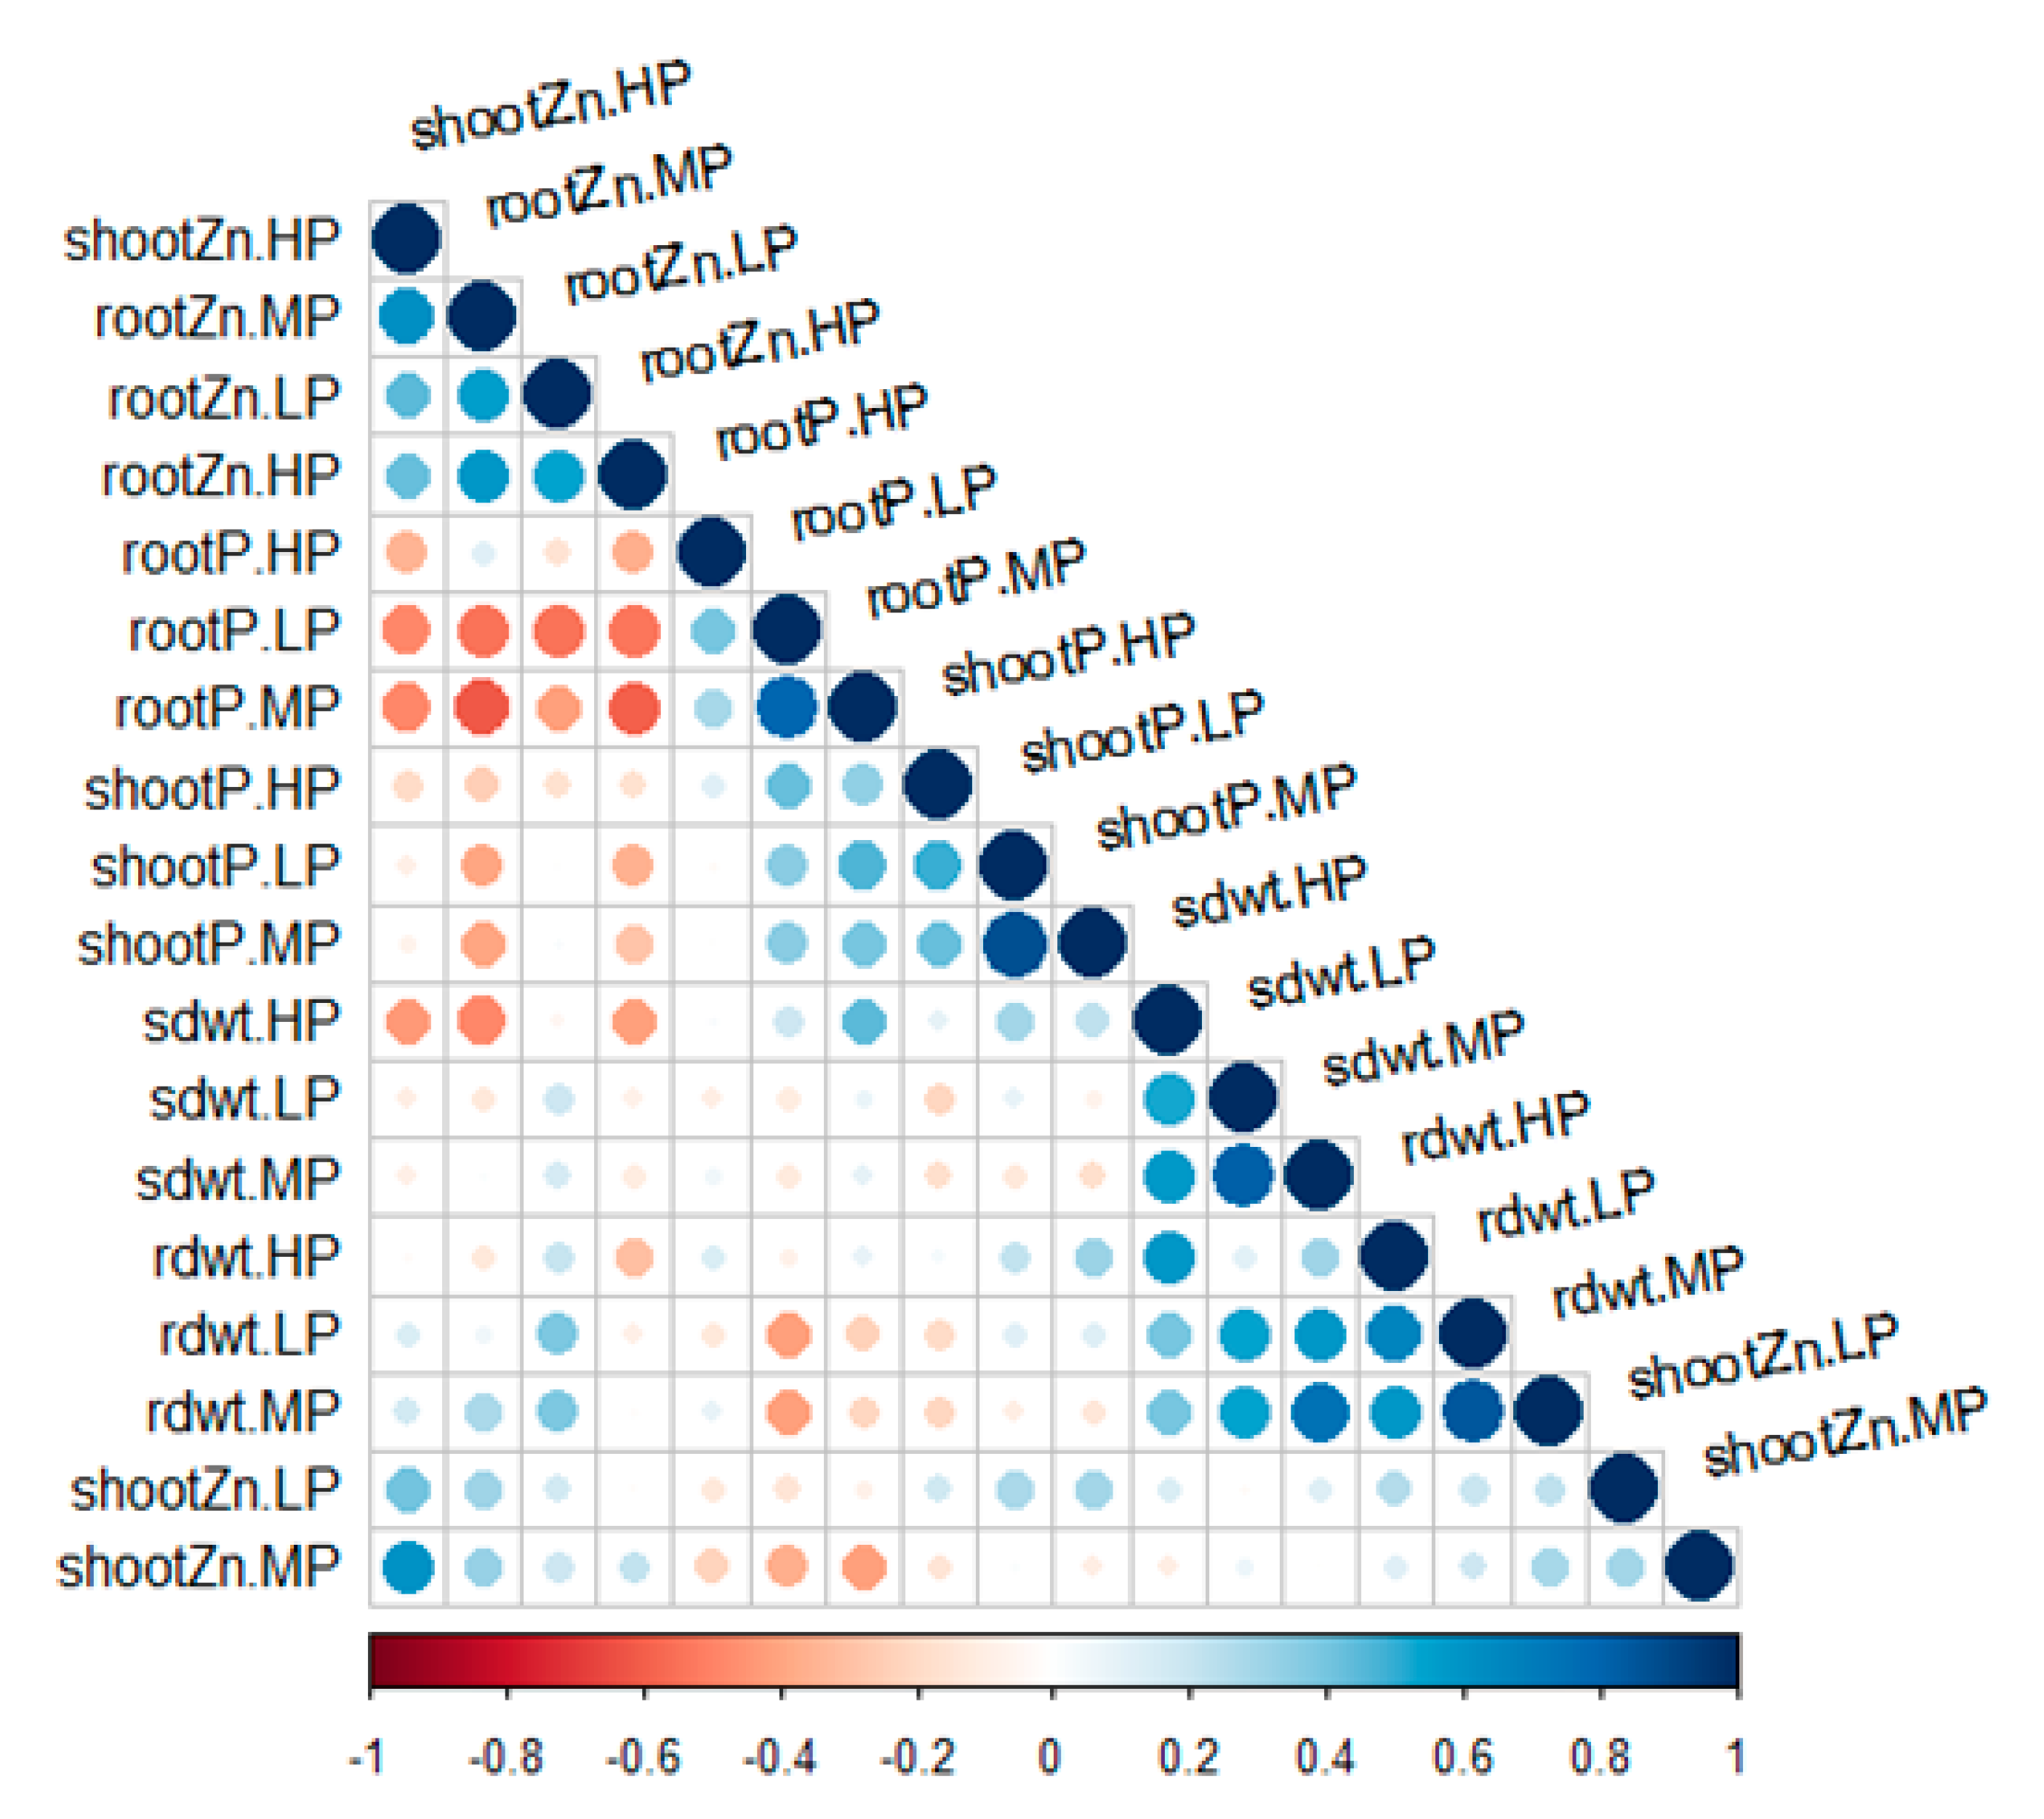
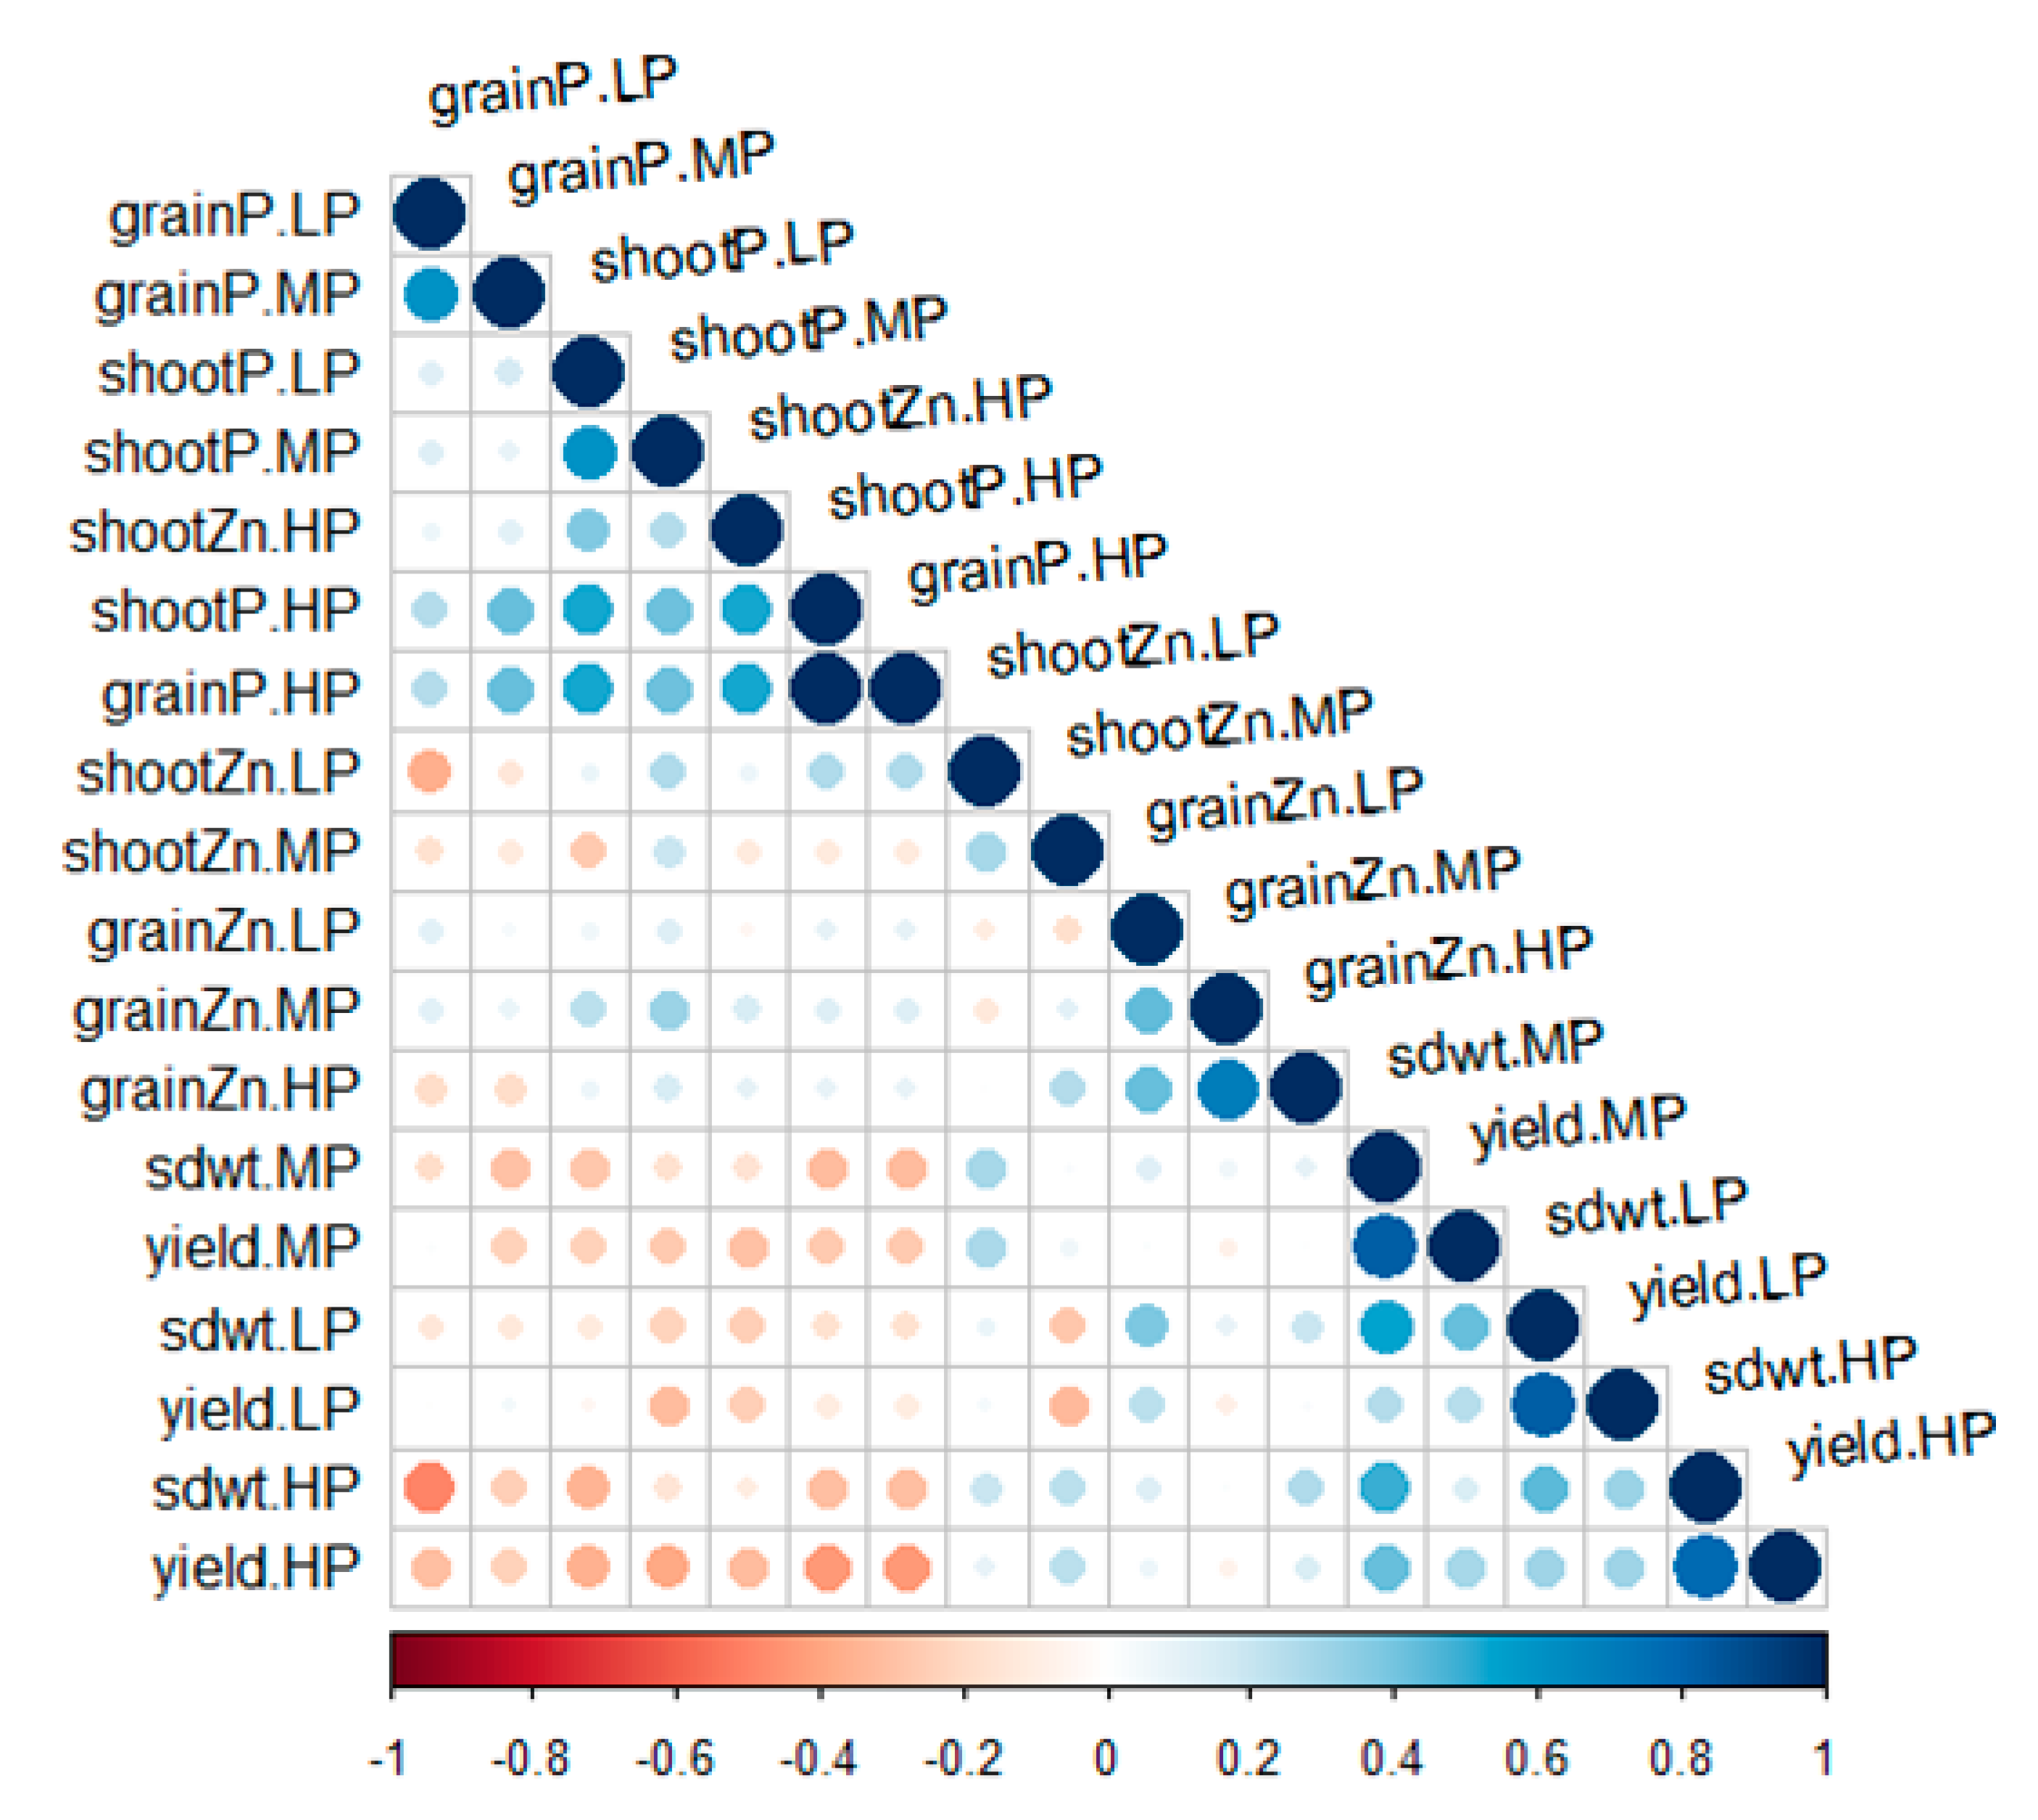
3.2. Phenotypic Association between Yield Components and Zinc Content in Cowpea

The relationships between several growth parameters and Zn content both in the screenhouse and field trials were not significant (r = 0.1–0.2) (Figure 4 and Figure 5, Supplementary Tables S5 and S6). The shoot dry weight versus shoot Zn content at HP treatment had a weak negative correlation (r = −0.1), while grain yield and grain Zn content at HP (r = 0.1) showed a weak positively significant relationship from field evaluation (Figure 5), indicating that high yield and Zn content can be combined in some genotypes since there is no strong association between the two traits that would result in a tradeoff between high yield vs. low Zn content, or vice versa. The correlation between these traits measured at the vegetative stage also showed similar weak associations (Supplementary Figure S2). This suggests that selection of genotypes with high Zn content is possible when cowpeas are grown on high soil P. This was confirmed from our analysis which identified several genotypes with high Zn content and yield under high soil P treatments (Table 3). Some genotypes (IT89KD-288, IAR-48, IT82E-18, IT97K-499-35, UCR779, and DanMisra) had higher grain yield with high Zn content at HP soil environment over other soil P rates (Table 3). Similarly, grain P and Zn (r = 0.1) were not significantly correlated at all levels of soil P treatments, indicating that no strong association exists between these traits.
Likewise, in the screenhouse experiments, shoot Zn content and shoot dry weight (shoot yield) on HP soil had higher negative association (r = −0.4) compared to the results in the field, while the shoot P and Zn content at all soil P levels had a weak and insignificant negative relationship (r = −0.1 − (0.1)) (Figure 4). Detailed correlation coefficients for these traits in both screenhouse and field experiments are presented respectively in Supplementary Tables S5 and S6. The results indicate that there are suggestive negative relationships between high soil P and yield (shoot and grain), but they are not strong enough to exclude selection of outstanding genotypes with high yield and Zn content. See Supplementary Figures S3 and S4 for scatter plots that further depict these weak relationships.

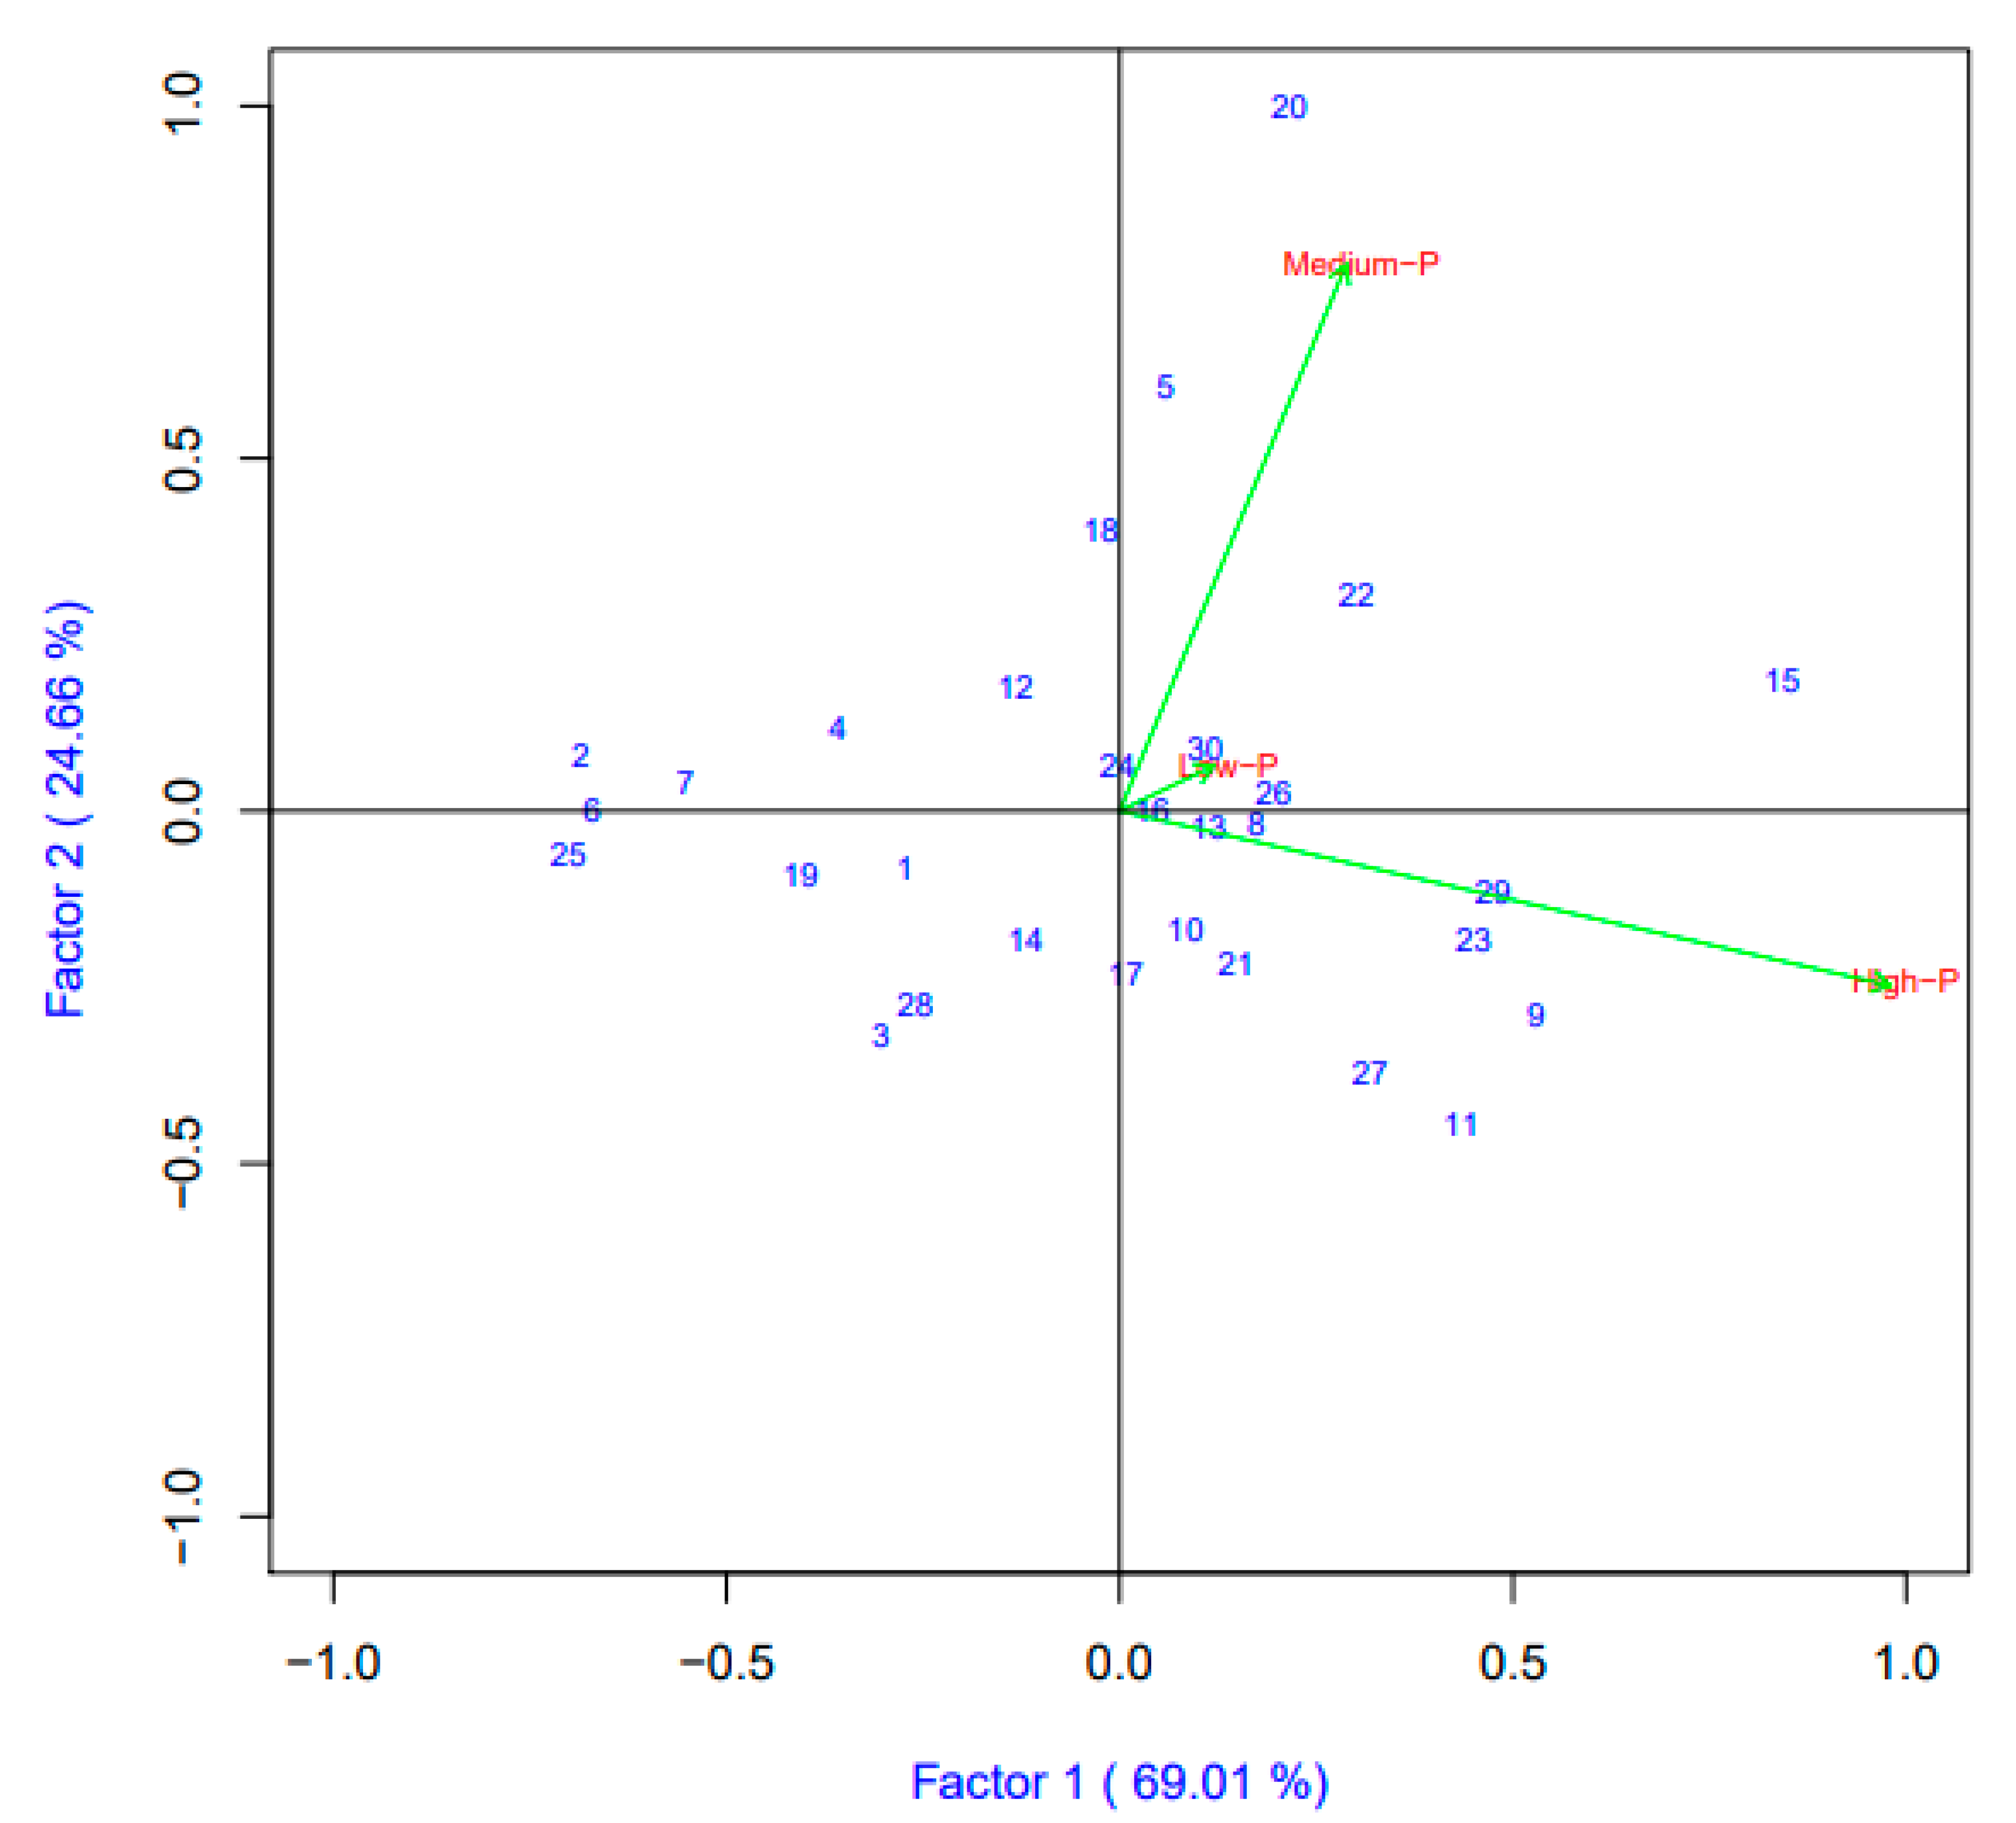
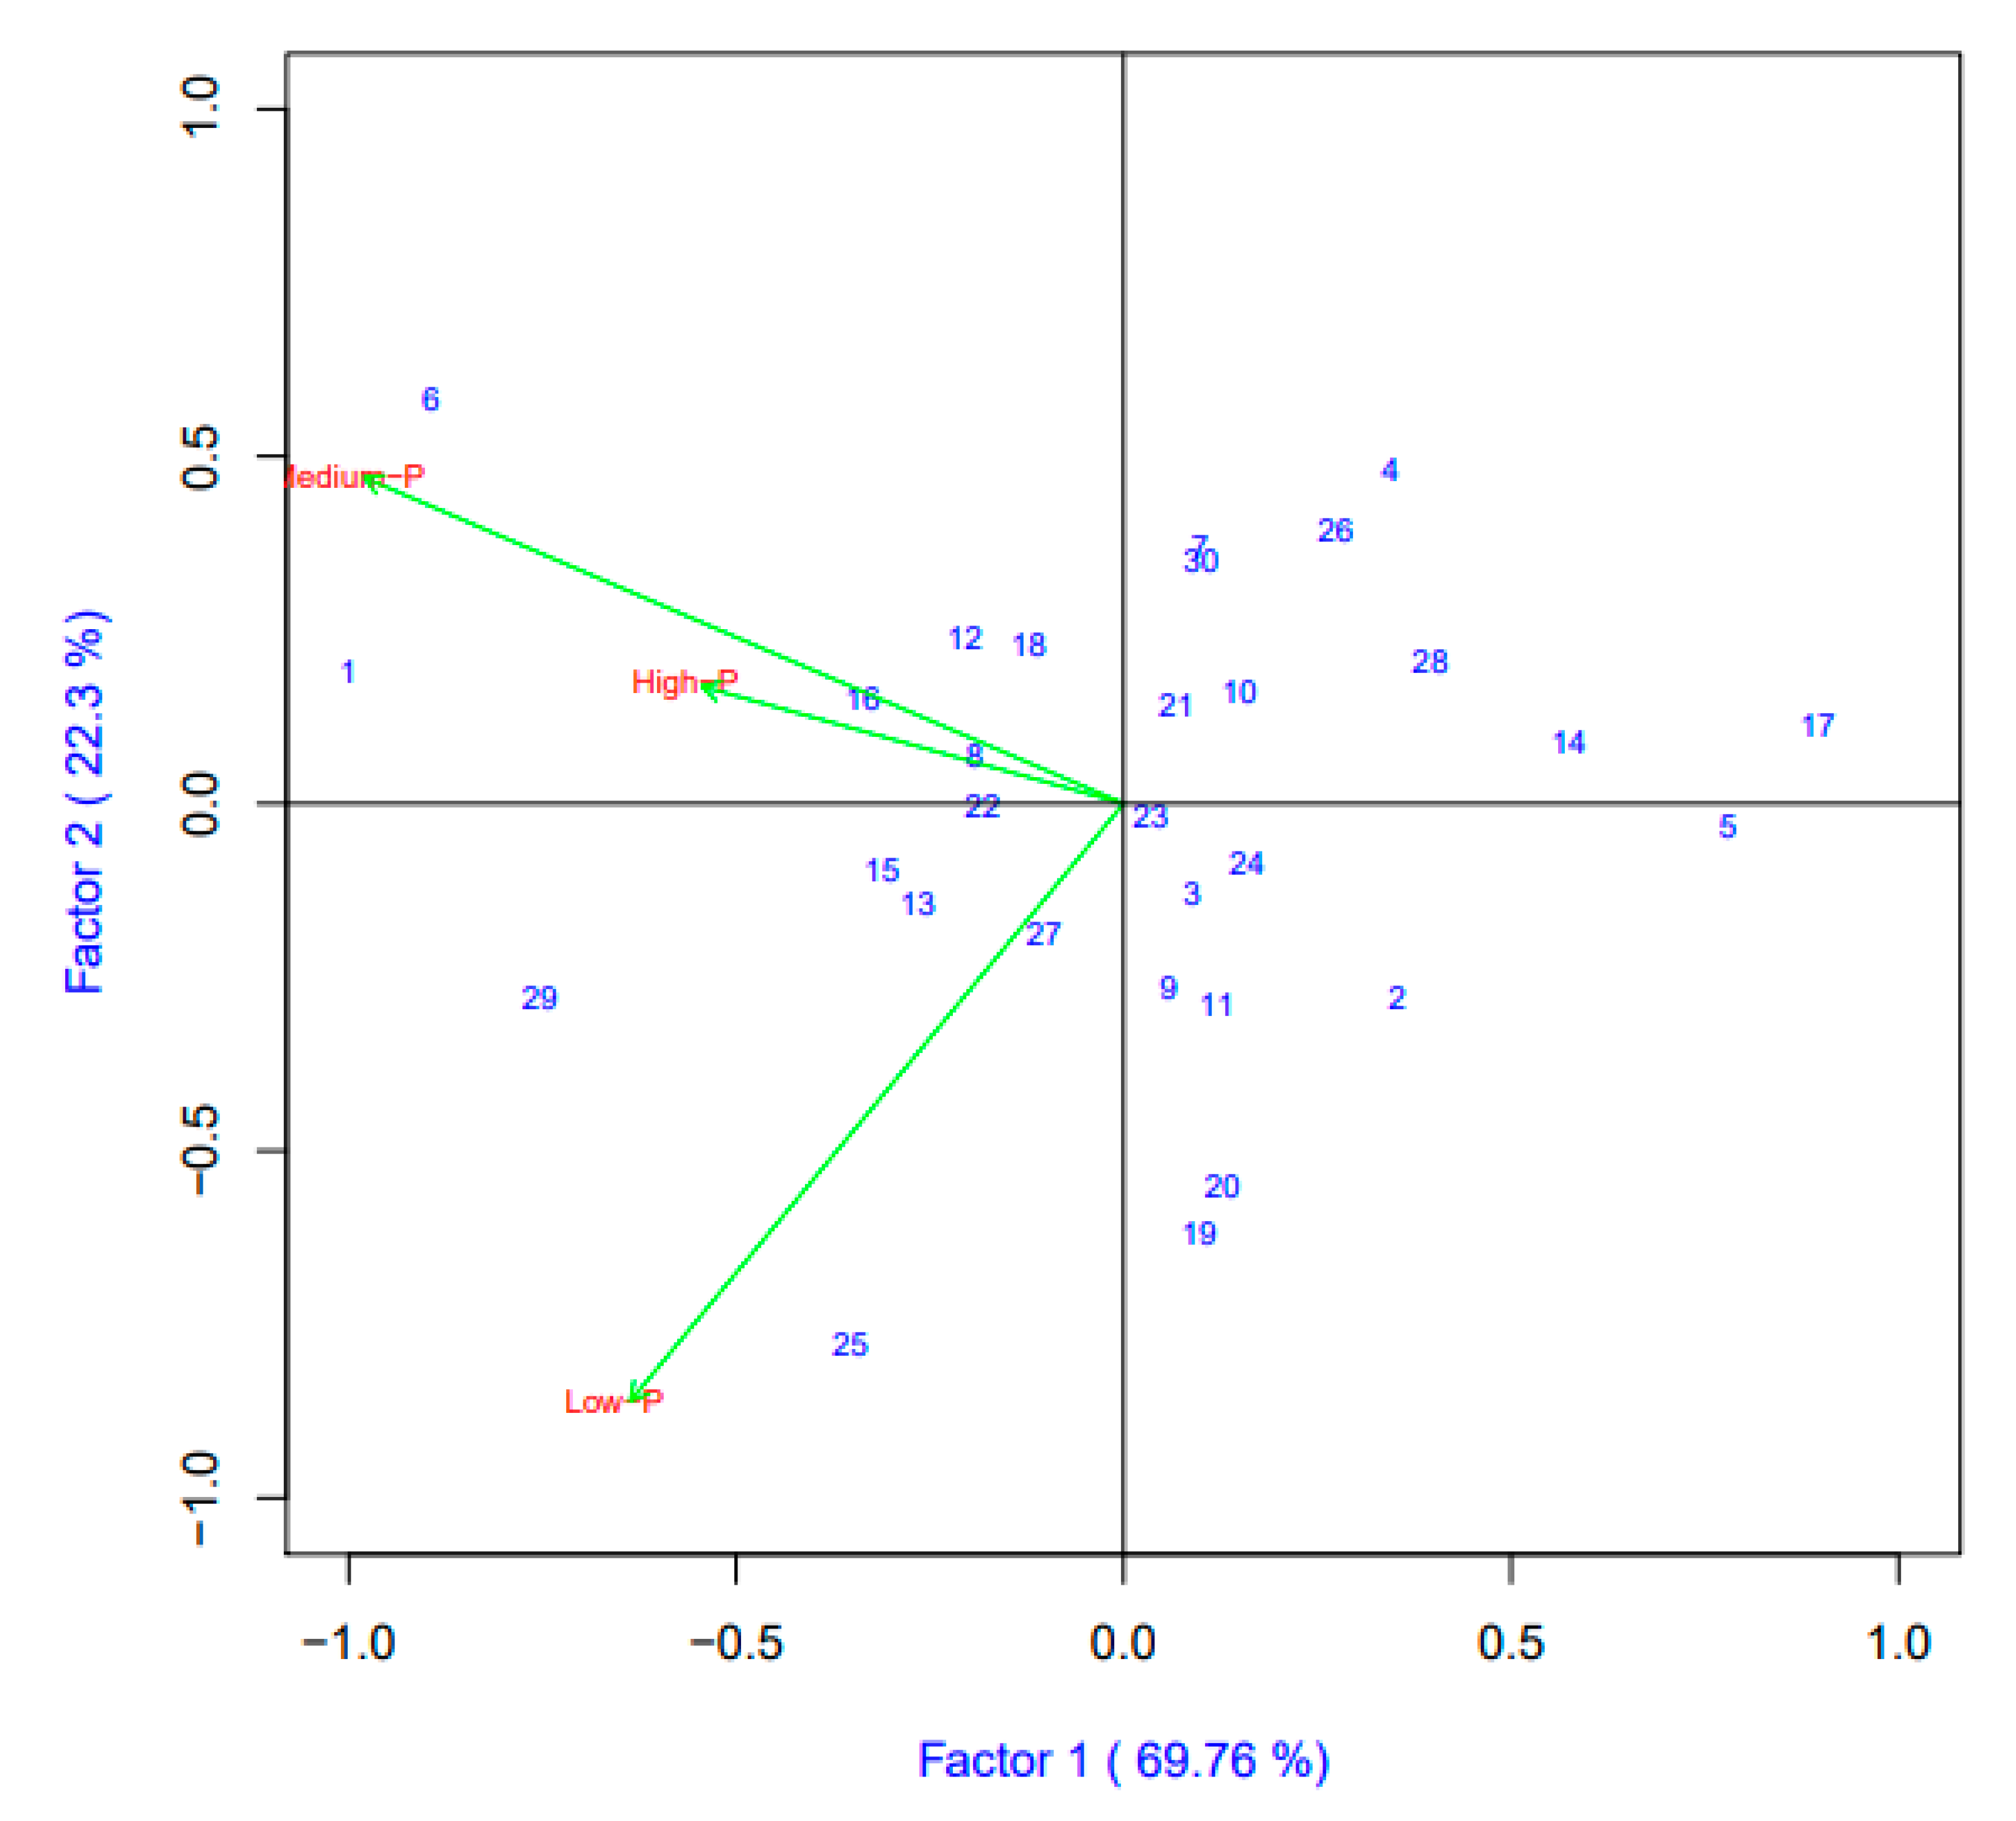
3.3. Interaction of Genotypes and Phosphorus Rates on Grain Yield and Zinc Content with Biplot Analysis

The genotype main effect plus genotype by environment (GGE) biplot analysis, where the different soil P rates were considered as distinct environments, revealed the presence of divergence between the genotypes, grain yield, and Zn content at different soil P conditions. Genotypes 8, 9, 13, 23, and 29 were the top-performing in the HP trials for grain yield, and the angle between their vectors and the HP (environment) vector was less than 90° (acute angle), while genotypes like 2, 4, 6, 7, 19, and 25 had lower grain yield below the mean and the angle of their vectors appeared to be greater than 90° (obtuse angle) (Figure 6, see Supplementary Table S1 for names of the genotypes and their corresponding entry numbers). The most stable genotypes across all the environments for the grain yield were 13, 16, 24, and 30, which are nearer to the origin of the biplots of the PC1 vs. PC2, while those genotypes that are farther away from the origin are more sensitive to the varying levels of soil P (Figure 6).
Genotypes 8, 16, and 22 were the top-performing in the HP trials with high grain Zn since the angle between their vectors and the HP vector is less than 90° (acute angle), while genotypes 2, 4, 5, 14, 17, and 26 had lower grain Zn below the mean under the HP soil since the angle of their vectors appeared to be greater than 90° (obtuse angle) (Figure 7). The most stable genotypes across all the P environments for the grain Zn were 3, 21, 22, and 23 because they are nearer to the origin of the biplots of the PC1 vs. PC2, while those genotypes that are farther away from the origin are less stable for grain Zn content across the P environments, these include genotypes 1, 4, 5, 6, 17, 25, and 29 (Figure 7). The vectors of the P environments (levels) indicated positive correlations between grain yield and Zn content because all the vectors of the P levels formed an acute angle. The level of P at HP had the highest discriminating ability, while LP had the least, as shown by the length of their vectors for grain yield, though for the grain Zn content, the LP and MP were more discriminating over the HP (Figure 6 and Figure 7).

4. Discussion

Increased performance of cowpea, as measured by indices of high dry matter yield (shoot, root, and total plant dry weight), increased content of phosphorus (P) in shoots in the screenhouse study using a sand-nutrient solution. High grain yield was observed with an increasing supply of P in the growth media in the field environment. This corroborates several earlier reports on cowpea’s response to the addition of P fertilizer under greenhouse and field conditions [27,28,29,30,41,42]. The grain Zn content of cowpea genotypes evaluated in this study showed no significant differences (p > 0.05) across the various P levels applied to the soil. This was further demonstrated by correlation analysis, where grain Zn content had a non-significant negative association (r = −0.2, p = 0.3) with the high rate of P application compared to the medium and minimal soil P rates. The negative and non-significant relationship between high soil P and Zn content indicates that there is no tradeoff between balancing greater yield and Zn content. Achieving greater yield with high P application and desired grain Zn content are not mutually exclusive. A similar report on two cowpea varieties with differential response to P fertilization showed that high P fertilization, in the absence of Zn application, was associated with Zn deficiency symptoms, even though there was no reduction in the Zn concentration in the shoots [43]. Other authors have reported that higher rates of P supplied to cowpea led to a linear increase in grain yield, P in leaves and seed, but Zn concentration was reduced in leaves [44] and grains [45]. Increasing P supply did not reduce Zn concentration of plant tissue in Brassica oleracea [46], where more shoot Zn concentration was seen in one genotype [47]. Earlier observations of increasing P levels in soil with no reduction in the Zn concentration of non-Zn-supplied plants have been reported in beans and potatoes [48], russet Burbank potato [49], and subterranean clover [50].
The association between plant P and Zn concentrations has been a topic of investigation by several researchers. Although, most agree that high P applications could lead to the development of Zn deficiency symptoms in certain crop plants, but not necessarily cause reduced Zn or P content of plant tissues [31,47,48]. In crops or genotypes where the development of Zn deficiency or reduction in Zn content because of high soil P application has been reported, providing optimum Zn nutrition in the growth medium can be used to remedy the condition. This phenomenon has been described in several publications as P-induced Zn deficiency [31,48,51]. The inverse relationship between P and grain Zn concentrations when a high rate of P is applied without Zn fertilizers supplied to the growth media has been reported in maize [52,53], wheat [54,55], common beans [56], and numerous other crops [57]. Though, contrary observations have been reported by Loneragan and Webb [31], who provide evidence of a linear relationship between the Zn and P concentrations in cereals and citrus leaves treated with superphosphate fertilizers. Increased Zn concentration with high P application in plants receiving no external supply of Zn has been documented [31]. However, some authors have opined that such observations may have been due to contamination of the superphosphate used. Nevertheless, in crops where an antagonist relationship exists between high P rates and grain Zn content, application of Zn fertilizer/nutrients have been reported to help remedy the situation [18,31,58,59,60].
In contrast to these results, we observed that a high rate of P applications had no significant effect on the Zn content of cowpea genotypes investigated and did not cause the appearance of Zn deficiency symptoms in cowpea. There are few reports on cowpea addressing the relationship between high P application and Zn content of grains or other edible parts [32]. The few reports of the plant P–Zn relationship on the crop are sometimes confusing. Oseni [61] reported decreased Zn content of cowpea plants when P was applied at high levels in the soil. While a more recent study on the impact of contrasting P rates and constant level of N fertilizers on iron and Zn contents of cowpea grains made a contrary observation. Ayeni et al. [32] observed that application of P alone at high rates does not significantly decrease the content of Zn and Fe on cowpea grains, but a combination of high P (60 kg/ha) and N was associated with reduced Zn content of the grains. The authors provided some explanation for this observation, suggesting that the lack of a decrease in Zn content when only high P rate was applied may be due to applied P being fixed in certain soil compounds. However, application of N, a known element that could enhance the early establishment of cowpea [62] and uptake of P from soil [63], may be responsible for decreased Zn content when N and P fertilizers were applied at a high level.
Several mechanisms have been proposed to explain plant P–Zn interaction in which a decrease in Zn content is observed in certain crops or genotypes when P application is at the highest level in the growth media. One of the mechanisms responsible for P-induced Zn reduction in plant tissues includes the following: First, increasing P supply to the growth medium stimulates the growth of crop plants sufficiently to dilute the concentration of Zn in plant tissues to levels that could induce a decrease in Zn availability. Second, the high P supply could suppress either absorption of Zn by roots or translocation of Zn from roots to shoots [31,57,64,65]. The lower value of grain Zn content in some genotypes at high soil P may be due to decreased diffusion of Zn in the soil colloids [57,65]. Another explanation for the high P–Zn reduced bioavailability is that, when both P and Zn are limited in soil, application of high P rates tends to promote plant growth and this could cause dilution in tissue Zn, which may further lead to reduced availability of Zn in plant tissues [31]. Such observations have led to the belief that an imbalance in the ratios of P–Zn in the growth environment may be responsible for the reduced Zn content observed in some crops/genotypes when P is applied at a high rate [43]. Some authors have also observed the highest grain Zn concentration on fields where mineral N, P fertilizers, and organic nutrient sources were applied [20].
In the present study, we observed that the “so-called” P-induced Zn reduction phenomenon may be genotype-dependent because the relationship between the increased yield due to high P application and Zn content revealed an insignificant negative association. Earlier investigations have supported this. Susceptibility to P-induced Zn deficiency was attributed to genetic differences and soil conditions in cowpea [20,43] and navy beans [51], where varieties had varying efficiency to absorb and use nutrient constituents of the soil.
Various approaches have been used to achieve greater grain yield and Zn content in soils with higher P application. These include the application of Zn fertilizers either as a foliar spray [18] or applied directly to the soil [20,53,58], improved agronomic practices such as integrated soil fertility management and intercropping, in which cereals can increase Zn bioavailability of the soil and benefit the companion legumes [20,66], adopting multiple strategies such as dietary diversification [20], which could mean supplementing cowpea meal with high micronutrient-rich crops like common beans, a legume also rich in Zn content [17,19], and cultivation of varieties with inherently high Zn concentration at any soil P rates. Other researchers [32] have recommended application of medium P rates such as 40 kg P2O5/ha even without application of Zn fertilizer to obtain high yield and Zn content in the grains [30,44,61]. Application of Zn-containing fertilizers has been observed elsewhere to increase cowpea’s grain Zn content and yield under integrated soil fertility management [20].
Ayeni et al. [32] observed that some cowpea genotypes had a high content of Zn at all levels of P, a finding similar to our observation in this study where certain genotypes such as IT82E-18, UCR779, CB46, and IT97K-556-6 had increased grain Zn content with increasing supply of P in the growth environment. This was confirmed by the GGE biplots that displayed genotypes, such as 16 (IT89KD-288), 8 (Danila), and 22 (SAMPEA-9), with high grain Zn content under high soil P fertilization, while genotypes such as 3 (58-77), 21 (SAMPEA-17), 22 (SAMPEA-9), and 23 (Sanzi) had stable grain Zn across all P levels. In this study, we identified 3 very stable high-grain Zn-containing genotypes at high soil P rate and 4 high-grain Zn genotypes across all the P levels based on site regression analysis (SREG) biplot analysis [40]. Also, genotypes with high grain yield at all P levels were identified. The use of GGE biplot analysis enabled us to visualize the genotypes and their association with the different P rates (serving as environments) using biplots, which shows genotypes that are high-performing for grain yield and grain Zn content at each P rate and those that are most stable across all P levels [32,67]. The genotypes identified with high grain Zn at a high P level should be tested in more locations to further substantiate this finding and make possible recommendations for release to farmers as high Zn varieties.

5. Conclusions

There was wide variation for the P concentration and Zn content of cowpea genotypes investigated. Increasing P fertilization leads to a significant increase in yield and concentration of P in the shoots of the cowpea materials assessed. We conclude that since no significant relationship between increased P fertilization and grain Zn content was observed and high P fertilization is related to greater yield, there is no reason to not fertilize with P at high levels. Increased grain yield under high P supply can be achieved without sacrificing desired Zn content, especially if genotypes such as IT89KD-288, IAR-48, IT97K-499-35, UCR779, CB46, IT97K-556-6, IT82E-18, and DanMisra, that do not show a negative impact of decreased grain Zn content at high rates of P, are cultivated. The high-grain Zn genotypes at high P fertilization can be used as parents in conventional or molecular plant breeding pipelines for further improvement of grain Zn content in cowpea varieties that are popularly grown in major producing areas.

Supplementary Materials

The following are available online at https://www.mdpi.com/article/10.3390/agronomy11040802/s1, Figure S1: Phenotypic distribution of traits measured in the field experiment at the vegetative stage under varying soil phosphorus levels. Box plot displays the median of each group bounded by the first and third quartile, with 1_LP = no-P application, 2_MP = 10 kg P2O5 ha−1 & 3_HP = 60 kg P2O5 ha−1. Figure S2: Correlation matrices for traits measured across varying soil phosphorus concentrations in the field experiment at the vegetative stage (n = 30 genotypes). See Table 1 for list and abbreviations of the traits. Positive and negative associations between given traits are in blue and red, respectively. The color intensity and the size of the circle are proportional to the correlation coefficients. On the X-axis of the correlogram, the legend color shows the correlation coefficients and the corresponding colors. Figure S3: Scatterplot showing weak correlations between pairs of traits from the field evaluation (a) Shoot dry weight (g) and shoot Zn content (ppm) of high phosphorus treatment, R = −0.10; P = 0.58, (b) Soil available phosphorus (mg/kg) and grain Zn content (ppm), R = −0.20, P = 0.29, (c) Grain yield (kg/ha) and grain Zn content (ppm), R = 0.13, P = 0.47, (d) Grain phosphorus (mg/kg) and grain Zn content (ppm), R = 0.02, P = 0.92. Each point represents an average of a genotype. Figure S4: Scatterplot showing weak correlations between pairs of traits from the screenhouse evaluation (a) Shoot dry weight (g) and shoot Zn content (ppm) of high phosphorus treatment, R = −0.43; P = 0.02, (b) Shoot phosphorus (mg/kg) and shoot Zn content (ppm) of high phosphorus treatment, R = −0.20, P = 0.29, (c) Root dry weight (g) and root Zn content (ppm) of high phosphorus treatment, R = −0. 30, P = 0.11, (d) Root phosphorus (mg/kg) and root Zn content (ppm) of high phosphorus treatment, R = 0.37, P = 0.04. Each point represents an average of a genotype. Table S1: List of cowpea genotypes used and their origin/source, Table S2: Formulae used for computation of relative reduction (%), phosphorus concentration, and zinc content of samples, Table S3: Means of genotypes for shoot parameters measured in the screenhouse experiment under three soil phosphorus concentrations, Table S4: Means of cowpea genotypes for shoot parameters measured in the field experiment under three soil phosphorus concentrations, Table S5: Trait correlations between dry biomass yield, P and Zn content of shoot and root of genotypes evaluated in the screenhouse under varying soil P rates, Table S6: Trait correlations between grain yield, P and Zn content of shoot and grain of genotypes evaluated in the field under varying soil P rates.

Author Contributions

Conceptualization, S.B.M., D.K.D., M.F.I., P.B.T., and V.G.; formal analysis, investigation, writing—original draft preparation, S.B.M.; writing—review and editing, S.B.M., D.K.D., A.Y., M.L.U., M.F.I., P.B.T., and V.G.; supervision, D.K.D., M.F.I., P.B.T., and V.G.; funding acquisition, S.B.M. All authors have read and agreed to the published version of the manuscript.

Funding

This research was partly funded by the Bill and Melinda Gates Foundation through the Program for Emerging Agricultural Research Leaders (PEARL II) to the Ahmadu Bello University, Nigeria, grant number “OPP1131397/INV-009560”, and The APC was funded by (OPP1131397/INV-009560).

Institutional Review Board Statement

Not applicable.

Informed Consent Statement

Not applicable.

Data Availability Statement

The data presented in this study are available within the article and as Supplementary Material.

Acknowledgments

The present study was part of the PhD thesis of the first author. The first author acknowledges the West Africa Agricultural Productivity Programme (WAAPP-Nigeria, a World Bank Supported Intervention) for funding part of his PhD work. The authors are thankful to the team of Technicians at the Cowpea Breeding Unit of the Institute for Agricultural Research Ahmadu Bello University, Nigeria, for their assistance in conducting the experiments. The authors are grateful to James D. Burridge and Mustafa Jibirn Ojonuba for their insightful comments.

Conflicts of Interest

The authors declare no conflict of interest.

References

  1. White, P.J.; Broadley, M.R. Biofortification of crops with seven mineral elements often lacking in human diets - iron, zinc, copper, calcium, magnesium, selenium and iodine. New Phytol. 2009, 182, 49–84. [Google Scholar] [CrossRef]
  2. Philipo, M.; Ndakidemi, P.A.; Mbega, E.R. Environmental and genotypes influence on seed iron and zinc levels of landraces and improved varieties of common bean (Phaseolus vulgaris L.) in Tanzania. Ecol. Genet. Genom. 2020, 15, 100056. [Google Scholar] [CrossRef]
  3. Hambidge, M. Human Zinc Deficiency. J. Nutr. 2000, 130, 1344S–1349S. [Google Scholar] [CrossRef]
  4. Brown, K.H.; Wuehler, S.E.; Peerson, J.M. The importance of zinc in human nutrition and estimation of the global prevalence of zinc defi ciency. Food Nutr. Bull. 2001, 22, 13. [Google Scholar] [CrossRef] [Green Version]
  5. Deshpande, J.D.; Joshi, M.M.; Giri, P.A. Zinc in Human Nutrition And Health 1. Int. J. Med. Sci. Public Health 2013, 2. [Google Scholar] [CrossRef] [Green Version]
  6. Abate, T.; Alene, A.D.; Bergvinson, D.; Shiferaw, B.; Silim, S.; Orr, A.; Asfaw, S. Tropical Grain Legumes in Africa and South Asia: Knowledge and Opportunities; International Crops Research Institute for the Semi-Arid Tropics; ICRISAT-Nairobi: Nairobi City, Kenya, 2011. [Google Scholar]
  7. Boukar, O.; Belko, N.; Chamarthi, S.; Togola, A.; Batieno, J.; Owusu, E.; Haruna, M.; Diallo, S.; Umar, M.L.; Olufajo, O.; et al. Cowpea (Vigna unguiculata): Genetics, genomics and breeding. Plant Breed. 2018, 1–10. [Google Scholar] [CrossRef] [Green Version]
  8. Langyintuo, A.S.; Lowenberg-Deboer, J.; Faye, M.; Lambert, D.; Ibro, G.; Moussa, B.; Kergna, A.; Kushwaha, S.; Musa, S.; Ntoukam, G. Cowpea supply and demand in West and Central Africa. Field Crop. Res. 2003, 82, 215–231. [Google Scholar] [CrossRef]
  9. Phillips, R.D.; Mcwatters, K.H.; Chinnan, M.S.; Hung, Y.-C.; Beuchat, L.R.; Sefa-Dedeh, S.; Sakyi-Dawson, E.; Ngoddy, P.; Nnanyelugo, D.; Enwere, J.; et al. Utilization of cowpeas for human food. Field Crop. Res. 2003, 82, 193–213. [Google Scholar] [CrossRef]
  10. Samireddypalle, A.; Boukar, O.; Grings, E.; Fatokun, C.A.; Kodukula, P.; Devulapalli, R.; Okike, I.; Blümmel, M. Cowpea and Groundnut Haulms Fodder Trading and Its Lessons for Multidimensional Cowpea Improvement for Mixed Crop Livestock Systems in West Africa. Front. Plant Sci. 2017, 08, 30. [Google Scholar] [CrossRef] [Green Version]
  11. Snapp, S.; Rahmanian, M.; Batello, C. Pulse Crops for Sustainable Farms in Sub-Saharan Africa; FAO: Rome, Italy, 2018. [Google Scholar]
  12. Horn, L.; Shimelis, H.; Laing, M. Participatory appraisal of production constraints, preferred traits and farming system of cowpea in the northern Namibia: Implications for breeding. Legum. Res. 2014, 38, 691–700. [Google Scholar] [CrossRef] [Green Version]
  13. Magani, I.E.; Kuchinda, C. Effect of phosphorus fertilizer on growth, yield and crude protein content of cowpea (Vigna unguiculata [L.] Walp) in Nigeria. J. Appl. Biosci. 2009, 23, 1387–1393. [Google Scholar]
  14. Mohammed, S.B.; Mohammad, I.F.; Pangirayi, T.B.; Vernon, G.; Dzidzienyo, D.K.; Umar, M.L.; Umar, S. Farmers’ knowledge, perception, and use of phosphorus fertilization for cowpea production in Northern Guinea Savannah of Nigeria. Heliyon 2020, 6. [Google Scholar] [CrossRef]
  15. Genc, Y.; Humphries, J.M.; Lyons, G.H.; Graham, R.D. Exploiting genotypic variation in plant nutrient accumulation to alleviate micronutrient deficiency in populations. J. Trace Elem. Med. Biol. 2005, 18, 319–324. [Google Scholar] [CrossRef] [PubMed]
  16. Gonçalves, A.; Goufo, P.; Barros, A.; Domínguez-Perles, R.; Trindade, H.; Rosa, E.A.S.; Ferreira, L.; Rodrigues, M. Cowpea (Vigna unguiculata L. Walp), a renewed multipurpose crop for a more sustainable agri-food system: Nutritional advantages and constraints: Nutritional aptitude of cowpea. J. Sci. Food Agric. 2016, 96, 2941–2951. [Google Scholar] [CrossRef] [PubMed]
  17. Cichy, K.A.; Caldas, G.V.; Snapp, S.S.; Blair, M.W. QTL Analysis of Seed Iron, Zinc, and Phosphorus Levels in an Andean Bean Population. Crop Sci. 2009, 49. [Google Scholar] [CrossRef] [Green Version]
  18. Zhang, Y.-Q.; Deng, Y.; Chen, R.-Y.; Cui, Z.-L.; Chen, X.-P.; Yost, R.; Zhang, F.-S.; Zou, C.-Q. The reduction in zinc concentration of wheat grain upon increased phosphorus-fertilization and its mitigation by foliar zinc application. Plant Soil 2012, 361, 143–152. [Google Scholar] [CrossRef]
  19. Blair, M.W.; Medina, J.I.; Astudillo, C.; Rengifo, J.; Beebe, S.E.; Machado, G.; Graham, R. QTL for seed iron and zinc concentration and content in a Mesoamerican common bean (Phaseolus vulgaris L.) population. Theor. Appl. Genet. 2010, 121, 1059–1070. [Google Scholar] [CrossRef]
  20. Manzeke, M.G.; Mtambanengwe, F.; Nezomba, H.; Watts, M.J.; Broadley, M.R.; Mapfumo, P. Zinc fertilization increases productivity and grain nutritional quality of cowpea (Vigna unguiculata [L.] Walp.) under integrated soil fertility management. Field Crop. Res. 2017, 213, 231–244. [Google Scholar] [CrossRef]
  21. White, P.J.; Broadley, M.R. Biofortifying crops with essential mineral elements. Trends Plant Sci. 2005, 10, 586–593. [Google Scholar] [CrossRef]
  22. Gaddameedi, A.; Ravikiran, K.T.; Mohammed, R.; Phuke, R.M.; Sadaiah, K.; Kavi Kishor, P.B.; Ashok Kumar, A. Inheritance studies on grain iron and zinc concentration and agronomic traits in sorghum [Sorghum bicolor (L.) Moench]. J. Cereal Sci. 2018, 83, 252–258. [Google Scholar] [CrossRef]
  23. ICRISAT. Enhancing Cowpea Productivity and Production in Drought-Prone Areas of Sub-Saharan Africa; ICRISAT: Patancheruvu, India, 2017. [Google Scholar]
  24. Olufajo, O.O.; Singh, B.B. Advances in cowpea cropping systems research. In Challenges and Opportunities for Enhancing Sustainable Cowpea Production; Fatokun, C.A., Tarawali, S.A., Singh, B.B., Kormawa, P.M., Tamò, M., Eds.; International Institute of Tropical Agriculture, IITA: Ibadan, Nigeria, 2002; pp. 267–277. [Google Scholar]
  25. Simpson, R.J.; Oberson, A.; Culvenor, R.A.; Ryan, M.H.; Veneklaas, E.J.; Lambers, H.; Lynch, J.P.; Ryan, P.R.; Delhaize, E.; Smith, F.A.; et al. Strategies and agronomic interventions to improve the phosphorus-use efficiency of farming systems. Plant Soil 2011, 349, 89–120. [Google Scholar] [CrossRef]
  26. Oladiran, O.; Olajire, F.; Abaidoo, R.C.; Nnenna, I. Phosphorus Response Efficiency in Cowpea Genotypes. J. Agric. Sci. 2012, 4, 81–90. [Google Scholar] [CrossRef]
  27. Sanginga, N.; Lyasse, O.; Singh, B.B. Phosphorus use efficiency and nitrogen balance of cowpea breeding lines in a low P soil of the derived savanna zone in West Africa. Plant Soil 2000, 220, 119–128. [Google Scholar] [CrossRef]
  28. Gyan-Ansah, S.; Adu-Dapaah, H.; Kumaga, F.; Gracen, V.; Nartey, F.K.K. Evaluation of cowpea (Vigna unguiculata L. Walp.) genotypes for phosphorus use efficiency. Acta Hortic. 2016, 373–380. [Google Scholar] [CrossRef]
  29. Adusei, G.; Gaiser, T.; Boukar, O.; Fatokun, C. Growth and yield responses of cowpea genotypes to soluble and rock P fertilizers on acid, highly weathered soil from humid tropical West Africa. Int. J. Biol. Chem. Sci. 2016, 10, 1493–1507. [Google Scholar] [CrossRef] [Green Version]
  30. Saidou, A.K.; Singh, B.B.; Abaidoo, R.C.; Iwuafor, E.N.O.; Sanginga, N. Response of cowpea lines to low Phosphorus tolerance and response to external application of P. Afr. J. Microbiol. Res. 2012, 6, 5479–5485. [Google Scholar] [CrossRef]
  31. Loneragan, J.F.; Webb, M.J. Interactions Between Zinc and Other Nutrients Affecting the Growth of Plants. In Zinc in Soils and Plants; Robson, A.D., Ed.; Springer Netherlands: Dordrecht, The Netherlands, 1993; pp. 119–134. [Google Scholar]
  32. Ayeni, D.F.; Ikwebe, J.; Onyezili, F.N. Iron and zinc levels in Vigna unguiculata (L.) Walp under varying phosphorus and fixed nitrogen treatment conditions. Food Energy Secur. 2018, 7, e00141. [Google Scholar] [CrossRef]
  33. Santos, C.A.F.; Boiteux, L.S. Breeding biofortifed cowpea lines for semi-arid tropical areas by combining higher seed protein and mineral levels. Genet. Mol. Res. 2013, 12, 6782–6789. [Google Scholar] [CrossRef] [PubMed]
  34. Ashok Kumar, A.; Reddy, B.V.S.; Ramaiah, B.; Sahrawat, K.L.; Pfeiffer, W.H. Gene effects and heterosis for grain iron and zinc concentration in sorghum [Sorghum bicolor (L.) Moench]. Field Crop. Res. 2013, 146, 86–95. [Google Scholar] [CrossRef] [Green Version]
  35. Huynh, B.-L.; Ehlers, J.D.; Close, T.J.; Cis, N.; Drabo, I.; Boukar, O.; Lucas, M.R.; Wanamaker, S.; Pottorff, M.; Roberts, P.A. Enabling Tools for Modern Breeding of Cowpea for Biotic Stress Resistance. In Translational Genomics for Crop Breeding, Volume I: Biotic Stress; Varshney, R.K., Tuberosa, R., Eds.; John Wiley & Sons, Inc.: Hoboken, NJ, USA, 2013; pp. 183–199. [Google Scholar]
  36. Boukar, O.; Fatokun, C.A.; Huynh, B.-L.; Roberts, P.A.; Close, T.J. Genomic Tools in Cowpea Breeding Programs: Status and Perspectives. Front. Plant Sci. 2016, 7, 1–13. [Google Scholar] [CrossRef] [Green Version]
  37. Muñoz-Amatriaín, M.; Mirebrahim, H.; Xu, P.; Wanamaker, S.I.; Luo, M.C.; Alhakami, H.; Alpert, M.; Atokple, I.; Batieno, B.J.; Boukar, O.; et al. Genome resources for climate-resilient cowpea, an essential crop for food security. Plant J. 2017, 89, 1042–1054. [Google Scholar] [CrossRef] [Green Version]
  38. Bationo, A.; Ntare, B.R.; Tarawali, S.A.; Tabo, R. Soil fertility management and cowpea production in the semiarid tropics. In Challenges and Opportunities for Enhancing Sustainable Cowpea Production; Fatokun, C.A., Tarawali, S.A., Singh, B.B., Kormawa, P.M., Tamo, M., Eds.; International Institute of Tropical Agriculture, IITA: Ibadan, Nigeria, 2002; pp. 301–318. [Google Scholar]
  39. Rothe, C.J. Breeding for Tolerance of Cowpea to Low Phosphorus Soil Conditions through Physiological and Genetic Studies. Ph.D. Thesis, Texas A&M University, College Station, TX, USA, 2014. [Google Scholar]
  40. Pacheco, Á.; Vargas, M.; Alvarado, G.; Rodríguez, F.; Crossa, J.; Burgueño, J. GEA-R (Genotype x Environment Analysis with R for Windows); Version 4.1; CIMMYT: Mexico City, Mexico, 2015. [Google Scholar]
  41. Kolawole, G.O.; Tian, G.; Singh, B.B. Differential response of cowpea lines to aluminum and phosphorus application. J. Plant Nutr. 2008, 23, 731–740. [Google Scholar] [CrossRef]
  42. Krasilnikoff, G.; Gahoonia, T.; Nielsen, N.E. Variation in phosphorus uptake efficiency by genotypes of cowpea (Vigna unguiculata) due to differences in root and root hair length and induced rhizosphere processes. Plant Soil 2003, 251, 83–91. [Google Scholar] [CrossRef]
  43. Safaya, N.M.; Singh, B. Differential susceptibility of two varieties of cowpea (Vigna unguiculata (L) Walp) to phosphorus-induced zinc deficiency. Plant Soil 1977, 48, 279–290. [Google Scholar] [CrossRef]
  44. Benvindo, R.N.; Prado, R.D.M.; Nóbrega, J.C.A.; Flores, R.A. Phosphorus Fertilization on the Nutrition and Yield of Cowpea Grown in an Arenosols. J. Agric. Environ. Sci 2014, 14, 434–439. [Google Scholar] [CrossRef]
  45. Nyoki, D.; Ndakidemi, P.A. Influence of Bradyrhizobium japonicum and Phosphorus on Micronutrient Uptake in Cowpea. A Case Study of Zinc (Zn), Iron (Fe), Copper (Cu) and Manganese (Mn). Am. J. Plant Sci. 2014, 5, 427–435. [Google Scholar] [CrossRef] [Green Version]
  46. Pongrac, P.; Fischer, S.; Thompson, J.A.; Wright, G.; White, P.J. Early Responses of Brassica oleracea Roots to Zinc Supply Under Sufficient and Sub-Optimal Phosphorus Supply. Front. Plant Sci. 2020, 10. [Google Scholar] [CrossRef] [PubMed]
  47. Pongrac, P.; Castillo-Michel, H.; Reyes-Herrera, J.; Hancock, R.D.; Fischer, S.; Kelemen, M.; Thompson, J.A.; Wright, G.; Likar, M.; Broadley, M.R.; et al. Effect of phosphorus supply on root traits of two Brassica oleracea L. genotypes. BMC Plant Biol. 2020, 20, 368. [Google Scholar] [CrossRef]
  48. Boawn, L.C.; Brown, J.C. Further Evidence for a P-Zn Imbalance in Plants. Soil Sci. Soc. Am. J. 1968, 32, 94–97. [Google Scholar] [CrossRef]
  49. Boawn, L.C.; Leggett, G.E. Phosphorus and Zinc Concentrations in Russet Burbank Potato Tissues in Relation to Development of Zinc Deficiency Symptoms. Soil Sci. Soc. Am. J. 1964, 28, 229–232. [Google Scholar] [CrossRef]
  50. Millikan, C. Effects of different levels of zinc and phosphorus on the growth of subterranean clover (Trifolium subterraneum L.). Aust. J. Agric. Res. 1963, 14, 180–205. [Google Scholar] [CrossRef]
  51. Ambler, J.E.; Brown, J.C. Cause of Differential Susceptibility to Zinc Deficiency in Two Varieties of Navy Beans (Phaseolus vulgaris L.). Agron. J. 1969, 61, 41–43. [Google Scholar] [CrossRef]
  52. Bogdanovic, D.; Ubavic, M.; Cuvardic, M. Effect of phosphorus fertilization on Zn and Cd contents in soil and corn plants. Nutr. Cycl. Agroecosyst. 1999, 54, 49–56. [Google Scholar] [CrossRef]
  53. Imran, M.; Rehim, A.; Sarwar, N.; Hussain, S. Zinc bioavailability in maize grains in response of phosphorous-zinc interaction. J. Plant Nutr. Soil Sci. 2016, 179, 60–66. [Google Scholar] [CrossRef]
  54. Ova, E.A.; Kutman, U.B.; Ozturk, L.; Cakmak, I. High phosphorus supply reduced zinc concentration of wheat in native soil but not in autoclaved soil or nutrient solution. Plant Soil 2015, 393, 147–162. [Google Scholar] [CrossRef]
  55. Ryan, M.H.; McInerney, J.K.; Record, I.R.; Angus, J.F. Zinc bioavailability in wheat grain in relation to phosphorus fertiliser, crop sequence and mycorrhizal fungi. J. Sci. Food Agric. 2008, 88, 1208–1216. [Google Scholar] [CrossRef]
  56. Singh, J.P.; Karamanos, R.E.; Stewart, J.W.B. The mechanism of phosphorus-induced zinc deficiency in bean (Phaseolus vulgaris L.). Can. J. Soil Sci. 1988, 68, 345–358. [Google Scholar] [CrossRef]
  57. Fageria, V.D. Nutrient interactions in crop plants. J. Plant Nutr. 2001, 24, 1269–1290. [Google Scholar] [CrossRef]
  58. Liu, D.-Y.; Zhang, W.; Liu, Y.-M.; Chen, X.-P.; Zou, C.-Q. Soil Application of Zinc Fertilizer Increases Maize Yield by Enhancing the Kernel Number and Kernel Weight of Inferior Grains. Front. Plant Sci. 2020, 11, 188. [Google Scholar] [CrossRef]
  59. Rose, T.J.; Impa, S.M.; Rose, M.T.; Pariasca-Tanaka, J.; Mori, A.; Heuer, S.; Johnson-Beebout, S.E.; Wissuwa, M. Enhancing phosphorus and zinc acquisition efficiency in rice: A critical review of root traits and their potential utility in rice breeding. Ann. Bot. 2013, 112, 331–345. [Google Scholar] [CrossRef] [Green Version]
  60. Qaswar, M.; Hussain, S.; Rengel, Z. Zinc fertilisation increases grain zinc and reduces grain lead and cadmium concentrations more in zinc-biofortified than standard wheat cultivar. Sci. Total Environ. 2017, 605–606, 454–460. [Google Scholar] [CrossRef]
  61. Oseni, T.O. Growth and zinc uptake of sorghum and cowpea in response to phosphorus and zinc fertilization. World J. Agric. Sci. 2009, 5, 670–674. [Google Scholar]
  62. Abdul Rahman, N.; Larbi, A.; Kotu, B.; Marthy Tetteh, F.; Hoeschle-Zeledon, I. Does Nitrogen Matter for Legumes? Starter Nitrogen Effects on Biological and Economic Benefits of Cowpea (Vigna unguiculata L.) in Guinea and Sudan Savanna of West Africa. Agronomy 2018, 8, 120. [Google Scholar] [CrossRef] [Green Version]
  63. Ngwene, B.; George, E.; Claussen, W.; Neumann, E. Phosphorus uptake by cowpea plants from sparingly available or soluble sources as affected by nitrogen form and arbuscular-mycorrhiza-fungal inoculation. J. Plant Nutr. Soil Sci. 2010, 173, 353–359. [Google Scholar] [CrossRef]
  64. Nishigaki, T.; Tsujimoto, Y.; Rinasoa, S.; Rakotoson, T.; Andriamananjara, A.; Razafimbelo, T. Phosphorus uptake of rice plants is affected by phosphorus forms and physicochemical properties of tropical weathered soils. Plant Soil 2019, 435, 27–38. [Google Scholar] [CrossRef] [Green Version]
  65. Amin, S.; Che, F.I.; Hanafi, M.M.; Hamed, Z.; Zaharah, A.R. Phosphorus and Zinc Uptake and Their Interaction Effect on Dry Matter and Chlorophyll Content of Sweet Corn (Zea mays var. Saccharat). J. Agron. 2013, 12, 187–192. [Google Scholar]
  66. Xue, Y.; Xia, H.; Christie, P.; Zhang, Z.; Li, L.; Tang, C. Crop acquisition of phosphorus, iron and zinc from soil in cereal/legume intercropping systems: A critical review. Ann. Bot. 2016, 117, 363–377. [Google Scholar] [CrossRef]
  67. Ukalski, K.; Klisz, M. Application of GGE biplot graphs in multi-environment trials on selection of forest trees. Folia For. Pol. Ser. A 2016, 58, 228–239. [Google Scholar] [CrossRef]
Figure 1. Phenotypic distribution of traits measured in the screenhouse under varying soil phosphorus levels. Box plot displays the median of each group bounded by the first and third quartile, where the X-axis is soil phosphorus concentrations. 1_LP = no-P application, 2_MP = 1.5 mg P kg−1, and 3_HP = 30 mg P kg−1 added to Hoagland nutrient solution used for watering the plants. Letters above each box plot denote similarity among groups as per Tukey’s honestly significant difference comparison test (α ≤ 0.05). Means with the same letter are not significantly different.
Agronomy 11 00802 g001
Figure 2. Phenotypic distribution of growth and yield parameters measured in the field under varying soil phosphorus levels. Box plot displays the median of each group bounded by the first and third quartile, where the X-axis is soil phosphorus concentrations, with 1_LP = no-P application, 2_MP = 10 kg P2O5 ha−1, and 3_HP = 60 kg P2O5 ha−1. Letters above each box plot denote similarity among groups as per Tukey’s honestly significant difference comparison test (α ≤ 0.05). Means with the same letter are not significantly different.
Agronomy 11 00802 g002
Figure 3. Phenotypic distribution of phosphorus (P) and zinc (Zn) contents of shoot, root, and grains from the field environment under varying soil phosphorus levels. Box plot displays the median of each group bounded by the first and third quartile, where the X-axis is soil phosphorus concentrations, with 1_LP = no-P application, 2_MP = 10 kg P2O5 ha−1, and 3_HP = 60 kg P2O5 ha−1. Letters above each box plot denote similarity among groups as per Tukey’s honestly significant difference comparison test (α ≤ 0.05). Means with the same letter are not significantly different.
Agronomy 11 00802 g003
Figure 4. Correlation matrices for traits measured across varying soil phosphorus levels in the screenhouse (n = 30 genotypes). Positive and negative associations between given traits are in blue and red, respectively. The color intensity and the size of the circle are proportional to the correlation coefficients. On the X-axis of the correlogram, the legend color shows the correlation coefficients and the corresponding colors. LP = low phosphorus (no-P application), MP = medium phosphorus (1.5 mg P kg−1), and HP = high phosphorus (30 mg P kg−1). See Table 1 for list and abbreviations of the traits.
Agronomy 11 00802 g004
Figure 5. Correlation matrices for traits measured across varying soil phosphorus levels in the field (n = 30 genotypes). Positive and negative associations between given traits are in blue and red, respectively. The color intensity and the size of the circle are proportional to the correlation coefficients. On the X-axis of the correlogram, the legend color shows the correlation coefficients and the corresponding colors. LP = no P2O5 application, MP = 10 kg P2O5P ha−1, and High P = 60 kg P2O5 ha−1 for P field evaluation. See Table 1 for list and abbreviations of the traits.
Agronomy 11 00802 g005
Figure 6. Genotype main effect plus Genotype by Environment (GGE) biplot showing the grain yield of the genotypes at varying soil P levels. Factors 1 and 2 are the principal component axis. Low-P = no P application of P2O5, Medium-P = 10 kg P2O5 ha−1, and High-P = 60 kg P2O5 ha−1 for field evaluation.
Agronomy 11 00802 g006
Figure 7. Genotype main effect plus Genotype by Environment (GGE) biplot displaying the genotypes for grain Zn content at varying soil P levels. Factors 1 and 2 are the principal component axis. Low-P = no P application of P2O5, Medium-P = 10 kg P2O5 ha−1, and High-P = 60 kg P2O5 ha−1 for field evaluation.
Agronomy 11 00802 g007
Table 1. List of trait names with their abbreviation and definitions.
TraitsDefinition and Abbreviations
Grain yield, kg/haGrain yield in kg per hectare from the low, medium, and high phosphorus treatments (yield.LP, yield.MP, and yield.HP)
Grain phosphorus concentration, mg/kg Phosphorus concentration determined from grain samples from the low, medium, and high phosphorus treatments (grainP.LP, grainP.MP, and grainP.HP)
Grain zinc content, ppmThe zinc content of grain samples from the low, medium, and high phosphorus treatments (grainZn.LP, grainZn.MP, and grainZn.HP)
Plant height, cmThe height of the plant measured in centimeters from the soil surface to the base of the top leaf on the main stem (average per genotype) (pht.LP, pht.MP, and pht.HP)
Root dry weight, gramWeight of dry root, per plot of low, medium, and high phosphorus treatments (rdwt.LP, rdwt.MP, and rdwt.HP)
Root phosphorus concentration, mg/kgPhosphorus concentration determined from root samples from the low, medium, and high phosphorus treatments (rootP.LP, rootP.MP, and rootP.HP)
Root zinc content, ppmThe zinc content of root samples from the low, medium, and high phosphorus treatments (rootZn.LP, rootZn.MP, and rootZn.HP)
Shoot dry weight, gramWeight of dry shoot, per plot of low, medium, and high phosphorus treatments (sdwt.LP, sdwt.MP, and sdwt.HP)
Shoot phosphorus concentration, mg/kgPhosphorus concentration determined from shoot samples from the low, medium, and high phosphorus treatments (shootP.LP, shootP.MP, and shootP.HP)
Shoot zinc content, ppmThe zinc content of shoot samples from the low, medium, and high phosphorus treatments (shootZn.LP, shootZn.MP, and shootZn.HP)
Soil phosphorus content, mg/kgPlant available phosphorus from the low, medium, and high phosphorus plots (soilP.LP, soilP.MP, and soil.P.HP), determined using the Bray-I method
Table 2. Relative difference (RD) in performance of high phosphorus treatment relative to low phosphorus on some traits measured in the screenhouse and field conditions.
ScreenhouseField
Phosphorus LevelsPht (cm)Sdwt (g)ShootP (mg/kg)ShootZn (ppm)Sdwt (g)ShootP (mg/kg)ShootZn (ppm)Yield (kg/ha)GrainP (mg/kg)GrainZn (ppm)
LP14.50.4942.470.720.61132.4103.9294.12106.834.3
MP14.30.51054.173.438.91162.996.8558.92286.431.5
HP22.22.21275.968.394.51183.788.71406.62368.229.3
RD (%)34.681.826.1−3.578.24.3−17.179.111.0−17.1
LP = low phosphorus (no-P application), MP = medium phosphorus (1.5 mg P kg−1), and HP = high phosphorus (30 mg P kg−1) for river-sand in the screenhouse, and MP = 10 kg P2O5 ha−1 and High P = 60 kg P2O5 ha−1 for field evaluation, where Pht = plant height (cm) at maturity, Sdwt = shoot dry weight (g), P = phosphorus concentration, Zn = zinc content, and RD = relative difference (%).
Table 3. Mean performance of representative genotypes with higher shoot dry weight, grain yield, and grain Zn content at high soil P fertilization under field environment.
GenotypesSdwt
.HP
Sdwt
.MP
Sdwt
.LP
Yield
.HP
Yield
.MP
Yield
.LP
GrainZn
.HP
GrainZn
.MP
GrainZn
.LP
IT89KD-28898.633.019.01475.0599.299.943.739.236.2
IAR-48116.532.021.91547.1421.9388.741.122.626.3
IT82E-1890.849.021.31171.1643.9519.240.737.231.7
IT97K-499-3580.348.020.21261.1925.1289.339.534.630.3
UCR77993.613.019.51197.1232.022.231.419.021.1
DanMisra127.627.022.12105.5459.9571.931.124.239.4
LP = no P application of P2O5, MP = 10 kg P2O5 ha−1, and HP = 60 kg P2O5 ha−1 for field evaluation.
Publisher’s Note: MDPI stays neutral with regard to jurisdictional claims in published maps and institutional affiliations.

