1. Introduction
Chilli pepper is among the most fascinating and consumed spice foods, largely appreciated for its high nutritional and health contribution to human diets. Today, the crop is cultivated worldwide covering a surface of about four million hectares and a production over 40 million tonnes [
1].
Chilli pepper cultivars are highly variable regarding morphological characteristics and levels of bioactive compounds, especially capsaicinoids which contribute to their typical flavour and pungent taste that are unique of this species. These characteristics make chilli fruits a multidisciplinary item, as food in fresh, dried or in paste form (e.g., sauce, cream) or for industrial use, such as colouring additive or agent for cosmetics [
2]. The broad diversity of chilli pepper includes both cultivated (
Capsicum annuum) and other domesticated species, that includes accessions such as the habanero (
C. chinense), tabasco (
C. frutescens), rocoto (
C. pubescens) and aji types (
C. baccatum). Most of these are widely grown in the Caribbean, South America, and various Asian areas, where a combination of culinary and cultural factors has favoured consumption of very spicy types [
3]. The cultivated
C. annuum spicy types, on the other hand, have a more global market and are the most consumed in the Europe where mild spicy varieties are preferred according to the needs of consumers [
4]. Europe is the second major importer of chillies after Asia and is also an exporter of dried and packaged products. Considering the increasing trend of spicy foods, it is necessary to develop and cultivate new cultivars suitable to meet both producers and consumer expected needs [
4].
To date, diverse local varieties selected by farmers are grown especially in small to medium sized farms. These materials although well adapted to specific habitats, could still hold some intrinsic genetic variability since they are mostly open-pollinated varieties with off-types from high genetic diversity. These constraints are not desired for packaging and processing where the production chain requirements are stricter [
5,
6]. In previous works, we characterized panels of chilli genotypes including open-pollinated cultivars and landraces for their agronomic performance and nutritional characters, as well as for the effect of genotype by environment interaction on traits [
6,
7]. The growing interest of seed companies in the development of new chilli cultivars has led to the release of improved uniform varieties with high yield, such as F
1 hybrids.
This research aims to broaden the information on these types of varieties, in order to: (a) understand the characteristics on which selection has been mostly focused, (b) determine whether improved cultivars are more stable than the landraces by estimating the G × E effect, (c) investigate the possible existing gap between the performance of improved and unimproved cultivars, and d) define further objectives to be pursued in chilli breeding.
Thus, ten outstanding hybrids (representing cherry, horn, and jalapeno morphotypes) were grown at two environmentally different locations. Phenotyping was carried out for 18 agronomic and biochemical traits, as well as for over 40 morphometric and colour fruit parameters. Multi-trait analysis provides novel knowledge for the exploitation of chilli cultivars in further breeding programs.
2. Materials and Methods
2.1. Plant Material and Field Trials
Plant material consisted of ten commercial hybrids of cultivated pepper selected for fresh and dried consumption. Hybrids included cherry (‘Bomber’ and ‘Topik’) and jalapeno (‘Jalapride’ and ‘Newpark’) morpho-types with round and ovoid shape, respectively, whereas the remaining selection had a horn shape (‘Anastar’, ‘Eris’, ‘Haruba’, ‘PH11421’, ‘Vulcan’, ‘Zigano’). Seeds were obtained from various companies (Sativa, Esasem, United Genetics). Plants were grown at two locations: Battipaglia (BP) in the Sele Valley of Campania Region (40°37′ N; 14°58′ E, 65 m a.s.l.) and Montanaso Lombardo (ML) in the Po Valley of Lombardia Region) (45°20′ N; 9°26′ E, 80 m a.s.l). The two sites are located at over 800 km of distance apart and are characterized by very different pedoclimatic conditions (
Table 1). Cultivation conditions have been performed equally in the two considered locations. Seeds were sown in April and seedlings transplanted in May in a randomized block experimental design with three replicates. Ten plants were grown for each genotype in each experimental unit at a density of 2.7 plants/m
2. Fruits were harvested at commercial ripening, from August to October, according to the different varieties’ characteristics. Fields were managed according to standard agronomic practices. For plant fertilization, 120 kg ha
−1 of N, 100 kg ha
−1 of P
2O
5 and 80 kg ha
−1 of K
2O were applied. Based on crop evapotranspiration, plants were irrigated throughout the entire cultivation period using a drip irrigation system. Effective control of pests and diseases was pursued with the aim of having healthy plants until the end of the cycle. Data from each variety were grouped and presented as the average of the three typologies ’cherry‘, ’jalapeno‘ and ’horn‘ shape.
2.2. Morpho-Agronomic Characterizations
Agronomic traits scored at both locations included total yield (grams) [TY] of fully ripe fruits assessed as: the total weight of fruits taken from each plant at full ripening stage; average fruit weight (FW) (in grams) obtained by dividing the total yield by the number of fruits harvested; fruit length (FL) and fruit width (FD) (in centimeters) measured by using manual calliper on ten fruits; and fruit shape index (FS) as length/width ratio.
2.3. Chemical and Biochemical Characterization
Chemical and biochemical assessment was conducted on fruits from each replication in both fields. The plant material for the analyses was established after selecting fresh peppers without apparent defects. Peduncles were removed from selected fruits and then cut along the longitudinal axes according to common practices and carefully dried until constant weight in a forced-air oven at 45 °C for 48 h. The dried material was powdered by a waring blender (Waring Commercial, Stamford, CT, USA) at 4 °C and stored in dark bottles at −20 °C until analyses. Chemical traits were measured using a supernatant solution obtained after suspending 2 g of powder in 25 mL of deionized water, subsequent stirring (15 min), and decantation. The total soluble solid content (SSC), expressed in °Brix on 100 g on dried weight (°Bx dw), was measured using a Multi-Scale refractometer RFM 91 (Bellingham-Stanley Ltd., Kent, UK). The pH and the titratable acidity (AC), expressed as mEq% dw, were determined using a titroprocessor mod 682 equipped with a Dosimat 665 apparatus (Metrohm, Herisau, Switzerland). Biochemical traits measurements included: (a) total carotenoids (TC) and their red (CR) and yellow (CY) fraction; (b) ascorbic acid (AsA); (c) capsaicin (CAPS), dihydro-capsaicin (DHC), nordihydro-capsaicin (NDHC); (d) Scoville units (SHU); and (e) gamma-tocopherol (γ-toc), alpha-tocopherol (α-toc). Carotenoids were measured using spectrophotometric methodology, whereas the remaining traits were analysed by High Performance Liquid Chromatography (HPLC). Details of analytical protocols used can be found in previous works [
6,
7].
2.4. Digital Fruit Analysis
A representative bulk of fifteen ripe fruits for each accession and from the BP site were cut longitudinally and scanned with CanoScan Lide 200 (Canon, Italy) at 300 dpi resolution in a dark room using a black background in order to avoid any bias due to light. Resulting images were analysed using the software Tomato Analyzer 3.0 (TA) [
8]. Thirty-eight quantitative fruit size and shape traits were evaluated. Fruit color was assessed by handheld colorimeter (Minolta Chroma Meter CR-210; Minolta Corp., Osaka, Japan) to obtain CIELab (L*, a*, b*) coordinates along with Chroma [(a*)
2 + (b*)
2]
0.5 and Hue angle (arctan b*/a*) [
9].
2.5. Data Analysis
All traits were subjected to a two-way ANOVA to analyse the main effects of genotype (G), environment (E), and their interaction (G × E) by using JMP v7.0 software package (SAS Institute, 2007, Cary, NC, USA). Means were compared by using Tukey HSD (honest significant difference) test (
p < 0.05). Coefficient of variation (CV) in percentage was expressed as the ratio of the standard deviation to the mean value multiplied by 100. Correlation test was used to compare the distribution of biochemical compounds and morpho-agronomic traits. Pearson analysis was carried out testing at
p < 0.01. Correlogram was constructed and visualized using the Corrplot package implemented in R version 3.0.2 (R Development Core Team) [
10]. Principal component analysis (PCA) was performed using the computer package XLSTAT 2012.1.
3. Results
3.1. Phenotypic Variability
A variable level of diversity was found for the assessed traits. Considering the three typologies studied, differences (
p < 0.001) were found for 10 out of 18 agronomic and biochemical traits (
Table 2). Only pH did not differ among cultivar groups considering the two sites.
Horn types were higher yielding with greater fruit weight and shape parameters at both sites, with ‘Zigano’ having outstanding values (
Table S1). The evaluated accessions had similar productivity between locations except for ‘Jalapride’ that had low yield at BP.
Bioactive compounds content differed according to the chilli pepper type. Higher levels of Vitamic C (AsA) were found in horn types at both sites with ‘Vulcan’ having the greatest amount (
Table S1). In comparison, high levels of carotenoids were found in both cherry and horn types (
Table 2). Capsaicinoids and related Scoville scale units were more genotype-dependent rather than based on cultivar group, with high levels of pungency found in both jalapeno types as well in ‘PH11421’ (
Table S1). Cherry types exhibited the highest levels of γ-tocopherols with ‘Topik’ having high amounts at both locations, whereas α-tocopherols primarily accumulated in horn types with ‘PH11421’ having the highest amount compared to the other cultivars across both locations (
Table S1).
3.2. Genotype by Environment Interaction
The results of combined analysis of variance for agronomic and biochemical traits are reported in
Table 3. A strong effect of the genotype (G) with high level of significance (
p < 0.001) was detected in 16 out of the 18 assessed traits. The main source of variation was due to G, which accounted on average for 70% of total variation, expressed by TSS%. The strongest effect was found for morpho-agronomic traits fruit shape and fruit length exhibiting TSS value over 97%. Among biochemical traits, the highest values were found for the minor components of capsaicinoids (DHC and NDHC) and tocopherols (γ-toc). The environmental (E) factor, as well as the G × E interaction, represented 12% and 18% of the total variation, respectively. Several traits were not influenced by location differences or G × E interaction (
Table 3), among them, SSC did not show any effect due to either E or G × E, whereas all capsaicinoids did not differ between environmental locations.
3.3. Digital Fruit Analysis
The digital assessment involved the measurement of morphometric parameters by fruit scans and automatic inspection of surface colour through CIELab coordinates. For each accession, a total of 30 image sections were analysed for 38 size and shape parameters. The ANOVA detected highly significant differences (
p < 0.001) for all size traits, whereas, among shape attributes, five parameters showed lower (Proximal Indentation Area and H. Asymmetry.ob) or null (Proximal Angle Micro, Proximal and Distal Eccentricity) significance (
Table 4).
The largest variation was found for fruit size and shape traits, and well as Lobedness Degree and Circular Homogeneity, the latter explaining most of the variance with the highest
F-ratio. Fruit size-related traits were highly variable between accessions, having a relatively high
F-ratio, except for Maximum width and Height Mid-width (
Table 4).
The coefficient of variation ranged from 3.58% for pericarp area to 440.50% for Obovoid Asimmetry. Negative values were recorded for Ovoid and Distal Eccentricity, while minimum values of zero were found for Shoulder Height, Proximal and Distal Indentation Area, Distal End Protrusion, Obovoid, H. Asymmetry.ob and ov (
Table 4). As evidenced by manual measurements, horn types had the highest values of fruit size and shape traits. Fruit imaging better discriminated the investigated cultivars, highlighting the major values of Pericarp Area and Pericarp Thickness for cherry and jalapeno types. Fruit shape index traits were the most discriminating between cherry, jalapeno and horn genotypes. Cherry types had average values ranging from 0.72 to 1.01 for Fruit Shape Index External I/II and from 0.94 to 1.22 for Curved Fruit Shape Index. Horn types had average values of 2.53–4.83 for Fruit Shape Index External I, 4.25–8.19 for Fruit Shape Index External II and 4.91–11.18 for Curved Fruit Shape Index. Jalapeno types were intermediate with respect to the above-mentioned cultivar groups with the values for the considered fruit shape parameters ranging from 1.73 to 3.17.
Table S2 reports the results of tomato analyzer descriptors for each accession. The cultivar ‘Anastar’ had the highest average values for the fruit size traits apart from Width Mid-height and Maximum Width which were higher in ‘Bomber’ and ‘Zigano’, respectively. Additionally, ‘Topik’ showed the lowest average value for these traits except for Width Mid-height and Maximum Width which was lower in ‘Eris’ and ‘Newpark’, respectively. CIELab coordinates (
Table 5) indicated an average L* value of 35.09, a positive a* value (mean of 28.20) and a positive b* value (average of 17.59). Chroma ranged from 24.88 (‘Newpark’) to 41.5 (‘Eris) (
Table S2) with a mean of 33.26. Jalapeno types had the lower mean value for the CIELab colour coordinates, resulting in fruits with less intense red colour.
The highest values were instead found in ‘Eris’, a horn-shape type. Among colour coordinates, b* was the variable that exhibited a CV higher than L* and a*. On the contrary, L* and Hue had the lower coefficient of variability indicating low level of variation among genotypes. Overall, fruits were almost stable in terms of colour parameters in all genotypes as indicated by reported standard deviation values (
Table S2).
3.4. Trait Correlation and Multivariate Analysis
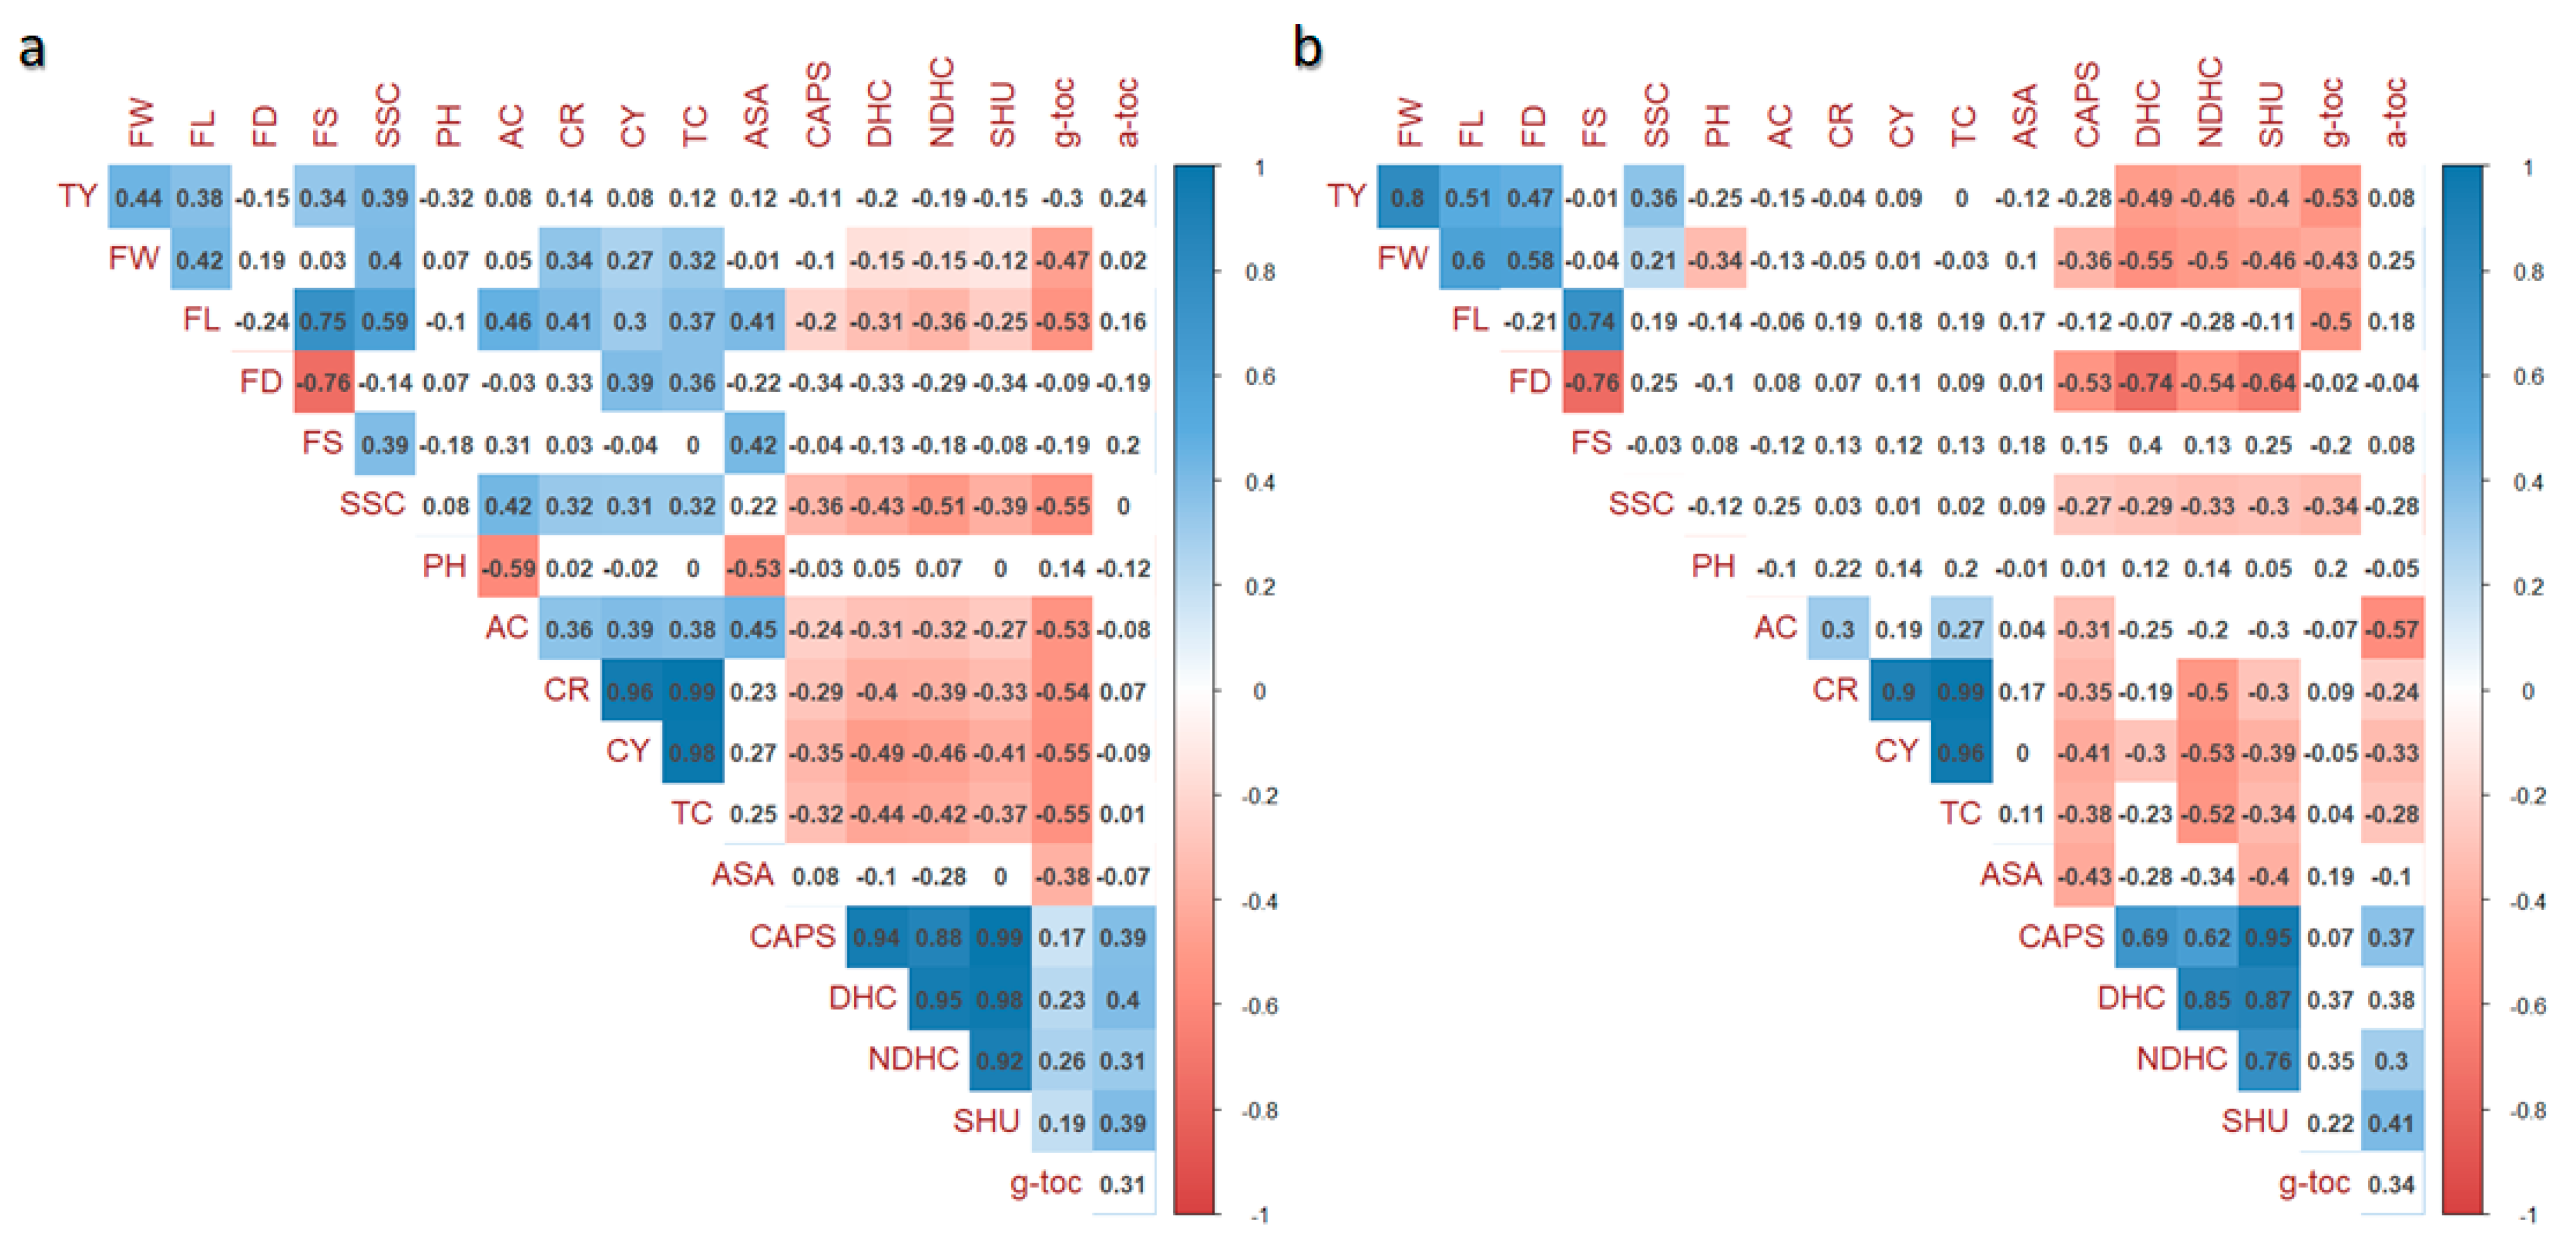
For each growing site, correlograms between pairs of variables were generated considering a
p threshold of 0.01 (
Figure 1). As expected, high correlations mainly occurred among the same trait’s categories. Specifically, fruit weight (FW) and soluble solids (SSC) were positively correlated to carotenoids and negatively correlated to capsaicinoids in both BP and ML (
Figure 1a,b), showing significative positive values only at BP. At both locations, negative correlations were found between carotenoids and capsaicinoids (maximum value—0.49 for CY vs. DHC in
Figure 1a, and—0.53 for CY vs. NDHC in
Figure 1b) with tighter values at BP (
Figure 1a). Negative significant correlations were evidenced for morphological traits (coefficient of −0.76 for FS and FD at both sites) and for fruit length and γ-toc (values of—0.53 and—0.50 for BP and ML, respectively), whereas positive correlations were found for α-toc and capsaicinoids (0.40 vs. DHC in BP and 0.41 vs. SHU in ML). Considering the single growing sites, a larger number of significant correlations were found at BP than ML (81 vs. 60), although the trend was similar at the two locations. Correlations with opposite signs and different significance between BP and ML were found for FW vs. pH, FS vs. SSC, CR and TC vs. α-toc. Furthermore, divergent correlations were found in the two grown sites for AsA vs. γ-toc as well as for AsA vs. CAPS.
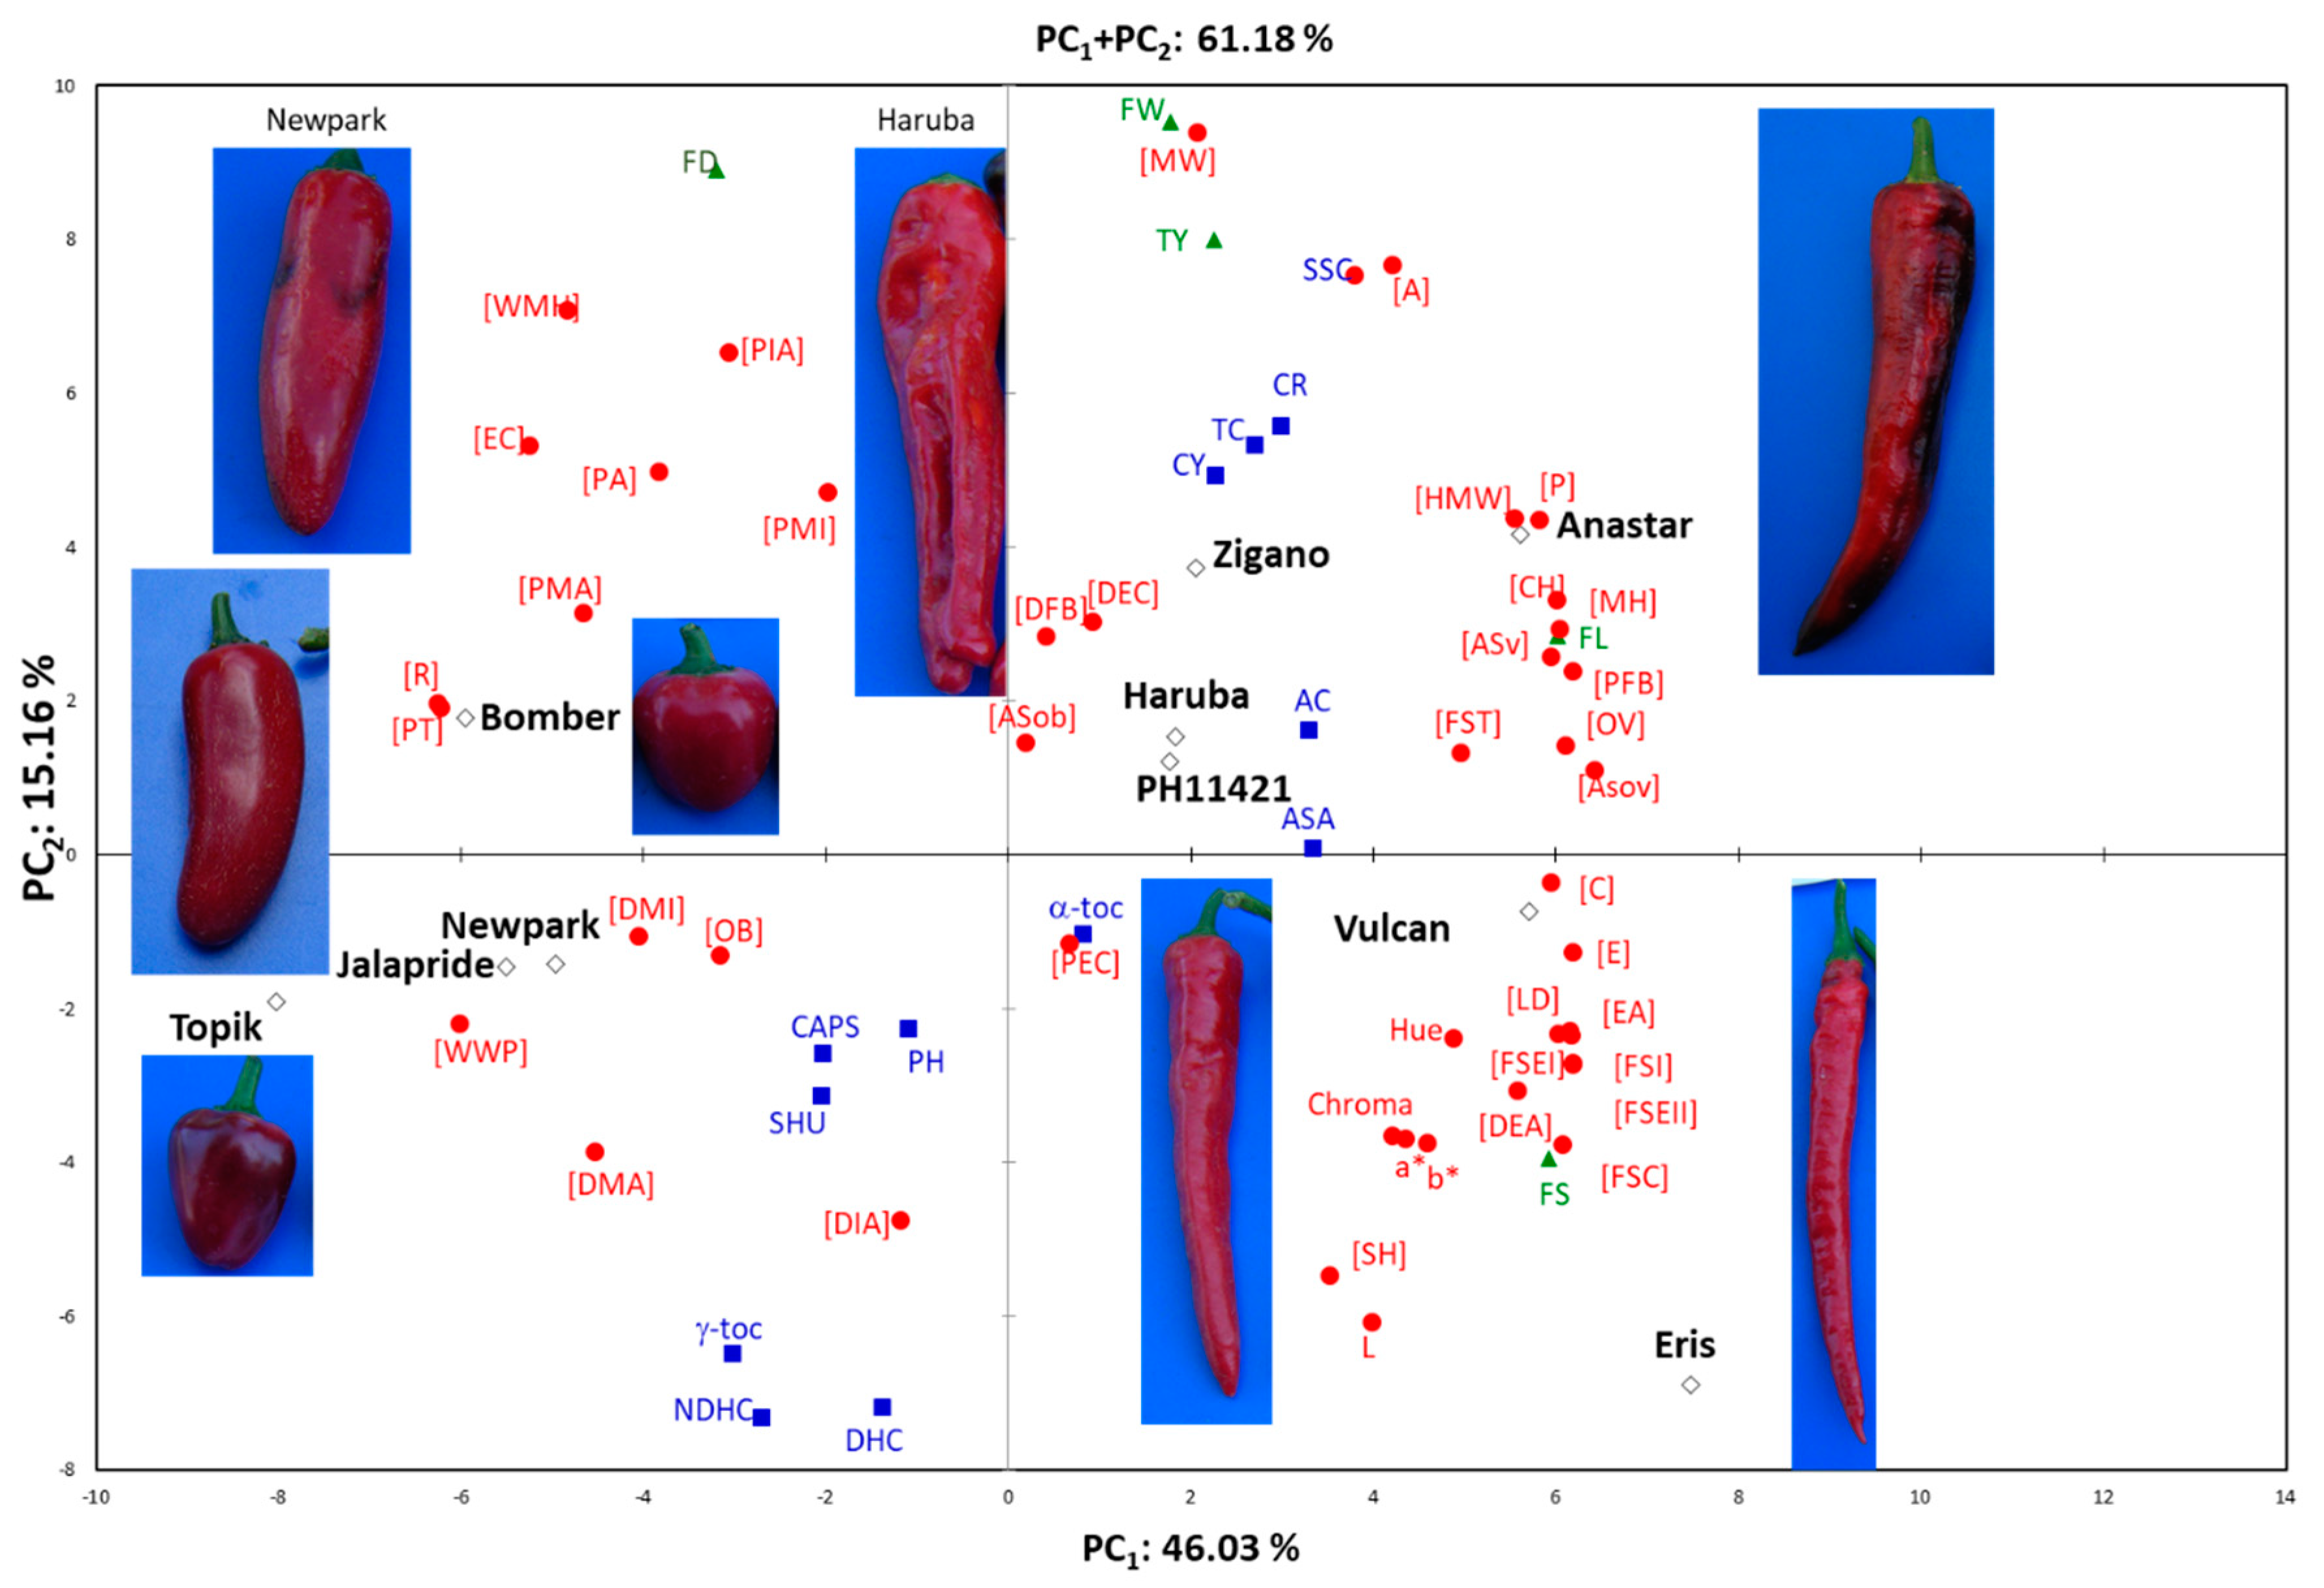
The principal component analysis that considered the entire dataset of 62 traits scored, explained 61.18% of the variation in the first two dimensions (
Figure 2). Traits and genotypes were evenly distributed in the two axes of the biplot. Most of the variation (46.03%) was explained by the first PC which separated cherry and jalapeno types from horn types, positioned in the negative and positive part of the axis (PC
1), respectively. The PCA highlighted major traits of the studied genotypes which were those related to yield, fruit weight, and size. Horn types were discriminated in positive axis of both PC
1 and PC
2, whereas, among biochemical traits, the main discriminators were related to SSC and carotenoids both located in positive axis values of PC
1 and PC
2. Instead, on the opposite side, those related to pungency clearly discriminated the genotypes positioned in the region of negative values of both PC
1 and PC
2 (
Figure 2,
Table S3). It is interesting to note that these latter observations are in full accordance with the correlation data presented in
Figure 1.
3.5. Comparison of Yield and Ascorbic Acid Content with Local Varieties
To determine the potentiality of F
1 hybrids and to investigate any gaps with the current chilli local varieties, we compared our results with previous studies performed on pungent landraces in Mediterranean environments. As a reference, we considered studies assessing typical Italian chilli cultivars [
6,
7,
11], Balkan pungent lines [
12], and a set of Spanish pepper landraces [
13].
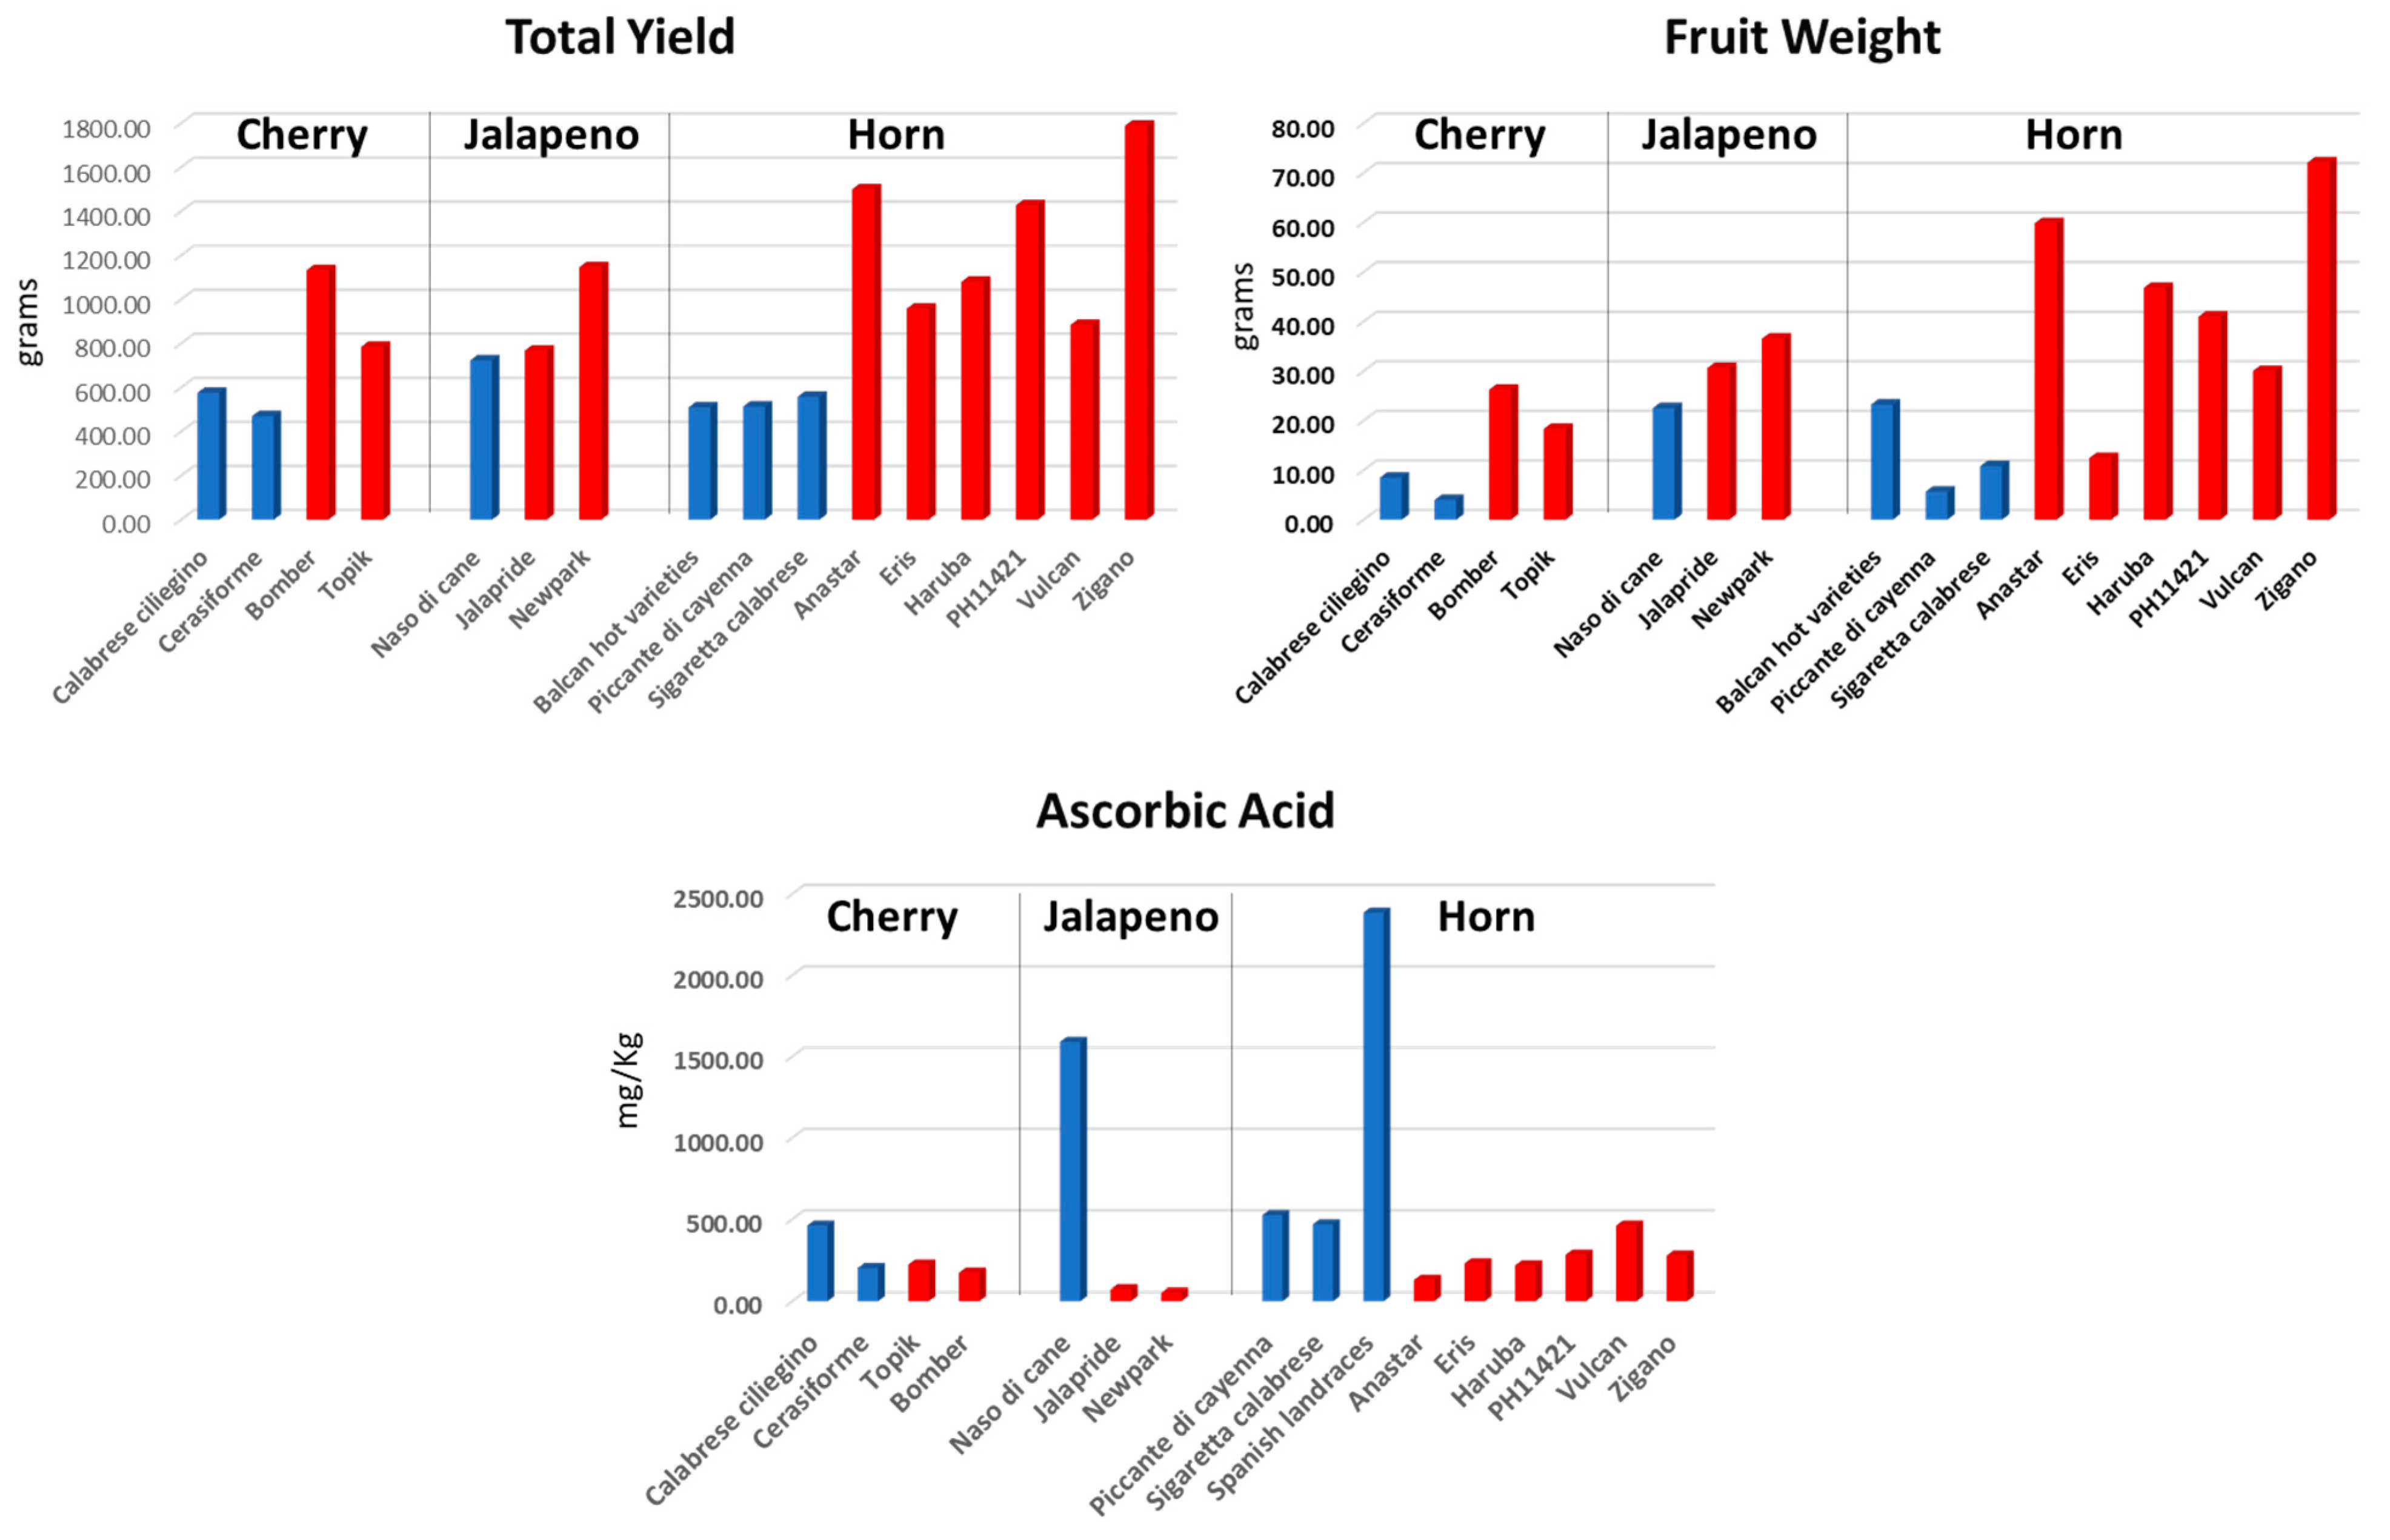
Five landraces having cherry (‘Calabrese Ciliegino’ and ‘Cerasiforme’), jalapeno (’Naso di Cane’) and horn (‘Piccante di Cayenna’ and ‘Sigaretta calabrese’) shape, were evaluated in diverse trials during seasons 2014–2016 [
6,
7,
11]. Considering the average performance, hybrids produced two to three times higher with reference to the cherry and horn cultivar groups, whereas the jalapeno F
1 types were slightly higher in terms of fruit weight and total yield respect the reference ‘Naso di Cane’. The same trend was observed for the Balcan hot varieties that showed substantial lower productivity than commercial hybrids (
Figure 3). Although low levels of ascorbic acid were detected in the commercial hybrids, contents in local cultivars were higher and up to 10 times more in some instances.
4. Discussion
Chilli pepper is one of the most popular spices with multi-consumption uses as fresh food, dried in powder, processed as sauce or cream. This versatility has leads to an increase in the cultivation of types addressed for different market segments. Previous studies in chillies reported the assessment of different germplasm material including local landraces, breeding lines and established cultivars [
6,
7,
11,
12,
13]. The need to standardize the production chain has led to the development of commercial hybrid cultivars aimed to have better performance. Thus, ten hybrids were selected and cultivated at Italian farms with two contrasting environments to assessing a broad range of agronomic and biochemical traits for investigating their performance, as well as variation due to environmental factors. We further refined the characterization of the cultivars based on a detailed assessment of fruit morphological features and colour. This approach was pursued to highlight the level of variability among the pepper genetic materials using established phenotyping tools [
14,
15].
The accessions differed (p < 0.05) in fruit size and fruit shape, being divided into two primary roundish and horn groups, the former including circular and oval types known as cherry and jalapeno. The traits leading to the selection of fruit morphology characters were identified. In fact, most of the variation was related to fruit size and shape index traits. Less variation among accessions was instead for fruit colour coordinates, which did not allow accessions to form defined groups. Although digital measurements were carried out on fruits from a single location, we can consider the obtained information reliable, considering the low environmental influence on fruit morphological traits obtained across the two environmental locations. In fact, all fruit shape traits showed a strong genotypic effect, with no G × E detected for FD or FS, and only a low significance for FL. Thus, the environment had little influence on manipulating these fruit traits. Considering possible bias in manual measurements due to the curvature of fruits in the longitudinal section (in particular horn-shaped types) we implemented a more precise method for shape traits based on fruit scans. The observations based on the fruit scans provided more detailed information allowing the measurement of more traits than those visually recorded and manually collected. This confirms the potentiality of scans for fruit phenotyping in chilli pepper. We found similar trait correlations across sites, although a greater number was found at BP. This may be due to the diverse pedoclimatic conditions of the cultivation sites, and/or the quantitative nature of the traits measured which are affected by environmental changes.
In comparison with data from previous studies [
6,
7,
11,
12], we observed an increase in productivity of hybrids with respect to cultivars and/or landraces cultivated in the same field sites. Instead, minor content of ascorbic acid has been observed with respect of what usually reported in local varieties of chillies [
6,
7,
11,
13]. Anyhow, the levels of AsA founded are in line with the previous essays on F
1 hybrids [
16]. Interestingly, we found a low influence of the environmental changes on ascorbic acid contents in fruits to what was previously observed [
6,
7]. Although there are not many data of AsA content in chilli hybrids, we suggest our results are due to a possible heterotic effect resulting from the hybrid combination, but also the lesser effect of the environment on low vitamin C genotypes. On the contrary, carotenoids and α-tocopherol were significantly influenced by the environment which agrees with previous studies [
6,
7,
12]. Wall and colleagues [
17], although not describing the G × E interaction, report a variable level of carotenoids across two years of evaluation in different chillies. In addition, the total carotenoid content found in the hybrids is lower in respect to those reported in other
C. annuum hot cultivars including serrano, cayenne [
17], and jalapeño [
18].
These findings highlight how the breeding activities for commercial varieties could have focused on high-yielding and morphologically stable genotypes rather than high-quality ones. This seems to be confirmed by the observed strong genotypic effect over the environment for agronomic traits. The similar trend observed for the values of capsaicinoids across locations suggests pungency should be added as an additional primary objective in the breeding of chilli pepper for the market toward the development of slightly spicy cultivars. In fact, the SHU levels encountered in this study were 30–50-fold lower than the typical hot pepper such as habanero types (about 300,000 SHU). This reflects the culinary and cultural uses of the Mediterranean diet. The high productivity combined with greater fruit weight certainly represents an advantage in manual harvesting, which is still very common in chillies, with a better final product yield for both fresh and processed market.
5. Conclusions
This report has shown the potential of chilli hybrids regarding their agronomic and qualitative performance. By deep phenotyping, we determined the characteristics of different types of chilli pepper highlighting how morphology, yield and capsaicinoids are the main drivers of selection toward the development of high yielding and mild-pungent varieties. Instead, additional efforts are needed for the improvement of quality-linked traits. Further studies involving sensory analyses and panel tests could give additional insight into the preference of consumers for the different existing genotypes of chillies.
Supplementary Materials
The following are available online at
https://www.mdpi.com/article/10.3390/agronomy11040805/s1, Table S1: Mean Values, standard deviation, and results of post-hoc Tukey’s for morpho-agronomic and biochemical traits in ten chilli cultivars evaluated at Battipaglia (BP) and Montanaso lombardo (ML); Table S2: Mean values, standard deviation, and results of post-hoc Tukey’s for Tomato Analyzer attributes and CIELab colour traits in ten chilli cultivars; Table S3: Variable contribution in % for the traits in the first two PC.
Author Contributions
Conceptualization and methodology P.T., M.S., and R.L.S.; field trials and phenotyping P.T. and M.S.; chemical and biochemical analysis, R.L.S.; writing—original draft preparation, P.T.; writing—review and editing, M.S. and R.L.S.; funding acquisition P.T., M.S., and R.L.S. All authors have read and agreed to the published version of the manuscript.
Funding
This research was funded by funded by the Italian Ministry of Agriculture, Food and Forestry, grant name “RGV-ORFLORA and PEPIC”.
Institutional Review Board Statement
Not applicable.
Informed Consent Statement
Not applicable.
Data Availability Statement
The data presented in this study are available on request from the corresponding author.
Conflicts of Interest
The authors declare no conflict of interest. The funders had no role in the design of the study; in the collection, analyses, or interpretation of data; in the writing of the manuscript; or in the decision to publish the results.
References
- FAOSTAT. 2019. Available online: http://www.fao.org/faostat/en/#home (accessed on 15 March 2021).
- Tripodi, P.; Kumar, S. The Capsicum Crop: An introduction. In The Capsicum Genome; Ramchiary, N., Kole, C., Eds.; Springer International Publishing: Cham, Switzerland, 2019. [Google Scholar]
- Jarret, R.L.; Barboza, G.E.; Costa Batista, F.R.d.; Berke, T.; Chou, Y.-Y.; Hulse-Kemp, A.; Ochoa-Alejo, N.; Tripodi, P.; Veres, A.; Garcia, C.C.; et al. Capsicum—An abbreviated compendium. J. Am. Soc. Hort. Sci. 2019, 144, 3–22. [Google Scholar] [CrossRef] [Green Version]
- CBI. Available online: https://www.cbi.eu/market-information/spices-herbs/dried-chillies/market-potential (accessed on 15 March 2021).
- Govindarajan, V.S.; Salzer, U.J. Capsicum-production, technology, chemistry, and quality Part 1: History, botany, cultivation, and primary processing. Crit. Rev. Food Sci. Nutr. 1985, 22, 109–176. [Google Scholar] [CrossRef] [PubMed]
- Tripodi, P.; Ficcadenti, N.; Rotino, G.L.; Festa, G.; Bertone, A.; Pepe, A.; Caramanico, R.; Migliori, C.A.; Spadafora, D.; Schiavi, M.; et al. Genotypic and environmental effects on the agronomic, health-related compounds and antioxidant properties of chilli peppers for diverse market destinations. J. Sci. Food Agric. 2019, 99, 4550–4560. [Google Scholar] [CrossRef] [PubMed]
- Tripodi, P.; Cardi, T.; Bianchi, G.; Migliori, C.A.; Schiavi, M.; Rotino, G.L.; Lo Scalzo, R. Genetic and environmental factors underlying variation in yield performance and bioactive compound content of hot pepper varieties (Capsicum annuum) cultivated in two contrasting Italian locations. Eur. Food Res. Technol. 2018, 244, 1–13. [Google Scholar] [CrossRef]
- Tomato Analyzer. 2020. Available online: https://vanderknaaplab.uga.edu/tomato_analyzer.html (accessed on 15 March 2021).
- Corbalán, M.; Millán, M.S.; Yzuel, M.J. Color pattern recognition with CIELAB coordinates. Opt. Engng. 2002, 1, 130–138. [Google Scholar]
- R Core Team. 2020. Available online: https://www.R-project.org/ (accessed on 15 March 2021).
- Tripodi, P.; Lo Scalzo, R.; Ficcadenti, N. Dissection of heterotic, genotypic and environmental factors influencing the variation of yield components and health-related compounds in chilli pepper (Capsicum annuum). Euphytica 2020, 216, 1–17. [Google Scholar] [CrossRef]
- Nankar, A.N.; Todorova, V.; Tringovska, I.; Pasev, G.; Radeva-Ivanova, V.; Ivanova, V.; Kostova, D. A step towards Balkan Capsicum annuum L. core collection: Phenotypic and biochemical characterization of 180 accessions for agronomic, fruit quality, and virus resistance traits. PLoS ONE 2020, 15, e0237741. [Google Scholar] [CrossRef] [PubMed]
- Rodríguez-Burruezo, A.; Raigón, M.; Prohens, J.; Nuez, F. Characterization for bioactive compounds of Spanish pepper landraces. Acta Hortic. 2011, 918, 537–543. [Google Scholar] [CrossRef]
- González-López, J.; Rodríguez-Moar, S.; Silvar, C. Correlation Analysis of High-Throughput Fruit Phenomics and Biochemical Profiles in Native Peppers (Capsicum spp.) from the Primary Center of Diversification. Agronomy 2021, 11, 262. [Google Scholar] [CrossRef]
- Tripodi, P.; Greco, B. Large Scale Phenotyping Provides Insight into the Diversity of Vegetative and Reproductive Organs in a Wide Collection of Wild and Domesticated Peppers (Capsicum spp.). Plants 2018, 7, 103. [Google Scholar] [CrossRef] [PubMed] [Green Version]
- Topuz, A.; Ozdemir, F. Assessment of carotenoids, capsaicinoids and ascorbic acid composition of some selected pepper cultivars (Capsicum annuum L.) grown in Turkey. J. Food Compos. Anal. 2007, 20, 596–602. [Google Scholar] [CrossRef]
- Wall, M.M.; Waddell, C.A.; Bosland, P.W. Variation in β-carotene and total carotenoid content in fruits of Capsicum. Hortic. Sci. 2001, 36, 746–749. [Google Scholar] [CrossRef] [Green Version]
- Topuz, A.; Dincer, C.; Özdemir, K.S.; Feng, H.; Kushad, M. Influence of different drying methods on carotenoids and capsaicinoids of paprika (Cv., Jalapeno). Food Chem. 2011, 129, 860–865. [Google Scholar] [CrossRef] [PubMed]
| Publisher’s Note: MDPI stays neutral with regard to jurisdictional claims in published maps and institutional affiliations. |
© 2021 by the authors. Licensee MDPI, Basel, Switzerland. This article is an open access article distributed under the terms and conditions of the Creative Commons Attribution (CC BY) license (https://creativecommons.org/licenses/by/4.0/).


