Article

Groundcover Mulching in Mediterranean Vineyards Improves Soil Chemical, Physical and Biological Health Already in the Short Term

1
Group of Agroecology, Institute of Life Sciences, Scuola Superiore Sant’Anna, Piazza Martiri della Libertà, 33, 56127 Pisa, Italy
2
Department of Agriculture Food and Environment (DAFE), University of Pisa, Via del Borghetto, 80, 56124 Pisa, Italy
3
Department of Agricultural and Forestry Sciences (DAFNE), University of Tuscia, Via S.C. de Lellis, 01100 Viterbo, Italy
*
Author to whom correspondence should be addressed.
Agronomy 2021, 11(4), 787; https://doi.org/10.3390/agronomy11040787
Submission received: 16 February 2021 / Revised: 2 April 2021 / Accepted: 15 April 2021 / Published: 16 April 2021

Abstract

:
Vineyards are among the land uses with the highest soil degradation rate in Mediterranean Europe, mainly due to intensive tillage management. Therefore, practices able to foster soil health are critical to promote sustainable wine production. We studied the following treatments in two organic farms in Chianti Classico (Italy): conventional tillage, spontaneous vegetation, pigeon bean (Vicia faba var. minor) incorporated in spring and a mixture of barley (Hordeum vulgare) and squarrosum clover (Trifolium squarrosum), both incorporated and left as mulch. An innovative approach, based on gamma-ray and apparent electrical conductivity, was used to account for the fine-scale soil variability that was included in the statistical model. Mulched groundcovers were associated with higher soil organic matter compared to tillage, already after two years. An increased N availability was found under all groundcovers compared with tillage. The effect of soil management practices on P2O5 strongly varied across farms and years, while it was not statistically significant on K availability. Spontaneous vegetation positively influenced the soil structure index, soil penetration resistance and soil biological health. The results show that mulched groundcovers can improve soil health already in the short term, thereby potentially increasing the sustainability of the wine sector.

1. Introduction

Soil is a key natural resource for humankind as well as for agriculture. It has been estimated that about 95% of the food comes directly or indirectly from soils [1]. Soil biodiversity provides a wide set of essential ecosystem services (ESs), including key ones such as biomass production, climate regulation, C-sequestration and nutrient and water cycling [2,3]. Global and international policies have clearly identified the importance of soil health among the main pillars of ecosystem stability and human welfare [4].
Despite the recognized importance of soil health, global soil loss ranges between 12 and 36 billion t year−1 due to unsustainable management [5,6]. In Europe, soil degradation has significantly increased in the last decades thereby calling for immediate action to mitigate, e.g., erosion, compaction, organic matter decline and biodiversity loss [7,8]. Vineyards are among the land use types with the highest mean soil loss rate (about 9.5 t ha−1 year−1 vs. 2.5 t ha−1 year−1 on average of all land use types), as they are mainly located in the hilly areas of Mediterranean Europe [9].
In these countries, vineyards have been historically planted on poor soils, characterized by a coarse texture, high stoniness, low soil organic matter (SOM) and low capacity to protect SOM from degradation [10]. These characteristics, along with the steep topography and the Mediterranean climatic pattern characterized by strongly uneven rainfall distribution across the year, make those soils highly susceptible to erosion and other forms of degradation. Moreover, land preparation for vineyard plantation has a strong impact on soil features, because soil is often deep ploughed or dug up by excavator, and the land topography is usually leveled to adapt vineyards to mechanization. These activities, if not optimally managed, can create areas highly prone to soil degradation. In particular, soil scalping and soil horizon mixing can bring to strong SOM decline, loss of soil biodiversity, crop nutrient deficiency and decrease of water retention [11].
Intensive tillage practices normally applied in modern vineyard management has further escalated soil degradation by fostering SOM oxidation [12,13], negatively impacting the activity and diversity of soil biological communities [14,15,16], disrupting soil structure [17] and increasing soil erodibility [18,19].
Although vineyards have been identified as an important land use system to deliver ESs [20], their provision is under threat due to the intensive cultivation practices adopted by growers [21]. Soil degradation has, therefore, raised concerns among consumers and local institutions regarding the impact of wine production on natural resources and has questioned the long-term sustainability of this sector. There is, therefore, a clear need to protect or rehabilitate the capacity of Mediterranean vineyards to deliver ESs through management practices able to reverse soil degradation and support soil health.
In this context, the introduction of cover crops (CC) can be instrumental in restoring soil functionality, due to their impact on SOM and physical and biological soil quality [22]. The role of CC and, in particular, permanent CC or natural vegetation cover in the inter-row of vineyards to control water erosion is widely accepted [23,24]. Vegetation cover protects soils from raindrop impact, increases water infiltration and reduces water speed and runoff. Vegetation cover also represents an important addition of OM to soils. Significant increases in SOM were found in no-till and reduced till inter-rows where CCs were grown as compared with conventional tillage [25,26], although the magnitude of these effects varied across sites and wine regions [27,28,29].
Organic matter input coupled with more conservative tillage practices can positively impact soil physical characteristics by improving soil aggregates and reducing their turnover [10,30,31]. In addition, vegetation cover and mulch from CC residues mitigate soil erosion, one of the major contributors to soil degradation in Mediterranean vineyards [32,33]. Nevertheless, such a mitigation effect seems to be very dependent on CC management [31] and slope range [34].
Soil cover practices also hold potential to improve the habitat for soil microorganisms and micro-, meso- and macrofauna [35]. The labile soil organic carbon (SOC) input from CC can increase microbial carbon [36] and soil-borne fungal richness [37] as compared to conventional tillage. However, the effects of CC on soil microbiota has been shown to be strongly affected by soil type, soil management and wine growing region [38]. CC were also reported to encourage the soil mesofauna [39], increase the soil biological quality index (QBS) [15] and favor earthworm populations [40]. However, these results are far from being generalized. A recent meta-analysis [41] suggests that further studies are needed, especially on certain aspects (e.g., the effects of tillage and of temporary vs. permanent CC on soil microarthropods), to fully reveal the effects of vineyard management on the soil’s biological quality. The highly variable and site-specific response of CC establishment in vineyards on SOM and physical and biological soil health calls for additional on-farm studies. These are instrumental to improve knowledge of the ecological processes and effects related to CC across different climatic, edaphic and management conditions.
Although on-farm experiments offer several advantages for agricultural research and development, e.g., practical application of research outcomes and closed exchange with stakeholders [42], soil variability and the need for simple experimental designs can often reduce the statistical power and hamper the scientific rigor of the trials. This is particularly relevant in vineyards, where soil variability is often substantial, as a result of the combination of tillage, earth movement during the plantation establishment, inherent geological diversity and soil erosion. Furthermore, vines are displaced in rows; hence, complex randomized designs are more difficult to be implemented. In this context, multi-location experiments and fine-scale soil mapping represent critical tools to improve the power of agronomic experiments and related analyses. Soil maps can be produced by the use of soil apparent conductivity (ECa) measurements. The resulting maps have been mainly used in two ways: (i) identifying homogeneous zones in order to improve blocking [43]; (ii) including the ECa as a continuous co-variate in statistical models [44]. Among these two options, the authors of [45] clearly demonstrated that using ECa as a covariate resulted in larger improvements in statistical power. Gamma-ray spectroscopy has also been used in the last decade for proximal soil sensing in cropland. Passive gamma-ray spectrometers measure the natural emission of gamma-rays from the topsoil (first 30–40 cm), in particular the emission of the radionuclides 40K, 232Th, 238U. The radionuclides content of the soil is strongly related to soil parent material mineralogy and to several soil physical and chemical characteristics, namely texture, calcium carbonate content and stoniness [46,47]. Despite their large potential, ECa and gamma-ray have been used merely as a mapping tool [48,49,50], while, to the best of our knowledge, they have never been used to improve the assessment of soil management and other agronomic practices in vineyards.
In this paper, ECa and gamma-rays were used to produce soil maps of selected edaphic parameters that are statistically correlated with those technologies. We then extracted soil-related covariates and included them in statistical models to study the effect of different agronomic practices applied in two distinct areas of Chianti Classico DOP (Italy), one of the most renowned wine regions worldwide. Here, innovative organic farmers have applied mixtures of cereal and leguminous CC or left spontaneous vegetation to grow along with non-inversion tillage to restore and protect their soils. Nevertheless, these innovations were not supported by local studies, thereby calling for on-farm testing as a basis to discuss the effectiveness of these practices with local stakeholders. This paper aimed to study the short-term effects of different soil management and CC practices directly chosen by local farmers, on chemical, biological and physical parameters, taking into account the edaphic variability that characterizes the experimental sites.

2. Materials and Methods

2.1. Site and Experimental Design

The experiment was conducted from 2017 to 2020 in two commercial organic farms located in two different areas of the Chianti Classico wine district (Tuscany, Italy). A first site, Fattoria San Giusto a Rentennano (SG) (43°22′14.1″ lat. N, 11°25′19.4″ long. E), is located in Gaiole in Chianti (Siena province) at 233 m a.s.l. Average annual rainfall and air temperature are 801 mm and 14.4 °C, respectively. Soils are loamy, moderately gravelly (5–15%), developed on marine sands and Pliocene conglomerates. The second site, Montevertine (MT) (43°30′06.2″ lat. N, 11°23′29.0″ long. E) is located in Radda in Chianti (Siena province) at 425 m a.s.l., where average annual rainfall and air temperature are 824 mm and 12.6 °C, respectively. Soils are stony, from silty clay loam to clay loam, developed on marls and limestone of the Sillano formation. The average slope of the experimental vineyards is ca. 10% at both sites.
The vines (Vitis vinifera, L. cv. Sangiovese R10, rootstock 420A) were planted in rows (2.50 × 0.8 m, i.e., 5000 plants ha
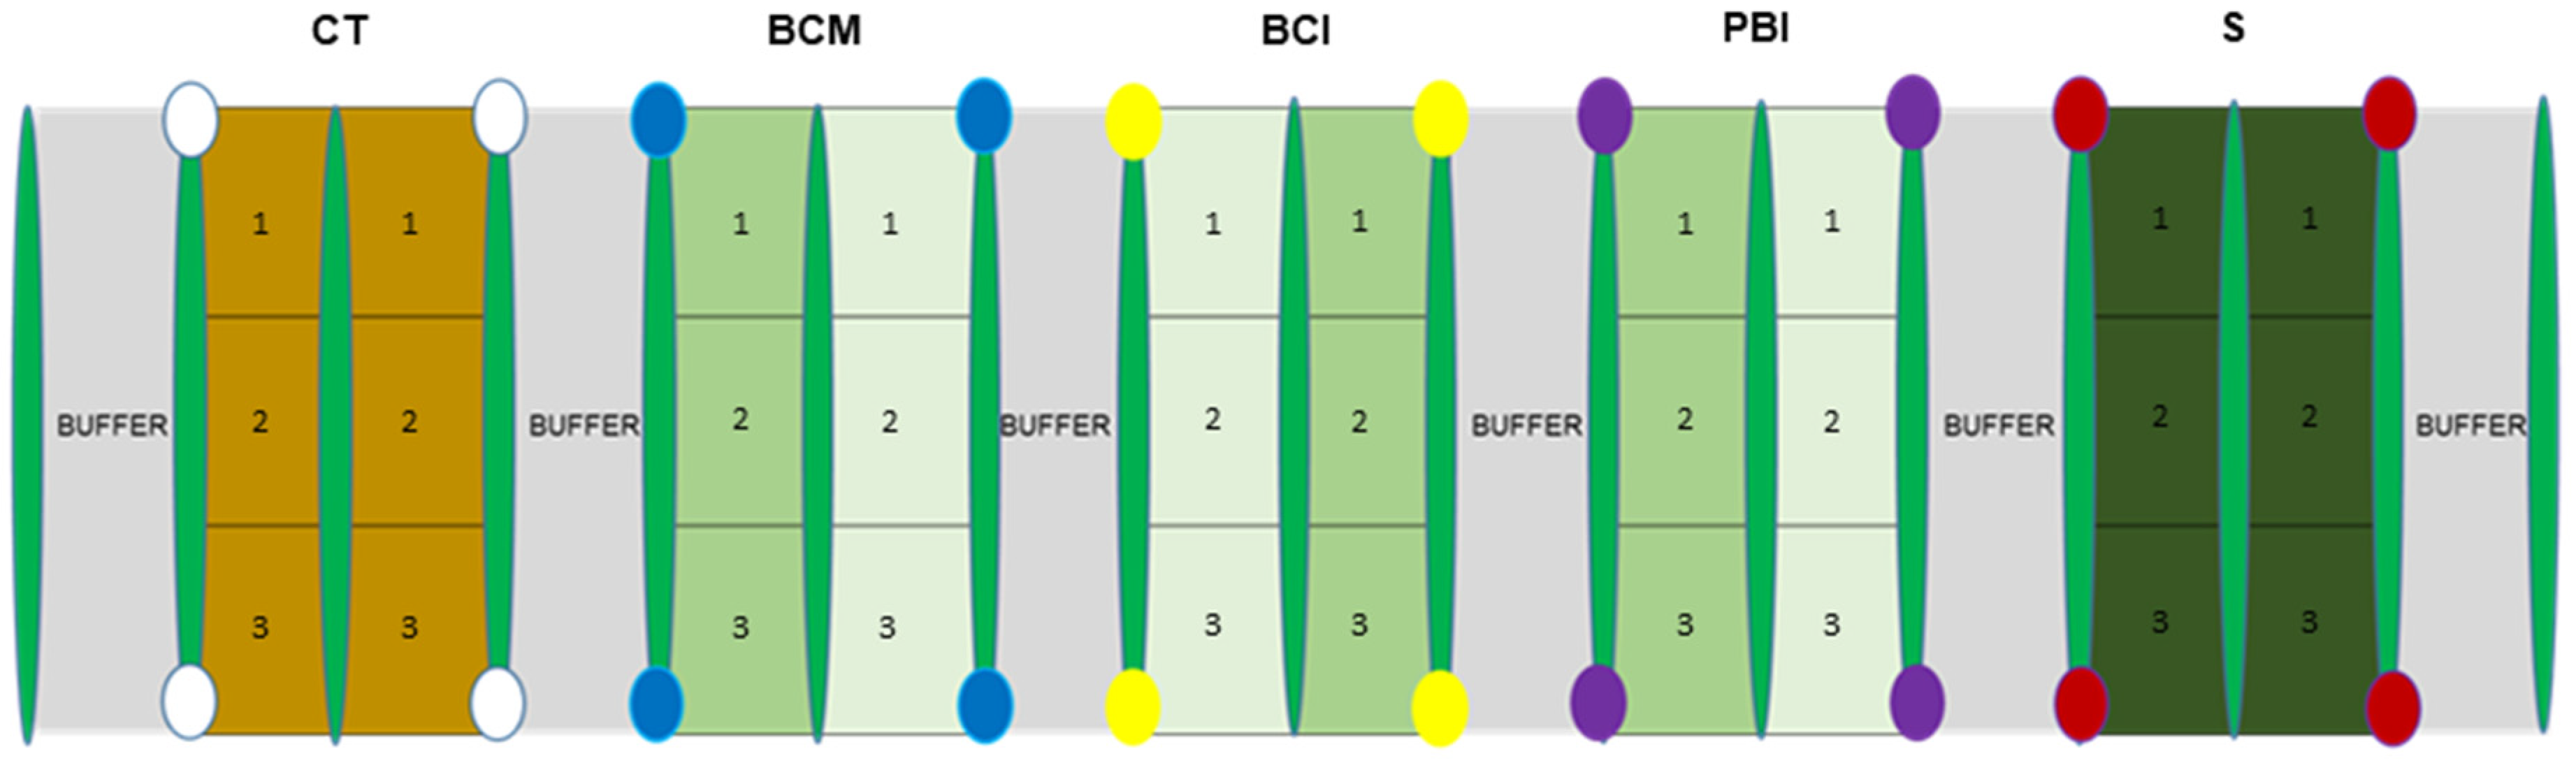
−1) with S-W and S-E orientation at SG and MT, respectively. The year of establishment of the vineyards is comparable (1995 and 1991 at SG and MT, respectively). The training system is Guyot at SG and spurred cordon at MT. Five soil management practices were studied in both farms (Figure 1):
  • Conventional tillage, performed once in autumn, spring and summer with a rigid tine cultivator at 15 cm depth (CT);
  • Pigeon bean (Vicia faba L. var. minor (Peterm. em. Harz) Beck. L.) CC sown at 90 kg ha−1 in autumn and soil incorporated with a disc plough at 15 cm depth in late spring (PBI);
  • A mixture of barley (Hordeum vulgare L.) and squarrosum clover (Trifolium squarrosum L.) CC sown in autumn at 85 and 25 kg ha−1, respectively, mown in late spring and left as dead on soil surface mulch (BCM);
  • A mixture of barley and squarrosum clover CC sown as described above and soil incorporated with a disc plough at 15 cm depth in late spring (BCI);
  • Spontaneous vegetation mown in late spring and left as dead mulch on soil surface (S).

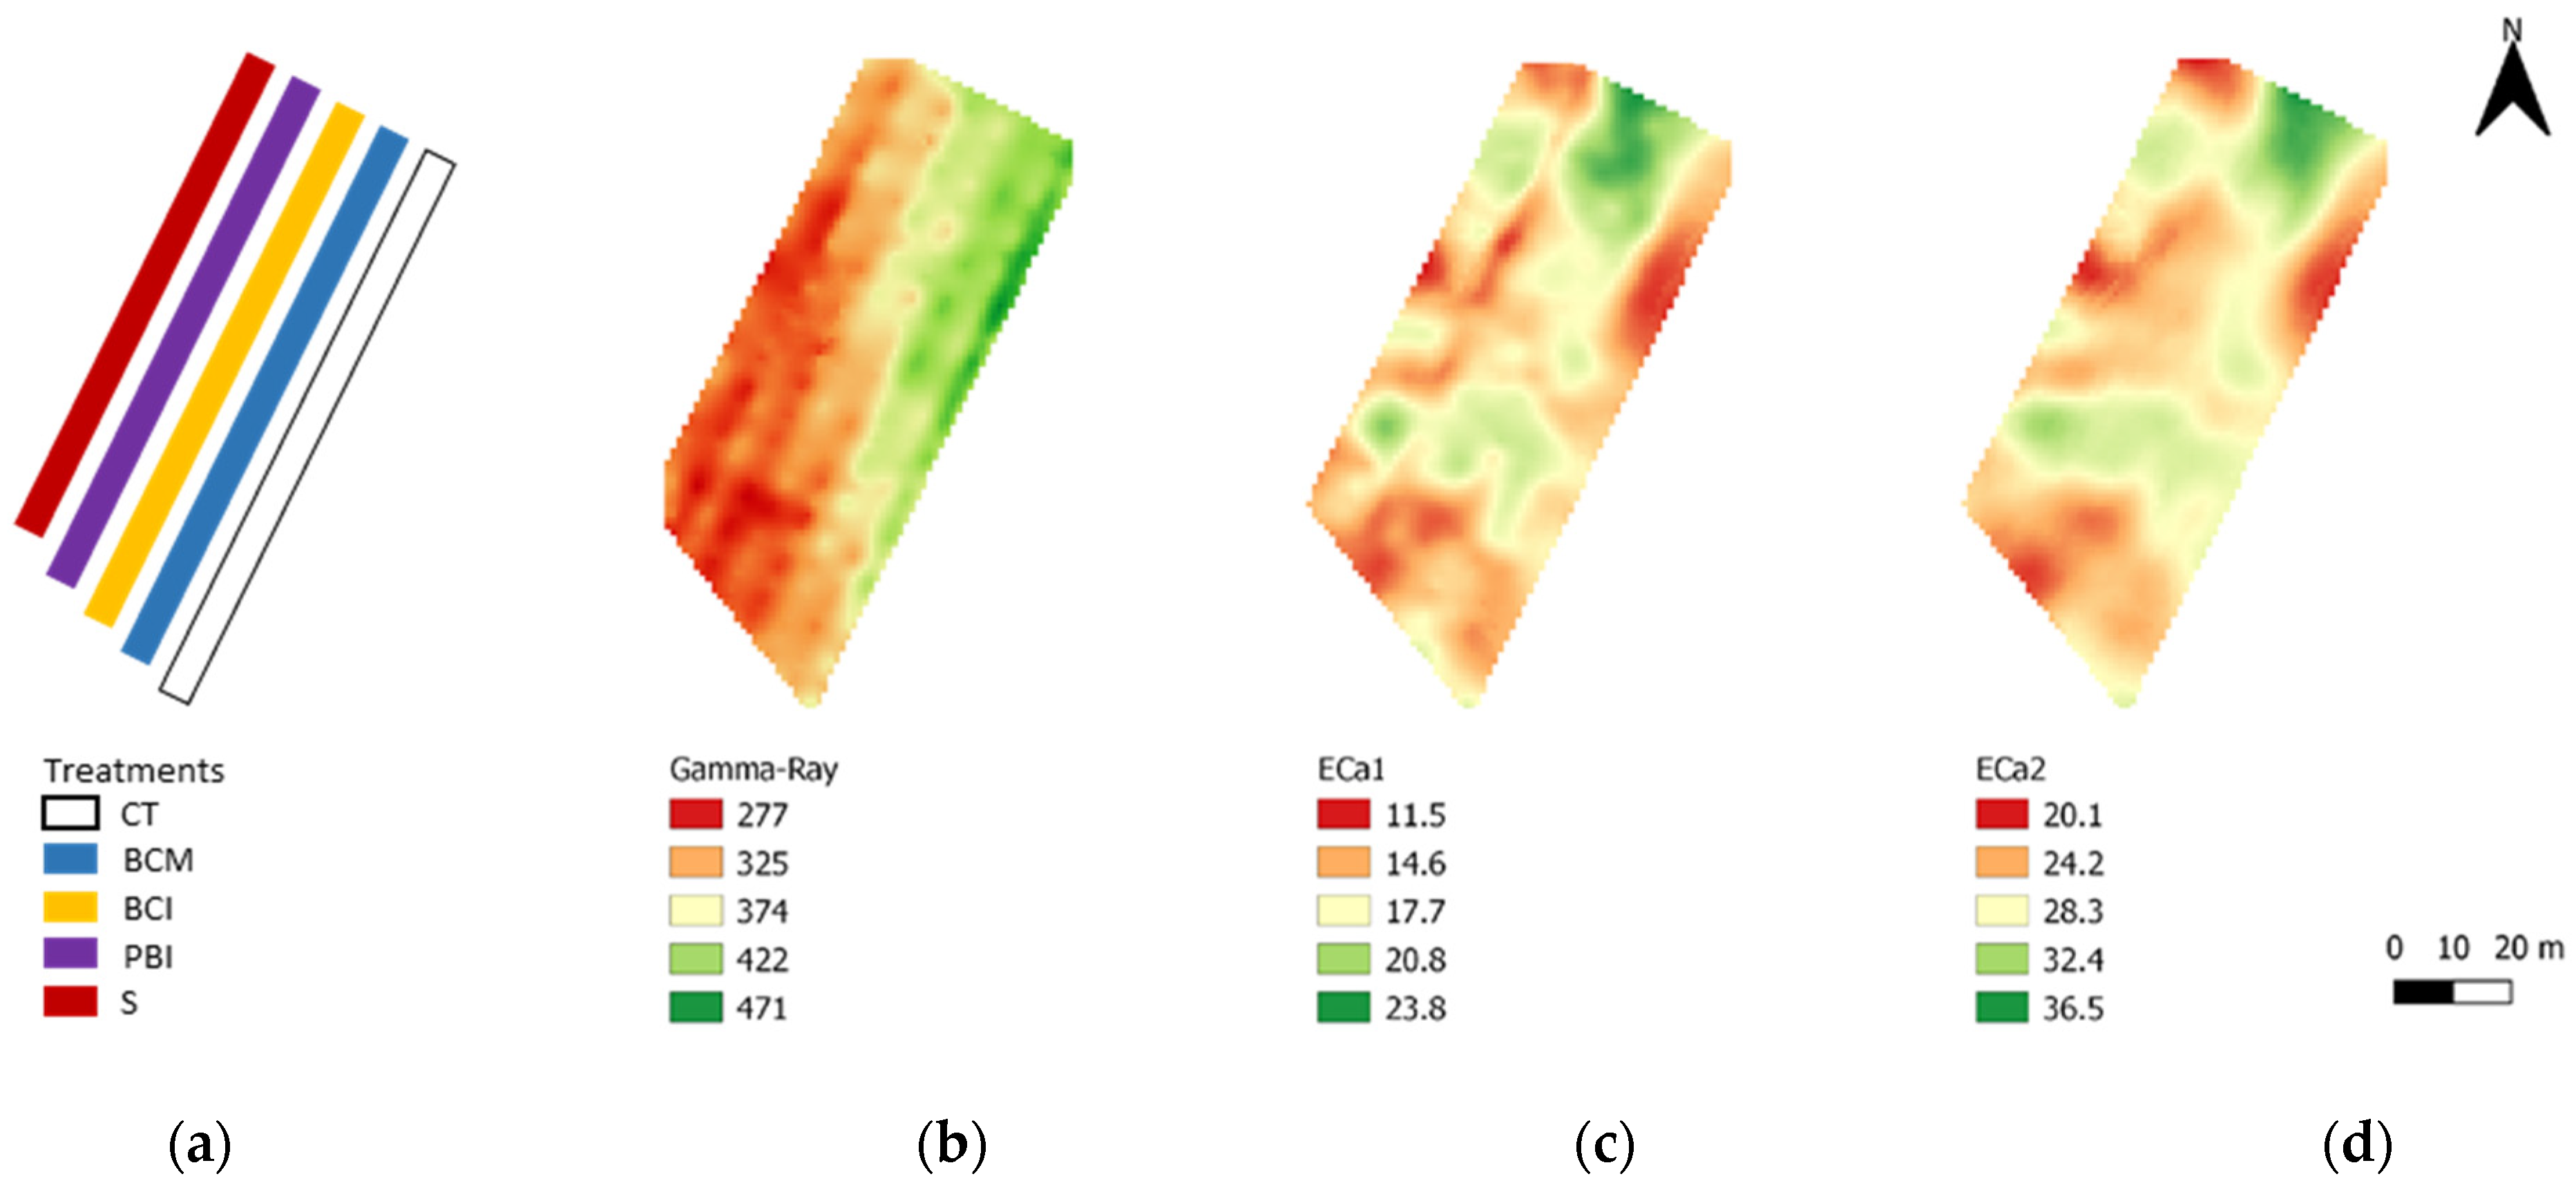
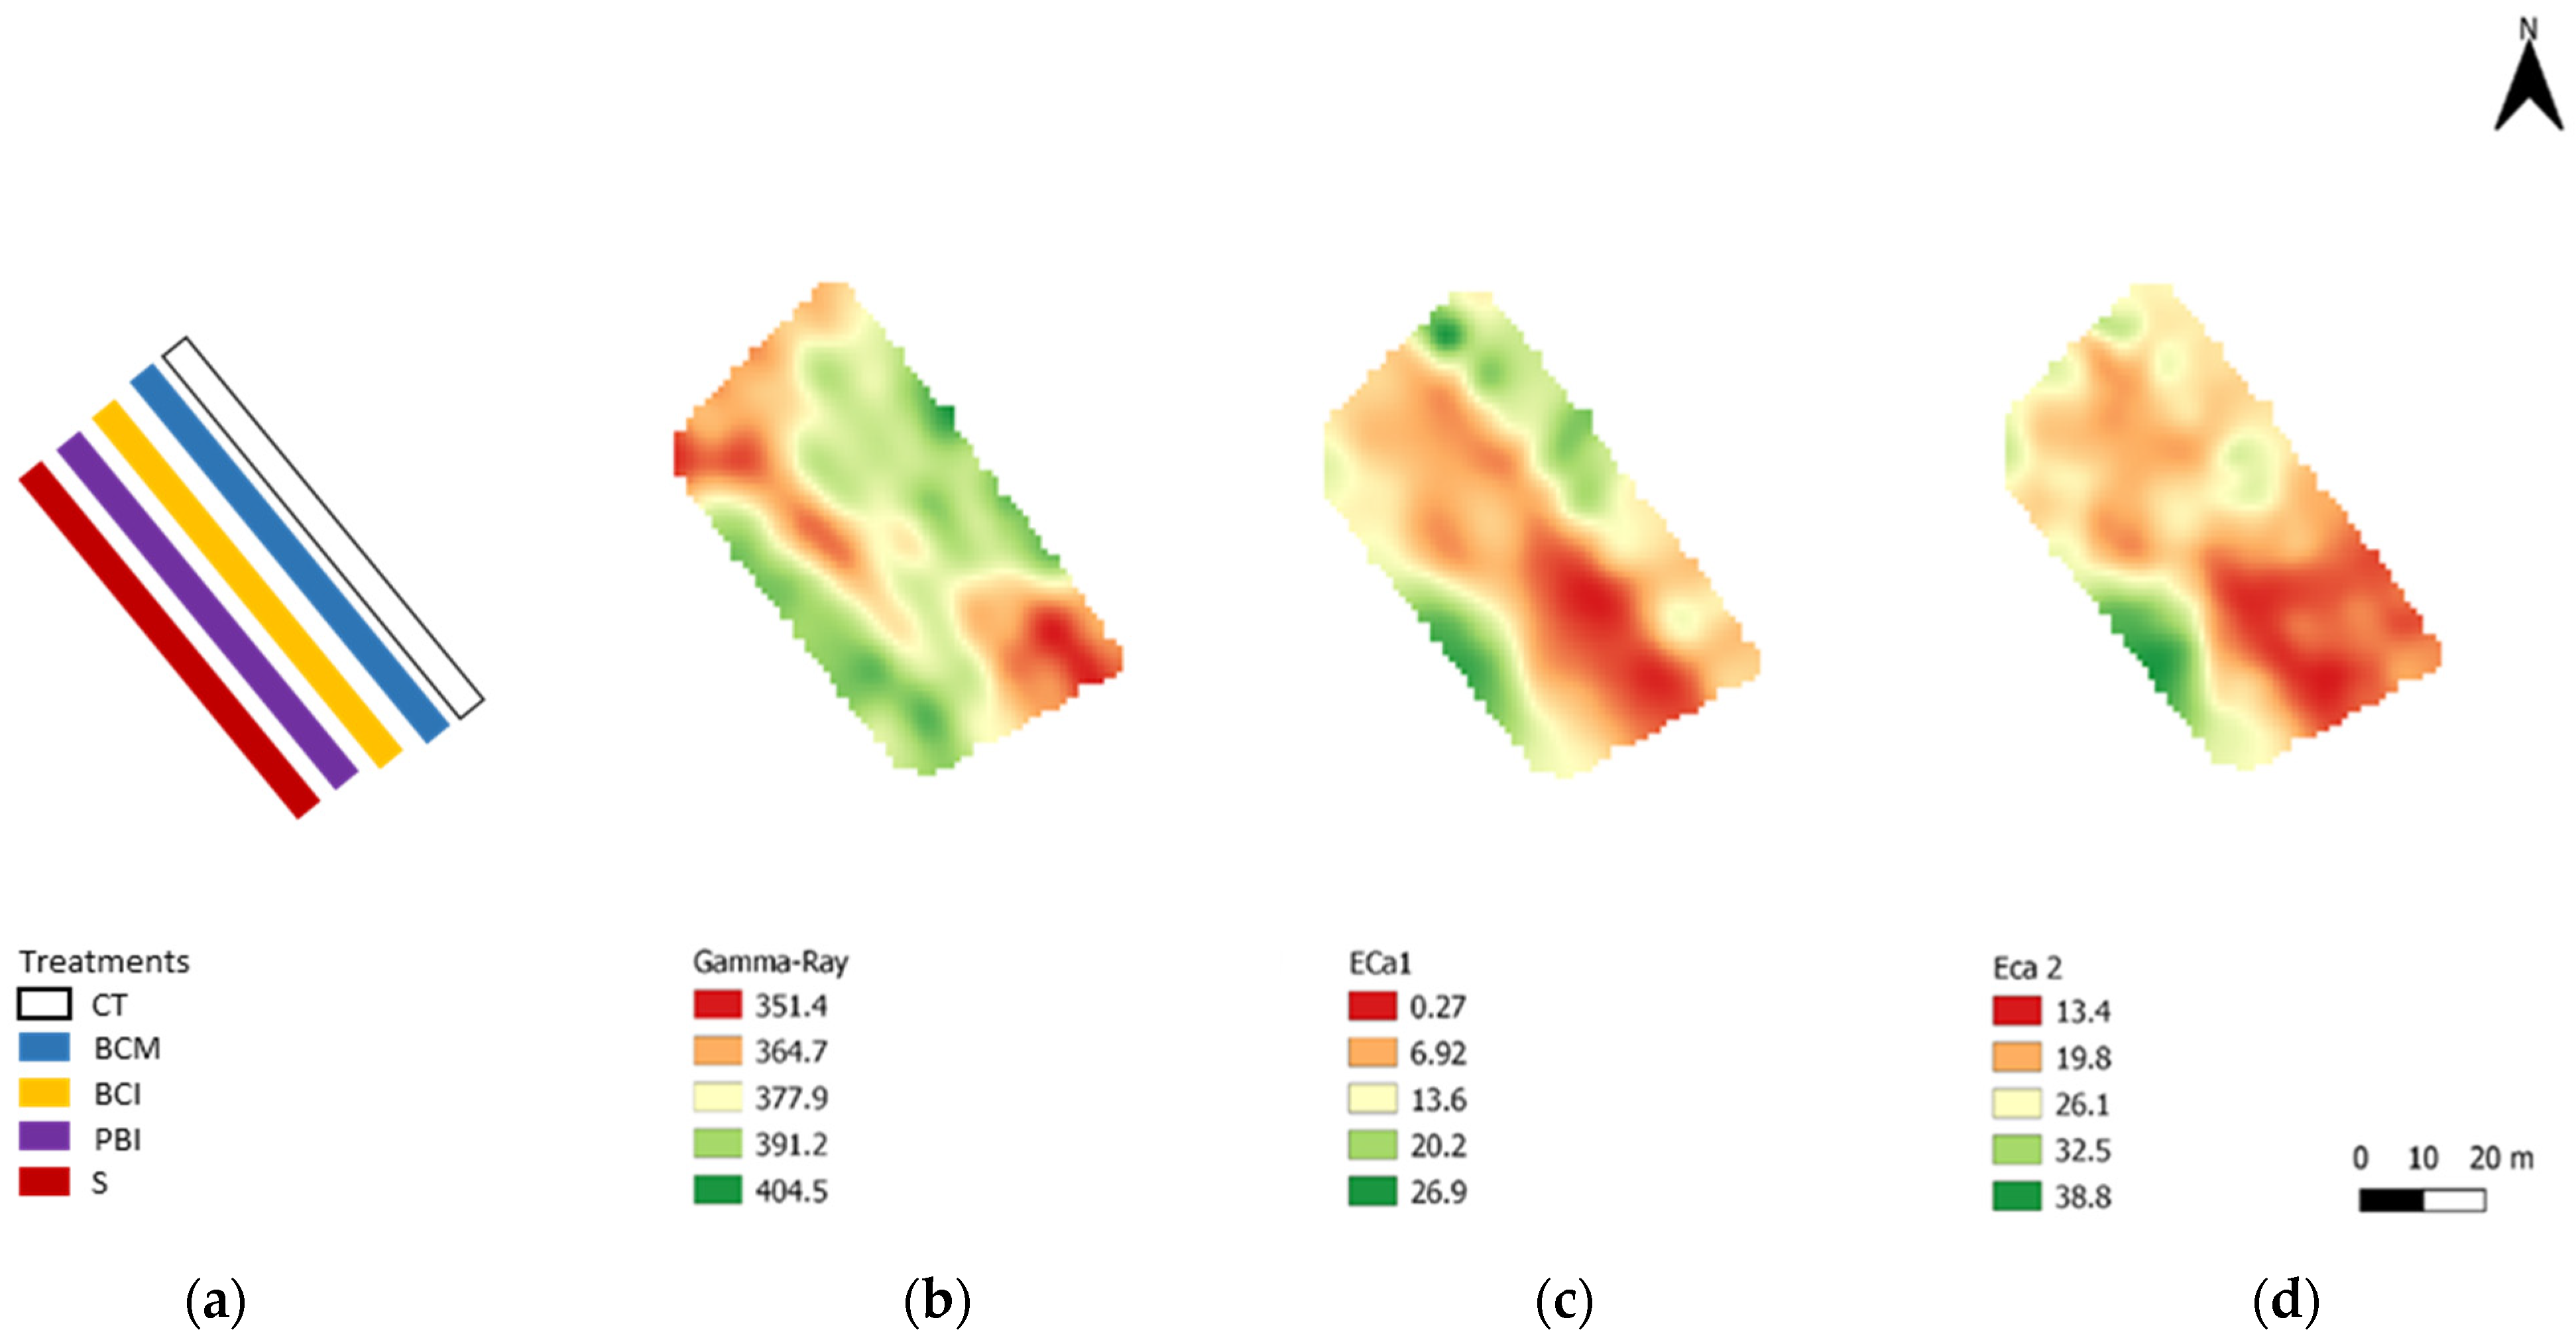
2.2. Soil Variability Surveys

The two experimental sites were preliminary surveyed with two proximal sensors: (i) an EM38-Mk2 electromagnetic induction sensor (Geonics Ltd., Mississauga, ON, Canada) and (ii) “The Mole,” a gamma-ray spectroradiometer (Soil Company, the Netherlands). The former measures ECa across two depth intervals, about 0–75 cm (ECa1) and 0–150 cm (ECa2). The EM38-Mk2 sensor was positioned on a non-metallic cart and pulled by the operator across every other inter-row. “The Mole” is a gamma-ray spectrometer with a CsI (Caesium Iodide) scintillator crystal of 70 × 150 mm, coupled to a photomultiplier unit and a multichannel analyzer system with 512 energy bands. The sensor was placed in a handbag and carried by the operator following the same itinerary of the ECa survey. The gamma-ray spectrometer measures the total spectrum of gamma ray emission from a soil depth varying from 0–30 to 0–40 cm. The gamma-ray spectra were analyzed by “The Gamman” software (Medusa Systems, The Netherlands), using the Full Spectrum Analysis (FSA) [51]. The software allowed to identify and delete data outliers and to process gamma-ray spectrum for calculation of individual radionuclide concentrations (40K, 238U, 232Th) and TC, expressed in Bq·kg−1.
Both sensors were supplied by GPS with metric precision. The advantages of using these instruments to obtain maps of soil spatial variability were extensively explained in [50,52].
Geographical Weighted Regression (GWR) was adopted to estimate the spatial distribution of selected soil parameters. The GWR is a geostatistical method for the estimation of non-stationary data, which includes a spatial weighting function in the regression model [53]. The GWR was preferred to the regression kriging due to the small size of the experimental site (less than 0.5 ha) and the limited number of soil pits (15 in total), which might have affected the correctness of the semi-variogram. The GWR does not need a semi-variogram, but only spatial weights incorporated into the regression, computed from a weighting scheme. The Gaussian weighting function was chosen for all the regression models. The bandwidth of the function determines the distance at which the regression weights, and then the regression coefficients, are recalculated. Bandwidth of the weighting function was set at 30 m, corresponding to the distance which includes at least five sampling points. We used ECa1, ECa2, TC-gamma (gamma ray total count), and the relative slope position (obtained by the digital elevation model) as independent variables to estimate the content of clay, silt, sand, gravel, K, Mg, and total limestone of the two experimental sites. The soil analyses carried out in 2017 were used to calibrate the geographical regression models. The GWR model showed unacceptable errors of prediction of SOM, when using the ECa1, ECa2, TC-gamma, and the relative slope position as predictive variables. Therefore, this set of predictive variables was complemented by the previously estimated maps of clay, silt, and sand. Adding the maps of textural fractions as predictors increased the accuracy of the prediction. GWR was performed by the software SAGA-Gis, which provides the map of the variable selected for regression and the map of coefficient of determination (R2) calculated in each prediction point, since the regression model varies along the space [54]. The R2 map allows to distinguish areas where the regression fits well from areas where the regression shows lower accuracy. For each predicted map, we reported the mean R2, the adjusted-R2 (R2adj), the Root Mean Square error of calibration (RMSE), and the Ratio of Performance to Deviation (RPD), which is the ratio between standard deviation of the calibration points and the RMSE. RPD values higher than 1 demonstrate that the prediction error is lower than the standard deviation of the calibration samples.

2.3. Soil Characterization and Chemical Analysis

An initial soil sampling campaign was conducted in October 2017 prior to the implementation of the treatments and served to characterize the soil at the two experimental sites. A total of 15 soil pits per farm were opened, one per replicate. Samples were taken at three different depths, namely 0–10, 10–30 and 30–60 cm. Soil was air-dried, passed through a 2-mm sieve and analyzed for physical and chemical properties. The soil texture was determined following the USDA classification [55]. SOM concentration was analyzed with the Walkley-Black acid oxidation method [
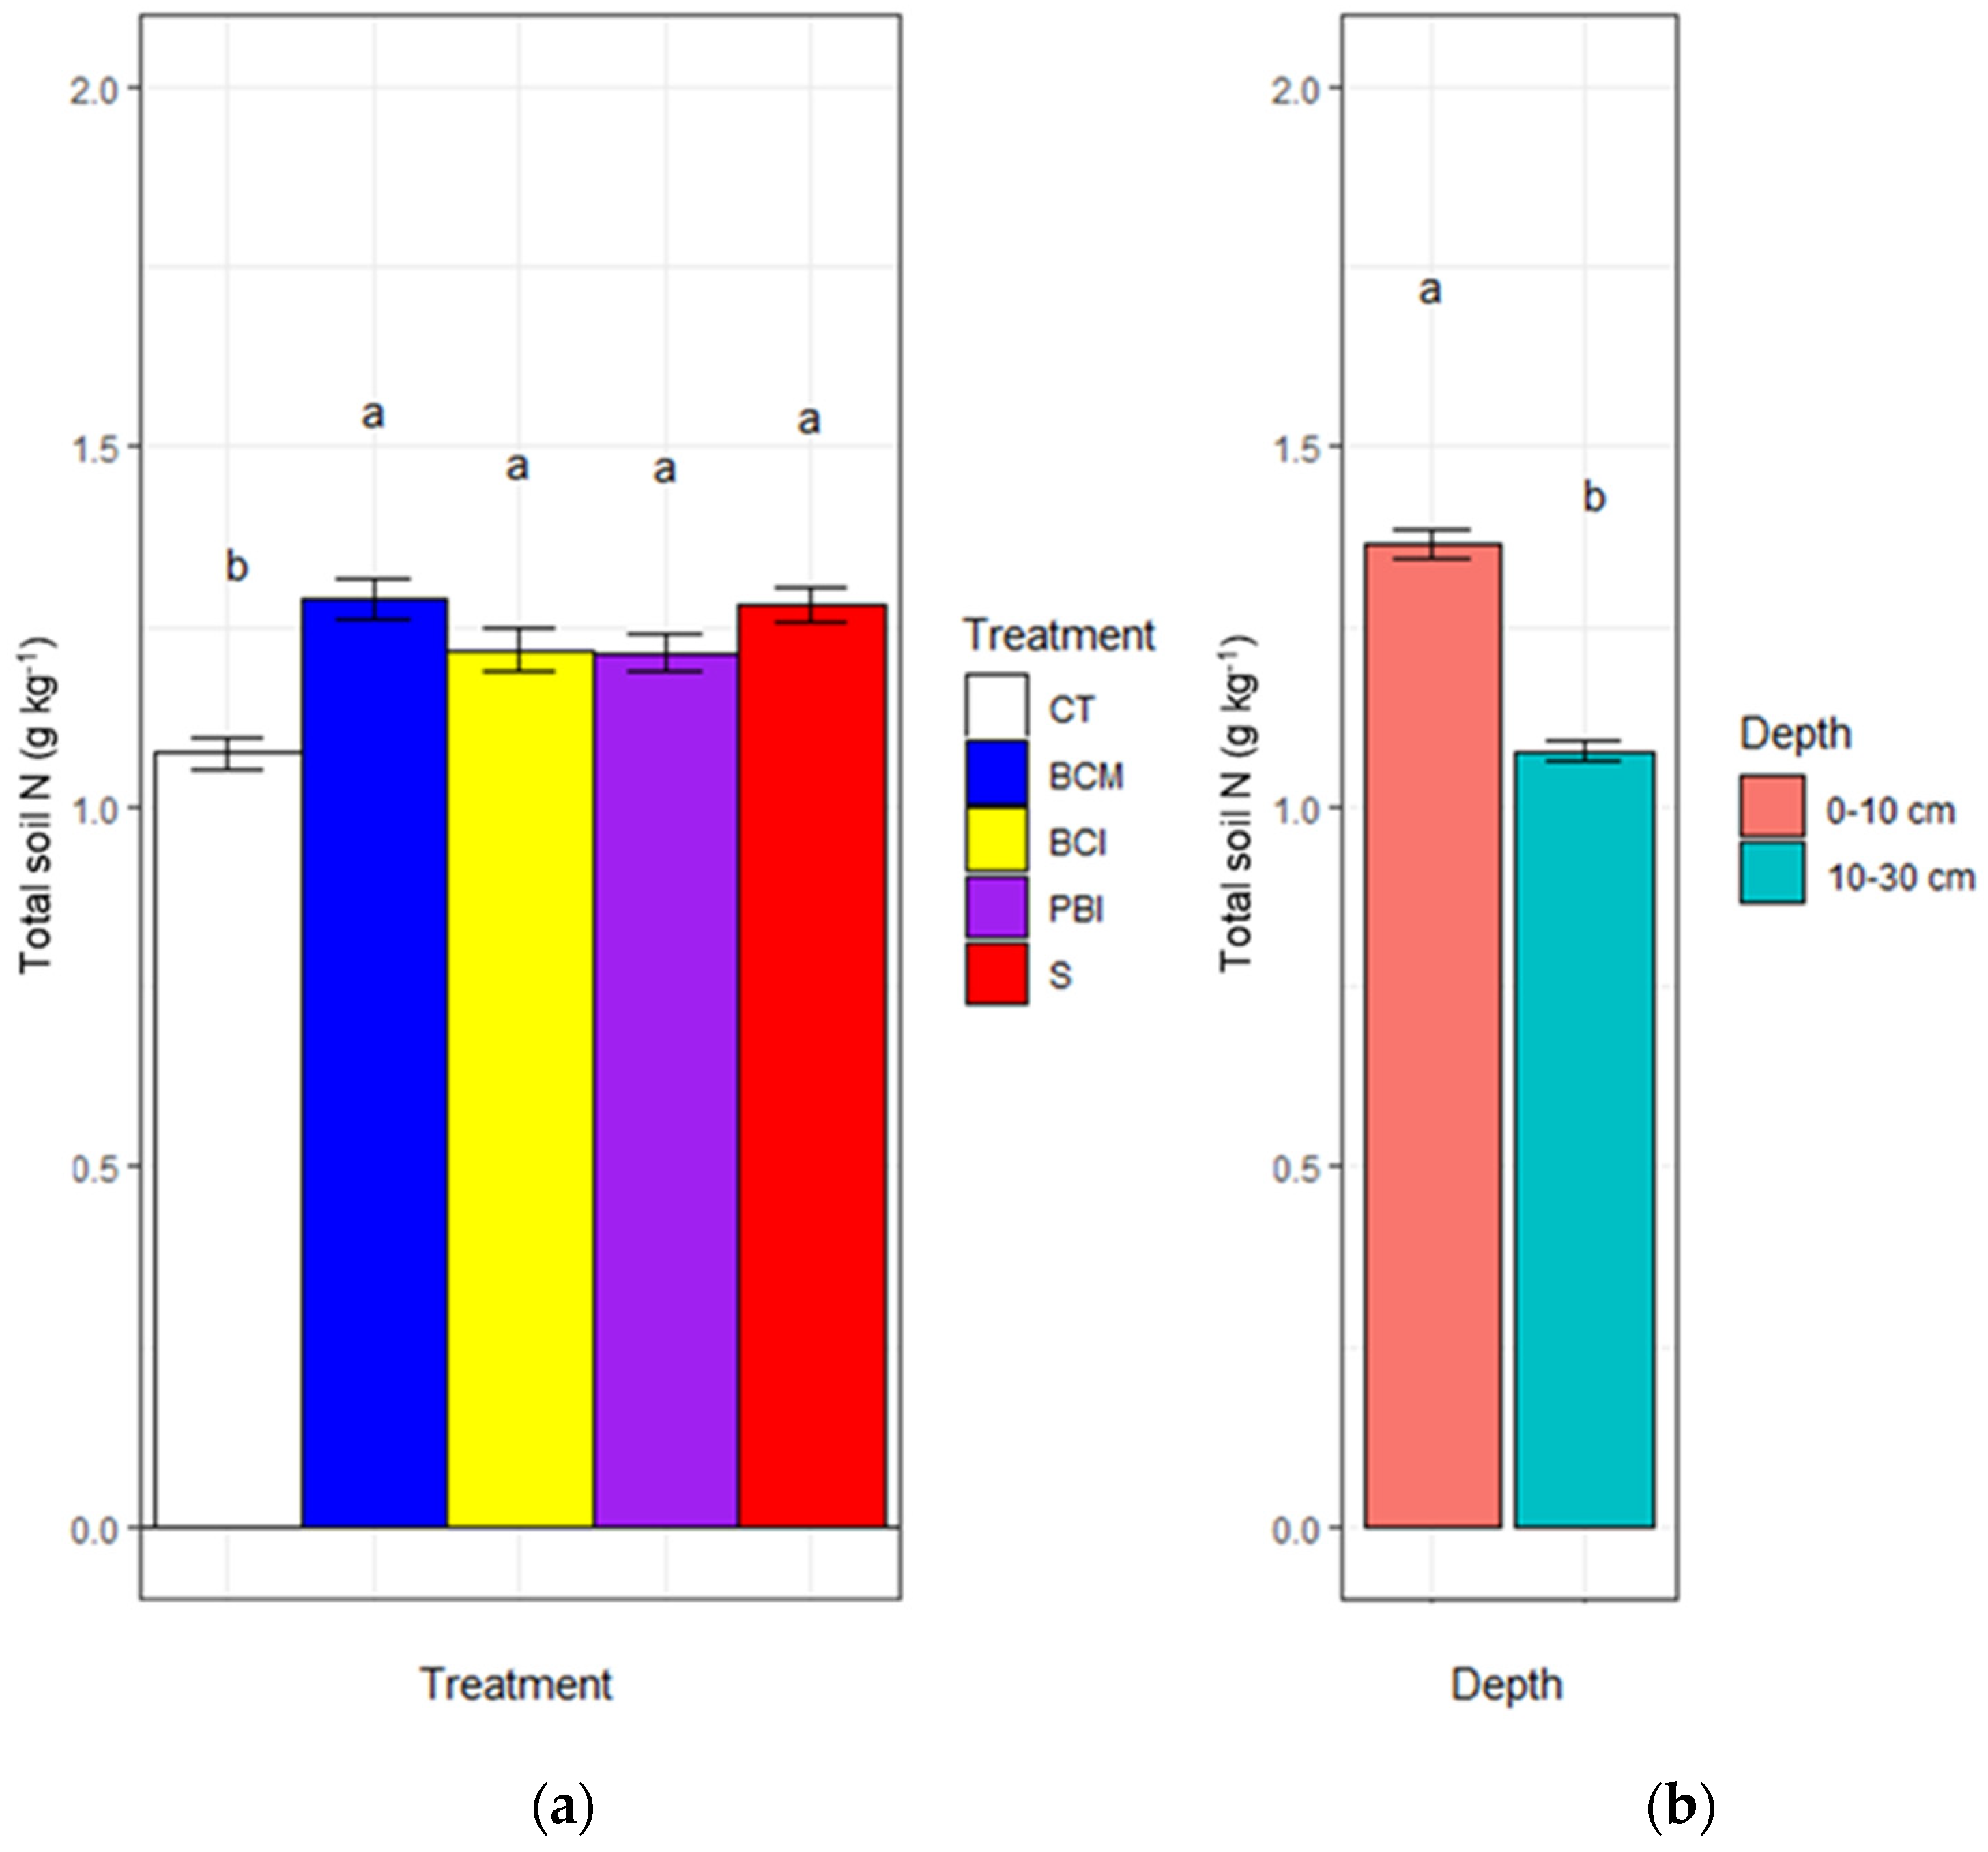
56]. Total N was analyzed with the Kjeldahl method [
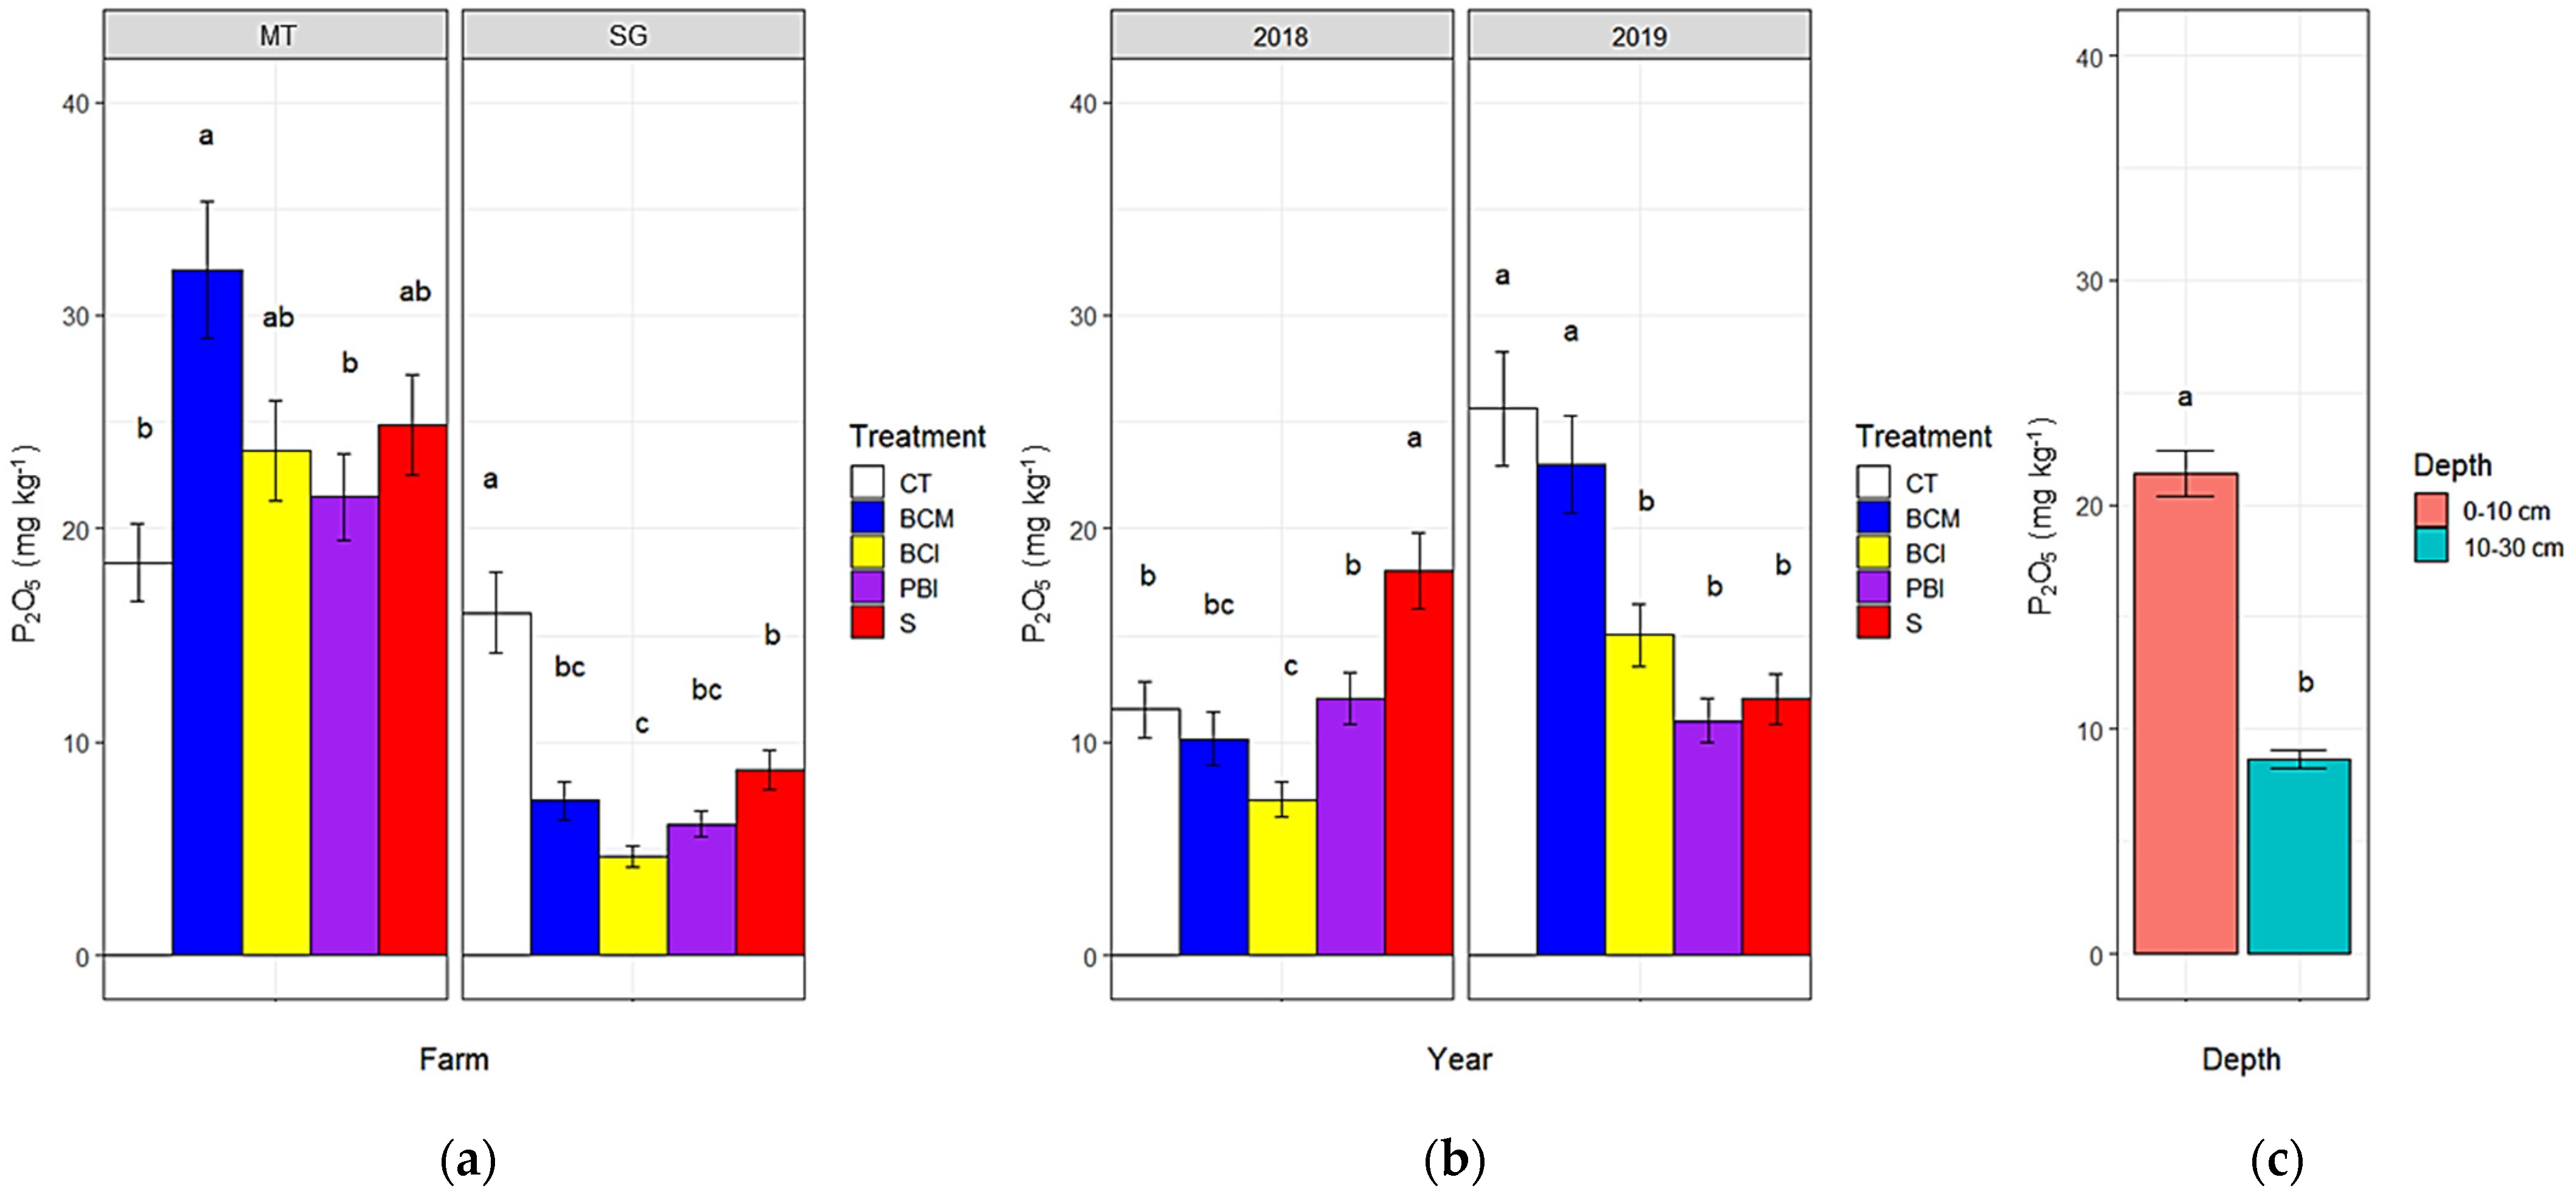
57]. Available P2O5 was analyzed with the Olsen method [58]. Exchangeable K, Ca and Mg were analyzed with the barium chlorine method [59]. Active lime was analyzed with the Drouineau method [60], while the total carbonate was analyzed with the volumetric method [61]. Gravel was visually estimated in field through the charts for estimating proportions of coarse fragments and expressed as volumetric percentage [62].
The second and third soil sampling campaigns were carried out in both farms in November 2018 and January 2020, respectively. A composite sample of three sub-samples collected over an area of one square meter was taken in each of the three replicates. Samples were taken at 0–10 and 10–30 cm depths. The geographical coordinates of each sampling point were recorded by a centimetric GNSS rtk (Emlid Reach rs+, Lora connection).

2.4. Soil Physical Analysis

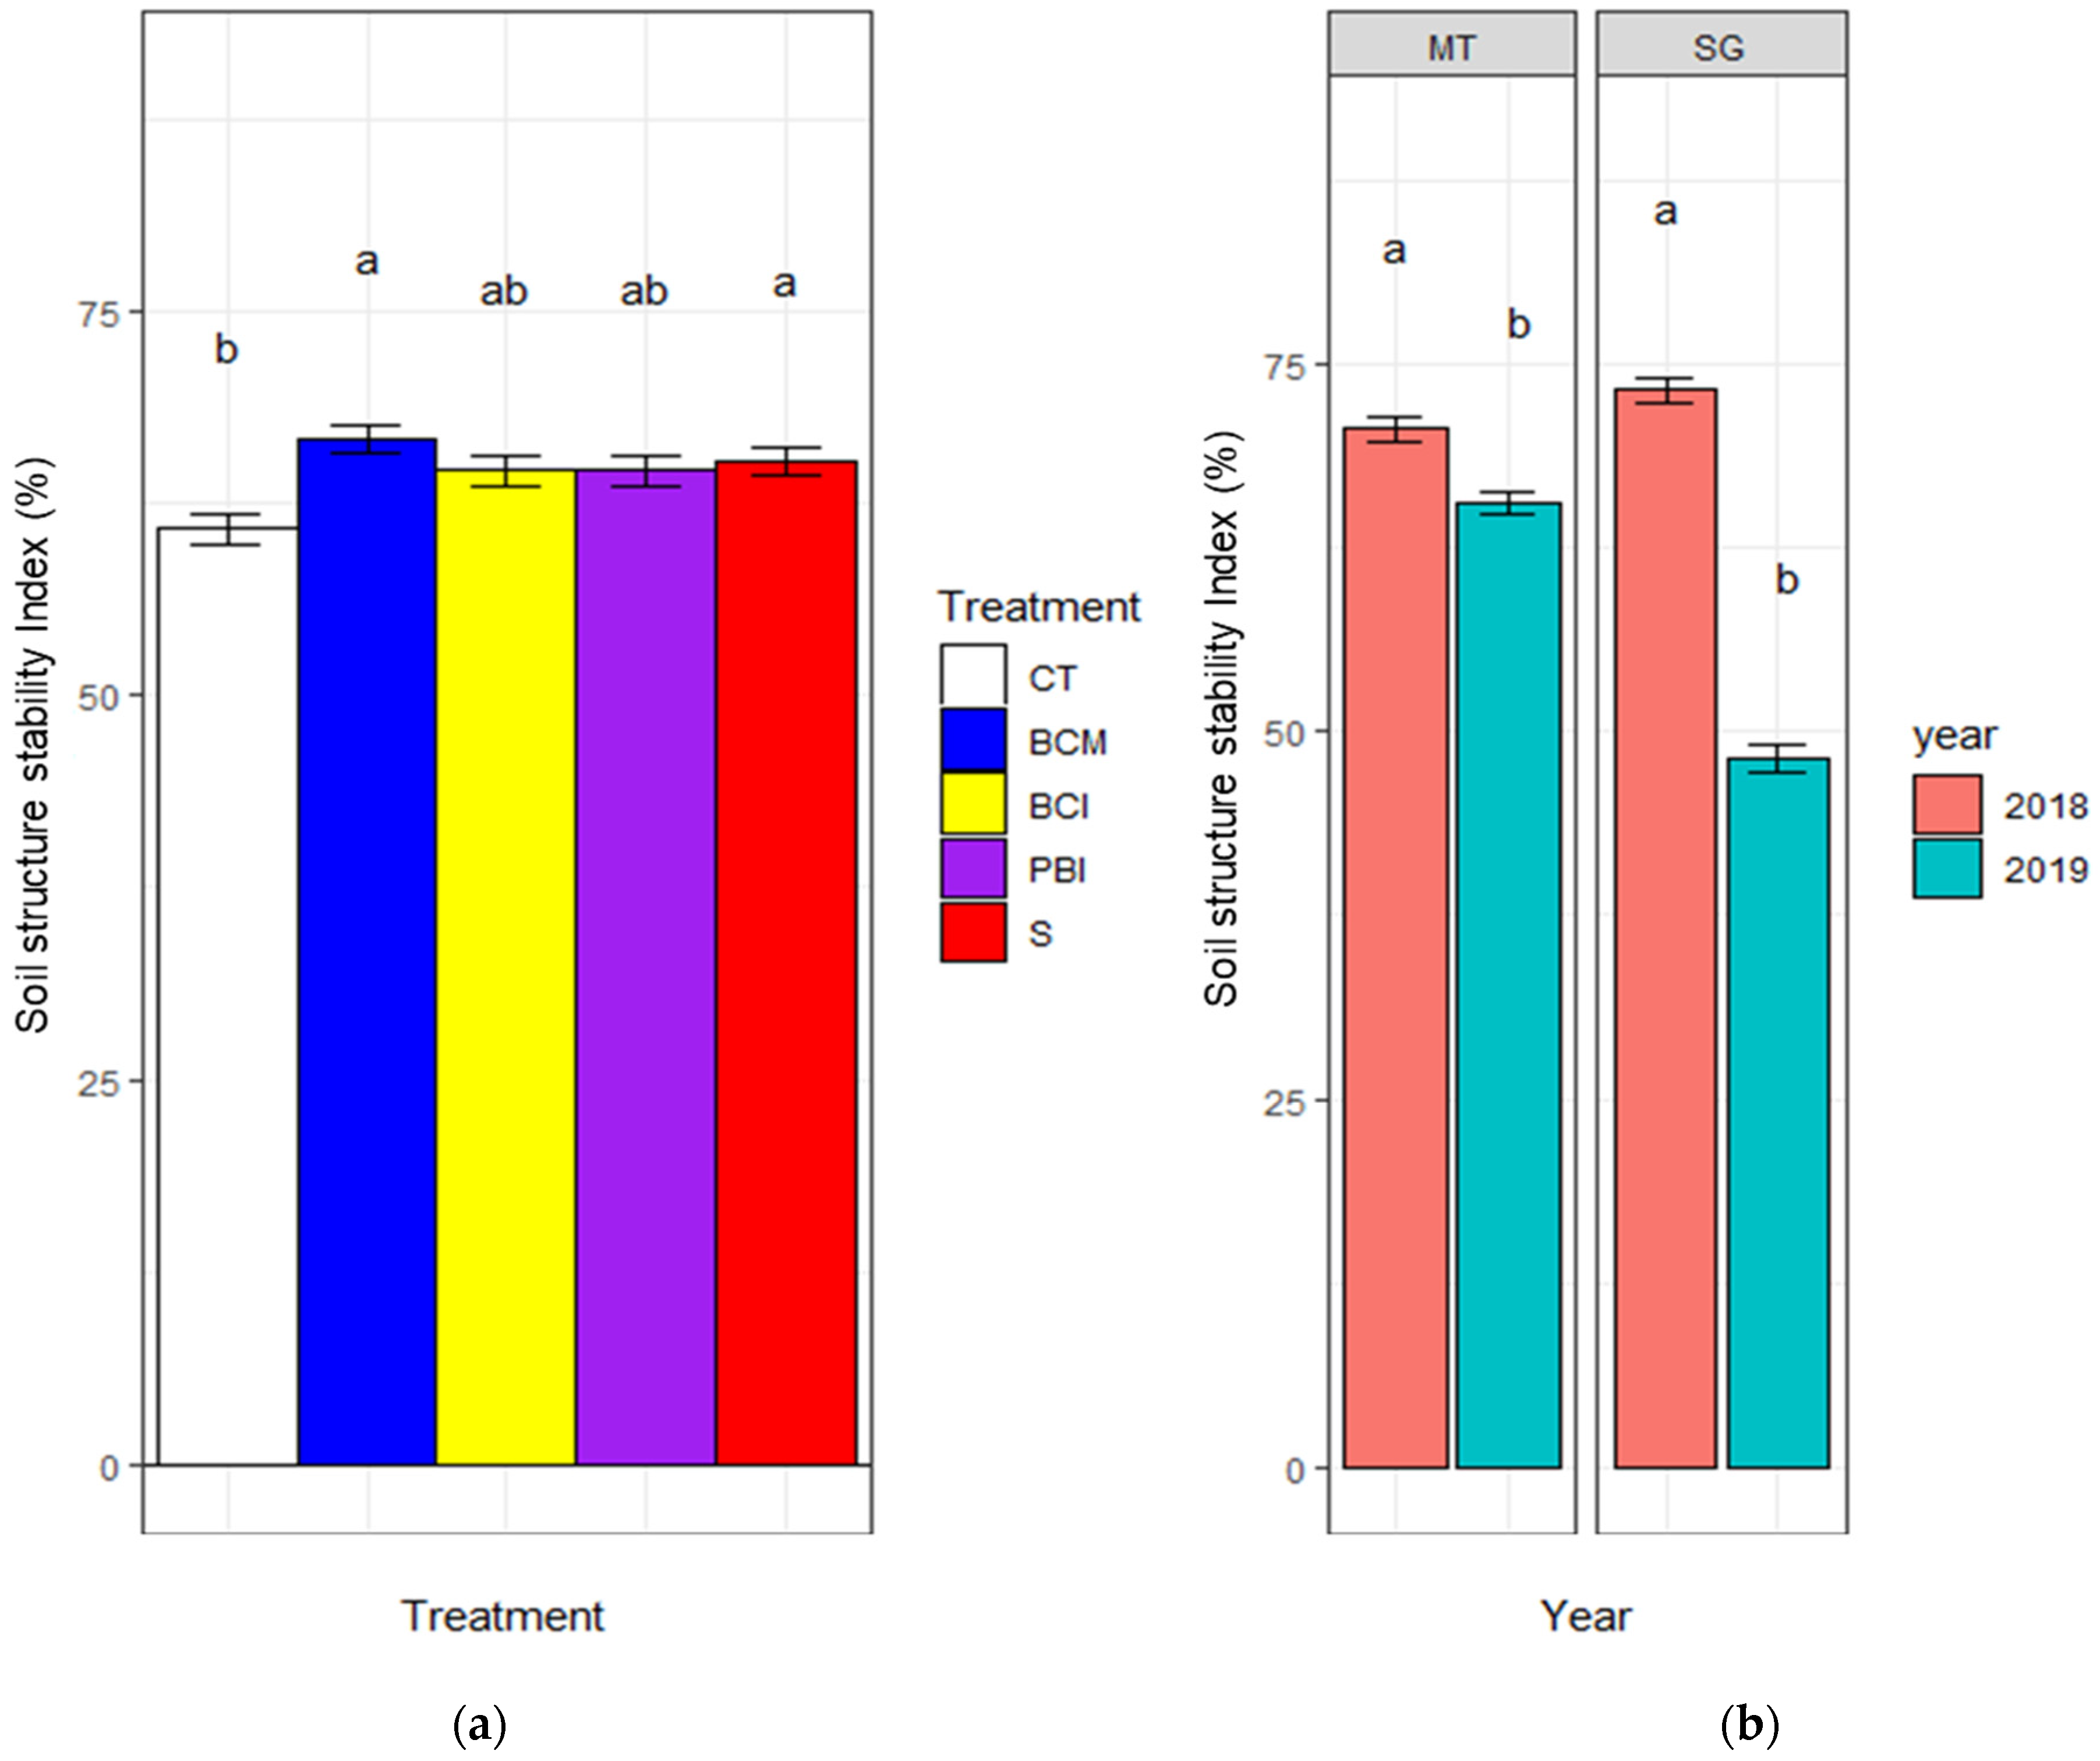
Soil physical analysis included the Structure Stability Index and Soil Penetration Resistance. Soil samples for structure stability index were taken in November 2018 and January 2020 at both experimental sites. A gauge shovel was used to take a composite sample from the middle of each replicate. Two different depths ranges were sampled, namely 0–10 and 10–30 cm. Samples were air dried, passed through a 2 mm sieve and then analyzed. Structure stability index was determined using wet sieving with vertical oscillation (30 oscillations per minute) as described by the authors of [63]. Specimens of 10 g aggregates of 1–2 mm size (weight A) were used for the analysis. The aggregate specimens were wetted by capillarity and then sieved (0.2 mm sieve) in water for 30 min and re-weighted (weight B). After this treatment, aggregates > 0.2 mm were dried at 105 °C and weighted (weight C). The stable aggregates were then dispersed with sodium hexametaphosphate, sieved with distilled water, dried and weighted (weight D). The structure stability index was calculated as follows:
Structure stability index = [(C − B)−(D − B)/(A − (D − B))] × 100 = [(C − D)/(A + B − D)] × 100
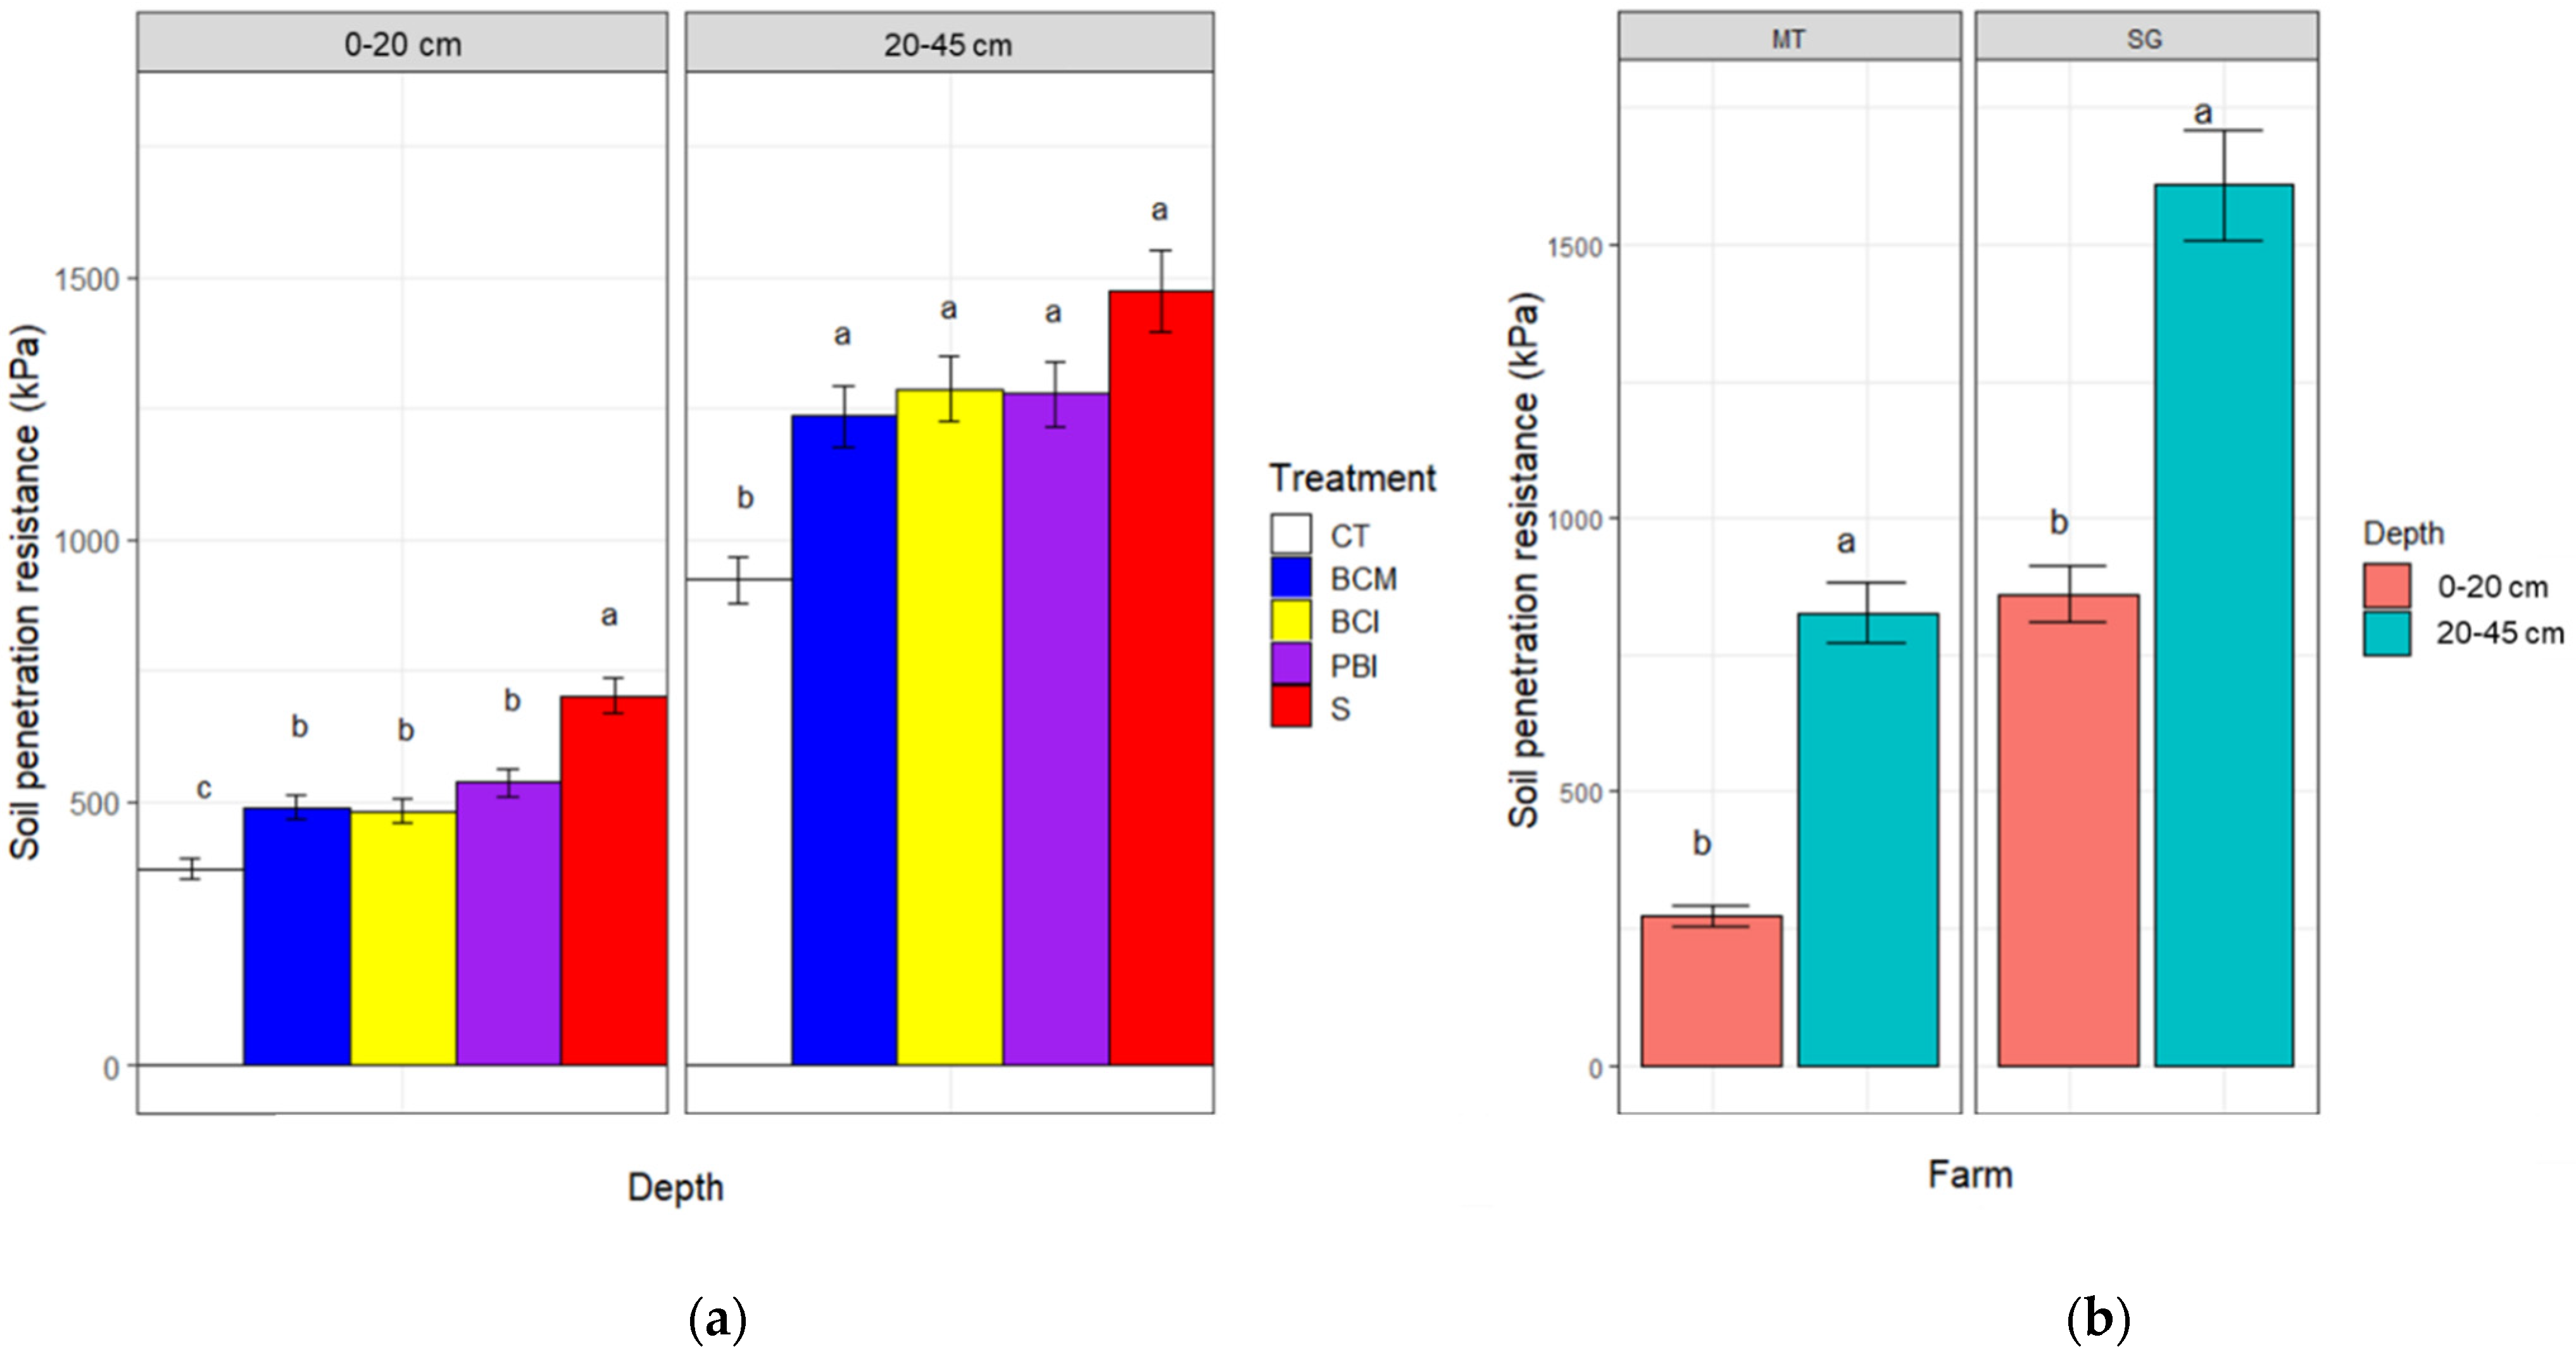
A Fieldscout SC 900 Soil Compaction Meter (Spectrum technologies Inc., Aurora, IL, US) was used to collect soil penetration resistance data (cone tip size = ½ inch). Two sampling campaigns were carried out, one in December 2018 and one in February 2020. A total of five sampling points per each replicate were surveyed in each inter-row which had received the treatment. Tractor wheel tracks were avoided by sampling in the central part of the inter-row space. Soil penetration resistance was recorded every 2.5 cm across the 0–45 cm depth range. Given the high percentage of gravel (especially at MT), the soil penetration resistance dataset was screened for outliers. Specifically, measurements with soil penetration resistance increments higher than 300 kPa cm−1 were identified as stones and excluded from the dataset, as suggested by the authors of [64]. The geographical coordinates of each sampling point were recorded by a centimetric GNNS rtk. The values of soil penetration resistance measurements at each 2.5 interval were averaged across the 0–20 and 20–45 cm layers.

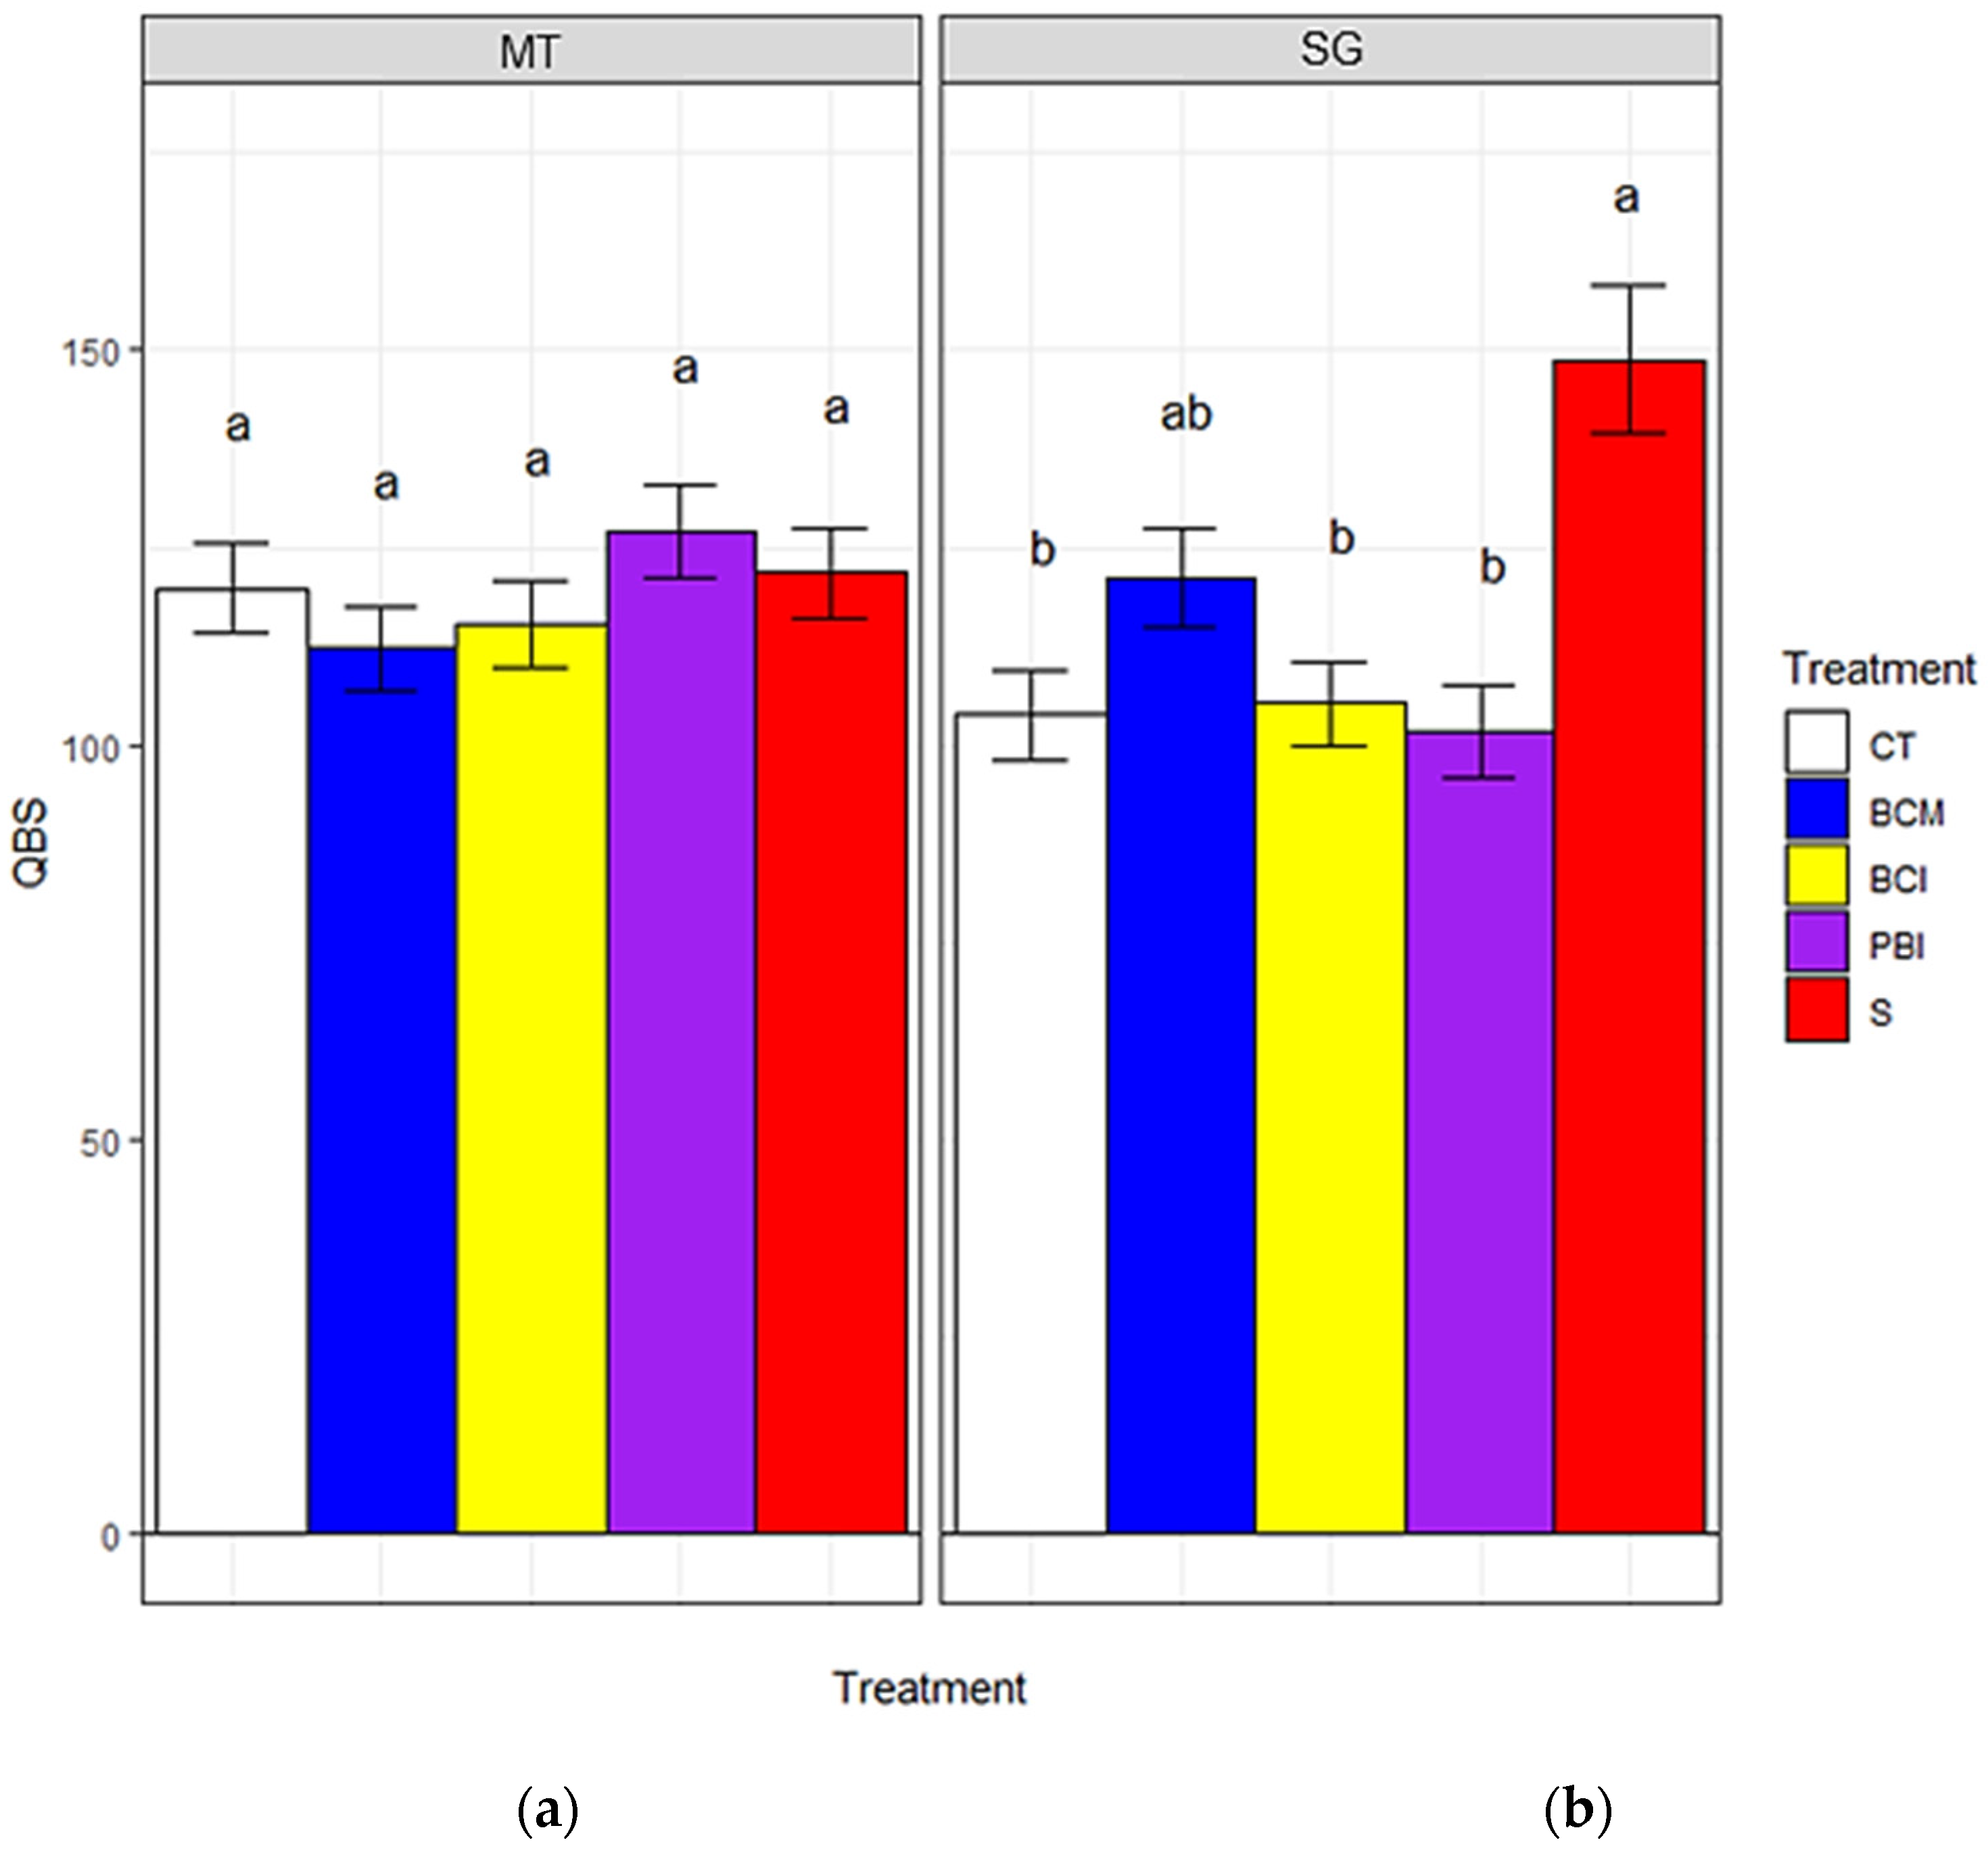
2.5. Soil Biological Quality Index

The Soil Biological Quality (QBS-ar) index was adopted as a proxy for soil biological health. Soils were sampled in November 2018 and January 2020 at both farms. Three 10 cm3 undisturbed soil samples were taken per each replicate in the inter-row that had received the treatments. Undisturbed samples were placed in a Berlese funnel to extract micro-arthropods for 7 days. Light bulbs were placed above the samples in order to stimulate microarthropods to move towards the bottom of the funnel and be collected in a preservative solution (75% ethanol). The harvested micro-arthropods were analyzed through a stereo microscope (20–40×) and the Eco-Morphological Index (EMI) was attributed per each taxon. GPS coordinates were taken for each soil sample. A detailed explanation of the QBS-ar methods is reported in [65].

2.6. Statistical Analysis

The soil maps (clay, sand, silt, K, Mg, gravel, total limestone) were used to extract the values of the selected soil parameters according to the geographical coordinates where the soil samples were taken in both experimental years. We used these parameters as covariates in our statistical model at both experimental sites. The extrapolation of soil covariates was carried out in QGIS 3.6.3 (“join by location function”).
Variable selection was carried out by choosing, among all possible variable subsets, the model with no interactions which showed the minimum BIC (bestglm—best-glm package). Such variables were used to feed the Feasible Solution Algorithm (FSA—rFSA package), allowing the algorithm to include interactions. FSA solutions are optimal in the sense that no single swap to any of the variables will increase the criterion function (BIC). FSA was firstly used to study the data from 2017 taken prior the implementation of the trial. This served to investigate differences across the inter-rows where the treatments would have been implemented and which were coded as “Treatment-T0.” Treatment-T0 was never selected by FSA as a critical factor for SOM, N, P2O5 and K, thereby suggesting that any soil variability between and within inter-rows could be controlled by soil covariates. Best-glm and FSA were then used to analyze the data collected in 2018 and 2019 following the implementation of the treatments. We included “treatment” as fixed variable when it was not specified by best-glm. Generalized Linear Models (GLM) with Gamma distribution and logarithm link function were used for the analysis of N, SOM, P2O5, K, QBS and soil penetration resistance (lme4 package). Soil structure stability index was analyzed with a linear model. In all cases, residuals were assessed visually and a Shapiro–Wilk test was performed. Analysis of variance (type III SS) was used to check for statistically significant variables from each model (linear or GLM) fit. Estimated marginal means were used to obtain p-value corrections, with Tukey’s post hoc test (α = 0.05). All statistical analyses were performed in R (version 3.4.3, 2017).

3. Results

3.1. Soil Variability Surveyed through ECa and Gamma-Ray

At SG, gamma-ray TC were on average 357 Bq kg−1 while ECa in the shallower (ECa1) and deeper (ECa2) layers, respectively, spanned from 11.5 to 23.8 (mean = 16.8) mS m−1 and 20.1 to 36.5 (mean = 27.2) mS m−1 (Figure 2). In this farm, gamma-ray TC showed marked differences between the northeast, ranging between 400 and 470 Bq kg−1, and the southwest portion of the vineyard, ranging from 277 to 325 Bq kg−1 (Figure 2b). Conversely, ECa values did not show such a net differentiation. Rather, ECa1 and ECa2 highlighted patches of high (e.g., central part on the north edge) and low ECa (e.g., south portion) (Figure 2c,d). The difference of gamma-ray TC between the eastern and western parts of the vineyard can be probably explained by slightly different topsoil features. In particular, the topsoil of the eastern part of the vineyard has a higher clay content, 27–29% versus about 20% of the western part.
At MT, gamma-ray TC were on average 375 Bq kg−1, while ECa1 and ECa2 ranged from 0.27 to 26.8 (mean = 10.8) and 13.4 to 38.8 (mean = 22.4) mS m−1 (Figure 3), respectively. Gamma-ray TC were particularly low in the southeast and northwest portions of the experimental site (Figure 3b). ECa showed, in general, lower differences as compared with gamma-ray TC. Nevertheless, ECa1 highlighted high ECa values in the northeast and southwest corners of the plot. ECa2 showed a generally lower soil heterogeneity at deeper soil layers and an area of high EC on the southwest portion of the vineyard, which was consistent with ECa1 values.
In both the farms, the maps of the highest gamma-ray radionuclide (40K) followed the pattern of the TC, whereas the other two radionuclides (238U, 232Th) showed low values and high noise within the vineyard. This is probably due to the homogeneity of the mineralogy of the soil parent materials, which had mainly calcareous and was poor in U and Th. For these reasons, only gamma-ray TC was used as covariates for soil features mapping interpolation.
Overall, ranges and means of ECa and gamma-ray TC were similar at the two experimental sites. Indeed, the soil texture was comparable, but the two farms differed in terms of: (i) gravel, which was higher at MT (from 23 to 37%) than at SG (from 7 to 20%); (ii) SOM, which was on average 50% higher at SG; (iii) active limestone, with higher and more variable values at SG (mean = 13.4%) than at MT (mean = 6.2%) (Table 1).
The soil maps produced using the GWR showed in general a better fit at SG due to the higher soil variability that characterizes this site. Total limestone, K, sand and silt were the soil parameters showing higher mean R2, R2adj and RPD for GWR models at SG (Table 2). By contrast, gravel and SOM displayed lower mean R2 and R2adj. This is mainly due to the great homogeneity of these parameters within the vineyard. The standard deviation of SOM and gravel of the calibration points was very low: 0.15 g 100 g−1 and 4.1%, respectively. The RPD of the GWR models of SOM and gravel were higher than 1, and the errors of the models were lower than the standard deviation.
A different scenario was observed at MT, where a more homogenous soil resulted in generally lower R2 values. Here, mean R2adj values higher than 0.45 were calculated only for SOM, total limestone and gravel. The GWR models showed negative R2adj for sand and silt, but the errors of the models were anyway lower than the standard deviation of the calibration points, as demonstrated by the RPD of 2.9 and 3.0 (g 100 g−1).

3.2. Effects of Soil Management on Soil Chemical Health

3.2.1. Soil Organic Matter

Soil organic matter concentration was significantly affected by treatment, farm, depth and by the interaction [Farm × Depth]. BCM and S showed significantly higher values of SOM as compared to CT (Figure 4a). BCI and PBI had a higher SOM in comparison with CT but did not differ significantly from the other treatments. SOM decreased with depth at both sites; on average, we found 92% and 40% higher SOM at 0–10 cm than at 10–30 cm at MT and SG, respectively (Figure 4b).

3.2.2. Soil Total Nitrogen

Soil Total N concentration was significantly affected by treatment, depth and gravel content (Table 3). CT significantly decreased total N concentration as compared with the other treatments (Figure 5a). Therefore, neither CC type nor termination strategy affected N. Overall, N was on average 27% higher at 0–10 cm (1.40 g kg−1) than at 10–30 cm (1.11 g kg−1) (Figure 5b).

3.2.3. Soil Available P2O5

Soil P2O5 was characterized by large variability across years, treatments and experimental sites. P2O5 was significantly affected by treatment, year, depth and by the tested interactions, i.e., Treatment × Year and Treatment × Farm (Table 4). Different trends were found across treatments at the experimental sites (Figure 6a). CT showed the lowest P2O5 concentration at MT, but it was only significantly different from BCM. Conversely, P2O5 was higher under CT at SG, where it was significantly different from all the other treatments, and the two CC incorporated in spring (BCI and PBI) showed the lowest P2O5 concentration. In the treatments with groundcover mulching (S and BCM), P2O5 was higher than in the treatments where CC were incorporated. High P2O5 fluctuations among treatments were also found across years (Figure 6b). Concerning depth, P2O5 was on average about 2.4 times higher at 0–10 cm (22.2 mg kg−1) than at 10–30 cm (9.1 mg kg−1) (Figure 6c).

3.2.4. Soil Exchangeable K

Treatments did not affect K concentration in soils. However, K differed per farm, depth and total limestone and SOM concentration (Table 5). K concentration was about 31% higher at SG than at MT and 29% higher at 0–10 cm than at 10–30 cm depth.

3.3. Effects of Soil Management on Soil Physical Health

3.3.1. Soil Penetration Resistance

Soil penetration resistance was affected by treatment, depth, gravel, farm and by two interactions [Treatment × Depth] and [Depth × Farm) (Table 6). As expected, we found marked differences across treatments at 0–20 cm depth (Figure 7a). Mulched spontaneous vegetation increased soil penetration resistance significantly as compared with all the other treatments. CT significantly decreased soil penetration resistance in comparison with all the other treatments. A different trend was observed at 20–45 cm depth: treatments including CC and spontaneous vegetation did not differ significantly among them and had higher soil penetration resistance than CT, probably due to the higher soil moisture in tilled soil (data not shown), which facilitated the penetration in those plots. Overall, soil penetration resistance was significantly higher at 20–45 cm than at 0–20 cm at both experimental sites (Figure 7b).

3.3.2. Soil Structure Stability

The soil structure stability index was significantly affected by treatment, farm, year, total limestone and by the interaction [Farm × Year] (Table 7). CT decreased structure stability index significantly as compared to S and BCM (Figure 8a). CC incorporated into the soil showed structure stability values, which were lower than mulched treatments but higher than CT. Still, those differences were not statistically significant. The structure stability index was significantly higher in 2018 as compared with 2019 at both farms (Figure 8b).

3.4. Effects of Soil Management on Soil Biological Quality Index

The Soil Biological Quality Index (QBS) was only affected by the Treatment × Farm interaction (Table 8). No significant differences among treatments were found at MT, while at SG, the treatments without spring tillage (BCM and S) had the highest QBS values (Figure 9). QBS under S (149) was significantly higher than in the other treatments except BCM, while BCM did not show any significant differences with the other treatments.

4. Discussion

4.1. Effects of Soil Management on Soil Chemical Health

4.1.1. Soil Organic Matter

After accounting for the soil variability across the experimental sites, we found significant effects of the mulched CC and spontaneous vegetation on SOM as compared to CT (Figure 4). This suggests that while CC represents an important OM input, the effect of spring tillage negatively affected SOM accumulation. In other words, the combination of soil cover—either spontaneous or sown—with mulching is critical to trigger SOM accumulation. Our results are in accordance with the literature. Numerous studies found a sharp increase in SOM under mulched groundcovers as compared to tilled soil [13,66,67,68]. Still in agreement with our results, Novara et al. (2020) found a very limited and non-significant increase in SOM following eight years of faba bean CC incorporated in spring. The lower SOM associated with CT could be a result of the lower C input associated with spontaneous vegetation incorporation, a higher mineralization rate triggered by tillage, as well as of the increased exposure of tilled soils to erosive processes [32], which are much less pronounced when vegetation is left as surface mulch. Conversely, the significant SOM accumulation under mulched treatments could have been stimulated by the combined effect of the OM input provided by seeded and spontaneous groundcovers along with the erosion/mineralization mitigation role of mulching [33,34,69].
We expected to find evidence of SOM stratification across the two soil depths in the mulched treatments, as reported in the literature. For example, the authors of [70] reported that the highest increase in SOM accumulation under mulched cover cropping after five or eight years occurred at 0–2.5 cm depth and decreased at deeper depth, until 25 cm. Similarly, the authors of [13] found a significant increase of SOM at 0–5 cm and not at 5–10 cm depth under mown spontaneous vegetation after three years of experiment. Nonetheless, our results did not indicate the occurrence of SOM accumulation in superficial soil layers following mulching; rather, we found a consistent positive effect of mulched groundcovers on SOM up to 30 cm as compared to CT. On the one hand, it may be possible that the depth intervals considered in this study (0–10 and 10–30 cm) could be too coarse to capture the possible SOM accumulation triggered by mulching in very shallow layers. On the other hand, this study may contribute to the debate on the actual effect of reduced tillage vs. CT on SOM, particularly on whether reduced tillage actually increases total SOM or just triggers a redistribution of SOM across the soil profile [71]. Previous studies have demonstrated the key role of below-ground biomass of CC and spontaneous groundcovers also at deeper soil layers. The authors of [72] found higher SOM under spontaneous vegetation up to 50 cm soil depth in an Italian vineyard because of higher belowground plant biomass. We hypothesize that in our study the higher below ground biomass provided by the CC and spontaneous vegetation largely contributed to SOM accumulation up to 30 cm. Indeed, the mean residence time of root C in soils has been estimated to be more than twice that of shoot C, thereby highlighting the key role of root biomass for SOM accumulation and C sequestration [73]. Furthermore, tillage has a detrimental effect on soil aggregates, and therefore, can lead to lower OM protection and a higher mineralization rate [10]. As a result, the combination of high below-ground residue biomass and the absence of tillage could have fostered SOM accumulation from 0 to 30 cm in the mulched treatments.
It should be stressed that these processes were able to influence SOM content in only one year. We did not find differences in SOM between the mulched CC mixture and spontaneous vegetation. The latter included the cumulative effect of two years of no-till and mulched groundcovers. Concerning the mulched CC treatment, we followed the local practices of alternating the vine row receiving the groundcovers every year. To the best of our knowledge, this is the first study highlighting such a quick effect of soil cover practices on SOM. Although additional inquiries are needed to confirm this trend, the short-term effect of groundcovers may represent an important trigger to facilitate the adoption of soil cover practices among vine growers.

4.1.2. Soil Total Nitrogen

Soil N availability represents an important criterion for farmers to assess the effect of soil management practices in vineyards. Viticulturists, especially in Mediterranean areas, are very much concerned about the competition for N and water that may arise between groundcovers and vines in the summer period [27,74]. The results from our trials, however, showed a consistent positive effect of groundcover practices on total N as compared to CT. Two main reasons can lay behind these results. Firstly, the presence of legumes, also common in the S treatment especially in spring 2018 (Medicago spp. accounted for 65 ± 17% and 57 ± 9%, of total biomass at MT and SG, respectively), could have played an important role due to the N fixation capacity of these species. Increased N concentration in vineyards following legume CC is often reported in the literature [75,76]. Secondly, tillage in CT might have stimulated the mineralization of the organic N pool. The resulting inorganic N could have been taken up by vines and/or lost via N leaching throughout the season, thereby decreasing the residual N pool after grape harvest, i.e., when soil samples were collected. The higher soil nitrate concentrations following tillage found in Californian and Spanish vineyards [25,26] at the beginning of summer supports this hypothesis.
Overall, we found positive effects of soil cover practices on N, regardless of their termination strategy (mulch or incorporation). Concerning CC species, we expected that pigeon bean would have increased soil N concentration as compared to the barley/clover mixture. Indeed, legume CC have been often reported to increase N availability in vineyards [77], especially when compared with grass CC [72,75]. Nonetheless, the authors of [78] recently found higher N availability under a legume-grass mixture. This has been attributed to (i) high N retention in roots, a pool that is usually overlooked or underestimated, and (ii) stimulation of legume N fixation by the presence of a grass companion species. Despite these findings, in our experiment, we did not find any net effect of CC mixture on the total N concentration.
Concerning depth, we found a strong interaction of total soil N with soil gravel content but not with treatments. As for SOM, our results did not highlight an effect of mulch on N distribution across the soil profile. In contrast, other studies found an accumulation of N in the first 5 cm under cover cropping in comparison with CT [26]. Our results indicate that cover cropping affected soil N at different depths irrespectively of the type of tillage.

4.1.3. Soil Available P2O5

We did not identify a clear trend on the effect of soil management practices on soil available P2O5, as this varied considerably across years and experimental sites. Different effects are reported in the literature. The authors of [76] did not find cover cropping to affect soil P availability in a Spanish Tempranillo vineyard where barley and clover CC were compared with CT. Similar results were obtained in a South African sandy soil, where a wide range of CC species was tested against spontaneous vegetation and full chemical weed control [79]. Conversely, the authors of [68] found a positive effect of spontaneous vegetation on P availability both in the inter-row and in the soil under the vines. We hypothesize that the marked differences in soil available P2O5 found between farms in our study can be due to the large difference in terms of groundcover biomass production in the spring. Biomass production was on average much higher at SG than at MT, being 62%, 56%, 61% and 20% higher under BCI, BCM, CT and S, respectively. Only PBI was less productive at SG than MT (on average −24%). The significantly lower soil P concentration found under cover cropping at SG may, therefore, be a result of the larger P uptake by more productive groundcovers. Cover cropping can contribute to P cycling by stimulating mycorrhizal colonization, solubilizing non-available P and recycling P through crop residues mineralization [80]; nevertheless, P uptake from CC can result in a temporary P depletion.

4.1.4. Soil Exchangeable Potassium

Soil management did not affect soil exchangeable K concentration. Instead, soil K was influenced by farm, depth, active limestone and SOM concentration. Variable results were reported in the literature. Our results are comparable with the authors of [81], who found no significant effect of a creeping red fescue (Festuca rubra L. cv. Pennlawn) living mulch on soil K concentration across five years. However, the authors of [68] found a positive effect of spontaneous vegetation on K availability both in the inter-row and in the soil under the vines. The discrepancy found in the literature may depend on the different CC species and mixes that were tested in each study.

4.2. Effects of Soil Management on Soil Physical Health

4.2.1. Soil Structure Stability Index

Soil structure and soil aggregate stability are critical soil properties strictly related to soil erodibility and SOM stabilization and thus are extremely relevant for Mediterranean vineyards [82]. A high soil structure stability index is, therefore, desirable in order to foster soil C stock and reduce soil losses. Overall, we found a significant negative effect of tillage on the structure stability index as compared to spontaneous vegetation. CT has been widely reported to have a detrimental effect on soil structure, as it promotes the breakdown of soil aggregates, thereby favoring SOM oxidation and soil erosion [10]. As an alternative, no-till practices combined with soil groundcover practices can protect soil and improve SOM content, which is a key factor in soil aggregates formation [18]. Increased aggregate stability under temporary CC in contrast with tillage were reported in Spanish and Italian vineyards [68,83,84]. The authors of [13] reported no difference in terms of soil aggregation between spontaneous vegetation and cover cropping along with a strong negative effect of tillage. Nonetheless, in our study, there was no visible effect of CC management on soil aggregation, possibly due to the short time of the experiment and the implementation of treatments in alternate rows every year. This hypothesis is supported by the authors of [81], who found a visible effect of mulch on soil aggregation already after two years. Furthermore, we did not find differences in soil structure stability index between CT and the CC treatments incorporated in spring. These results are in accordance with the recent literature. Indeed, it has been reported that tillage, even when shallow and occasional, has a detrimental effect on soil aggregation. As a result, the combination of cover cropping and tillage does not offer the expected benefits in terms of soil structure stability [10]. Evidence from [85] further supports our results: these authors reported that soil management has a critical impact on soil aggregate stability and found that only one year of tillage is sufficient to compromise soil aggregate stability after three years of groundcover practices.

4.2.2. Soil Penetration Resistance

Soil penetration resistance is considered a suitable indicator to characterize soil compaction and soil aptness for root development. The soil penetration resistance is obviously highly influenced by soil management and highly dependent on soil parent material, texture, soil aggregation, bulk density and soil moisture [86,87]. Over a certain threshold, which has been reported to be 2000 kPa in some studies [68,88] and 2500 kPa in others [87,89], root growth is negatively affected. In this study, we found lower soil penetration resistance under CT as compared to groundcover practices at 0–20 cm. This result is in accordance with the literature. The authors of [90] found higher soil penetration resistance under cover cropping down to 15 cm, a plough pan at 20 cm as a result of tillage operation and no significant differences across soil management practices at deeper depth. The authors of [13] found that tillage significantly lowered soil penetration resistance down to 25 cm, while soil management practices did not affect soil penetration resistance in deeper layers. Similar results were obtained in Italy, where soil penetration resistance was considerably higher under groundcovers as compared to CT [91,92]. Nevertheless, a six-year Spanish study showed opposite results [68]. The authors found a significant effect of spontaneous vegetation in lowering soil penetration resistance and improving soil aggregation as compared to tillage. These results suggest the need for a longer time span to appreciate the positive effects of groundcovers on soil penetration resistance, and that root-related traits of both CC and spontaneous plant species may also be important.
Despite being an optimal indicator for soil compaction, soil penetration resistance may not be sufficient to assess the effect of soil management practices on the complex soil physical and hydrological dynamics in a comprehensive manner. As an example, the authors of [13] found higher soil penetration resistance under groundcovers but similar porosity and higher water infiltration rate than in CT. CC and spontaneous vegetation can, therefore, increase pore connectivity, which improves water movement even at a higher compaction level. This could also be the reason behind the absence of significant differences found across soil moisture levels in our study (data not shown). Moreover, penetrometer readings may be affected by the resistance applied by CC roots, which increase soil penetration resistance values but are not associated with a lower development of grapevine roots [90]. As a result, the higher soil penetration resistance found in this study under S (max soil penetration resistance = 2340 kPa) may not hamper roots elongation and soil hydrological properties.

4.3. Effects of Soil Management on a Soil’s Biological Health

QBS has been widely used to monitor the effect of soil tillage and other agronomic practices on soil biological health. This index links soil microarthropod biodiversity with their adaptations to the deep soil environment and has been shown to be a reliable indicator to assess soil biological quality [65,93]. In this study, QBS was on average 118.4 (±22.8) and 117.1 (±34.0) at MT and SG, respectively, well above the 93.7 value indicated as a possible threshold to discriminate between high and low quality soils [93]. Positive relations between organic management and QBS have been reported by the authors of [94] and could explain the high QBS score measured in both farms. In our study, QBS was significantly affected by active limestone and by the Farm × Treatment interaction. BCM and S showed the highest QBS values at SG. Specifically, QBS under S was significantly higher (+48%) than in the treatments receiving tillage, while BCM did not show any significant differences. Tillage is known to be a practice that hampers microarthropod communities by modifying chemical and physical soil properties, thereby negatively impacting QBS values [93,95]. Indeed, higher QBS scores were reported on arable lands when no-till + crop residue retention was compared with conventional tillage [96,97]. Similarly, in vineyards, no-till combined with mowing of CC or spontaneous vegetation positively affected the microarthropod assemblages and the QBS scores [15]. This is in accordance with our results at the SG site, where the combination of surface mulch and the absence of tillage stimulated microarthropod communities.
No significant differences among treatments were found at the MT site. This result can be due to (i) climatic and management factors, and (ii) sampling issues faced in 2019. Firstly, MT is located at higher altitude than SG and characterized by a cooler climate, which is known to negatively affect QBS [98]. Secondly, CC establishment—especially of the barley/clover mixture—has been more problematic at MT than at SG, due to cooler temperature and higher rainfall, which delayed sowing and hampered crop emergence. Similarly, biomass of spontaneous vegetation was on average 18% and 45% lower at MT than SG in 2018 and 2019, respectively (data not shown). The quantity and quality of crop residues have been shown to positively affect microarthropod communities; hence, the lower mulch biomass in MT may have affected the QBS score of the plots under S [99]. Conversely, the combined effect of higher temperature and higher biomass could have resulted in a better environment for microarthropods in SG, which translated into marked differences among treatments. Furthermore, soil samples for the 2019 season were collected in late January 2020 because of intense rainfalls occurred at MT in the autumn. Such a large time span from the implementation of the treatments (June) combined with high precipitations may have buffered the treatment effects [94,100].

5. Conclusions

This study presents information on the effect of different soil management practices on soil health in Chianti Classico DOP. Using an innovative methodology that takes into account the fine-scale soil variability that typically characterizes vineyards, we provided a comprehensive assessment of the effect of groundcover practices on the chemical, physical and biological soil health.
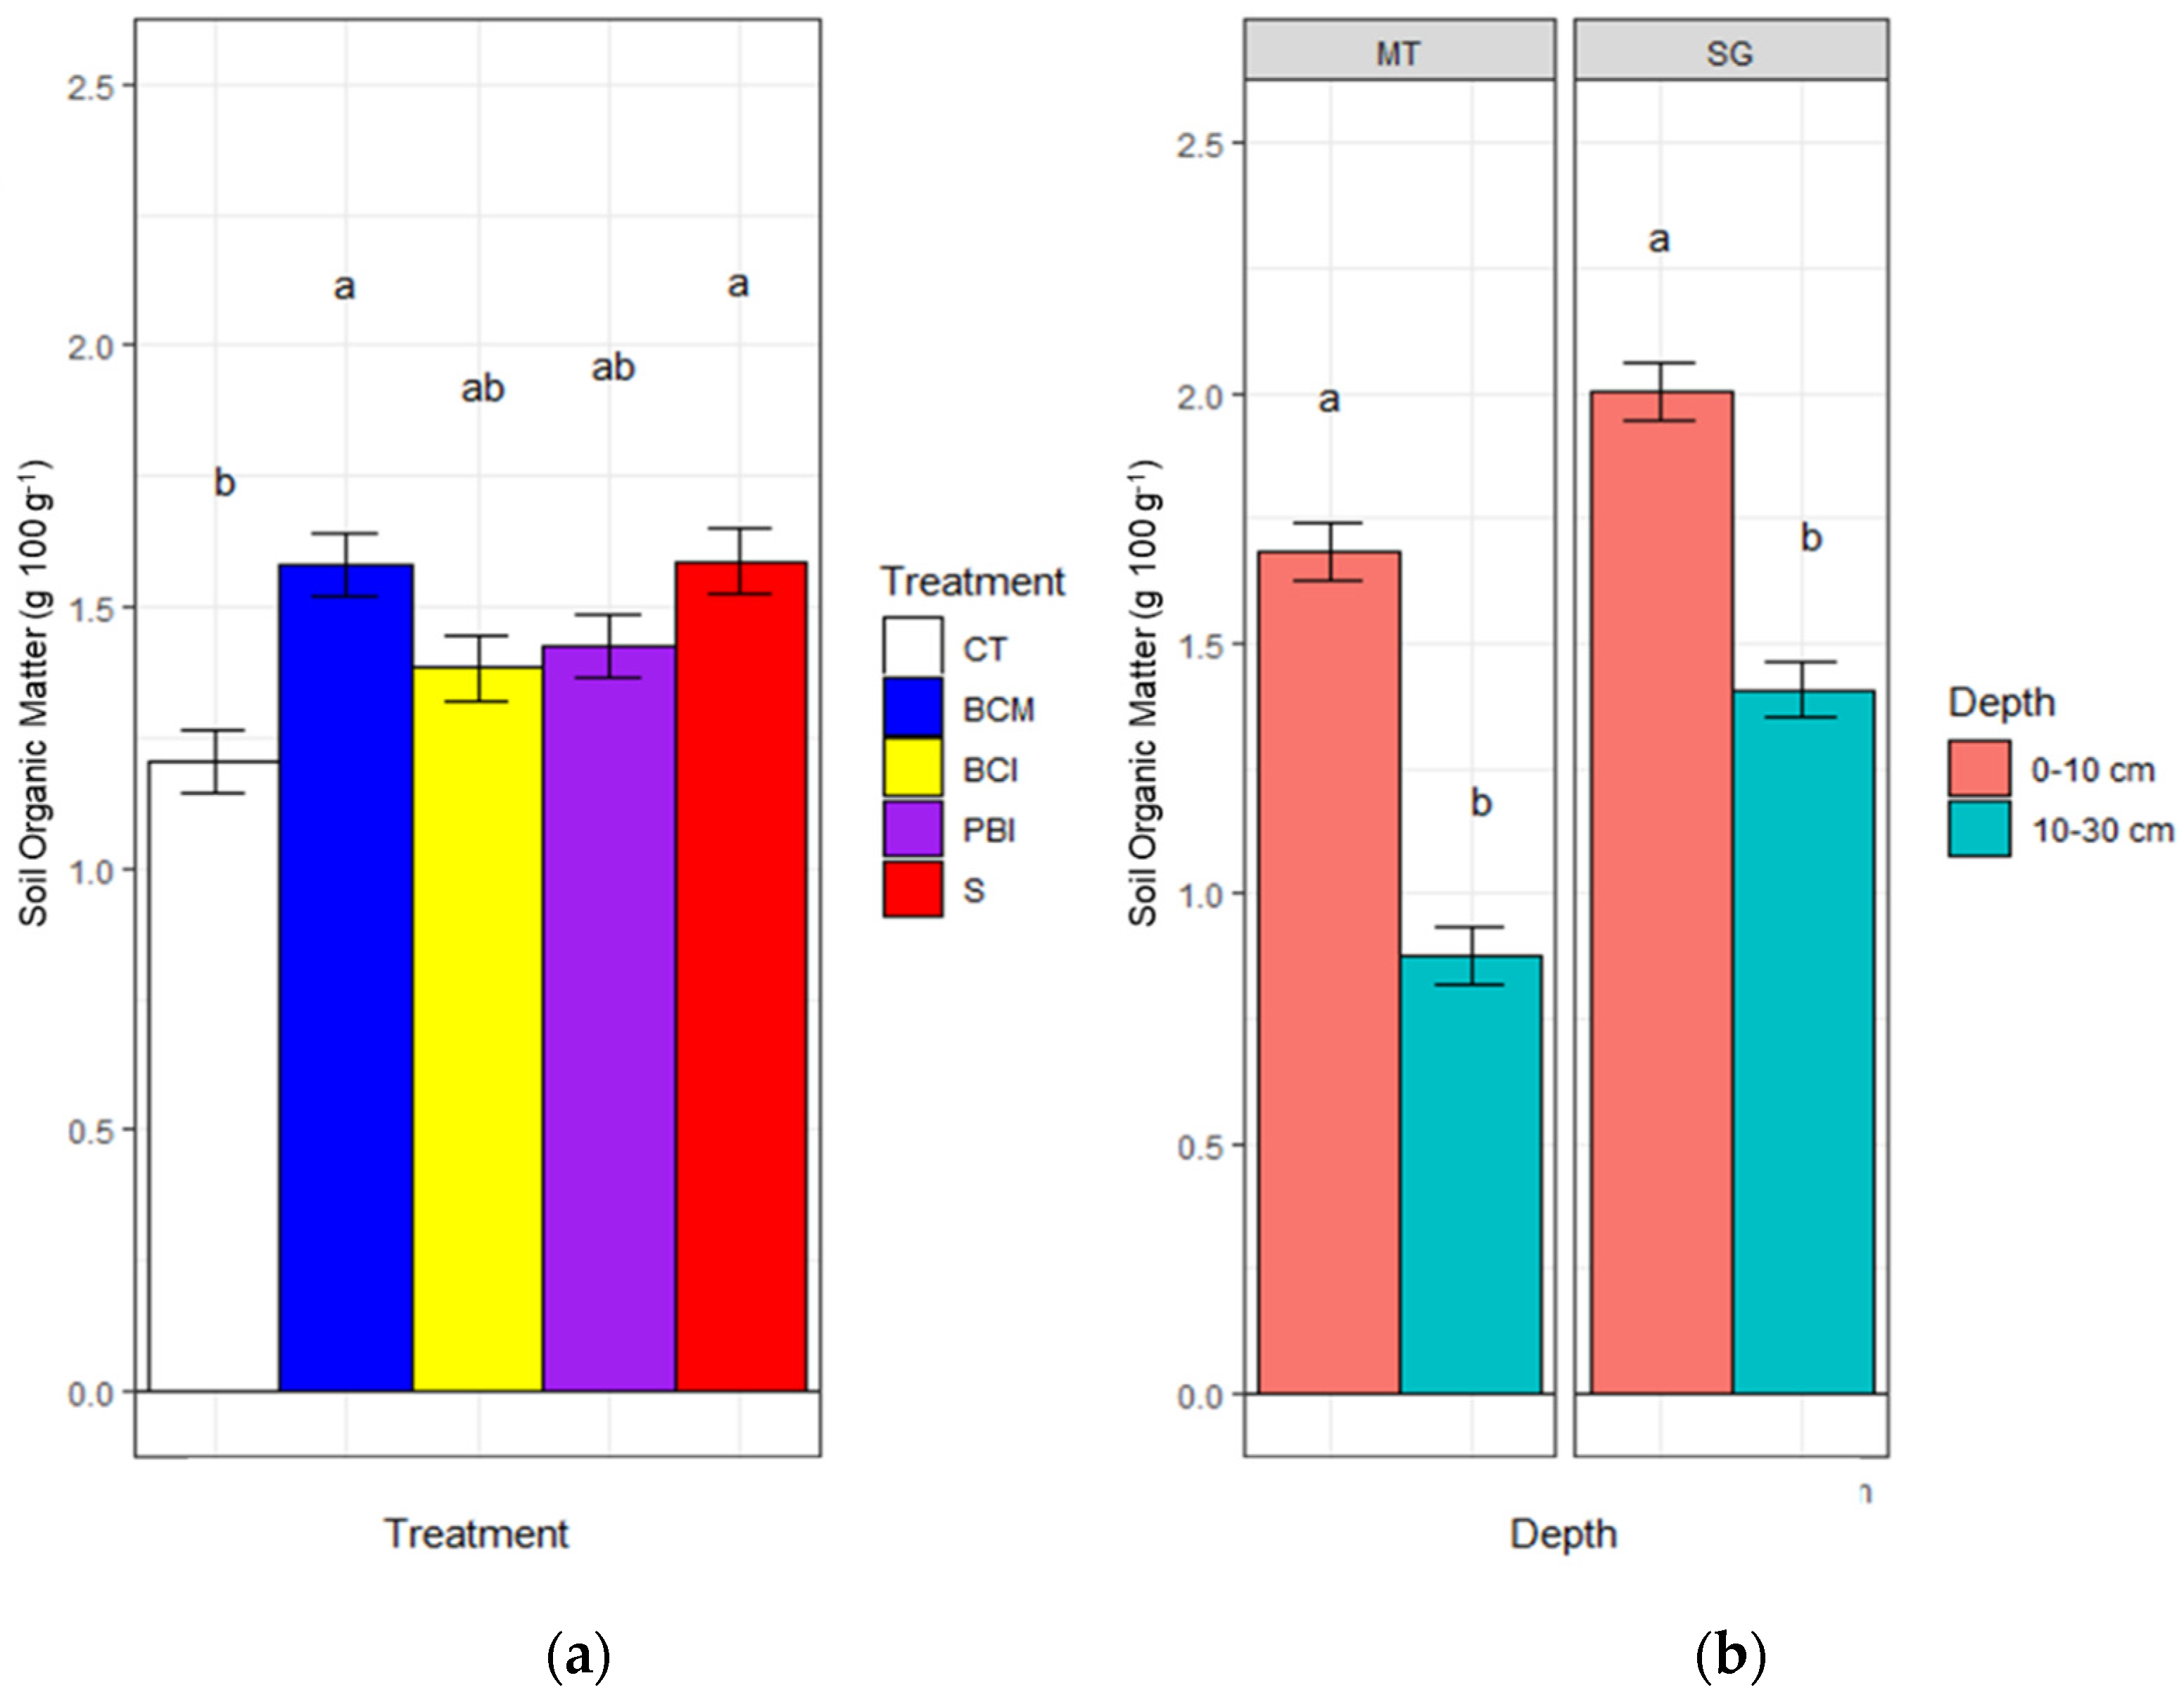
Compared to tillage, groundcover practices increased SOM when managed as mulch, as a consequence of higher C input and soil erosion mitigation. Surprisingly, soil cover practices were also associated with larger N availability, irrespective of CC type and management, probably due to the higher N input and slower mineralization process. Farmers may, therefore, consider groundcover practices as a strategy to improve N cycling and increase SOM, which are of paramount importance especially in organic farming. Nonetheless, these findings need to be complemented with ancillary measurements on grapevine N uptake, to elucidate whether groundcovers and vines may develop synergistic or competitive relationships, especially during high N-demanding stages. The effect of soil management practices on P2O5 was not fully clear as those data are often characterized by high variability across—and within—experimental sites and are mediated by different edaphic and microbiological processes. Soil management effects on K availability were very limited and not statistically significant. Further studies are needed to better investigate the effect of soil management practices on P2O5 and K.
Among groundcovers, mulched spontaneous vegetation and CC positively influenced physical soil health as compared to tillage. Increased physical stability and aggregation is correlated with reduced soil erodibility, which is the main cause of soil degradation in Mediterranean vineyards and one of the main threats for the sustainability of the wine sector. Moreover, no-till in conjunction with mulch did not increase soil compaction at a level that hampers root development. Spontaneous vegetation and mulching improved soil biological health, even though this effect was quite variable across experimental sites and edaphic conditions.
Overall, these results demonstrate that groundcover practices, especially if managed as mulch, can improve soil health already in a short time period, as compared to tillage. By increasing SOM, improving N cycling, reducing soil erodibility and maintaining soil life, those practices can substantially contribute to increasing the sustainability of the wine sector in Mediterranean Europe. In this respect, actions at both policy and field level are needed. Results from this research can support the formulation of specific policy levers for the promotion of groundcovers in vineyards. Likewise, our findings can be used as a starting point to discuss more sustainable soil management practices with farmers and address possible trade-offs between provisioning (e.g., grape production and quality) and supporting/regulating ES (e.g., nutrient cycling and C-sequestration).

Author Contributions

Conceptualization: D.W.R., D.A., P.B. and S.C.; Methodology: D.W.R., P.B. and S.C.; Investigation: D.W.R., S.P., D.A., C.F. and S.M.; Data analysis: D.W.R. and S.C.; Writing—original draft preparation: D.W.R. and S.P.; Writing—review and editing: D.W.R., P.B., D.A., S.P., S.M. and S.C., Supervision: P.B. and D.A.; Project administration: D.A. All authors have read and agreed to the published version of the manuscript.

Funding

This research was partly funded by the European Union’s Horizon 2020 research and innovation programme under grant agreement No. 727321 (IWMPRAISE). D.W.R. has a study grant from the International PhD course in Agrobiodiversity at Sant’Anna School of Advanced Studies, Pisa, Italy.

Institutional Review Board Statement

Not applicable.

Informed Consent Statement

Informed consent was obtained from all subjects involved in the study.

Data Availability Statement

The data presented in this study are available on request from the corresponding author. The data are not publicly available as commercial farms were involved in the study.

Acknowledgments

The authors wish to acknowledge the Centre for Agri-Environmental Research “Enrico Avanzi” of the University of Pisa, whose assistance in the field and lab work was invaluable. We also want to thank the Stazione Sperimentale per la Viticoltura Sostenibile (SPEVIS) for the technical support. Special thanks go to the owners, farm managers and workers of the Fattoria San Giusto a Rentennano and Montevertine, who uniquely supported this research. We also wish to acknowledge the Council for Agricultural Research and Economics (CREA) of Florence, Ruggero Petacchi (SSSA), Elisabetta Rossi (UNIPI) and Silvia Landi (CREA), for their kind assistance and support on microarthropods extraction and identification. Last but not the least, we wish to acknowledge Miningful Studio for the statistical support.

Conflicts of Interest

The authors declare no conflict of interest.

References

  1. FAO. Healthy Soils Are the Basis for Healthy Food Production; FAO: Rome, Italy, 2015. [Google Scholar]
  2. Kibblewhite, M.G.; Ritz, K.; Swift, M.J. Soil Health in Agricultural Systems. Philos. Trans. R. Soc. Lond. B Biol. Sci. 2008, 363, 685–701. [Google Scholar] [CrossRef] [PubMed] [Green Version]
  3. Orgiazzi, A.; Bardgett, R.D.; Barrios, E.; Behan-Pelletier, V.; Briones, M.J.I.; Chotte, J.-L.; De Deyn, G.B.; Eggleton, P.; Fierer, N.; Fraser, T.; et al. Global Soil Biodiversity Atlas; European Commission, Publications Office of the European Union: Luxembourg, 2016. [Google Scholar]
  4. Adhikari, K.; Hartemink, A.E. Linking Soils to Ecosystem Services—A Global Review. Geoderma 2016, 262, 101–111. [Google Scholar] [CrossRef]
  5. Nair, R.P. Grand Challenges in Agroecology and Land Use Systems. Front. Environ. Sci. 2014, 2, 1. [Google Scholar] [CrossRef] [Green Version]
  6. Borrelli, P.; Robinson, D.A.; Fleischer, L.R.; Lugato, E.; Ballabio, C.; Alewell, C.; Meusburger, K.; Modugno, S.; Schütt, B.; Ferro, V. An Assessment of the Global Impact of 21st Century Land Use Change on Soil Erosion. Nat. Commun. 2017, 8, 1–13. [Google Scholar] [CrossRef] [PubMed] [Green Version]
  7. Montanarella, L. Trends in land degradation in Europe. In Climate and Land Degradation; Springer: Berlin/Heidelberg, Germany, 2007; pp. 83–104. [Google Scholar]
  8. EEA. The European Environment—State and Outlook 2020; European Environmental Agency: Copenhagen, Denmark, 2019; ISBN 978-92-9480-090-9.
  9. Panagos, P.; Borrelli, P.; Poesen, J.; Ballabio, C.; Lugato, E.; Meusburger, K.; Montanarella, L.; Alewell, C. The New Assessment of Soil Loss by Water Erosion in Europe. Environ. Sci. Policy 2015, 54, 438–447. [Google Scholar] [CrossRef]
  10. Belmonte, S.A.; Celi, L.; Stanchi, S.; Said-Pullicino, D.; Zanini, E.; Bonifacio, E. Effects of Permanent Grass versus Tillage on Aggregation and Organic Matter Dynamics in a Poorly Developed Vineyard Soil. Soil Res. 2016, 54, 797–808. [Google Scholar] [CrossRef] [Green Version]
  11. Costantini, E.A.; Castaldini, M.; Diago, M.P.; Giffard, B.; Lagomarsino, A.; Schroers, H.-J.; Priori, S.; Valboa, G.; Agnelli, A.E.; Akça, E. Effects of Soil Erosion on Agro-Ecosystem Services and Soil Functions: A Multidisciplinary Study in Nineteen Organically Farmed European and Turkish Vineyards. J. Environ. Manag. 2018, 223, 614–624. [Google Scholar] [CrossRef]
  12. Mazzoncini, M.; Sapkota, T.B.; Bàrberi, P.; Antichi, D.; Risaliti, R. Long-Term Effect of Tillage, Nitrogen Fertilization and Cover Crops on Soil Organic Carbon and Total Nitrogen Content. Soil Tillage Res. 2011, 114, 165–174. [Google Scholar] [CrossRef]
  13. García-Díaz, A.; Marqués, M.J.; Sastre, B.; Bienes, R. Labile and Stable Soil Organic Carbon and Physical Improvements Using Groundcovers in Vineyards from Central Spain. Sci. Total Environ. 2018, 621, 387–397. [Google Scholar] [CrossRef] [Green Version]
  14. Roger-Estrade, J.; Anger, C.; Bertrand, M.; Richard, G. Tillage and Soil Ecology: Partners for Sustainable Agriculture. Soil Tillage Res. 2010, 111, 33–40. [Google Scholar] [CrossRef]
  15. Gonçalves, F.; Nunes, C.; Carlos, C.; López, Á.; Oliveira, I.; Crespí, A.; Teixeira, B.; Pinto, R.; Costa, C.A.; Torres, L. Do Soil Management Practices Affect the Activity Density, Diversity, and Stability of Soil Arthropods in Vineyards? Agric. Ecosyst. Environ. 2020, 294, 106863. [Google Scholar] [CrossRef]
  16. Fiera, C.; Ulrich, W.; Popescu, D.; Buchholz, J.; Querner, P.; Bunea, C.-I.; Strauss, P.; Bauer, T.; Kratschmer, S.; Winter, S. Tillage Intensity and Herbicide Application Influence Surface-Active Springtail (Collembola) Communities in Romanian Vineyards. Agric. Ecosyst. Environ. 2020, 300, 107006. [Google Scholar] [CrossRef]
  17. Polge de Combret-Champart, L.; Guilpart, N.; Mérot, A.; Capillon, A.; Gary, C. Determinants of the Degradation of Soil Structure in Vineyards with a View to Conversion to Organic Farming. Soil Use Manag. 2013, 29, 557–566. [Google Scholar] [CrossRef]
  18. Novara, A.; Gristina, L.; Saladino, S.S.; Santoro, A.; Cerdà, A. Soil Erosion Assessment on Tillage and Alternative Soil Managements in a Sicilian Vineyard. Soil Tillage Res. 2011, 117, 140–147. [Google Scholar] [CrossRef] [Green Version]
  19. Rodrigo-Comino, J.; Keesstra, S.; Cerdà, A. Soil Erosion as an Environmental Concern in Vineyards: The Case Study of Celler Del Roure, Eastern Spain, by Means of Rainfall Simulation Experiments. Beverages 2018, 4, 31. [Google Scholar] [CrossRef] [Green Version]
  20. Brunori, E.; Farina, R.; Biasi, R. Sustainable Viticulture: The Carbon-Sink Function of the Vineyard Agro-Ecosystem. Agric. Ecosyst. Environ. 2016, 223, 10–21. [Google Scholar] [CrossRef]
  21. Salomé, C.; Coll, P.; Lardo, E.; Metay, A.; Villenave, C.; Marsden, C.; Blanchart, E.; Hinsinger, P.; Le Cadre, E. The Soil Quality Concept as a Framework to Assess Management Practices in Vulnerable Agroecosystems: A Case Study in Mediterranean Vineyards. Ecol. Indic. 2016, 61, 456–465. [Google Scholar] [CrossRef]
  22. Jian, J.; Du, X.; Reiter, M.S.; Stewart, R.D. A Meta-Analysis of Global Cropland Soil Carbon Changes Due to Cover Cropping. Soil Biol. Biochem. 2020, 143, 107735. [Google Scholar] [CrossRef]
  23. Marques, M.; García-Muñoz, S.; Muñoz-Organero, G.; Bienes, R. Soil Conservation beneath Grass Cover in Hillside Vineyards under Mediterranean Climatic Conditions (Madrid, Spain). Land Degrad. Dev. 2010, 21, 122–131. [Google Scholar] [CrossRef]
  24. Rodrigo Comino, J.; Iserloh, T.; Morvan, X.; Malam Issa, O.; Naisse, C.; Keesstra, S.D.; Cerdà, A.; Prosdocimi, M.; Arnáez, J.; Lasanta, T. Soil Erosion Processes in European Vineyards: A Qualitative Comparison of Rainfall Simulation Measurements in Germany, Spain and France. Hydrology 2016, 3, 6. [Google Scholar] [CrossRef] [Green Version]
  25. Steenwerth, K.; Belina, K.M. Cover Crops Enhance Soil Organic Matter, Carbon Dynamics and Microbiological Function in a Vineyard Agroecosystem. Appl. Soil Ecol. 2008, 40, 359–369. [Google Scholar] [CrossRef]
  26. Peregrina, F.; Pérez-Álvarez, E.P.; Colina, M.; García-Escudero, E. Cover Crops and Tillage Influence Soil Organic Matter and Nitrogen Availability in a Semi-Arid Vineyard. Arch. Agron. Soil Sci. 2012, 58, SS95–SS102. [Google Scholar] [CrossRef]
  27. Celette, F.; Findeling, A.; Gary, C. Competition for Nitrogen in an Unfertilized Intercropping System: The Case of an Association of Grapevine and Grass Cover in a Mediterranean Climate. Eur. J. Agron. 2009, 30, 41–51. [Google Scholar] [CrossRef]
  28. Delpuech, X.; Metay, A. Adapting Cover Crop Soil Coverage to Soil Depth to Limit Competition for Water in a Mediterranean Vineyard. Eur. J. Agron. 2018, 97, 60–69. [Google Scholar] [CrossRef]
  29. Novara, A.; Catania, V.; Tolone, M.; Gristina, L.; Laudicina, V.A.; Quatrini, P. Cover Crop Impact on Soil Organic Carbon, Nitrogen Dynamics and Microbial Diversity in a Mediterranean Semiarid Vineyard. Sustainability 2020, 12, 3256. [Google Scholar] [CrossRef] [Green Version]
  30. Peregrina, F.; Larrieta, C.; Ibáñez, S.; García-Escudero, E. Labile Organic Matter, Aggregates, and Stratification Ratios in a Semiarid Vineyard with Cover Crops. Soil Sci. Soc. Am. J. 2010, 74, 2120–2130. [Google Scholar] [CrossRef]
  31. Biddoccu, M.; Guzmán, G.; Capello, G.; Thielke, T.; Strauss, P.; Winter, S.; Zaller, J.G.; Nicolai, A.; Cluzeau, D.; Popescu, D.; et al. Evaluation of Soil Erosion Risk and Identification of Soil Cover and Management Factor (C) for RUSLE in European Vineyards with Different Soil Management. Int. Soil Water Conserv. Res. 2020. [Google Scholar] [CrossRef]
  32. Ruiz-Colmenero, M.; Bienes, R.; Eldridge, D.J.; Marques, M.J. Vegetation Cover Reduces Erosion and Enhances Soil Organic Carbon in a Vineyard in the Central Spain. Catena 2013, 104, 153–160. [Google Scholar] [CrossRef]
  33. Prosdocimi, M.; Jordán, A.; Tarolli, P.; Keesstra, S.; Novara, A.; Cerdà, A. The Immediate Effectiveness of Barley Straw Mulch in Reducing Soil Erodibility and Surface Runoff Generation in Mediterranean Vineyards. Sci. Total Environ. 2016, 547, 323–330. [Google Scholar] [CrossRef] [Green Version]
  34. Novara, A.; Minacapilli, M.; Santoro, A.; Rodrigo-Comino, J.; Carrubba, A.; Sarno, M.; Venezia, G.; Gristina, L. Real Cover Crops Contribution to Soil Organic Carbon Sequestration in Sloping Vineyard. Sci. Total Environ. 2019, 652, 300–306. [Google Scholar] [CrossRef] [PubMed]
  35. Tsiafouli, M.A.; Thébault, E.; Sgardelis, S.P.; Ruiter, P.C.; Putten, W.H.; Birkhofer, K.; Hemerik, L.; Vries, F.T.; Bardgett, R.D.; Brady, M.V. Intensive Agriculture Reduces Soil Biodiversity across Europe. Glob. Chang. Biol. 2015, 21, 973–985. [Google Scholar] [CrossRef]
  36. Peregrina, F.; Pilar Pérez-Álvarez, E.; García-Escudero, E. Soil Microbiological Properties and Its Stratification Ratios for Soil Quality Assessment under Different Cover Crop Management Systems in a Semiarid Vineyard. J. Plant Nutr. Soil Sci. 2014, 177, 548–559. [Google Scholar] [CrossRef]
  37. Hendgen, M.; Hoppe, B.; Döring, J.; Friedel, M.; Kauer, R.; Frisch, M.; Dahl, A.; Kellner, H. Effects of Different Management Regimes on Microbial Biodiversity in Vineyard Soils. Sci. Rep. 2018, 8. [Google Scholar] [CrossRef] [PubMed] [Green Version]
  38. Burns, K.N.; Bokulich, N.A.; Cantu, D.; Greenhut, R.F.; Kluepfel, D.A.; O’Geen, A.T.; Strauss, S.L.; Steenwerth, K.L. Vineyard Soil Bacterial Diversity and Composition Revealed by 16S RRNA Genes: Differentiation by Vineyard Management. Soil Biol. Biochem. 2016, 103, 337–348. [Google Scholar] [CrossRef] [Green Version]
  39. Favretto, M.R.; Paoletti, M.G.; Caporali, F.; Nannipieri, P.; Onnis, A.; Tomei, P.E. Invertebrates and Nutrients in a Mediterranean Vineyard Mulched with Subterranean Clover (Trifolium Subterraneum L.). Biol. Fertil. Soils 1992, 14, 151–158. [Google Scholar] [CrossRef]
  40. Schreck, E.; Gontier, L.; Dumat, C.; Geret, F. Ecological and Physiological Effects of Soil Management Practices on Earthworm Communities in French Vineyards. Eur. J. Soil Biol. 2012, 52, 8–15. [Google Scholar] [CrossRef] [Green Version]
  41. Karimi, B.; Cahurel, J.-Y.; Gontier, L.; Charlier, L.; Chovelon, M.; Mahé, H.; Ranjard, L. A Meta-Analysis of the Ecotoxicological Impact of Viticultural Practices on Soil Biodiversity. Environ. Chem. Lett. 2020, 18, 1947–1966. [Google Scholar] [CrossRef]
  42. Maat, H. The History and Future of Agricultural Experiments. NJAS-Wagening. J. Life Sci. 2011, 57, 187–195. [Google Scholar] [CrossRef] [Green Version]
  43. Le Guen, M.-E.; Herrmann, L.; Robain, H.; Wiriyakitnateekul, W.; de Oliveira, T.; Robin, A.; Srimawong, P.; Bräu, L.; Lesueur, D. Relevance of Taking into Account the Fine Scale Soil Variability to Assess the Effects of Agricultural Inputs on Soil Characteristics and Soil Microbial Communities: A Case Study of Biochar Application in a Rubber Plantation in North East Thailand. Geoderma 2017, 305, 21–29. [Google Scholar] [CrossRef]
  44. Heil, K.; Heinemann, P.; Schmidhalter, U. Modeling the Effects of Soil Variability, Topography, and Management on the Yield of Barley. Front. Environ. Sci. 2018, 6, 146. [Google Scholar] [CrossRef]
  45. Rudolph, S.; Wongleecharoen, C.; Lark, R.M.; Marchant, B.P.; Garré, S.; Herbst, M.; Vereecken, H.; Weihermüller, L. Soil Apparent Conductivity Measurements for Planning and Analysis of Agricultural Experiments: A Case Study from Western-Thailand. Geoderma 2016, 267, 220–229. [Google Scholar] [CrossRef]
  46. Priori, S.; Bianconi, N.; Costantini, E.A. Can γ-Radiometrics Predict Soil Textural Data and Stoniness in Different Parent Materials? A Comparison of Two Machine-Learning Methods. Geoderma 2014, 226, 354–364. [Google Scholar] [CrossRef]
  47. Reinhardt, N.; Herrmann, L. Gamma-ray Spectrometry as Versatile Tool in Soil Science: A Critical Review. J. Plant Nutr. Soil Sci. 2019, 182, 9–27. [Google Scholar] [CrossRef] [Green Version]
  48. Cancela, J.; Fandiño, M.; Rey, B.; Dafonte, J.; González, X. Discrimination of Irrigation Water Management Effects in Pergola Trellis System Vineyards Using a Vegetation and Soil Index. Agric. Water Manag. 2017, 183, 70–77. [Google Scholar] [CrossRef]
  49. Priori, S.; Martini, E.; Andrenelli, M.; Magini, S.; Agnelli, A.; Bucelli, P.; Biagi, M.; Pellegrini, S.; Costantini, E. Improving Wine Quality through Harvest Zoning and Combined Use of Remote and Soil Proximal Sensing. Soil Sci. Soc. Am. J. 2013, 77, 1338–1348. [Google Scholar] [CrossRef]
  50. Priori, S.; Pellegrini, S.; Perria, R.; Puccioni, S.; Storchi, P.; Valboa, G.; Costantini, E.A. Scale Effect of Terroir under Three Contrasting Vintages in the Chianti Classico Area (Tuscany, Italy). Geoderma 2019, 334, 99–112. [Google Scholar] [CrossRef]
  51. Hendriks, P.; Limburg, J.; De Meijer, R. Full-Spectrum Analysis of Natural γ-Ray Spectra. J. Environ. Radioact. 2001, 53, 365–380. [Google Scholar] [CrossRef]
  52. Priori, S.; Fantappiè, M.; Bianconi, N.; Ferrigno, G.; Pellegrini, S.; Costantini, E.A. Field-Scale Mapping of Soil Carbon Stock with Limited Sampling by Coupling Gamma-Ray and Vis-NIR Spectroscopy. Soil Sci. Soc. Am. J. 2016, 80, 954–964. [Google Scholar] [CrossRef]
  53. Fotheringham, A.S.; Brunsdon, C.; Charlton, M. Geographically Weighted Regression: The Analysis of Spatially Varying Relationships; John Wiley & Sons: Hoboken, NJ, USA, 2002; ISBN 0-470-85525-8. [Google Scholar]
  54. Lloyd, C. Spatial Data Analysis: An. Introduction for GIS Users; Oxford University Press: Oxford, UK, 2010; ISBN 0-19-955432-3. [Google Scholar]
  55. Gee, G.W.; Or, D. 2.4 Particle-size Analysis. Methods Soil Anal. Part 4 Phys. Methods 2002, 5, 255–293. [Google Scholar]
  56. Nelson, D.; Sommers, L. Total Carbon, Organic Carbon, and Organic Matter. Methods Soil Anal. Part 2 Chem. Microbiol. Prop. 1983, 9, 539–579. [Google Scholar]
  57. Bremner, J. Total Nitrogen. Methods Soil Anal. Part 2 Chem. Microbiol. Prop. 1965, 9, 1149–1178. [Google Scholar]
  58. Page, A.L.; Miller, R.H.; Keeney, D.R. Methods of Soil Analysis; American Society of Agronomy: Madison, WI, USA, 1982; ISBN 0-89118-072-9. [Google Scholar]
  59. Hendershot, W.H.; Duquette, M. A Simple Barium Chloride Method for Determining Cation Exchange Capacity and Exchangeable Cations. Soil Sci. Soc. Am. J. 1986, 50, 605–608. [Google Scholar] [CrossRef]
  60. Drouineau, G. Dosage Rapide Du Calcaire Actif Du Sol: Nouvelles Données Sur La Separation et La Nature Des Fractions Calcaires. Ann. Agron 1942, 12, 441–450. [Google Scholar]
  61. Allison, L.; Moodie, C. Carbonate. Methods Soil Anal. Part 2 Chem. Microbiol. Prop. 1965, 9, 1379–1396. [Google Scholar]
  62. Shepherd, G.; Stagnari, F.; Pisante, M.; Benites, J. Visual Soil Assessment (VSA) Field Guides Vol. 1; FAO: Rome, Italy, 2008. [Google Scholar]
  63. Pagliai, M.; Torri, D.; Patruno, A. Stabilitae Distribuzione Dimensionale Degli Aggregati. Metod. Anal. Fısica Suolo Angelif. Ed. 1997, 5, 4. [Google Scholar]
  64. Grunwald, S.; Lowery, B.; Rooney, D.; McSweeney, K. Profile Cone Penetrometer Data Used to Distinguish between Soil Materials. Soil Tillage Res. 2001, 62, 27–40. [Google Scholar] [CrossRef]
  65. Parisi, V.; Menta, C.; Gardi, C.; Jacomini, C.; Mozzanica, E. Microarthropod Communities as a Tool to Assess Soil Quality and Biodiversity: A New Approach in Italy. Agric. Ecosyst. Environ. 2005, 105, 323–333. [Google Scholar] [CrossRef]
  66. Gattullo, C.E.; Mezzapesa, G.N.; Stellacci, A.M.; Ferrara, G.; Occhiogrosso, G.; Petrelli, G.; Castellini, M.; Spagnuolo, M. Cover Crop for a Sustainable Viticulture: Effects on Soil Properties and Table Grape Production. Agronomy 2020, 10, 1334. [Google Scholar] [CrossRef]
  67. Priori, S.; D’Avino, L.; Agnelli, A.E.; Valboa, G.; Knapic, M.; Schroers, H.; Akca, E.; Tangolar, S.; Kiraz, M.E.; Giffard, B.; et al. Effect of Organic Treatments on Soil Carbon and Nitrogen Dynamics in Vineyard. Eqa-Int. J. Environ. Qual. 2018, 31, 1–10. [Google Scholar]
  68. López-Piñeiro, A.; Muñoz, A.; Zamora, E.; Ramírez, M. Influence of the Management Regime and Phenological State of the Vines on the Physicochemical Properties and the Seasonal Fluctuations of the Microorganisms in a Vineyard Soil under Semi-Arid Conditions. Soil Tillage Res. 2013, 126, 119–126. [Google Scholar] [CrossRef]
  69. López-Vicente, M.; Calvo-Seas, E.; Álvarez, S.; Cerdà, A. Effectiveness of Cover Crops to Reduce Loss of Soil Organic Matter in a Rainfed Vineyard. Land 2020, 9, 230. [Google Scholar] [CrossRef]
  70. Peregrina, F. Soil Carbon Content and Its Stratification at the Medium-Term (5 and 8 Years) in a Semi-Arid Vineyard with Cover Crops. Span. J. Soil Sci. 2019, 9. [Google Scholar] [CrossRef]
  71. Wolff, M.W.; Alsina, M.M.; Stockert, C.M.; Khalsa, S.D.S.; Smart, D.R. Minimum Tillage of a Cover Crop Lowers Net GWP and Sequesters Soil Carbon in a California Vineyard. Soil Tillage Res. 2018, 175, 244–254. [Google Scholar] [CrossRef]
  72. Agnelli, A.; Bol, R.; Trumbore, S.E.; Dixon, L.; Cocco, S.; Corti, G. Carbon and Nitrogen in Soil and Vine Roots in Harrowed and Grass-Covered Vineyards. Agric. Ecosyst. Environ. 2014, 193, 70–82. [Google Scholar] [CrossRef] [Green Version]
  73. Rasse, D.P.; Rumpel, C.; Dignac, M.-F. Is Soil Carbon Mostly Root Carbon? Mechanisms for a Specific Stabilisation. Plant Soil 2005, 269, 341–356. [Google Scholar] [CrossRef]
  74. Celette, F.; Gary, C. Dynamics of Water and Nitrogen Stress along the Grapevine Cycle as Affected by Cover Cropping. Eur. J. Agron. 2013, 45, 142–152. [Google Scholar] [CrossRef]
  75. King, A.P.; Berry, A.M. Vineyard Δ15N, Nitrogen and Water Status in Perennial Clover and Bunch Grass Cover Crop Systems of California’s Central Valley. Agric. Ecosyst. Environ. 2005, 109, 262–272. [Google Scholar] [CrossRef]
  76. Pérez-Álvarez, E.P.; Garde-Cerdán, T.; Santamaría, P.; García-Escudero, E.; Peregrina, F. Influence of Two Different Cover Crops on Soil N Availability, N Nutritional Status, and Grape Yeast-Assimilable N (YAN) in a Cv. Tempranillo Vineyard. Plant Soil 2015, 390, 143–156. [Google Scholar] [CrossRef]
  77. Pardini, A.; Faiello, C.; Longhi, F.; Mancuso, S.; Snowball, R. Cover Crop Species and Their Management in Vineyards and Olive Groves. Adv. Hortic. Sci. 2002, 16, 225–234. [Google Scholar]
  78. Ball, K.R.; Baldock, J.A.; Penfold, C.; Power, S.A.; Woodin, S.J.; Smith, P.; Pendall, E. Soil Organic Carbon and Nitrogen Pools Are Increased by Mixed Grass and Legume Cover Crops in Vineyard Agroecosystems: Detecting Short-Term Management Effects Using Infrared Spectroscopy. Geoderma 2020, 379, 114619. [Google Scholar] [CrossRef]
  79. Fourie, J.; Louw, P.; Agenbag, G. Cover Crop Management in a Sauvignon Blanc/Ramsey Vineyard in the Semi-Arid Olifants River Valley, South Africa. 2. Effect of Different Cover Crops and Cover Crop Management Practices on Grapevine Performance. S. Afr. J. Enol. Vitic. 2007, 28, 81–91. [Google Scholar] [CrossRef] [Green Version]
  80. Hallama, M.; Pekrun, C.; Lambers, H.; Kandeler, E. Hidden Miners—The Roles of Cover Crops and Soil Microorganisms in Phosphorus Cycling through Agroecosystems. Plant Soil 2019, 434, 7–45. [Google Scholar] [CrossRef] [Green Version]
  81. DeVetter, L.W.; Dilley, C.A.; Nonnecke, G.R. Mulches Reduce Weeds, Maintain Yield, and Promote Soil Quality in a Continental-Climate Vineyard. Am. J. Enol. Vitic. 2015, 66, 54–64. [Google Scholar] [CrossRef]
  82. Le Bissonnais, Y.; Blavet, D.; De Noni, G.; Laurent, J.; Asseline, J.; Chenu, C. Erodibility of Mediterranean Vineyard Soils: Relevant Aggregate Stability Methods and Significant Soil Variables. Eur. J. Soil Sci. 2007, 58, 188–195. [Google Scholar] [CrossRef]
  83. Guzmán, G.; Cabezas, J.M.; Sánchez-Cuesta, R.; Lora, Á.; Bauer, T.; Strauss, P.; Winter, S.; Zaller, J.G.; Gómez, J.A. A Field Evaluation of the Impact of Temporary Cover Crops on Soil Properties and Vegetation Communities in Southern Spain Vineyards. Agric. Ecosyst. Environ. 2019, 272, 135–145. [Google Scholar] [CrossRef]
  84. Vignozzi, N. Effect of Management on Topsoil Structure. Eqa-Int. J. Environ. Qual. 2018, 31, 11–15. [Google Scholar]
  85. Garcia, L.; Damour, G.; Gary, C.; Follain, S.; Le Bissonnais, Y.; Metay, A. Trait-Based Approach for Agroecology: Contribution of Service Crop Root Traits to Explain Soil Aggregate Stability in Vineyards. Plant Soil 2019, 435. [Google Scholar] [CrossRef] [Green Version]
  86. Bastgen, H.M.; Diserens, E. Q Value for Calculation of Pressure Propagation in Arable Soils Taking Topsoil Stability into Account. Soil Tillage Res. 2009, 102, 138–143. [Google Scholar] [CrossRef]
  87. Catania, P.; Badalucco, L.; Laudicina, V.A.; Vallone, M. Effects of Tilling Methods on Soil Penetration Resistance, Organic Carbon and Water Stable Aggregates in a Vineyard of Semiarid Mediterranean Environment. Environ. Earth Sci. 2018, 77, 348. [Google Scholar] [CrossRef]
  88. Hamza, M.; Anderson, W. Soil Compaction in Cropping Systems: A Review of the Nature, Causes and Possible Solutions. Soil Tillage Res. 2005, 82, 121–145. [Google Scholar] [CrossRef]
  89. Whalley, W.R.; To, J.; Kay, B.D.; Whitmore, A.P. Prediction of the Penetrometer Resistance of Soils with Models with Few Parameters. Geoderma 2007, 137, 370–377. [Google Scholar] [CrossRef]
  90. Linares, R.; de la Fuente, M.; Junquera, P.; Lissarrague, J.R.; Baeza, P. Effects of Soil Management in Vineyard on Soil Physical and Chemical Characteristics; EDP Sciences: Julis, France, 2014; Volume 3, p. 01008. [Google Scholar]
  91. Capello, G.; Biddoccu, M.; Ferraris, S.; Cavallo, E. Effects of Tractor Passes on Hydrological and Soil Erosion Processes in Tilled and Grassed Vineyards. Water 2019, 11, 2118. [Google Scholar] [CrossRef] [Green Version]
  92. Ferrero, A.; Usowicz, B.; Lipiec, J. Effects of Tractor Traffic on Spatial Variability of Soil Strength and Water Content in Grass Covered and Cultivated Sloping Vineyard. Soil Tillage Res. 2005, 84, 127–138. [Google Scholar] [CrossRef]
  93. Menta, C.; Conti, F.D.; Pinto, S.; Bodini, A. Soil Biological Quality Index (QBS-Ar): 15 Years of Application at Global Scale. Ecol. Indic. 2018, 85, 773–780. [Google Scholar] [CrossRef]
  94. Ghiglieno, I.; Simonetto, A.; Donna, P.; Tonni, M.; Valenti, L.; Bedussi, F.; Gilioli, G. Soil Biological Quality Assessment to Improve Decision Support in the Wine Sector. Agronomy 2019, 9, 593. [Google Scholar] [CrossRef] [Green Version]
  95. Menta, C.; Conti, F.D.; Lozano Fondón, C.; Staffilani, F.; Remelli, S. Soil Arthropod Responses in Agroecosystem: Implications of Different Management and Cropping Systems. Agronomy 2020, 10, 982. [Google Scholar] [CrossRef]
  96. Sapkota, T.B.; Mazzoncini, M.; Bàrberi, P.; Antichi, D.; Silvestri, N. Fifteen Years of No till Increase Soil Organic Matter, Microbial Biomass and Arthropod Diversity in Cover Crop-Based Arable Cropping Systems. Agron. Sustain. Dev. 2012, 32, 853–863. [Google Scholar] [CrossRef]
  97. Fiorini, A.; Boselli, R.; Maris, S.C.; Santelli, S.; Perego, A.; Acutis, M.; Brenna, S.; Tabaglio, V. Soil Type and Cropping System as Drivers of Soil Quality Indicators Response to No-till: A 7-Year Field Study. Appl. Soil Ecol. 2020, 155, 103646. [Google Scholar] [CrossRef]
  98. Ghiglieno, I.; Simonetto, A.; Orlando, F.; Donna, P.; Tonni, M.; Valenti, L.; Gilioli, G. Response of the Arthropod Community to Soil Characteristics and Management in the Franciacorta Viticultural Area (Lombardy, Italy). Agronomy 2020, 10, 740. [Google Scholar] [CrossRef]
  99. Choudhary, M.; Jat, H.S.; Datta, A.; Yadav, A.K.; Sapkota, T.B.; Mondal, S.; Meena, R.; Sharma, P.C.; Jat, M.L. Sustainable Intensification Influences Soil Quality, Biota, and Productivity in Cereal-Based Agroecosystems. Appl. Soil Ecol. 2018, 126, 189–198. [Google Scholar] [CrossRef]
  100. O’Lear, H.; Blair, J. Responses of Soil Microarthropods to Changes in Soil Water Availability in Tallgrass Prairie. Biol. Fertil. Soils 1999, 29, 207–217. [Google Scholar] [CrossRef]
Figure 1. Experimental design of the study. CT = Conventional Tillage; BCM = Mulched cover crop mixture of barley + Scheme 5. × 100 m). Treatments including CC were allocated to alternate rows. The inter-row receiving a CC treatment was shifted every year, as this is common practice in the area. Conversely, CT and S were implemented on both inter-rows. Each experimental plot was divided in three replicates according to the slope of the vineyard. Treatments were separated by a buffer strip which was mown in spring and summer.
Agronomy 11 00787 g001
Figure 2. (a) Treatment positioning. (b) Gamma-Ray Total Count (Bq kg−1), (c) ECa1 (mS m−1) and (d) ECa2 (mS m−1) measured at San Giusto a Rentennano.
Agronomy 11 00787 g002
Figure 3. (a) Treatment positioning. (b) Gamma-Ray Total Count (Bq kg−1), (c) ECa1 (mS m−1) and (d) ECa2 (mS m−1) measured at Montevertine.
Agronomy 11 00787 g003
Figure 4. Weighted mean Soil Organic Matter (g 100 g−1) averaged across (a) depth and farm; (b) treatments (adjusted-R2 = 67.6%). CT = Conventional Tillage; BCM = Mulched cover crop of barley + squarrosum clover; BCI = Cover crop of barley + squarrosum clover incorporated in the soil; PBI = Pigeon bean cover crop incorporated in the soil; S = Mulched Scheme 0. (Tukey test). Bars denote standard errors of the mean (n = 60). Different letters are significantly different at p < 0.05 (Tukey test).
Agronomy 11 00787 g004
Figure 5. Weighted mean soil N concentration (g kg−1) averaged across (a) depth and gravel; (b) treatments and gravel (adjusted-R2 = 63.6%). CT = Conventional Tillage; BCM = Mulched cover crop of barley + squarrosum clover; BCI = Cover crop of barley + squarrosum clover incorporated in the soil; PBI = Pigeon bean cover crop incorporated in the soil; S = Mulched spontaneous vegetation. Treatments (a) and depths (b) indicated by different letters are significantly different at p < 0.05 (Tukey test). Bars denote standard errors of the mean (n = 60).
Agronomy 11 00787 g005
Figure 6. Weighted mean soil P2O5 (mg kg−1) concentration averaged across (a) year and depth; (b) farm and depth; (c) farm, year and treatment (adjusted-R2 = 64.3%). CT = Conventional Tillage; BCM = Mulched cover crop of barley + squarrosum clover; BCI = Cover crop of barley + squarrosum clover incorporated in the soil; PBI = Pigeon bean cover crop incorporated in the soil; S = Mulched Scheme 0. (Tukey test). Bars denote standard errors of the mean (n = 60). Different letters are significantly different at p < 0.05 (Tukey test).
Agronomy 11 00787 g006
Figure 7. Mean Soil penetration resistance (kPa) averaged across (a) farm, year and gravel and (b) treatments and gravel (adjusted-R2 = 50.5%). CT = Conventional Tillage; BCM = Mulched cover crop of barley + squarrosum clover; BCI = Cover crop of barley + squarrosum clover incorporated in the soil; PBI = Pigeon bean cover crop incorporated in the soil; S = Mulched spontaneous vegetation. MT = Montevertine, SG = San Giusto a Rentennano. Treatments (a) and depths (b) indicated by different letters are significantly different at p < 0.05 (Tukey test). Bars denote standard errors of the mean (n = 600).
Agronomy 11 00787 g007
Figure 8. Weighted Mean structure stability index (%) averaged across (a) farm, year and total limestone and (b) treatments, year, silt and farm; (adjusted-R2 = 85.1%). CT = Conventional Tillage; BCM = Mulched cover crop of grasses mixture + squarrosum clover; BCI = Cover crop of barley + squarrosum clover incorporated in the soil; PBI = Pigeon bean cover crop incorporated in the soil; S = Spontaneous vegetation mulch. Treatments (a) and years (b) indicated by different letters are significantly different at p < 0.05 (Tukey test). Error bars denote standard errors of the mean (n = 45).
Agronomy 11 00787 g008
Figure 9. Mean Soil Biological Quality Index (QBS) averaged across year and total limestone (adjusted-R2 = 18.3%) at (a) Montevertine (MT); and (b) San Giusto a Rentennano (SG). CT = Conventional Tillage; BCM = Mulched cover crop of grasses mixture + squarrosum clover; BCI = Cover crop of barley + squarrosum clover incorporated in the soil; PBI = Pigeon bean cover crop incorporated in the soil; S = Spontaneous vegetation mulch. Within a farm, treatments indicated by different letters are significantly different at p < 0.05 (Tukey test). Bars denote standard errors of the mean (n = 180).
Agronomy 11 00787 g009
Table 1. Weighted average of soil chemical properties (depth = 0–60 cm) at Montevertine and San Giusto a Rentennano upon sampling in October 2017.
Montevertine (MT)San Giusto a Rentennano (SG)
MeanMaxMinMeanMaxMin
PH8.18.27.98.08.27.8
P2O5 (mg kg−1)20.144.55.210.654.02.9
K (mg kg−1)981348414125881
Ca (mg kg−1)529959024207311635022400
Mg (mg kg−1)10221055546340
SOM (g 100 g−1)0.81.20.41.21.51.0
N (g kg−1)0.91.10.70.91.10.8
Total limestone (%)18.724.78.322.440.00.5
Active limestone (%)4.56.22.57.013.40.1
Clay (g 100 g−1)27.433.218.525.231.219.6
Loam (g 100 g−1)49.563.742.143.459.832.6
Sand (g 100 g−1)23.133.017.831.438.320.7
Gravel (%)32372312207
Table 2. Mean R2, R2-adjusted (R2 adj), root mean squared error (RMSE) and ratio of performance of prediction (RPD) of the models used to predict the soil parameters at Montevertine and San Giusto a Rentenanno from electrical conductivity (ECa) and Gamma-ray total count surveys. RMSE and RPD are reported in the unit of the variable.
Montevertine (MT)San Giusto a Rentennano (SG)
R2R2 adjRMSERPDR2R2 adjRMSERPD
SOM (g 100 g−1)0.780.560.12.60.46−0.080.11.6
Total Limestone (%)0.610.451.72.20.940.922.85.7
Gravel (%)0.610.452.71.60.340.083.31.3
K (mg kg−1)0.540.367.61.90.890.8514.93.6
Mg (mg kg−1)0.430.2030.41.50.760.662.72.2
Clay (g 100 g−1)0.480.2722.11.80.780.6910.82.8
Sand (g 100 g−1)0.21−0.1138.31.30.810.7320.02.9
Silt (g 100 g−1)0.23−0.0836.21.50.810.7328.63.0
Table 3. Significance of variables from the GLM model: type III SS analysis of variance for soil total N concentration (n = 60).
nChisqDfp Value
Treatment45.654***
Depth145.011***
Gravel5.2241*
Depth × Gravel3.1551ns
*, *** significant at p ≤ 0.05 and p ≤ 0.001, respectively.
Table 4. Significance of variables from the GLM model: type III SS analysis of variance for soil available P2O5 concentration (n = 60).
P2O5ChisqDfp Value
Treatment16.2484**
Year8.5221**
Farm0.2671ns
Depth148.9681***
Treatment × Year34.4594***
Treatment × Farm66.0274***
**, *** significant at p ≤ 0.01 and p ≤ 0.001, respectively.
Table 5. Significance of variables from the GLM model: type III SS analysis of variance for K (n = 60).
KChisqDfp Value
Treatment6.6074ns
Year1.4631ns
Farm16.3861***
Depth76.041***
Total limestone16.0721***
SOM10.84**
Treatment × Year8.0694ns
Total limestone × SOM0.0571ns
**, *** significant at p ≤ 0.01 and p ≤ 0.001, respectively.
Table 6. Significance of variables from the GLM model: type III SS analysis of variance for Soil Penetration Resistance (n = 600).
Soil Penetration ResistanceChisqDfp Value
Treatment121.4764***
Depth268.3881***
Gravel20.2251***
Farm58.3831***
Treatment × Depth14.3824**
Depth × Farm113.5251***
**, *** significant at p ≤ 0.01 and p ≤ 0.001, respectively.
Table 7. Significance of variables from the linear model: type III SS analysis of variance for the Soil Structure Stability Index (n = 45).
Structure Stability IndexSum SqdfF Valuep Value
(Intercept)57,84312978.209***
Treatment43045.534***
Farm425121.894***
year365118.795***
Total limestone20311104.555***
Farm × Year27211140.078***
*** significant at p ≤ 0.001.
Table 8. Significance of variables from the GLM model: type III SS analysis of variance for the Soil Biological Quality Index (QBS) (n = 180).
QBSChisqDfp Value
Treatment1.50584ns
Year0.07771ns
Farm2.79051ns
Total Limestone3.82891ns
Treatment × Year2.90764ns
Treatment × Farm24.00874***
*** significant at p ≤ 0.001.
Publisher’s Note: MDPI stays neutral with regard to jurisdictional claims in published maps and institutional affiliations.

