Article

Effect of White Clover (Trifolium repens L.) Undersowing Cultivation and Nitrogen Fertilization on Weed Infestation, Biomass Yield and Its Component, Content and Uptake of Macroelements of Willow (Salix viminalis L.)

Institute of Agroecology and Plant Production, Wrocław University of Environmental and Life Sciences, 50-375 Wrocław, Poland
Agronomy 2021, 11(4), 786; https://doi.org/10.3390/agronomy11040786
Submission received: 18 March 2021 / Revised: 12 April 2021 / Accepted: 14 April 2021 / Published: 16 April 2021
(This article belongs to the Special Issue Recent Advances in Biological Nitrogen Fixation)

Abstract

:
Fertilization of willow with nitrogen is an important issue with economic and environmental implications. The study was aimed at determining the effect of nitrogen fertilization and white clover on weed infestation, morphology, biomass and chemical composition of willow. A field experiment was established at Wroclaw University of Environmental and Life Sciences (Poland) during the years 2013–2017 with the use of a randomized complete block design (RCBD). The results showed that the number and dry mass of weeds per m2, the number of willow shoots and the fresh weight yield of willow were smaller where the clover was sown. The plants were found to be higher after applying nitrogen fertilization. The dry mass yield and shoot diameter did not depend on the cultivation method. Nitrogen fertilization increased the ash content. Undersowing willow with white clover, higher nitrogen content was found. Nitrogen fertilization increased the content of ash, and in undersowing cultivation, the willow stems had higher nitrogen content than in monoculture. On average, the phloem had 5.6 times higher crude ash content and 4.6 times higher nitrogen content than wood. On the basis of the conducted research, it can be concluded that in the first years after planting, the undersowing growing of willow with white clover can be an alternative to plantations fertilized and non-fertilized with nitrogen.

1. Introduction

Short rotation woody crops (SRWC) are important in ensuring a more secure energy future worldwide [1]. The cultivation of energy crops, including short-rotation woody crops (SRWC), leads to an increase in humus content and soil structure improvement [2,3]. Energy crops reduce carbon dioxide emissions both by replacing fossil fuels and by immobilizing organic carbon in soil [4,5,6]. In the near future, biomass obtained from SRWC will become more important and beneficial [7].
Of all the species cultivated for energy purposes, willow is cultivated in the greatest numbers in Northern Europe [4,7,8]. Due to the numerous environmental benefits, the area of willow cultivation is predicted to grow rapidly over the next decades [9]. This plant is characterized by high biomass increments [10], and due to its natural occurrence in Poland, Salix viminallis (L.) is perfectly adapted to the climatic conditions that occur in this country.
Soil erosion and nitrogen leaching on SRWC plantations are lower than on arable land. Nevertheless, it occurs [11,12,13,14,15,16], especially when plantations are established and on slopes. For instance, Kort et al. [15] stated that the long-term loss of productivity due to soil erosion in Minnesota is 5% but is greater on soils with slopes > 6%. Fertilization of newly established S. viminalis in Germany at a level of 75 kg N ha−1 per year as calcium nitrate resulted in leaching losses constituting between 23% and 49% of applied N in the first and second years of growth [17].
One way to reduce nitrogen leaching may be to sow white clover during planting energy crops. This plant is a cover crop grown via intercropping with the main crop, maintains soil fertility, and reduces the use of pesticides and mineral fertilizers and minimizes cultivation costs. Mc Laughlin et al. [18] stated that the cultivation of ground cover plants in the field trial with poplars prevented the leaching of fertilizer and nitrogen from the soil. The economic benefits (or losses) from fertilization largely depend on the cost of fertilization and the price received for biomass [19].
Willow is prone to weed infestation in the initial years after planting. It should also be noted that in the first vegetation period, weeds use nitrogen more efficiently than willow, and nitrogen fertilization does not always contribute to the yield increase [20]. In the first year after planting, weeds can limit willow growth from 50% to 95%. Currently, recommendations for the establishment of SRWC involve the use of herbicides and tillage in the autumn to control weeds [21].
Theoretically, undersowing of willow together with white clover can bring a number of benefits. Monoclonal growing systems are considered to be vulnerable to pathogen adaptations. The cultivation of cover crops results in an improvement in biodiversity on willow plantations and may decrease the pressure on willow from pathogens. The compact cover of white clover plants, with a strong root system, prevents erosion. Weed infestation also decreases, which is particularly beneficial for willows when there are high and climbing weeds on the plantation [22]. The symbiotic nitrogen fixation by bacteria coexisting with white clover increases the level of nitrates in the soil. The increase in soil nitrogen content depends on the number of root nodules, the rate of nitrogen fixation from the air and the length of the growing season. Fertilization, other organisms that fix nitrogen from the air and atmospheric lighting may also contribute to the increase in soil nitrate [23]. White clover can supply 100 kg ha−1 of atmospheric nitrogen (equivalent to 200 kg of nitrogen in mineral fertilizers) to the soil in chemical compounds [16].
However, white clover competes with willow for nutrients. It has been found that live cover plants integrated with woody plants during the establishment of plantations compete with each other for moisture and possibly light, resulting in reduced growth and leaching [24,25]. Other studies have not confirmed these observations [21,22]
The aim of this study was to compare differences in yield, morphology and chemical composition of willow fertilized and unfertilized with nitrogen and undersowing cultivation (willow with white clover) and then to compare these for 2013–2017. In the working hypothesis, it was assumed that undersowing cultivation with white clover could replace fertilization with nitrogen. The results of the research can be particularly useful for biomass producers. They can also be an inspiration for additional research for the needs of willow growers.

2. Materials and Methods

2.1. Study Sites

A field trial was conducted at Wroclaw University of Environmental and Life Sciences in Poland in 2013–2017. The field trial was located in a suburban area at a distance of 10 km northwest of the center of Wroclaw. The field plots were located at an altitude of 147 m above sea level, in the river Dobra’s catchment area, a right-bank tributary of the river Widawa. The geographical position is defined by the following coordinates: 5°10′ N, 17°07′ E.

2.2. Soil Conditions

The field experiments were conducted on a light soil defined as very light alluvial soil, on loose sand and sandy gravel. Each year, soil samples (from each plot) were analyzed. Samples were taken at a depth of 0–30 cm at the start of the vegetation period. Analysis was performed according to the following methods:
  • The soil reaction (KCl) by the potentiometric method;
  • The available forms of potassium and phosphorus by Egner–Riehm method [26,27];
  • Magnesium by Schachtschabel method [28].
The soil is visibly alkaline, the content of phosphorus ranges from medium to high, and potassium from high to very high [26], and the content of Mg is medium [28] (Table 1):

2.3. Weather Conditions

The research was conducted in one of the warmest of Lower Silesia’s regions. From 1901 to 1950, the average annual air temperature was 8.6 °C, the average temperature of the vegetation period (IV–IX) was 14.7 °C. The groundwater level was 85 cm below the ground level. The mean annual temperature during the study was higher than the long-term trend. The monthly and annual precipitation sums varied. The lowest precipitation was reported in 2015. Specific temperature and precipitation breakdown are described in Table 2 and Table 3.

2.4. Material and Management Practices

This study was conducted in an experiment with a Salix viminalis var. gigantea (1047 willow clone). This variety is intended for biomass producers. Research with this variety has been described out by many researchers [29,30,31,32]. It was planted with 20 cm ligneous one-year-old cuttings obtained from a nearby plantation (planted in 2010) immediately before planting the plants. The density of cuttings was 16,700 plants ha−1. The row distance was 1 m, and the distance between plants in a row was 0.6 m. White clover of the Romena cultivar was sown in the amount of 10 kg ha−1 (hand-sown during plantation setup). The clover was not mown during the studied period. For the first two years in tested undersowing cultivation, clover covered about 95% of the area. Clover dying was observed because of little access to light and drought in the third year of the experiment. To determine the yield, willow plants were harvested after the fifth vegetation period. The chemical composition was determined on four and five-year-old plants.
The preferred crop was winter oilseed rape (OSR), and the forecrop was fallow land. The most frequently weed species in the year preceding plantation establishment included: Elymus repens (L.) Gould., Viola arvensis Murr. and Thlaspi arvense L. In July and September 2012, two sprays of Roundup 360 SL herbicide at a dose of 5 L ha−1 were applied, and autumn plowing was performed. In spring, the field was evened out with a cultivator. After these treatments, weeds were no longer controlled until the end of the experiment.
Mineral fertilizers were applied annually in spring (before the start of vegetation). Fertilized plots annually received 35.2 kg P ha−1 and 83 kg K ha−1 in the form of triple superphosphate and potassium salt. Urea (50 kg N ha−1) was applied on nitrogen fertilized plots.

2.5. Measurement

The number and dry mass of weeds were assessed each year in June. A 50 cm × 50 cm metal frame was placed on the ground between the rows at four places within each treatment plot. The numbers and species of weeds were recorded inside each frame. The weed biomass was assessed by weighing their fresh mass. The dry matter of the weeds was established by the drying method. The fresh mass of weeds was dried at 60 °C for 24 h and then for five hours at 105 °C. After harvest in December 2017, absolute dry mass yield and water content in Salix plants were determined based on 4 randomly chosen shoots from every plot. The shoot fragments were cut at a distance of 20 cm on both sides of the gravity center point and subsequently dried at 60 °C for 1 week until a constant weight was reached, and then dried for 5 h at 105 °C (modified norm PN-R-04013:1988). The weight of fresh and dry stem pieces was determined with an accuracy of 0.01 g. Total shoot dry weight per plot was calculated by multiplying the total fresh weight of all sampled shoots for each plot by the dry matter content. Plant shoot dry weight was calculated as total shoot dry weight per plot divided by the number of living plants in each plot.
At the beginning and end of the vegetation period, the diameter and height of the main shoot were measured 20 cm above the ground, and plant losses were determined. The plant was designated as dead if no living tissue was detected at 5 cm above the ground.

2.6. Chemical Analysis

Plant material was collected at the end of the growing season (December 2016 and 2017). Stems were collected from ten randomly chosen plants. Plant material was dried and minced, and chemical analysis was performed:
  • Crude ash—determined by burning of 2 g plant material at 600 °C in an electric furnace. After a loss on ignition, the crucibles were placed in a desiccator to cool down and then weighed to the nearest 0.001 g.
  • The Kjeldahl method using the Kjeltec apparatus was applied for total nitrogen determination [33].
  • Potassium and calcium concentrations were determined by flame photometry using Flapho 4 (Carl Zeiss Jena—GDR).
  • Phosphorus concentration was determined by a colorimetric method with vanadium and molybdenum reagents using Spekol 10—Carl Zeiss (Jena—GDR).
  • Magnesium concentration was determined by a colorimetric method with yellow titanium using Spekol 10 (Carl Zeiss Jena—GDR).
I separate the phloem from the wood manually. The uptake of crude ash and macroelements was calculated as a multiplication of the dry mass yield and chemical concentration.

2.7. Statistical Analysis

Five years (2013–2017) of one-factor field experiment was established with the use of a randomized complete block design (RCBD). The study was based on rigorous 1-factor field trials. The study compared weed assessments, morphological features, yield, and chemical composition of (a) basket willow in monoculture without nitrogen fertilization, (b) basket willow in undersowing cultivation with white clover and (c) basket willow monoculture fertilized with nitrogen at a dose of 50 kg ha−1. The area of plots was 12 m2 with 4 replications of each treatment.
All examined parameters were statistically evaluated, using analysis of variation, at a 0.05 level of confidence. Plant mortality variations between treatments were compared using data from square root transformations. The conversion was performed to meet the assumptions of the standard normal distribution. The AWA program [34] was used for the least significant difference (LSD). The results were statistically analyzed using STATISTICA 13.0 PL, Palo Alto, CA, USA. Homogeneous groups were determined by Tukey’s multiple range test using consecutive letters starting from “a”—the most beneficial value—to “e”—least beneficial in terms of economic value. ± figures in tables represent the standard deviation. The vertical line at the top of each bar in Figure 1 is the standard deviation for that mean.

3. Results and Discussion

3.1. Weed Assessments

Weed infestation has a significant effect on yield and plant mortality [35]. In a study carried out by Welc et al. [36], weed competition reduced aboveground biomass production on average by 36%. In our own research for the first two years, the weed flora was dominated by Elymus repens (L.) Gould, Thlaspi arvense L., Viola arvensis Murr. and Chenopodium album L. In the next few years, the occurrence of the following perennial weeds increased: Elymus repens, Artemisia vulgaris L., Urtica dioica L., Solidago canadensis L., Achillea millefolium L., Taraxacum officinale F.H. Wigg. Furthermore, Albertsson et al. [37] noticed that the weed flora was initially dominated by annuals for the first two years but became dominated by perennial weeds during the following years. The number and dry weight of weeds, in general, decreased during the 2013–2015 field experiment. In the Edelfeldt et al. [38] study, higher weed biomass was obtained on plots with high nitrogen levels, where they were sown earlier. In our study, the lowest weed count was noted with the undersowing cultivation of willow and white clover (Table 4). Similar results have been reported by other authors [22,39]. The largest dry mass of weeds was achieved in treatment fertilized with nitrogen and the lowest on plots with white clover. The results obtained for a dry matter of weeds showed a high level of variability as measured by the standard deviation. The differences were significant in the first and third years of the study (Table 4). Fertilization may instead benefit weeds more than willow resulting in an increased competitive ability and a high relative growth rate for the weeds. These observations are confirmed by the studies of Balasus et al. [17]. In another study [38], in the first year, fertilization increased weed biomass growth by 46%, suggesting that weeds are more responsive to fertilization than willow.

3.2. Plant Mortality Assessments

By the second 3-year harvest, willow survival was still over 80% in the McCracken et al. [40] research. In our own research, in general, 83% of the planted plants survived within 5 years. The number of plants per m2 decreased significantly in the study years, but no significant differences were found in the number of plants dying in different cultivation systems. Willow loss mainly occurred in the first year after the experiment was established. The lowest rainfall was recorded in 2015 (Table 3), which resulted in a higher number of withered willow plants than in the previous year. At the same time, in that year, the highest standard deviation was recorded for the number of shoots per plant and per 1 m2. Willow plants produced on average about 3 shoots from one cut (Table 5). In the research by Hangs et al. [41], where the willow plants were cut down after the first year after planting, the number of shoots per plant was 2–3 times higher than that in our own experiment. There were no significant differences between study years and year-by-system cultivation interactions regarding planting density (Table 5).
A less restrictive test of homogeneous groups showed that willow intercropped with white clover in the last year had the fewest shoots per 1 m2 compared to the other cropping systems (Table 5). The highest number of shoots per plant and shoots per m2 was obtained by growing willow in monoculture without nitrogen fertilization and the lowest by growing willow and white clover in undersowing cultivation. Therefore, farmers who decide to cultivate willow with white clover should plant willow in this undersowing system more densely than when growing willow in monoculture., This method of cultivation may turn out to be risky in case of low precipitation.

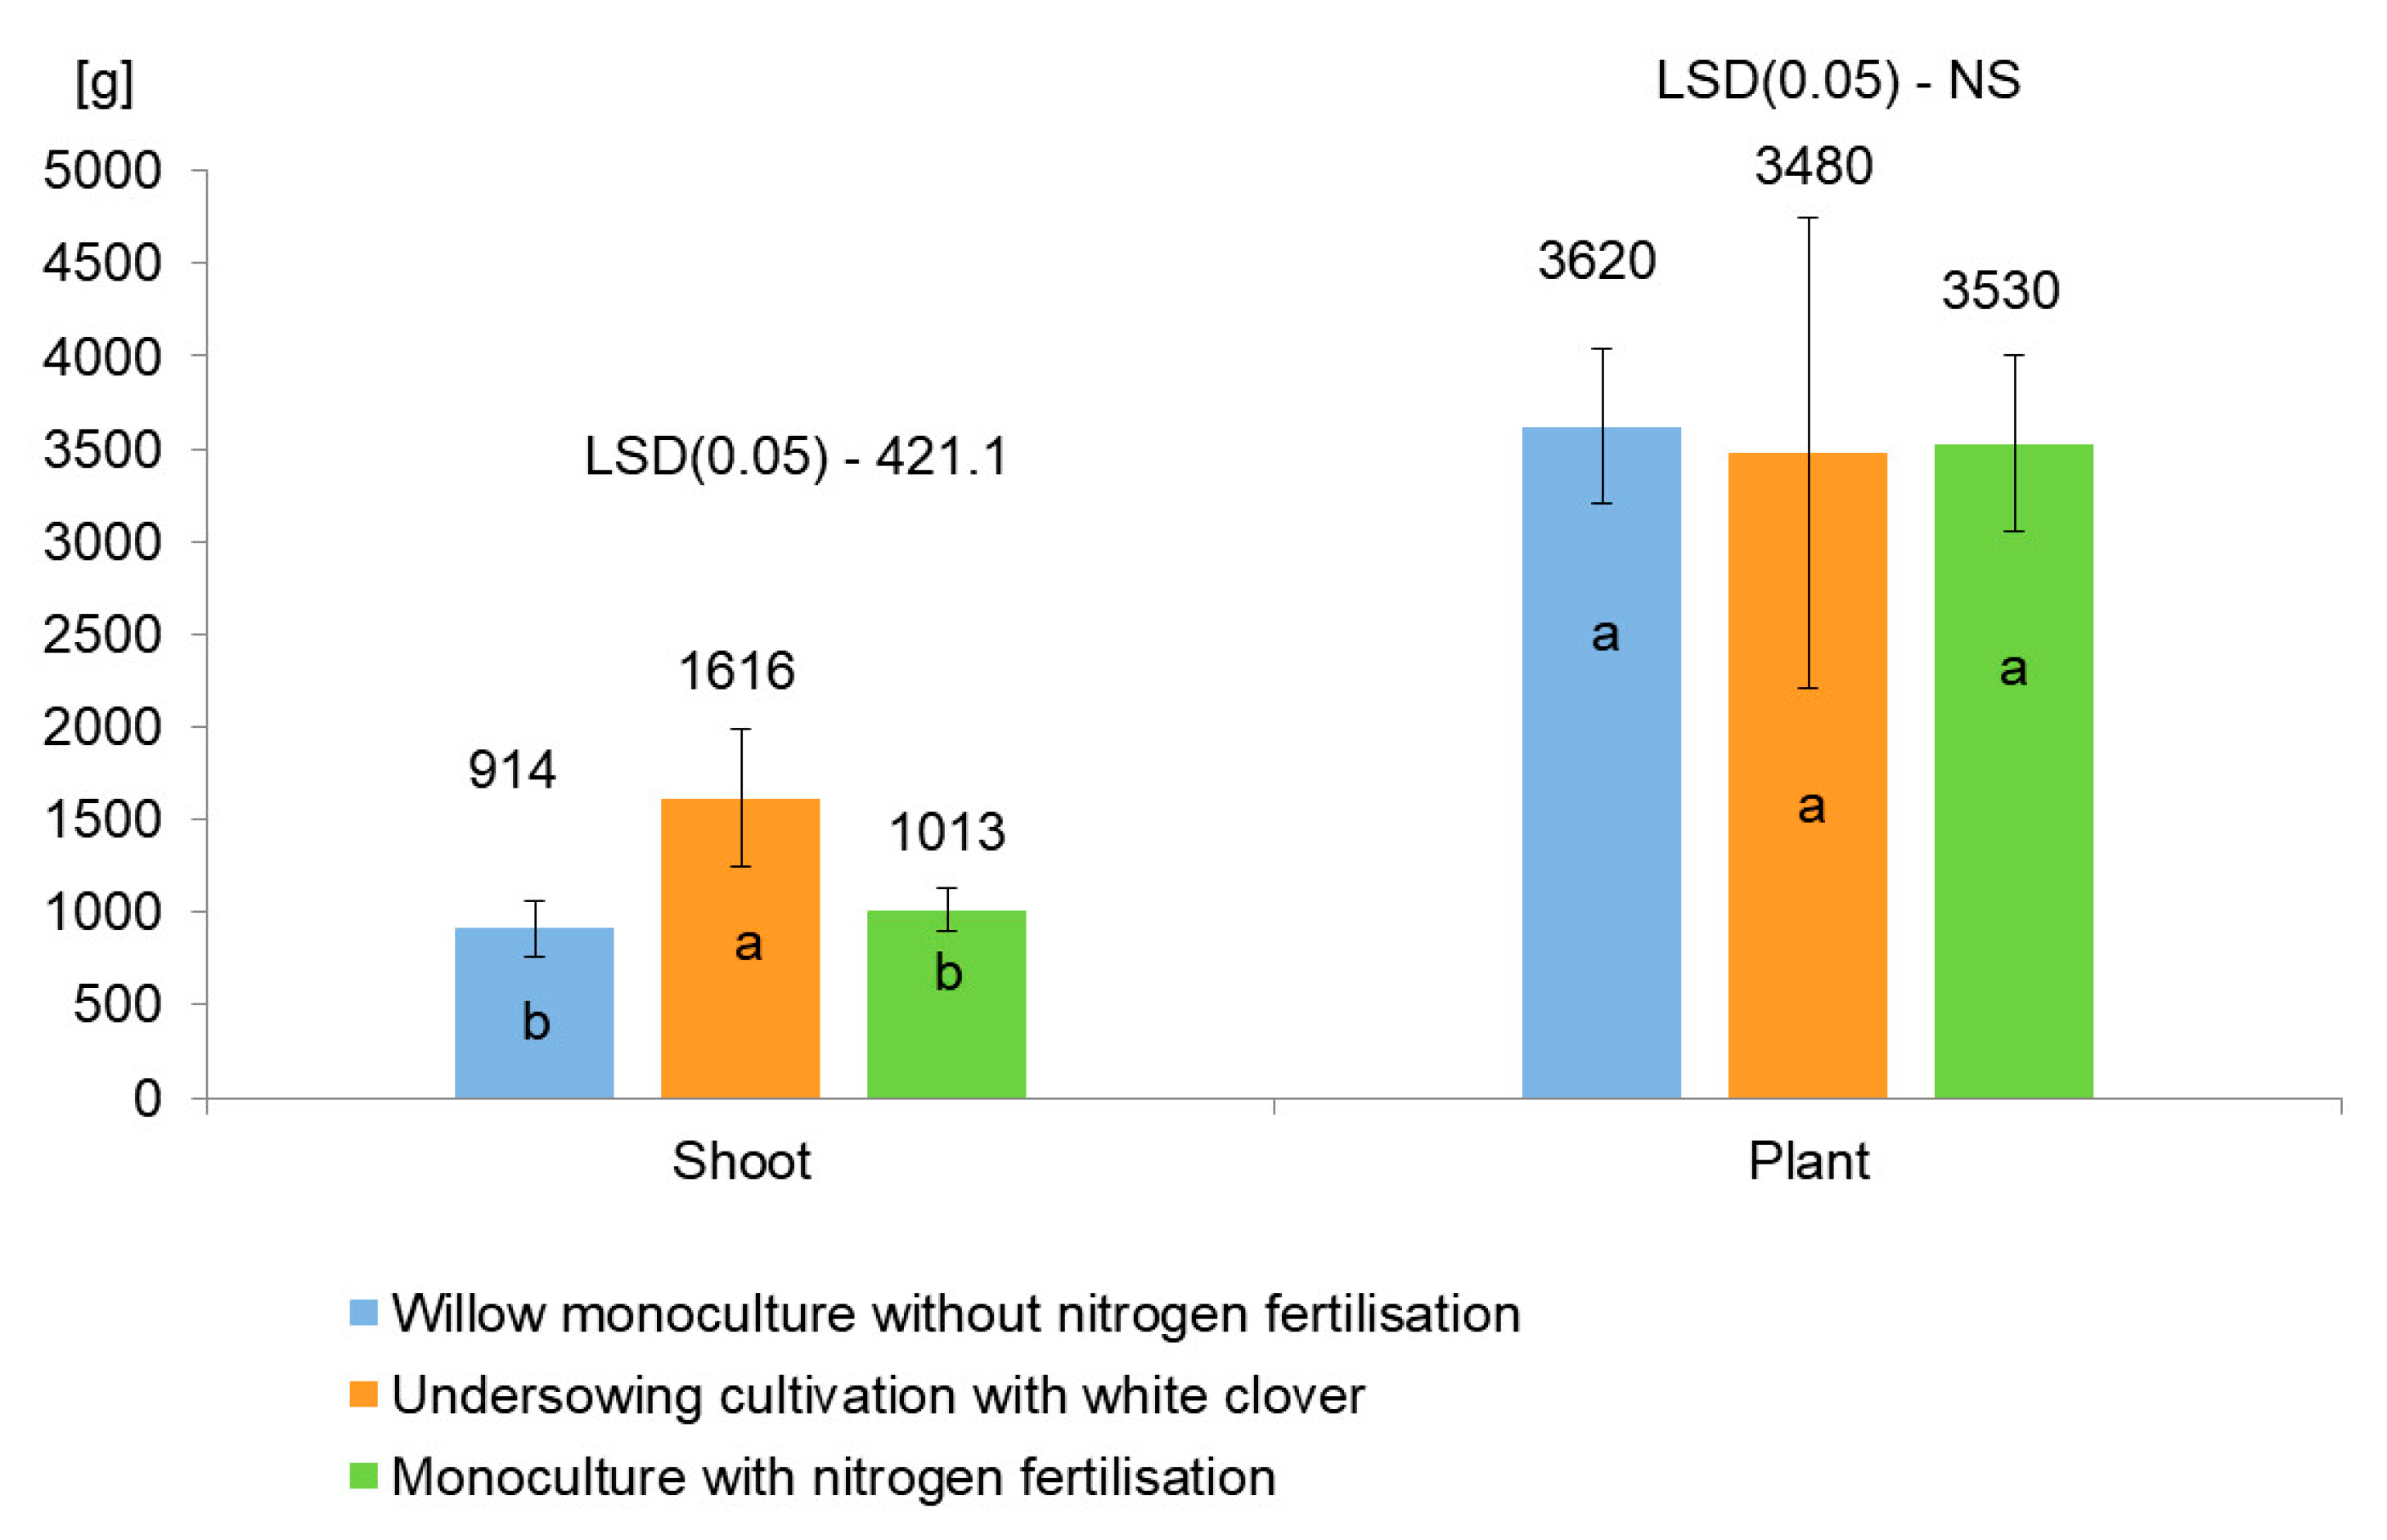
3.3. Morphological Traits

The stem diameter, plant height and number of shoots were found to be significant factors variable for willow biomass production [38]. The highest plant growth dynamics were observed in the second year of the study. Regardless of the cultivation system, five years after planting, the willow plants reached a height of more than 5 m and a diameter of about 40 mm, and the differences between the cultivation systems were negligible (Table 6). Furthermore, the volume of trees fertilized with easily soluble fertilizers was no different from those fertilized with controlled-release fertilizers in the research by Brown and van den Driessche [42]. Sevel et al. [1] measured the diameter of 3-year-old shoots as being from 18.1 to 27.2 mm compared to the 25.8 mm observed in the own study (Table 6).
Mild temperatures and frequent rainfall are suitable conditions for growing willows. Willows have very high evapotranspiration requirements, and in Sweden, for optimal growth at mid-summer, 5–6 mm of available water per day are needed [43]. Sufficient precipitation was recorded only in June 2013. In 2015 because of the lowest precipitation, the lowest plant height increases were noticed except for the first-year trial (Table 3 and Table 6). In the reported experiments [21], it was observed that during the first 2 months after plowing of 34-day old clover, willow grew better in a pure stand. In the own trial, we observed that the plant height in undersowing cultivation was higher than in the non-fertilized plants. However, the highest plant height was observed on plots where nitrogen fertilization was applied (Table 6). Although there were no significant year-by-high of plant differences in plant interactions, the homogeneous groups test showed that in 2015 and 2016, nitrogen-fertilized willow was higher than in the other cropping systems. The highest standard deviation of the height of the plant was recorded in 2016 (Table 6).
There were the least number of shoots per m2 and shoots per plant in undersowing cultivation (Table 5). However, the higher accessibility of light and nutrients later meant that the dry mass of willow shoots in this cultivation was greater. The dry mass of plants (as a result of multiplying the number of shoots per plant by the mass of one shoot) did not vary between the different cultivation systems (Figure 1).
A regression analysis confirmed the presence of a significant correlation between the diameter of shoots, the height of plants and the dry mass of the main shoot (Table 7 and Table 8). Similar to the study by Krzyżaniak [44], a correlation was observed between the height of the main shoot and its diameter. A significant correlation (r2 = 0.86) between age and diameter was found in one study [45] using regression analysis.

3.4. Yield of Fresh and Dry Mass of Willow

Willow can yield 20 Mg ha−1 under optimal conditions [46]. Based on the experience of other authors, the assumed yield of willow biomass for the first cycle is 10 Mg dry mass ha year−1 [17,46]. For example, yields are given 9.1 Mg ha−1 in the UK [47], in Swedish 7 Mg dry mass ha−1 per year. In other research [48,49], yield in Poland was higher compared to my field experiment. The subsequent rotations grow faster because the willow root system is already established [50]. Some scientists state the increase in biomass yields willow and poplar as a result of N, P and K fertilization [51]. The nitrogen levels had no significant effect on willow yield in a two-year study by Balasus et al. [17]. The total dry mass of willow in undersowing cultivation with white clover was not significantly different from the total dry mass of willow under the control treatment in own study (Table 9). Similar results were obtained by Arevalo et al. [21] after several months of growing S. sachalinensis and S. discolor with white clover. However, in our own study, the yield of fresh mass was significantly lower in willow with white clover than in monoculture. The water content in the fresh matter of the plants was about 50% (Table 9). In another study [22] at higher precipitation willow–white clover undersowing cultivation had a positive effect on the yield of fresh willow weight.

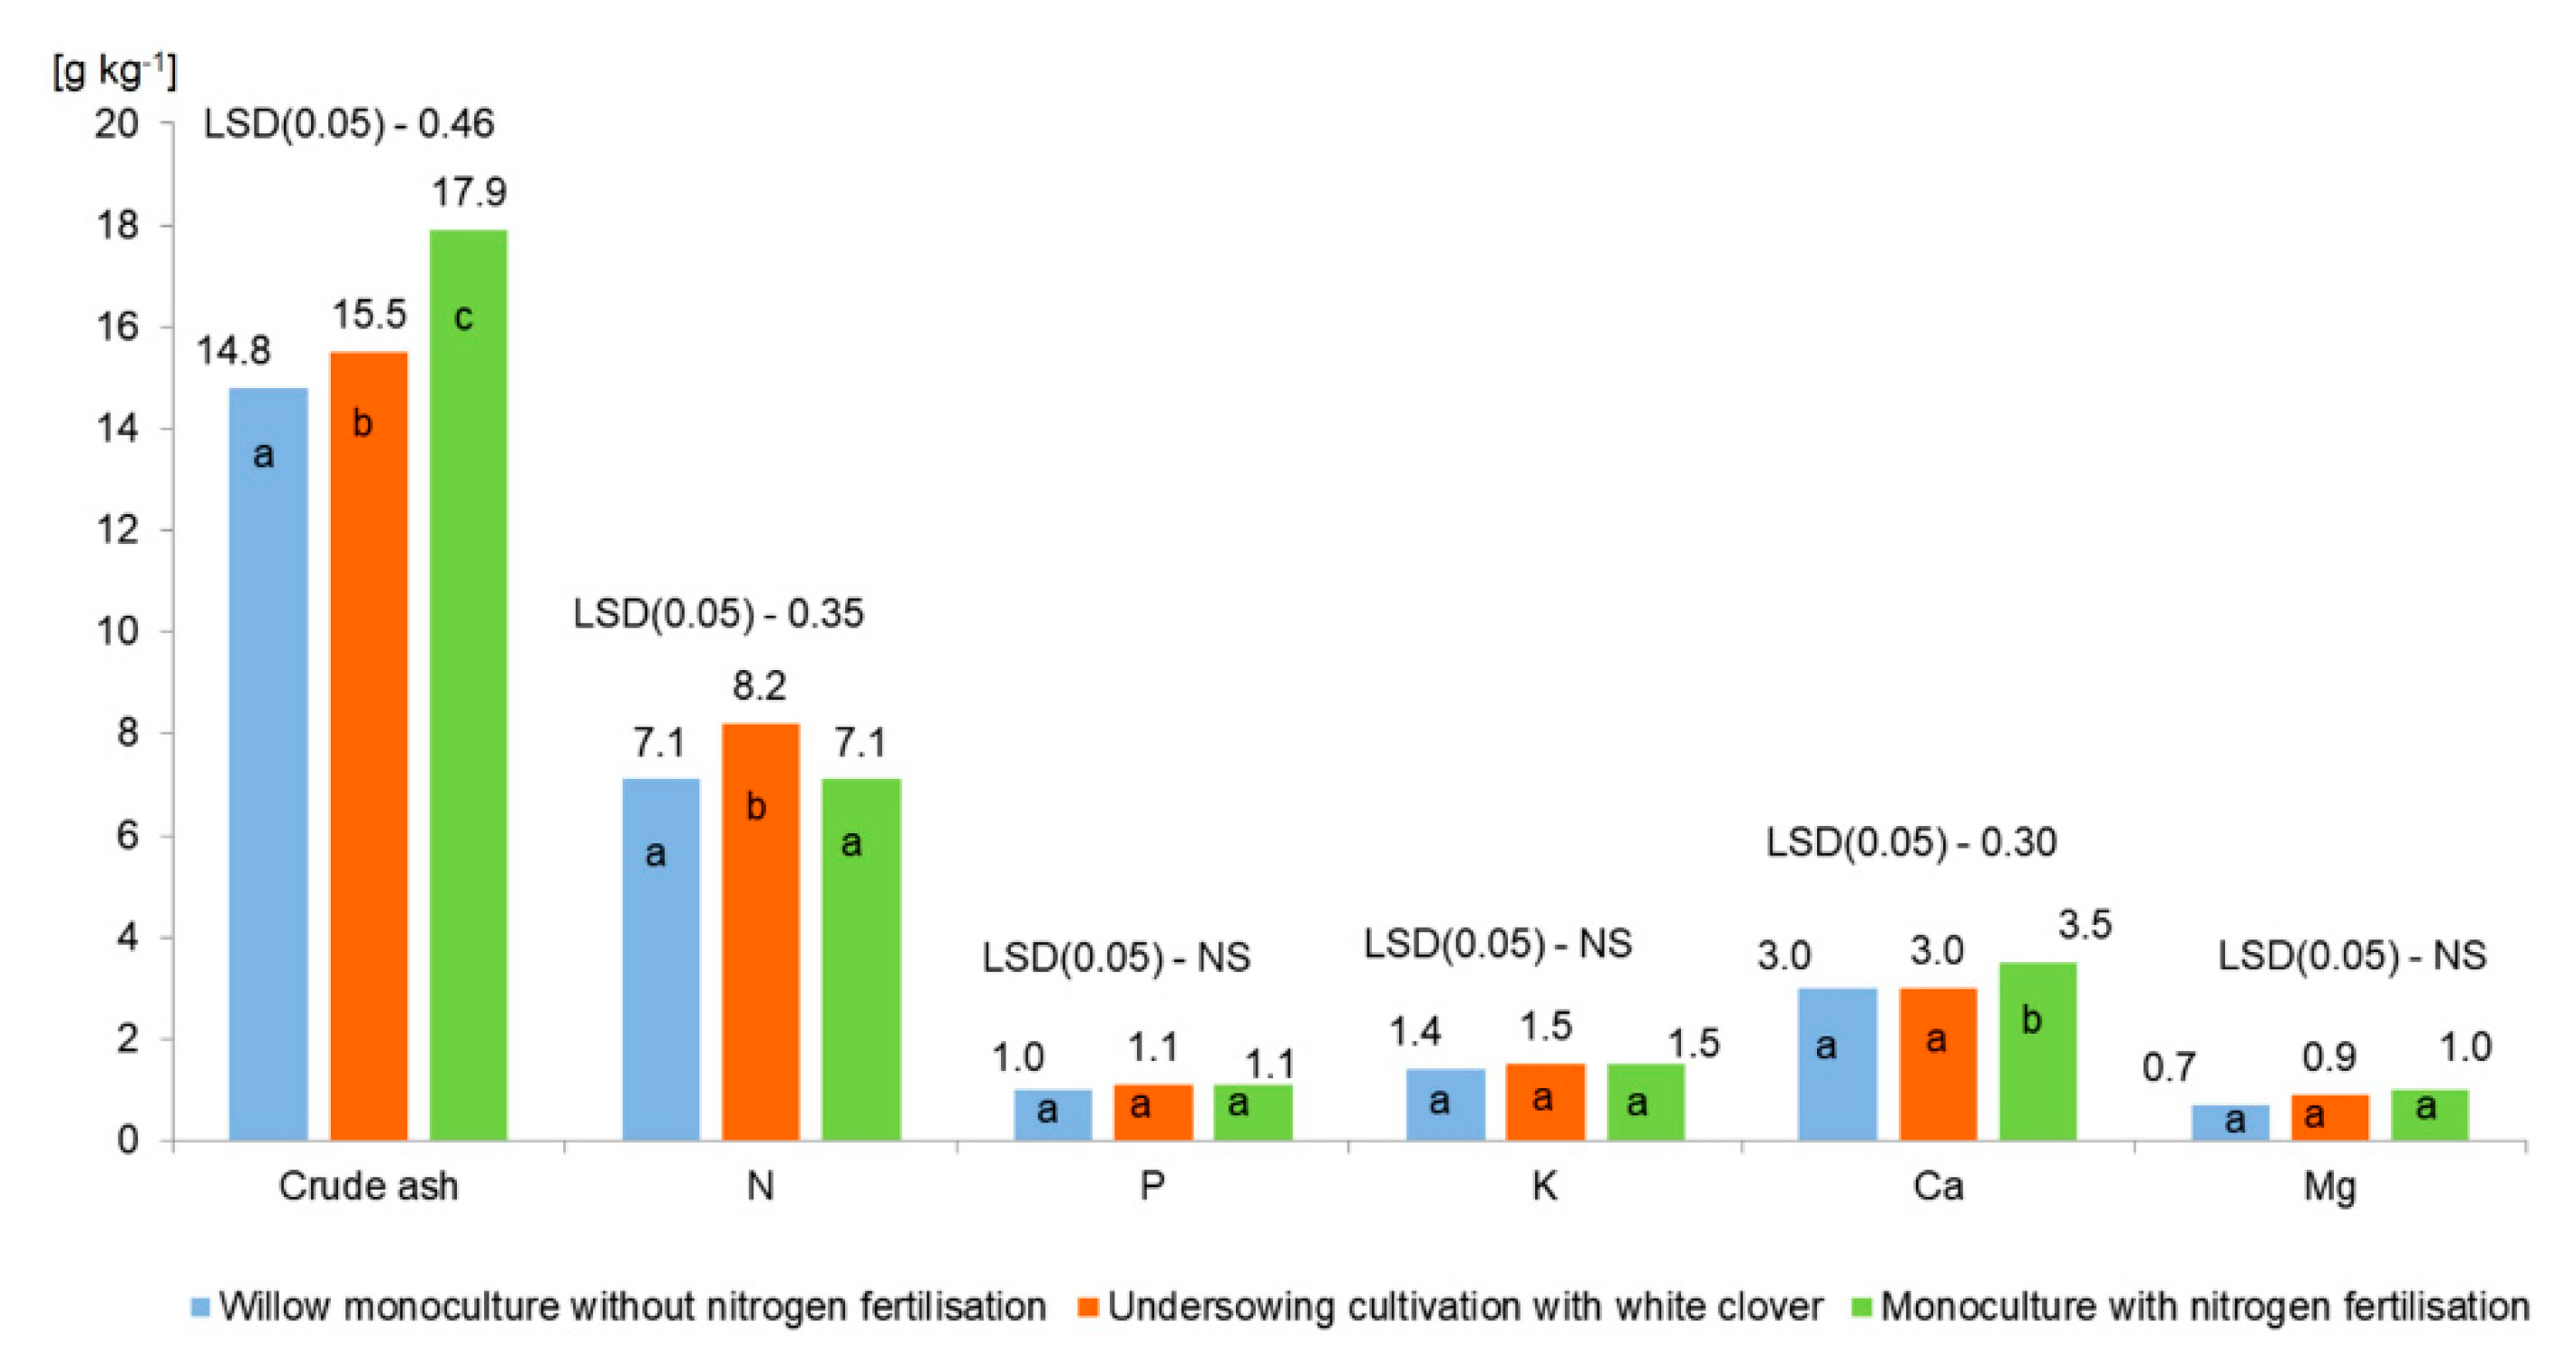
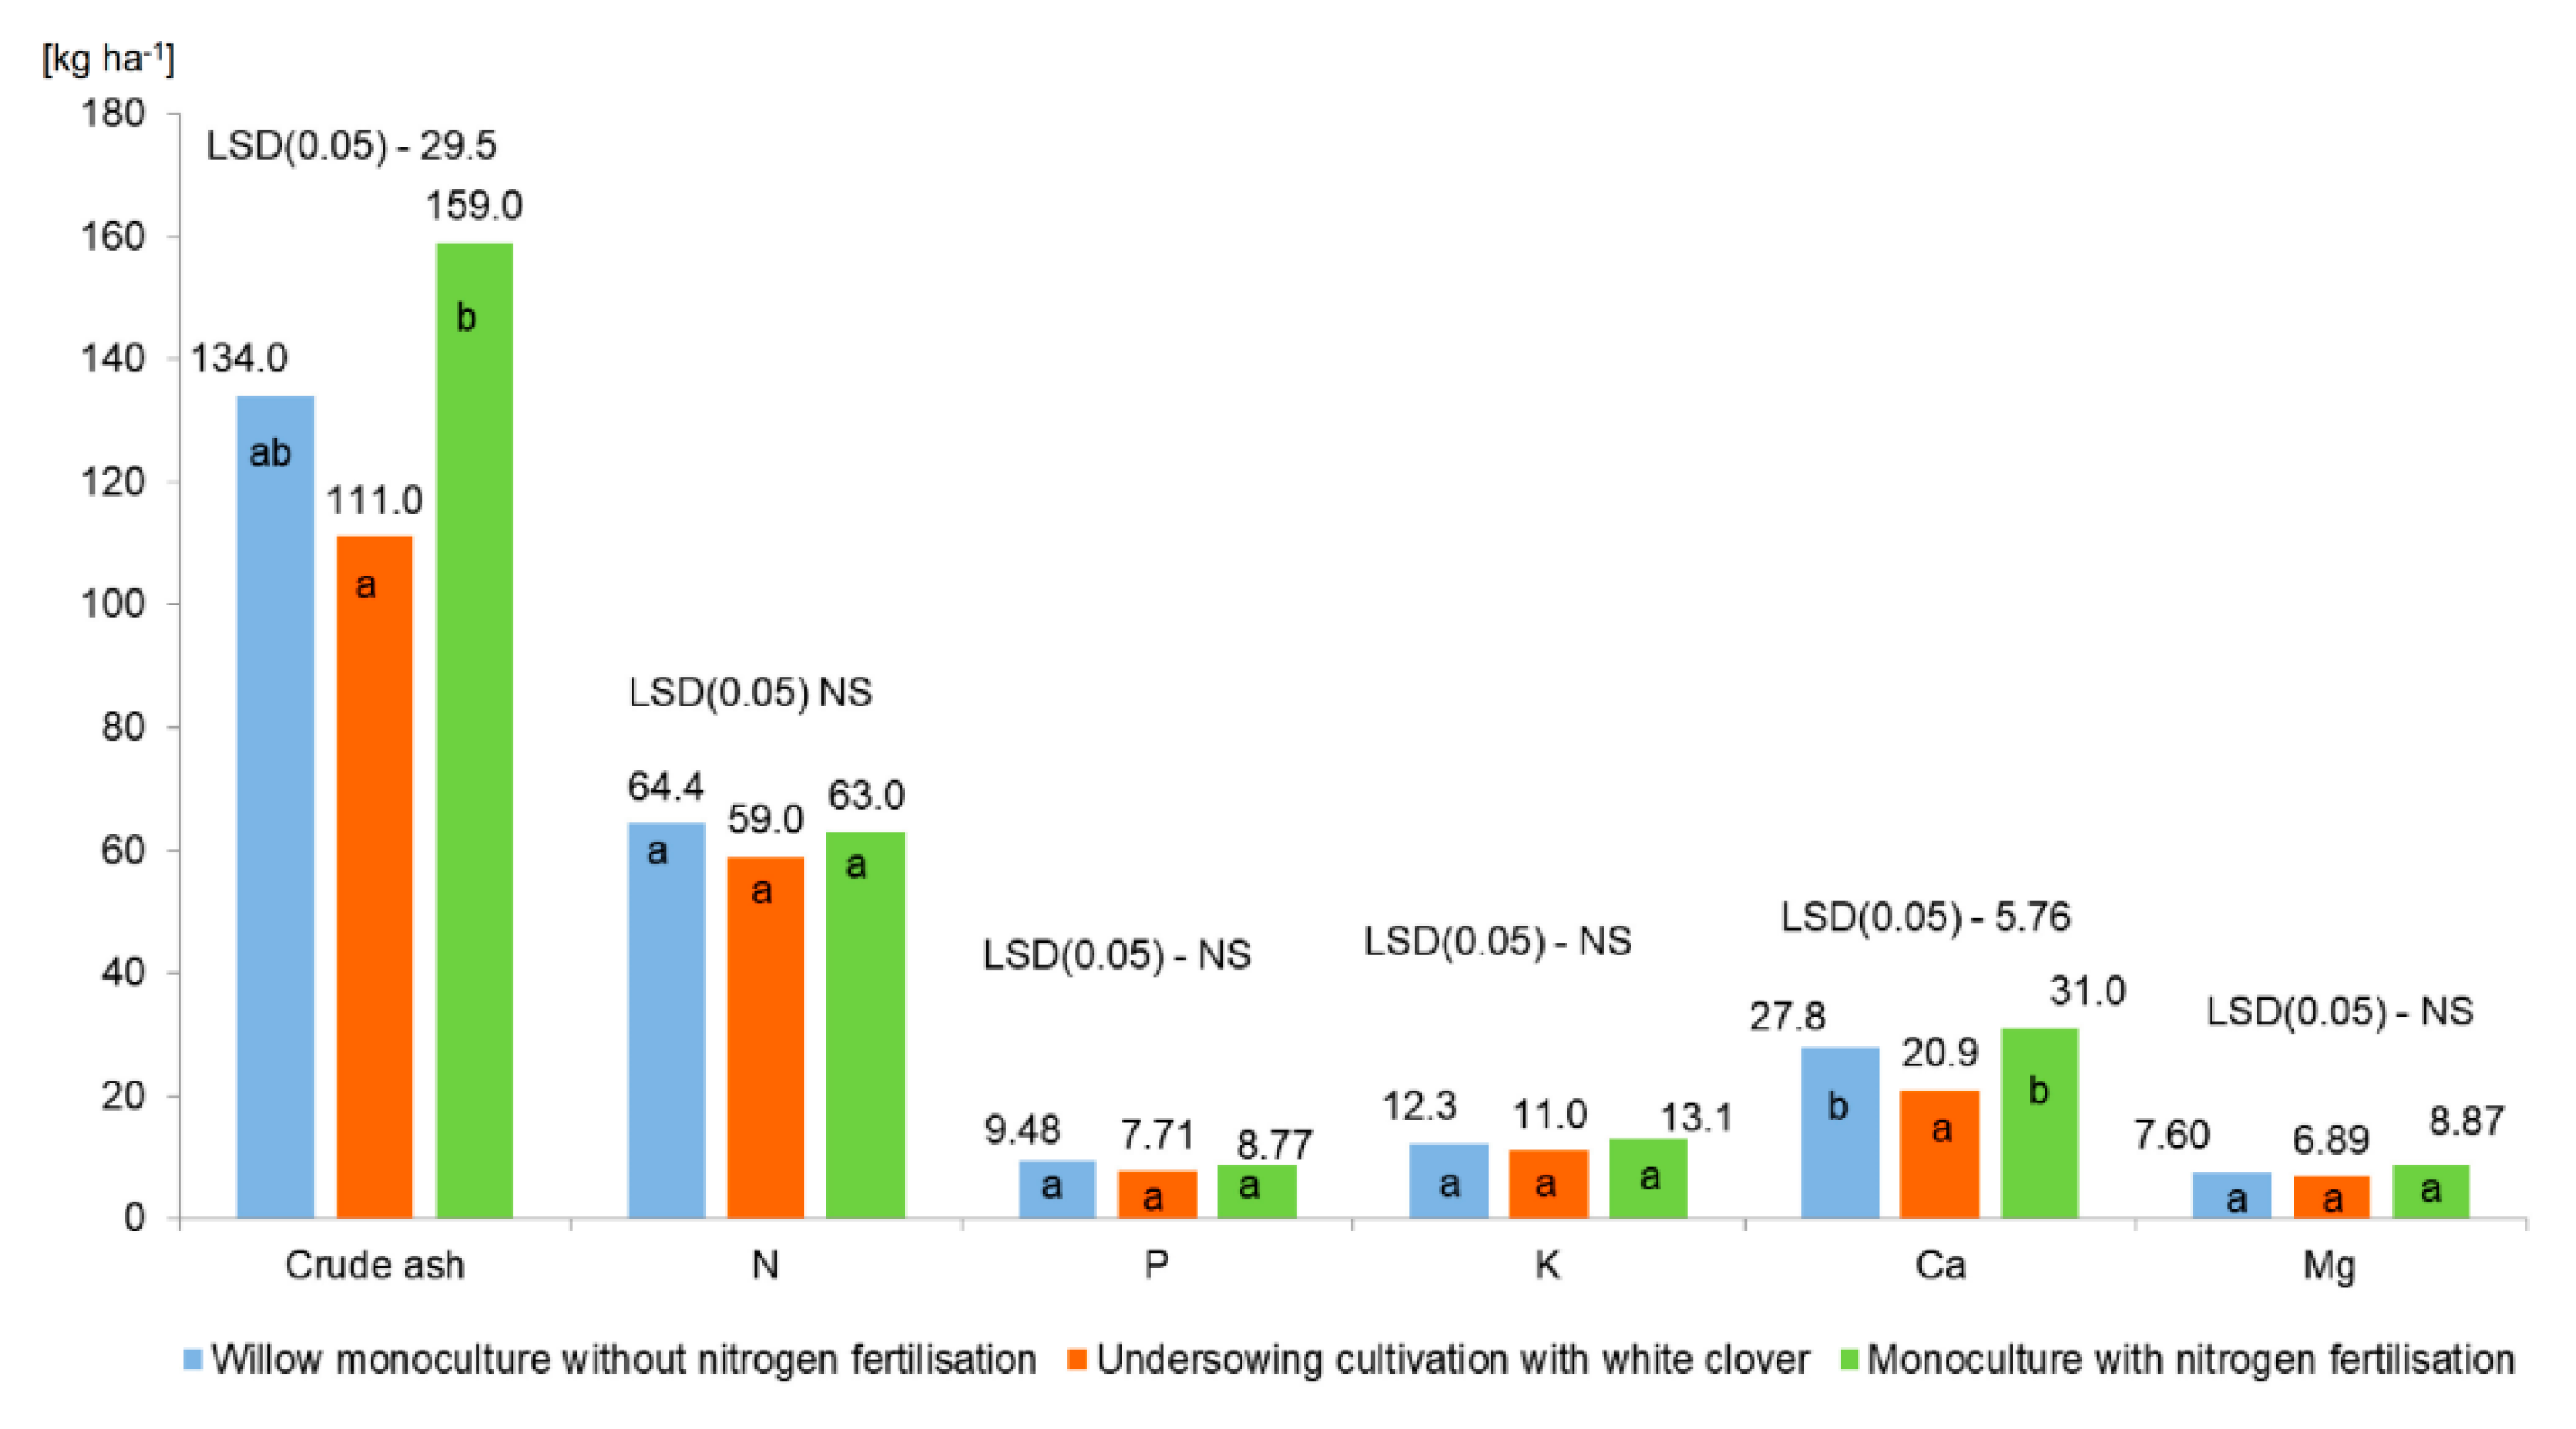
3.5. Chemical Composition and Uptake of Macronutrients in Willow Plants

The main environmental problems associated with short-rotation woody crops in relation to plant nutrients include changes—either depletion or accretion in elemental content of the soil and disposal of ash or other wastes left after burning or other processes using the biomass [12]. Furthermore, a high ash and potassium concentration lower its calorific value [52]. On the other hand, wood ash can be used to fertilize and increase soil pH, thus improving plant growth [12]. Estimation of ash content and macronutrients may, therefore, be important for practical purposes.
Similar to the study by Schroeder et al. [53], the ash content was approximately 16 g kg−1 dry mass, and the highest ash content was recorded in willow plants fertilized with inorganic nitrogen (Figure 2).
The nitrogen content was the highest in the undersowing cultivation. Labrecque and Teodorescu [54] suggest that on sites where soil nitrogen content is high, willows have a lower response to fertilization. In contrast to nitrogen, the potassium content was lower in our research than in Sevel [55]. The phosphorus content was comparable to the results obtained by Jama-Rodzeńska et al. [31]. In all instances, the wood had less ash and macroelements than the phloem (Table 10). The ratio of dry wood mass to phloem dry mass in undersowing cultivation and nitrogen fertilization was 3.9:1, and for the control, 3.91:1. Nitrogen fertilization (and production of nitrogenous fertilizers) and combustion of biomass with high nitrogen content adversely affect the climate and human health [56]. Therefore, considering the protection of the environment and human health, the best way of cultivation turned out to be a willow monoculture without nitrogen fertilization.
Harvesting was the main factor responsible for the net export of nutrients [55] and should be taken into account for the determination of fertilizer doses. In the experiment by Labrecque and Teodorescu [54], after the completion of 3 years of willow rotation and depending on the fertilization of sewage sludge and soil, the nitrogen intake amounted to 50.3–176.2; phosphorus 5.9–20.6; potassium 16.7–71.3; calcium 49.8–96.5 and magnesium 4.3–13.9 kg ha−1 per year. Nitrogen and phosphorus uptake on sandy soils was similar, and potassium and calcium uptake were higher [54] than in my own research. In our own studies, the uptake of nitrogen and calcium was similar, magnesium higher and potassium lower than in Several studies [55]. In my field experiment in undersowing cultivation, the accumulation of crude ash and calcium was lower than in monoculture (Figure 3). Less raw ash and calcium elevation may lead to a smaller decrease in soil pH, which is beneficial on light soils in Poland.

4. Conclusions

White clover grown together with willow contributed to the reduction of willow shoots per m2 both and shoots per plant. Undersowing of two selected species also resulted in the highest average dry weight of one willow shoot (g), taking into account the lower competition for daylight and nutrients (least shoot density). The dry matter yield of willow (Mg ha−1) in undersowing system cultivation and nitrogen fertilization did not show positive effects compared to cultivation in monoculture without fertilization. This may suggest that nitrogen fertilization is not an essential factor for willow growth in the first years after planting and partly supports the working hypothesis that intercropping of willow with white clover can replace nitrogen fertilization in the first years after the establishment of the plantation. Willow shoots grown together with clover were characterized by higher nitrogen content compared to monoculture. Lack of nitrogen fertilization in the first years after planting reduces the cost of establishing a plantation and is beneficial to the environment. On the basis of the conducted research, it can be concluded that in the first years after planting, the undersowing growing of willow with white clover can be an alternative to plantations fertilized and non-fertilized with nitrogen.

Funding

This research received no external funding.

Conflicts of Interest

The author declares no conflict of interest.

References

  1. Keoleian, G.A.; Volk, T.A. Renewable Energy from Willow Biomass Crops: Life Cycle Energy, Environmental and Economic Performance. CRC Crit. Rev. Plant Sci. 2005, 24, 385–406. [Google Scholar] [CrossRef]
  2. Clifton-Brown, J.; Hastings, A.; Mos, M.; McCalmont, J.P.; Ashman, C.; Awty-Carroll, D.; Cerazy, J.; Chiang, Y.-C.; Cosentino, S.; Cracroft-Eley, W.; et al. Progress in upscaling Miscanthus biomass production for the European bio- economy with seed based hybrids. GCB Bioenergy 2017. [Google Scholar] [CrossRef] [Green Version]
  3. Hansen, E.M.; Christensen, B.T.; Jensen, L.S.; Kristensen, K. Carbon sequestration in soil beneath long-term Miscanthus plantations as determined by 13C abundance. Biomass Bioenergy 2004, 26, 97–105. [Google Scholar] [CrossRef]
  4. Caputo, J.; Balogh, S.B.; Volk, T.A.; Johnson, L.; Puettmann, M.; Lippke, B.; Oneil, E. Incorporating Uncertainty into a Life Cycle Assessment (LCA) Model of Short-Rotation Willow Biomass (Salix spp.) Crops. Bioenergy Res. 2014, 7, 48–59. [Google Scholar] [CrossRef]
  5. Clifton-Brown, J.C.; Breuer, J.; Jones, M.B. Carbon mitigation by the energy crop, Miscanthus. Glob. Chang. Biol. 2007, 13, 2296–2307. [Google Scholar] [CrossRef]
  6. McLaughlin, S.; Walsh, M. Evaluating environmental consequences of producing herbaceous crops for bioenergy. Biomass Bioenergy 1998, 14, 317–324. [Google Scholar] [CrossRef] [Green Version]
  7. Stolarski, M.; Szczukowski, S.; Tworkowski, J.; Klasa, A. Productivity of seven clones of willow coppice in annual and quadrennial cutting cycles. Biomass Bioenergy 2008, 32, 1227–1234. [Google Scholar] [CrossRef]
  8. Stolarski, M.J.; Krzyżaniak, M.; Szczukowski, S.; Tworkowski, J.; Załuski, D.; Bieniek, A.; Gołaszewski, J. Effect of Increased Soil Fertility on the Yield and Energy Value of Short-Rotation Woody Crops. Bioenergy Res. 2015, 8, 1136–1147. [Google Scholar] [CrossRef] [Green Version]
  9. Verwijst, T. Willows: An underestimated resource for environment and society. For. Chron. 2001, 77, 281–285. [Google Scholar] [CrossRef] [Green Version]
  10. Serapiglia, M.J.; Cameron, K.D.; Stipanovic, A.J.; Abrahamson, L.P.; Volk, T.A.; Smart, L.B. Yield and Woody Biomass Traits of Novel Shrub Willow Hybrids at Two Contrasting Sites. Bioenergy Res. 2013, 6, 533–546. [Google Scholar] [CrossRef] [Green Version]
  11. Eckersten, H.; Noroha-Sannervik, A.; Torssell, B.; Nyman, P. (Eds.) Modelling Radiation Use, Water and Nitrogen in Willow Forest; Report from the Department of Crop Production Ecology (VPE); Swedish University of Agricultural Sciences (SLU): Uppsala, Sweden, 2006; ISBN 91-576-6898-1-21. [Google Scholar]
  12. Heilman, P.; Norby, R.J. Nutrient cycling and fertility management in temperate short rotation forest systems. Biomass Bioenergy 1998, 14, 361–370. [Google Scholar] [CrossRef]
  13. Malik, R.K.; Green, T.H.; Brown, G.F.; Mays, D. Use of cover crops in short rotation hardwood plantations to control erosion. Biomass Bioenergy 2000, 18, 479–487. [Google Scholar] [CrossRef]
  14. Mann, L.; Tolbert, V. Soil Sustainability in Renewable Biomass Plantings. AMBIO J. Hum. Environ. 2000, 29, 492–498. [Google Scholar] [CrossRef]
  15. Kort, J.; Collins, M.; Ditsch, D. A review of soil erosion potential associated with biomass crops. Biomass Bioenergy 1998, 14, 351–359. [Google Scholar] [CrossRef]
  16. Andrews, M.; Scholefield, D.; Abberton, M.T.; McKenzie, B.A.; Hodge, S.; Raven, J.A. Use of white clover as an alternative to nitrogen fertiliser for dairy pastures in nitrate vulnerable zones in the UK: Productivity, environmental impact and economic considerations. Ann. Appl. Biol. 2007, 151, 11–23. [Google Scholar] [CrossRef]
  17. Balasus, A.; Bischoff, W.-A.; Schwarz, A.; Scholz, V.; Kern, J. Nitrogen fluxes during the initial stage of willows and poplars in short-rotation coppices. J. Plant Nutr. Soil Sci. 2012, 175, 729–738. [Google Scholar] [CrossRef]
  18. Mc Laughlin, R.A.; Pope, P.E.; Hansen, E.A. Nitrogen Fertilization and Ground Cover in a Hybrid Poplar Plantation: Effects on Nitrate Leaching. J. Environ. Qual. 1985, 14, 241–245. [Google Scholar] [CrossRef]
  19. Fabio, E.S.; Smart, L.B. Effects of nitrogen fertilization in shrub willow short rotation coppice production—A quantitative review. GCB Bioenergy 2018, 10, 548–564. [Google Scholar] [CrossRef]
  20. Densmore, R.V.; Neiland, B.J.; Zasada, J.C.; Masters, M.A. Planting Willow for Moose Habitat Restoration on the North Slope of Alaska, U.S.A. Arct. Alp. Res. 1987, 19, 537–543. [Google Scholar] [CrossRef]
  21. Arevalo, C.B.M.; Drew, A.P.; Volk, T.A. The effect of common Dutch white clover (Trifolium repens L.), as a green manure, on biomass production, allometric growth and foliar nitrogen of two willow clones. Biomass Bioenergy 2005, 29, 22–31. [Google Scholar] [CrossRef]
  22. Helios, W. Effect of white clover (Trifolium repens L.) intercropping system on weed infestation of willow (Salix viminalis L.). Prog. Plant Prot./Postępy Ochr. Roślin 2013, 53, 303–309. [Google Scholar]
  23. Smil, V. Global Population and the Nitrogen Cycle. Sci. Am. 1997, 277, 76–81. [Google Scholar] [CrossRef]
  24. Malik, R. Biomass production of short-rotation bioenergy hardwood plantations affected by cover crops. Biomass Bioenergy 2001, 21, 21–33. [Google Scholar] [CrossRef]
  25. Cogliastro, A.; Gagnon, D.; Coderre, D.; Bhéreur, P. Response of seven hardwood tree species to herbicide, rototilling, and legume cover at two southern Quebec plantation sites. Can. J. For. Res. 1990, 20, 1172–1182. [Google Scholar] [CrossRef]
  26. Egner, H. Bestimmung der Kalibedürftigkeit des Bodens auf Chemischen Wege; Bodenkunde und Pflanzenbau: Berlin, Germany, 1940. [Google Scholar]
  27. Egner, H.; Riehm, H.; Domingo, W.R. Utersuchungen über die chemische Bodenanalyse als Grudlage für die Beurteilung des Nährstoff-zunstandes der Boden. II. K. Lantbrhogsk. Annlr. 1960, 20, 199–216. [Google Scholar]
  28. Schachtschabel, P. Das pflanzenverfügbare Magnesium des Boden und seine Bestimmung. Z. Pflanzenernaehr. Dueng. Bodenk. 1954, 67, 9–23. [Google Scholar] [CrossRef]
  29. McCracken, A.; Dawson, W.; Bowden, G. Yield responses of willow (Salix) grown in mixtures in short rotation coppice (SRC). Biomass Bioenergy 2001, 21, 311–319. [Google Scholar] [CrossRef]
  30. Kim, H.-G.; Song, H.-J.; Jeong, M.-J.; Seo, Y.-L.; Yang, J.-K.; Yoo, S.-B.; Choi, M.-S. Bioethanol production by enzymatic saccharification of Salix viminalis var. gigantea biomass. For. Sci. Technol. 2014, 10, 67–72. [Google Scholar] [CrossRef]
  31. Jama-Rodzeńska, A.; Bocianowski, J.; Nowak, W.; Ciszek, D.; Nowosad, K. The influence of communal sewage sludge on the content of macroelements in the stem of selected clones of willow (Salix viminalis L.). Ecol. Eng. 2016, 87, 212–217. [Google Scholar] [CrossRef]
  32. Borkowska, H.; Molas, R. Two extremely different crops, Salix and Sida, as sources of renewable bioenergy. Biomass Bioenergy 2012, 36, 234–240. [Google Scholar] [CrossRef]
  33. Kjeldahl, J. Neue Methode zur Bestimmung des Stickstoffs in organischen Körpern. Fresenius Z. Anal. Chem. 1883, 22, 366–382. [Google Scholar] [CrossRef] [Green Version]
  34. Analysis of Variance for Orthogonal Sets. The awa programme. In Description of Statistical Programmes Elaborated at the Institute of Information Technology; Bartkowiak, A., Ed.; The University of Wrocław: Wrocław, Poland, 1978. [Google Scholar]
  35. Albertsson, J.; Hansson, D.; Bertholdsson, N.-O.; Åhman, I.; Kempenaar, C. Site-related set-back by weeds on the establishment of 12 biomass willow clones. Weed Res. 2014, 54, 398–407. [Google Scholar] [CrossRef]
  36. Welc, M.; Lundkvist, A.; Verwijst, T. Effects of Cutting Phenology (Non-dormant Versus Dormant) on Early Growth Performance of Three Willow Clones Grown Under Different Weed Treatments and Planting Dates. Bioenergy Res. 2017, 10, 1094–1104. [Google Scholar] [CrossRef] [Green Version]
  37. Albertsson, J.; Verwijst, T.; Hansson, D.; Bertholdsson, N.-O.; Åhman, I. Effects of competition between short-rotation willow and weeds on performance of different clones and associated weed flora during the first harvest cycle. Biomass Bioenergy 2014, 70, 364–372. [Google Scholar] [CrossRef]
  38. Edelfeldt, S.; Lundkvist, A.; Forkman, J.; Verwijst, T. Establishment and Early Growth of Willow at Different Levels of Weed Competition and Nitrogen Fertilization. Bioenergy Res. 2016, 9, 763–772. [Google Scholar] [CrossRef]
  39. Adiele, J.G.; Volk, T.A. Developing live cover crop systems for willow (Salix spp.) bioenergy crop. Sky J. Soil Sci. Environ. Manag. 2013, 2, 84–100. [Google Scholar]
  40. McCracken, A.R.; Walsh, L.; Moore, P.J.; Lynch, M.; Cowan, P.; Dawson, M.; Watson, S. Yield of willow (Salix spp.) grown in short rotation coppice mixtures in a long-term trial. Ann. Appl. Biol. 2011, 159, 229–243. [Google Scholar] [CrossRef]
  41. Hangs, R.D.; Stevenson, F.C.; Schoenau, J.J.; Van Rees, K.C.J. Measuring Harvestable Biomass in Short-Rotation Willow Bioenergy Plantations Using Light Attenuation. Bioenergy Res. 2013, 6, 83–90. [Google Scholar] [CrossRef]
  42. Brown, K.R.; van den Driessche, R. Growth and nutrition of hybrid poplars over 3 years after fertilization at planting. Can. J. For. Res. 2002, 32, 226–232. [Google Scholar] [CrossRef]
  43. Perttu, K.L. Environmental and hygienic aspects of willow coppice in Sweden. Biomass Bioenergy 1999, 16, 291–297. [Google Scholar] [CrossRef]
  44. Krzyżaniak, M.; Stolarski, M.; Szczukowski, S. Willow biomass obtained from different soils as a feedstock for energy. Ind. Crops Prod. 2015, 75, 114–121. [Google Scholar] [CrossRef]
  45. Mirck, J.; Schroeder, W. Composition, Stand Structure, and Biomass Estimates of “Willow Rings” on the Canadian Prairies. Bioenergy Res. 2013, 6, 864–876. [Google Scholar] [CrossRef]
  46. Mitchell, C.P. New cultural treatments and yield optimisation. Biomass Bioenergy 1995, 9, 11–34. [Google Scholar] [CrossRef]
  47. Aylott, M.J.; Casella, E.; Tubby, I.; Street, N.R.; Smith, P.; Taylor, G. Yield and spatial supply of bioenergy poplar and willow short-rotation coppice in the UK. New Phytol. 2008, 178, 358–370. [Google Scholar] [CrossRef] [PubMed]
  48. Szczukowski, S.; Stolarski, M.; Tworkowski, J.; Przyborowski, J.; Klasa, A. Productivity of willow coppice plants grown in short rotations. Plant Soil Environ. 2011, 51, 423–430. [Google Scholar] [CrossRef] [Green Version]
  49. Szczukowski, S.; Tworkowski, J.; Klasa, A.; Stolarski, M. Productivity and chemical composition of wood tissues of short rotation willow coppice cultivated on arable land. Plant Soil Environ. 2011, 48, 413–417. [Google Scholar] [CrossRef] [Green Version]
  50. Heller, M.C.; Keoleian, G.A.; Volk, T.A. Life cycle assessment of a willow bioenergy cropping system. Biomass Bioenergy 2003, 25, 147–165. [Google Scholar] [CrossRef]
  51. Adegbidi, H.G.; Volk, T.A.; White, E.H.; Abrahamson, L.P.; Briggs, R.D.; Bickelhaupt, D.H. Biomass and nutrient removal by willow clones in experimental bioenergy plantations in New York State. Biomass Bioenergy 2001, 20, 399–411. [Google Scholar] [CrossRef]
  52. Gołąb-Bogacz, I.; Helios, W.; Kotecki, A.; Kozak, M.; Jama-Rodzeńska, A. Content and Uptake of Ash and Selected Nutrients (K, Ca, S) with Biomass of Miscanthus × giganteus Depending on Nitrogen Fertilization. Agriculture 2021, 11, 76. [Google Scholar] [CrossRef]
  53. Schroeder, W.; Kort, J.; Savoie, P.; Preto, F. Biomass Harvest from Natural Willow Rings around Prairie Wetlands. Bioenergy Res. 2009, 2, 99–105. [Google Scholar] [CrossRef]
  54. Labrecque, M.; Teodorescu, T.I. High biomass yield achieved by Salix clones in SRIC following two 3-year coppice rotations on abandoned farmland in southern Quebec, Canada. Biomass Bioenergy 2003, 25, 135–146. [Google Scholar] [CrossRef]
  55. Sevel, L.; Ingerslev, M.; Nord-Larsen, T.; Jørgensen, U.; Holm, P.E.; Schelde, K.; Raulund-Rasmussen, K. Fertilization of SRC Willow, II: Leaching and Element Balances. Bioenergy Res. 2014, 7, 338–352. [Google Scholar] [CrossRef]
  56. Scholz, V. The growth productivity, and environmental impact of the cultivation of energy crops on sandy soil in Germany. Biomass Bioenergy 2002, 23, 81–92. [Google Scholar] [CrossRef]
Figure 1. Influence of undersowing cultivation and nitrogen fertilization on the dry mass of 1 shoot and plants of willow plants after harvest in December 2017. LSD—the least significant difference. NS—difference is not significant. Different letters indicate significant differences between treatments (Tukey’s multiple range test).
Agronomy 11 00786 g001
Figure 2. Nutrient content in whole willow plants with two fertilizing treatments and undersowing system (average for 2016–2017). LSD—the least significant difference. NS—difference is not significant. Different letters indicate significant differences between treatments (Tukey’s multiple range test).
Agronomy 11 00786 g002
Figure 3. Annual nutrient uptake with two fertilizing treatments and undersowing system. LSD—the least significant difference. NS—difference is not significant. Different letters indicate significant differences between treatments (Tukey’s multiple range test).
Agronomy 11 00786 g003
Table 1. Soil pH and macronutrient abundance over the period 2013–2017.
YearspHContent of Assimilable Forms (mg kg−1)
(1 M KCl)PKMg
20137.4515915436.0
20147.8514016038.9
20157.8016215330.8
20167.6417818636.4
20177.7517019334.8
Mean7.7016216935.4
SD0.15914.25018.892.963
SD—standard deviation.
Table 2. Monthly mean air temperature (°C) over the period 2013–2017.
MonthsYearsStandard Deviation
2013–2017
Mean Temperature
(30-Year Monthly)
20132014201520162017
January−1.60.02.3−1.2−3.42.11−0.4
February0.13.71.53.80.91.670.6
March−0.97.05.44.36.83.223.8
April9.210.68.98.77.90.998.9
May14.613.313.515.314.20.8214.4
June17.716.616.618.618.50.9817.3
July20.521.220.319.519.00.8619.6
August19.017.322.717.919.42.1018.6
September12.915.515.116.413.31.4913.7
October10.810.78.48.512.01.579.1
November5.66.66.23.45.51.244.3
December3.02.35.41.22.91.540.6
Mean9.210.410.59.79.80.549.2
Table 3. Monthly total precipitation (mm) over the period 2013–2017.
MonthsYearsStandard Deviation
2013–2017
Sums of Precipitation
(30-Year Monthly Average)
20132014201520162017
January51.335.846.033.416.913.2634.9
February29.51.215.656.224.220.3027.9
March43.040.139.555.931.18.9838.2
April42.755.215.846.45716.5533.6
May135.9101.421.05.324.157.5554.1
June171.740.273.344.652.554.7467.4
July36.352.955.6114.3112.236.3678.9
August68.275.05.627.143.628.7565.3
September105.872.223.244.765.730.9944.9
October7.859.420.083.871.433.0133.7
November25.815.552.536.328.413.8036.6
December13.017.524.036.129.69.2336.3
Sum731.0566.4392.1584.1556.6120.29551.8
Table 4. Dry weight and number of weeds.
YearsCultivation WillowNumber of Weeds
(pcs m−2)
Dry Weight of Weeds
(g m−2)
A21 e ± 4.4384 ab ± 270.8
2013B13 abc ± 1.223 a ± 22.6
C19 de ± 1.6698 b ± 391.2
A18 cde ± 4.0244 a ± 77.2
2014B11 a ± 0.6201 a ± 71.6
C17 bcde ± 2.4325 a ± 133.4
A16 abcde ± 2.8255 a ± 41.2
2015B12 ab ± 0.430 a ± 7.8
C13 abc ± 1.8279 a ± 94.8
A15 abcd ± 0.8223 a ± 7.0
2016B12 ab ± 0.6168 a ± 22.6
C15 abcd ± 1.0216 a ± 18.6
A13 abc ± 0.8207 a ± 197.8
2017B12 ab ± 0.6252 a ± 74.0
C16 abcde ± 1.6180 a ± 91.0
LSD (α = 0.05)2.7189.4
Mean for Cultivation System and Years
A17 b ± 3.9262 b ± 152.1
B12 a ± 0.9135 a ± 104.2
C16 b ± 2.6339 b ± 257.3
LSD (α = 0.05)1.284.7
2013 18 b ± 4.3368 b ± 380.7
2014 15 ab ± 4.1257 ab ± 103.7
2015 14 a ± 2.5188 a ± 129.1
2016 14 a ± 1.7202 ab ± 30.0
2017 14 a ± 2.0213 ab ± 124.0
LSD (α = 0.05)1.6109.3
A—willow monoculture without nitrogen fertilization; B—undersowing cultivation with white clover; C—willow monoculture with nitrogen fertilization. ± figures in tables represent the standard deviation. LSD—the least significant difference. Different letters indicate significant differences between treatments (Tukey’s multiple range test).
Table 5. Plant density in undersowing and monoculture cultivation.
YearsCultivation SystemNumber of Plants (pcs m−2)Plant Mortality *Number of Shoots
ab(pcs m−2)(pcs plant−1)
A1.52 a ± 0.0778.982.93 a ± 0.7524.98 ab ± 0.7203.27 abc ± 0.342
2013B1.48 ab ± 0.07711.383.31 a ± 0.7353.22 bcdef ± 0.5522.19 bc ± 0.421
C1.44 ± 0.16113.923.22 a ± 2.1694.67 abc ± 0.8893.23 abc ± 0.284
A1.50 a ± 0.0651.270.56 a ± 1.1254.88 abc ± 0.7453.25 abc ± 0.473
2014B1.46 ab ± 0.0461.270.56 a ± 1.1253.03 cdef ± 0.6602.08 bc ± 0.454
C1.44 ab ± 0.1610.00.00 a ± 0.0004.55 abcd ± 0.7573.16 abc ± 0.181
A1.36 ab ± 0.1269.392.16 a ± 2.5055.16 a ± 1.4153.86 a ± 1.298
2015B1.29 ab ± 0.14611.72.91 a ± 2.0672.70 def ± 0.8902.08 bc ± 0.600
C1.38 ab ± 0.0523.740.97 a ± 1.9354.26 abcde ± 0.1903.10 abc ± 0.223
A1.36 ab ± 0.1260.000.00 a ± 0.0004.97 ab ± 0.8323.65 a ± 0.417
2016B1.25 ab ± 0.1813.361.29 a ± 1.4972.38 ef ± 0.4711.91 c ± 0.296
C1.35 ab ± 0.0451.590.63 a ± 1.2604.11 abcdef ± 0.5383.05 abc ± 0.449
A1.29 ab ± 0.2215.001.12 a ± 2.2355.12 a ± 0.7344.06 a ± 0.987
2017B1.13 b ± 0.33611.652.36 a ± 2.8482.36 f ± 0.7622.15 bc ± 0.490
C1.27 ab ± 0.0776.001.73 a ± 2.0014.42 abcd ± 0.2623.48 ab ± 0.159
LSD (α = 0.05)NS-NSNSNS
Mean for Cultivation System and Years
A1.40 a ± 0.1514.931.35 a ± 1.8045.02 a ± 0.8313.62 a ± 0.781
B1.32 a ± 0.2157.862.09 a ± 1.9212.74 c ± 0.7032.08 c ± 0.423
C1.37 a ± 0.185.051.31 a ± 1.8734.40 b ± 05663.20 b ± 0.293
LSD (α = 0.05)NS-NS0.4540.329
2013 1.48 a ± 0.10711.433.15 b ± 1.2714.29 a ± 1.03772.89 a ± 0.612
2014 1.47 a ± 0.980.840.37 a ± 0.8764.15 a ± 1.0672.83 a ± 0.661
2015 1.34 ab ± 01118.262.01 ab ± 2.1434.04 a ± 1.3793.01 a ± 1.073
2016 1.32 ab ± 0.1281.650.64 a ± 1.1613.82 a ± 1.2612.87 a ± 0.834
2017 1.23 b ± 0.2277.551.74 ab ± 2.2243.97 a ± 1.3523.23 a ± 1.018
LSD (α = 0.05)0.120-1.316NSNS
A—willow monoculture without nitrogen fertilization; B—undersowing cultivation with white clover; C—willow monoculture with nitrogen fertilization. ± figures in tables represent the standard deviation. LSD—least significant difference. NS—difference is not significant. Different letters indicate significant differences between treatments (Tukey’s multiple range test). * a—% of dead plants, b—plant mortality variations between treatments were compared using data from square root transformations. The conversion was performed to meet the assumptions of the standard normal distribution.
Table 6. Influence of undersowing cultivation and nitrogen fertilization on morphological traits of willow plant.
YearsCultivation SystemHeight of Plants at the End of Vegetation (cm)Yearly Increase in the Height of Plants (cm)Diameter of Shoots After the End of Vegetation (mm)Yearly Increase in Shoot Diameter (mm)
A80 f ± 3.580 a ± 3.510.0 e ± 0.2210.0 a ± 0.22
2013B75 f ± 10.375 a ± 10.39.8 e ± 0.149.8 a ± 0.14
C83 f ± 6.883 a ± 6.810.2 e ± 0.1410.2 a ± 0.14
A212 e ± 42.6132 a ± 45.717.5 de ± 2.387.5 a ± 2.25
2014B215 e ± 24.2141 a ± 31.417.4 de ± 5.297.6 a ± 5.24
C237 e ± 20.9154 a ± 16.820.0 cde ± 1.939.7 a ± 2.05
A287 de ± 39.976 a ± 22.526.2 bcd ± 2.878.7 a ± 0.83
2015B300 de ± 50.885 a ± 37.824.3 bcd ± 3.736.9 a ± 2.27
C332 cd ± 12.495 a ± 13.026.9 bcd ± 3.897.0 a ± 2.26
A365 bcd ± 56.077 a ± 78.830.0 abc ± 4.043.8 a ± 2.39
2016B415 bc ± 80.6115 a ± 35.133.0 ab ± 6.898.7 a ± 6.49
C440 ab ± 21.6108 a ± 14.034.8 ab ± 7.347.8 a ± 10.41
A510 a ± 30.7145 a ± 57.840.4 a ± 6.2010.4 a ± 6.67
2017B522 a ± 21.8107 a ± 82.642.0 a ± 10.259.1 a ± 6.02
C526 a ± 20.086 a ± 36.942.0 a ± 5.137.1 a ± 2.95
LSD (α = 0.05)NSNSNSNS
Mean for Cultivation System and Years
A291 b ± 152.1102 a ± 53.724.8 a ± 11.28.1 a ± 3.83
B305 ab ± 164.1104 a ± 47.325.3 a ± 12.898.4 a ± 4.32
C324 a ± 159.7105 a ± 31.826.8 a ± 12.068.4 a ± 4.67
LSD (α = 0.05)22.9NSNSNS
2013 79 e ± 7.779 b ± 7.6810.0 e ± 0.2310.0 a ± 0.23
2014 221 d ± 30.2142 a ± 31.618.3 d ± 3.438.3 a ± 3.35
2015 307 c ± 39.685 b ± 25.425.8 c ± 3.407.5 a ± 1.94
2016 407 b ± 61.9100 ab ± 48.732.6 b ± 6.036.8 a ± 6.90
2017 519 a ± 23.4113 ab ± 61.641.5 a ± 6.858.9 a ± 5.13
LSD (α = 0.05)29.634.53.98NS
LSD—least significant difference. NS—difference is not significant. Different letters indicate significant differences between treatments (Tukey’s multiple range test). ± figures in tables represent the standard deviation.
Table 7. Correlation coefficients for the analyzed traits in 2017.
Cultivation SystemMeanStandard DeviationCorrelation Coefficients *
Dry Mass of the Main ShootDiameter of ShootsHeight of Plants
Dry mass of the main shoot 1187 g6051
Diameter of shoots39.5 mm8.990.901
Height of plants 510 cm1000.740.751
* All correlation coefficients are significant.
Table 8. Correlation coefficients for the analyzed traits (for the cultivation system) in 2017.
Cultivation SystemMeanStandard DeviationCorrelation Coefficients
Dry Mass of the Main ShootDiameter of ShootsHeight of Plants
Willow monoculture without nitrogen fertilization
Dry mass of the main shoot 908 g5451
Diameter of shoots34.3 mm6.70.981
Height of plants 452 cm72.70.810.821
Undersowing cultivation with white clover
Dry mass of the main shoot 1385 g7291
Diameter of shoots 41.8 mm9.60.931
Height of plants 556 cm123.70.710.691
Monoculture with nitrogen fertilization
Dry mass of the main shoot 1269 g4681
Diameter of shoots 42.6 mm8.890.811
Height of plants 552 cm76.3NS *0.711
* NS—correlation coefficient is not significant.
Table 9. Comparison of yielding in monoculture and willow undersowing cultivation 5 years after planting.
Cultivation SystemDry Mass Yield (Mg ha−1)Fresh Mass Yield (Mg ha−1)
WoodPhloemTotal
Willow monoculture without nitrogen fertilization36.8 a ± 4.029.4 a ± 1.0646.2 a ± 5.0891.2 a ± 7.12
Undersowing cultivation with white clover29.0 a ± 4.197.3 a ± 1.0436.3 a ± 5.2371.1 b ± 1.39
Monoculture with nitrogen fertilization35.7 a ± 3.549.0 a ± 0.8844.7 a ± 4.4290.5 a ± 6.33
LSD (α = 0.05)NSNSNS9.02
LSD—least significant difference. NS—difference is not significant. Different letters indicate significant differences between treatments (Tukey’s multiple range test). ± figures in tables represent the standard deviation.
Table 10. Nutrient content in willow with two fertilizing treatments and undersowing system in 2017.
Cultivation SystemCrude AshNPKCa
g kg−1
Willow Wood
Willow monoculture without nitrogen fertilization7.23.90.70.81.4
Undersowing cultivation with white clover7.35.10.91.01.5
Monoculture with nitrogen fertilization10.23.80.70.91.9
Willow Phloem
Willow monoculture without nitrogen fertilization43.119.02.33.49.3
Undersowing cultivation with white clover47.520.21.73.68.4
Monoculture with nitrogen fertilization47.920.02.13.79.7
Publisher’s Note: MDPI stays neutral with regard to jurisdictional claims in published maps and institutional affiliations.

