
The Contribution of Groundwater to the Salinization of Reservoir-Based Irrigation Systems

 , ,
, ,
Abstract
:1. Introduction
1.1. General
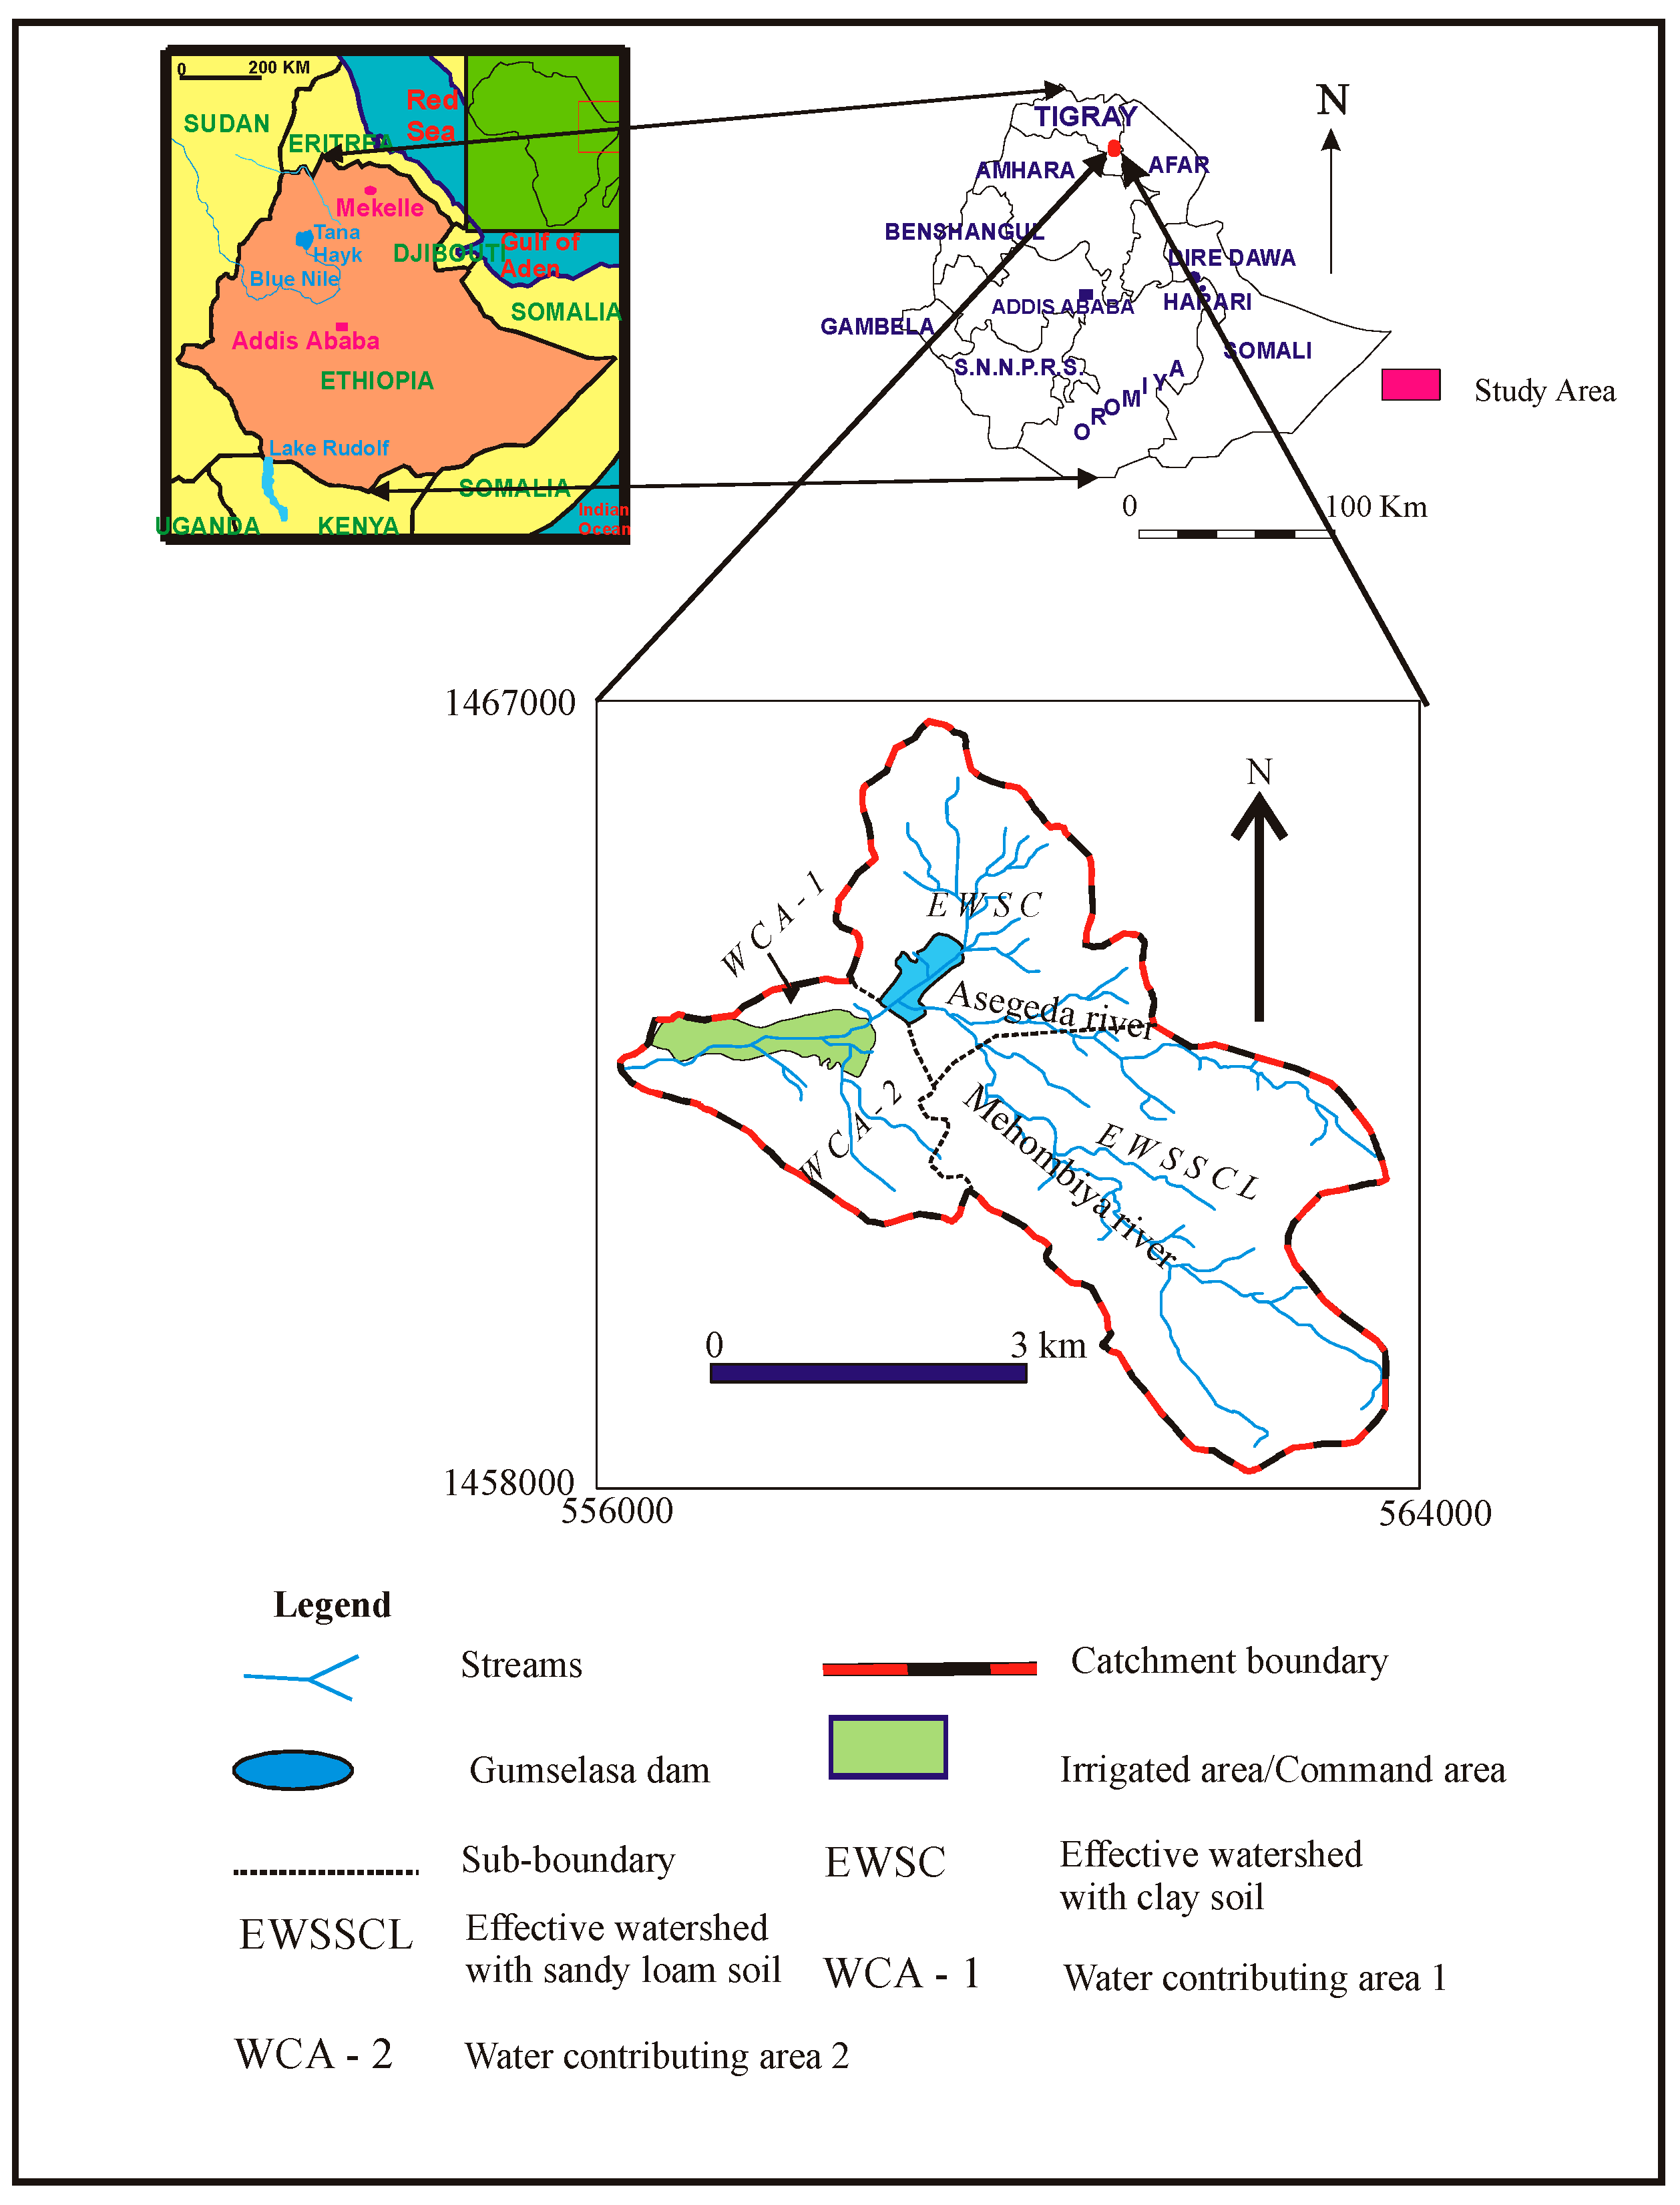
1.2. The Study Area
1.2.1. Location
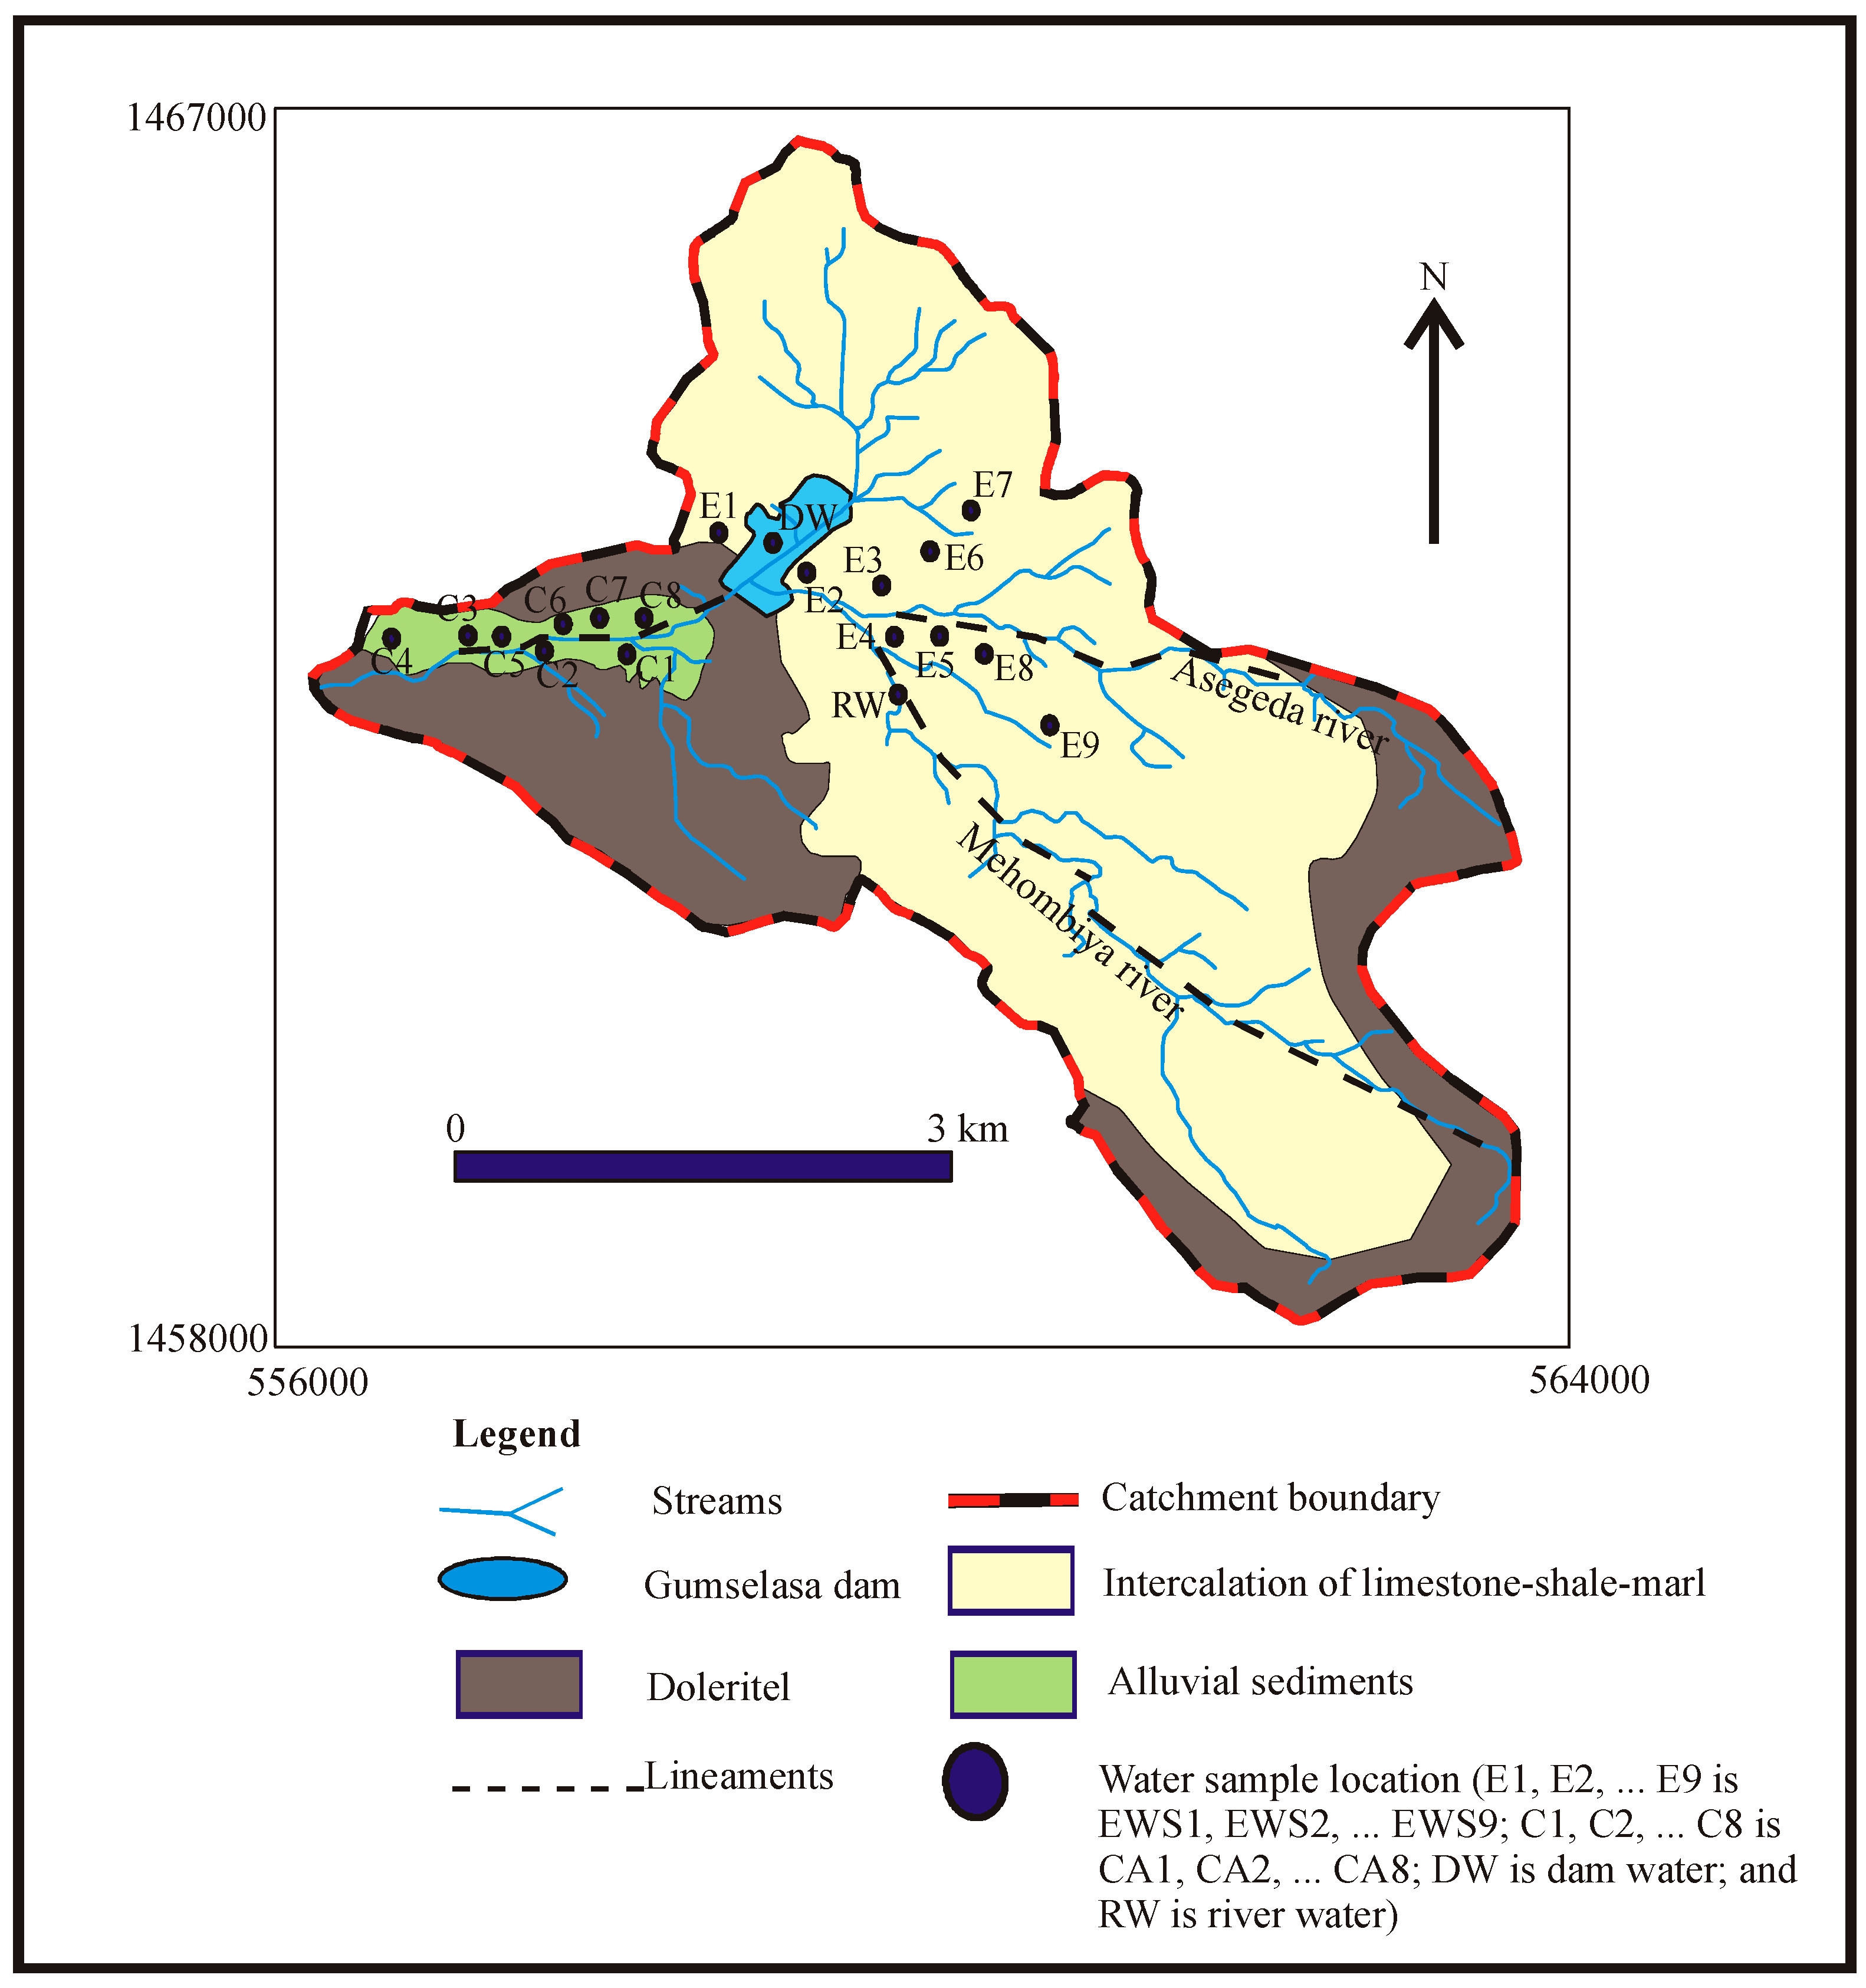
1.2.2. Geology
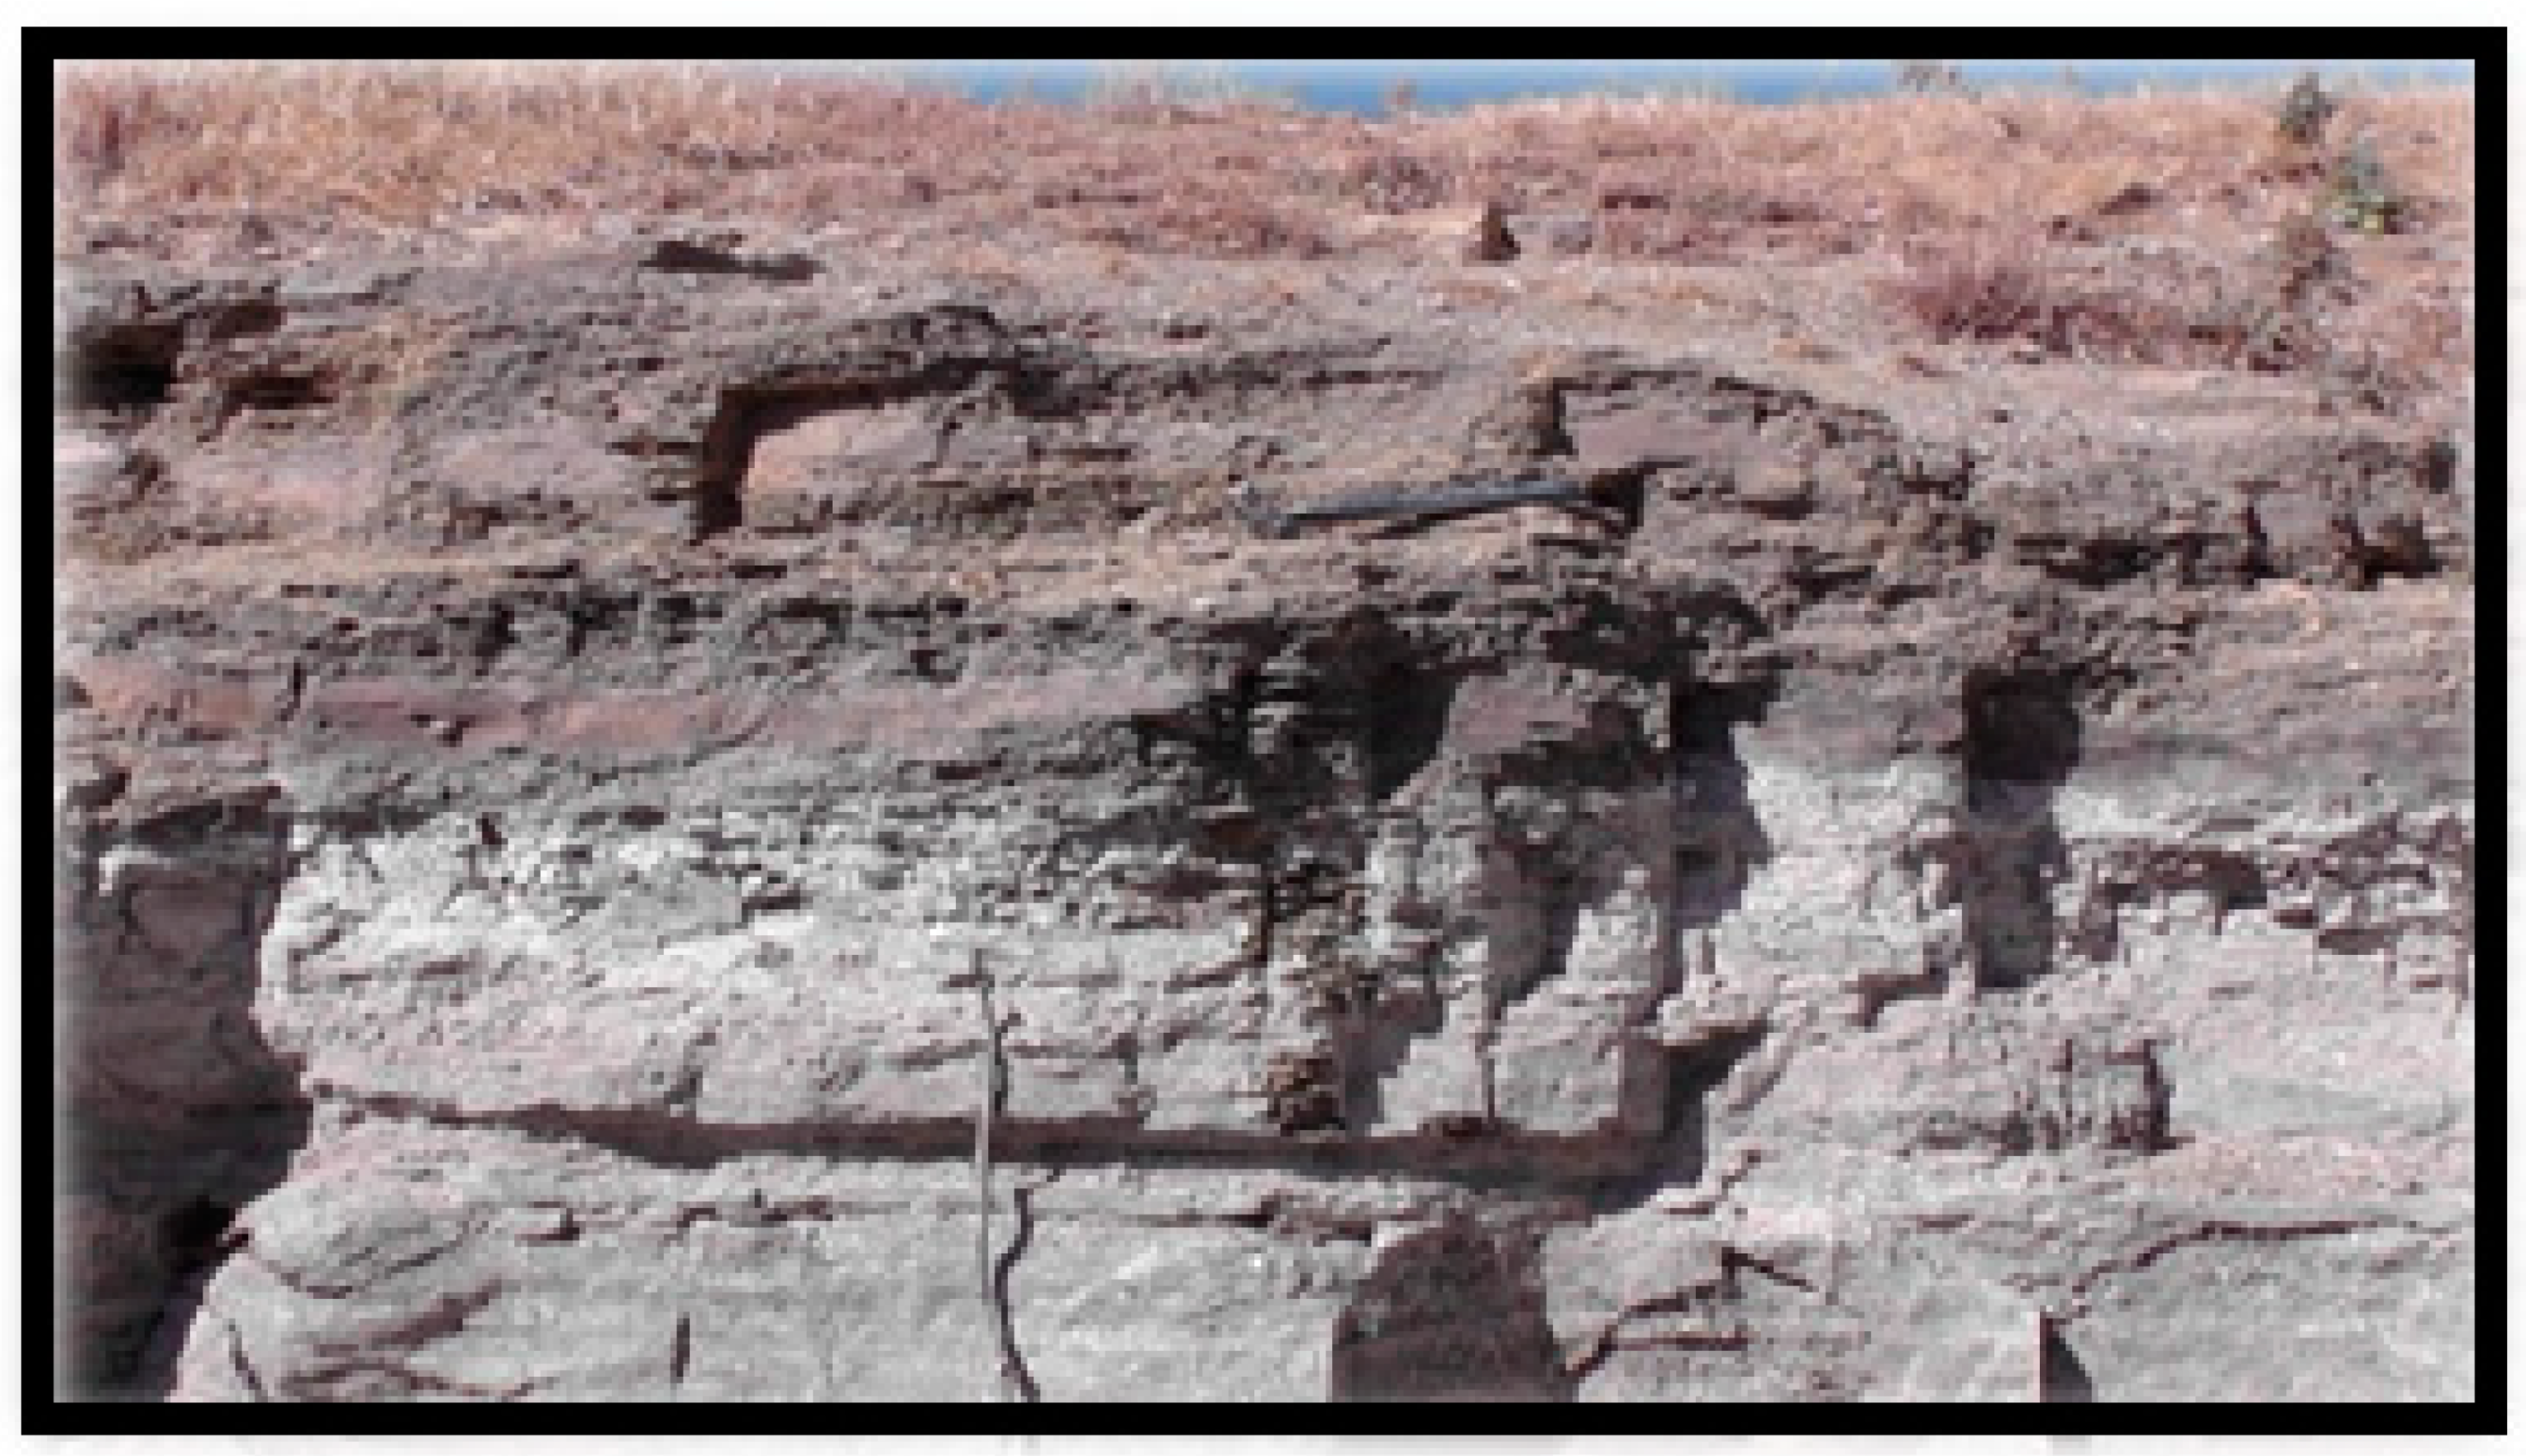
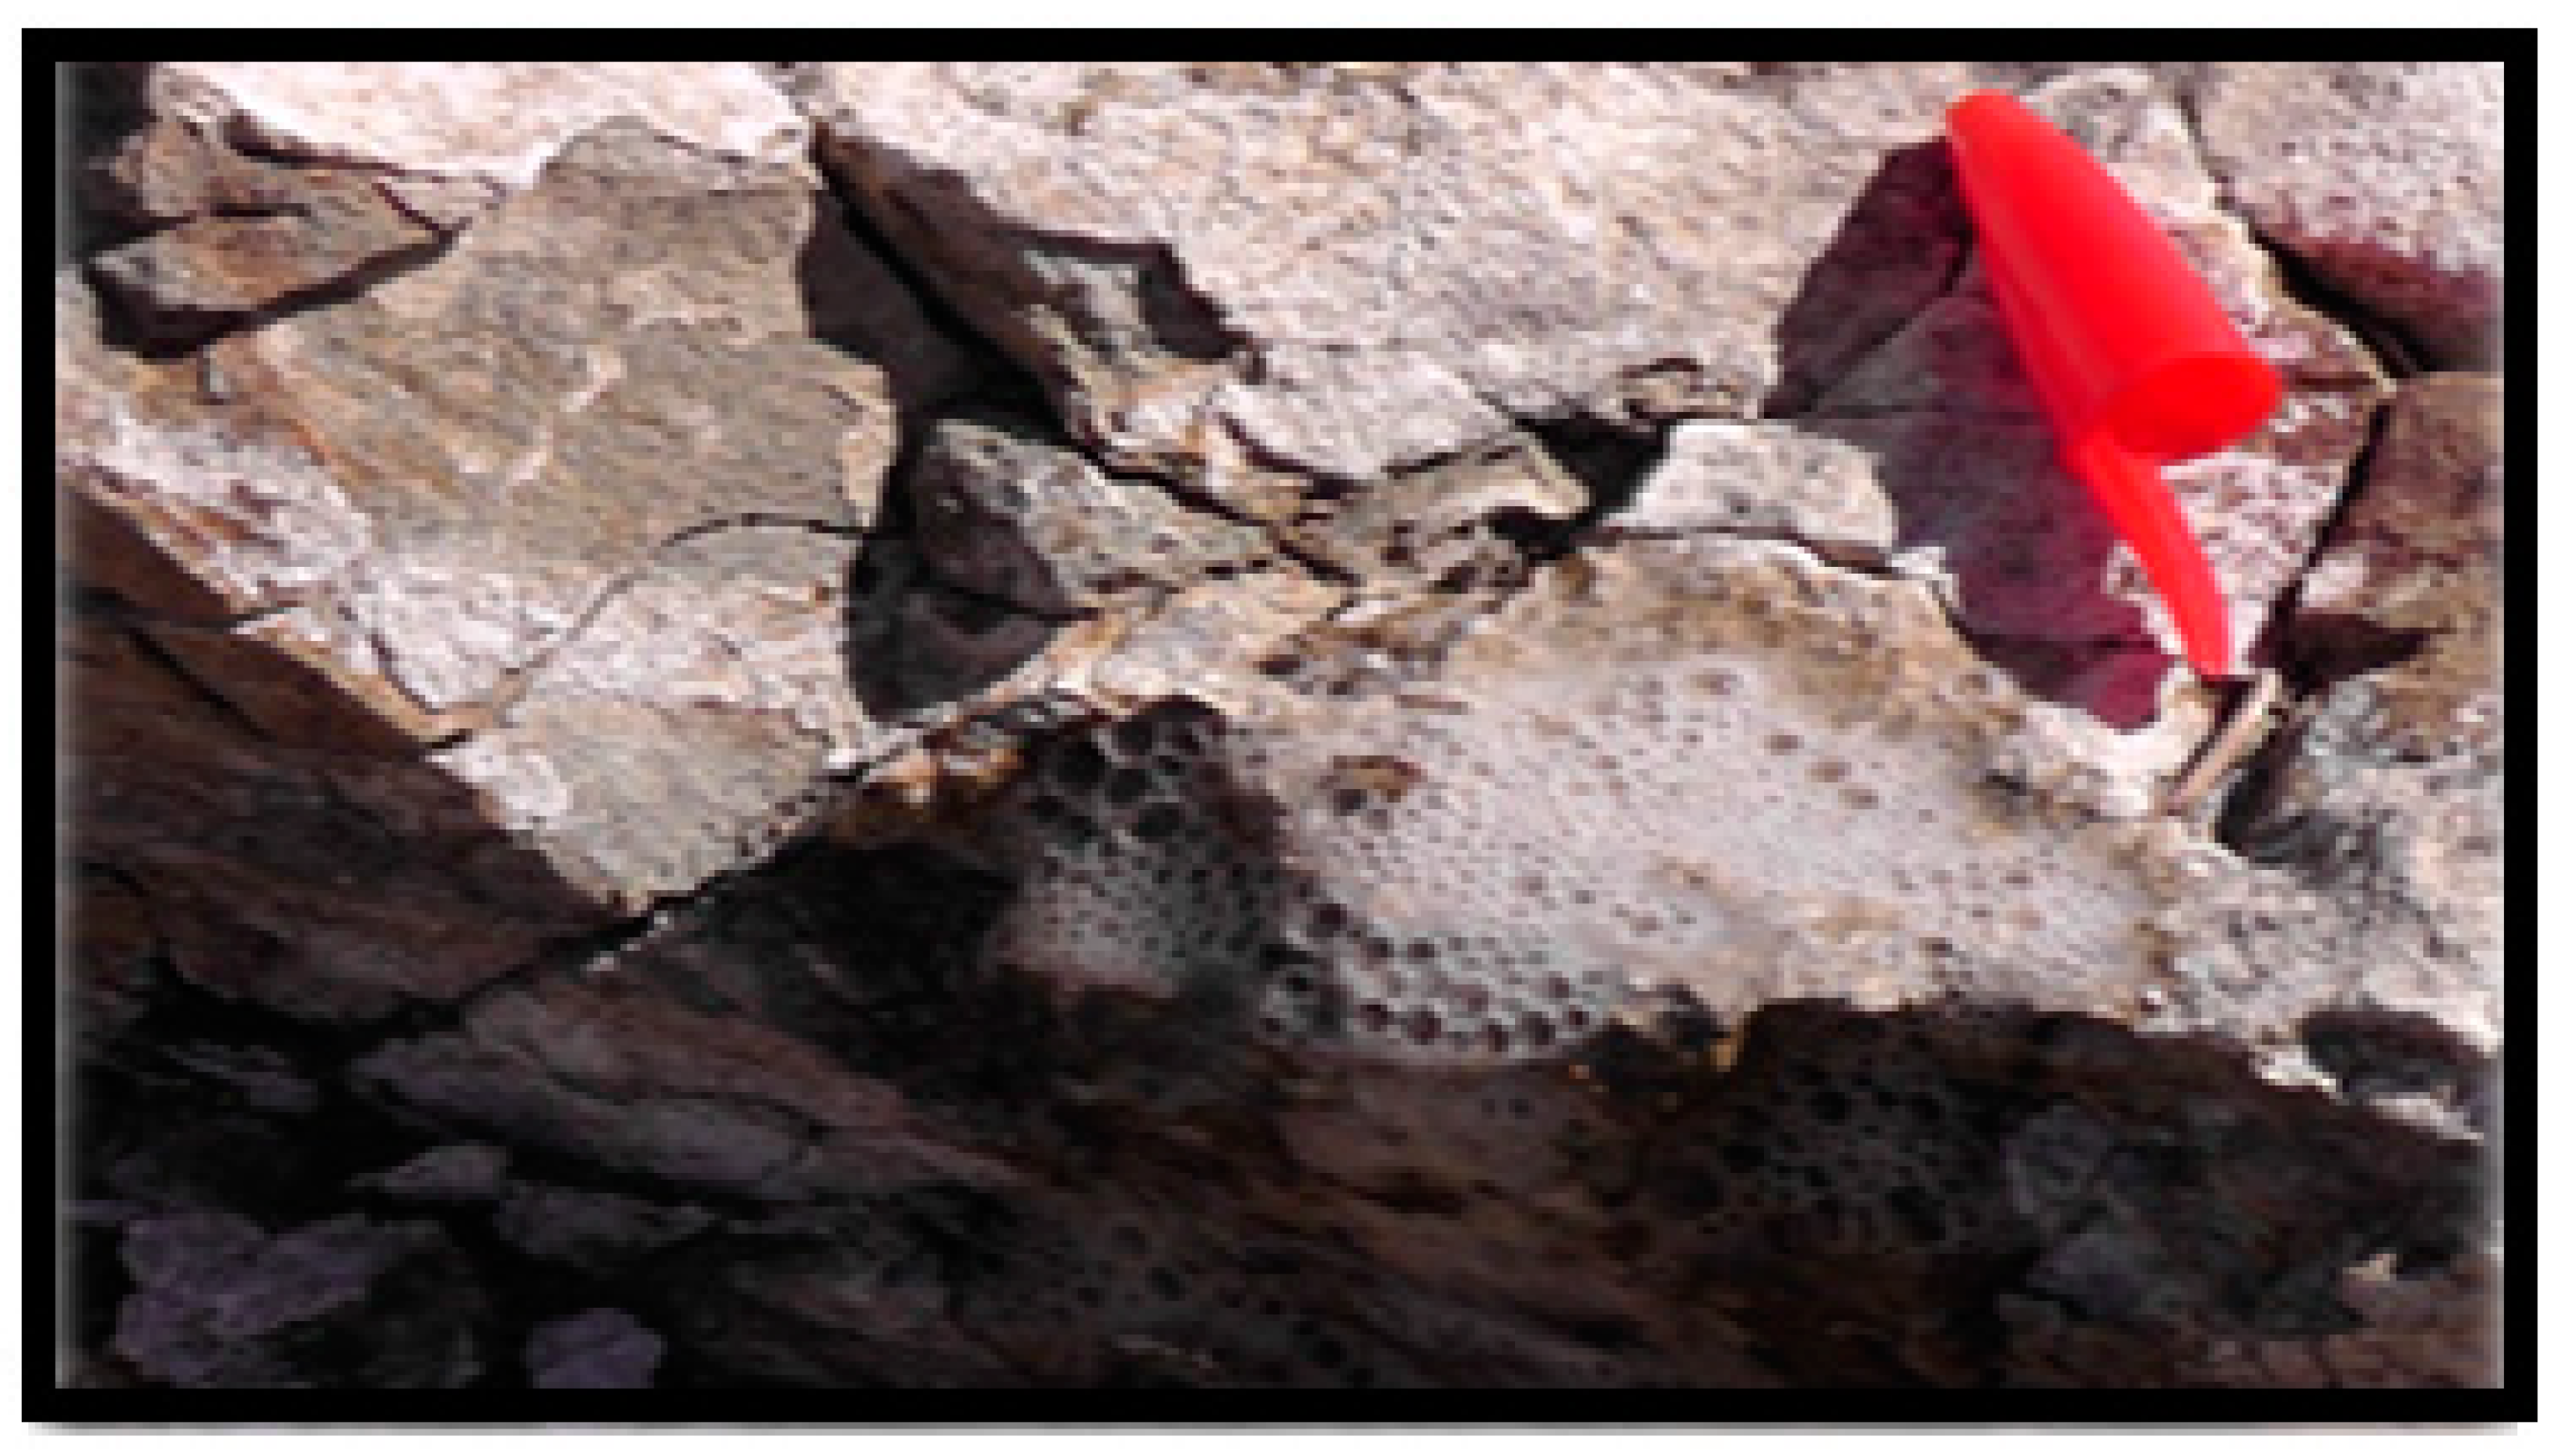
Limestone–Shale–Marl Intercalation
Dolerites Dykes
Quaternary Deposits
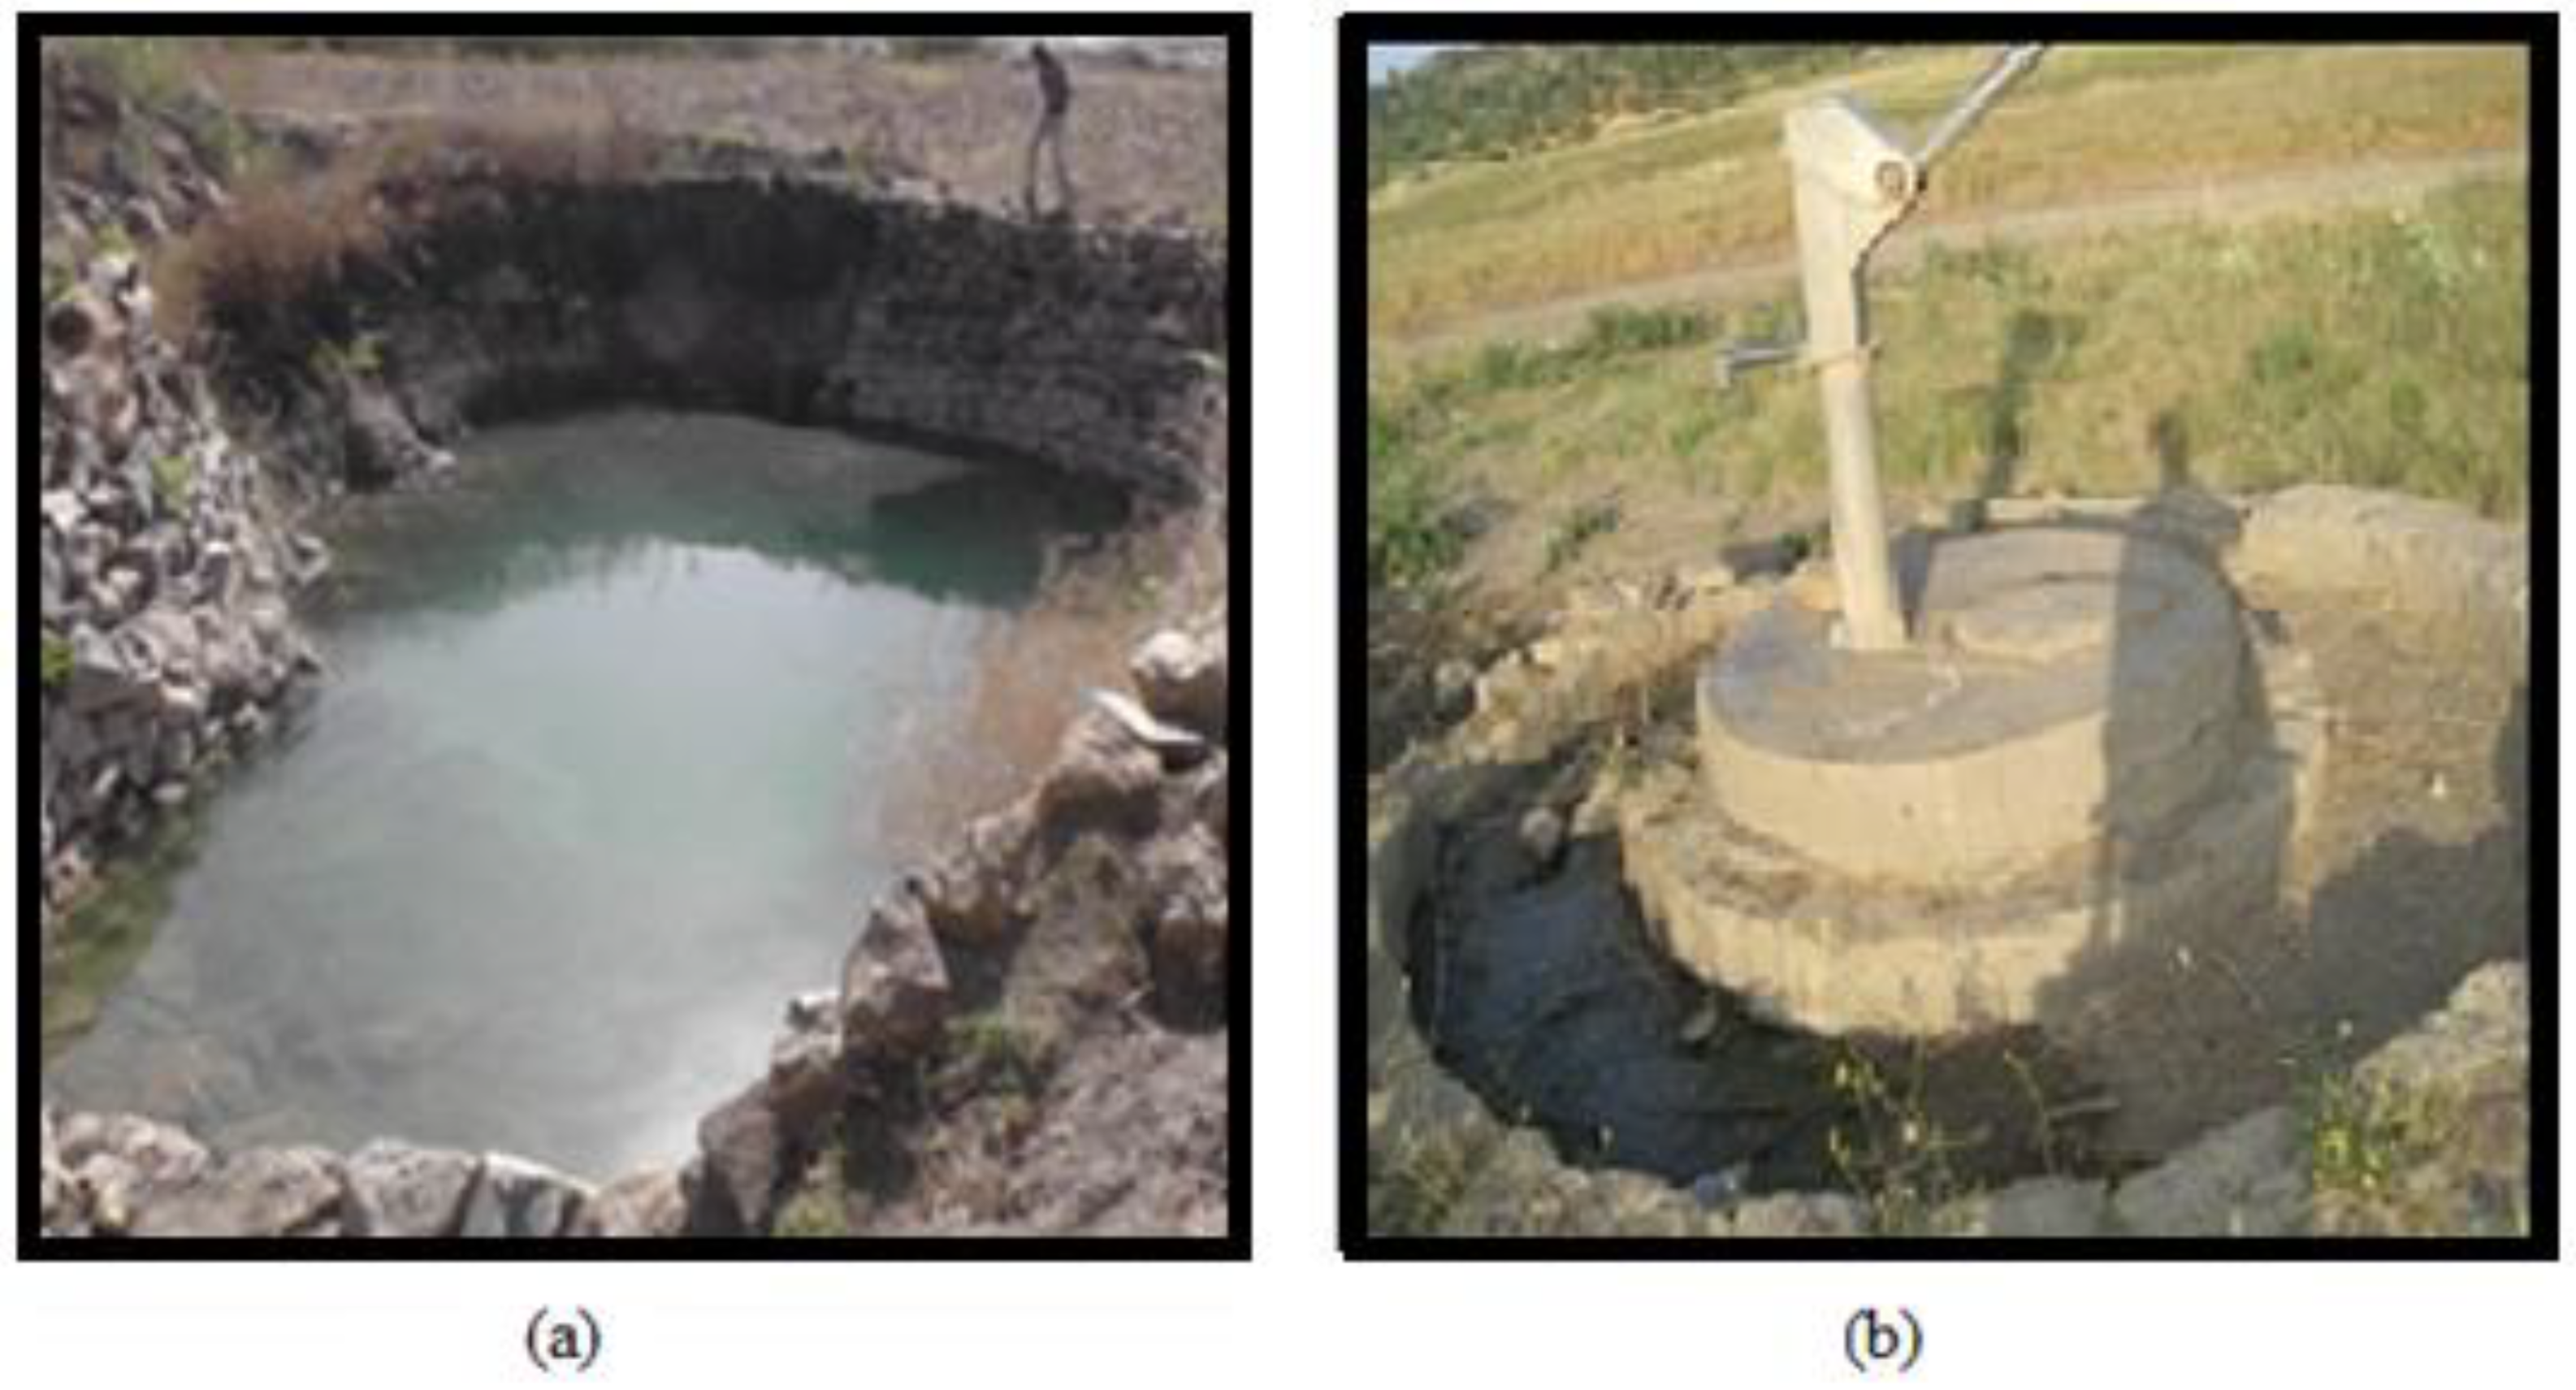
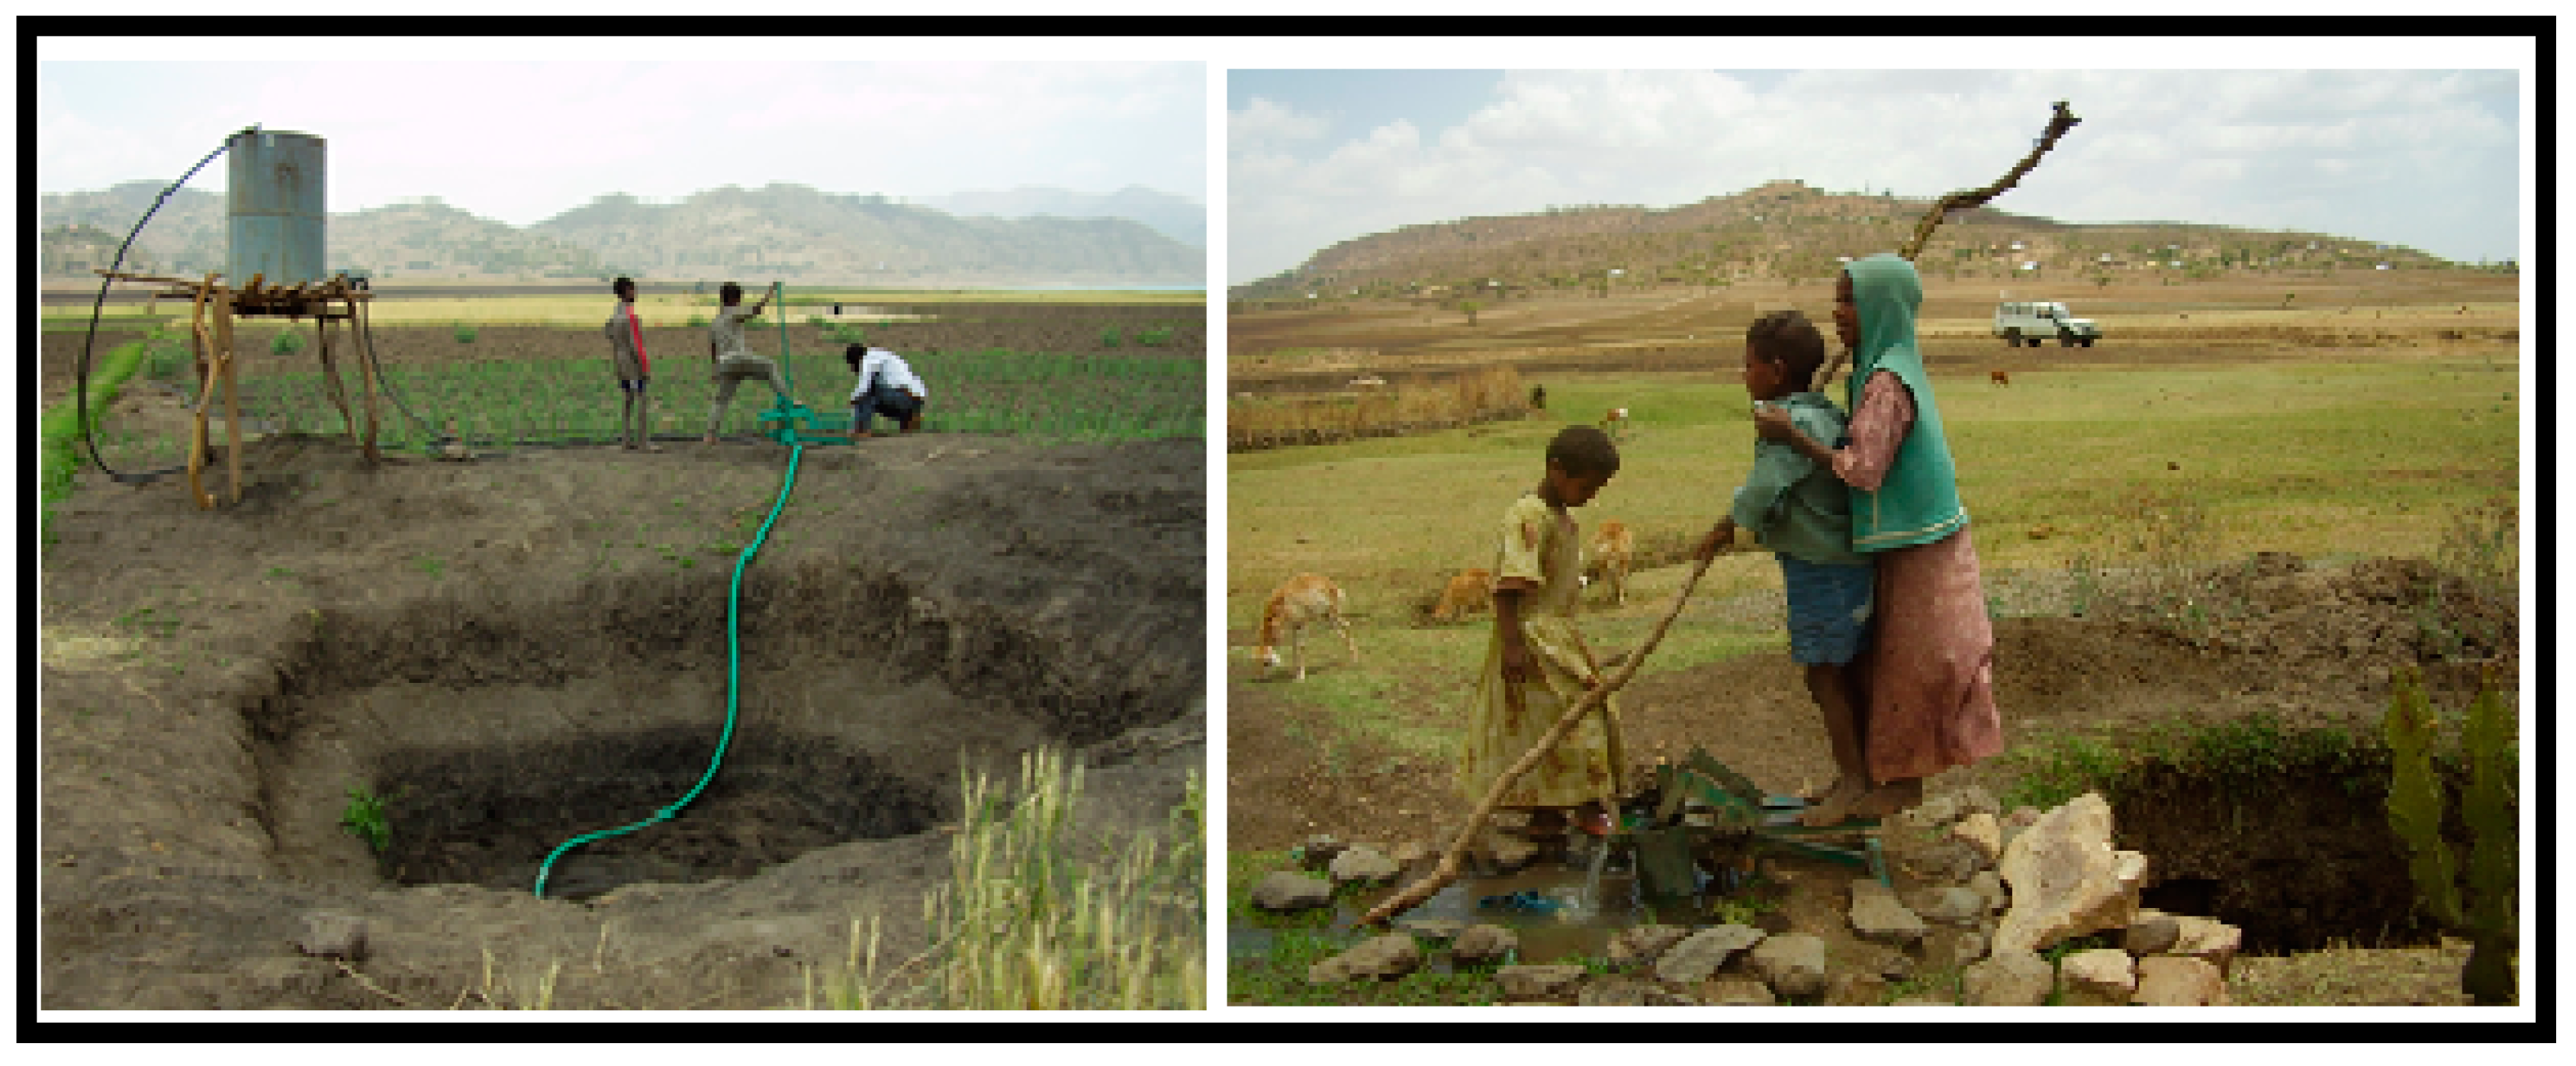
1.2.3. Water Uses
2. Methods
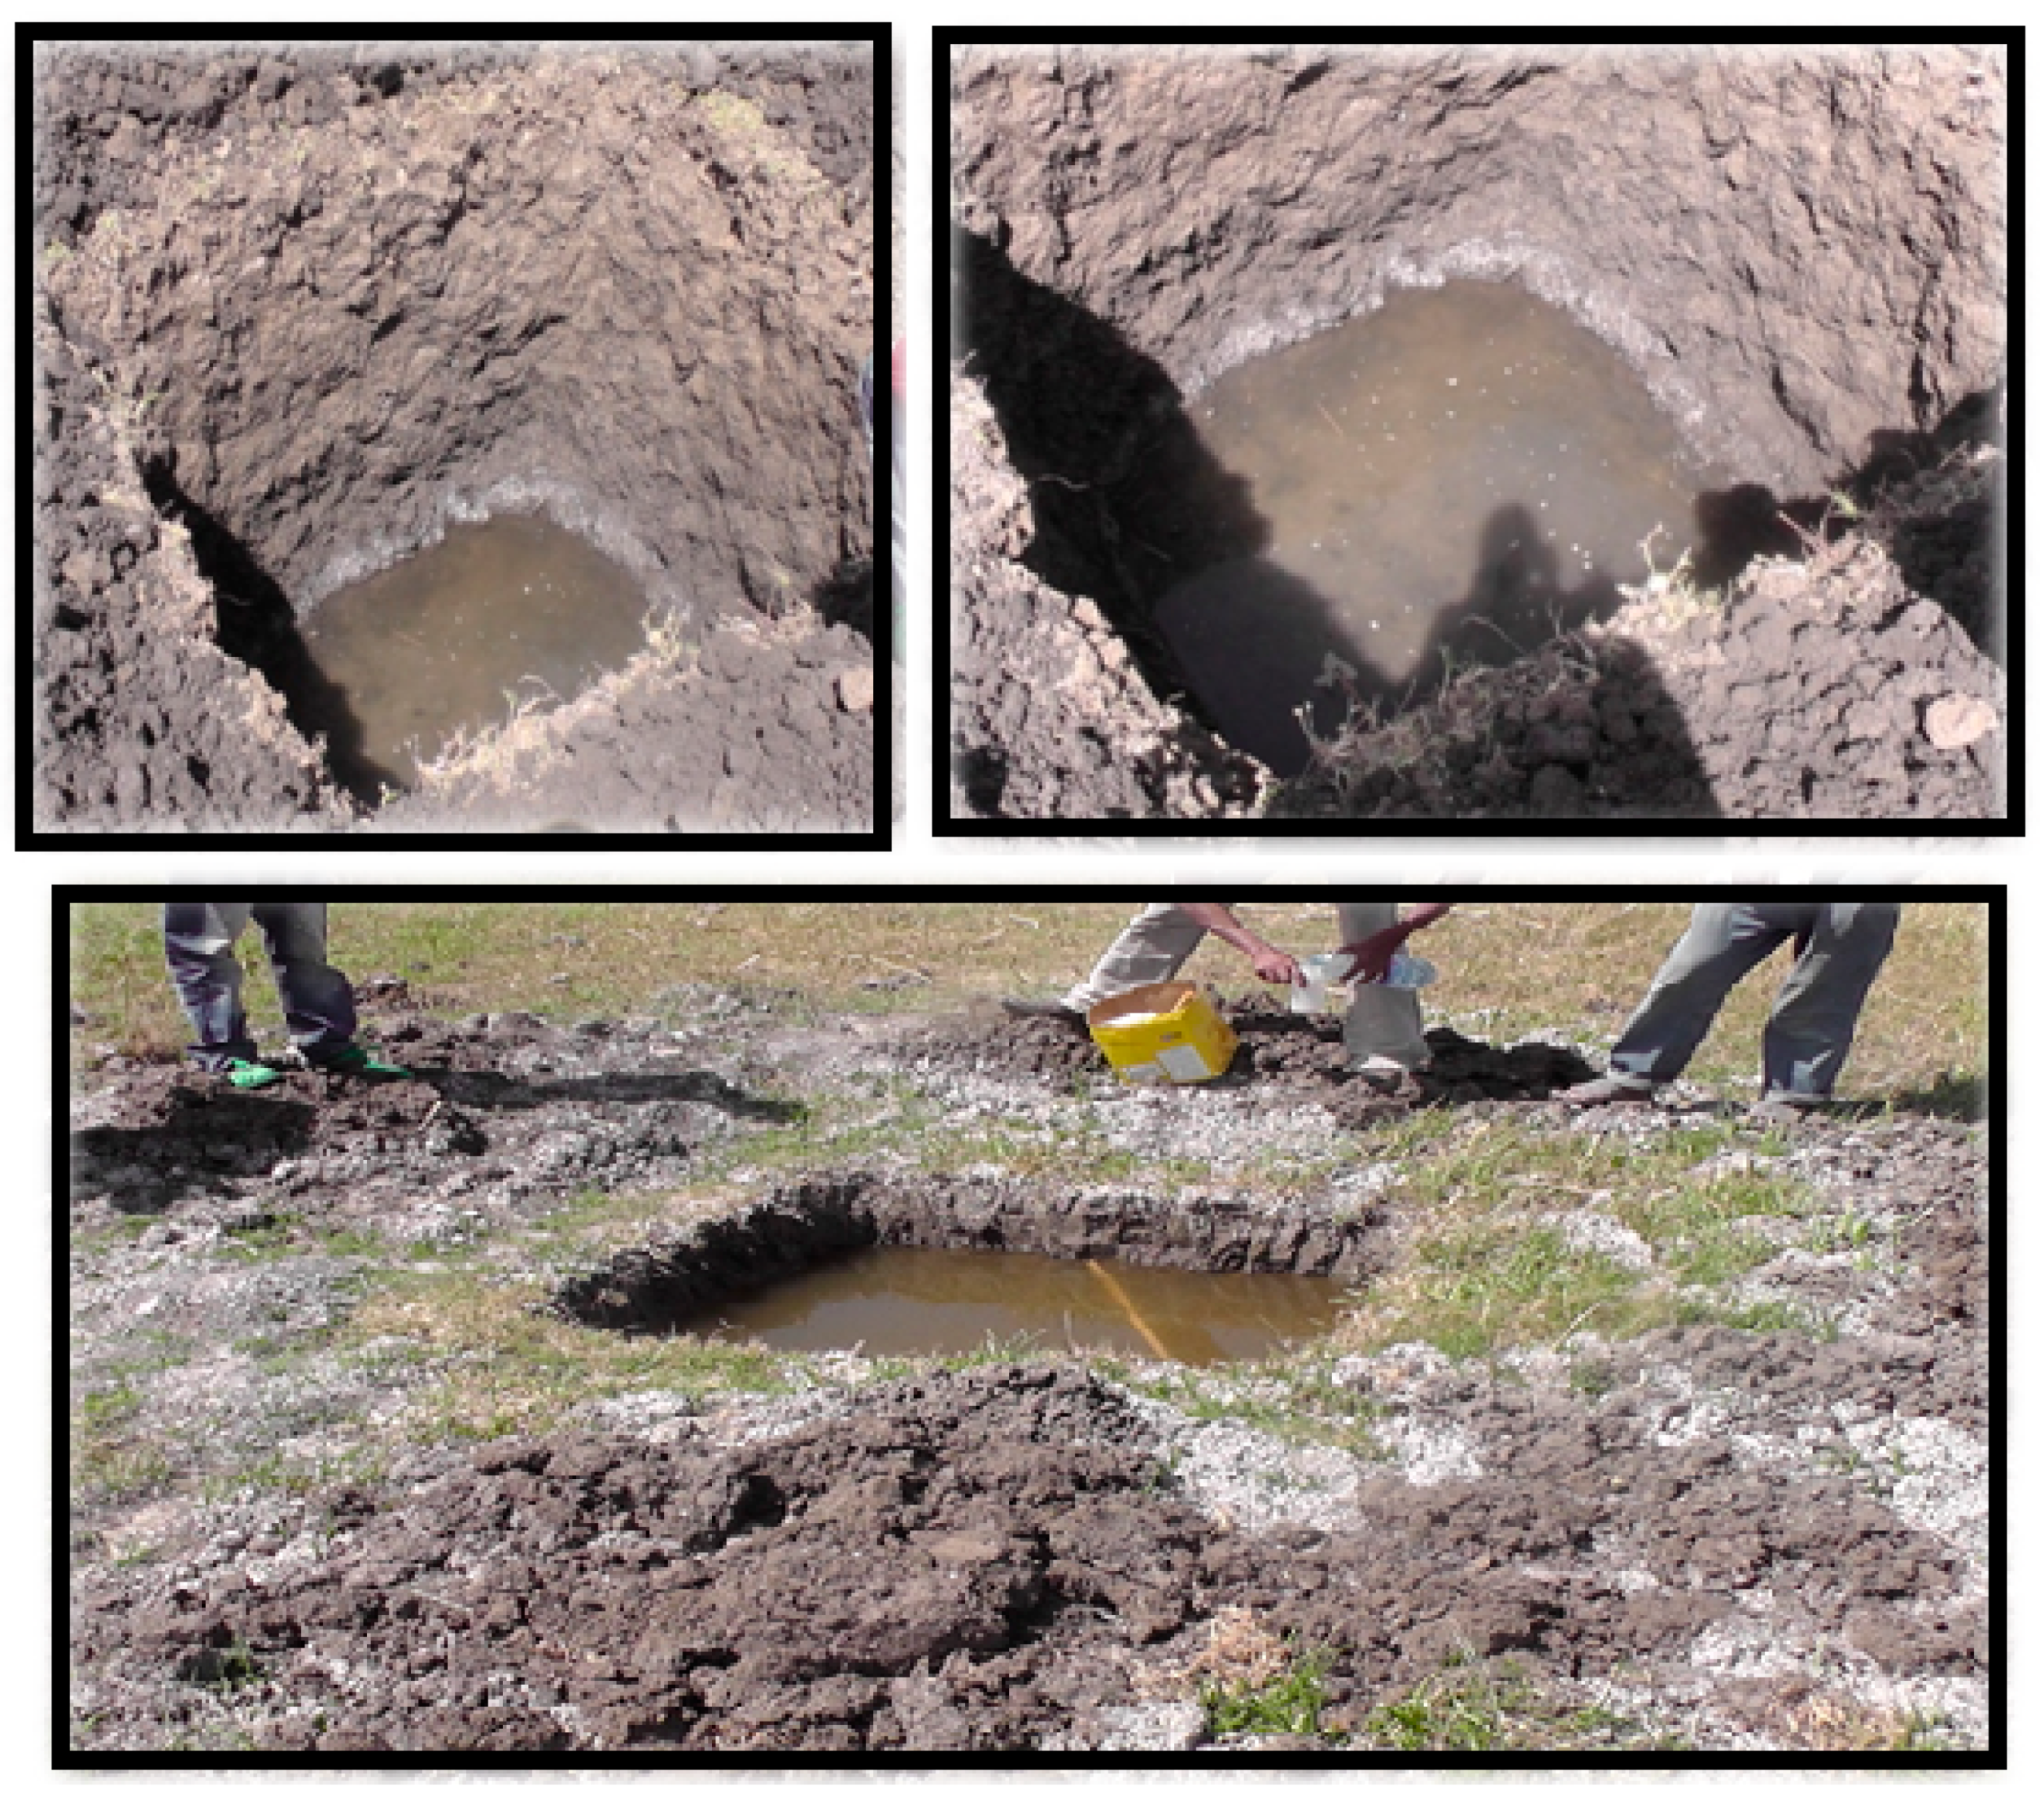
2.1. Data Collection
2.2. Data Analysis
3. Results
3.1. Water Balance
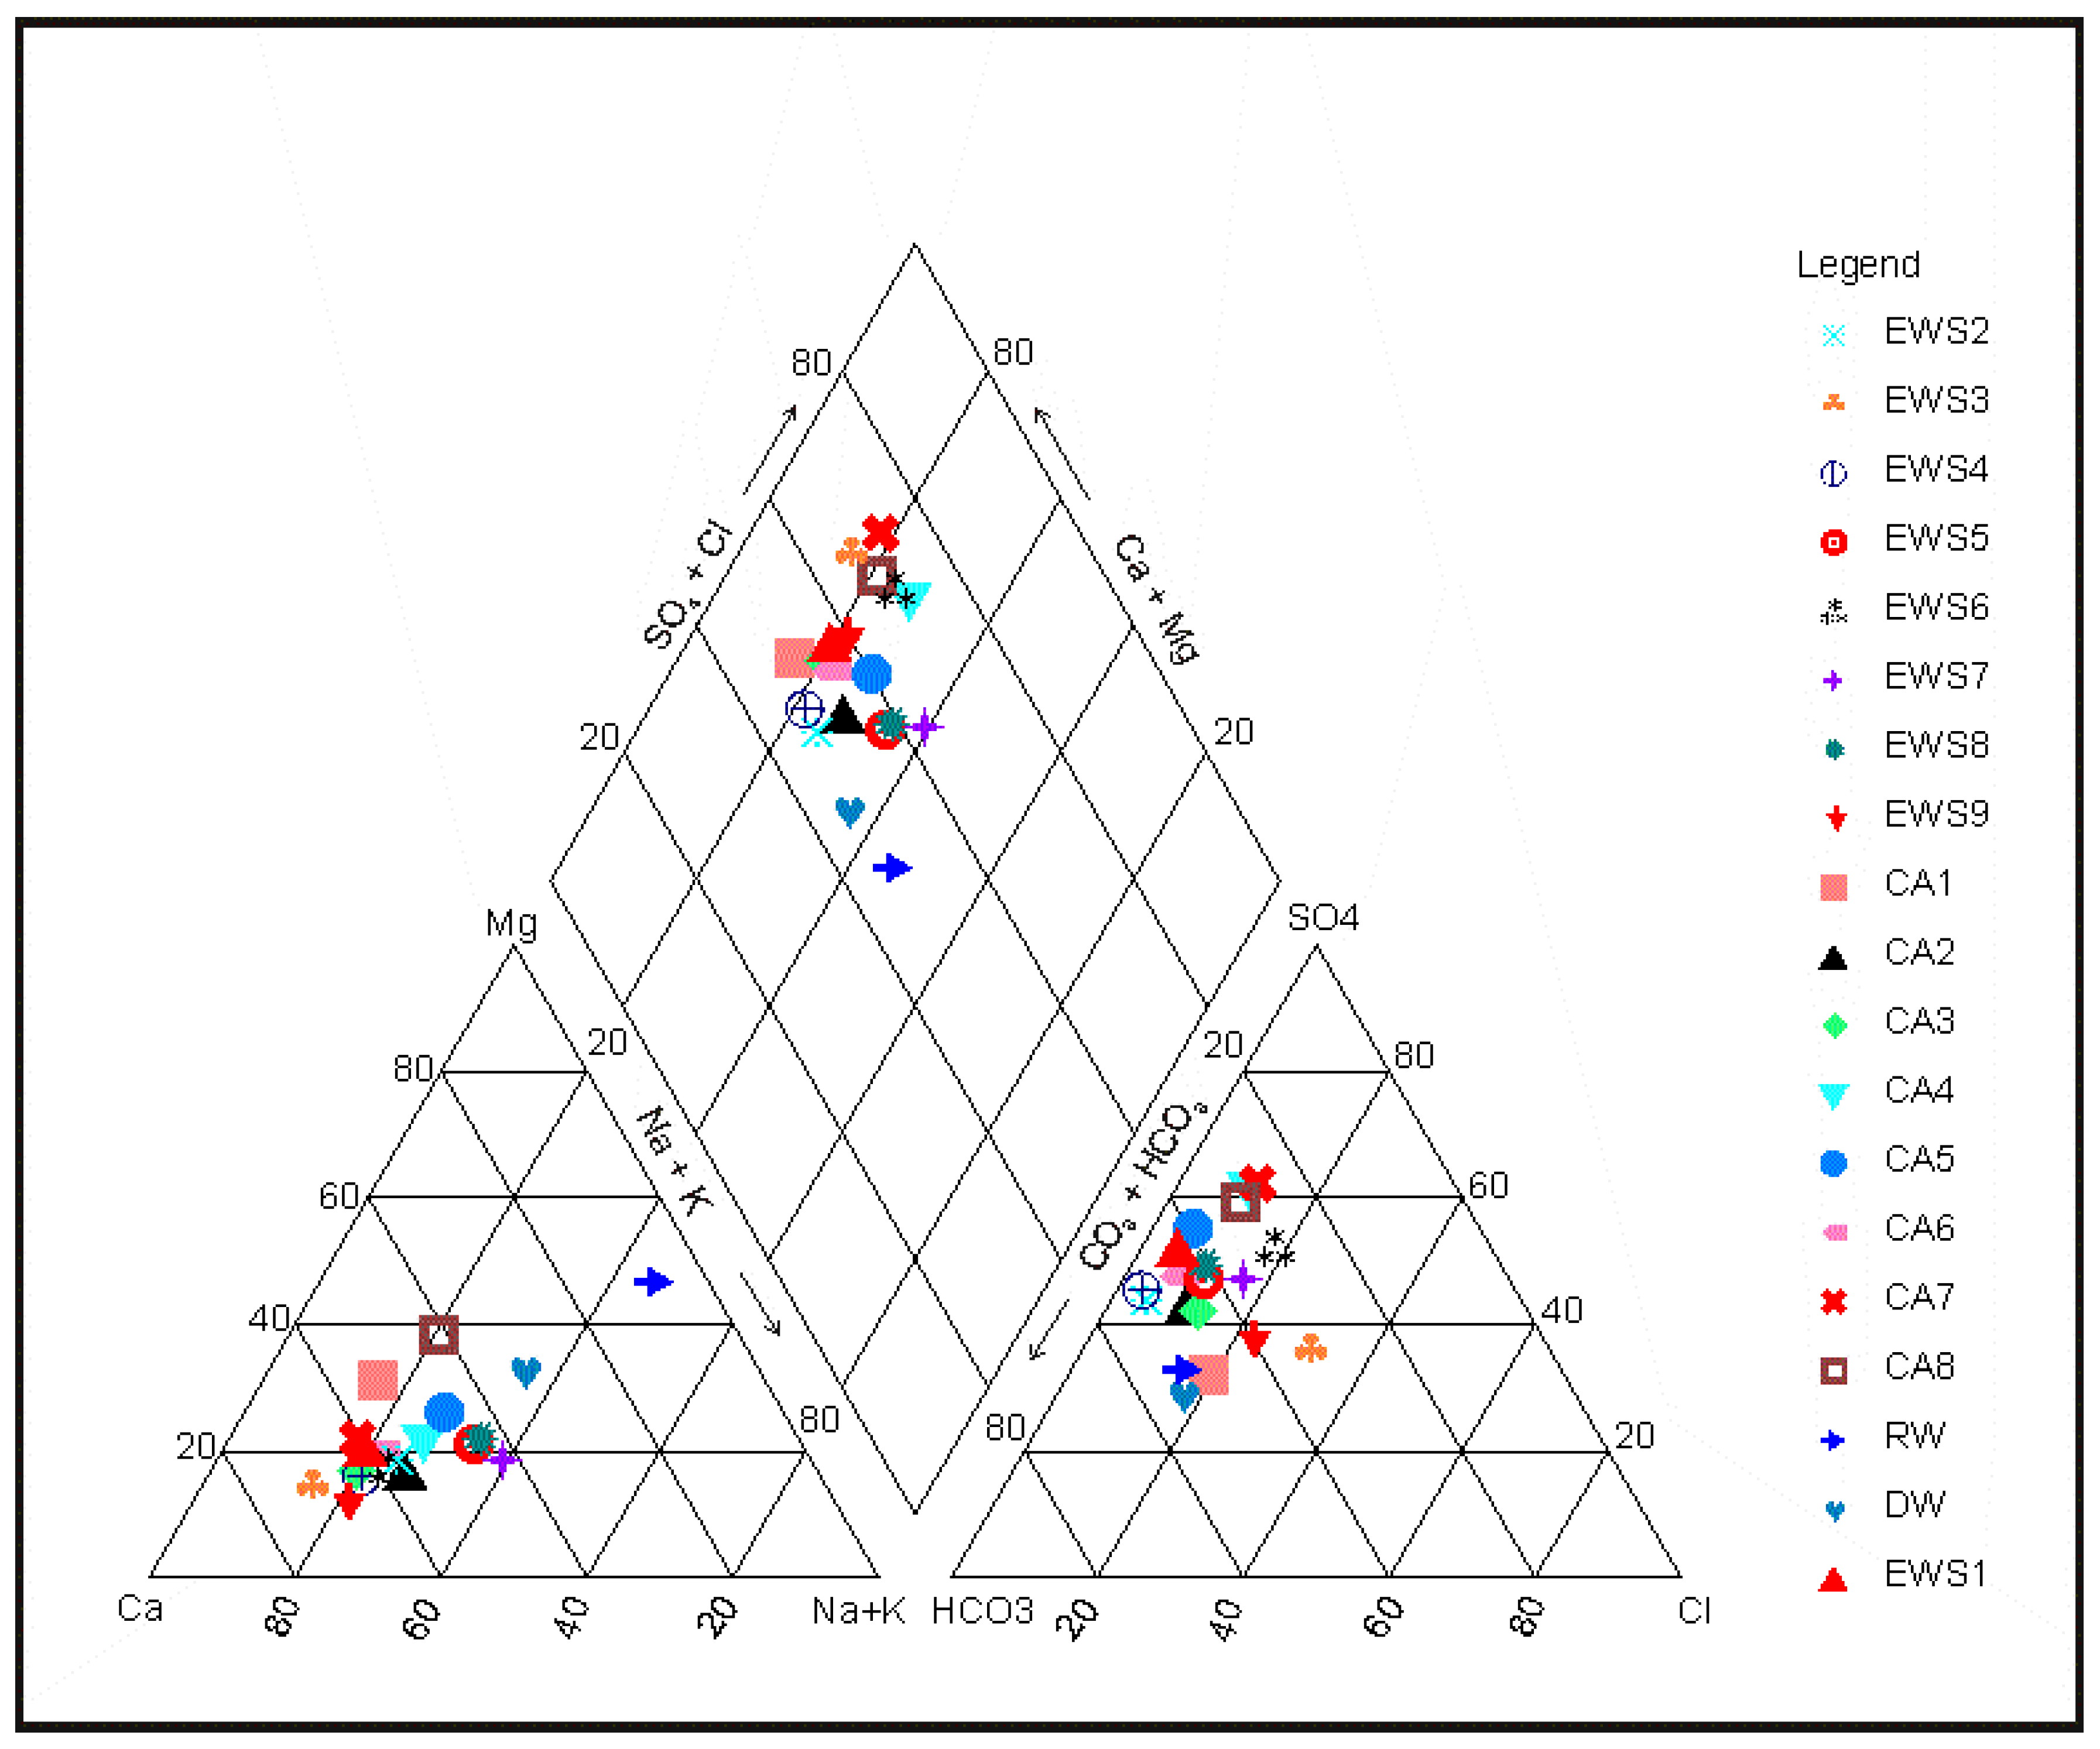
3.2. Hydrochemical Analyses
3.3. Irrigation Water Quality
3.3.1. Salinity of Water
3.3.2. Sodicity Hazard
3.3.3. Magnesium Hazard (MH)
3.3.4. Toxicity Hazard
4. Discussions
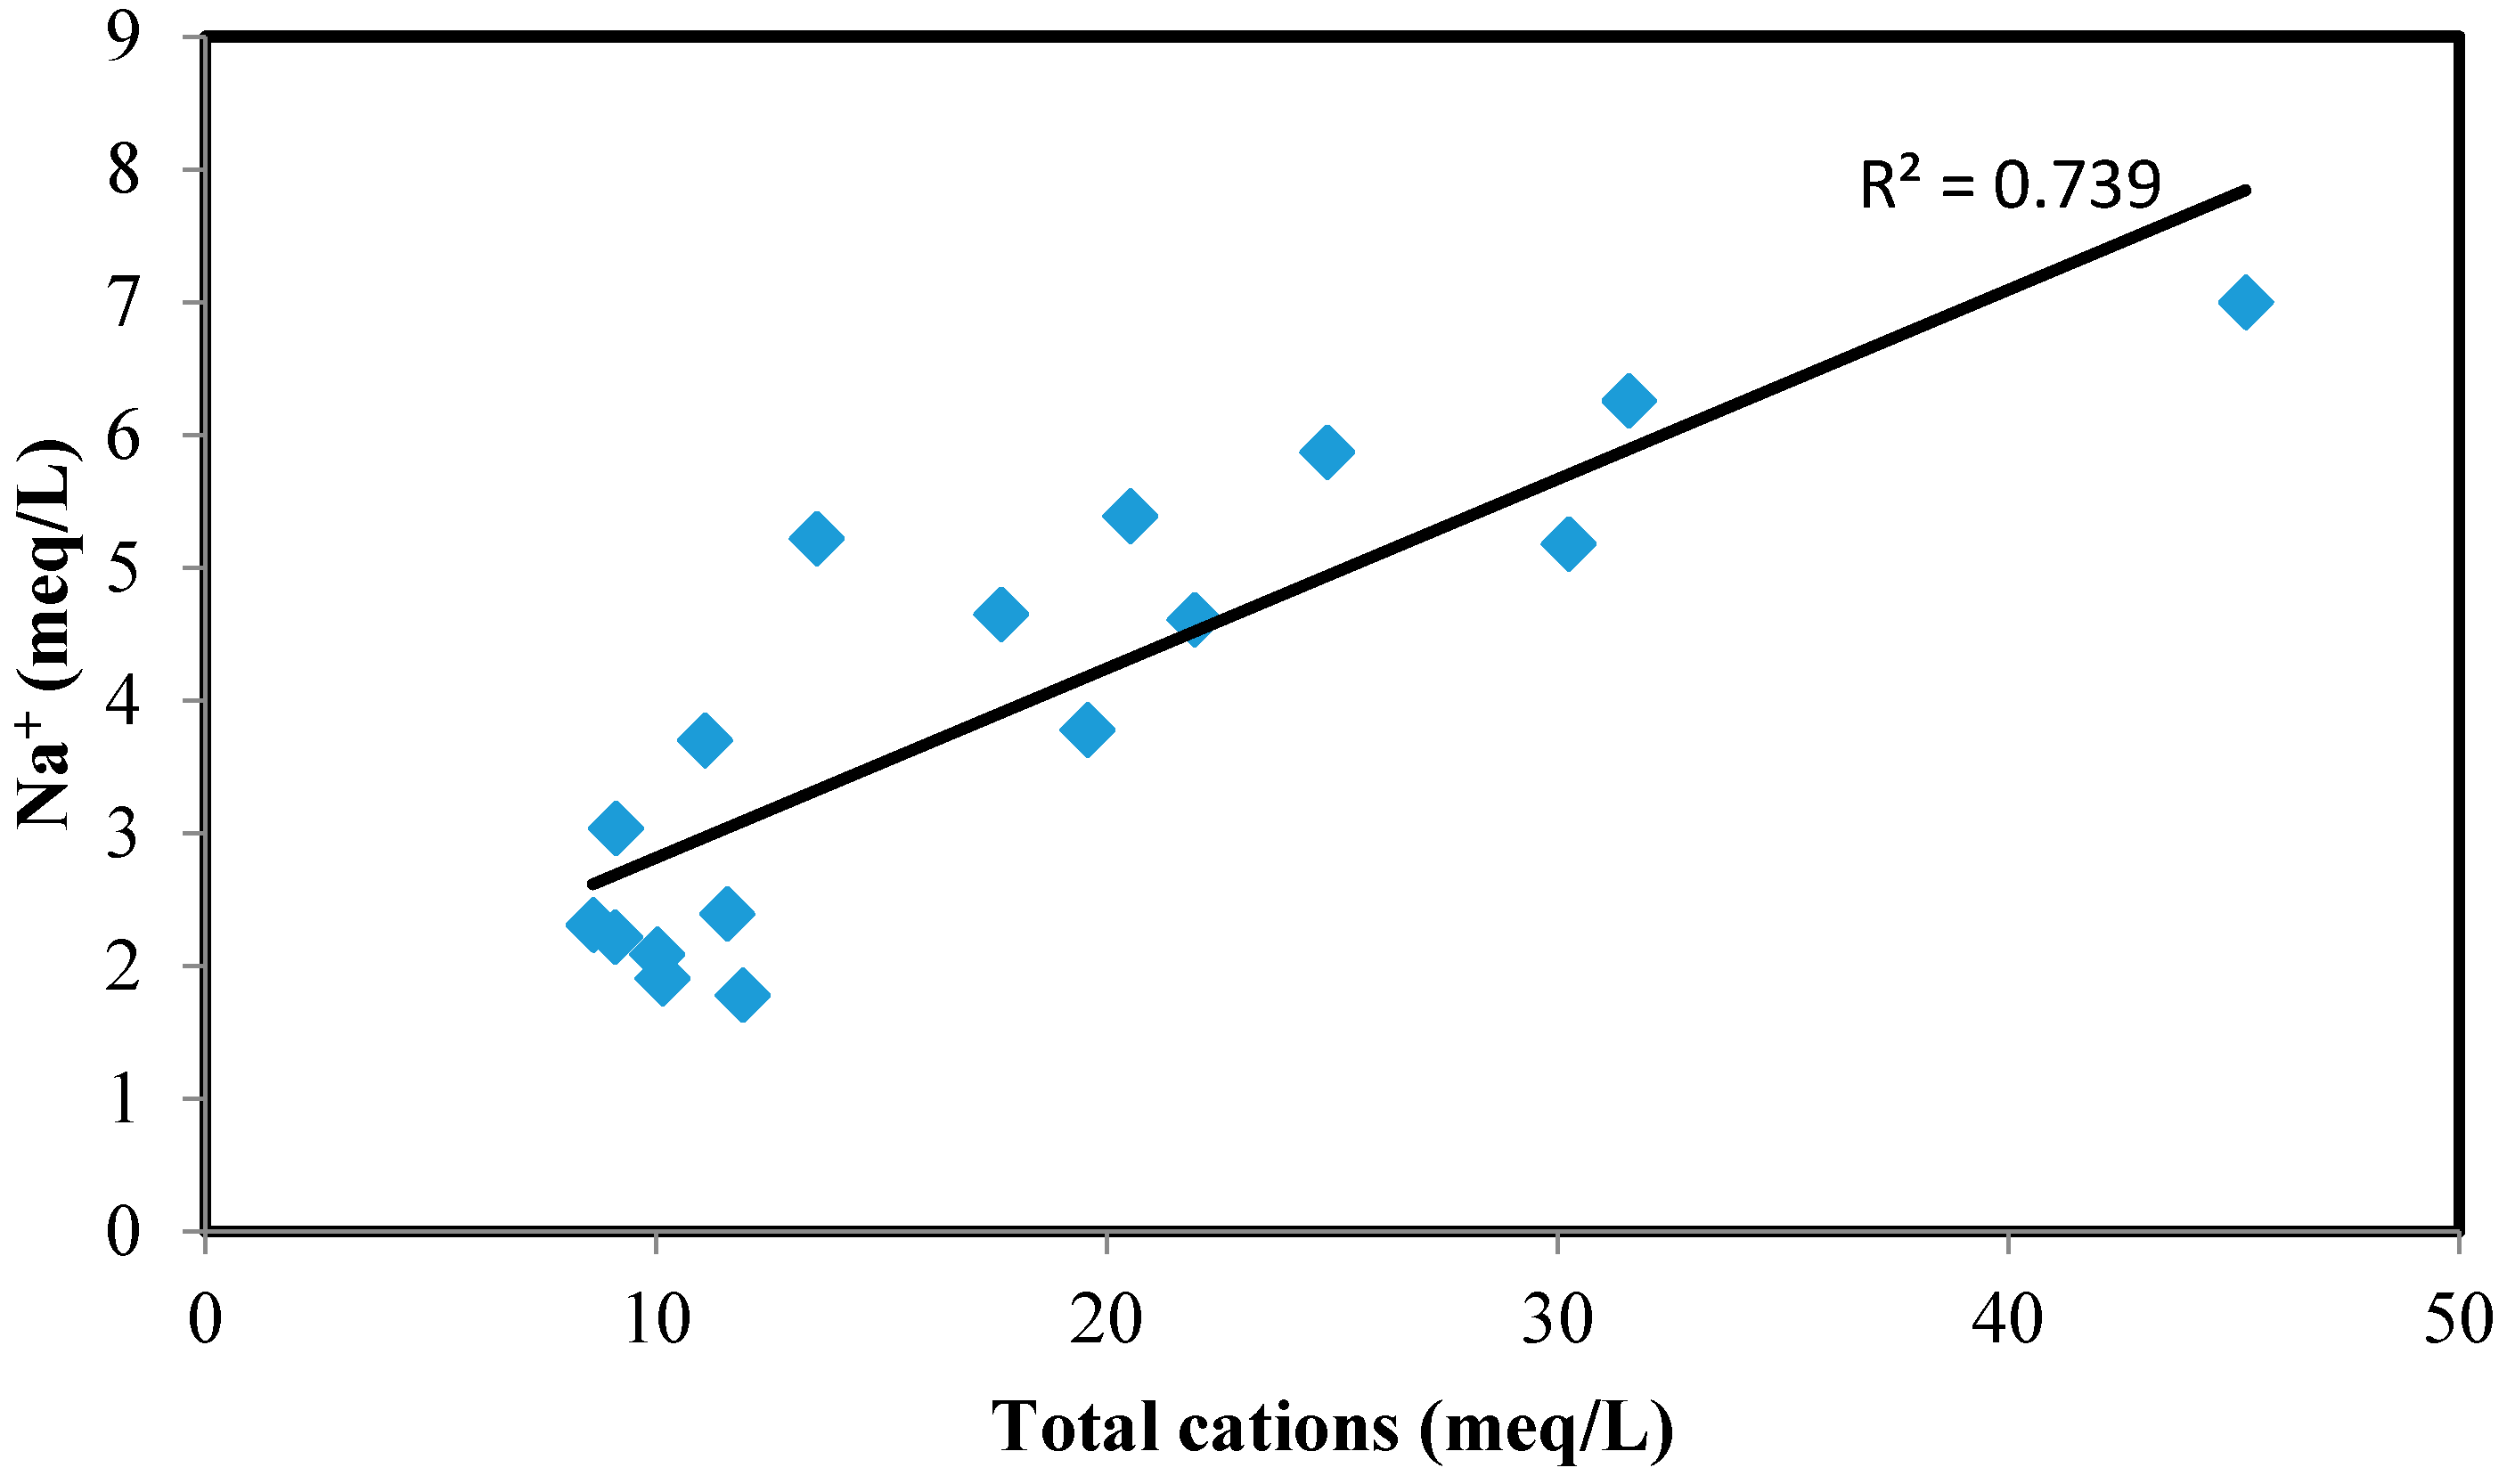
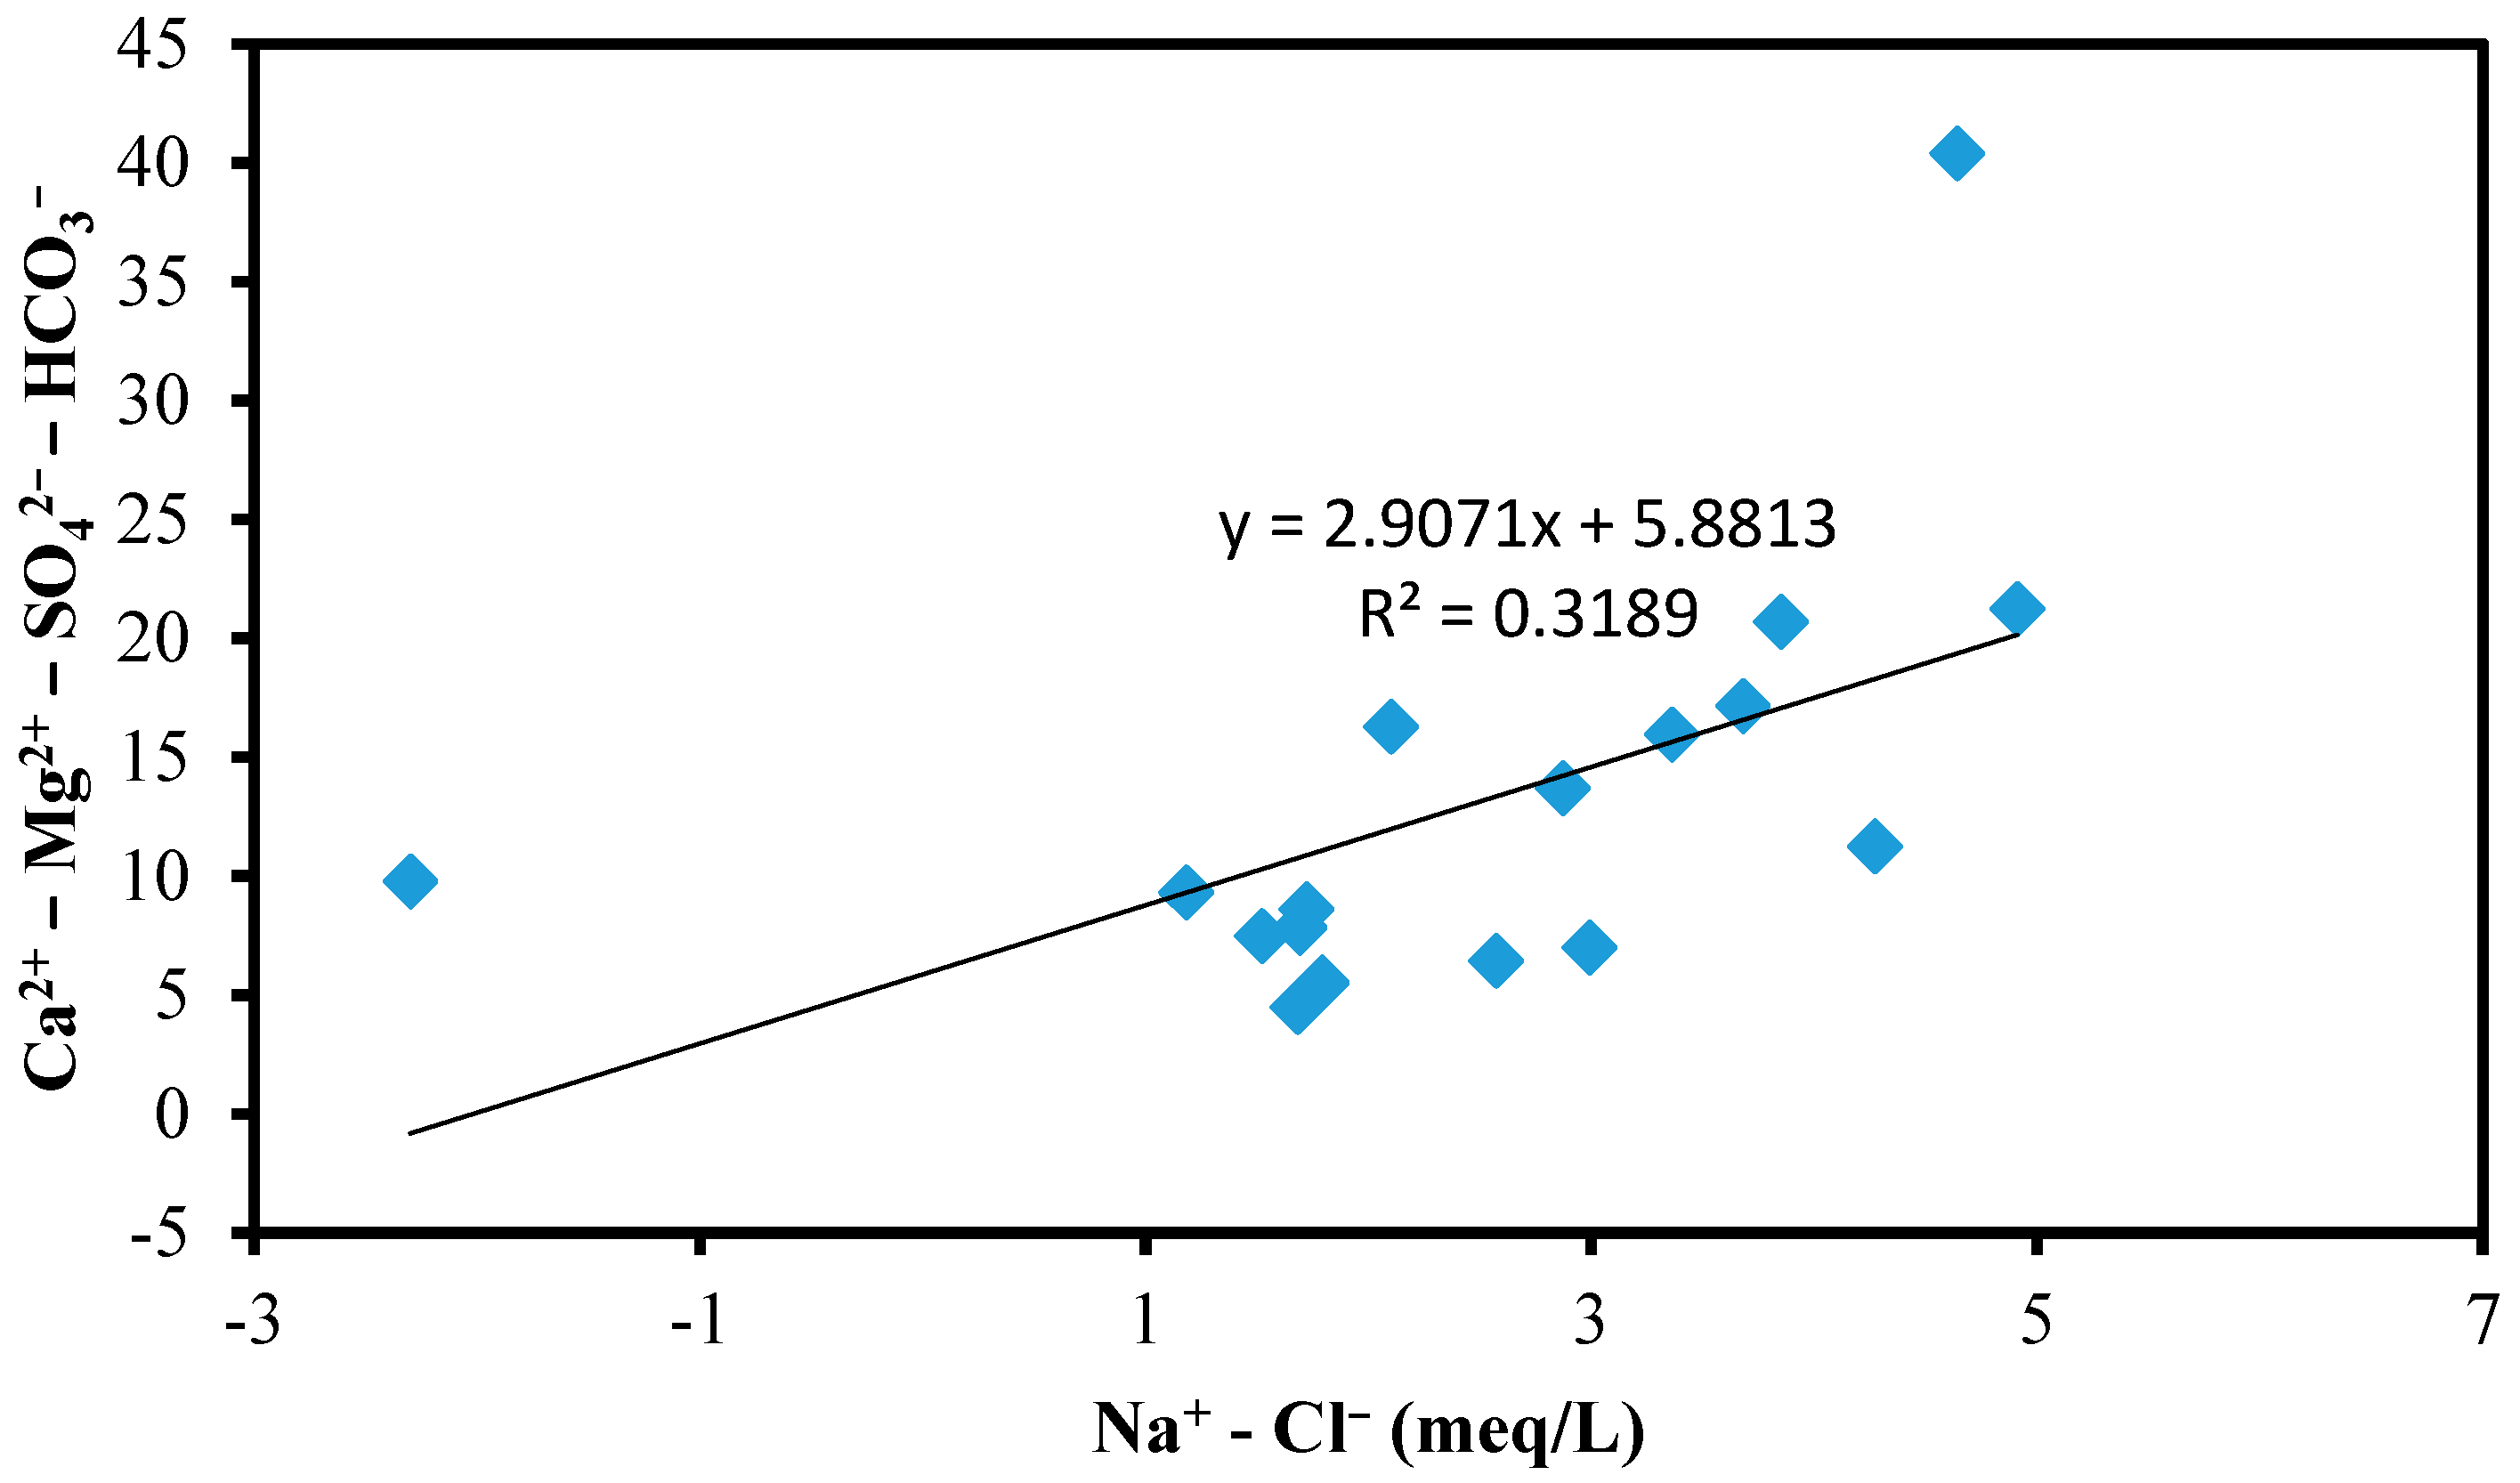
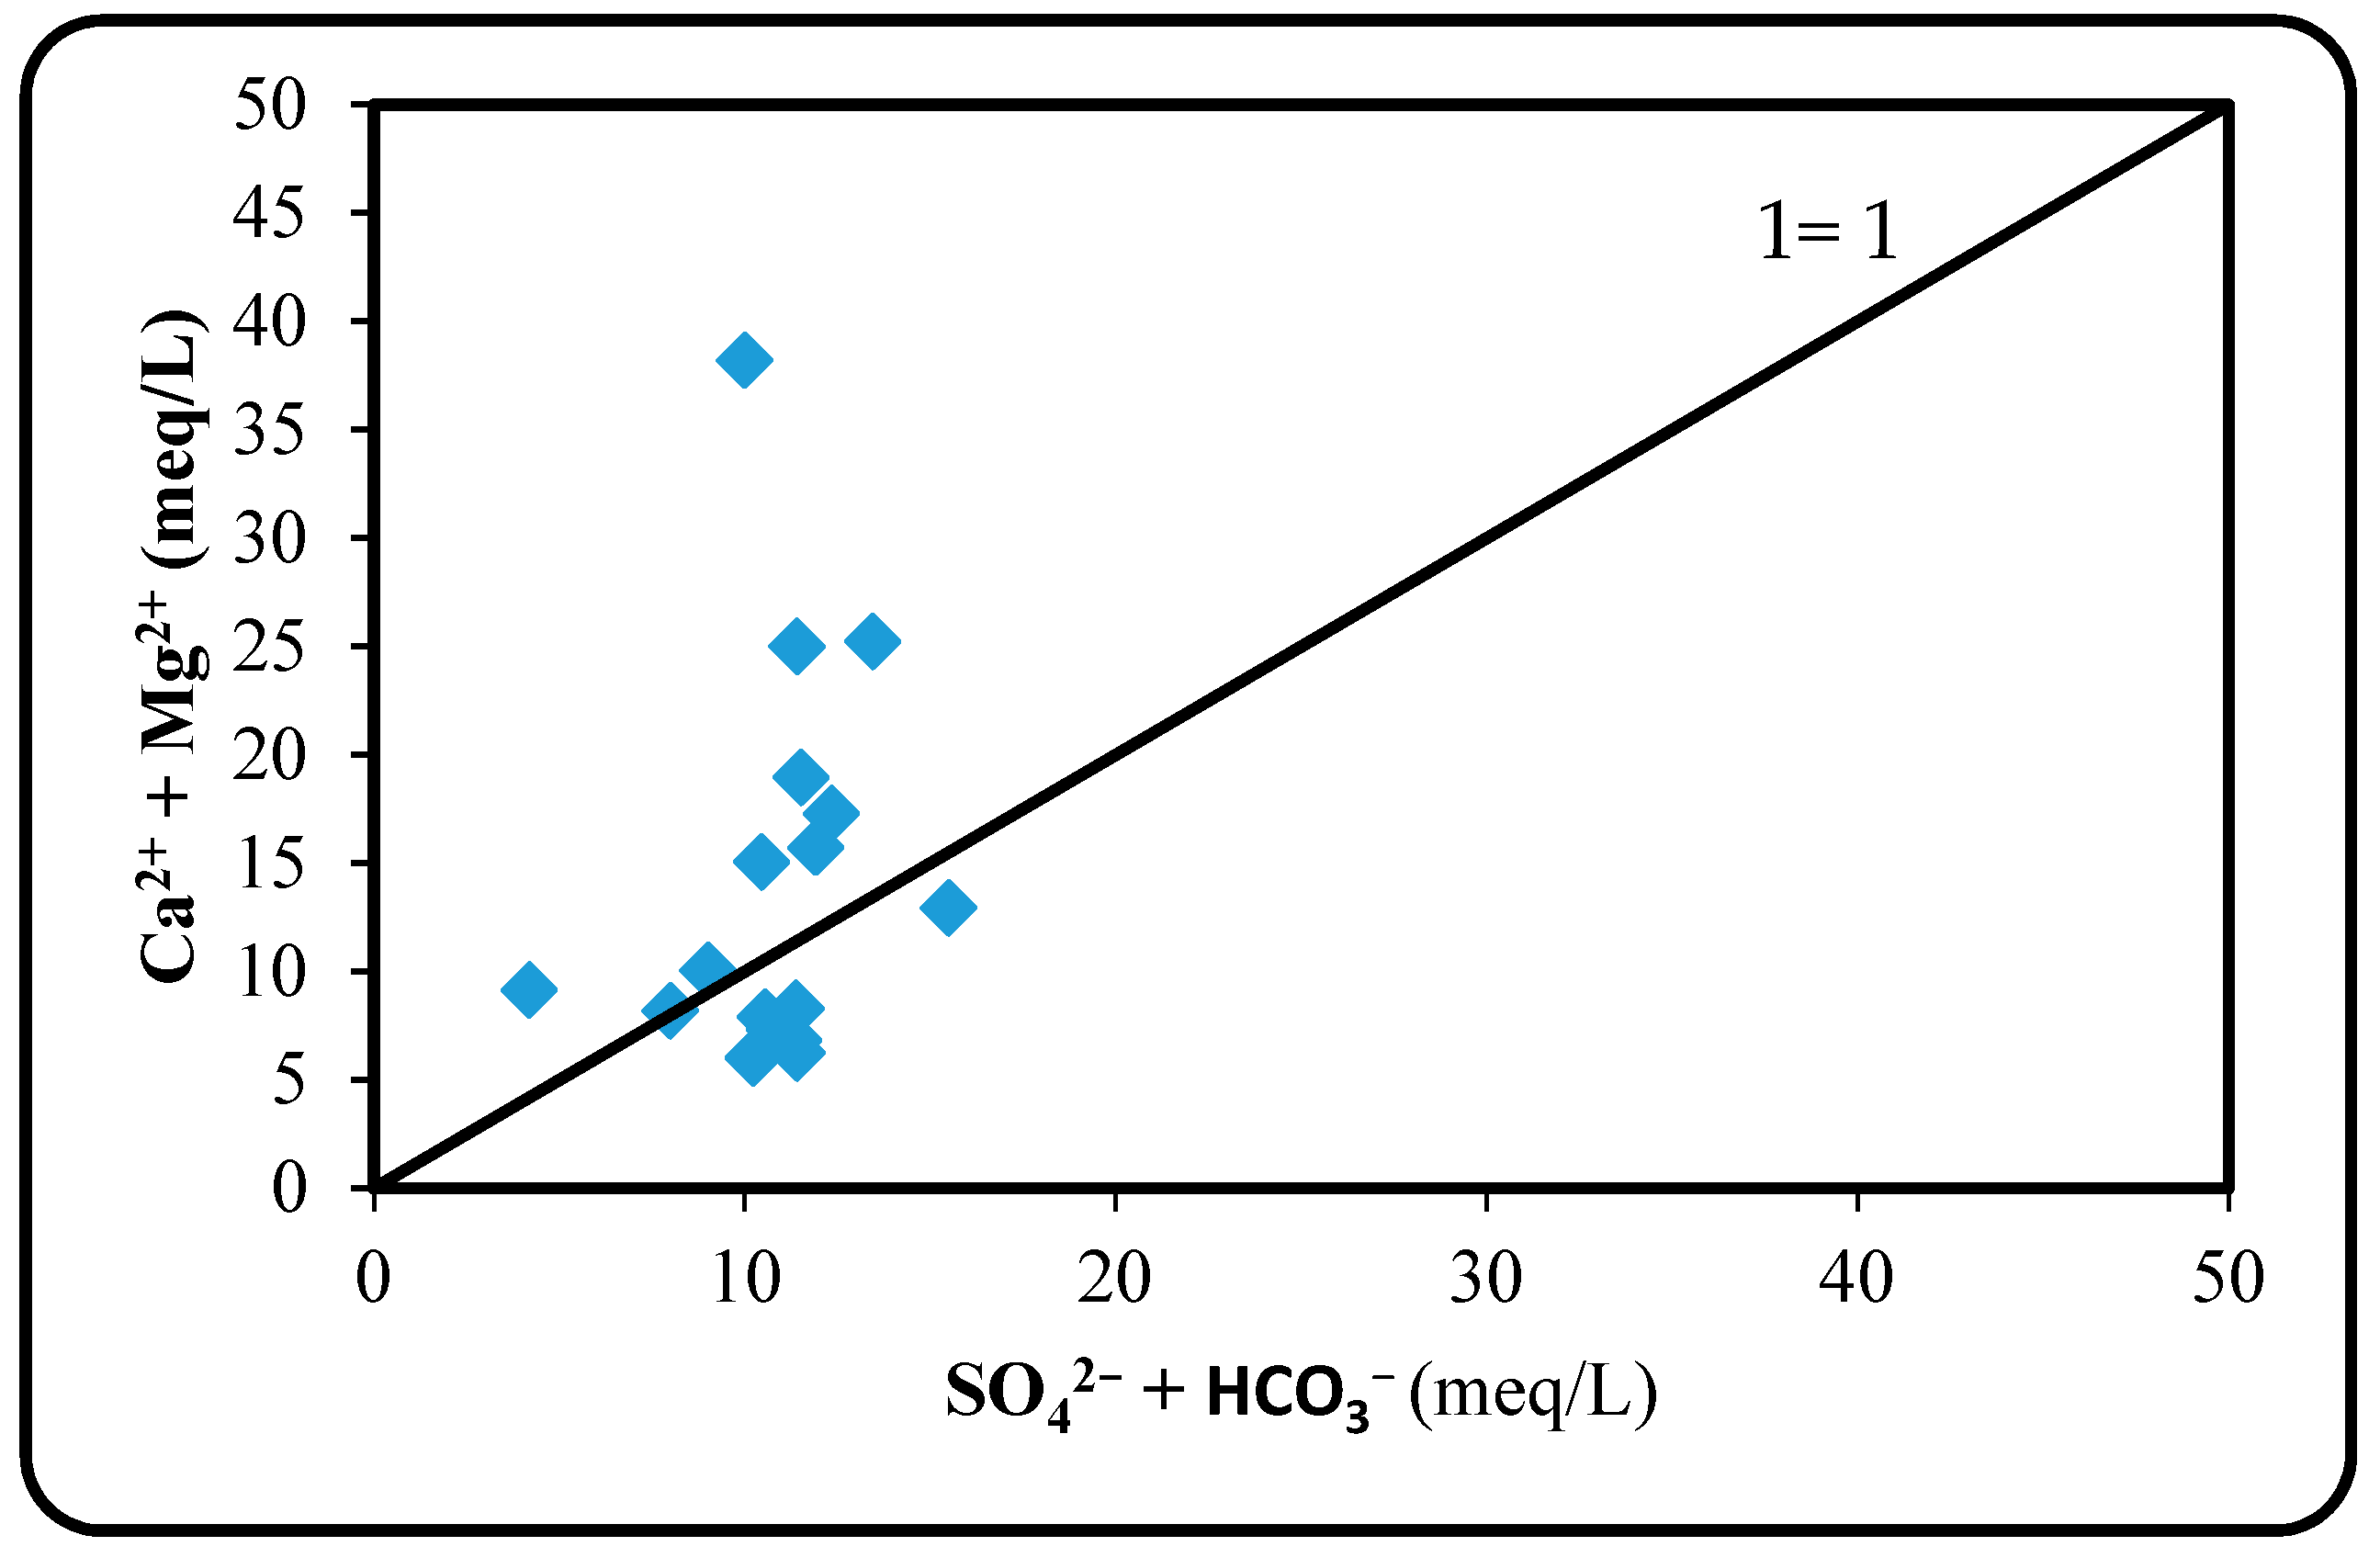
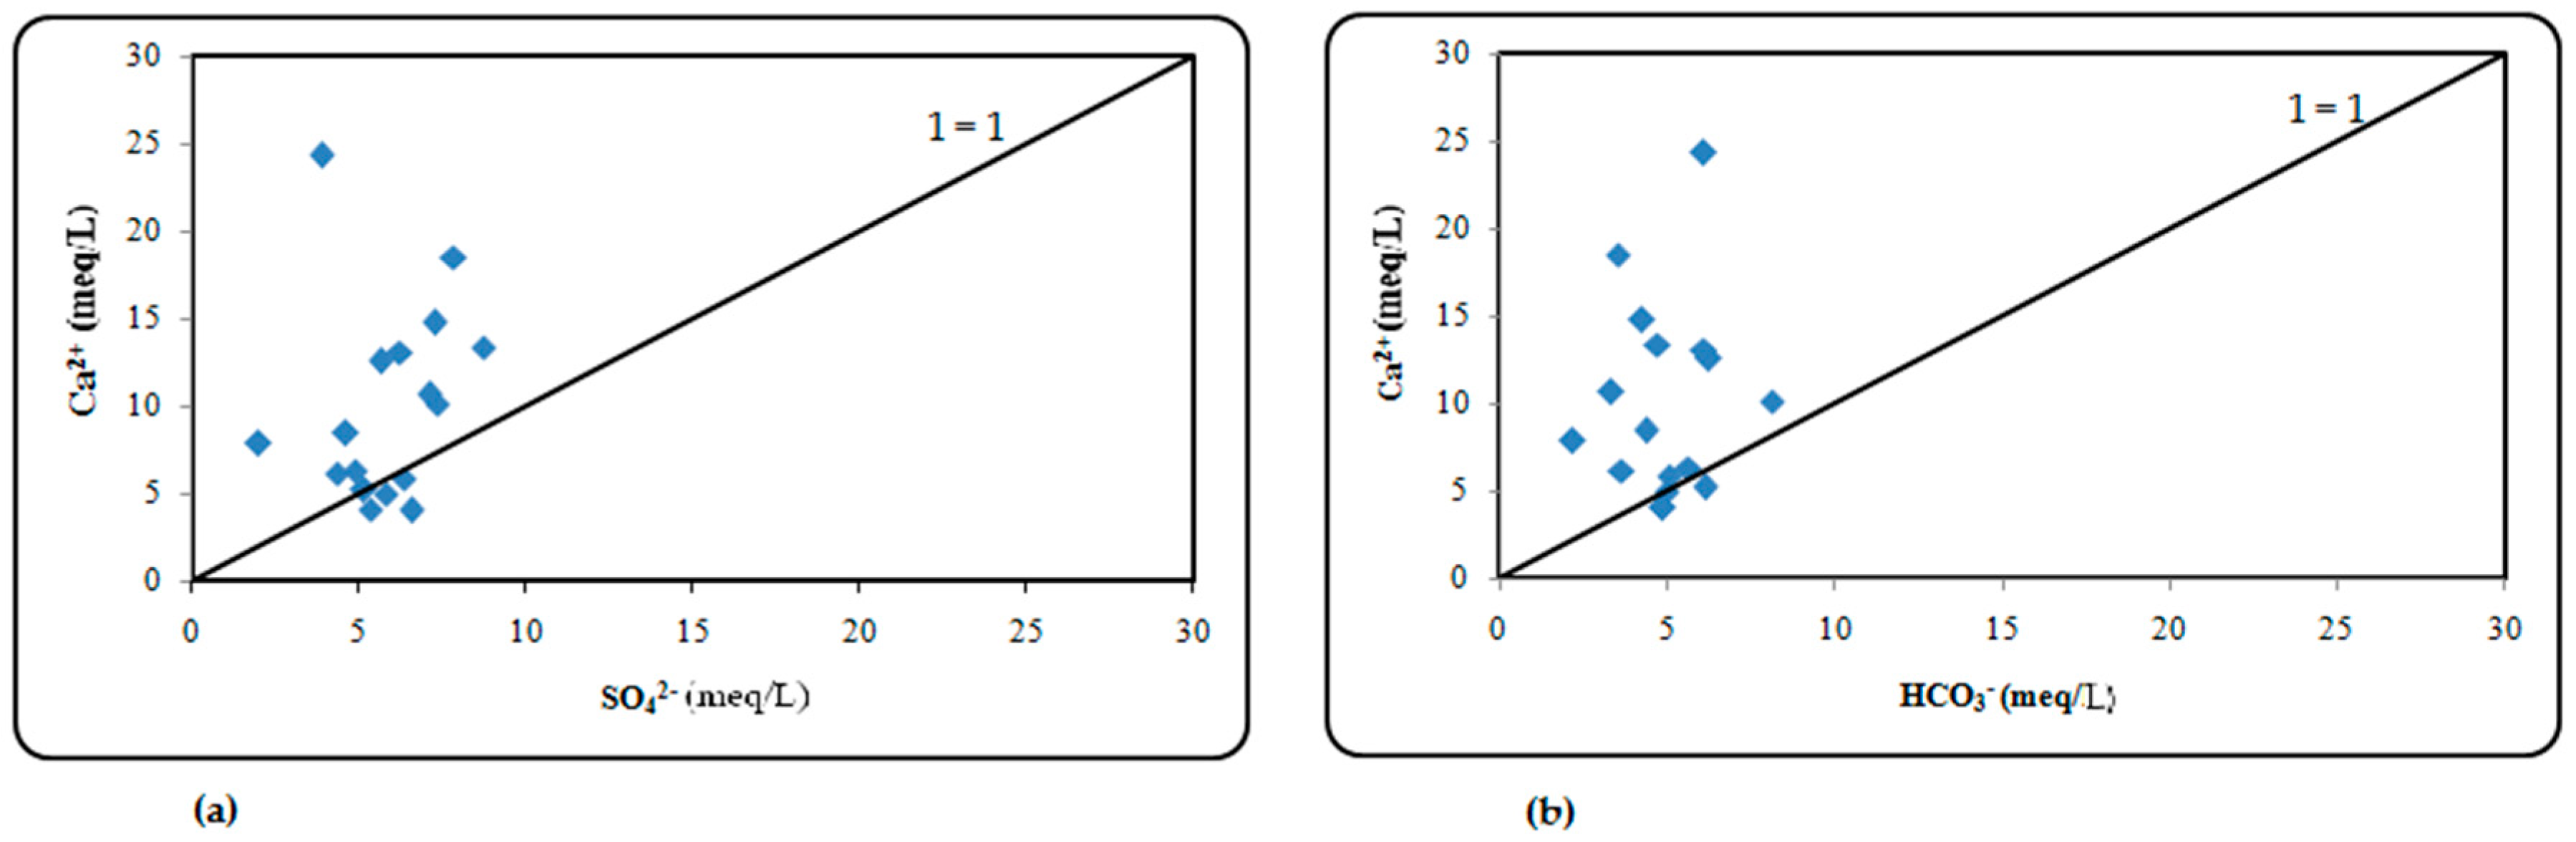
Sources of Salinity
5. Conclusions
- Surface and subsurface drainages must be installed to minimize groundwater rise that lead to salinization due to salts dropped in soil when the rise up groundwater evaporates and;
- Salt tolerant (salt loving) plants should be planted in areas where there is high salinity, like rice, barley, and other salt tolerant plants.
Author Contributions
Funding
Data Availability Statement
Acknowledgments
Conflicts of Interest
References
- Zaman, M.; Shahid, S.A.; Heng, L. Guideline for Salinity Assessment, Mitigation and Adaptation Using Nuclear and Related Techniques; Springer Nature AG: Cham, Switzerland, 2018; p. 162. ISBN 978-3-319-96189-7. [Google Scholar]
- Evangelou, V.P. Effect of Fertilizer Salts on Crop Production; Soil Science News and Views: Lexington, KY, USA, 1983; p. 164. Available online: https://uknowledge.uky.edu/pss_views/164 (accessed on 25 December 2020).
- Szabolcs, I. Salt-Affected Soils; CRC Press: Boca Raton, FL, USA, 1989; p. 274. [Google Scholar]
- Pooja, S.; Rajesh, K. Soil salinity: A serious environmental issue and plant growth promoting bacteria as one of the tools for its alleviation. Saudi J. Biol. Sci. 2015, 22, 123–131. [Google Scholar]
- Massoud, F.I. Salinity and alkalinity. In A World Assessment of Soil Degradation: An International Program of Soil Conservation; Report of an expert consultation on soil degradation; FAO: Rome, Italy, 1974; pp. 16–17. [Google Scholar]
- Ponnamperuma, F.N. Role of cultivar tolerance in increasing rice production on saline-lands. In Salinity Tolerance in Plants: Strategies for Crop Improvement; Staple, R.C., Toenniessen, G.H., Eds.; Wiley: New York, NY, USA, 1984; pp. 255–271. [Google Scholar]
- Mateo-Sagasta, J.; Burke, J. Agriculture and water quality interactions: A global overview. In SOLAW Background Thematic Report—TR08; FAO: Rome, Italy, 2011; p. 46. [Google Scholar]
- Stanners, D. Europe’s Environment: The Dobris Assessment; Office for Official Publication of the European Communities: Luxembourg, 1995. [Google Scholar]
- Taddese, G. Land degradation: A Challenge to Ethiopia. Environ. Manag. 2001, 27, 815–824. [Google Scholar] [CrossRef]
- Ruffeis, D.; Loiskandl, W.; Spendlingwimmer, R.; Schonerklee, M.; Awulachew, S.B.; Boelee, E.; Wallner, K. Environmental impact analysis of two large scale irrigation schemes in Ethiopia. In Proceedings of the Impact of Irrigation on Poverty and Environment in Ethiopia: Draft Proceedings of the Symposium and Exhibition, Addis Ababa, Ethiopia, 27–29 November 2007; Awulachew, S.B., Loulseged, M., Yilma, A.D., Eds.; International Water Management Institute (IWMI): Colombo, Sri Lanka, 2008; pp. 370–388. [Google Scholar]
- Gebrehiwot, K.A. A review on waterlogging, salinization and drainage in Ethiopian irrigated agriculture. Sustain. Water Resour. Manag. 2018, 4, 55–62. [Google Scholar] [CrossRef]
- Abebe, T.F.; Alamirew, T.; Abegaz, F. Appraisal and mapping of soil salinity problem in Amibara irrigation farms, Middle Awash basin. IJISR 2015, 13, 298–314. [Google Scholar]
- Hagos, E.Y.; Schultz, B.; Depeweg, H. Reservoir operation in view of effective utilization of limited water in semi-arid areas, the case of Gumselasa earthen dam irrigation scheme in Tigray. Ethiopia. Irrigat. Drain. 2016, 65, 294–307. [Google Scholar] [CrossRef]
- Darout, G. The Socio-Cultural Aspect of Irrigation Management: The Case of Two Community-Based Small-Scale Irrigation Schemes in the Upper TEKEZE Basin, Tigray Region, Ethiopia. Master’s Thesis, Addis Ababa University, Addis Ababa, Ethiopia, 2004; p. 126. [Google Scholar]
- Teshome, W. Irrigation practices, state intervention and farmer’s life-worlds in drought-prone Tigray. In Best Practices and Technologies for Small Scale Agricultural Water Management in Ethiopia, Proceedings of the MoARD/MoWR/USAID/IWMI Symposium and Exhibition, Addis Ababa, Ethiopia, 7–9 March 2006; Awulachew, S.B., Menker, M., Abesha, D., Atnafe, T., Wondimkun, Y., Eds.; IWMI: Colombo, Sri Lanka, 2006; pp. 129–142. [Google Scholar]
- Mintesinot, B. Assessment and Optimization of Traditional Irrigation of Vertisols in Northern Ethiopia: A Case Study at Gumselasa Micro-Dam Using Maize as an Indicator Crop. Ph.D. Thesis, Ghent University, Ghent, Belgium, 2002. [Google Scholar]
- Yazew, E. Development and Management of Irrigated Lands in Tigray, Ethiopia; Balkema: Delft, The Netherlands, 2005; p. 265. ISBN 04-1538-485-0. [Google Scholar]
- Degol, F.Y.; Ritsema, C.J.; Solomon, H.; Froebrich, J.; van Dam, J.C. Irrigation water management: Farmers’ practices, perceptions and adaptations at Gumselasa irrigation scheme, North Ethiopia. Agric. Water Manag. 2017, 191, 16–28. [Google Scholar]
- Haregeweyn, N.; Poesen, J.; Nyssen, J.; De Wit, J.; Haile, M.; Govers, G.; Deckers, S. Reservoirs in Tigray (Northern Ethiopia): Characteristics and sediment deposition problems. Land Degrad. Develop. 2006, 17, 211–230. [Google Scholar] [CrossRef]
- Fassile, K.; Charles, Y. Soil fertility status and NuMaSS fertilizer recommendation of typichapluusterts in the northern highlands of Ethiopia. World Applsci. J. 2009, 6, 1473–1480. [Google Scholar]
- Degol, F. Irrigation Water Management: Effects of Irrigation Water Management Practices on the Prognosis of Soil Salinization: Case Study of Farms around Gumselasa Dam, Tigray, Ethiopia; VDM Verlag Dr. Müller: Riga, Latvia, 2010; p. 96. [Google Scholar]
- Yordanos, B. Collective Action in Irrigation System Management: A Case Study on the Management of Two Irrigation Schemes in Tigray, Ethiopia. Master’s Thesis, Wageningen University, Wageningen, The Netherlands, 2012; p. 77. [Google Scholar]
- Tedros, T. Contribution of Small Holders’ Irrigation to Households Income and Food Security: A Case Study of Gum-Selasa and Shilena Irrigation Schemes, Hintalowejerat, South-Eastern Zone of Tigray, Ethiopia. Master’s Thesis, Mekelle University, Mekelle, Ethiopia, 2014. [Google Scholar]
- Oates, N.; Hisberg, A.; Rodríguez Ros, J.; Solomon, H.; Ludi, E.; Marlet, S.; Jamin, J.-Y. The implications of state intervention for self-governed irrigation schemes: Insights from Tigray, Ethiopia. Irrig. Drain. 2020, 69, 88–99. [Google Scholar] [CrossRef]
- Gebremedhin, B.; Tesfamichael, G.; Kristine, M.; Kristine, W. Overview of micro-dam reservoirs (MDR) in Tigray (northern Ethiopia): Challenges and benefits. J. Afr. Earth Sci. 2016, 123, 210–222. [Google Scholar]
- Amdom, G.; Henok, S.; Amanuel, Z.; Girmay, G.; Solomon, H.; Tesfay, G. The impact of climate change on irrigation water requirement of Maize and Onion: The case of Gumselasa small-scale irrigation scheme, Tigray, Ethiopia. J. Drylands 2018, 8, 729–740. [Google Scholar]
- Nata, T.T.; Michiele, G.; Solomon, H.; Berhanu, F.A. Water balance model: Implications for groundwater recharge estimation in data scarce arid catchment, northern Ethiopia. Asian Rev. Environ. Earth Sci. 2018, 5, 34–46. [Google Scholar]
- Gebremedhin, G.; Gebremicael, T.G.; Mulubrehan, K.; Esayas, M.; Teferi, G.; Abbadi, G. Salinization pattern and its spatial distribution in the irrigated agriculture of northern Ethiopia: An integrated approach of quantitative and spatial analyses. Agric. Water Manag. 2018, 206, 147–157. [Google Scholar] [CrossRef]
- Michiele, G. Assessment of Sources of Salinity in Gumselasa Irrigation Scheme, Southern Tigray, Ethiopia. Master’s Thesis, Mekelle University, Mekelle, Ethiopia, 2014; p. 78. [Google Scholar]
- Nata, T. Lithological and structural controls on the development of aquifer in basement rock dominated Tsalit-Ira river basin, Tigray, Northern Ethiopia. Momona Ethiop. J. Sci. 2017, 9, 106–126. [Google Scholar]
- Alemu, T.; Abdelsalam, M.G.; Dawit, E.L.; Atnafu, B.; Mickus, K.L. The Paleozoic e Mesozoic Mekele Sedimentary Basin in Ethiopia: An example of an exhumed IntraCONtinental Sag (ICONS) basin. J. Afr. Earth Sci. 2018, 143, 40–58. [Google Scholar] [CrossRef]
- Beyth, M. Paleozoic-Mesozoic Sedimentary Basins of Mekele Outlier. Northern Ethiopia. Assoc. Am. Pet. Geol. Bull. 1972, 56, 2426–2439. [Google Scholar]
- Engels, G.G. Mesozoic Stratigraphy of Northern Ethiopia, Rept. No. ETG-18. Unpublished Report. 1966.
- Enkurie, D.L. Adigrat Sandstone in Northern and Central Ethiopia: Stratigraphy, Facies, Depositional Environments and Palynology. Ph.D. Thesis, University of Berlin, Berlin, Germany, 2010; p. 162. [Google Scholar]
- Worash Getaneh. Sulfides, Stable isotopes and other Diagenetic features of the Mesozoic Carbonate-Marl-Shale Succession in Northern Ethiopia. SINET Ethiop. J. Sci. 2016, 39, 34–49. [Google Scholar]
- Nata, T.; Miruts, H.; Bheemalingeswara, K. Hydrogeological Investigation: A case study on the groundwater potential assessment in the Hantebet catchment, Tigray, northern Ethiopia. J. Drylands 2009, 2, 55–65. [Google Scholar]
- Ayers, R.S.; Westcot, D.W. Water Quality for Agriculture; FAO Irrigation and Drainage Paper 29 Rev.1; FAO: Rome, Italy, 1989; p. 156. [Google Scholar]
- Faisal, K.Z.; Saad, M.; Manoj, M.; Elkhedr, I. Evaluation of groundwater chemistry and its impact on drinking and irrigation water quality in the eastern part of the Central Arabian graben and trough system, Saudi Arabia. J. Afr. Earth Sci. 2016, 120, 208–219. [Google Scholar]
- Schoeller, H. Qualitative evaluation of groundwater resources. In Methods and Techniques of Groundwater Investigation and Development; Water Resource Series No. 33; Schoeller, H., Ed.; UNESCO: Paris, France, 1967; pp. 44–52. [Google Scholar]
- Nata, T.; Bheemalingswara, K. Prospects and constraints of household irrigation practices, Hayelom watershed, Tigray, northern Ethiopia. Momona Ethiop. J.Sci. 2010, 2, 87–109. [Google Scholar] [CrossRef]
- Carmelita, S.N.; Thushyanthy, M.; Barathithasan, T.; Saravanan, S. Irrigation water quality based on hydro chemical analysis, Jaffna, Sri Lanka. Am. Eurasian J. Agric. Environ. Sci. 2010, 7, 100–102. [Google Scholar]
- Selma, E.; Semia, C.; Jamila, T. Hydrochemical assessment of water quality for irrigation: A case study of the Medjerda River in Tunisia. Appl. Water Sci. 2017, 7, 469–480. [Google Scholar]
- Tahmasebi, P.; Mahmudy-Gharaie, M.H.; Ghassemzadeh, F.; Karouyeh, A.K. Assessment of groundwater suitability for irrigation in a gold mine surrounding area, NE Iran. Environ. Earth Sci. 2018, 77, 766. [Google Scholar] [CrossRef]
- Ravikumar, P.; Somashekar, R.K.; Angami, M. Hydrochemistry and evaluation of groundwater suitability for irrigation and drinking purposes in the Markandeya River basin, Belgaum District, Karnataka State, India. Environ. Monit. Assess. 2011, 173, 459–487. [Google Scholar] [CrossRef] [PubMed]
- Hussain, Y.; Ullah, S.F.; Akhter, G.; Aslam, A.Q. Groundwater quality evaluation by electrical resistivity method for optimized tube well site selection in an ago-stressed Thal Doab Aquifer in Pakistan. Model. Earth Syst. Environ. 2017, 3, 15. [Google Scholar] [CrossRef]
- Khalid, S. An assessment of groundwater quality for irrigation and drinking purposes around brick kilns in three districts of Balochistan province, Pakistan, through water quality index and multivariate statistical approaches. J. Geochem. Explor. 2019, 197, 14–26. [Google Scholar]
- Abdulhussein, F.M. Hydrochemical assessment of groundwater of Dibdibba aquifer in Al-Zubair area, Basra, south of Iraq and its suitability for irrigation purposes. Iraqi J. Sci. 2018, 59, 135–143. [Google Scholar]
- Golchin, I.; AzhdaryMoghaddam, M. Hydro-geochemical characteristics and groundwater quality assessment in Iranshahr plain aquifer, Iran. Environ. Earth Sci. 2016, 75, 14. [Google Scholar] [CrossRef]
- Mayback, M. Global chemical weathering of surficial rocks estimated from river dissolved loads. Am. J. Sci. 1987, 287, 401–428. [Google Scholar] [CrossRef]
- Elango, L.; Kannan, R. Rock–water interaction and its control on chemical composition of groundwater. In Developments in Environmental Science; Sarkar, D., Datta, R., Hannigan, R., Eds.; Elsevier: Amsterdam, The Netherlands, 2007; Volume 5, pp. 229–243. [Google Scholar]
- Adomako, D.; Osae, S.; Akiti, T.T.; Faye, S.; Maloszewski, P. Geochemical and isotopic studies of groundwater conditions in the Densu River Basin of Gana. Environ. Earth Sci. 2011, 62, 1071–1084. [Google Scholar] [CrossRef]
- Fisher, R.S.; Mullican, W.F. Hydrochemical evolution of sodium-sulfate and sodium-chloride groundwater beneath the northern Chihuahuan Desert, Trans-Pecos, Texas, USA. Hydrogeol. J. 1997, 5, 4–16. [Google Scholar] [CrossRef]
- Datta, P.S.; Tyagi, S.K. Major ion chemistry of groundwater in Delhi area: Chemical weathering processes and groundwater flow regime. J. GeolSoc. India 1996, 47, 179–188. [Google Scholar]
- Garrels, R.M. A survey of low temperature water mineral relations. In Interpretation of Environmental Isotope and Hydrogeochemical Data in Groundwater Hydrology; International Atomic Energy Agency: Vienna, Austria, 1976; pp. 65–84. [Google Scholar]
- Zhang, B.; Song, X.; Zhang, Y.; Han, D.; Tang, C.; Yilei, Y.; Ma, Y. Hydrochemical characteristics and water quality assessment of surface water and groundwater in Songnen Plain, northeast China. Water Res. 2012, 46, 2737–2748. [Google Scholar] [CrossRef] [PubMed]
- Elango, L.; Kannan, R.; Senthil Kumar, M. Major ion chemistry and identification of hydrogeochemical processes of groundwater in a part of Kancheepuram district, Tamil Nadu, India. Environ. Geosci. 2003, 10, 157–166. [Google Scholar]


| Location | Area (km2) | AET (×106) m3 | P (×106) m3 | Qi (×106) m3 | Qo(×106) m3 | I (×106) m3 |
|---|---|---|---|---|---|---|
| EWSSCL | 17.16 | 5.468 | 8.34 | 1.167 | 1.705 | |
| EWSC | 4.98 | 1.55 | 2.42 | 0.44 | 0.43 | |
| RES | 0.4 | 0.505 | 0.194 | 1.607 | 0.553 | 0.743 |
| WCA-1 | 0.55 | 0.19 | 0.267 | 0.048 | 0.029 | |
| WCA-2 | 3.99 | 1.42 | 1.94 | 0.349 | 0.171 | |
| CA | 1 | 0.32 | 0.486 | 0.95 | 0.13 | 0.986 |
| Sample ID | Major Cations (mg/L) | Major Anions (mg/L) | Chemical Parameters | Water Type | |||||||
|---|---|---|---|---|---|---|---|---|---|---|---|
| Na+ | K+ | Ca2+ | Mg2+ | Cl− | SO42− | NO3− | HCO3− | pH | TDS | ||
| EWS 1 | 44 | 1.31 | 123 | 25 | 13.95 | 208.1 | 17.15 | 222 | 8.22 | 504 | Ca-Mg-Na-SO4-HCO3 |
| EWS 2 | 51 | 1.07 | 104 | 20 | 18.95 | 247.4 | 14.9 | 375.9 | 8.35 | 472 | Ca-Na-HCO3-SO4 |
| EWS 3 | 41 | 1.93 | 169 | 20 | 144.6 | 222.4 | 18.26 | 266.1 | 7.94 | 596 | Ca-SO4-HCO3-Cl |
| EWS 4 | 48 | 1.16 | 127 | 19 | 13.07 | 235.1 | 16.33 | 344.3 | 8 | 588 | Ca-HCO3-SO4 |
| EWS 5 | 70 | 1.09 | 83 | 23 | 44.25 | 256.1 | 19.15 | 297.2 | 8.42 | 668 | Ca-Na-SO4-HCO3 |
| EWS 6 | 135 | 1.67 | 296 | 51 | 89.03 | 348.1 | 42.08 | 259.9 | 7.97 | 2189 | Ca-Na-Mg-SO4-HCO3 |
| EWS 7 | 120 | 1.23 | 117 | 30 | 78.98 | 303.9 | 27.94 | 307.5 | 8.07 | 1193 | Ca-Na-SO4-HCO3 |
| EWS 8 | 85 | 1.44 | 99 | 29 | 40.17 | 279.2 | 21.07 | 303.5 | 8.4 | 689 | Ca-Na-Mg-SO4-HCO3 |
| EWS 9 | 55 | 1.06 | 157 | 16 | 43.01 | 95.3 | 17.99 | 133.3 | 7.82 | 358 | Ca-Na-HCO3-SO4 |
| CA 1 | 161 | 1.91 | 487 | 169 | 83.77 | 186.6 | 46.74 | 372.1 | 7.81 | 5605 | Ca-Mg-Na-HCO3 |
| CA 2 | 107 | 1.42 | 202 | 35 | 63.08 | 353.3 | 45.09 | 495.7 | 7.95 | 1061 | Ca-Na-HCO3-SO4 |
| CA 3 | 87 | 1.67 | 251 | 39 | 59.53 | 271.7 | 40.36 | 380.8 | 7.96 | 1059 | Ca-Na-HCO3-SO4 |
| CA 4 | 124 | 1.78 | 213 | 54 | 39.79 | 341.1 | 18.57 | 203.1 | 8.33 | 1508 | Ca-Na-Mg-SO4-HCO3 |
| CA 5 | 53 | 1.07 | 81 | 27 | 22.47 | 315 | 16.03 | 295 | 8.12 | 635 | Ca-Na-Mg-SO4-HCO3 |
| CA 6 | 106 | 1.13 | 261 | 52 | 33.04 | 299.2 | 17.26 | 372.5 | 8.18 | 1266 | Ca-Na-Mg-SO4-HCO3 |
| CA 7 | 119 | 1.99 | 371 | 79 | 47.18 | 377 | 20.55 | 216.7 | 8.13 | 1612 | Ca-Mg-Na-SO4 |
| CA 8 | 144 | 2.16 | 267 | 145 | 47.93 | 418.4 | 20.19 | 287.7 | 8.52 | 3016 | Ca-Mg-Na-SO4-HCO3 |
| RW | 70 | 1.13 | 11 | 38 | 40.93 | 119.4 | 15.17 | 246.1 | 8.42 | 662 | Mg-Na-HCO3-SO4 |
| DW | 18 | 1.04 | 15 | 9 | 39.89 | 87.82 | 13.89 | 211 | 8.2 | 248 | HCO3-SO4-Cl |
| Sample Id | EC25 at 25 °C (dS/m) | SAR | %Na | MH (%) |
|---|---|---|---|---|
| EWS 1 | 0.7 | 0.943 | 18.84 | 25.12 |
| EWS 2 | 0.662 | 1.201 | 24.42 | 24.12 |
| EWS 3 | 0.836 | 0.793 | 14.95 | 16.37 |
| EWS 4 | 0.824 | 1.052 | 20.86 | 19.75 |
| EWS 5 | 0.937 | 1.751 | 33.41 | 31.34 |
| EWS 6 | 3.07 | 1.906 | 23.59 | 22.14 |
| EWS 7 | 7.684 | 2.561 | 38.5 | 29.72 |
| EWS 8 | 0.967 | 1.933 | 33.42 | 32.61 |
| EWS 9 | 0.923 | 1.117 | 20.66 | 14.43 |
| CA 1 | 7.68 | 1.601 | 15.47 | 36.4 |
| CA 2 | 1.489 | 1.826 | 26.35 | 22.22 |
| CA 3 | 1.485 | 1.348 | 19.33 | 20.39 |
| CA 4 | 2.114 | 1.964 | 26.28 | 29.46 |
| CA 5 | 0.89 | 1.306 | 26.86 | 35.46 |
| CA 6 | 1.776 | 1.567 | 21.01 | 24.74 |
| CA 7 | 2.26 | 1.465 | 17.13 | 25.99 |
| CA 8 | 4.23 | 1.762 | 19.83 | 47.25 |
| RW | 0.929 | 2.242 | 45.04 | 85.05 |
| DW | 0.348 | 0.904 | 33.91 | 49.66 |
| Sample Code | Na+/Cl− | Na+/Na+ + Cl− | CAI1 | CAI2 |
|---|---|---|---|---|
| EWS1 | 4.897 | 0.830 | −3.974 | −0.189 |
| EWS2 | 4.189 | 0.807 | −3.245 | −0.150 |
| EWS3 | 0.436 | 0.304 | 0.551 | 0.244 |
| EWS4 | 5.649 | 0.850 | −4.730 | −0.163 |
| EWS5 | 2.432 | 0.709 | −1.456 | −0.174 |
| EWS6 | 2.339 | 0.700 | −1.355 | −0.282 |
| EWS7 | 2.341 | 0.701 | −1.354 | −0.257 |
| EWS8 | 3.274 | 0.766 | −2.310 | −0.236 |
| EWS9 | 1.975 | 0.664 | −1 | −0.275 |
| CA1 | 2.966 | 0.748 | −1.987 | −0.443 |
| CA2 | 2.612 | 0.723 | −1.635 | −0.181 |
| CA3 | 2.25 | 0.692 | −1.274 | −0.172 |
| CA4 | 4.813 | 0.828 | −3.857 | −0.404 |
| CA5 | 3.667 | 0.786 | −2.714 | −0.147 |
| CA6 | 4.957 | 0.832 | −3.989 | −0.296 |
| CA7 | 3.895 | 0.796 | −2.932 | −0.334 |
| CA8 | 4.637 | 0.823 | −3.681 | −0.363 |
| Minimum | 0.436 | 0.304 | −4.730 | − 0.443 |
| Maximum | 5.649 | 0.850 | 0.551 | 0.244 |
| Average | 3.372 | 0.739 | −2.408 | −0.225 |
Publisher’s Note: MDPI stays neutral with regard to jurisdictional claims in published maps and institutional affiliations. |
© 2021 by the authors. Licensee MDPI, Basel, Switzerland. This article is an open access article distributed under the terms and conditions of the Creative Commons Attribution (CC BY) license (http://creativecommons.org/licenses/by/4.0/).
Share and Cite
Gebrehiwet, M.; Tafesse, N.T.; Habtu, S.; Alemaw, B.F.; Laletsang, K.; Lasarwe, R. The Contribution of Groundwater to the Salinization of Reservoir-Based Irrigation Systems. Agronomy 2021, 11, 512. https://doi.org/10.3390/agronomy11030512
Gebrehiwet M, Tafesse NT, Habtu S, Alemaw BF, Laletsang K, Lasarwe R. The Contribution of Groundwater to the Salinization of Reservoir-Based Irrigation Systems. Agronomy. 2021; 11(3):512. https://doi.org/10.3390/agronomy11030512
Chicago/Turabian StyleGebrehiwet, Michiele, Nata T. Tafesse, Solomon Habtu, Berhanu F. Alemaw, Kebabonye Laletsang, and Reneilwe Lasarwe. 2021. "The Contribution of Groundwater to the Salinization of Reservoir-Based Irrigation Systems" Agronomy 11, no. 3: 512. https://doi.org/10.3390/agronomy11030512