Article

Yield Assessment of Maize Varieties under Varied Water Application in Semi-Arid Conditions of Southern Mozambique

1
Departamento de Engenharia Rural, Faculdade de Agronomia e Engenharia Florestal, Universidade Eduardo Mondlane, Maputo 257, Mozambique
2
Department of Agricultural Research Services, Kasinthula Research Station, Chikwawa P.O. Box 28, Malawi
3
Department of Soil Science, School of Agricultural Sciences, University of Zambia, Lusaka P.O. Box 32379, Zambia
*
Authors to whom correspondence should be addressed.
Agronomy 2021, 11(12), 2541; https://doi.org/10.3390/agronomy11122541
Submission received: 16 October 2021 / Revised: 2 November 2021 / Accepted: 2 November 2021 / Published: 14 December 2021

Abstract

:
Maize is one of the most important staple food crops in Mozambique. Its production is country-wise dominated by smallholder farmers (more than 90%) under rain-fed conditions, where the risk of crop failure is high, especially under semi-arid conditions in southern Mozambique. Several maize genotypes have been developed for the broad agro-ecological zone adaptation but lack strong evidence about their productivity and yield stability to support decision-making in farming systems. In order to assess the yield and yield stability of maize genotypes under different environments, five identical on-station trials were implemented in the period 2017 to 2019, covering summer and winter seasons in the semi-arid region of southern Mozambique. The trials were established at the experimental station of the Universidade Eduardo Mondlane (UEM) in Sábie and at the Instituto de Investigação Agrária de Moçambique (IIAM) in Chókwe. A strip-plot design in a randomized complete block arrangement with 15 maize genotypes, and three water application (rainfall plus irrigation) levels in four replications was followed in a line-source irrigation arrangement. The water application levels varied from 151 mm to 804 mm, covering different water regimes. Under well-watered summer conditions, the genotypes G6 and G12 showed high yield and high grain yield stability. In the drier conditions, either in summer or winter, the G2 and G11 genotypes produced higher grain yield but with low stability. Both groups of genotypes have a high potential to be included in technology transfer packages to smallholder farmers to address food security or large-scale commercial farmers differently.

1. Introduction

Maize productivity in the Southern Africa Development Community (SADC) region is among the lowest globally [1], and Mozambique is one among the tail end. At present, the average yield of maize crops in Mozambique is stagnant at approximately 1.0 ton ha−1 [2,3]. Water shortage and poor water management are among the main constraints for good maize production in different agro-ecological environments. Although maize is the second most important staple food crop to cassava in Mozambique, it is more than 90% dominated by rain-fed agriculture and smallholder farmers country-wide [2]. Additionally, the risk of crop failure is more than 50% under the rain-fed cropping conditions and a predominantly semi-arid climate in most areas of southern Mozambique [4]. Therefore, these important challenges triggered the idea of identifying suitable genotypes for a specific environment and disseminating water management techniques that increase maize grain yield per volume of water. It was hypothesized that appropriate water management and genotype selection would save water while increasing grain yield and stability.
Potential options for improving crop water productivity on maize are likely to succeed if the water supply and nutrient management are combined [5]. Even so, efficient water management strategies in maize production are also limited by the lack of information on suitable maize genotypes to avoid or tolerate stress due to limited water supply. Several maize genotypes have been developed for the broad agro-ecological zone adaptation in Mozambique. Still, they lack strong evidence about their productivity and yield stability to support-farming systems, and water management decision-making process.
Several studies have been conducted to assess the productivity and stability of maize genotypes under different environmental conditions, also known as a multi environmental trial (MET). The criterion commonly used to evaluate the performance of the genotypes, the “which won where?” allows identification of the best performing genotypes for which environment or group of environments (mega-environment) [6,7,8]. In this way, the better-off genotypes combine superior yield and higher stability across environments [9,10].
Nevertheless, the genotype response is influenced by both the environment and genotype-environment interaction (GEI), demanding well-elaborated identification of the winning genotype [11,12,13]. Several models—such as joint regression analysis, multivariate clustering techniques [12,14,15], the additive main effect and multiplicative interaction (AMMI) [6,16,17], and genotype and genotype-environment (GGE) [18] biplots—are used to assess GEI in MET. AMMI and GGE biplot are the commonly used to assess MET data and the selection of the better-off genotypes per environment or mega-environment integrating principal component (PC) analysis [11,16,19,20,21,22]
This study aimed at assessing the grain yield and yield stability of maize genotypes under different cropping seasons and water supply in semi-arid conditions. It was expected that the findings would contribute to farmers’ information on suitable maize genotypes options for their specific environment and cropping conditions such as rain-fed under full or supplemental irrigation.

2. Materials and Methods

Five on-station trials with identical experimental settings and trial management were implemented in 2017 to 2019, covering wet and dry seasons in the semi-arid region of southern Mozambique. Two on station trials were conducted at the Estação Agrária de Chókwè of Instituto de Investigação Agrária de Moçambique (24°30′07″ S; 33°00′03″ E) and other three at the Centro de Desenvolvimento Agrário do Sábie of Universidade Eduardo Mondlane (25°19′12″ S; 32°16′58″ E).
The average annual rainfall was 650 mm/year for Chókwè [23] and 580 mm/year for Sábie [24]. In Chókwè, the mean annual temperature was 23.6 °C, with an average minimum of 10.9 °C in July and an average maximum of 33.7 °C in January [25]. In Sábie, average annual temperature was 23 °C, with a minimum of 11 °C in June and July, and a maximum of 34 °C in December and January [24]. The rainfall has a unimodal pattern for both sites, with a higher concentration between December and February, about 88% of the total annual rainfall. The soil texture of the trial site in Sábie is loamy sand [24,26] and a clay texture in Chókwe [27].
The trials followed a strip-plot design in a randomized complete block arrangement with four replicates per site. The maize genotypes were taken as main treatments and the water regime (water supply) per cropping season as sub-treatment. Treatment and sub-treatment plot sizes were 18 × 3.2 m and 2 × 3.2 m, respectively.
The line source sprinkler approach [28] was used to create different water regime strips per cropping season (sub-treatments) varying from a higher application (close to the sprinkler line) through an intermediate application (halfway from the sprinkler line) to rain-fed conditions (far from the reach of the sprinkler). The sub-treatments closer to the line-source sprinkler (well-watered) received 3.50 mm h−1 to 3.75 mm h−1, and the water received in the intermediate application (moderately-watered) sub-treatment strips were 23% to 27% less compared to the higher application. The sub-treatments under rain-fed conditions were considered to be poorly-watered. The measuring strips representing water regimes were separated by 5.5 m in order to ensure application of different amounts and the water application per event was moderate to avoid run-off. The trials set up, selected planting dates, and water management using the line source sprinkler were intended to represent the different environments described in Table 1.
The planting dates were selected to cover both winter and summer cropping seasons. The cumulative water use (irrigation plus rainfall) from different irrigation strips were used to set up the different watering regimes—i.e., well-watered, moderately-watered, and rain-fed conditions. Irrigation plus rainfall intervals for each environment (Table 1) resulted from a multi-year variation of rainfall in both experimental sites.
At the starting of the trials in both sites, land preparation was done by disc ploughing followed by harrowing powered by a tractor. In the following cropping seasons, land preparation consisted of stover and grass removal using a hand-hoe. Among the commonly commercialized maize genotypes in Mozambique, 15 genotypes were used in the trials, with 5 open-pollinated and 10 hybrid (Table 2). The maize was sown at 0.8 × 0.25 m spacing, and simultaneously, NPK (12:24:12) basal fertilizer was applied at the rate of 30 kg N ha−1, 60 kg P ha−1, and 30 kg K ha−1. Top-dressing with urea (46% N) was applied 30 days after crop emergence (DAE) at a rate of 115 kg N ha−1.
Plots were kept weed and pest free during the experiment using hand-hoe and belt (flubendiamide), respectively, and no signs of diseases were detected. Grain yield from the sample strip was manually harvested at maturity, oven-dried at 70 °C to constant weight. The targeted grain moisture was 12%. Rainfall data was recorded with an automated tipping bucket rain gauge (model TE525WS, Texas Electronics, INC., Houston, TX, USA) in Sábie and at the climatic weather station in Chókwe, all located within 100 m from the experimental sites.
The data analysis was conducted using r-software. A strip-plot ANOVA was performed on grain yield data aiming to verify whether the environments were distinct. The least significant difference (LSD) means comparison test was employed to compare the environments. Both analyses were conducted using the doebioresearch package [29]. PC analysis was employed to assess genotype-environment interactions in AMMI and GGE biplots from metan package for multi-environment trial analysis [30]. AMMI and GGE biplots were intended to evaluate the performance of the genotypes on grain yield and grain yield stability. Additionally, the contribution of the variable environment to the PCs was determined using Factoextra package [31].
AMMI was used to determine the effect of genotype-environment interactions and defined potential mega-environments. The genotype-environment interactions were partitioned in PC1 to PC6, representing the decreasing order of importance of the environment as the source of variance to genotypes grain yield response. Therefore, PC1 and PC2 together would represent the major source of variance. The potential mega-environments were determined using AMMI analysis using the “which won where?” approach [6].
GGE biplots analysis was employed to rank the maize genotypes according to their grain yield and grain yield stability. Prior to the analysis, the factor (grain yield) was scaled in order to take into consideration the differences in genotypes expression, where each value was divided by the standard deviation of its corresponding environment [15,30,31]. The ranking and estimation of grain yield performance and stability of genotypes were performed using average environment coordination (AEC) method combined with the average tester coordinate line [18,32].

3. Results and Discussion

3.1. Analysis of Variance

The strip-plot ANOVA showed that the genotype, environment, and genotype-environment interaction were highly significant (p < 0.001) for maize grain yield (Table 3).
The difference in genotypes reveals variation in their grain yield performances. Similarly, the six tested environments were significantly different, supporting the study’s relevance in addressing such distinct conditions (Figure 1). The strip-plot ANOVA also shows highly significant differences among blocks, as expected, because the trial was conducted as a multi-year and multi-season experiment in two sites. The G: E interaction was highly significant, indicating substantial differences in genotypes responses across environments. Nevertheless, there was a need to assess which genotype performed better in what environment and their stability. Therefore, the variation in grain yield resulting from the environment required a more detailed analysis to identify high-yielding and stable genotypes across environments before recommendation for use by farmers. This is shown in the forthcoming sections with AMMI and GGE biplots analyses.
The effect of environments on the genotype grain yield differed due to water supply and season (Figure 1). As expected, from drier to wetter conditions, there was a positive trend in grain yield. However, grain yield was higher under moderate water supply in the winter season with moderate water supply, while under drier and wetter conditions, higher grain yield was recorded in summer. This result suggests that the low evapotranspiration in winter contributed positively to grain yield in moderately watered environments. Water supply was the limiting factor in drier conditions, and other physiological response factors were relevant for reducing response in the well-watered in winter group.

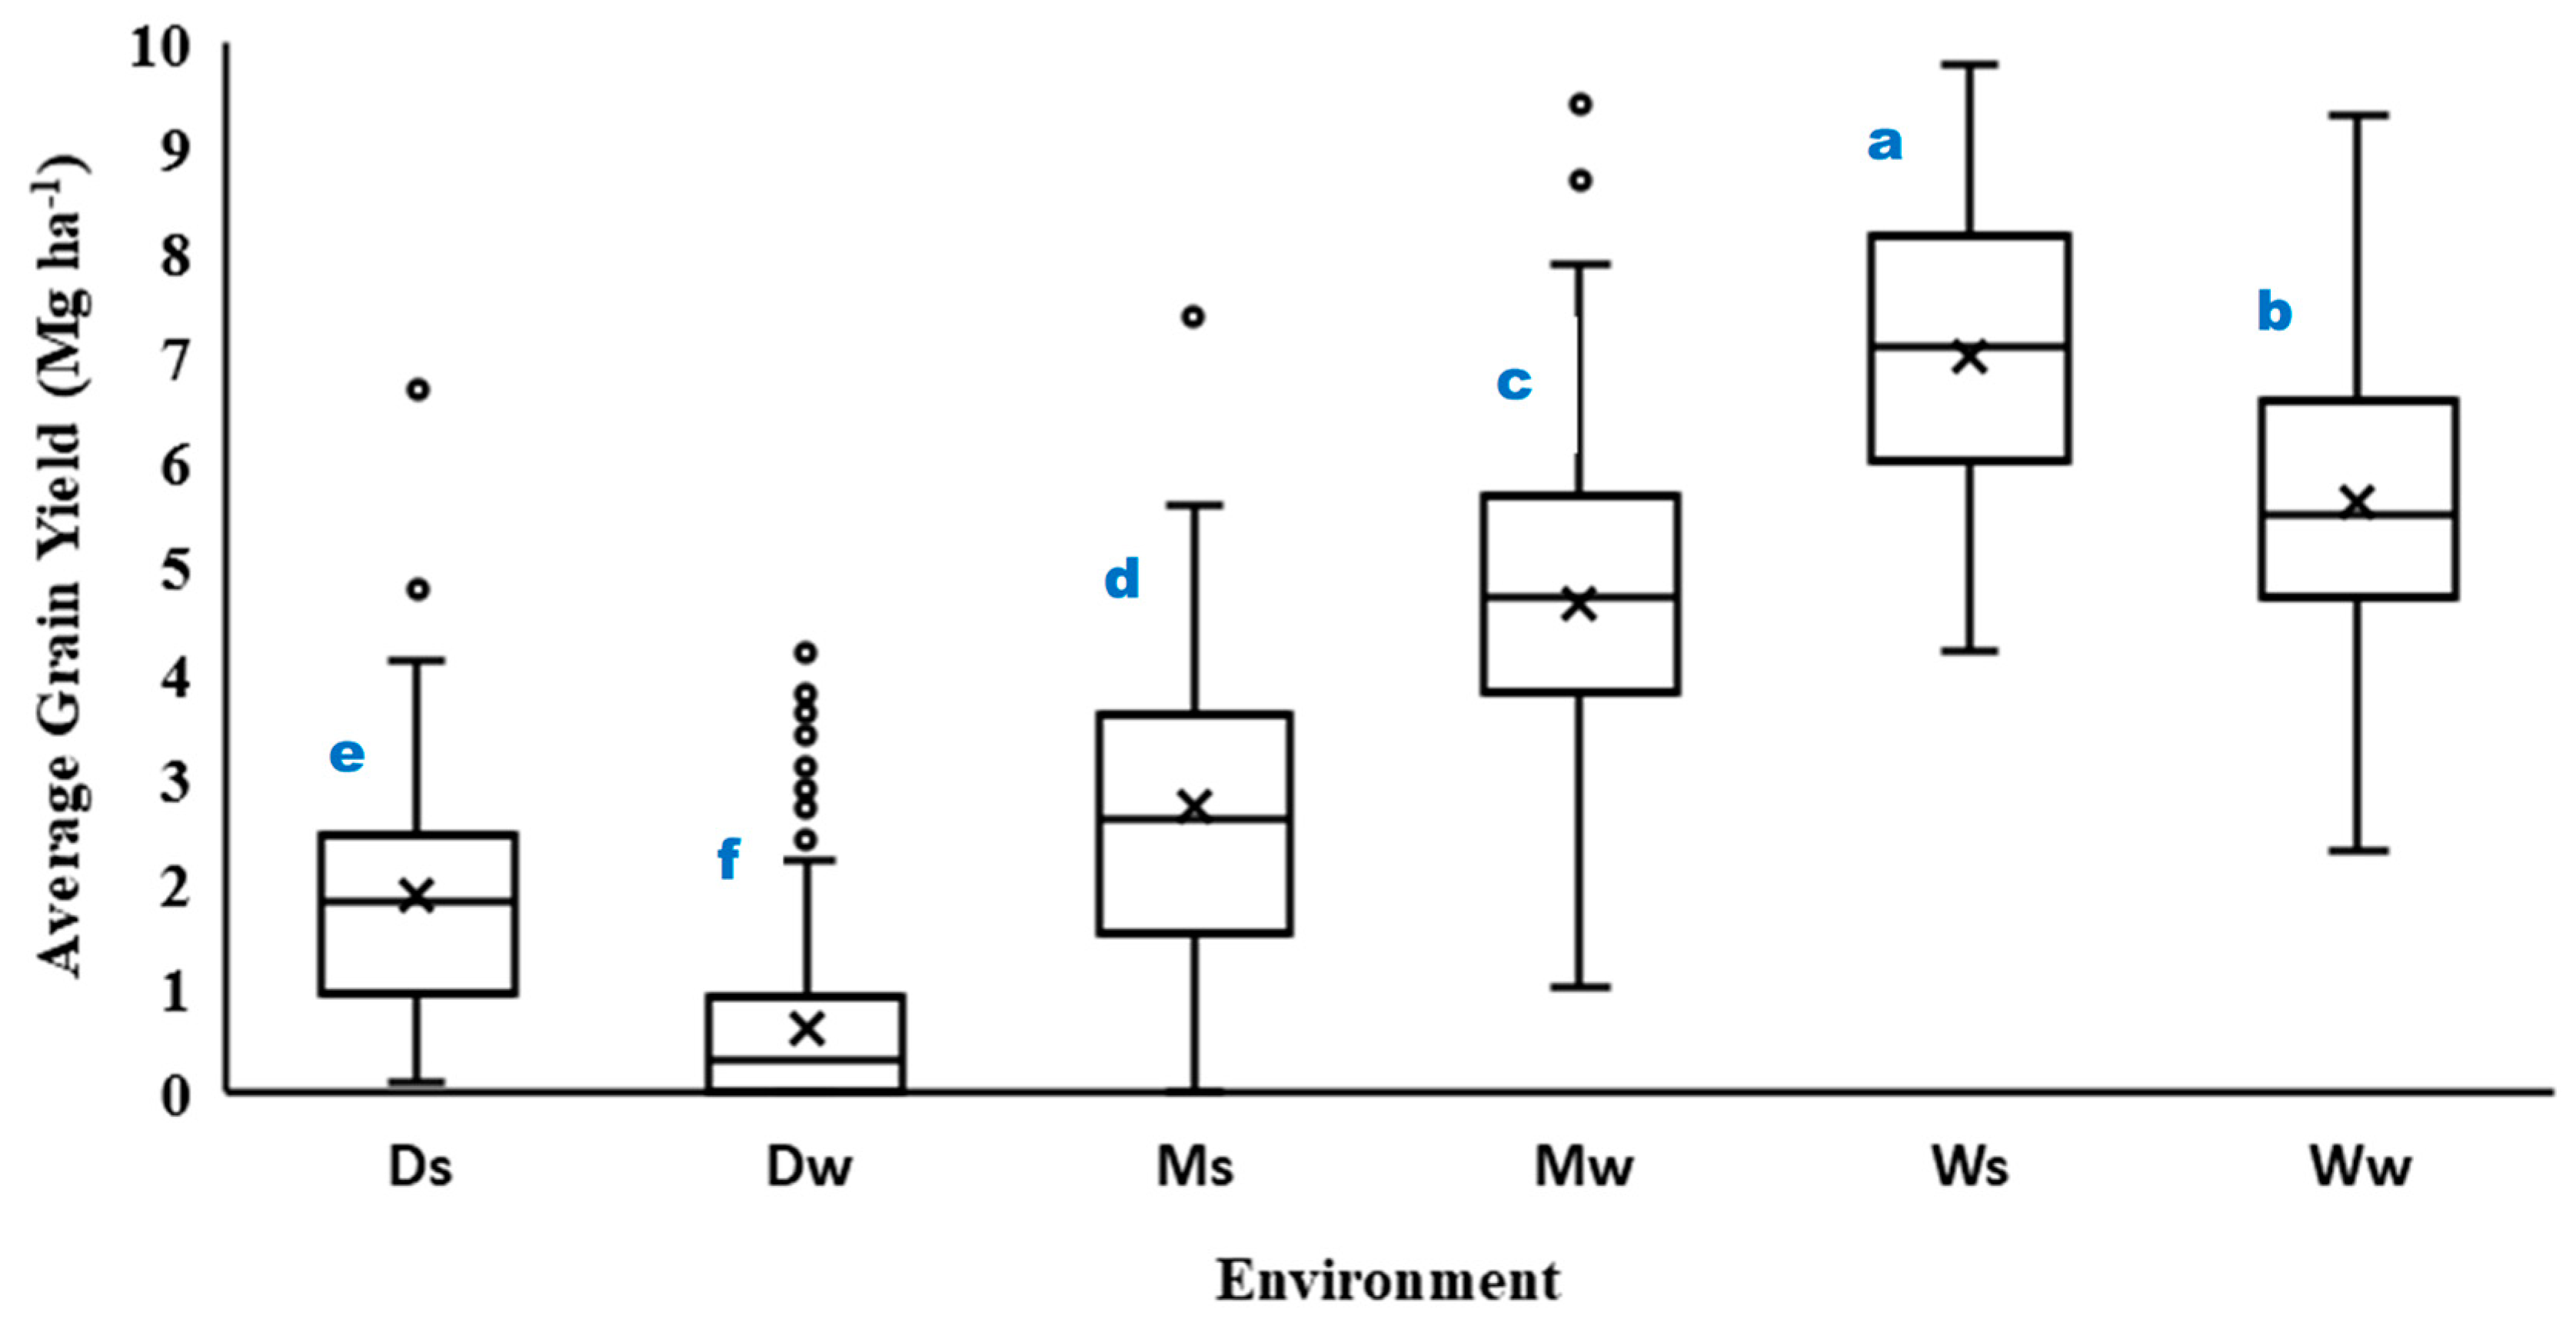
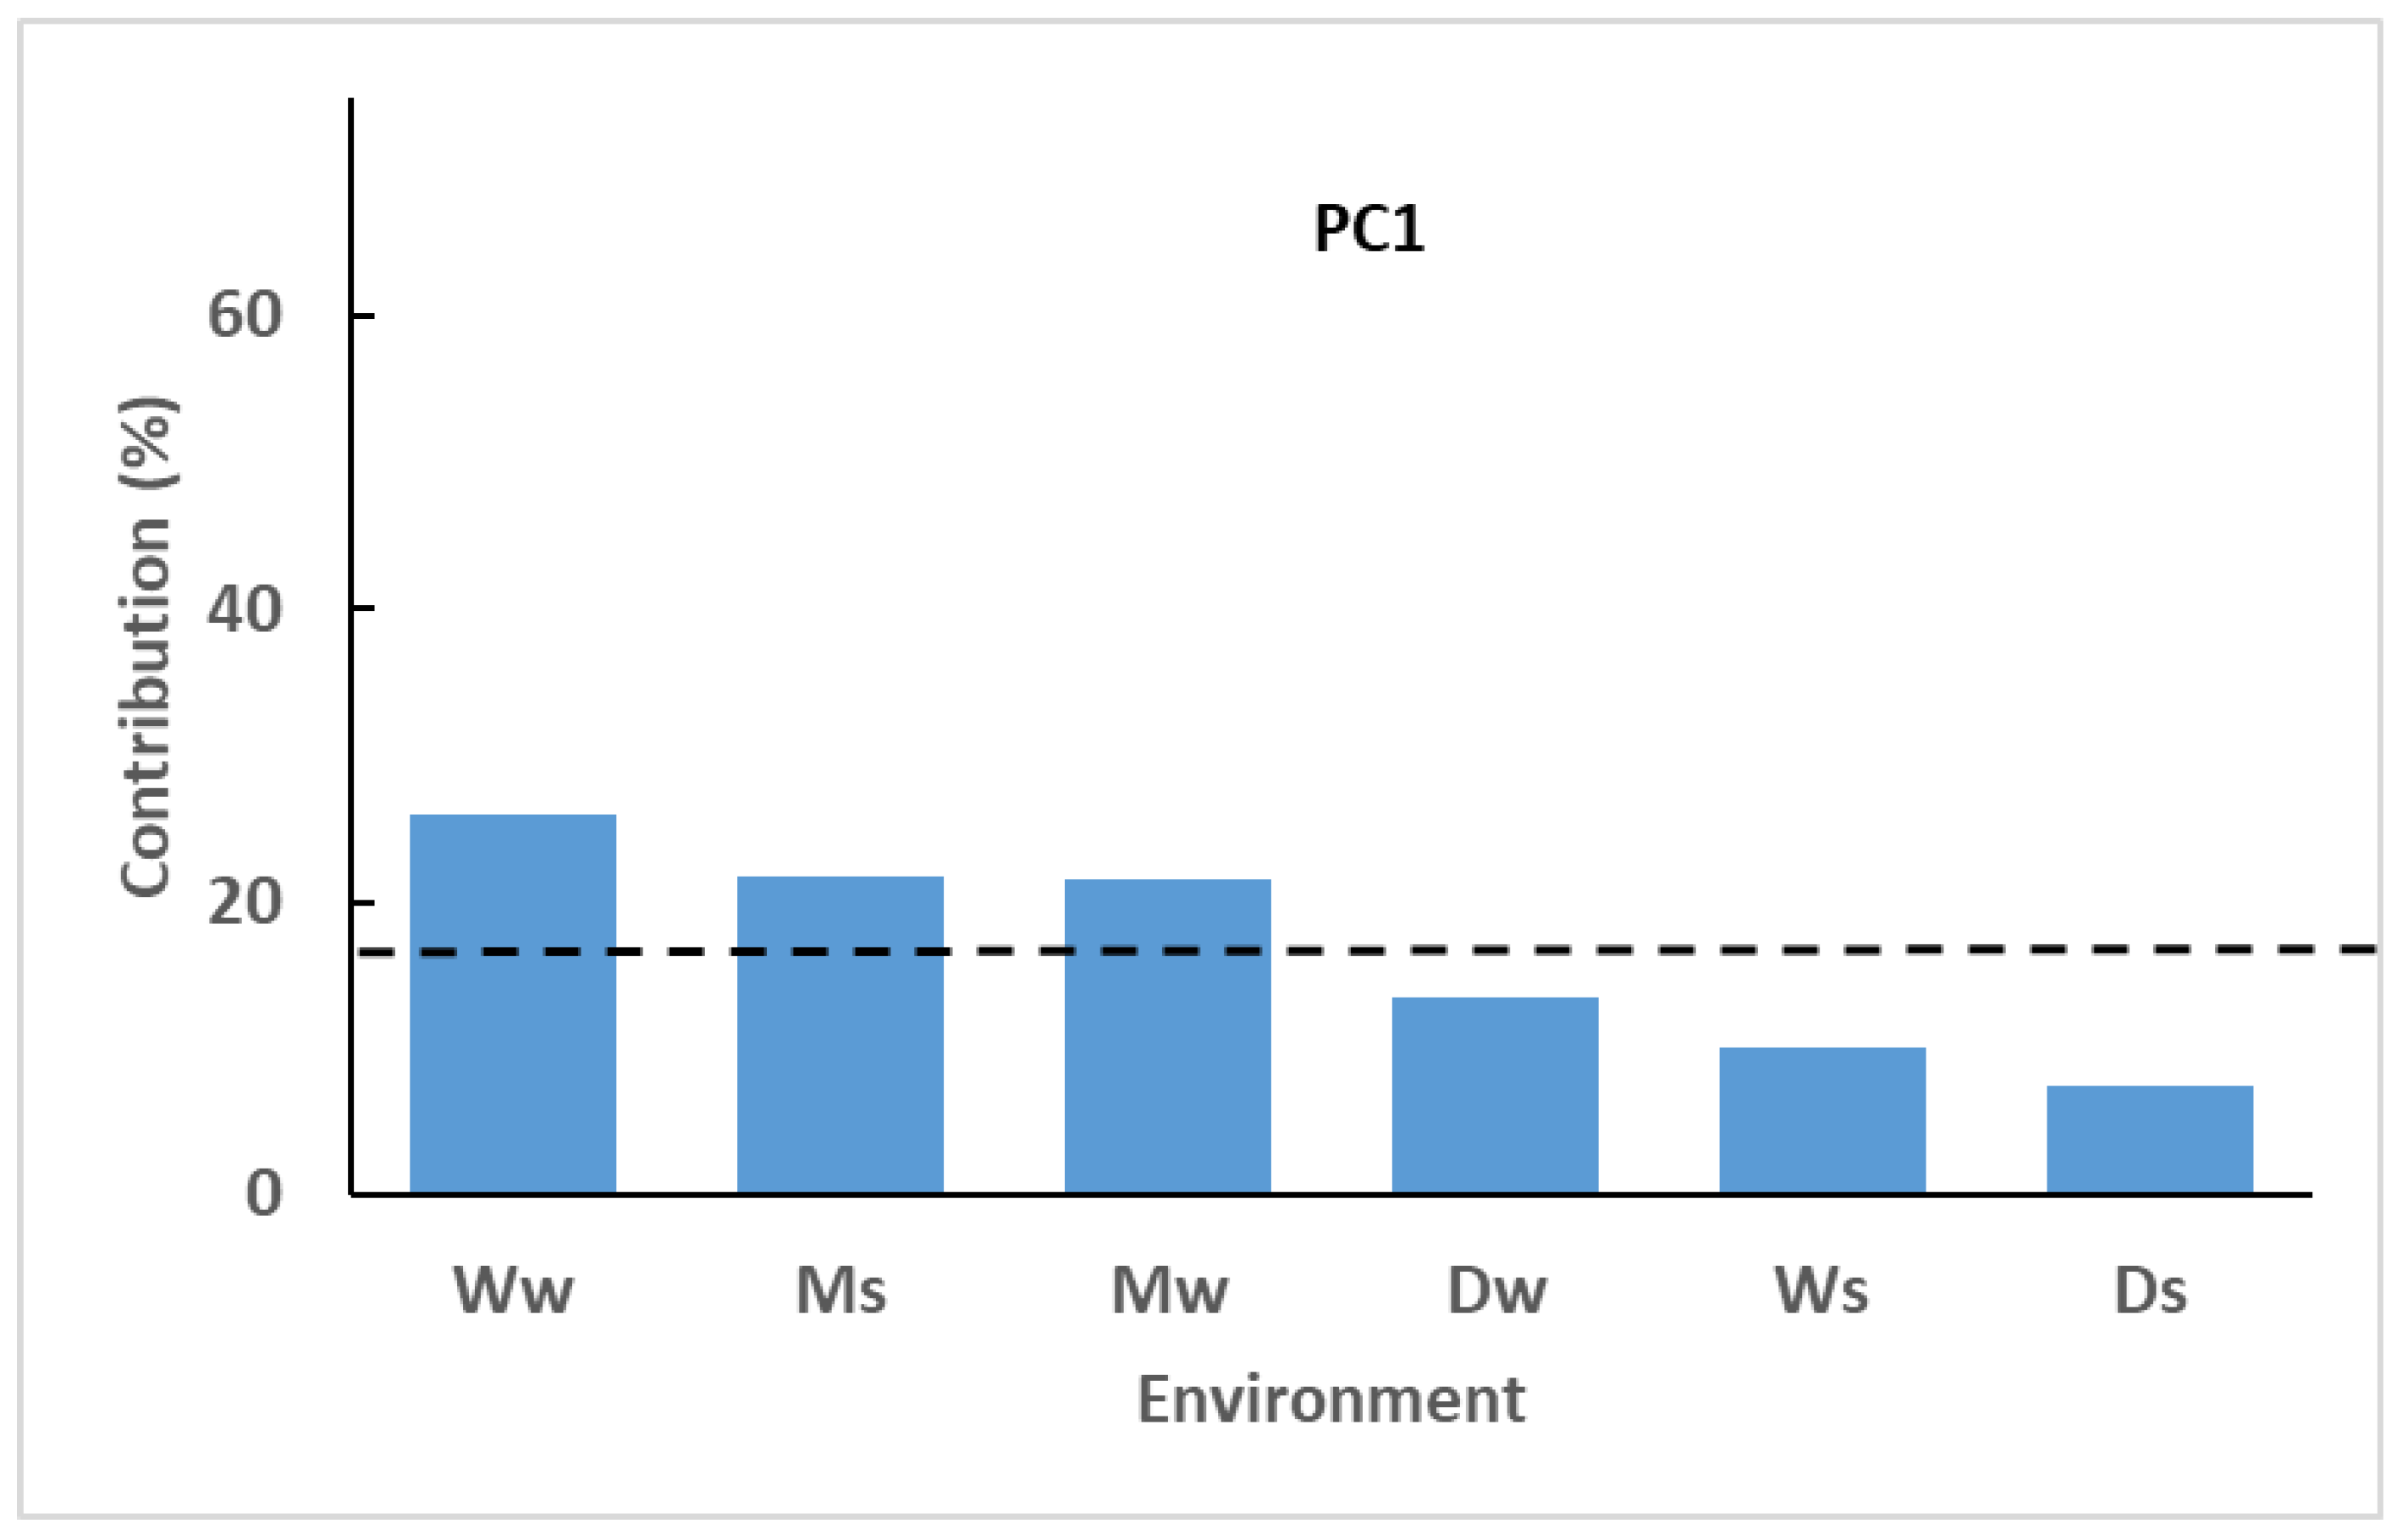
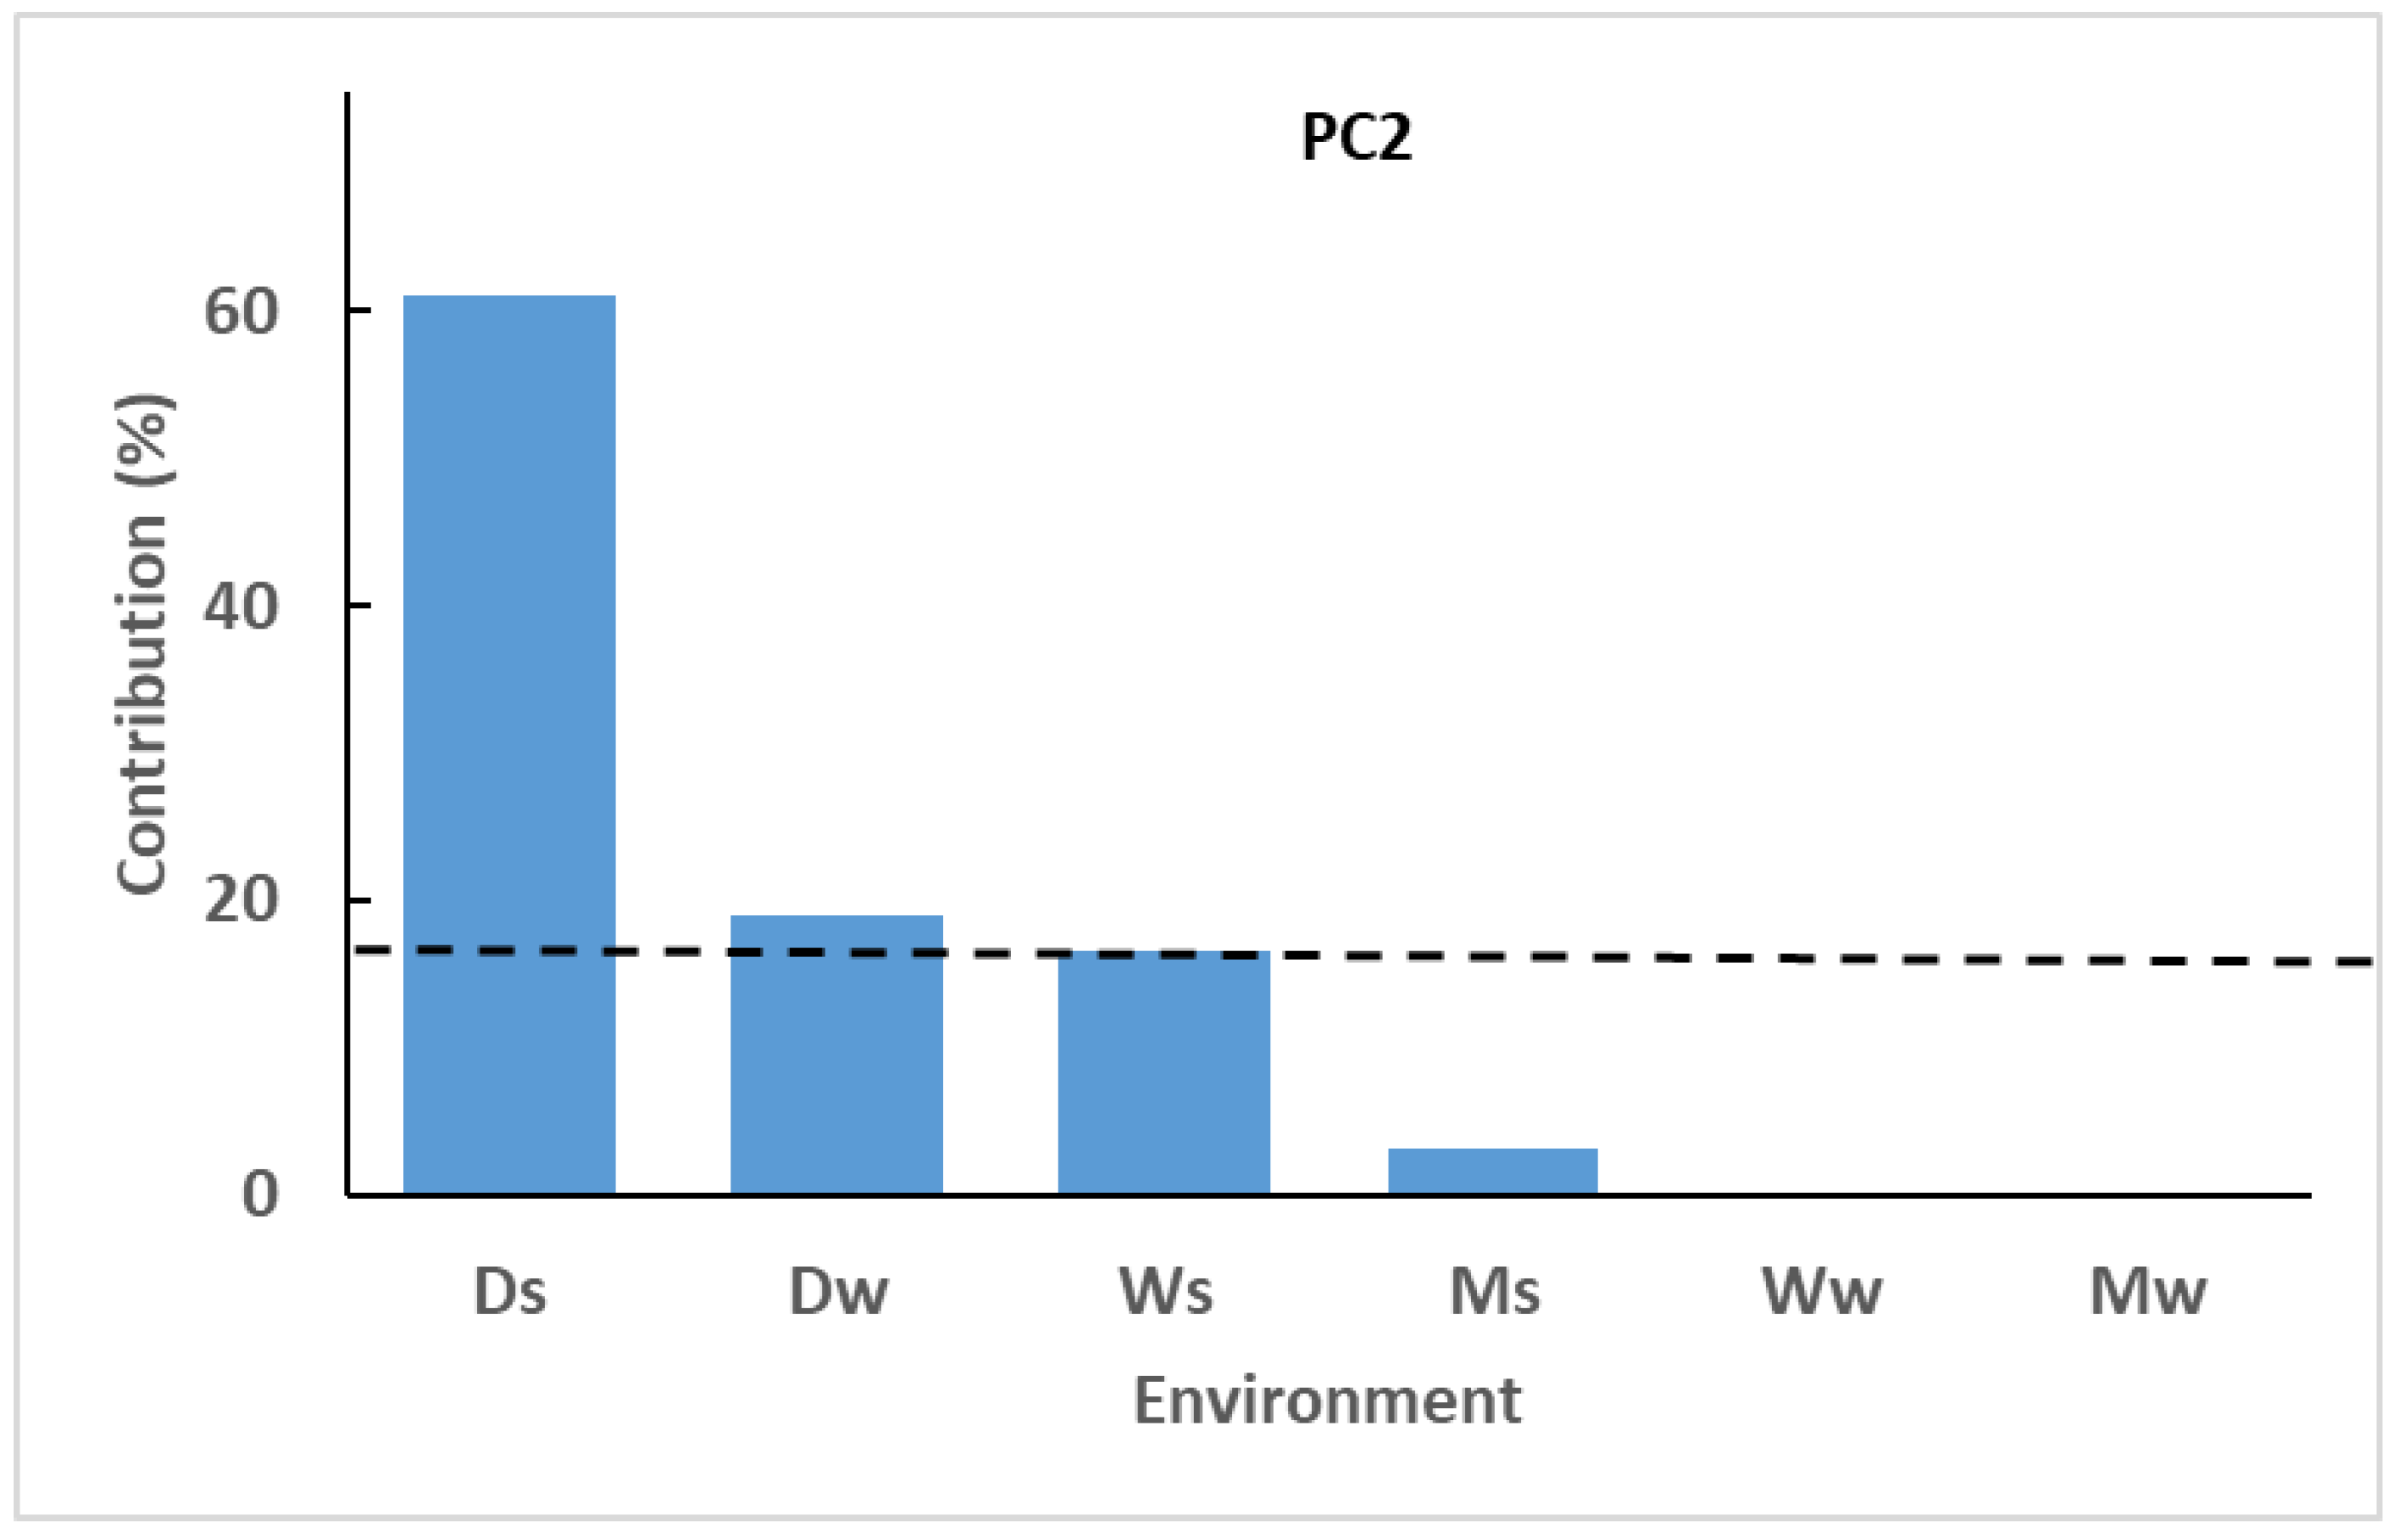
3.2. Relationship among Environments and Genotype Performance

The AMMI2 biplot analysis integrates well the environment similarities to mega-environments, as presented in Figure 2. In this figure, four potential mega-environments are identified and delimited by dashed lines through the biplot origin. The polygons are formed by connecting the markers of genotypes farthest away from the biplot origin such that all genotypes are contained in a given polygon [33]. The “winning” genotypes per mega-environment are located in the vertices of the polygon. Genotypes close to the origin had lower interactions with specific environments. The interactions between genotype and environments are explained by PC analysis, which accounts for 76.6% of the total variation, with PC1 and PC2 contributing for 48.5 and 28.1%, respectively. In this way, it is evident that the first two PCs explain most genotype–environment interactions. As illustrated by [34], the vertex represents the highest yielding genotype. Therefore, the four mega-environments showed that the best genotypes were G13 for the mega-environment Ww; G14 for the mega-environment Ws; G11 and G2 for the mega-environments Ds and Dw; and G8 for the mega-environment Mw and Ms. This shows the relevance of water supply, season, and genotype in grain yield response.
The mega environments shown in Figure 2 reflect the relevance of previously defined factors (water, season, and genotype response). Both Figure 2 and Figure 3 reveal that moderately watered and wet winter environments are mainly correlated with PC1, the drier ones are correlated with PC2, whereas wet summer is weakly correlated with both PCs. This weaker correlation reveals the relevance of the genotype-specific grain yield. As previously shown in Figure 1 and discussed, the effect of environments on the genotype grain yield differed due to water supply and season.

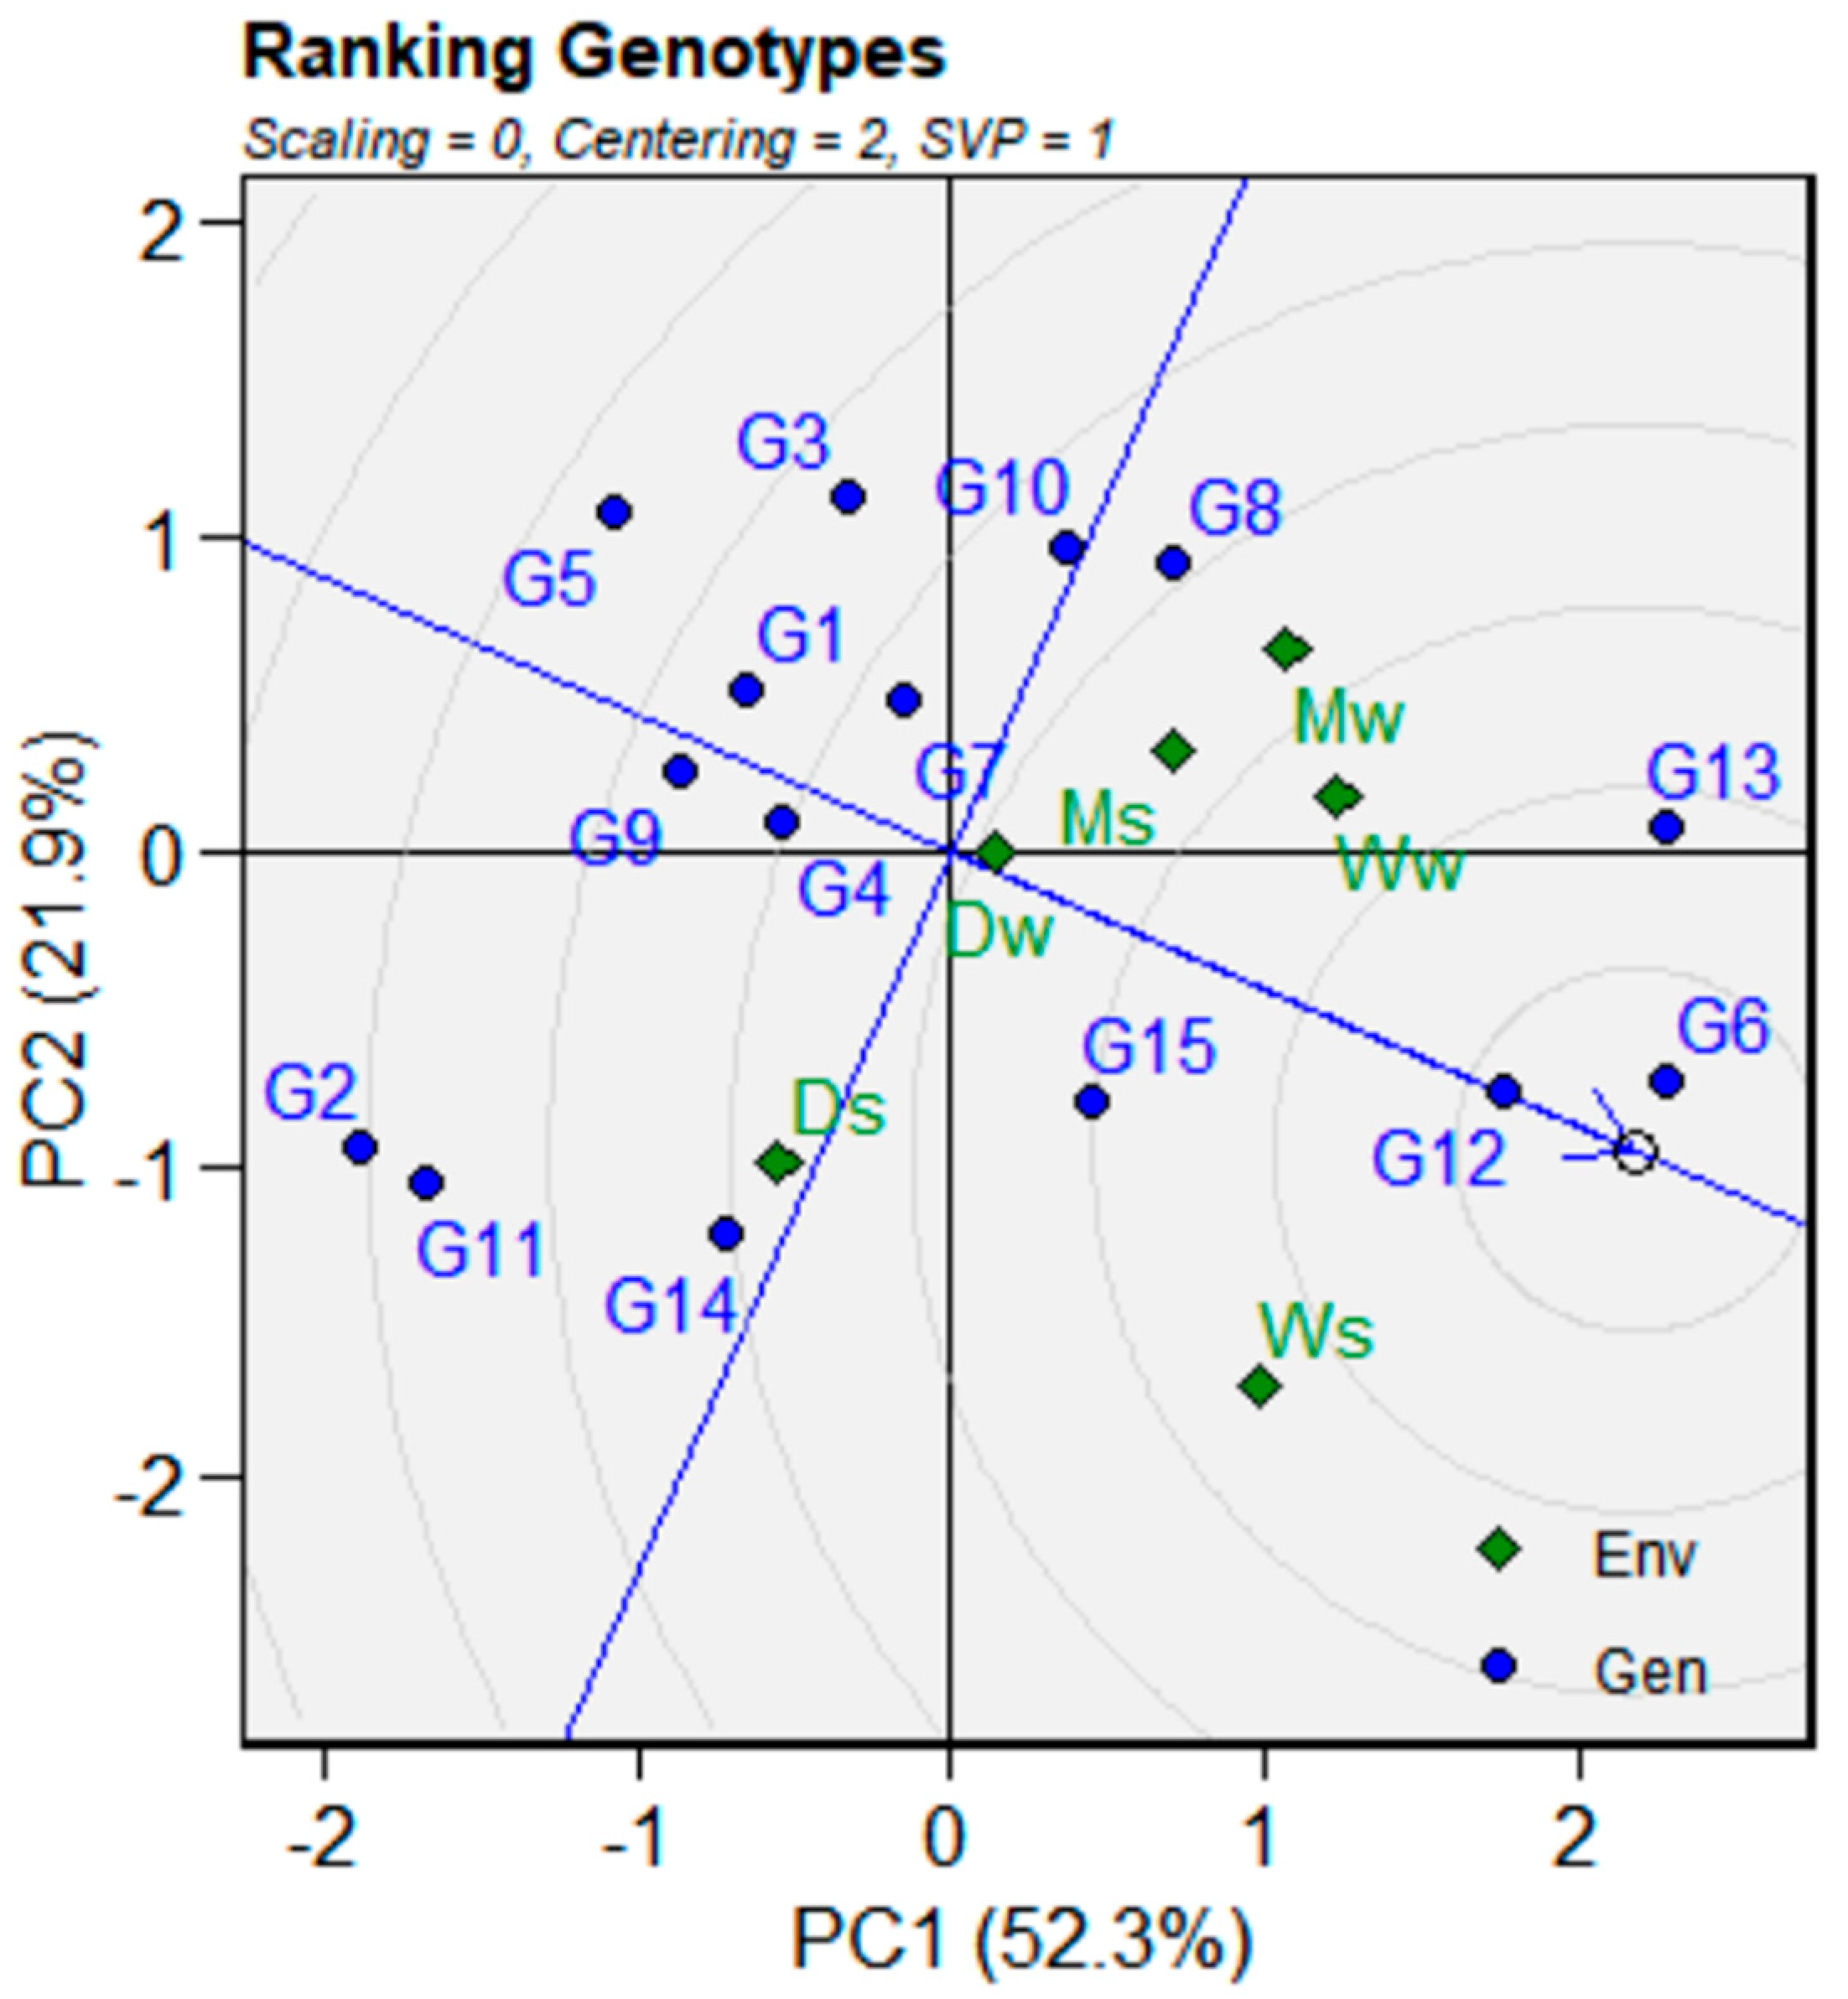
3.3. Ranking the Genotypes and Their Stability

The grain yield and stability of tested genotypes are presented in Figure 4. The average environment coordination (AEC) line ranks the relative performance of the tested genotypes. The AEC line passing through the origin represents the average environmental axis with the arrow pointing out the genotypes’ ideal performance, the center of the concentric circles. The perpendicular line to the AEC through the origin represents the yield stability axis [11,35] so that the length of the line that projects each genotype onto the AEC line indicates its stability. The longer the length, the lower their grain yield stability and vice-versa. Concentric circles determine the distance between the tested genotypes and the hypothetically ideal genotype. Dividing the concentric circles equitably into high, intermediate, and low yields and combined with three equidistance of the average tester coordinate line (high, medium, and low stability); the response of the tested maize genotypes across environments was that (i) high yielding genotypes were G6, G12 (high stability), and G13 (low stability); (ii) the low yielding genotypes were G11, G5, and G2.
In GGE and AMMI2 biplots, PC1 and PC2 explained cumulatively 74.2% and 76.6%, respectively. The difference in the cumulative percentage is due to the different approaches used in the two analyses. The GGE approach uses G plus GE interaction while AMMI separates G from GE in the initial analysis [12,22]. The difference between the two approaches has caused debates among authors, especially on their accuracy. Reference [36] claims that GGE is a direct plot product, while AMMI2 mega-environment analysis cannot be considered a true biplot because it is based on a predicted table for “which won where?” pattern discovery. On the other hand, [37] states that the GGE biplot explains less G + GE than AMMI2 mega-environment analysis.

4. Conclusions

This study assessed the grain yield and yield stability of maize genotypes in different environments. The results showed that suitable genotypes for non-water limiting conditions in semi-arid southern Mozambique were G6 and G12 based on their high yield and stability. However, G2 and G11 genotypes were not stable under water-limiting conditions, despite comparatively high grain yield compared with all other assessed maize genotypes. While genotypes G2 and G11 have the potential for technology transfer and address food security issues for smallholder farmers traditionally practicing low input rain-fed agriculture. On the other side, large-scale commercial farmers (high input irrigated agriculture) can benefit from the higher productivity of genotypes G6 and G12.

Author Contributions

Conceptualization, I.F., S.F., E.P. and A.N.; Methodology, E.P., S.F. and A.N.; Formal Analysis, A.N. and S.F.; Investigation, A.N., S.F. and A.C.; Resources, I.F., E.P. and S.F.; Data Curation, A.N. and S.F.; Writing—original draft preparation, A.N. and S.F.; Writing—review, A.N., S.F., I.F., A.C. and E.P. All authors have read and agreed to the published version of the manuscript.

Funding

The research was supported by Agricultural Productivity Program for Southern Africa under the project Improving Water Use Efficiency in Maize. World Bank Project ID P094183.

Institutional Review Board Statement

Not applicable.

Informed Consent Statement

Not applicable.

Data Availability Statement

Not applicable.

Acknowledgments

The authors give thanks to Pedro Fato and Egas Nhamucho, members of the maize group at Instituto de Investigação Agrária de Moçambique (IIAM) for assisting on acquisitions and description of maize varieties. They are also grateful to Ramos Sitoe and Miguel Tafula at Universidade Eduardo Mondlane—Centro de Desenvolvimento Agrário de Sábie; Ligia Fernando, Arlindo Mondlane, Filipe Manhique and Antsony Cumba at Estação Agrária de Chókwe—IIAM for their assistance in field management and data collection.

Conflicts of Interest

The authors declare no conflict of interest.

References

  1. Grant, W.; Wolfaardt, A.; Louw, A. Maize Value Chain in the SADC Region; Southern Africa Trade Hub: Gaborone, Botswana, 2012. [Google Scholar]
  2. MINAG. Plano Estratégico para o Desenvolvimento do Sector Agrário–PEDSA 2011–2020; MINAG: Maputo, Moçambique, 2010; Available online: https://papers.ssrn.com/sol3/papers.cfm?abstract_id=2405713 (accessed on 4 November 2021).
  3. Johnson, M.; Benin, S.; You, L.; Diao, X.; Chilonda, P.; Kennedy, A. Exploring Strategic Priorities for Regional Agricultural Research and Development Investments in Southern Africa. SSRN Electron. J. 2014. [Google Scholar] [CrossRef] [Green Version]
  4. Reddy, S.J. Agro-Limate of Mozambique as Relevant to Dry-land Agriculture; Série Terra e Água: Maputo, Mozambique, 1986. [Google Scholar]
  5. Fandika, I.R.; Kadyampakeni, D.; Bottomani, C.; Kakhiwa, H. Comparative response of varied irrigated maize to organic and inorganic fertilizer application. Phys. Chem. Earth Parts A/B/C 2007, 32, 1107–1116. [Google Scholar] [CrossRef]
  6. Gauch, H.G.; Zobel, R.W. Identifying Mega-Environments and Targeting Genotypes. Crop. Sci. 1997, 37, 311–326. [Google Scholar] [CrossRef]
  7. WeiKai, Y. GGE biplot vs. AMMI graphs for genotype-by-environment data analysis. J. Indian Soc. Agric. Stat. 2011, 65, 181–193. [Google Scholar]
  8. Boshev, D.; Jankulovska, M.; KuzManovska, B. Evaluation of Maize Hybrids for Grain Yield Stability under Rainfed and Irrigated Conditions using GGE Biplot Analysis. Bulg. J. Agric. Sci. 2014, 20, 1320–1325. [Google Scholar]
  9. Shrestha, J.; Tripathi, M.P. Grain Yield Stability of Quality Protein Maize Genotypes across Diverse Environments of Terai and Mid Hills in Nepal. Int. J. Agric. Syst. 2014, 2, 113–118. [Google Scholar]
  10. Okoth, S.; Rose, L.J.; Ouko, A.; Netshifhefhe, N.E.I.; Sila, H.; Viljoen, A. Assessing genotype-by-environment interactions in Aspergillus ear rot and pre-harvest aflatoxin accumulation in maize inbred lines. Agronomy 2017, 7, 86. [Google Scholar] [CrossRef] [Green Version]
  11. Haruna, A.; Adu, G.B.; Buah, S.S.; Kanton, R.A.L.; Kudzo, A.I.; Seidu, A.M.; Kwadwo, O.-A. Analysis of genotype by environment interaction for grain yield of intermediate maturing drought tolerant top-cross maize hybrids under rain-fed conditions. Cogent Food Agric. 2017, 3, 1–13. [Google Scholar] [CrossRef]
  12. Neisse, A.C.; Kirch, J.L.; Hongyu, K. AMMI and GGE Biplot for genotype × environment interaction: A medoid–based hierarchical cluster analysis approach for high–dimensional data. Biom. Lett. 2018, 55, 97–121. [Google Scholar] [CrossRef] [Green Version]
  13. Mohammed, A. Genotype by environment interaction and yield stability analysis of open pollinated maize varieties using AMMI model in Afar Regional State, Ethiopia. J. Plant. Breed. Crop. Sci. 2020, 12, 8–15. [Google Scholar] [CrossRef]
  14. Wasala, S.K.; Guleria, S.K.; Sekhar, J.C.; Mahajan, V.; Srinivasan, K.; Parsad, R.; Prasanna, B.M. Analysis of yield performance and genotype environment effects on selected maize (Zea mays) landrace accessions of India. Indian J. Agric. Sci. 2013, 83, 47–53. [Google Scholar]
  15. Al-Naggar, A.M.M.; Shafik, M.M.; Musa, R.Y.M. Genetic Diversity Based on Morphological Traits of 19 Maize Genotypes Using Principal Component Analysis and GT Biplot. Annu. Res. Rev. Biol. 2020, 35, 68–85. [Google Scholar] [CrossRef] [Green Version]
  16. Chimonyo, V.G.; Mutengwa, C.S.; Chiduza, C. Genotype × environment interactions and yield stability of stress-tolerant open-pollinated maize varieties in the Eastern Cape province, South Africa. South. Afr. J. Plant. Soil 2014, 31, 61–68. [Google Scholar] [CrossRef]
  17. Brankovic-Radojcic, D.; Babic, V.; Girek, Z.; Zivanovic, T.; Radojĉic, A.; Filipovic, M.; Srdic, J. Evaluation of maize grain yield and yield stability by AMMI analysis. Genetika 2018, 50, 1067–1080. [Google Scholar] [CrossRef]
  18. Yan, W.; Hunt, L.A.; Sheng, Q.; Szlavnics, Z. Cultivar Evaluation and Mega-Environment Investigation Based on the GGE Biplot. Crop. Sci. 2000, 40, 597–605. [Google Scholar] [CrossRef]
  19. Samonte, S.O.P.; Wilson, L.T.; McClung, A.M.; Medley, J.C. Targeting Cultivars onto Rice Growing Environments Using AMMI and SREG GGE Biplot Analyses. Crop. Sci. 2005, 45, 2414–2424. [Google Scholar] [CrossRef] [Green Version]
  20. Mohammadi, R.; Haghparast, R.; Amri, A.; Ceccarelli, S. Yield stability of rainfed durum wheat and GGE biplot analysis of multi-environment trials. Crop. Pasture Sci. 2010, 61, 92–101. [Google Scholar] [CrossRef]
  21. Kumar, R.; Singode, A.; Chikkappa, G.K.; Mukri, G.; Dubey, R.B.; Komboj, M.C.; Singh, H.C.; Olakh, D.S.; Ahmad, B.; Krishna, M.; et al. Assessment of genotype × environment interactions for grain Yield in maize hybrids in rainfed environments. SABRAO J. Breed. Genet. 2014, 46, 284–292. [Google Scholar]
  22. Hongyu, K.; de Silva, F.L.; de Oliveira, A.C.S.; Sarti, D.A.; de Araujo, L.B.; dos Dias, C.T.S. Comparação entre os modelos AMMI e GGE biplot para os dados de ensaios multi-ambientais. Rev. Brasileira Biometria 2015, 33, 139–155. [Google Scholar]
  23. Kajisa, K.; Payongayong, E. Potential of and constraints to the rice Green Revolution in Mozambique: A case study of the Chokwe irrigation scheme. Food Policy 2011, 36, 615–626. [Google Scholar] [CrossRef]
  24. Chilundo, M.; Joel, A.; Wesström, I.; Brito, R.; Messing, I. Response of maize root growth to irrigation and nitrogen management strategies in semi-arid loamy sandy soil. F. Crop. Res. 2017, 200, 143–162. [Google Scholar] [CrossRef]
  25. Smith, M. CLIMWAT for CROPWAT: A Climatic Database for Irrigation Planning and Management; FAO: Rome, Italy, 1993. [Google Scholar]
  26. Magaia, E.; Famba, S.; Wesström, I.; Brito, R.; Joel, A. Modelling maize yield response to plant density and water and nitrogen supply in a semi-arid region. Field Crop. Res. 2017, 205, 170–181. [Google Scholar] [CrossRef]
  27. Menete, M.Z.L.; van Es, H.M.; Brito, R.M.L.; DeGloria, S.D.; Famba, S. Evaluation of system of rice intensification (SRI) component practices and their synergies on salt-affected soils. Field Crop. Res. 2008, 109, 34–44. [Google Scholar] [CrossRef]
  28. Morgan, D.D.V.; Carr, M.K. V Analysis of Experiments Involving Line Source Sprinkler Irrigation. Exp. Agric. 1988, 24, 169–176. [Google Scholar] [CrossRef]
  29. Popat, R.; Banakara, K. Doebioresearch: Analysis of Design of Experiments for Biological Research. R Package Version 0.1.0. Available online: https://CRAN.R-project.org/package=doebioresearch (accessed on 4 November 2021).
  30. Olivoto, T.; Lúcio, A.D. Metan: An R package for multi-environment trial analysis. Methods Ecol. Evol. 2020, 11, 783–789. [Google Scholar] [CrossRef]
  31. Kassambara, A.; Mundt, F. Factoextra: Extract and Visualize the Results of Multivariate Analyses. R Package Version 1.0.7. Available online: https://cran.r-project.org/web/packages/factoextra/readme/README.html (accessed on 4 November 2021).
  32. Yan, W.; Cornelius, P.L.; Crossa, J.; Hunt, L.A. Two Types of GGE Biplots for Analyzing Multi-Environment Trial Data. Crop. Sci. 2001, 41, 656–663. [Google Scholar] [CrossRef] [Green Version]
  33. Shiri, M.R. Grain yield stability analysis of maize (Zea mays L.) hybrids under different drought stress conditions using GGE biplot analysis. Crop. Breed. J. 2013, 3, 107–112. [Google Scholar]
  34. Yan, W.; Frégeau-Reid, J.; Pageau, D.; Martin, R.; Mitchell-Fetch, J.; Etienne, M.; Rowsell, J.; Scott, P.; Price, M.; de Haan, B.; et al. Identifying Essential Test Locations for Oat Breeding in Eastern Canada. Crop. Sci. 2010, 50, 504–515. [Google Scholar] [CrossRef] [Green Version]
  35. Dhasarathan, M.; Geetha, S.; Karthikeyan, A.; Sassikumar, D.; Meenakshiganesan, N. Development of Novel Blackgram (Vigna mungo (L.) Hepper) Mutants and Deciphering Genotype × Environment Interaction for Yield-Related Traits of Mutants. Agronomy 2021, 11, 1287. [Google Scholar] [CrossRef]
  36. Yan, W.; Kang, M.; Ma, B.; Woods, S.; Cornelius, P.L. AMMI analysis of genotype-by-environment data. Crop. Sci. 2007, 47, 643–653. [Google Scholar] [CrossRef]
  37. Gauch, H.G., Jr.; Piepho, H.-P.; Annicchiarico, P. Statistical Analysis of Yield Trials by AMMI and GGE: Further Considerations. Crop. Sci. 2008, 48, 866–889. [Google Scholar] [CrossRef]
Figure 1. Overall average maize grain yield per environment in southern Mozambique. Ds = Poorly watered in summer; Dw = Poorly watered in winter; Ms = Moderately watered in summer; Mw = Moderately watered in winter; Ws = Well-watered in summer; Ww = Well-watered in winter. Different letters indicate significant differences at 0.1% probability level.
Agronomy 11 02541 g001
Figure 2. Potential mega-environments groupings and performance of maize genotypes in southern Mozambique by polygon method: Ds = Poorly watered in summer; Dw = Poorly watered in winter; Ms = Moderately watered in summer; Mw = Moderately watered in winter; Ws = Well-watered in summer; Ww = Well-watered in winter.
Agronomy 11 02541 g002
Figure 3. Individual contribution of environments to PC1 and PC2. Ds = Poorly watered in summer; Dw = Poorly watered in winter; Ms = Moderately watered in summer; Mw = Moderately watered in winter; Ws = Well-watered in summer; Ww = Well-watered in winter. The dashed lines indicate the expected average contribution, so that all contributors larger than this cut-off are considered as important to the respective component.
Agronomy 11 02541 g003aAgronomy 11 02541 g003b
Figure 4. Genotypes yield comparison with reference to the ‘ideal’ genotype (center of circles) according to the GGE biplot method in southern Mozambique: Ds = Poorly watered in summer; Dw = Poorly watered in winter; Ms = Moderately watered in summer; Mw = Moderately watered in winter; Ws = Well-watered in summer; Ww = Well-watered in winter.
Agronomy 11 02541 g004
Table 1. Description of trial environments (Env) in the semi-arid climate at Chokwe with clay soil and at Sabie with loamy sand soil texture.
Env CodeWater Regime Irr + RCropping SeasonAverage Meteorological Conditions [25]
(mm)ParameterChókweSabie *
WsWell-watered714–804Summer
(October to March)
Total rainfall (mm):
ETo (mm/day):
Minimum temperature (°C):
Maximum temperature (°C):
Sun hours (h):
482
5.1
17.5
33.7
7.0
514
5.2
17.3
34.1
6.8
MsModerately-watered343–659
DsPoorly-watered327–567
WwWell-watered575–707Winter
(April to September)
Total rainfall (mm):
ETo (mm/day):
Minimum temperature (°C):
Maximum temperature (°C):
Sun hours (h):
175
3.1
10.9
30.7
7.2
120
3.6
10.7
31.4
7.4
MwModerately-watered475–690
DwPoorly-watered151–340
Irr: irrigation; R: rainfall; ETo: reference evapotranspiration. Note that, Irr + R variations within the same environment is caused by rainfall. *: average meteorological conditions at Moamba climatic station located about 32 Km from Sabie.
Table 2. Maize varieties assessed for yield in Sábie and Chókwe.
#GenotypeCodeOriginTypeMain TraitMaturity (Days)Potential Yield
(ton ha−1)
Maturity Category
1MatubaG1IIAMOPVFlint, good resistance for Downy mildew and maize streak virus100–1201–6Early
2ChinacaG2IIAMOPVFlint, good resistance for maize streak virus and gray leaf spot, drought resistant and low N110–1202.5–7Medium
3TsanganoG3IIAMOPVFlint, good resistance for maize streak virus and gray leaf spot, drought resistant and low N120–1303–8Medium to late
4GogomaG4IIAMOPVVery susceptible to downy mildew90–1202–5Early
5ZM523G5PhoenixOPVWhite grain, open pollinated variety. maize streak virus, gray leaf spot, Turcicum and Rusts and moderate resistant to downy mildew, drought tolerant. Good under low soil fertility110–1203–7Early
6PAN53G6PANNARHybridFlint, resistant to major leaf diseases including northern leaf blight and maize streak virus, resistant to cob diseases, high yield potential130–14010Medium
7MolócueG7IIAMHybridWhite grain, drought tolerant and good under low soil fertility. Resistant to gray leaf spot, Turcicum and Rusts and moderate resistant to maize streak virus and downy mildew120–1354–9Medium
8SP1G8IIAMhybridWhite grain, drought tolerant and good under low soil fertility. resistant to gray leaf spot, Turcicum and Rusts and moderate resistant to maize streak virus126–1502–10Medium to late
9PRIS 601G9Klein KarroHybridSemi-flint, drought tolerant, resistant to gray leaf spot, maize streak virus, cob rots and has good stability120–1403–10Medium
10PAN 3M-01G10PANNARHybridFlint, resistant to major leaf diseases 1104–6Extra early
11MRI 624G11SygentaHybridSemi dent-like, resistant to major leaf diseases130–14012Medium
12MRI 514G12SygentaHybridSemi dent-like, drought tolerant, resistant to gray leaf spot, resistant to major leaf diseases, maize streak virus and gray leaf spot125–13010Early
13PAN 12G13PANNARHybridFlint, drought tolerant, resistant to major cob and leaf diseases,120–13010Medium
14MRI 744G14SygentaHybridDent-like, resistant to gray leaf spot, resistant to major leaf diseases, maize streak virus, and gray leaf spot140–14512Late
15NamuliG15IIAMHybridFlint, drought tolerant, resistant to major leaf diseases, maize streak virus, and gray leaf spot125–1404–10Late
Source of information: Seed companies (brochures and flyers).
Table 3. Strip-plot analysis of variance for maize genotypes grain yield.
Sources of
Variance
DfSSMSS
Block19215.211.3 ***
Gen14141.210.3 ***
Error A266386.91.5
Env54742.6948.5 ***
Error B35105.83.0
Gen:Env70209.93.0 ***
Error C490475.10.97
*** Significant at 0.1% probability level; Gen = genotype; Env = environment; Gen:Env = genotype × environment interaction.
Publisher’s Note: MDPI stays neutral with regard to jurisdictional claims in published maps and institutional affiliations.

