Article

Morphophysiology, Productivity and Quality of Soybean (Glycine max (L.) Merr.) cv. Merlin in Response to Row Spacing and Seeding Systems

by
Marta Jańczak-Pieniążek
*,
Jan Buczek
,
Dorota Bobrecka-Jamro
,
Ewa Szpunar-Krok
,
Renata Tobiasz-Salach
and
Wacław Jarecki
Department of Crop Production, University of Rzeszów, Zelwerowicza 4 St., 35-601 Rzeszów, Poland
*
Author to whom correspondence should be addressed.
Agronomy 2021, 11(2), 403; https://doi.org/10.3390/agronomy11020403
Submission received: 4 February 2021 / Revised: 19 February 2021 / Accepted: 22 February 2021 / Published: 23 February 2021
(This article belongs to the Special Issue Soybean Breeding, Agronomic Practices, and Production Systems)

Abstract

:
The appropriate row spacing and sowing density of soybeans are the basic non-input and pro-environmental agrotechnical factors. The optimal spacing of plants in the field can be crucial in terms of reducing competition between plants for water, nutrients and light, which is particularly important for photosynthesis and maximizes the use of environmental resources. The field experiment was carried out in the years 2017–2019 at the Experimental Station for Cultivar Assessment in Przecław, Poland, on Merlin cv. soybean plants. The experimental factors were: row spacing of 15 and 30 cm and the sowing density of 70, 90 and 110 pcs. m−2. During the research, the influence of row spacing and sowing density on yielding, seed quality, plant morphological features, nodulation and physiological processes in plants was assessed. The obtained soybean seed yield was not influenced by the experimental factors, but only by the weather conditions prevailing in the research years. The smaller row spacing and sowing density of 15/70 and 30/70 resulted in an increase in the parameters of the yield structure, the number and dry weight of root nodules, as well as the parameters of chlorophyll fluorescence (Fv/Fm, Fv/F0 and PI). Greater plant density per area unit resulted in low yield structure parameters, lower number and dry weight of nodules, poorer parameters of chlorophyll fluorescence and higher protein content in seeds. With the increased sowing density, the plants were higher, the 1st. pod was placed higher and an LAI value was also higher.

1. Introduction

Legumes are among the most promising crops in most European Union countries due to the growing demand for protein-rich food and feed and having a positive impact on soil fertility, which is of ecological and economic importance [1]. One of the strategic legumes cultivated in the world in 95 countries is soybean (Glycine max (L.) Merr.), which in terms of the sown area is the fourth most commonly cultivated species following wheat, rice and maize. The soybean cultivation area in the world in 2019 was 120.5 million ha, while the average yield at that time amounted to 2.77 tha−1 [2]. Soybeans are a valuable source of protein and oil, containing essential free amino acids and fatty acids, as well as other nutrients such as isoflavones, phytosterols and saponins (isoflavone, phytosterol, and saponins) [3,4]. Cultivation of soybean plants does not require large doses of nitrogen, which is possible thanks to the symbiosis of those plants with nodule bacteria (Bradyrhizobium japonicum) present in the root nodules, assimilating atmospheric nitrogen (N2) [5,6]. The productivity of soybeans is determined by the interactions between the selection of the appropriate genotype of a cultivar and the environment and the method of cultivation of that species [7]. Row spacing and sowing density of soybeans have a significant impact on the interspecific and intraspecific competition of plants for soil resources, in particular water and nutrients, and causes morphological changes in plants, in particular their height, branch length and the number of pods that are the main components of the yield [7,8]. Sowing density can influence the yield by modulating the leaf surface reflected in a change in the leaf area index (LAI), light capture and canopy photosynthesis [8,9]. Soybean sowing density can significantly affect the speed of inter-row closure, biomass production and canopy architecture, reduction of disease and weed severity, and the productivity of individual plants [10]. Sobko et al. [11] indicated that the seed yield increased with the sowing density, while the number of pods per plant decreased. According to Cox and Cherney [12], an increase in soybean sowing density also resulted in an increase in the seed yield, as well as an increase in dry weight per 1 m2 and the LAI and the number of pods and seeds per plant. However, from the research of Kozak et al. [13,14] result, that both vegetative and generative development of plants and yield depended mainly on weather conditions and less on the cultivar and sowing density. The row spacing determines the spatial arrangement of plants in the field, which affects the degree of light, water and nutrient consumption, and is an important tool for optimizing plant growth, biomass growth and the yield obtained [15,16]. Cox and Cherney [12] found that the reducing the row spacing increases seed yield and LAI values, and did not show any interaction between row spacing and sowing density. According to De Bruin and Pedersen [17], under favourable humidity conditions, soybeans give higher yield with smaller row spacing, while in drought conditions it yields higher with a larger row spacing. Prusiński and Nowicki [18] obtained the highest yield of soybean cultivated in narrow rows (16 cm) at the highest sowing density, while they did not observe a significant effect of sowing density on the yield of soybean sown in wide rows (32 cm). The use of an appropriate row spacing and sowing density is therefore an important pro-environmental tool that allows us to maximize the obtained seed yield, and thus reduce the costs of soybean production [10,19]. This is an important argument controlling the productivity of this plant, with the uncertainty associated with obtaining satisfactory soybean yields, especially in the conditions of current climate change and the occurrence of unpredictable periods of drought [11]. If we reduce the row spacing and increase seeding density, soybean plants overlap, which reduces the light reaching them and ultimately reduces the photosynthetic rate [20]. Light plays a significant role in photosynthetic capacity by driving force for photosynthesis, but can also affect leaf structure and function [21]. In the case of soybeans, even a slight increase or decrease in light intensity leads to significant changes in photosynthetic properties [22]. With a smaller row spacing and higher sowing densities, mutual shading of soybean plants leads to changes in the spatial structure of the plant population and causes a decrease in the photosynthetic rate. The appropriate row spacing and sowing density in field soybean cultivation can therefore improve the morphometric features of plants and contribute to a better use of light energy, which can improve the photosynthesis process and increase the productivity of this species [20].
The aim of this study is to determine the optimal row spacing and sowing density as well as the impact on productivity, seed quality as well as morphological and physiological yield-generating features of soybean under changing meteorological conditions in the years of study.

2. Materials and Methods

2.1. Experimental Design

A three-year field experiment was conducted in 2017, 2018 and 2019 in Experimental Station for Cultivar Assessment in Przecław (50°110′ N, 21°290′ E, altitude 185 m a.s.l.) near Mielec (Poland). The soybean cv. Merlin (Saatbau Linz, Austria), belonging to the mid-early stage (000++) was used for the research. The experiment was carried out as a two-factor split-plot method with four replications and 24 plots of 19.5 m2 (for sowing) and 16.5 m2 (for harvesting). The BBCH scale (Biologische Bundesanstalt, Bundessortenamtund CHemische Industrie) was given according to Munger et al. [23].The first experimental variable was the row spacing (15 and 30 cm), while the second experimental variable was the diverse plant density (70, 90 and 110 plants per m2). Soybeans were sown in the following variants: row spacing/seeding density: A1 (15/70), B1 (15/90), C1 (15/110) and A2 (30/70), B2 (30/90), C2 (30/110).
The forecrop of soybean in 2017 and 2018 was winter wheat, and in 2019—sugar beet. The soil mineral fertilisation was applied before sowing. The doses of phosphorus, potassium and nitrogen were 35 kg ha−1, 95 kg ha−1 and 30 kg ha−1, respectively. Soybeans were sown to a depth of 3–4 cm. The seeds were originally inoculated with bacteria Bradyrhizobium japonicum. Agrotechnical treatments and the dates of their implementation are presented in Table 1.

2.2. Soil Conditions

The experiment was located in soil originated from clay loam classified as Fluvic Cambisol (CMfv), according to WRB FAO [24]. The soil pH was slightly acidic (in 2018 and 2019) and neutral in 2017. The soil was characterised by high (2017 and 2018) and very high (2019) phosphorus content and average potassium content. Magnesium content was very high in 2017 and 2019, and in 2018 it was high. The content of micronutrients (iron, manganese and copper) was average in all research years, while zinc was average in 2018 and 2019 and low in 2017 (Table 2).

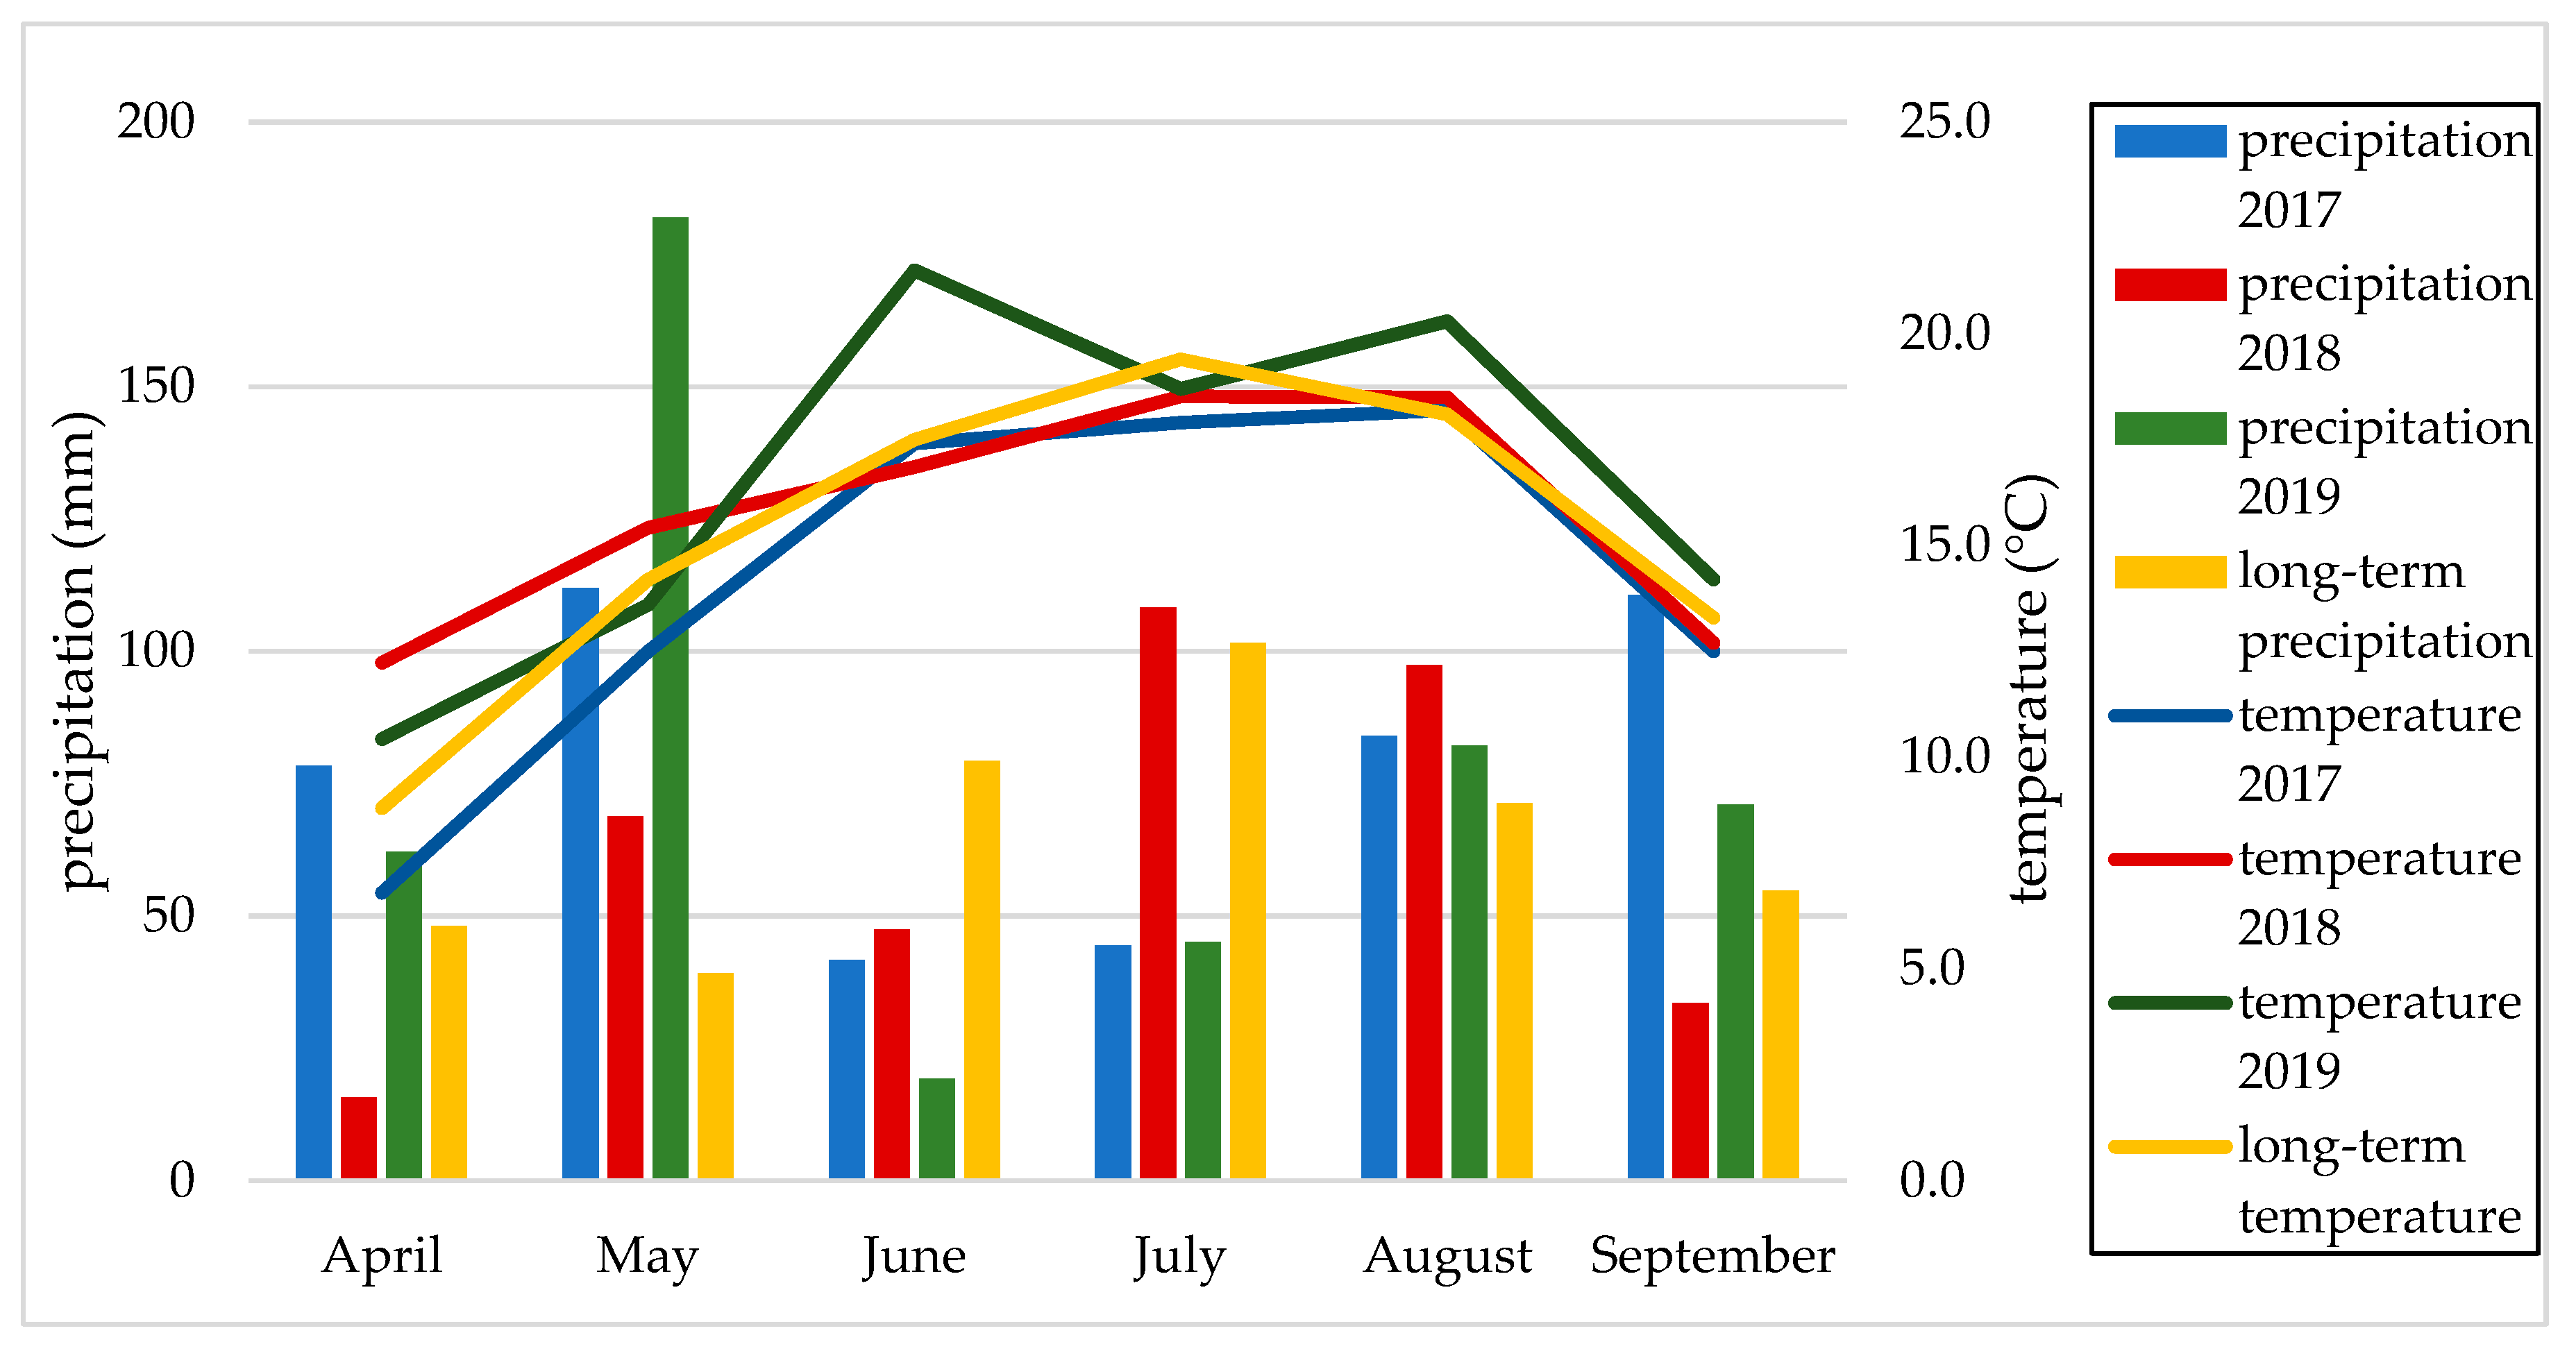
2.3. Weather Conditions

The weather conditions were recorded at the Experimental Station for Cultivar Assessment in Przecław (Figure 1). The characteristics of the growing seasons in terms of water and thermal conditions were assessed on the basis of the Sielianinov (k) hydrothermal coeffcient (Table 3), which was calculated as follows:
k = P 0.1 · Σ t
P—sum of monthly precipitation (mm)
Σt—sum of average daily air temperatures for a given month (°C)
The weather conditions were favourable during the growing season. Only April 2018 and June 2019 were dry, which was reflected in very low values of the hydrothermal coefficient. On the other hand, high rainfall was recorded in May 2019 and September 2017. In those months, the value of the hydrothermal coefficient was the highest. The most favourable hydrothermal conditions were recorded in September 2017 and 2019 and in May 2018. The growing season in the years 2017 and 2019 can be classified as wet, and in 2018—quite dry.

2.4. Physiological Measurements

Physiological measurements on soybean plants were carried out in the morning hours, 3 times during the growing season in the following phases: beginning of flowering (61 BBCH), end of flowering (69 BBCH) and end of pods developing (79 BBCH).

2.4.1. Measuring Relative Chlorophyll Content

Measurements of relative amount of chlorophyll in leaves were conducted using SPAD 502 (Konica-Minolta, Tokyo, Japan) device. SPAD meassurements were made on 20 randomly selected plants.

2.4.2. Measuring Chlorophyll Fluorescence

Measurements of chlorophyll a fluorescence were performed using a fluorometer (Pocket PEA, Hansatech Instruments, King’s Lynn, Norfolk, UK). The fluorescence signal was collected in red actinic light with a peak wavelength of 627 nm light diode source and applied for 1 s at the maximal available intensity of 3500 µmol of photosynthetically active radiation (PAR) m−2 s−1. Fluorescence measurements were carried out on leaves of 4 randomly selected plants, after leaf dark adaptation for 30 min, using leaf clips that were placed on the upper part of the leaf blade, omitting the main vein [26]. The following parameters were analysed in the paper: the maximum quantum yield of photosystem II (PSII), photochemistry (Fv/Fm), the maximum quantum yield of primary photochemistry (Fv/F0), and the performance index (PI).

2.4.3. Measuring Leaf Area Index

Leaf area index (LAI) measurements were performed with the use of an LAI 2000 apparatus (LI-COR, Lincoln, NE, USA). The LAI value was determined in four repetitions by performing one measurement over the canopy and four measurements in the canopy.

2.5. Biometric Measurements

In the flowering phase (65 BBCH), 20 roots were randomly collected from one plot, and then the number and dry weight of nodules were determined. Plant height (cm) was measured from the root crown to the tip of the shoot. In the phase of technical maturity, 20 plants were harvested to measure the number of pods per plant and the number of seeds per pod. The weight of one thousand seeds was determined with an accuracy of 0.1 g. The seeds were harvested in the full maturity phase (89 BBCH). The seed yield obtained from the plots was converted into the yield per 1 ha at 15% humidity.

2.6. Analytical Methods

The protein and fat content of soybeans was determined by near infrared spectroscopy (NIRS) using an MPA FT NIR spectrometer (Bruker, Billerica, MA, USA). Protein yield (PN-EN ISO 20483: 2014-02) and fat (PN-EN ISO 11085: 2015-10) was calculated from the product of the seed yield and the percentage of a given seed component.

2.7. Statistical Analyses

The results of the study were statistically analysed with the analysis of variance (ANOVA), using the statistical software TIBCO Statistica 13.3.0 (TIBCO Software Inc, Palo Alto, CA, USA). Significance of differences between treatments was verified by Tukey’s test, at the significance level of p = 0.05.
The canonical variate analysis (CVA), which is an extension of linear discrimination analysis (LDA) was applied to investigate the differences/similarities between various groups (variants of experiment) [27]. In order to eliminate the collinearity of quantitative variables taken for the analysis, the Spearaman’s rank correlation was used (Table S1). As a result of this procedure, 13 variables with correlations below rho < 0.50 were included in the analysis. These were the variables: seed yield, number of pods per plant, TSW, plant height, number of nodules per plant, oil content, protein yield, LAI (61 and 79 BBCH), SPAD (69 and 79 BBCH), Fv/Fm and Fv/F0 (69 BBCH). The Wilks’ lambda test, Mahalanobis distance and coefficients of standardized canonical variables were performed using the Statistica 13.3.0. Graphical visualization in the form of a biplot was performed using Canoco 5.0 software [28]. For this purpose, Hill scaling was used, which allowed to illustrate the plotted points as the means of clusters (variants of the experiments), and the distance between them as the Mahalanobis distances [29] (Table S2).

3. Results and Discussion

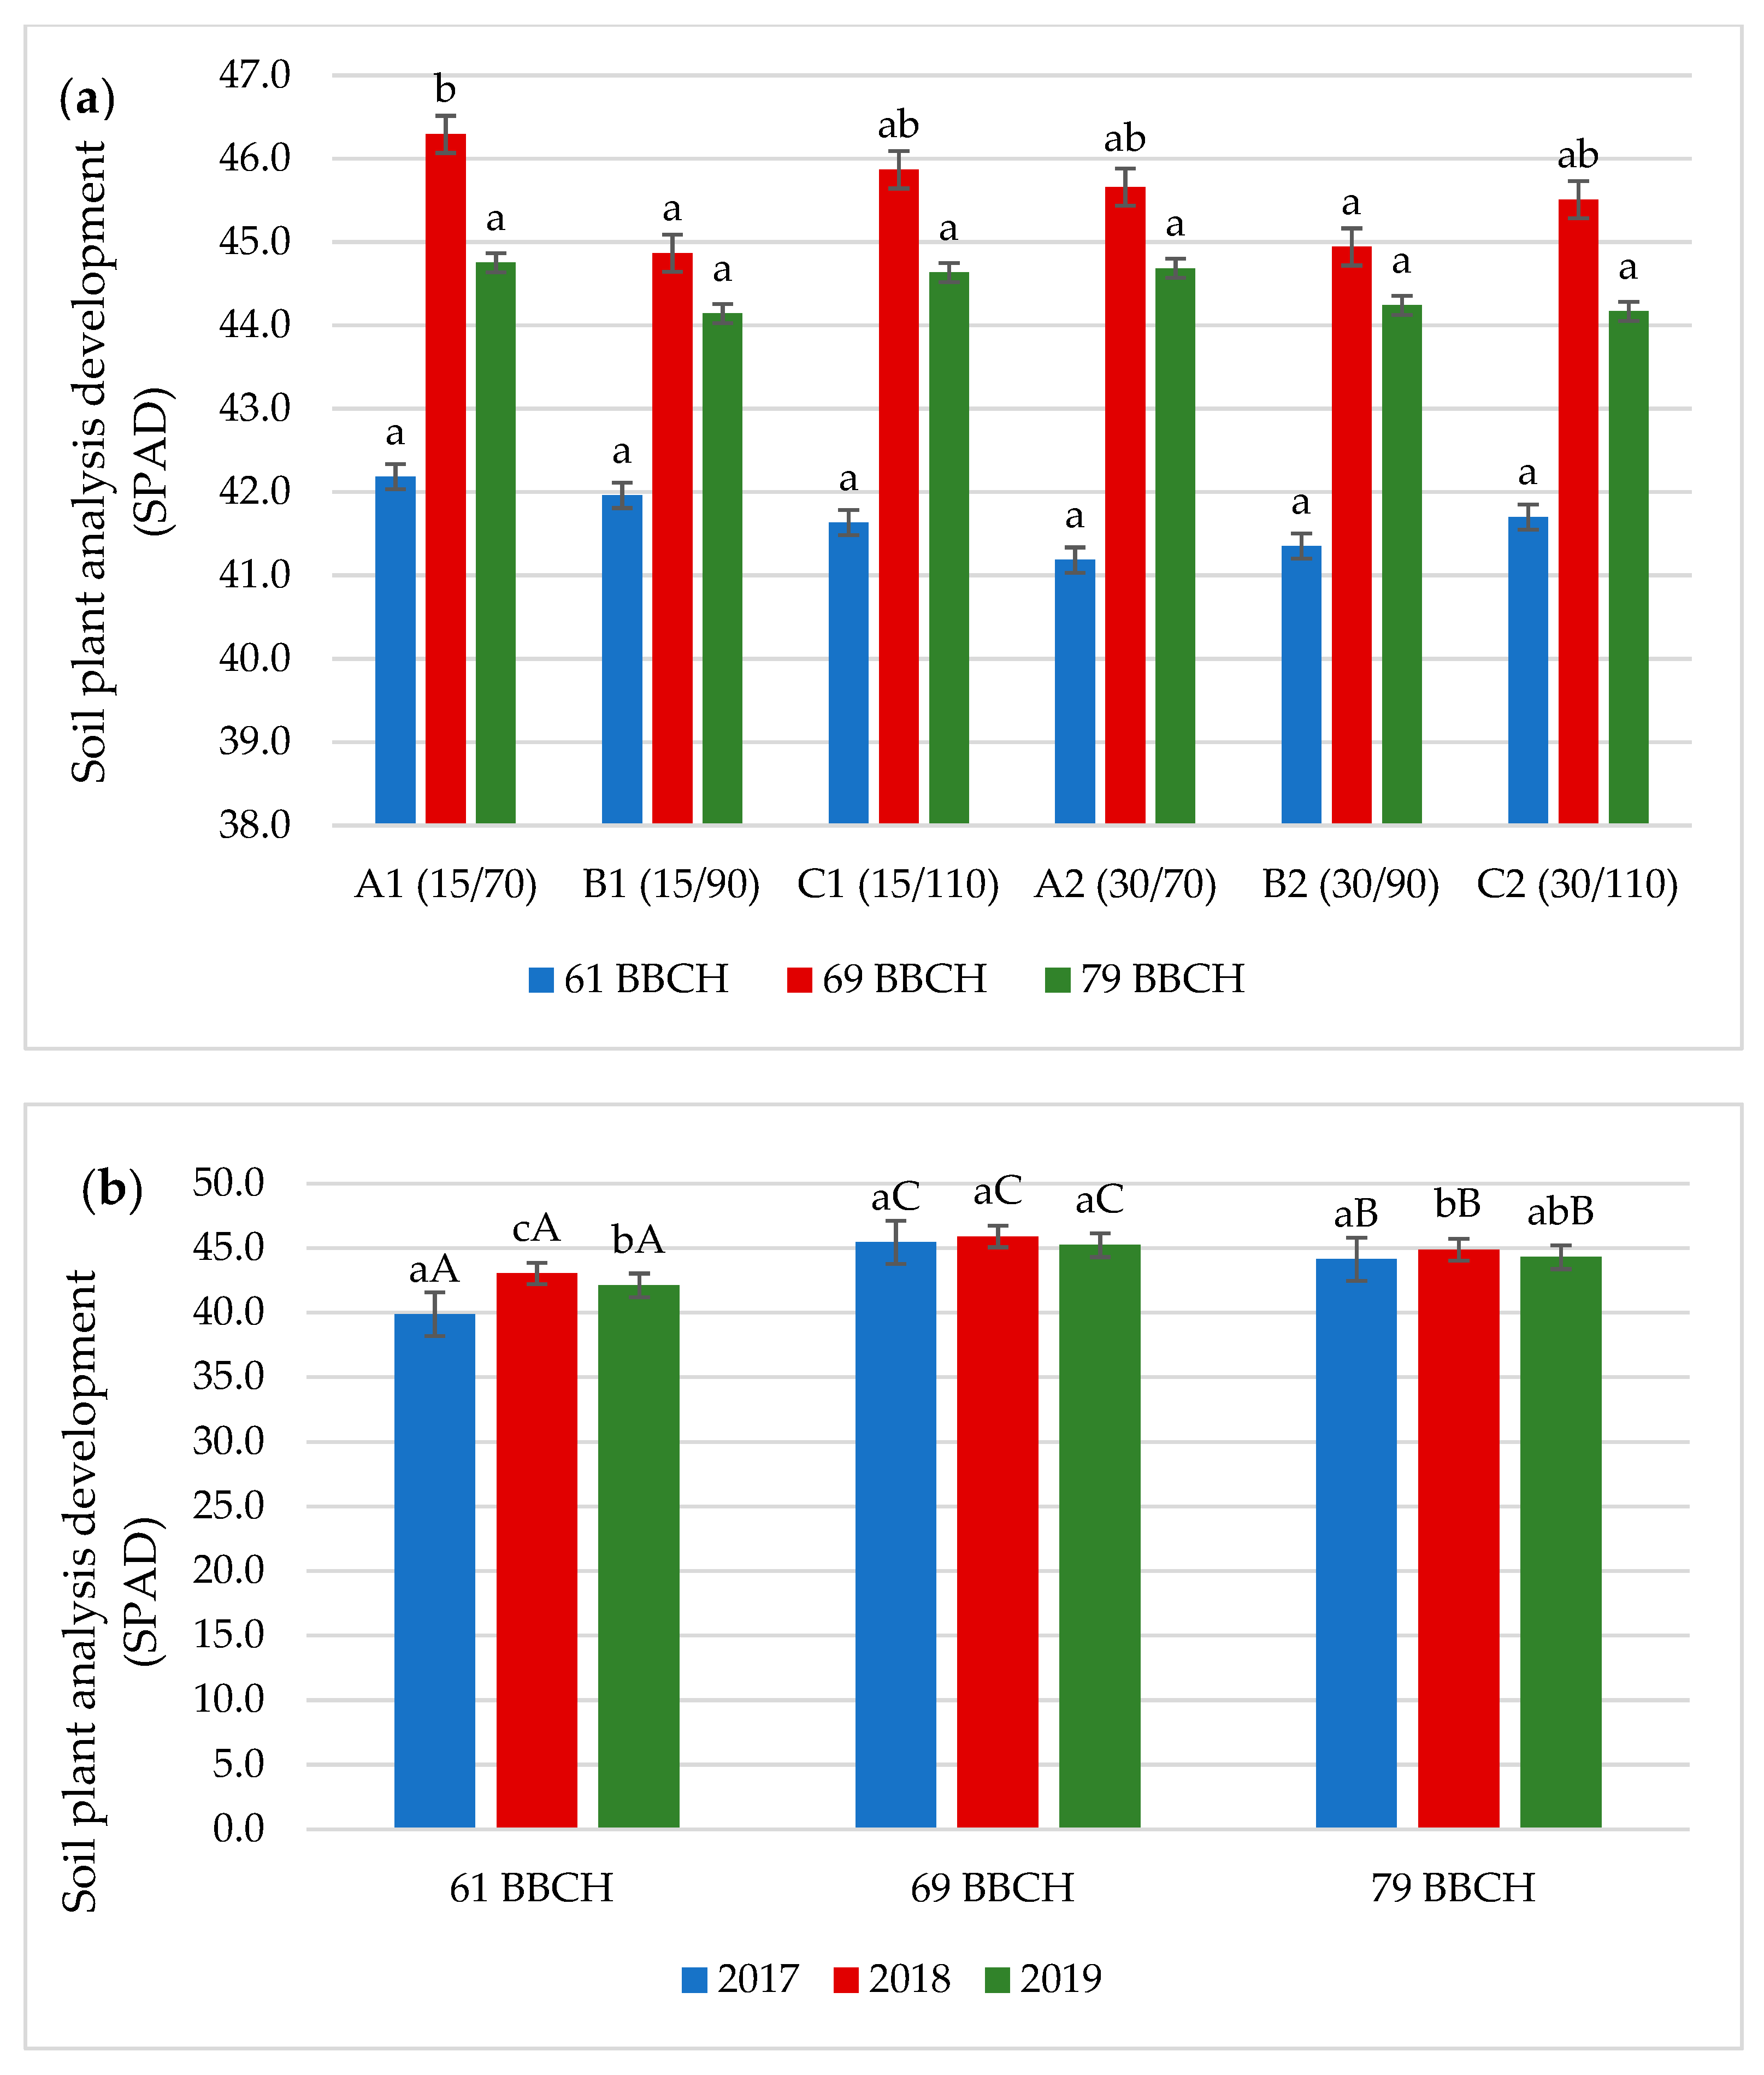
3.1. Chlorophyll Content

Research carried out by Fan et al. [30] prove that the soybean plants in normal light had thicker leaves characterised by larger palisade and spongy cells. As a result of shading, the thickness of the leaf tissue and palisade cells decreased by 29.2 and 48.9%, respectively. Increased chlorophyll content in leaves growing in shaded area is the result of transcription of genes encoding chlorophyll proteins as a result of acclimatization to low irradiance, in order to optimize capture of the limited light resource [31]. Under shaded conditions, the plant produces thinner leaves, accumulating more chlorophyll content per unit mass, which results in greater opportunities for light capture and harvesting [32]. In this study, the value of the leaf nutrition SPAD index reached the highest value in the 69 BBCH phase (Figure 2a). In stages 61 and 79 BBCH, the SPAD values did not differ significantly in different variants of the experiment. The highest SPAD value of 46.3 was obtained in variant A1 (15/70), compared to variants B1 (15/90) and B2 (30/90) it was higher by 3.1%. The SPAD value was the highest in phase 61 BBCH in 2018, in phase 69 BBCH it did not differ significantly in the analysed years, while in phase 79 BBCH it was higher in 2018 compared to 2017 (Figure 2b).
Fritschi and Ray [33] and Hussain et al. [34] found that the content of chlorophyll on the leaf surface is higher in a sunny environment compared to a shaded one, which was justified in the present study, where the high chlorophyll content was noted in variants with lower density of plants per unit area. Fan et al. [30], on the other hand, showed on soybean plants growing in intercropping crops that under shaded conditions the chlorophyll content was significantly higher than in normal light. A similar dependency was also found by Yao et al. [35] while studying the effect of shading on the physiological processes in soybean plants. The differences in the results obtained can be explained, among other things, by the fact that the SPAD meter readings are influenced by the stage of leaf development and the genotype of the cultivar. There may also be differences in the composition of thylakoid-related proteins and in the ultrastructure of chloroplasts between the cultivars used in the experiments [33].

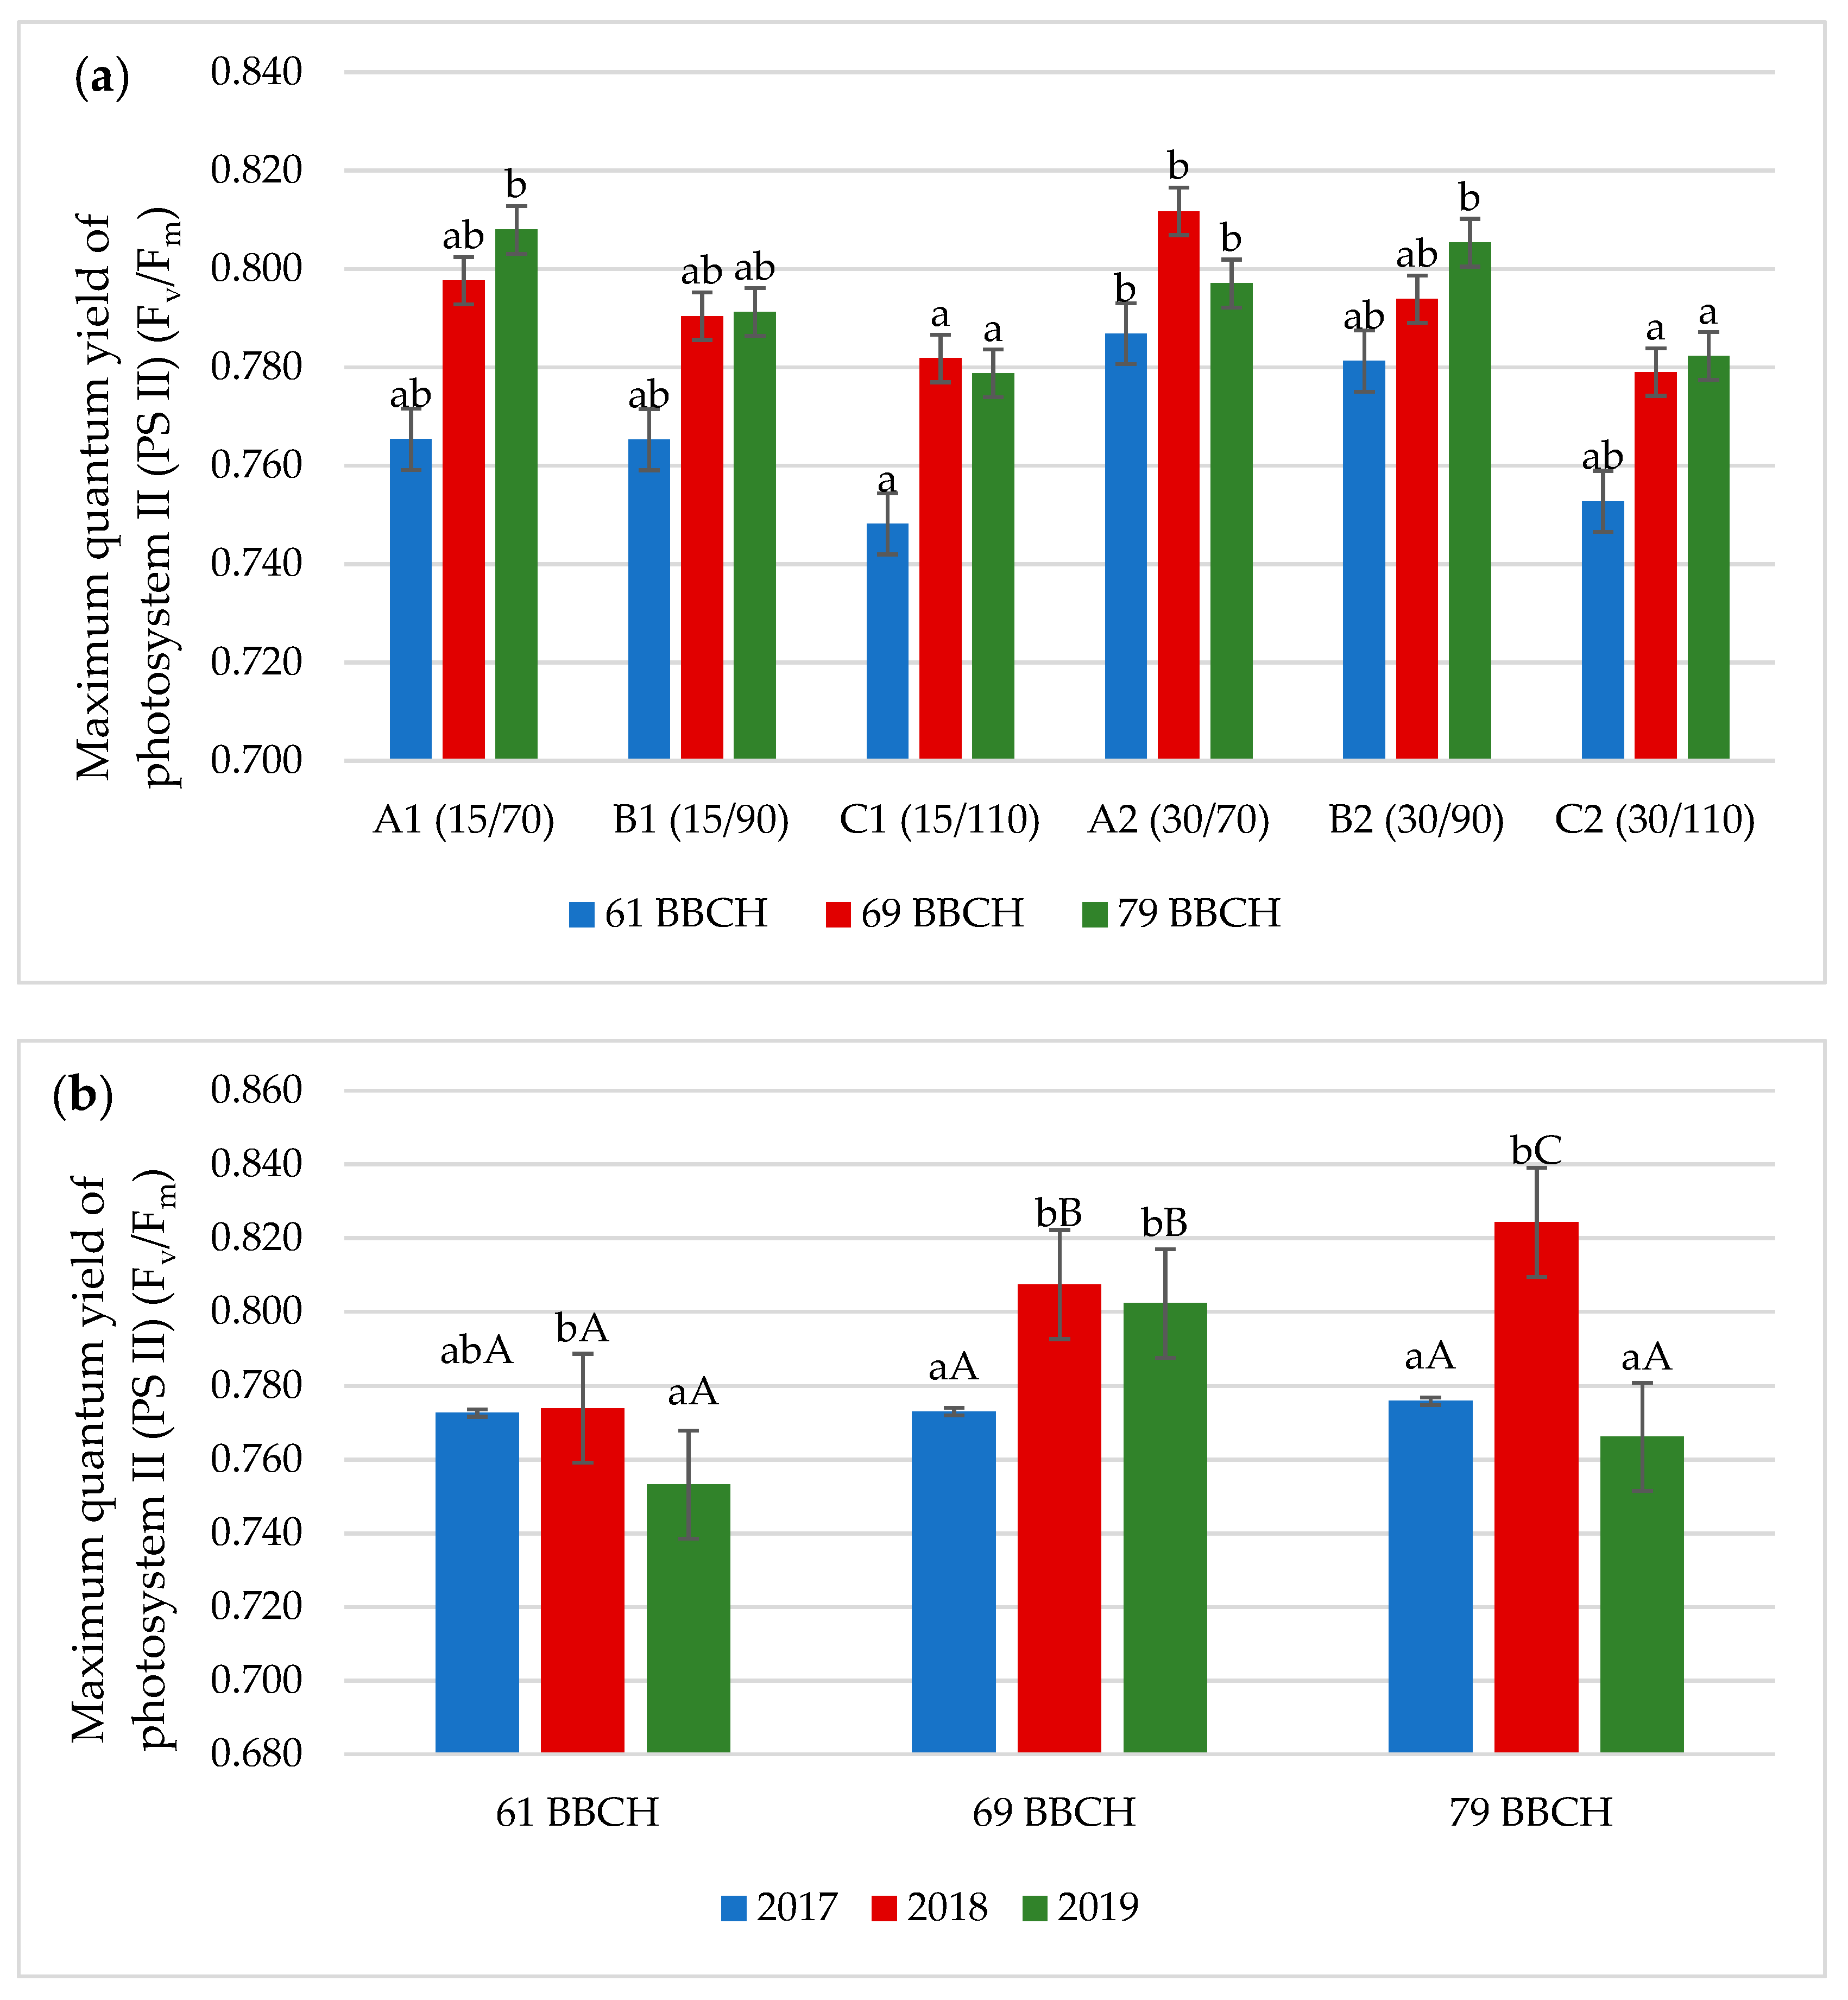
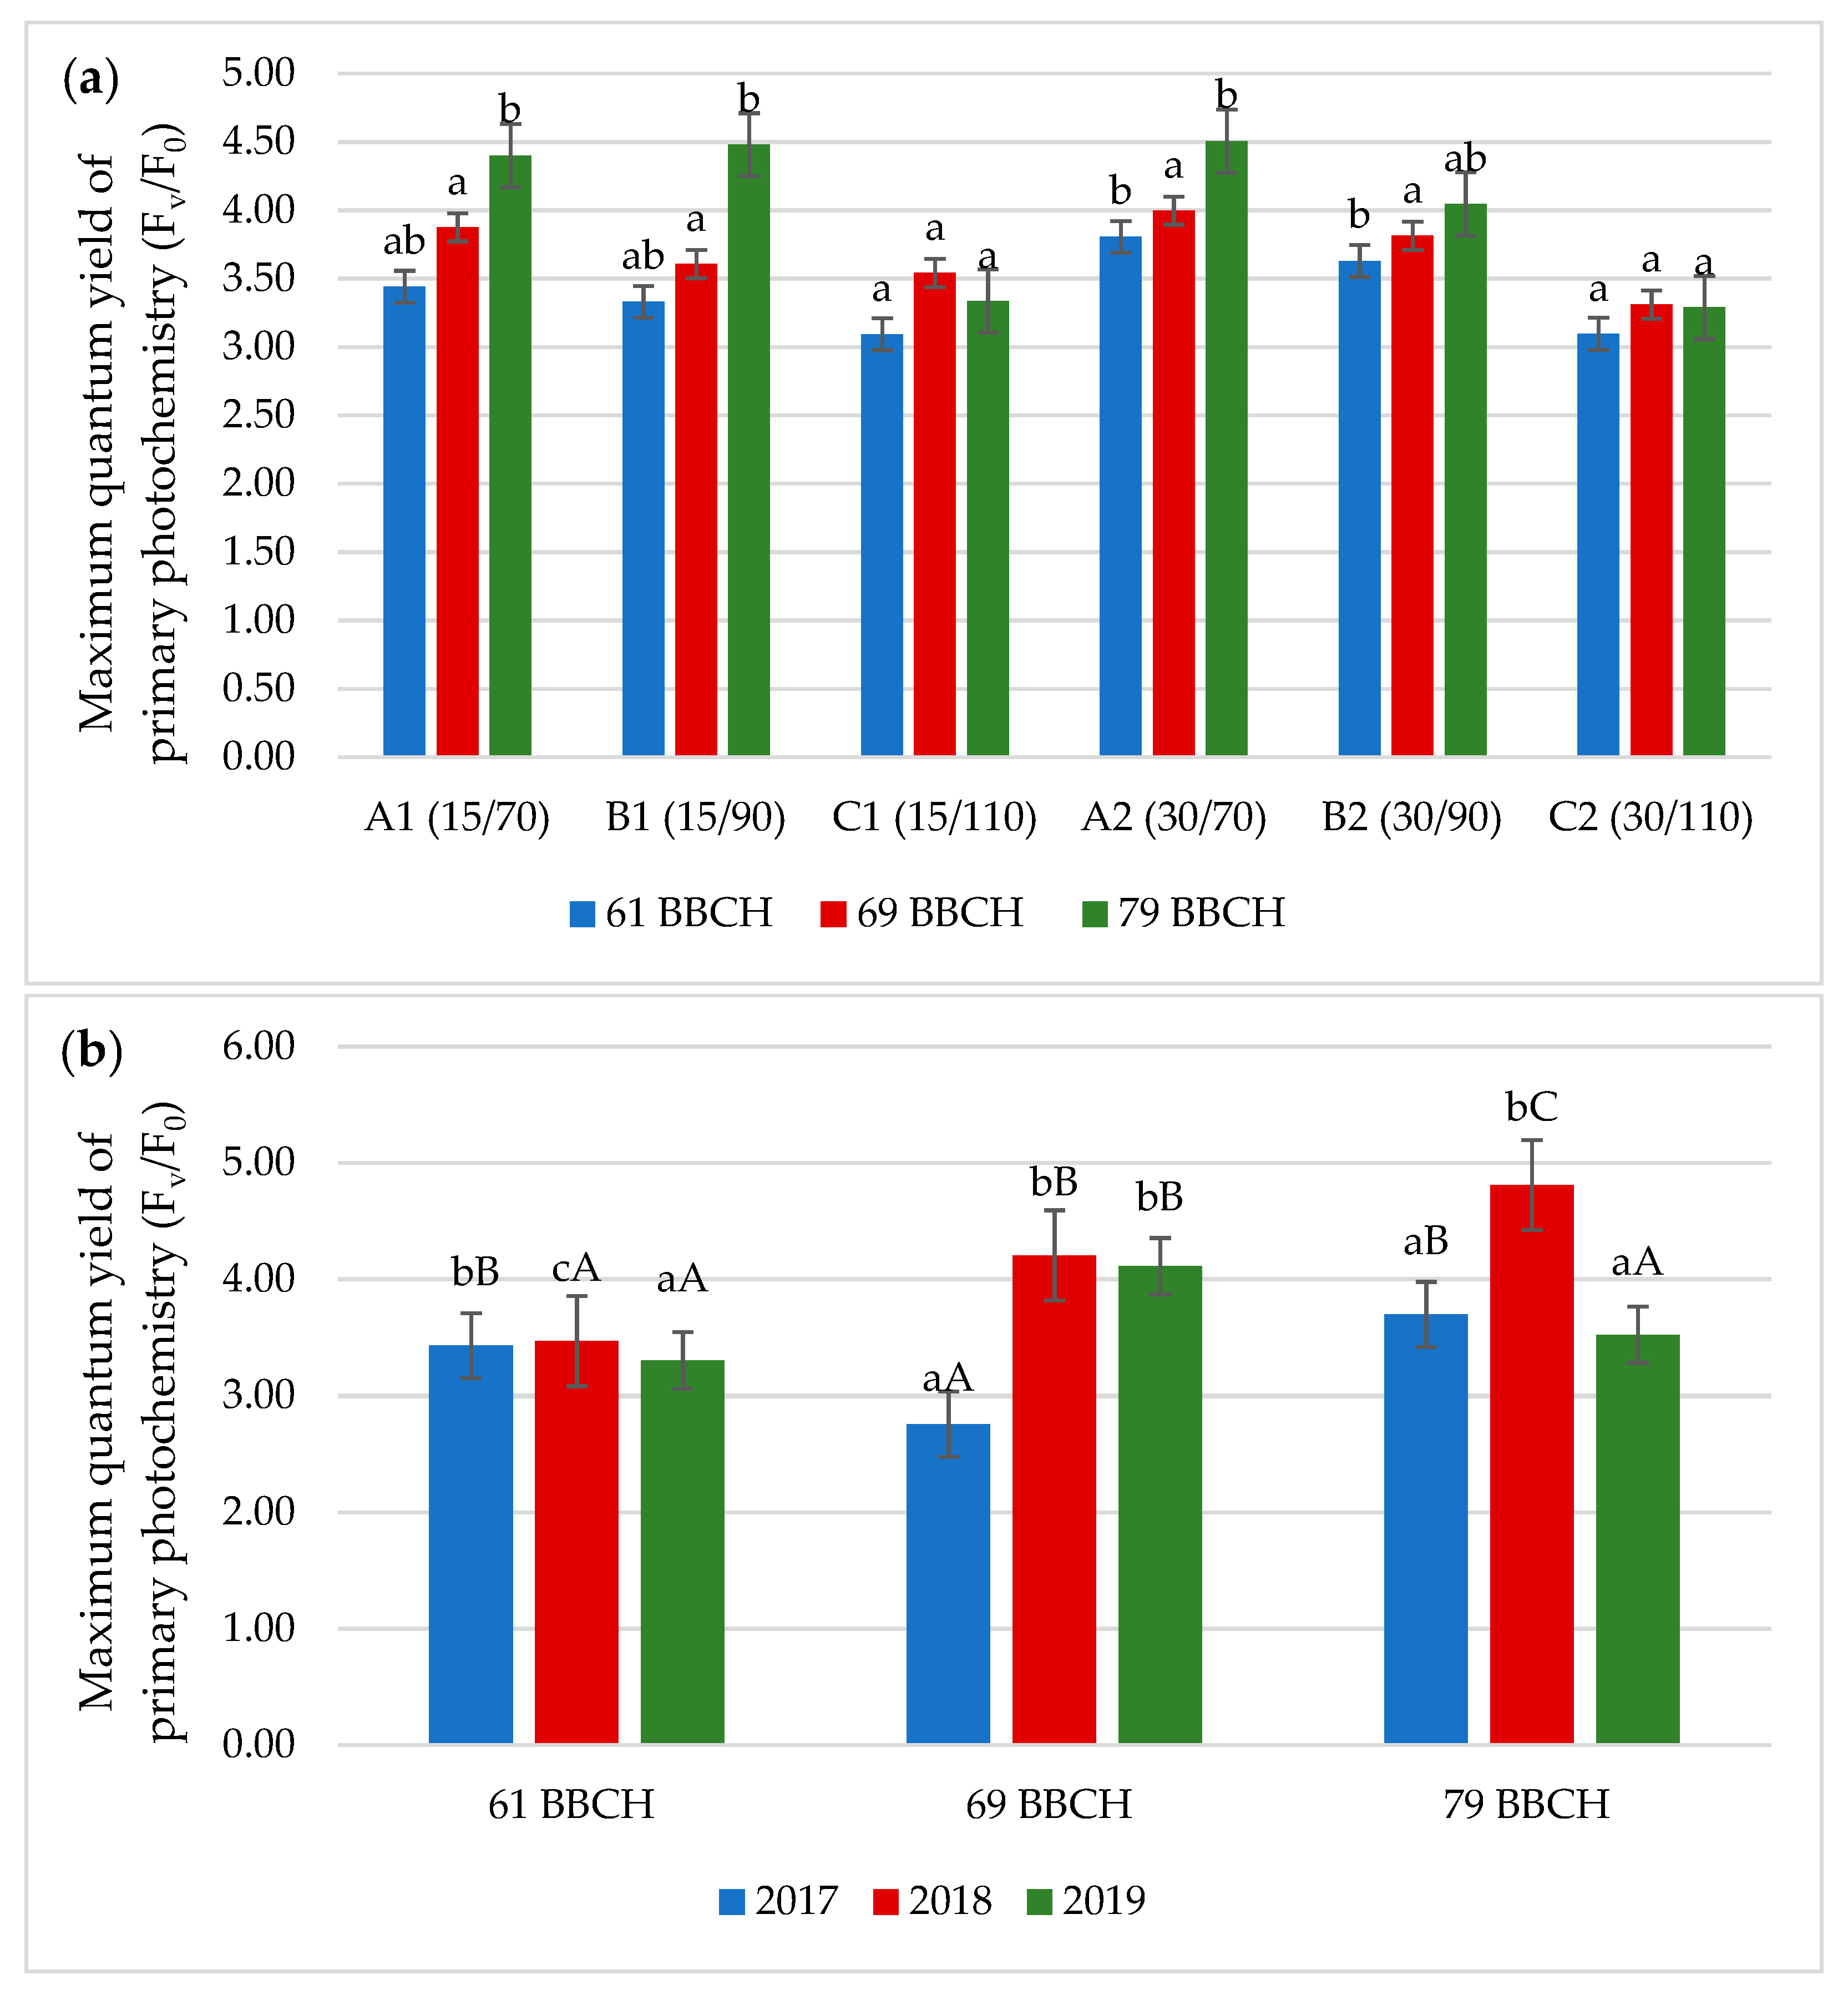
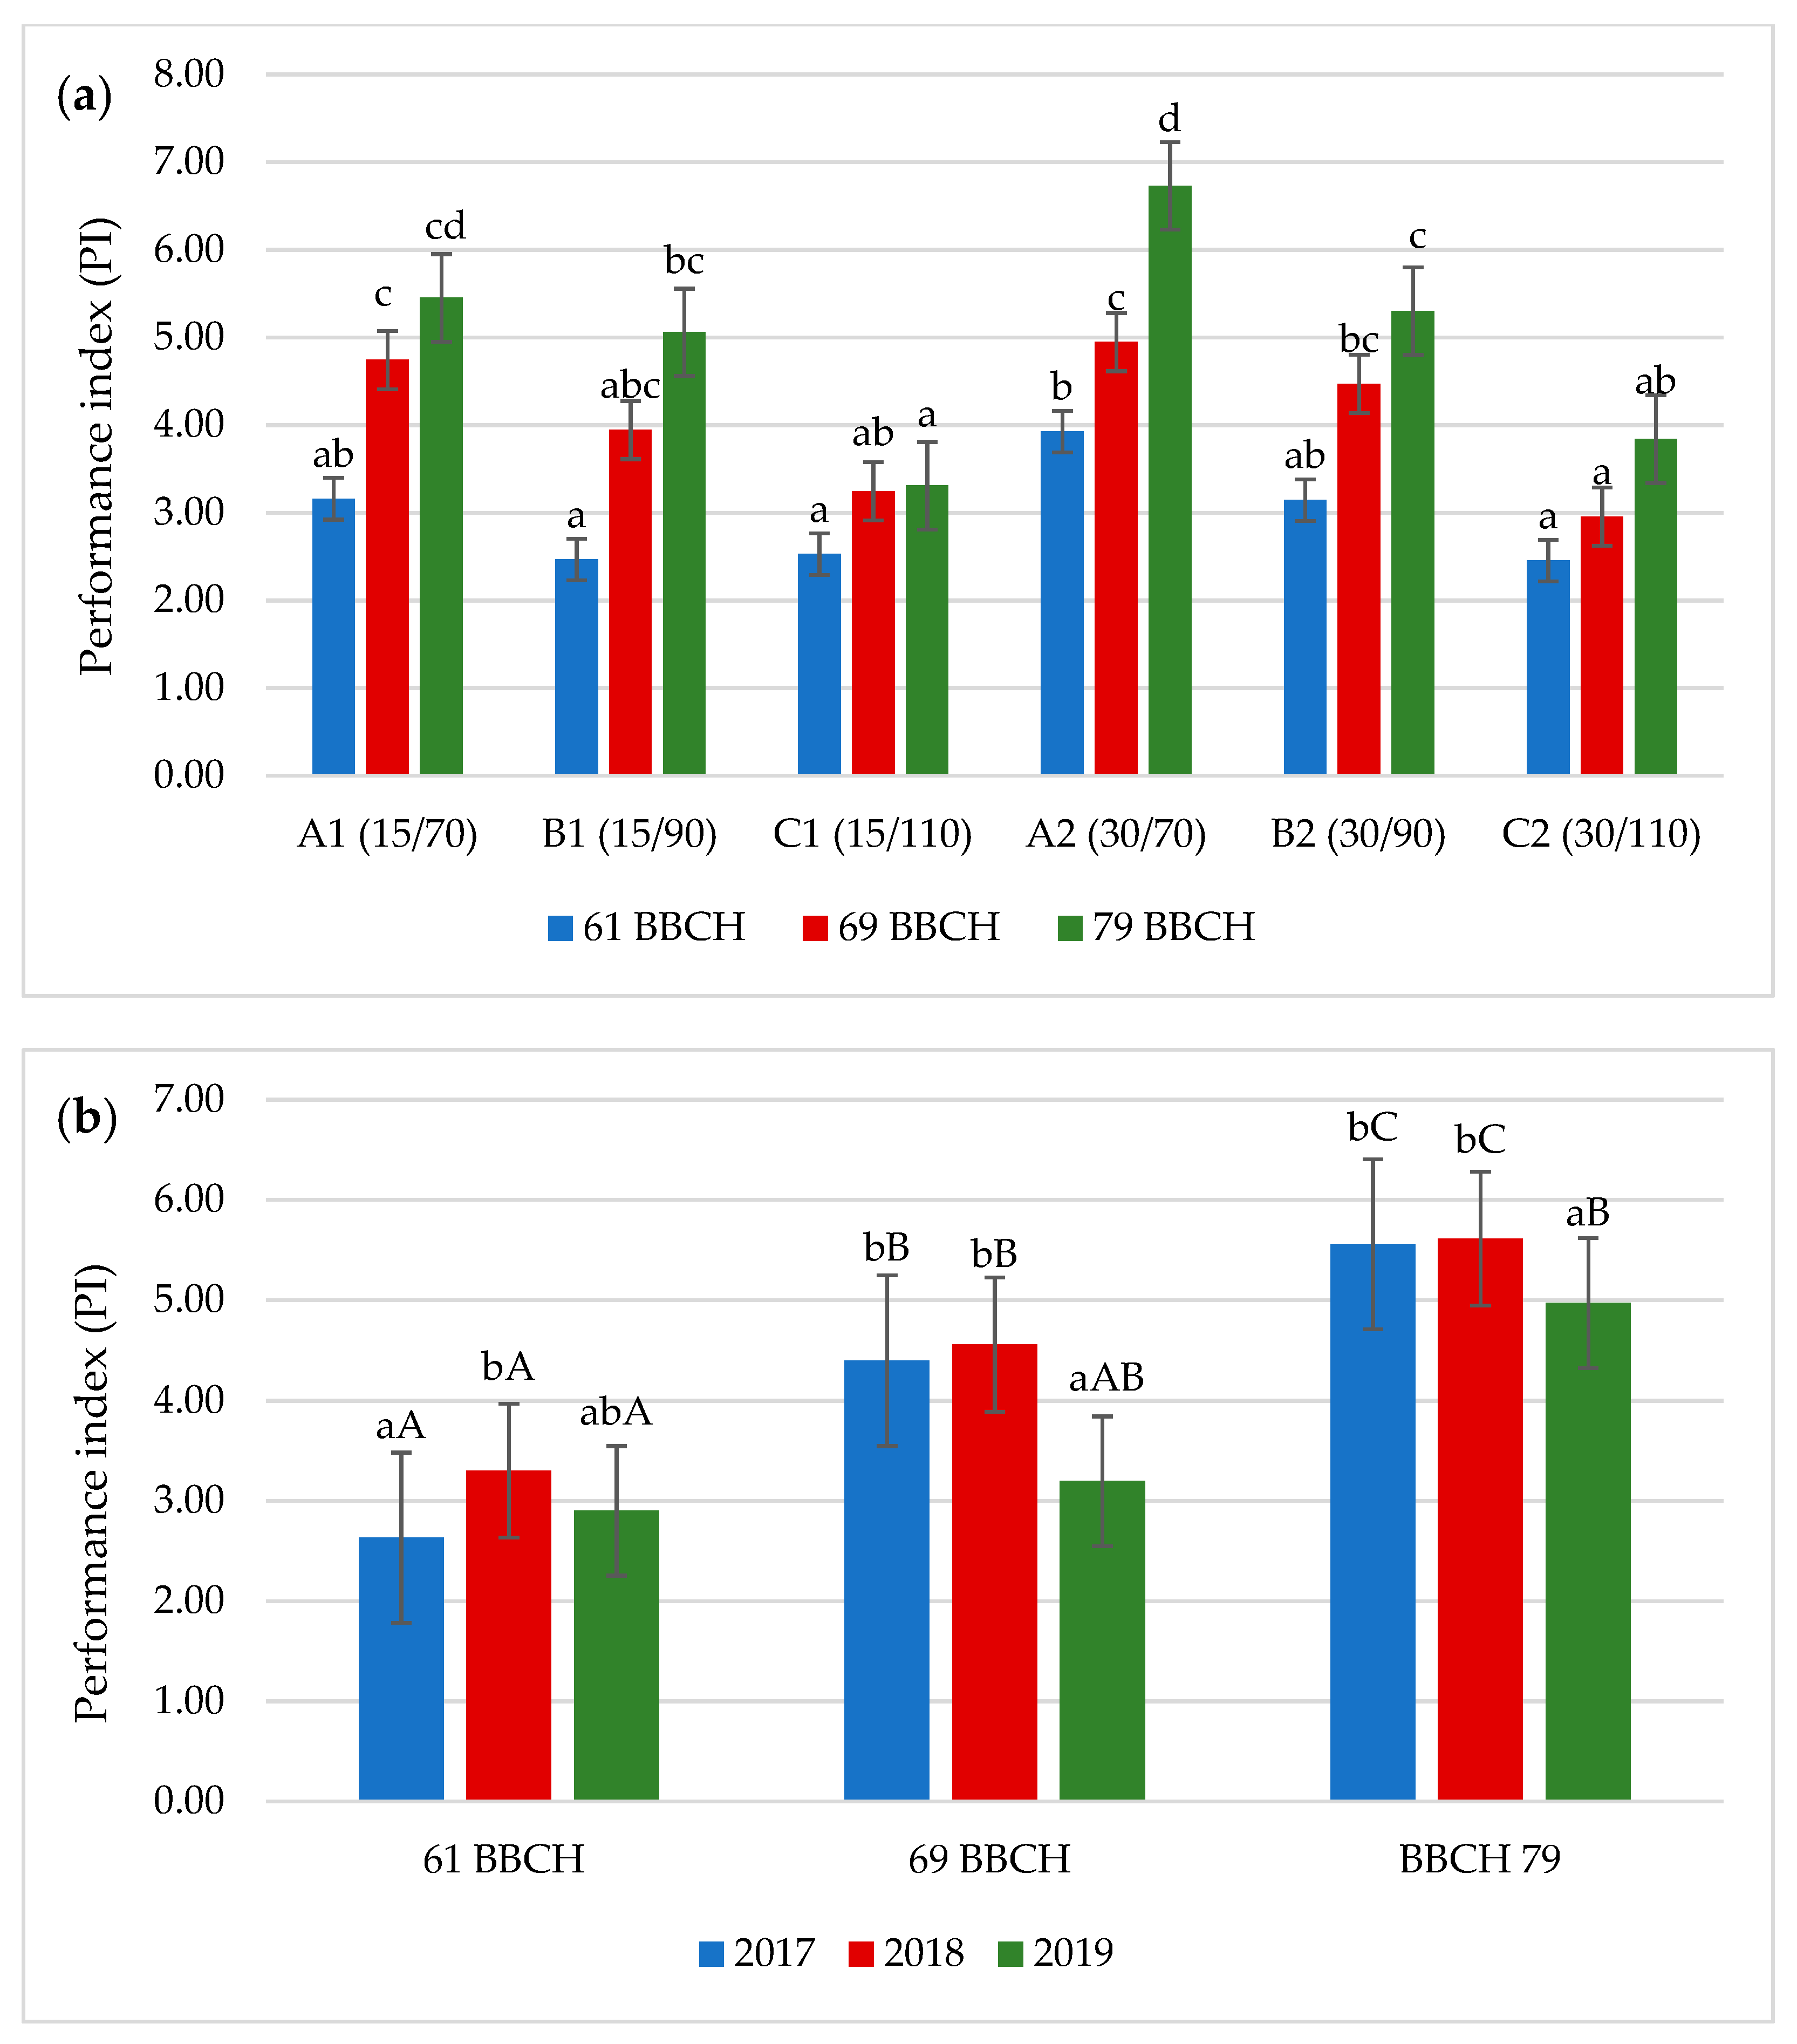
3.2. Chlorophyll Fluorescence

Measurement of chlorophyll a fluorescence allows to understand the basic mechanisms of photosynthesis and is the plant’s response to environmental changes [36]. Shade conditions decreased the capacity from PSII transmitted to PSI [30]. Research carried out by Gong et al. [31] showed that thinner soybean leaves developed in shaded conditions containing thinner palisade tissue cause the lower photosynthetic capacity, which in turn reduces the supply of photosynthetic products. Gratani et al. [37] showed that increasing the sowing density and row spacing resulted in a cover to each other of soybean plants, which reduced the availability of light for soybean plants and ultimately the photosynthetic rate of the leaves was reduced.
Research carried out by Hussain et al. [34] show that the value of the chlorophyll fluorescence parameter (Fv/Fm) is at a similar level under shading conditions and in normal light, while the research carried out by Khalid et al. [38] on soybean plants placed in pots, treated with different levels of shading, showed a decrease in the Fv/Fm parameter as a result of shading compared to the control. These differences may have been due to the varying shade conditions present in the experiment. Similar dependencies were also found in this study, where the use of a narrower row spacing and an increase in sowing density resulted in a decrease in the values of the analysed chlorophyll fluorescence parameters (Fv/Fm, Fv/F0 and PI). In the case of the Fv/Fm parameter, a lower value was recorded in variant C1 (15/110) compared to variant A2 (30/70), by 5.2% in the 61 BBCH stage and by 3.8% in the 69 BBCH stage (Figure 3a). In phase 79 of BBCH, the lowest value of this parameter was recorded in variants C1 (15/110) and C2 (30/110), while the highest—in variants A1 (15/70), A2 (30/70) and B2 (30/90).
The lowest values of the Fv/F0 and PI parameters were recorded along with increasing sowing density, regardless of the row spacing (Figure 4a and Figure 5a). This dependence was confirmed in all the tested phases, except for 69 BBCH (Fv/F0 parameter), where no significant differences were found between the individual variants. The decrease in sowing density increased the values of the Fv/F0 and PI parameters. In 2018, when the conditions were most optimal for the development of soybean plants, the highest values of the tested parameters of chlorophyll fluorescence were obtained (Figure 3b, Figure 4b and Figure 5b).

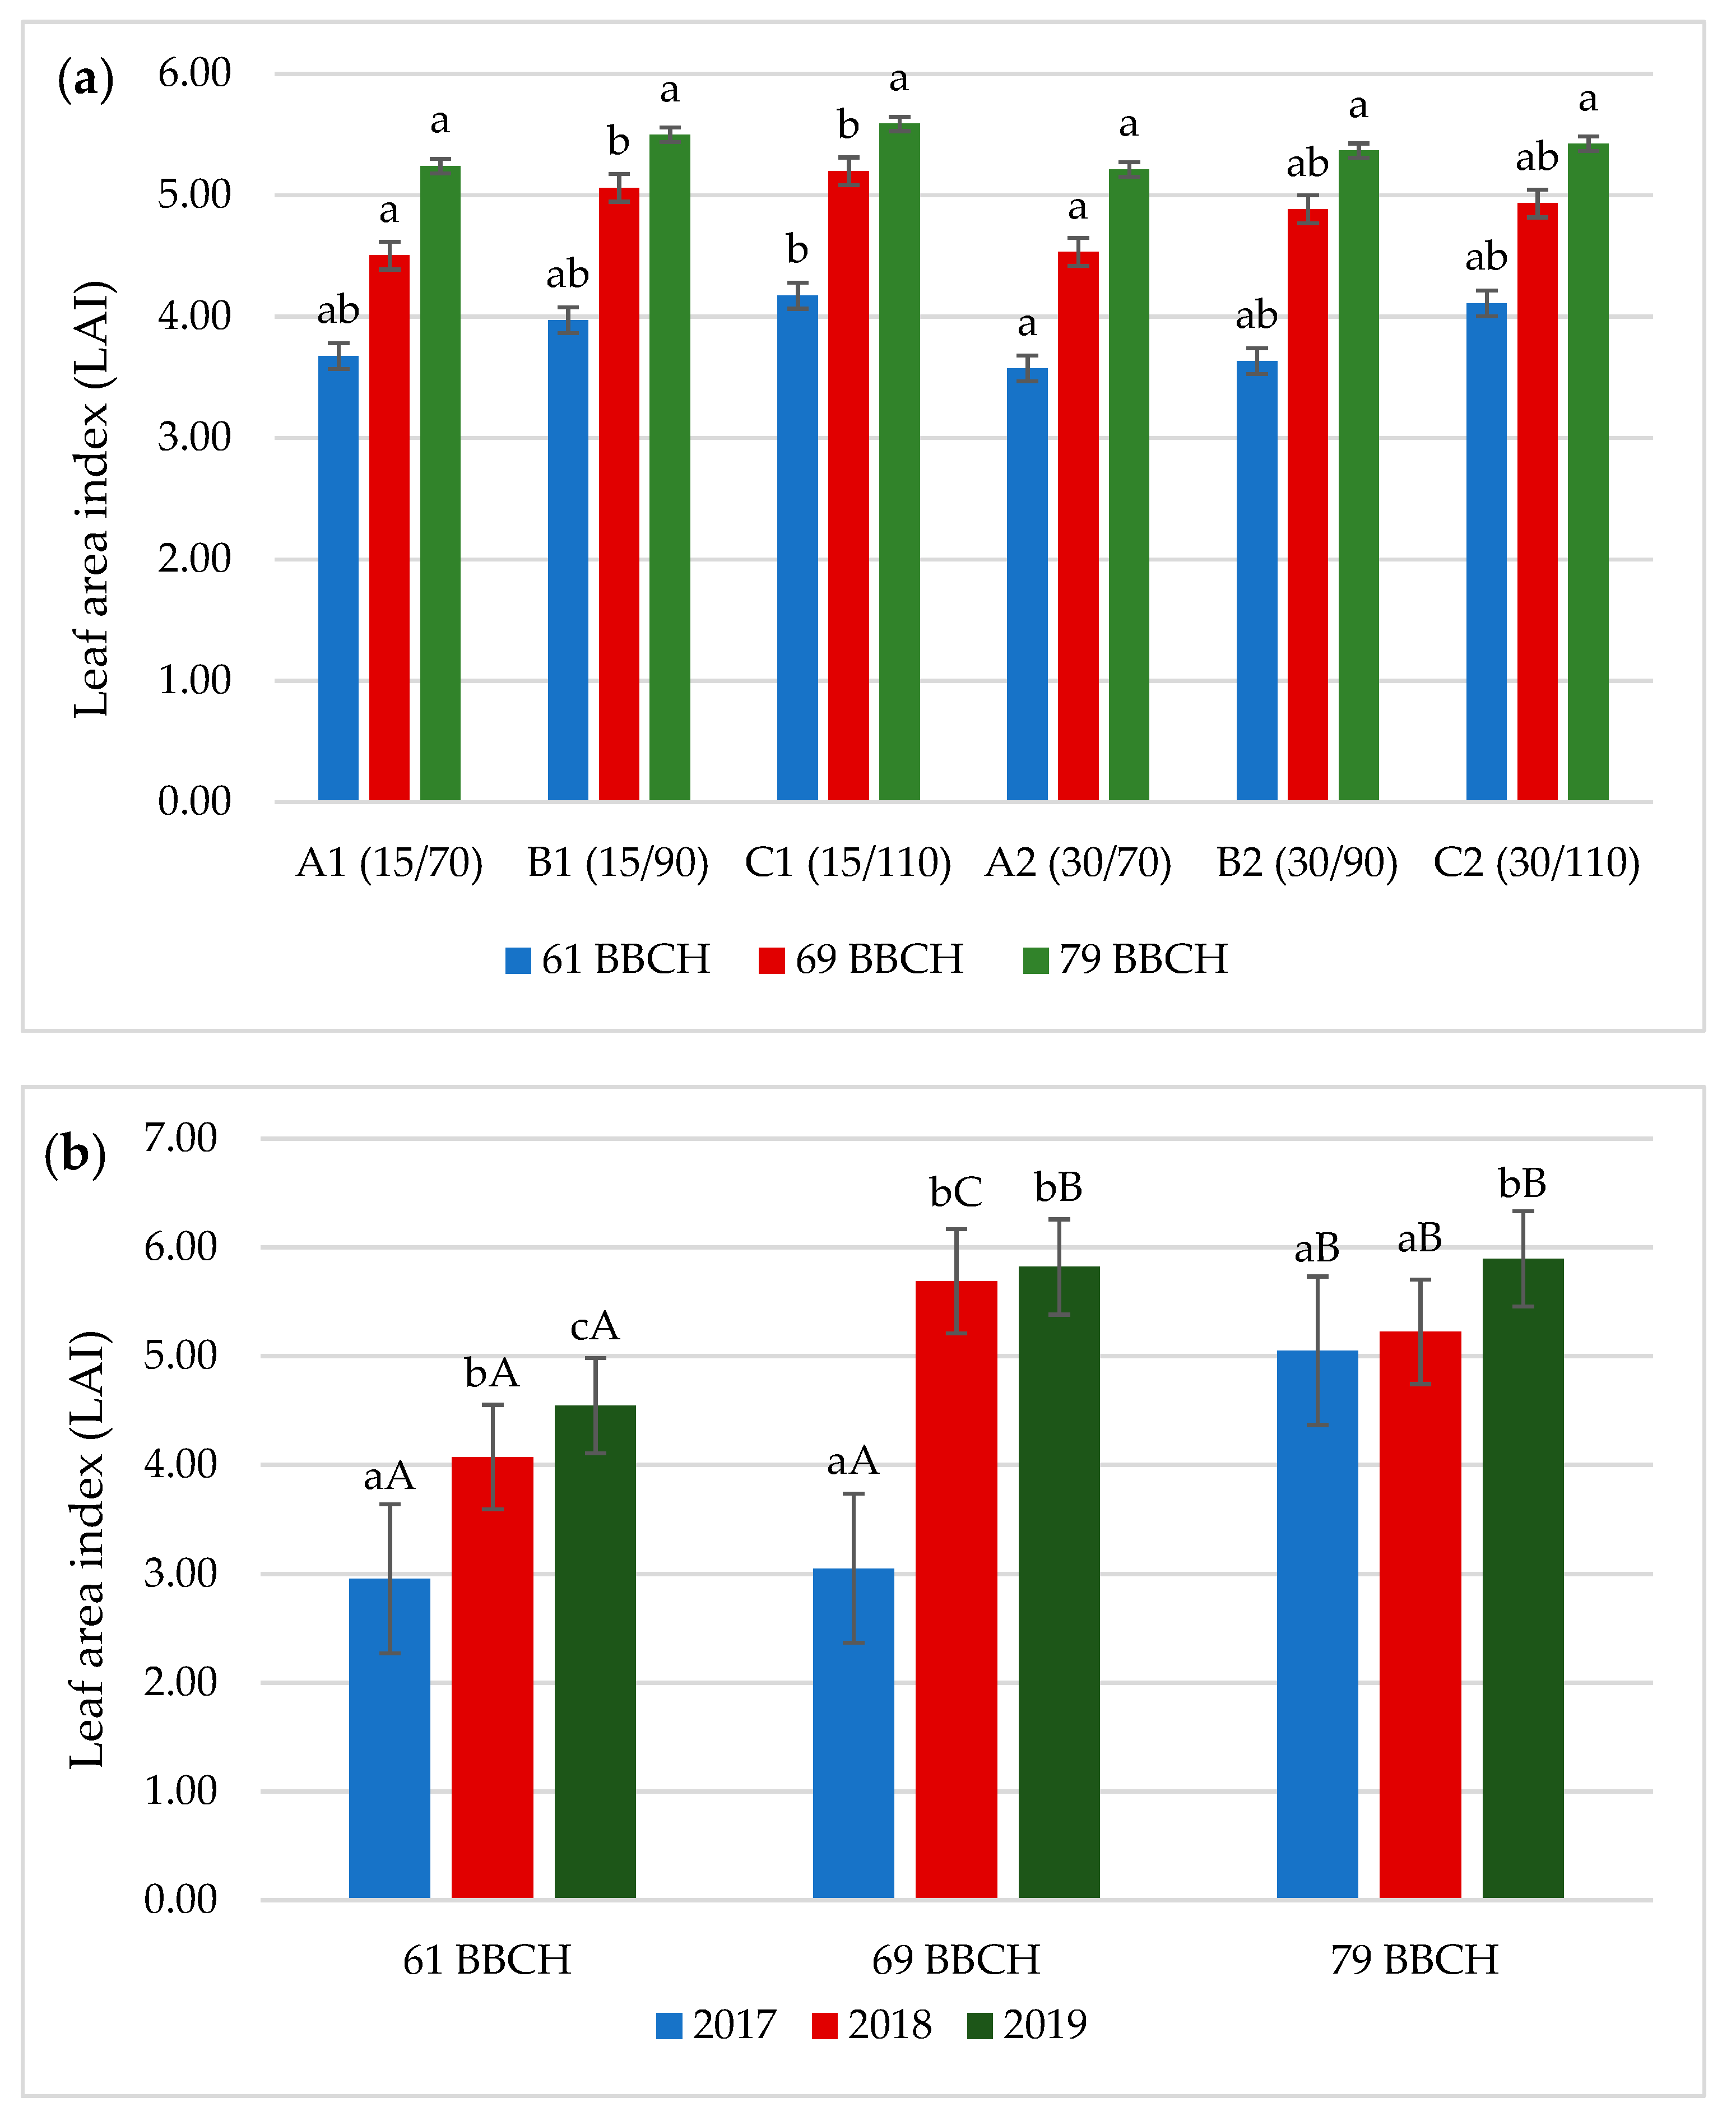
3.3. Leaf Area Index (LAI)

The leaf area index (LAI) depended significantly on the experiment factors. Differences in the LAI value were shown in the development stages of 61 and 69 BBCH soybean, while in the 79 BBCH stage the parameter was not influenced by the experimental factors. The LAI value increased along with the plant density on the area unit (Figure 6a). A significantly higher (by 16.8%) LAI value in phase 61 BBCH was found for variant C1 (15/110) compared to A2 (30/70). In phase 69 BBCH, variants A1 (15/70) and A2 (30/70) had the lowest LAI value in the range between 4.50–4.53 compared to variants B1 (15/90) and C1 (15/110) where the LAI value fell between 5.06–5.20. In the 79 BBCH phase, the LAI values did not differ significantly in any variants.
Research carried out by Souza et al. [8] and Prusiński and Nowicki [18] proved that, in contrast to this study, sowing density did not affect the LAI value, but only the cultivars used and the growth habit. These differences may have been due to the different habitat conditions of the experiments and the date of the measurements. Research carried out by Sobko et al. [11] showed, however, that LAI was differentiated by the sowing density in the flowering phase, while it was not different in the beginning of maturity phase. Similar dependencies were found in this study in phase 79 BBCH, where LAI values did not differ significantly. Sobko et al. [11] proved that the LAI value increased in proportion to the sowing density, which was also found in this study.
The weather conditions significantly influenced the LAI value (Figure 6b). The highest values were reported at all measurement dates in 2019 (except for 69 BBCH, where the LAI was at a similar level as in 2018). The highest LAI values were observed in the 79 BBCH phase, in which the soybean leaves were the largest in size, in contrast to the 61 BBCH phase, where the soybean leaves were the smallest.

3.4. Soybean Seed Yield and Yield Components

The yield of soybean seeds was not differentiated by either the row spacing or the sowing density (Table 4). According to previous literature reports, sowing density has little effect on the value of this parameter [39]. As reported by De Luca and Hungria [40] and Ribeiro et al. [10] it may be related to the high phenotypic plasticity of soybean plants, causing changes in their morphological structure as a result of different sowing density, which is related to the desire to obtain a high seed yield. Grown at lower density, the plants produce more branches, which increases the number of pods and thus seeds per plant, which resulted in greater production per individual. Also, the varied spacing of rows did not significantly affect the seed yield, which was confirmed in the studies by Dima [15] in which the row spacing of 12.5, 25 and 50 cm was used, and by Prusiński and Nowicki [18], where the row spacing was 16 and 32 cm. These authors showed a greater influence of weather factors on the value of the obtained seed yield.
In the conducted research, the soybean seed yield was determined mainly by the weather conditions during the research years. The most favourable thermal and precipitation conditions prevailed in the period of the formation of pods and seed maturation in 2018, which resulted in the highest yield, 5.33 tha−1, which was 18.2 and 12.5% higher than the yield obtained in 2017 and 2019. The total precipitation in July 2018 was 108.3 mm and was at a level similar to the multi-year period, while in 2017 (44.4 mm) and 2019 (45.1 mm) the precipitation was very low. Also Piper and Boote [41] confirmed that the yield of soybeans depends on weather conditions during the growing season, and the stress caused by the water deficit in the soil over the years, in particular during the seed formation phase, is undoubtedly one of the major abiotic stresses causing a considerable reduction in productivity of soybeans.
Yield structure elements were not differentiated by row spacing, except for the mass of seeds per plant, which was 8.0% higher at a row spacing of 15 cm compared to the spacing of 30 cm (Table 4). The sowing density differentiated the elements of the yield structure to a greater extent than the row spacing. The value of the yield structure parameters, except for thousand seeds weight (TSW), increased with the lower sowing density. A similar dependence was shown in the research carried out by Sobko et al. [11], who using the seeding density of 30, 50, 70 and 90 pcs. m−2 showed that the number of pods per plant decreased along with its increase. Carciochi et al. [42] showed a decrease in seed mass per plant and an increase in TSW along with increasing seeding density. In our research, TSW was significantly higher at the density of 90 pcs. m−2 (160.7 g) compared to the density of 70 and 110 pcs.m−2 by 6.2 and 13.9%, respectively. Souza et al. [43] and Sobko et al. [11] showed that TSW is not significantly influenced by the varied soybean sowing density, while in the studies conducted by Prusiński and Nowicki [18], a slight variation of the examined parameter was found as a result of the use of variable row spacing and sowing density and, similarly to own research, the highest TSW was found at the density of 90 pcs. m−2. Different results on TSW in studies by Souza et al. [43] and Sobko et al. [11] could result from the use of lower sowing densities than in our research.
Reducing the sowing density affects the growth and development of individual plants in the form of a larger leaf area, the number of branches and pods, and the number of seeds per plant [42]. A significant interaction of the co-existence of experience factors among yield components was found only in the case of the shaping of the TSW value The row spacing did not affect this parameter at the density of 70 or 110 pcs.m−2. In the case of a density of 90 pcs. m−2, a significant increase in the TSW value was demonstrated for the row spacing of 15 cm. Weather factors significantly differentiated all the parameters of the yield structure. The largest number of pods per plant and the number of seeds, soybean plants developed in 2019, while in 2018, when favourable weather conditions occurred during the seed formation period, the biggest seeds were developed, with a greater weight, which resulted in obtaining the highest yield, despite the formation of lower number of seeds.

3.5. Plant Morphology and Nodulation

In this study, there was no significant interaction between the experience factors on the shaping of soybean plant morphological features and nodulation. The average setting height of the 1st. pod was 13.5 cm (Table 5). As reported by Soares et al. [7], this height is suitable for combine harvesting, because with the first pod set at a height of less than 10 cm, losses in the seed yield may occur.
According to Rębilas et al. [44], due the low sowing densities soybean plants develop low-set pods, which may generate yield losses during combine harvesting.
In this study, as a result of reducing the row spacing from 30 to 15 cm, both the plant height as well as the height of the 1st. pod setting increased by 10.2% and 5.6%, respectively. The varied sowing density also shaped the plant height and the height of the of the 1st. pod setting. The increase in plant height as a result of an increase in sowing density was also found in this study. Significantly the highest plants were developed at the sowing density of 110 pcs.m−2, which compared to the density of 70 pcs.m−2 resulted in a significant elongation of soybean plants and higher setting of the 1st. pod by 7.5 and 6.1%, respectively. In the research conducted by Prusiński and Nowicki [18], it was found that these parameters were not influenced by the row spacing and sowing density, while Sobko et al. [11] showed that with the increase in sowing density, the height of the plants and the height of the 1st. pod setting increased. According to Gong et al. [45], soybean plants have developed two defence strategies against high-density shading. The first one is shade avoidance, and the second one is shade tolerance. The plants applying the shade avoidance strategy were characterised by elongated stems and hypocotyls at the expense of increasing leaf area and reducing the number of branches. In a study performed by Fan et al. [30] they also found elongation of soybean plants under the influence of shading, which demonstrates a stress avoidance strategy. The weather conditions had a significant impact on the parameters tested. In 2018, the highest plants (98.6 cm) were obtained, while in 2019 the plants developed the highest 1st. pod setting (14.5 cm).
The row spacing did not significantly affect the number and dry mass of nodules on the soybean root, while the sowing density shaped the value of this parameter. As the sowing density increased, the number and dry mass of nodules were significantly the lowest. With the sowing density of 70 pcs.m−2, the number of nodules was 23.5, and their weight was 0.328 g, which was significantly higher than with the density of 110 pcs.m−2-by 18.7 and 44.2%, respectively. A similar dependence was obtained by de Luca and Hungría [40], who used different sowing densities in the soybean in their experiment in the range between 40,000–320,000 pcs.ha−1. The use of lower sowing densities resulted in the increase in the photosynthetic rate as well as the number of nodules and the rate of nitrogen fixation. Lack of light penetration into the deeper layer of the canopy causes a decrease in yield. Research carried out by Prusiński and Nowicki [18] and Sobko et al. [11] showed no significant differences in the number and dry mass of nodules caused by different row spacing or sowing density.
The highest number (24.7 pcs.) and mass of nodules (0.359 g) were reported in 2018, characterised by the most favourable weather conditions. The influence of weather conditions on the number and mass of soybean nodules was also demonstrated in the studies by Jarecki [46].

3.6. Protein and Fat Content and Their Efficiency

The protein content of soybeans was influenced by the experiment factors (Table 6). Increasing the row spacing resulted in an increase in the protein content by 1.9%. The highest content of this component (36.8%) was found at rate of 90 pcs.m−2. Also Bellaloui et al. [47] showed that a higher plant density per unit area resulted in an increase in the protein content of soybeans. The experiment factors did not influence the protein yield differentiation. Contrary to protein, the fat content was not influenced by the row spacing or seeding density. Also the fat yield did not depend on the experimental factors. Ferreira et al. [48] and Sobko et al. [11] showed that both the protein and fat content were not influenced by the sowing density but only by the weather conditions, which was also confirmed in this study. In 2018, the highest protein content was found in seeds, while in 2017 the highest fat content. The highest protein and fat yields were obtained in 2019. However, there was no interaction of the experimental factors on the shaping of protein and oil content and their efficiency.

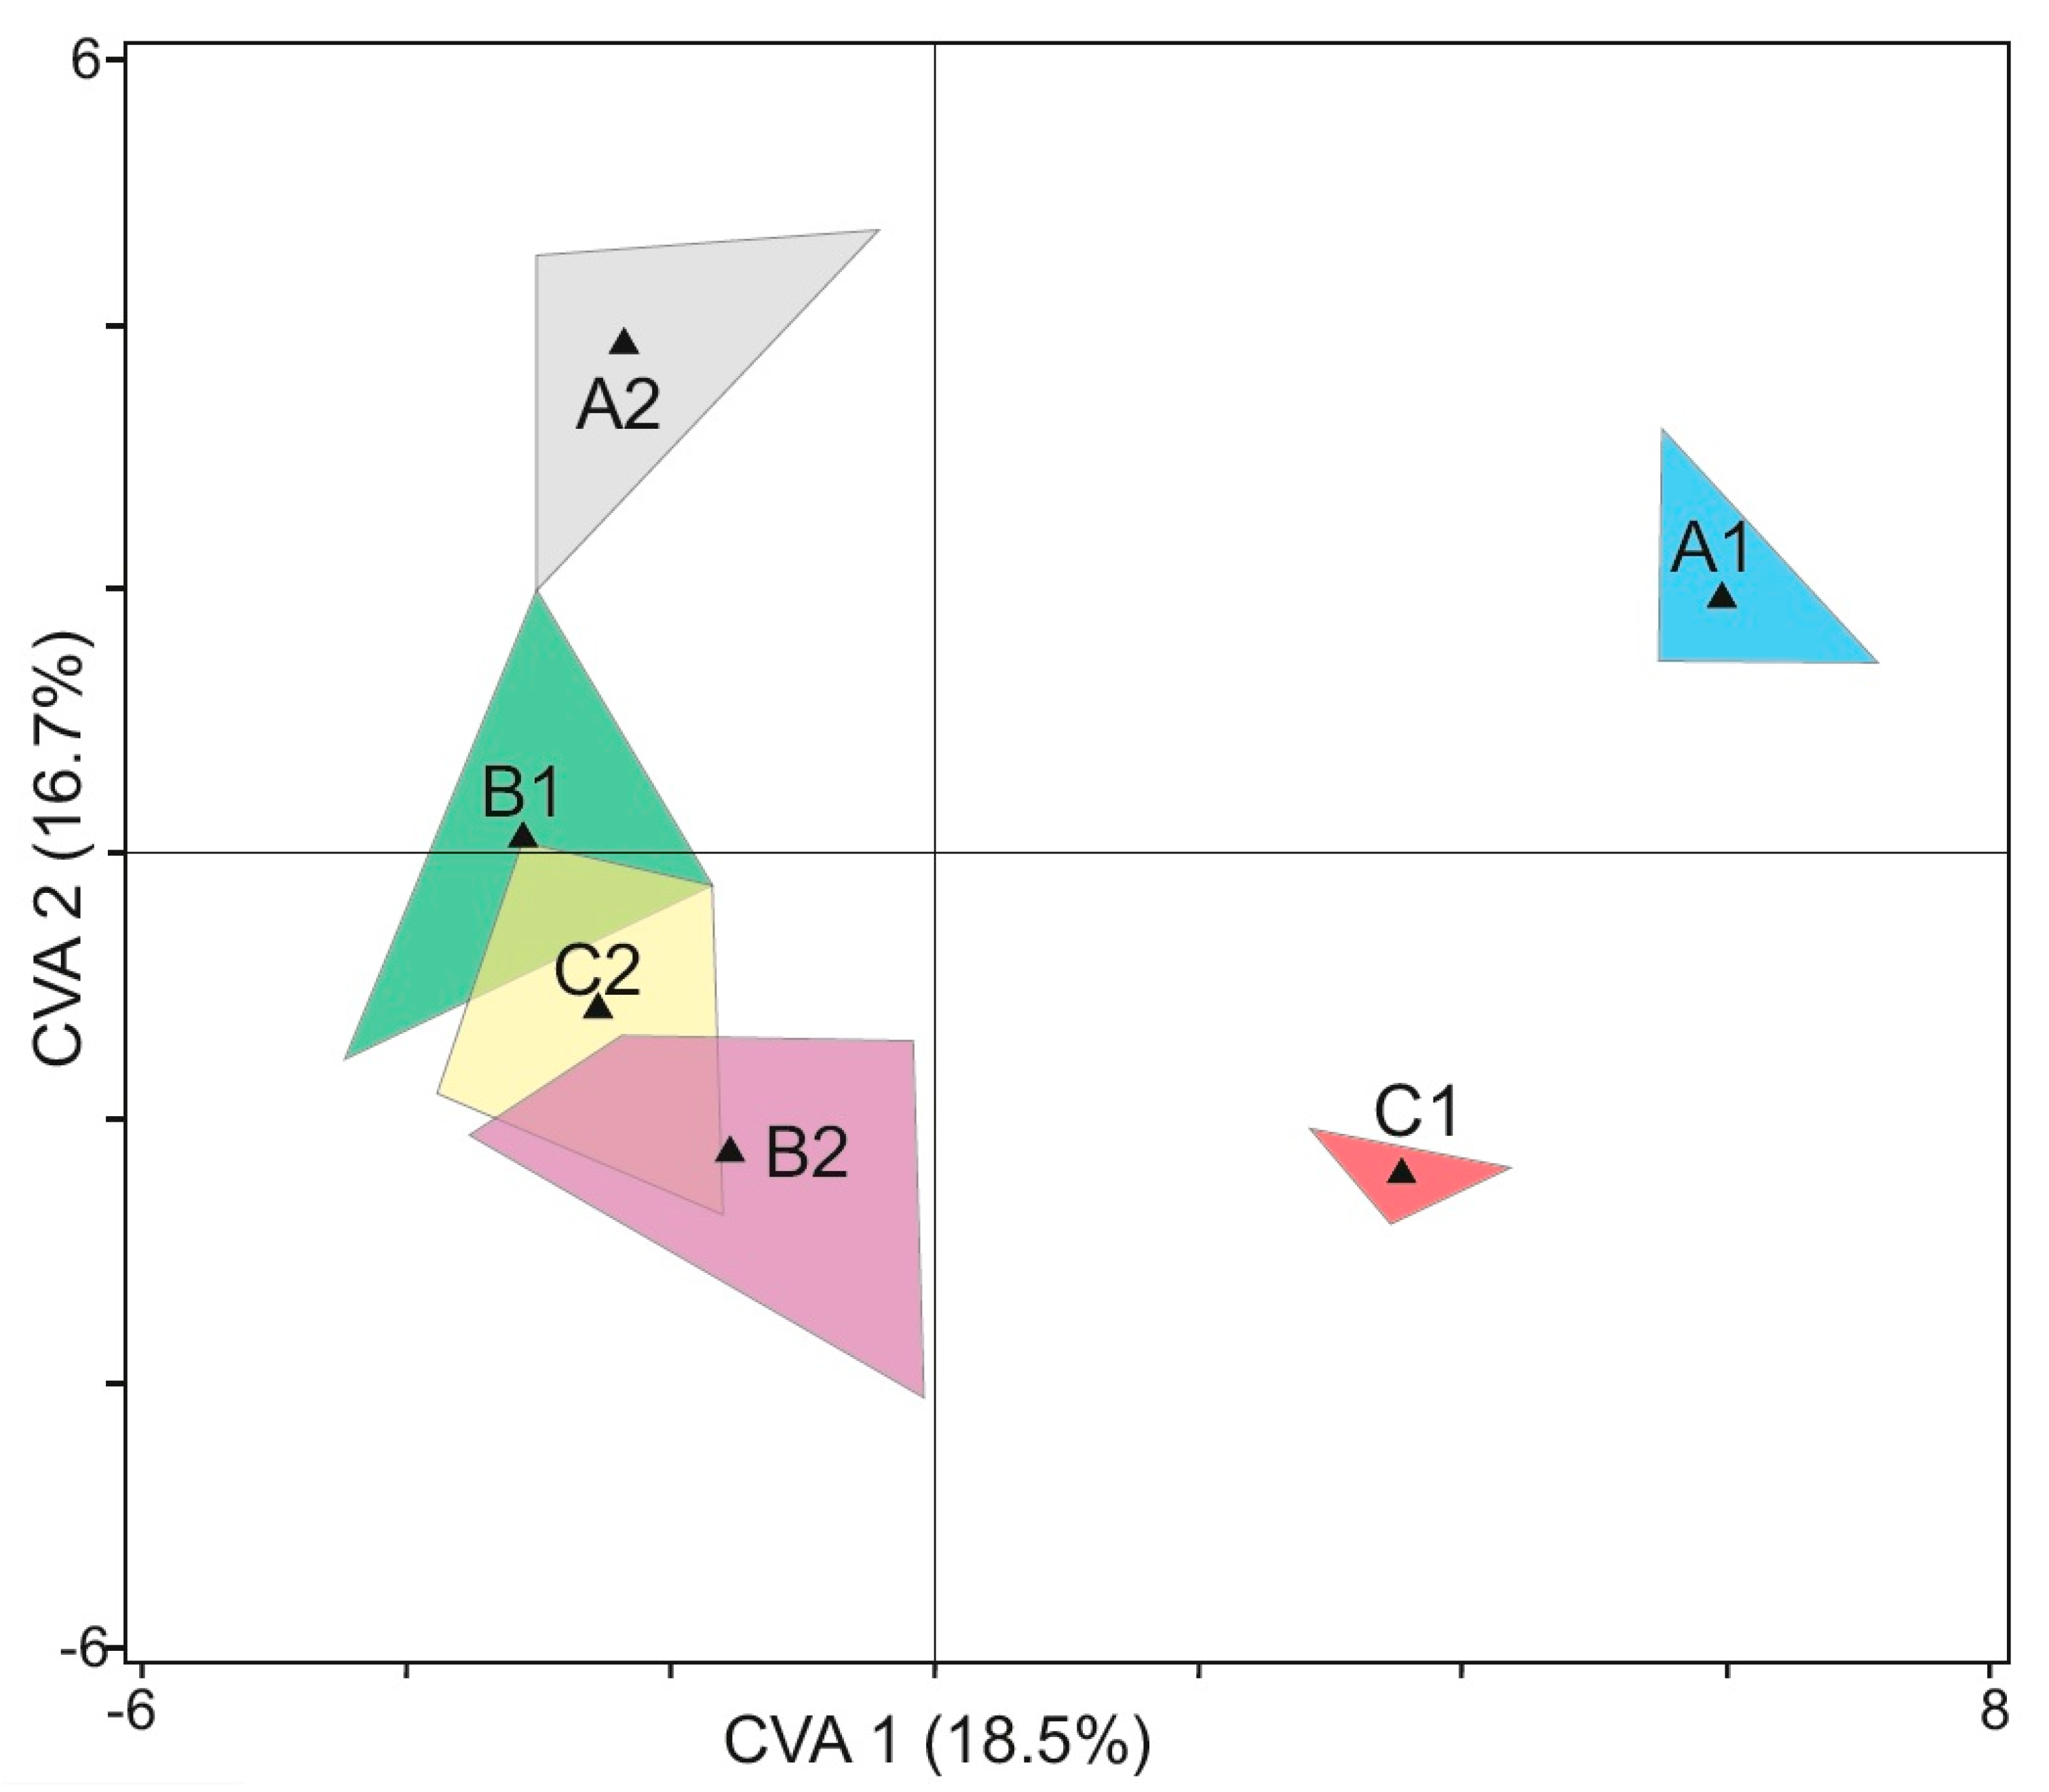
3.7. Canonical Variate Analysis (CVA)

CVA explains 60.4% of the variability, the axis CVA 1 (18.5%), while axis CVA 2 (16.7%) (Figure 7). The diversities in all traits, as measured with Mahalanobis distances are shown in Table S2. The Wilks’ lambda test (0.00234) did not show that the variables taken for the analysis significantly discriminated between the variants of the experiment (F65.32 = 1.2932, p < 0.2149).

4. Conclusions

Present study reveals that various row spacing and sowing density do not affect the productivity of soybeans directly, which confirms the high phenotypic plasticity of soybean plants dependent on thermal and precipitation factors in a given cultivation region. The use of lower sowing densities, regardless of the row spacing in variants A1 (15/70) and A2 (30/70), resulted in higher values of the yield structure parameters (number of pods and seeds per plant, seed mass), number and dry mass of nodules on the roots. In addition, lower plant density per unit area due to better access of light to plants resulted in lower susceptibility to stress and favoured greater efficiency of the soybean photosynthesis process, and in the longer term generates lower costs associated with the purchase of seed material of this species.

Supplementary Materials

The following are available online at https://www.mdpi.com/2073-4395/11/2/403/s1, Table S1: Correlation between selected measurements. Table S2: Squared Mahalanobis distances between variants of experiments.

Author Contributions

Conceptualization, M.J.-P., J.B., D.B.-J., E.S.-K., R.T.-S., and W.J.; methodology, D.B.-J., E.S.-K., R.T.-S., J.B., W.J. and M.J.-P.; investigation, M.J.-P., D.B.-J., E.S.-K., R.T.-S., J.B. and W.J.; writing—original draft preparation, M.J.-P.; writing—review and editing, J.B., E.S.-K. and D.B.-J. All authors have read and agreed to the published version of the manuscript.

Funding

This study was made possible by a grant from the Polish Ministry of Agriculture and Rural Development, Project: Improving domestic sources of plant protein, their production, trading and use in animal feed, project No. HOR 3.3/2016–2020. This work was financed by the program of the Minister of Science and Higher Education named “Regional Initiative of Excellence” in the years 2019–2022, project number 026/RID/2018/19, the amount of financing PLN 9 542 500.00.

Institutional Review Board Statement

Not applicable.

Informed Consent Statement

Not applicable.

Data Availability Statement

The data presented in this study are available in Supplementary Materials.

Conflicts of Interest

The authors declare no conflict of interest.

References

  1. Panasiewicz, K.; Faligowska, A.; Szymańska, G.; Szukała, J.; Ratajczak, K.; Sulewska, H. The effect of various tillage systems on productivityof narrow-leaved lupin-winter wheat-winter triticale-winter barley rotation. Agronomy 2020, 10, 304. [Google Scholar] [CrossRef] [Green Version]
  2. FAOSTAT. Available online: http://www.fao.org/faostat/en/#data/QC (accessed on 2 February 2021).
  3. Singh, G. The Soybean: Botany, Production and Uses; CABI: Wallingford, CT, USA, 2010; ISBN 978-1-84593-644-0. [Google Scholar]
  4. Qin, J.; Zhang, J.; Liu, D.; Yin, C.; Wang, F.; Chen, P.; Chen, H.; Ma, J.; Zhang, B.; Xu, J. iTRAQ-based analysis of developmental dynamics in the soybean leaf proteome reveals pathways associated with leaf photosynthetic rate. Mol. Genet. Genom. 2016, 291, 1595–1605. [Google Scholar] [CrossRef] [PubMed]
  5. de Portes, T.A.; de Araújo, B.R.B. Comparison of the allocation of phytomass in soybean and bean and its potential role in biological nitrogen fixation. Acta Sci. Agron. 2012, 34, 285–292. [Google Scholar] [CrossRef]
  6. Zou, H.; Zhang, N.-N.; Pan, Q.; Zhang, J.-H.; Chen, J.; Wei, G.-H. Hydrogen sulfide promotes nodulation and nitrogen fixation in soybean—Rhizobia symbiotic system. Mol. Plant Microbe Interact. 2019, 32, 972–985. [Google Scholar] [CrossRef]
  7. Soares, I.O.; de Rezende, P.M.; Bruzi, A.T.; Zuffo, A.M.; Zambiazzi, E.V.; Fronza, V.; Teixeira, C.M. Interaction between soybean cultivars and seed density. Am. J. Plant Sci. 2015, 6, 1425–1434. [Google Scholar] [CrossRef] [Green Version]
  8. Souza, R.T.G.; Teixeira, I.R.; Jesus, F.F.; Reis, E.F. Spray droplet spectrum and spray deposition in different soybean sowing systems. Aust. J. Crop Sci. 2017, 11, 1195–1202. [Google Scholar] [CrossRef]
  9. Rahman, M.M.; Hossain, M.M. Plant density effects on growth, yield and yield components of two soybean varieties under equidistant planting arrangement. Asian J. Plant Sci. 2011, 10, 278–286. [Google Scholar] [CrossRef] [Green Version]
  10. Ribeiro, A.B.M.; Bruzi, A.T.; Zuffo, A.M.; Zambiazzi, E.V.; Soares, I.O.; Vilela, N.J.D.; de Pereira, J.L.A.; Moreira, S.G. Productive performance of soybean cultivars grown in different plant densities. Cienc. Rural 2017, 47, 1–8. [Google Scholar] [CrossRef] [Green Version]
  11. Sobko, O.; Hartung, J.; Zikeli, S.; Claupein, W.; Gruber, S. Effect of sowing density on grain yield, protein and oil content and plant morphology of soybean (Glycine max L. Merrill). Plant Soil Environ. 2019, 65, 594–601. [Google Scholar] [CrossRef] [Green Version]
  12. Cox, W.J.; Cherney, J.H. Growth and yield responses of soybean to row spacing and seeding rates. Agron. J. 2011, 103, 123–128. [Google Scholar] [CrossRef]
  13. Kozak, M.; Malarz, W.; Serafin-Andrzejewska, M.; Kotecki, A. The effects of sowing rate and Asahi SL biostimulator on soybean growth and yield. In Biostimulators in Modern Agriculture. Field Crops; Dąbrowski, Z.T., Ed.; Editorial House Wieś Jutra: Warsaw, Poland, 2008; pp. 77–84. [Google Scholar]
  14. Kozak, M.; Malarz, W.; Serafin-Andrzejewska, M.; Kotecki, A. The effects of different sowing rate and Asahi SL treatments on soybean seed sowing value. In Biostimulators in Modern Agriculture. Field Crops; Dąbrowski, Z.T., Ed.; Editorial House Wieś Jutra: Warsaw, Poland, 2008; pp. 85–91. [Google Scholar]
  15. Dima, D.C. Results of soybean time of sowing and distance between rows in Romania in the experimental years 2015 and 2016. Sci. Pap. Ser. A Agron. 2017, 60, 229–235. [Google Scholar]
  16. Devlin, D.L.; Fjell, D.L.; Shroyer, J.P.; Gorden, W.B.; Marsh, B.H.; Maddux, L.D.; Martin, V.; Duncan, S.R. Row spacing and rates of soybean in low and high yielding environments. J. Prod. Agric. 1995, 8, 215–222. [Google Scholar] [CrossRef]
  17. De Bruin, J.L.; Pedersen, P. Effect of row spacing and seeding rate on soybean yield. Agron. J. 2008, 100, 704–710. [Google Scholar] [CrossRef]
  18. Prusiński, J.; Nowicki, R. Effect of planting density and row spacing on the yielding of soybean (Glycine max L. Merrill). Plant Soil Environ. 2020, 66, 616–623. [Google Scholar] [CrossRef]
  19. Randelović, P.; Ðordević, V.; Milić, S.; Balešević-Tubić, S.; Petrović, K.; Miladinović, J.; Ðukić, V. Prediction of soybean plant density using a machine learning model and vegetation indices extracted from RGB images taken with a UAV. Agronomy 2020, 10, 1108. [Google Scholar] [CrossRef]
  20. Cheng, B.; Raza, A.; Wang, L.; Xu, M.; Lu, J.; Gao, Y.; Qin, S.; Zhang, Y.; Ahmad, I.; Zhou, T.; et al. Effects of multiple planting densities on lignin metabolism and lodging resistance of the strip intercropped soybean stem. Agronomy 2020, 10, 1177. [Google Scholar] [CrossRef]
  21. Liu, X.; Rahman, T.; Yang, F.; Yang, S.C.; Yong, T.; Jiang, L.; Zhang, C.; Yang, W. PAR interception and utilization in different maize and soybean intercropping patterns. PLoS ONE 2017, 12, 0169218. [Google Scholar] [CrossRef] [PubMed]
  22. Wu, Y.; Gong, W.; Yang, W. Shade inhibits leaf size by controlling cell proliferation and enlargement in soybean. Sci. Rep. 2017, 7, 9259. [Google Scholar] [CrossRef] [PubMed]
  23. Munger, P.; Bleuholder, H.; Hack, H.; Hess, M.; Stauss, R.; van den Boom, T.; Weber, E. Phenological growth stages of soybean plant (Glycine max L. Merr.): Codification and description according to the BBCH scale. J Agron. Crop Sci. 1997, 179, 209–217. [Google Scholar] [CrossRef]
  24. IUSS Working Group WRB. International soil classification system for naming soils and creating legends for soil maps. In Word Reference Base for Soil Resources 2014, Update 2015; Word Soil Resources Reports No. 106; FAO: Rome, Italy, 2015; pp. 172–173. [Google Scholar]
  25. Skowera, B. Changes of hydrothermal conditions in the Polish area (1971–2010). Fragm. Agron. 2014, 31, 74–87. (In Polish) [Google Scholar]
  26. Maxwell, K.; Johnson, G.N. Chlorophyll fluorescence—A practical guide. J. Exp. Bot. 2000, 51, 659–668. [Google Scholar] [CrossRef]
  27. Campbell, N.A.; Atchley, W.R. The geometry of canonical variate analysis. Syst. Zool. 1981, 30, 268–280. [Google Scholar] [CrossRef]
  28. Lepš, J.; Šmilauer, T. Multivariate Analysis of Ecological Data Using CANOCO; Cambridge University Press: Cambridge, UK, 2003. [Google Scholar]
  29. ter Braak, C.J.F.; Šmilauer, P. Canoco Reference Manual and User’s Guide: Software for Ordination (Version 5.0); Microcomputer Power: Ithaca, NY, USA, 2012; 496p. [Google Scholar]
  30. Fan, Y.; Chen, J.; Wang, Z.; Tan, T.; Li, S.; Li, J.; Wang, B.; Zhang, J.; Cheng, Y.; Wu, X.; et al. Soybean (Glycine max L. Merr.) seedlings response to shading: Leaf structure, photosynthesis and proteomic analysis. BMC Plant Biol. 2019, 19, 34. [Google Scholar] [CrossRef] [Green Version]
  31. Gong, W.; Qi, P.; Du, J.; Sun, X.; Wu, X.; Song, C.; Liu, W.; Wu, Y.; Yu, X.; Yong, T.; et al. Transcriptome analysis of shade-induced inhibition on leaf size in relay intercropped soybean. PLoS ONE. 2014, 9, e98465. [Google Scholar] [CrossRef] [Green Version]
  32. Evans, J.R.; Poorter, H. Photosynthetic acclimation of plants to growth irradiance: The relative importance of specific leaf area and nitrogen partitioning in maximizing carbon gain. Plant Cell Environ. 2001, 24, 755–767. [Google Scholar] [CrossRef]
  33. Fritschi, F.B.; Ray, J.D. Soybean leaf nitrogen, chlorophyll content, and chlorophyll a/b ratio. Photosynthetica 2007, 45, 92–98. [Google Scholar] [CrossRef]
  34. Hussain, S.; Iqbal, N.; Brestic, M.; Raza, M.A.; Pang, T.; Langham, D.R.; Safdar, M.E.; Ahmeda, S.; Wena, B.; Gao, Y.; et al. Changes in morphology, chlorophyll fluorescence performance and Rubisco activity of soybean in response to foliar application of ionic titanium under normal light and shade environment. Sci. Total Environ. 2019, 658, 626–637. [Google Scholar] [CrossRef]
  35. Yao, X.; Li, C.; Li, S.; Zhu, Q.; Zhang, H.; Wang, H.; Yu, C.; Martin, S.K.S.; Xie, F. Effect of shade on leaf photosynthetic capacity, light-intercepting, electron transfer and energy distribution of soybeans. Plant Growth Regul. 2017, 83, 1–8. [Google Scholar] [CrossRef]
  36. Murchie, E.H.; Lawson, T. Chlorophyll fluorescence analysis: A guide to good practice and understanding some new applications. J. Exp. Bot. 2013, 13, 3983–3998. [Google Scholar] [CrossRef] [PubMed] [Green Version]
  37. Gratani, L.; Catoni, R.; Pirone, G.; Frattaroli, A.R.; Varone, L. Physiological and morphological leaf trait variations in two Apennine plant species in response to different altitudes. Photosynthetica 2012, 50, 15–23. [Google Scholar] [CrossRef]
  38. Khalid, M.H.B.; Raza, M.A.; Yu, H.Q.; Sun, F.A.; Zhang, Y.Y.; Lu, F.Z.; Si, L.; Iqbal, N.; Khan, I.; Fu, F.L.; et al. Effect of shade treatments on morphology, photosynthetic and chlorophyll fluorescence characteristics of soybeans (Glycine max L. Merr.). Appl. Ecol. Environ. Res. 2019, 17, 2551–2569. [Google Scholar] [CrossRef]
  39. De Luca, M.J.; Nogueira, M.A.; Hungria, M. Feasibility of lowering soybean planting density without compromising nitrogen fixation and yield. Agron. Soil Environ. Qulit. 2014, 106, 2118–2124. [Google Scholar] [CrossRef] [Green Version]
  40. De Luca, M.J.; Hungria, M. Plant densities and modulation of symbiotic nitrogen fixation in soybean. Sci. Agric. 2014, 71, 181–187. [Google Scholar] [CrossRef] [Green Version]
  41. Piper, E.L.; Boote, K.J. Temperature and cultivar effects on soybean seed oil and protein concentrations. J. Am. Oil Chem. Soc. 1999, 76, 1233–1241. [Google Scholar] [CrossRef]
  42. Carciochi, W.D.; Schwalbert, R.; Andrade, F.H.; Corassa, G.M.; Carter, P.; Gaspar, A.P.; Schmidt, J.; Ciampitti, I.A. Soybean seed yield response to plant density by yield environment in North America. J. Agron. 2019, 111, 1923–1932. [Google Scholar] [CrossRef] [Green Version]
  43. Souza, R.; Teixeira, I.; Reis, E.; Silva, A. Soybean morphophysiology and yield response to seeding systems and plant populations. Chil. J. Agric. Res. 2016, 76, 1. [Google Scholar] [CrossRef] [Green Version]
  44. Rębilas, K.; Bacior, M.; Klimek-Kopyra, A.; Zając, T. A mode for the yield losses estimation in an early soybean (Glycine max L. Merr.) cultivar depending on the cutting height at harvest. Field Crops Res. 2020, 254, 107846. [Google Scholar] [CrossRef]
  45. Gong, W.Z.; Jiang, C.D.; Wu, Y.S.; Chen, H.H.; Liu, W.Y.; Yang, W.Y. Tolerance vs. avoidance: Two strategies of soybean (Glycine max) seedlings in response to shade in intercropping. Photosynthetica 2015, 53, 259–268. [Google Scholar] [CrossRef]
  46. Jarecki, W. Reaction of soybean (Glycine max (L.) Merr.) to seed inoculation with Bradyrhizobium japonicum bacteria. Plant Soil Environ. 2020, 66, 242–247. [Google Scholar] [CrossRef]
  47. Bellaloui, H.; Bruns, H.A.; Abbas, H.K.; Mengistu, A.; Fisher, D.K.; Reddy, N.K. Effects of row-type, row-spacing, seeding rate, soil-type, and cultivar differences on soybean seed nutrition under us Mississippi Delta conditions. PLoS ONE 2015, 10, 1–23. [Google Scholar] [CrossRef] [PubMed]
  48. Ferreira, A.S.; Balbinot, A.A., Jr.; Werner, F.; Zucareli, C.; Franchini, J.C.; Debiasi, H. Plant density and mineral nitrogen fertilization influencing yield, yield components and concentration of oil and protein in soybean grains. Soil Sci. Plant Nutr. 2016, 75, 362–370. [Google Scholar] [CrossRef] [Green Version]
Figure 1. Mean monthly air temperature and precipitation in 2016–2019.
Agronomy 11 00403 g001
Figure 2. Effect of row spacing and sowing density on soil plant analysis development (SPAD) of soybean (a) between variants of the experiment during the 3-years study (b) between years of research. Lowercase letters indicate significant differences between the means in the measurement phases, capital letters indicate significant differences between means in the years of research according to ANOVA (followed by Tukey’s HSD test, p = 0.05).
Agronomy 11 00403 g002
Figure 3. Effect of row spacing and sowing density on maximum quantum yield of photosystem II (PSII)—Fv/Fm in soybean leaves (a) between variants of the experiment during the 3-years study (b) between years of research. Lowercase letters indicate significant differences between the means in the measurement phases, capital letters indicate significant differences between means in the years of research according to ANOVA (followed by Tukey’s HSD test, p = 0.05).
Agronomy 11 00403 g003
Figure 4. Effect of row spacing and sowing density on maximum quantum yield of primary photochemistry—Fv/F0 in soybean leaves (a) between variants of the experiment during the 3-years study (b) between years of research. Lowercase letters indicate significant differences between the means in the measurement phases, capital letters indicate significant differences between means in the years of research according to ANOVA (followed by Tukey’s HSD test, p = 0.05).
Agronomy 11 00403 g004
Figure 5. Effect of row spacing and sowing density on performance index (PI) in soybean leaves (a) between variants of the experiment during the 3-years study (b) between years of research. Lowercase letters indicate significant differences between the means in the measurement phases, capital letters indicate significant differences between means in the years of research according to ANOVA (followed by Tukey’s HSD test, p = 0.05).
Agronomy 11 00403 g005
Figure 6. Effect of row spacing and sowing density on Leaf Area Index (LAI) of soybean (a) between variants of the experiment during the 3-years study (b) between years of research. Lowercase letters indicate significant differences between the means in the measurement phases, capital letters indicate significant differences between means in the years of research according to ANOVA (followed by Tukey’s HSD test, p = 0.05).
Agronomy 11 00403 g006
Figure 7. Distribution of combinations of treatments in two first canonical varieties. Variants of experiment: row spacing/seeding density: A1 (15/70), B1 (15/90), C1 (15/110) and A2 (30/70), B2 (30/90), C2 (30/110). Black triangles represent centroids for each cluster (variants of the experiment).
Agronomy 11 00403 g007
Table 1. Agrotechnical treatments carried out in the study.
Treatment201720182019
Sowing date2 May24 April24 April
Herbicide 2 May
Afalon dyspersyjny 450 SC
(linuron)
1 dm3 ha−1
27 April
Boxer 800 EC
(prosulfocarb)
4 dm3 ha−1
26 April
Boxer 800 EC
(prosulfocarb)
4 dm3 ha−1
Insecticide - -10 June
Cyperkill Max 500 EC
(cypermrthrin)
0.05 dm3 ha−1
Fungicide -25 May
Topsin M 500 SC
(methyl thiophanate)
1.5 dm3 ha−1
-
Harvest date11.09.14.09.12.09.
Table 2. Soil characterization before soybean sowing.
TraitsYears
201720182019
pH KCl6.926.036.35
Humus content (%)1.161.161.38
Content of available nutrients (mg kg−1)
P155.2153.0207.1
K196.4154.1147.0
Mg238.1102.3179.1
Fe2885.31035.02079.3
Zn13.5410.9014.50
Mn370.40116.00341.90
Cu11.433.798.21
Table 3. Sielianinov’s hydrothermic coefficients (k) in the growing season.
YearMonthMean
AprilMayJuneJulyAugustSeptember
20173.79 (eh) 2.88 (vh) 0.80 (d) 0.80 (d) 1.50 (o)2.94 (vh)2.12 (h)
20180.42 (vd)1.43 (o) 0.94 (d) 1.88 (rh) 1.70 (rh)0.88 (d)1.21 (rd)
20192.93 (vh) 4.63 (eh) 0.31 (ed) 0.82 (d) 1.47 (o)1.86 (rh)2.00 (rh)
long term1.75 (rh) 1.81(rh) 1.55 (o) 1.45 (o) 1.50 (o)1.62 (rh)1.61(rh)
Coefficient (k) value [25]: ed–extremely dry, vd–very dry, d–dry, rd–rather dry, o–optimal, rh–rather humid, h–humid, vh–very humid, eh–extremely humid.
Table 4. Effect of row spacing and sowing density on seed yield and structural yield components of soybean.
FactorSeed Yield
[tha−1]
Number of Pods Per Plant
[pcs.]
Number of Seeds Per Plant
[pcs.]
Seed Weight Per Plant
[g]
Thousand Seeds Weight
[g]
Row Spacing [cm] (S)Sowing Density [pcs.m−2] (D)
15704.84 a ± 0.5427.6 b ± 9.557.0 c ± 10.68.23 c ± 1.27146 a ± 18
904.95 a ± 0.4820.4 ab ± 4.545.1 ab ± 7.47.61 c ± 0.97173 b ± 39
1104.91 a ± 0.4219.9 a ± 9.042.9 a ± 8.76.01 ab ± 1.05142 a ± 18
30704.73 a ± 0.4824.6 ab ± 8.650.8 bc ± 9.67.82 c ± 0.99157 a ± 23
904.87 a ± 0.4023.6 ab ± 5.845.4 ab ± 6.96.65 b ± 0.80148 a ± 17
1104.85 a ± 0.3518.5 a ± 5.441.0 a ± 9.05.75 a ± 1.17141 a ± 12
15 4.90 a ± 0.4722.6 a ± 8.548.3 a ± 10.87.28 b ± 1.43154 a ± 30
30 4.82 a ± 0.4122.2 a ± 7.145.7 a ± 9.36.74 a ± 1.29148 a ± 19
704.78 a ± 0.5026.1 b ± 9.053.9 b ± 10.48.02 c ± 1.13151 b ± 21
904.91 a ± 0.4322.0 ab ± 5.345.2 a ± 7.07.13 b ± 1.00161 c ± 32
1104.88 a ± 0.3819.2 a ± 7.342.0 a ± 8.75.88 a ± 1.10141 a ± 15
Year (Y)
20174.51 a ± 0.3020.1 a ± 4.242.6 a ± 9.15.98 a ± 1.35140 a ± 5
20185.33 c ± 0.2919.3 a ± 5.842.9 a ± 6.17.31 b ± 0.92173 b ± 30
20194.74 b ± 0.2227.9 b ± 9.455.5 b ± 8.87.74 b ± 1.22140 a ± 14
Mean4.86 ± 0.4422.4 ± 7.847.0 ± 10.07.01 ± 1.38151 ± 25
Snsnsns**ns
Dns***********
Y***************
S × Dnsnsnsns***
S × Ynsnsnsnsns
D × Ynsns**ns**
S × D × Ynsnsnsns*
The results are presented as mean values ± standard deviation. Different letters in the same column indicate significant differences (p = 0.05), according to ANOVA followed by Tukey’s test. *, **, *** and ns mean ≤0.05, ≤0.01, <0.001, and not significant, respectively.
Table 5. Effect of row spacing and sowing density on morphology traits and nodules of soybean plants.
FactorPlant Height
[cm]
1st. Pod Height
[cm]
Number of Nodules Per Plant
[pcs.]
Dry Weight of Nodules Per Plant
[g]
Row Spacing [cm] (S)Sowing Density [pcs.m−2] (D)
157085.7 a–c ± 14.213.9 bc ± 1.922.1 ab ± 5.80.325 ab ± 0.062
9087.9 bc ± 15.414.0 bc ± 1.322.1 ab ± 6.10.295 ab ± 0.074
11091.2 c ± 18.414.5 c ± 1.320.7 ab ± 4.20.280 ab ± 0.097
307080.2 a ± 11.812.2 a ± 1.325.0 b ± 4.20.330 b ± 0.105
9083.7 ab ± 14.712.8 ab ± 1.123.0 a ± 6.40.250 a ± 0.036
11087.0 bc ± 15.113.3 a-c ± 1.418.9 a ± 4.20.249 a ± 0.091
15 88.3 b ± 15.814.1 b ± 1.521.6 a ± 5.30.300 a ± 0.078
30 83.6 a ± 13.812.8 a ± 1.322.3 a ±5.50.277 a ± 0.089
7082.9 a ± 13.113.1 a ± 1.723.5 b ± 5.10.328 b ± 0.084
9085.8 a ± 14.913.4 ab ± 1.422.5 ab ± 6.10.273 a ± 0.061
11089.1 b ± 16.613.9 b ± 1.419.8 a ± 4.20.265 a ± 0.093
Year (Y)
201767.0 a ± 1.112.9 a ± 1.118.5 a ± 5.00.237 a ± 0.071
201898.6 c ± 9.313.0 a ± 1.624.7 b ± 5.60.359 b ± 0.078
201992.2 b ± 4.314.5 b ± 1.322.7 b ± 3.40.269 a ± 0.046
Mean85.9 ± 14.913.5 ± 1.522.0 ± 5.30.288 ± 0.084
S******nsns
D*******
Y************
S × Dnsnsnsns
S × Y****ns*
D × Ynsnsnsns
S × D × Ynsns**ns
The results are presented as mean values ± standard deviation. Different letters in the same column indicate significant differences (p = 0.05), according to ANOVA followed by Tukey’s test. *, **, *** and ns mean ≤0.05, ≤0.01, <0.001, and not significant, respectively.
Table 6. Effect of row spacing and sowing density on chemical seed composition and protein and oil yield.
FactorProtein Content
[% Dry Matter]
Protein Yield
[kgha−1]
Oil Content
[% Dry Matter]
Oil Yield
[kgha−1]
Row Spacing [cm] (S)Plant Density [pcs.m−2] (D)
157035.4 a ± 2.51673 a ± 26722.6 a ± 0.81066 a ± 152
9036.8 b ± 3.41736 a ± 21822.4 a ± 1.11063 a ± 153
11036.1 ab ± 2.91685 a ± 17822.6 a ± 1.11057 a ± 117
307036.7 b ± 3.61810 a ± 17322.5 a ± 1.31113 a ± 131
9036.9 b ± 3.01725 a ± 21522.5 a ± 0.71053 a ± 87
11036.7 b ± 2.51846 a ± 14822.4 a ± 0.71134 a ± 138
15 36.1 a ± 2.81698 a ± 21222.5 a ± 1.01062 a ± 133
30 36.8 b ± 2.91794 b ± 17822.5 a ± 0.91100 a ± 119
7036.0 a ± 3.01742 a ± 22622.5 a ± 1.11089 a ± 138
9036.8 b ± 3.11730 a ± 20722.5 a ± 0.91058 a ± 118
11036.4 ab ± 2.61765 a ± 17722.5 a ± 0.91095 a ± 129
Year (Y)
201734.6 a ± 1.01526 a ± 12923.3 c ± 0.51030 a ± 77
201840.2 b ± 1.21854 b ± 13721.4 a ± 0.5990 a ± 78
201934.5 a ± 0.51858 b ± 10622.7 b ± 0.31222 b ± 70
Mean36.4 ± 2.91746 ± 19922.5 ± 0.91081 ± 126
S***nsns
D*nsnsns
Y************
S × Dnsnsnsns
S × Y*nsnsns
D × Y*nsnsns
S × D × Y*nsnsns
The results are presented as mean values ± standard deviation. Different letters in the same column indicate significant differences (p = 0.05), according to ANOVA followed by Tukey’s test. *, **, *** and ns mean ≤0.05, ≤0.01, <0.001, and not significant, respectively.
Publisher’s Note: MDPI stays neutral with regard to jurisdictional claims in published maps and institutional affiliations.

