Article

Ghanaian Cocoa (Theobroma cacao L.) Bean Shells Coproducts: Effect of Particle Size on Chemical Composition, Bioactive Compound Content and Antioxidant Activity

by
Carmen Botella-Martínez
1,
Raquel Lucas-Gonzalez
1,
Carmen Ballester-Costa
1,
José Ángel Pérez-Álvarez
1,
Juana Fernández-López
1,
Johannes Delgado-Ospina
2,3,
Clemencia Chaves-López
1,2 and
Manuel Viuda-Martos
1,*
1
IPOA Research Group, Agro-Food Technology Department, Escuela Politécnica Superior de Orihuela, Universidad Miguel Hernández de Elche, Orihuela, 03312 Alicante, Spain
2
Faculty of Bioscience and Technology for Food, Agriculture and Environment, University of Teramo, Via R. Balzarini 1, 64100 Teramo, Italy
3
Grupo de Investigación Biotecnología, Facultad de Ingeniería, Universidad de San Buenaventura Cali, Carrera 122 # 6-65, 76001 Cali, Colombia
*
Author to whom correspondence should be addressed.
Agronomy 2021, 11(2), 401; https://doi.org/10.3390/agronomy11020401
Submission received: 2 February 2021 / Revised: 18 February 2021 / Accepted: 18 February 2021 / Published: 23 February 2021

Abstract

:
The worldwide cocoa bean shell (CBS) generation is estimated at around 900,000 tons. In their composition, this coproduct showed several bioactive compounds like methylxanthines or polyphenolic compounds. Thus, the aim of this work was to investigate the effects of different particle sizes on the chemical composition, physico-chemical, bioactive compounds content, and antioxidant properties of flours obtained from cocoa (Theobroma cacao L.) bean shells. The flours obtained from CBS with different particle sizes had high content of dietary fiber (61.18–65.58 g/100 g). The polyphenolic profile identified seven compounds being epicatechin and catechin (values ranged 4.56–6.33 and 2.11–4.56 mg/g, respectively) as the most abundant compounds. Additionally, the methylxanthines theobromine and caffeine were quantified with values ranging from 7.12 to 12.77 and 4.02 to 6.13 mg/g, respectively. For the fatty acid profile, the principal compounds identified were oleic, stearic and palmitic acids. CBS had antioxidant capacity with all methods assayed. For DPPH, ABTS and FRAP assays values ranged between 2.35–5.53, 3.39–11.55, and 3.84–7.62 mg Trolox equivalents/g sample, respectively. This study suggests that cocoa bean shells may constitute a valuable coproduct for the food industry due to its high content in valuable bioactive compounds.

Graphical Abstract

1. Introduction

The significant generation of waste and coproducts that normal human activity produces on our planet is one of the main problems that society confronts today. For this reason, it is necessary to search for processes that allow their use, recovery, or their controlled elimination. In this way, the valorization of agro-food coproducts has received rising attention in the last decades owing to the opportunities presented to (i) obtain several bioactive compounds extract bioactive compounds and (ii) provide high added value to the existing useless waste, promoting the circular economy [1].
One of the most important crops in the world is cocoa (Theobroma cacao L.). The cocoa beans production around the world in the season 2017/2018 was 4,648,000 tons, while for the 2019/2020 harvest, the cocoa production increase approximately 2.2% being Cotê d’Ivoire and Ghana the main producing countries [2].
The chocolate industry, in the roasting process during chocolate production, generates several coproducts being the main one the cocoa shells. Cocoa shells, also known as hulls or husks, which constitutes 12–20% of the cocoa seed, are the external fractions of beans that coat the nibs [3]. In view of these data, the world generation of this coproduct could be estimated at around 900,000 tons, which is a considerable volume. Actually, the disposal of these materials typically represents a problem that is further aggravated by legal restrictions. For this reason, this coproduct is generally used as boiler fuel at cocoa/chocolate industries or could be used as compost for the soil. Nevertheless, it is very important to notice that these coproducts are hidden usable substances with a lot of market value if properly valorized. In their composition, it is possible to find several bioactive compounds such as dietary fiber, polyphenols (i.e., quercetin, quercetin-3-O-glucoside, catechin, and epicatechin), methylxanthine alkaloids (i.e., caffeine, theobromine, and theophylline) or fatty acids (i.e., oleic acid and linoleic acid) [4,5,6,7]. Thus, Hernandez-Hernandez et al. [4] carried out a study to determine the phenolic profile of 25 cocoa cotyledons and husk cultivate in Mexico. These authors reported that, in all samples analyzed, the main polyphenols were catechin, and epicatechin while the principal methylxanthines were theobromine and caffeine. In a similar study, Soares et al. [5] analyzed the polyphenolic profile of cocoa bean shell cultivated in Brazil and extracted using a simultaneous green extraction. They found that epicathechin was the main flavonoid present in cocoa bean shell followed by Procyanidin B2 and catechin whilst for methylxanthines the principal compounds quantified were theobromine and caffeine. There are numerous scientific studies showing that these compounds exert a beneficial effect in the prevention of several chronic diseases including cancer, diabetes, cardiovascular disease, or hypertension, [8,9]. However, it should be borne in mind that this chemical composition differs depending on several factors like the bean type, geographical area, and maturity stage, along with the fermentation and drying methodology use [10].
Due to the relatively high content in bioactive compounds, these coproducts might be used for another end, for example, to obtain ingredients for the development of novel food with functional properties. One way to use cocoa shells, as ingredients in the food industry, is obtaining flours. These flours can show different particle sizes, which will deeply influence both the physico-chemical and techno-functional properties, such as the type and concentration of bioactive compounds. Thus, there are several scientific works where it has been found that flours with different particle sizes significantly affect bioactive content or physico-chemical and techno-functional properties [11,12]. The changes in these properties could be due to several issues like increase of surface area, redistribution of flour components as well as the release of bioactive compounds from cells [13].
Consequently, the objective of this work was to investigate the effects of different particle sizes (Dp > 701 µm; 417 µm < Dp < 701 µm; Dp < 417 µm) on the chemical composition, physico-chemical, bioactive compounds content, and antioxidant properties of flours obtained from Ghanaian cocoa (Theobroma cacao L.) bean shells, a coproduct of cacao/chocolate industries. Thus, it is possible to obtain theoretical data for the application of these flours, as potential ingredients, in the development of novel foods.

2. Materials and Methods

2.1. Samples

Cocoa bean shells were obtained from dry and fermented cocoa (Theobroma cacao L.) cv. Forastero cultivated in Ghana. The samples were supplied by chocolates Valor (Villajoyosa, Alicante, Spain).

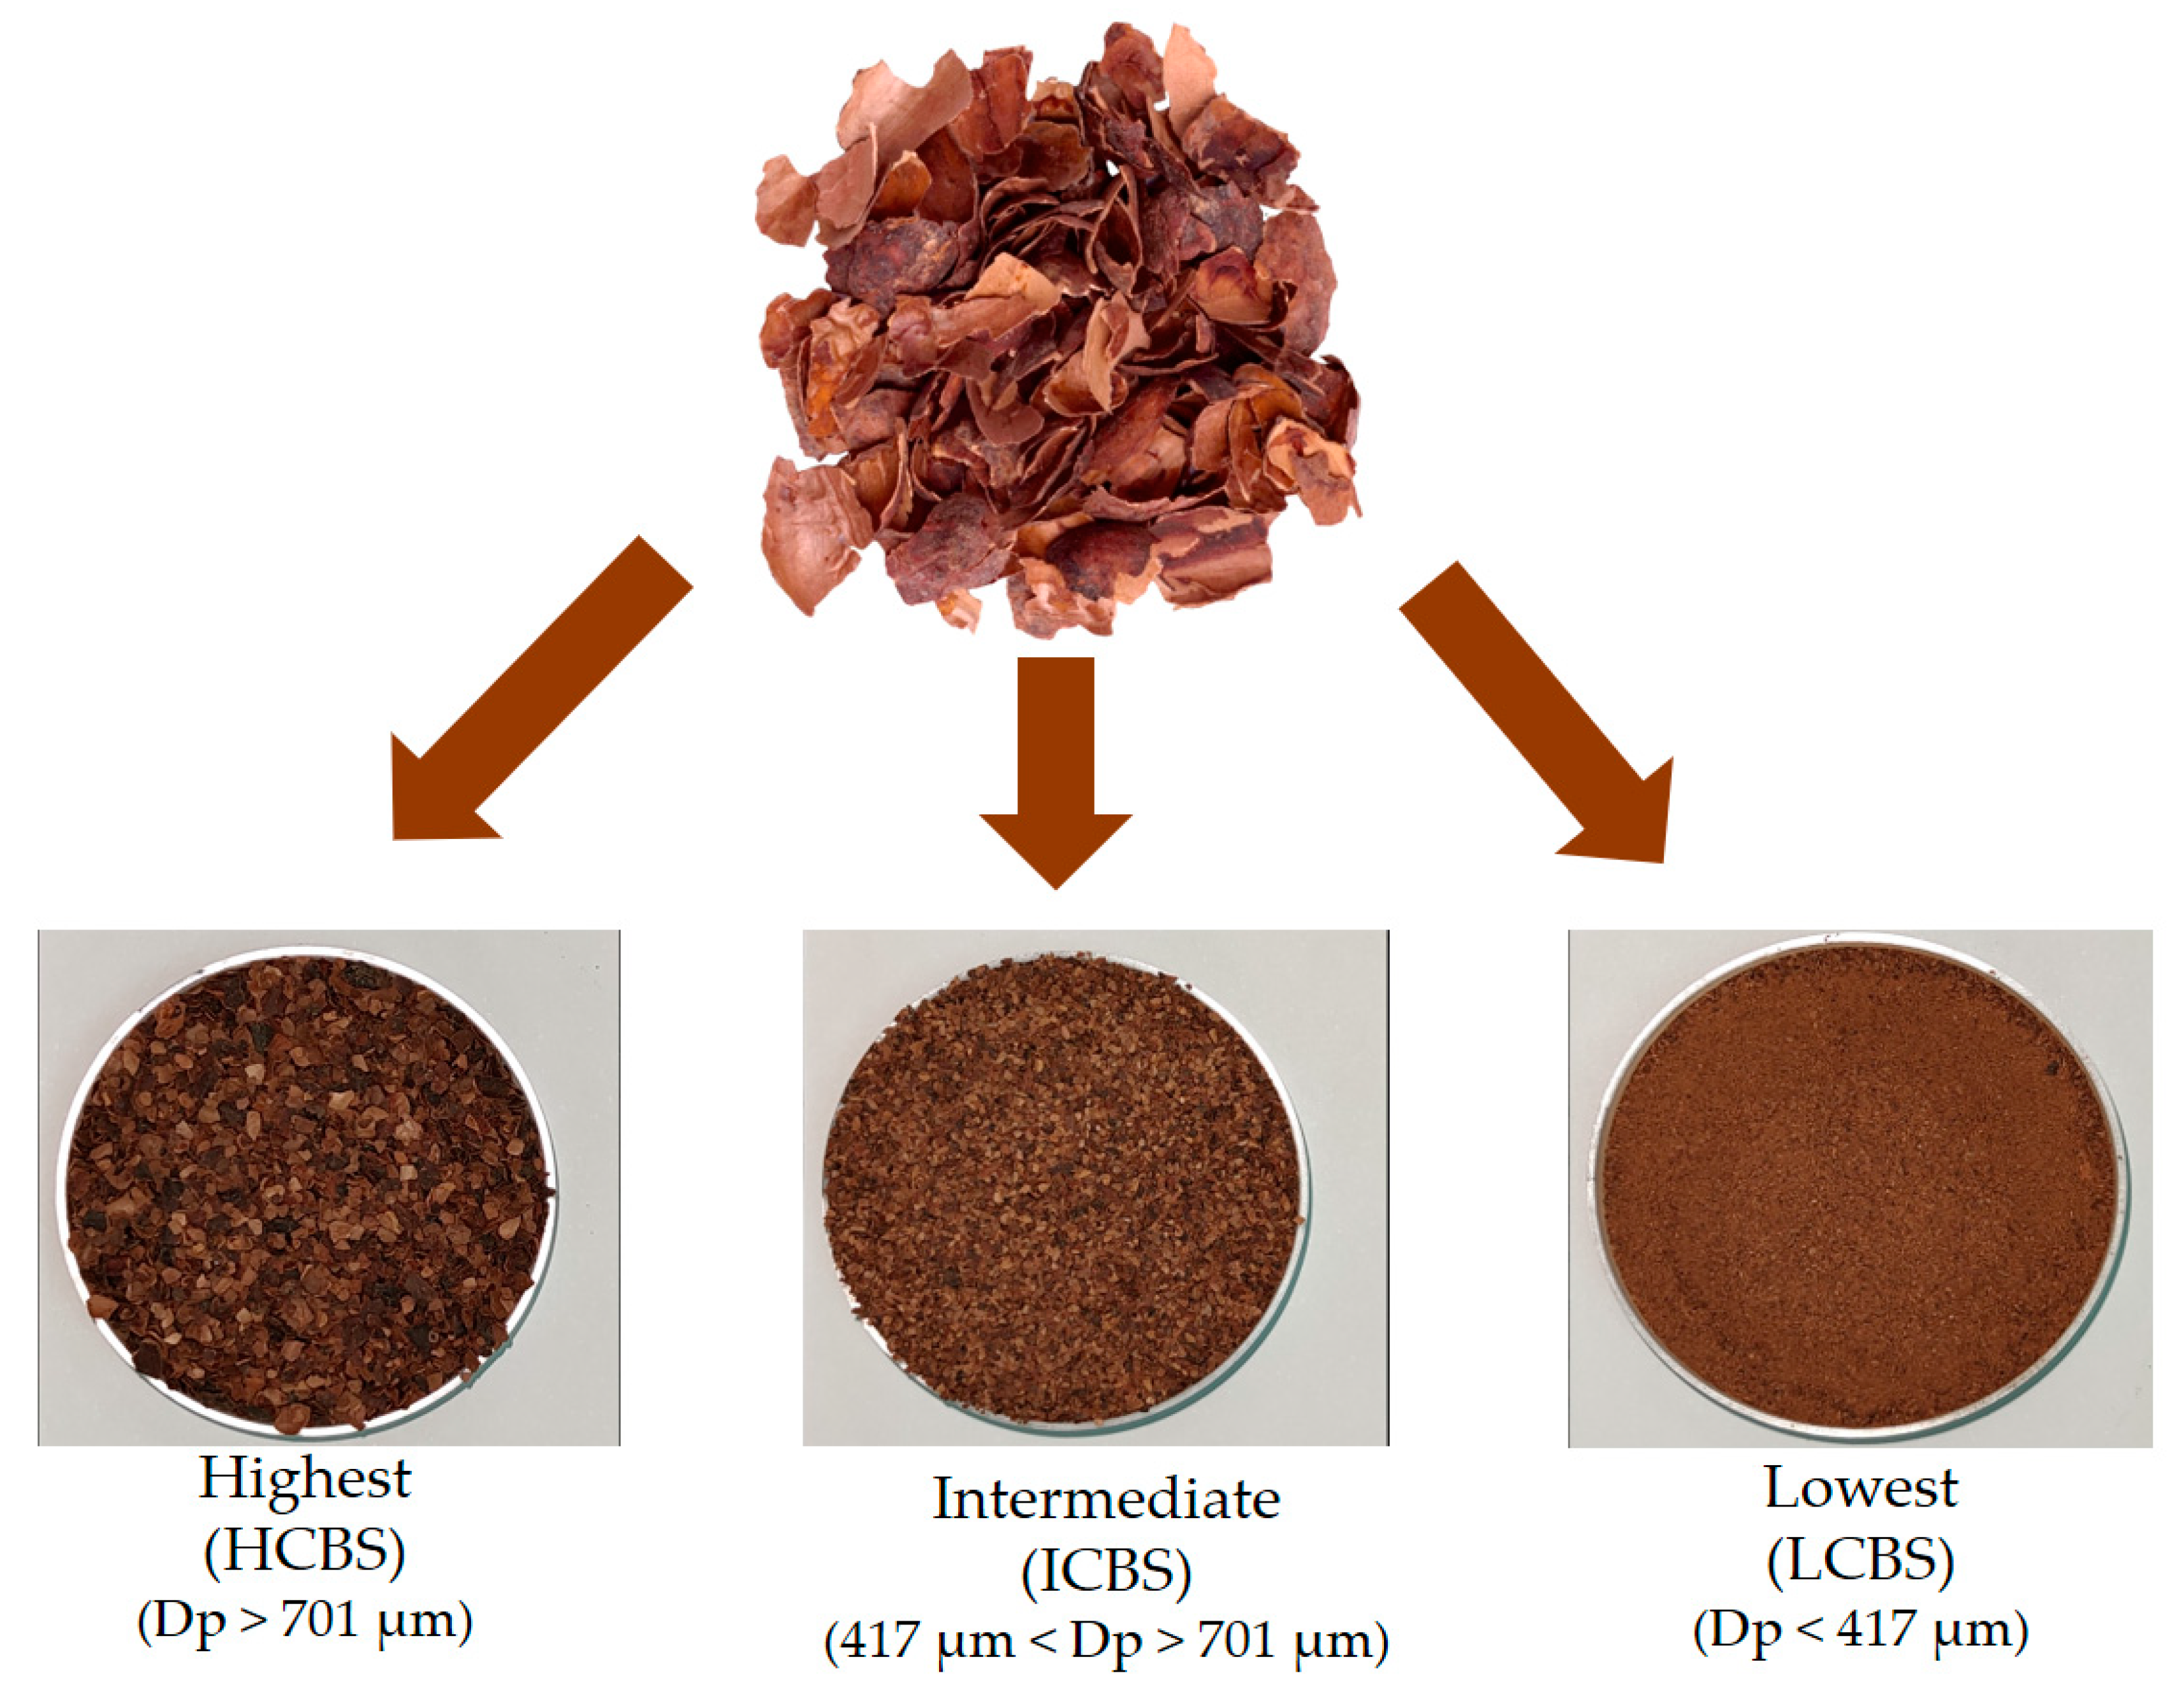
2.2. Preparation of Cocoa Bean Shells Flours with Different Particle Sizes

Cocoa bean shells were ground into powder by a knife mill (Moulinex, Barcelona, Spain) during 30 s. After that, the samples obtained were passed through the different mesh (701 and 417 µm). Then, the cocoa bean shell powder obtained was separated into three size ranges (Figure 1): highest (Dp > 701 µm) (HCBS), intermediate (417 µm < Dp < 701 µm) (ICBS), and lowest (Dp < 417 µm) (LCBS). All the samples were vacuum packed and stored in the darkness until analysis.

2.3. Chemical Composition

The fat, protein, moisture, ash, and total dietary fiber content was determined by the appropriate methodology described by the Association of Official Agricultural Chemists (AOAC) [14]. All results were expressed as g/100 g dry weight (d.w.)

2.4. Organic Acid and Sugar Content

2.4.1. Extraction of Organic Acid and Sugars

In total, 100 mL of ultrapure water, acidified with ortho-phosphoric acid (0.1% v/v), were added to 10 g of the different samples analyzed. Then, the samples were homogenized using an IKA T25 homogenizer (IKA, Staufen, Germany) for 1 min at 15,000 rpm. After that, the samples were centrifuged at 6500× g for 12 min at 4 °C and the supernatants were filtered through a 0.45 µm filter.

2.4.2. High Performance Liquid Chromatography Analysis

Organic acids and sugars were quantified according to Melgarejo-Sánchez et al. [15]. The samples (20 µL) were injected in a Hewlett-Packard 1100 series model (Woldbronn, Germany) equipped with a Supelco column (Supelcogel TM C-610H column 300 × 78 mm) and absorbance was measured at 210 nm using a diode-array detector (DAD G-1315A). The mobile phase was ortho-phosphoric acid in water (0.1% v/v) with an isocratic flow rate of 0.5 mL/min. These same HPLC conditions (elution buffer, flow rate and column) were employed for the determination of sugars. However, in this case, the detection was conducted using a refractive index detector (RID G1362A). The organic acids and sugars were identified and quantified by comparison with the standards previously injected in the same conditions.

2.5. Water Activity, pH and Color Analysis

The water activity (Aw) was examined with a hygrometer NOVASINA TH-200 (Novasina; Pfakon, Switzerland) at 25 °C. The pH was analyzed in an aqueous solution obtained from blending 2 g of each sample with 20 mL of deionized water for 10 min, using a pH-meter pH/Ion 510 (Crison, Barcelona, Spain). The color was analyzed with a CM-700 spectrophotometer (Minolta Camera Co., Osaka, Japan) with illuminant D65, observer 10° and specular component included mode. The CIELAB coordinates determined were lightness (L*), red (+a*), green (−a*), yellow (+b*), blue (−b*).

2.6. Techno-Functional Properties

Water and oil holding capacity (WHC and OHC, respectively) as well as swelling capacity analysis (SWC) was carried out according to the methods described by Chau and Huang [16]. The results were expressed as g of water or oil held by g of sample for WHC and OHC, respectively, whilst SWC results were expressed as mL water per g of sample.

2.7. Fatty Acid Profile

For the fatty acid analyses, all samples were transmethylated as described by Golay and Moulin [17]. The fatty acid methyl esters (FAMEs) were analyzed in a Gas chromatographer HP-6890 series model (Woldbronn, Germany) equipped with a flame ionization detector (FID) and a Suprawax 280 capillary column (30 m × 0.25 μm film thickness × 0.25 mm i.d.; Tecknokroma Barcelona, Spain). The injection volume was 0.2 μL in splitless and Helium was used as a carrier gas with a column inlet pressure set at 11 psi. The injector temperature was set at 250 °C whilst the detector was set at 270 °C. The temperature program was as follows: oven temperature was kept at 60 °C for 1 min; rising at 10.0 °C/min to 170 °C and held for 2 min; heating at 3 °C/min to 230 °C and held for 10 min. Finally, the temperature was increased at a rate of 2 °C/min until 260 °C and held for 1 min. The response factors were calculated with fatty acids standards and they were compared with the retention times of the FAMEs (Supelco 37 component FAME Mix, Bellefonte, PA, USA). All the samples were analyzed in triplicate and the result were expressed as mg fatty acid/g of sample.

2.8. Polyphenolic Profile

2.8.1. Extract Preparation

The extraction of polyphenolic compounds was divided in two fractions, (i) extracts with the free polyphenolic compounds and (ii) extracts with bound polyphenolic compounds. To obtain the free polyphenolic extracts, the methodology described by Genskowsky et al. [18] was used. For extraction of bounded polyphenolic compounds, the method described by Mpofu et al. [19] was followed, using the pellet remaining after the free polyphenolic compounds’ extraction. Finally, due to the sugar content present in the samples, which could interfere with the chromatographic analyses, the extracts were loaded onto a C-18 Sep-Pak cartridge, previously conditioned with 3 mL of methanol, 3 mL of ultrapure water, and 3 mL of hydrochloric acid (10 mM). Then, the cartridge was washed with 5 mL of ultrapure water and finally eluted with 3 mL acidified methanol (0.1 g/L formic acid). The extracts obtained were maintained at −40 °C until HPLC analysis.

2.8.2. High Performance Liquid Chromatography Analysis

Polyphenolic profiles of free and bound extracts obtained from all samples were determined by high performance liquid chromatography following the methodology described by Genskowsky et al. [18]. The identified compounds were quantified according to the peak area measurements, which were reported in calibration curves of the corresponding authentic standards.

2.9. Methylxanthines Determination

Caffeine and theobromine contents were determined for the hydroalcoholic extracts obtained in Section 2.8.1. The HPLC analyses were performed following the methodology proposed by Grillo et al. [3]. Quantification of caffeine and theobromine were quantified according to the peak area measurements, which were reported in calibration curves of the corresponding authentic standards.

2.10. Antioxidant Activity

The antioxidant activity of samples was assessed using four different antioxidant methodologies. Therefore, the 2,2-diphenyl-1-picrylhydrazyl radical scavenging assay (DPPH assay) was performed as described by Brand-Williams et al. [20], while the 2,2′-azinobis-(3-ethylbenzothiazoline-6-sulfonic acid) radical scavenging assay (ABTS assay) was carried out as proposed by Gullon et al. [21]. Ferric Reducing Antioxidant Power (FRAP assay) was performed as reported by Oyazu [22]. Finally, ferrous ion-chelating capacity assay (FIC assay) was measured according to the method reported by Mahdavi et al. [23]. The mixtures absorbance was measured respectively at 515, 734, 700, and 562 nm using a spectrophotometer (Thermo Spectronic Heγios γ, England). For DPPH assay, ABTS assay, and FRAP the results were expressed as mg Trolox Equivalents/g sample while for FIC assay the results were expressed as mg Ethylenediaminetetraacetic Equivalents/g sample.

2.11. Statistical Assay

All experiments were carried out in triplicate and data are reported as mean ± standard deviation. The analysis of the data consisted one-way analysis of variance (ANOVA), the effects of the treatment were considered, and all statistics assays were performed using NCSS (2011 version) software. The significant differences were estimated at a probability level of p < 0.05, if differences were found between treatments, a mean comparison test was performed by Tukey’s test. The correlation coefficients between the mean values were assessed by means of Pearson’s correlation test.

3. Results

3.1. Chemical Composition

As mentioned above the chemical composition of cocoa bean shell is subjected to numerous factors, such as the environmental conditions of the cultivation area, the cocoa variety, the postharvest processes and the processing conditions such as fermentation time, drying method or roasting temperature [10]. The effects of particle size on chemical composition values of cocoa bean shell samples are presented in Table 1. For the moisture and ash content, no differences were noted (p > 0.05) among the different particle sizes. These high ash contents were in agreement with those values reported by Martinez et al. [24] in cocoa bean shells (7.35 g/100 g) cultivated in Ecuador but lower than those values reported by Agus et al. [25] in Malaysia cocoa bean shell (11.67 g/100).
The protein and fat content varied between different particle sizes. It was increased with the decrease of particle size. However, for both protein and fat content no differences (p > 0.05) were found between HCBS and ICBS while LCBS showed the highest (p < 0.05) values. A contradictory trend was reported in the work of Memon et al. [11] who found that the protein and fat content, in different wheat flours, was decreased when the particle size of flour decreased. The increase in fat and protein extraction in lower particle size fractions could be explained due to the higher surface area which increases the extraction efficiency as mentioned Luthria et al. [26].
The protein and fat contents, obtained in the present study, were similar to the values found by Rojo-Poveda et al. [27] in cocoa bean shell from São Tomé cocoa beans (Forastero variety) with values for protein and fat of 20.9 and 2.3 g/100 g, respectively. However, Mellinas et al. [7] reported lower values for proteins and fat in cocoa bean shell coproducts collected from a local chocolate producer in Spain with values of 6.2 and 1.8 g/100 g, respectively. Regarding the total dietary fiber (Table 1) the results obtained showed that the highest total dietary fiber content (p < 0.05) was found for the biggest particle size sample (HCBS) while for the smallest particle sizes (ICBS and LCBS) there were no statistically significant differences (p > 0.05) between them. Literature data on the total dietary fiber content of cocoa bean shells reported values range between 39.25 and 66.33 g/100 g [24,27,28]. Dietary fibers have all the characteristics needed to be an important ingredient in the formulation of novel foods with functional properties. Additionally, there is considerable evidence from epidemiological, clinical and biochemical studies that fiber exerts a strong positive influence on human health. The fiber may protect against cardiovascular disease, provide improvements in gastrointestinal health; provide improvements in glucose tolerance and the insulin response, reduce the risk of developing some cancers and influence lipid absorption, hence contributing to some degree of weight management [29,30].

3.2. Organic Acid and Sugars

In all fractions of cocoa bean shell flours analyzed six organic acids were identified (oxalic, citric, succinic, tartaric, malic, and acetic acids; Figure S1) with a total amount range of 11.85 to 14.34 mg/g as shown in Table 2. Particle size only has an effect (p < 0.05) on oxalic citric and acetic acids since as the particle size decreased, the concentration of these acids increased. For succinic, tartaric, and malic acids no statistical differences (p > 0.05) were found between samples with different particle sizes. Tartaric acid followed by malic acid were the acids with the highest concentration in all the samples analyzed. There is not much data in the literature about the organic acid content of the cocoa bean shell. However, the organic acid content of the cocoa bean has been analyzed more. Thus, Hamdouche et al. [31] reported that five nonvolatile organic acids (citric, lactic, malic, oxalic, and tartaric acids) were detected and quantified in shells of cocoa beans cultivated in Ivory Coast. The production and type of organic acids will depend on numerous factors such as type and duration of fermentation, microorganisms involved, variety of cocoa beans, etc.
As regards sugars content (Table 2) the total sugars content varied among different particle sizes, it was increased from 13.20 to 15.57 mg/g with the decrease of particle size, and the unscreened and particle size. In all samples analyzed, four monosaccharides were identified and quantified being the glucose, for all particle size, the main component (p < 0.05) followed by fructose. Sucrose was the sugar found in the lowest (p < 0.05) concentration in all samples analyzed (Figure S2).
The results obtained are contradictory with those reported by Redgwell et al. [32] who analyzed the sugar content in cocoa bean shells obtained from roasted West African beans cv. Forastero. These authors informed that the main monosaccharides found in the cocoa bean shells were glucose, galactose, mannose, xylose, arabinose, fucose, and rhamnose. Similarly, Jokíc et al. [33] reported that the principal sugars presents in cocoa bean shell were glucose, rhamnose, arabinose, mannose, and xylose. The concentration and type of sugars present in the cocoa bean shell will depend on the temperature reached during fermentation and during the roasting process.

3.3. Physico-Chemical and Techno-Functional Properties

Table 3 shows the pH values, water activity and color coordinates of the cocoa bean shell flours according to the different particle sizes. Regarding pH, the values oscillate between 4.93 and 5.07. No statistically significant differences (p > 0.05) were found between the ICBS and LCBS samples, HCBS being the one that showed the highest pH values (p < 0.05). This decrease in the pH value obtained in the samples with the smallest particle size could be caused by the higher content of organic acids. For water activity, the decrease in particle size produced an increase in the values. Thus, no differences (p > 0.05) were found between ICBS and LCBS while HCBS showed the lowest (p < 0.05) values.
In reference to color coordinates (Table 3), lightness (L*), redness (a*) and yellowness (b*) were affected (p < 0.05) by the reduction in particle size. Therefore, for all color parameter, the values increased with decreasing particle size (p < 0.05). Thus, the maximum L*, a* and b* values were obtained for the finest particles. For L* this behavior is related to the surface area: the higher the surface area the higher the reflection of light as reported by Yu et al. [34].
For redness and yellowness, this conduct could be associated with the release of several compounds like pigments. In fact, grinding processes have a strong bearing on numerous components, such as ash, protein, pigments, and damaged dietary fiber content that, in turn, influence color Hidalgo et al. [35]. It is also important to note that the cocoa bean shells color, apart from the particle size, is also influenced by other parameters such as the conditions in which the fermentation and drying were carried out as well as the subsequent roasting conditions. As regards to the techno-functional properties, particle size reduction had a significant effect (p < 0.05) on water holding capacity, oil holding capacity and swelling capacity of cocoa bean shell samples as shown in Table 3. All values obtained, for the techno-functional properties analyzed, decreased significantly (p < 0.05) as the particle size of cocoa bean shell was reduced. This behavior is similar to that which occurs in the techno-functional properties analyzed in other flours. Therefore, Jacobs et al. [36] found that the hydration properties of commercial coarse wheat bran decreased when particle size was reduced and Lucas-Gonzalez et al. [37] who mentioned that in the flours obtained from persimmon (Diospyros kaki Trumb) coproducts, a reduction in these properties were observed when the particle size was reduced. It has been reported [38,39] that the reduction of water, oil holding capacities and the swelling capacity, in fine particle sizes, could be caused by several factors like (i) a reduction in direct absorption; (ii) reduced capillary forces; (iii) a reduction in the particle surface properties and (iv) hydrophobic nature of dietary fiber as well as the content and type (soluble or insoluble) of dietary fiber. The values obtained in this work for water holding capacity, oil holding capacity and swelling were similar to those values reported by Martinez et al. [24] in cocoa bean shells cultivated in two different localizations in Ecuador.

3.4. Fatty Acid Profile

Table 4 shows the effect of particle size on the fatty acid profile of cocoa bean shell flours with different particle sizes. In all samples analyzed LCBS had the highest (p < 0.05) content of poly-, mono- and saturated fatty acids followed by ICBS and HCBS, respectively (Figure S3). The monounsaturated and saturated fatty acids were the predominant groups found in samples analyzed. In monounsaturated fatty acid, with values ranging between 1080.29 and 1917.91 mg/100 g cocoa bean shell, oleic acid (C18:1n9) was the predominant fatty acid (1040.76–1855.52 mg/100 g cocoa bean shell).
The saturated fatty acid concentration varied from 1668.91 to 3176.21 mg/100 g cocoa bean shell being stearic acid (C18:0) with values comprised between 834.96 and 1618.40 mg/100 g cocoa bean shell and palmitic acid (C16:0), with values ranging between 736.82 and 1371.21 mg/100 g cocoa bean shell the predominant fatty acids. The polyunsaturated fatty acid ranged from 250.72 to 506.07 mg/100 g cocoa bean shell, principally contributed by linoleic acid (C18:2 (n6,9)) with values of 220.48–268.65 mg/100 g cocoa bean shell.
The results obtained in this work were in agreement with those reported by Lessa et al. [40] who reported that the main fatty acids found in roasted cocoa bean shells cultivated in Brazil were oleic acid; stearic acid and palmitic acid were the predominant mono- and saturated fatty acids. Similarly, Soares et al. [5] mentioned that the main fatty acids found in cocoa bean shell cultivated in Brazil and using a simultaneous green extraction of fat were oleic, stearic, and palmitic acids.

3.5. Polyphenolic Profile

From the products and coproducts achieved from cocoa, cocoa bean shells had a great number of polyphenolic compounds. Thus, these coproducts have demonstrated to be a good and inexpensive source of these bioactive compounds. The polyphenolic profile analysis of cocoa bean shell with different particle sizes is shown in Table 5. Both free and bound polyphenolic compounds contents were significant affected by the particle size.
Thus, for all compounds identified, the highest amount was found in the lowest particles; in other words, an increase in the extraction rate of polyphenolic compounds was obtained with the decrease of particle size. This behavior is similar to that which can be found in the literature [13,41] when the profile of polyphenolic compounds is analyzed as a function of particle size. Particle size is one of the most important aspects that could affect extraction efficiency; this is because the particle size controls the mass transfer kinetics as well as the access of solvent, easier permeability or diffusivity, to bioactive compounds [42].
The concentration of free polyphenolic compound was higher than bound polyphenolic compound. For free polyphenolic compounds, six compounds were identified, in all particle sizes analyzed, which were classified as flavan-3-ols (catechin, epicatechin and epicatechin derivative) and flavonols (quercetin, quercetin-3-O-glucosie and quercetin-3-O-rutinoside) while in bound polyphenolic compounds two flavan-3-ols (catechin and epicatechin), three flavonols (quercetin, quercetin-3-O-glucosie and quercetin-3-O-rutinoside) and a dihydroxybenzoic acid (Protocatechuic acid) were identified.
The main polyphenolic compound (p < 0.05) in all the analyzed cacao bean shell fractions was epicatechin, followed by catechin. These results were in agreement with the data reported in the literature by Hernández-Hernández et al. [43] who analyzed a total of 52 cocoa bean shells obtained from different genotypes of cacao cultivated in Mexico. These authors found that epicatechin was the main polyphenolic compound with values comprised between 4.40 and 34.97 mg/g while the catechin content ranged from 0.55 to 3.33 mg/g. Similarly, Papillo et al. [44] analyzed the polyphenolic profile of cocoa bean shells extracts obtained with different solvents, extraction techniques, and times. These authors reported that in all extraction methods assayed epicatechin was the most abundant component (0.50–2.10 mg/g), whilst catechin was present in smaller amounts (0.21–1.05 mg/g). In another study, Jokíc et al. [33] analyzed the polyphenolic content of cocoa bean shell extracts obtained with subcritical water extraction and they found that main phenolic compounds found in all samples analyzed were epicatechin and catechin with values ranging from 0.19 to 3.29 g/100 g and 0.07 to 0.45 g/100 g, respectively.
This great variability shown by cocoa bean shell may be due to different factors such as cocoa variety and genotype, environmental conditions of cultivation, but fundamentally to the conditions of time, pH and temperature in which fermentation takes place, since it is during this stage, in which the phenolic compounds migrate from the cotyledons of the cocoa seed to the shells.

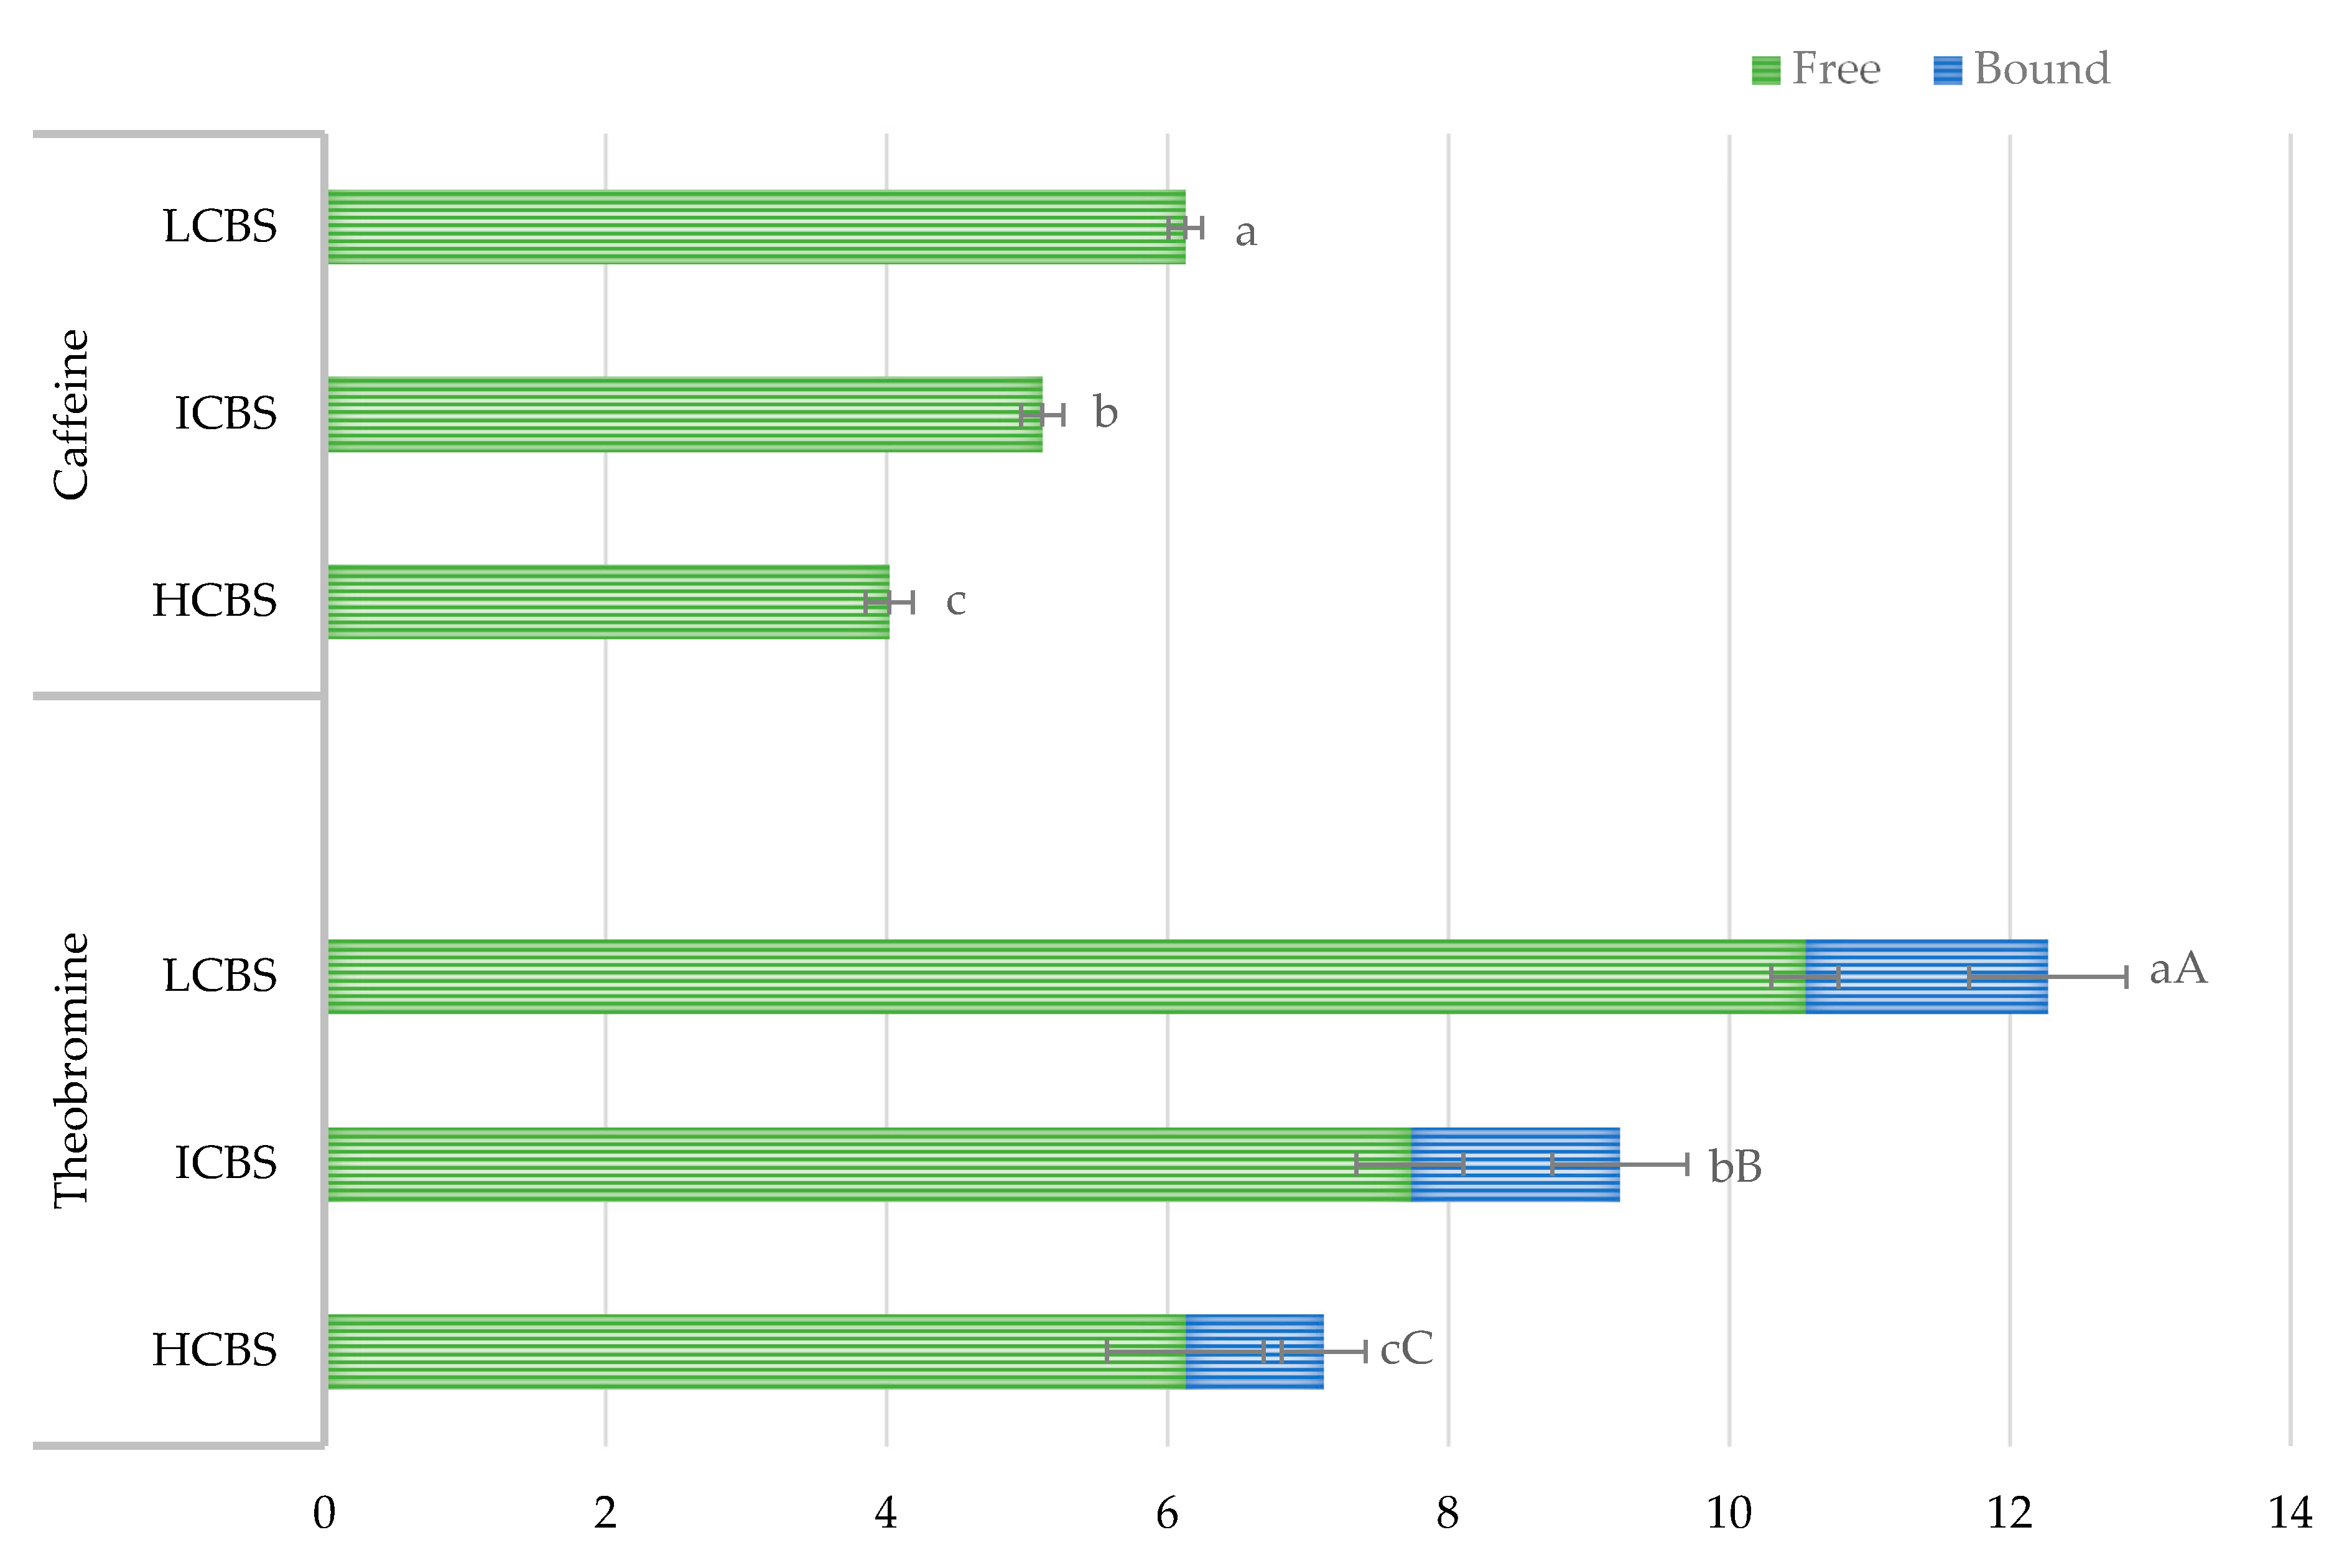
3.6. Methylxanthines Content

Methylxanthines, such as theobromine, caffeine, and theophylline, are another major class of phytochemicals found in cocoa bean shells. These compounds, mainly theobromine and caffeine, have been associated with numerous positive effects on human health acting as anticarcinogenic, antiobesity, or diuretic agents, among other effects [4,45].
Figure 2 showed the effect of particle size on Methylxanthines content (Theobromine and caffeine) of cocoa bean shell flours. As occurs with the polyphenolic profile, the particle size had a significant impact on methylxanthines content. The highest amounts of both theobromine and caffeine were found in the lowest particles. For the theobromine the highest (p < 0.05) concentration was achieved in LCBS with values of 12.27 mg/g (10.54 mg/g in free fraction and 1.73 mg/g in bound fraction) while HCBS had the lowest (p < 0.05) values (7.12 mg/g; 6.13 mg/g in free fraction and 0.99 mg/g in bound fraction).
These values are similar to those reported in the scientific literature. Therefore, Okiyama et al. [45] carried out a study to analyze the theobromine content of shells obtained from cocoa beans cultivated in Brazil and they reported a concentration of 9.89 mg/g sample. Hernández-Hernández et al. [4] analyzed the theobromine content of commercial cocoa bean shell samples. These authors found that the samples analyzed had a theobromine content of 12 mg/g sample. In a similar study, Barbosa-Pereira et al. 2018, investigated the theobromine content present in cocoa bean shell cvs Trinitario, Criollo × Trinitario, Forastero, cultivated in Trinidad, Mexico, Honduras, and São Tomé, respectively. They reported a theobromine content of 8.24, 10.57, 10.07, and 9.29 mg/g, respectively. This high content of theobromine could be explained due to the migration of methylxanthines from the bean to the shell during the fermentation process.
For caffeine (Figure 2), as occurs with the theobromine, the highest (p < 0.05) concentration was obtained in LCBS with values of 6.13 mg/g followed by with ICBS with a value of 5.11 mg/g. The values obtained in this study were higher than those reported by Jokíc et al. [33] who informed that the caffeine content in cocoa bean shell extracts obtained with subcritical water extraction ranged between 0.4 and 2.5 mg/g. Similarly, Barbosa-Pereira et al. [46] investigated the caffeine content present in cocoa bean shell cvs Trinitario, Criollo × Trinitario, Forastero, cultivated in Venezuela, Colombia, and Ecuador, respectively. They reported a caffeine content ranging between 1.61 and 4.08 mg/g. Figure S4 of supplementary material showed the chromatograms of methylxanthines found in cocoa bean shells samples analyzed.

3.7. Antioxidant Properties

Four different methodologies (2,2-diphenyl-1-picrylhydrazyl radical scavenging assay (DPPH); 2,2′-azinobis-(3-ethylbenzothiazoline-6-sulfonic acid) radical scavenging assay (ABTS); Ferric reducing antioxidant power (FRAP); Ferrous ion-chelating ability assay (FIC)), were applied for determining the antioxidant activity of different granulometric fractions (Table 6). Size reduction of cocoa bean shell flours showed a significant difference (p < 0.05) in the antioxidant properties. Thus, in all methodologies used, the highest values (p < 0.05) of antioxidant activity were obtained in the finest particles. This behavior could be explained as, for larger particle sizes, the matrix is less altered, producing less release of bioactive compounds with antioxidant properties, while reducing the size of the matrix by grinding can cause a greater release of bioactive compounds which could cause an increase in its potential antioxidant effect.
The antioxidant properties obtained in this work were in agreement with reported in the literature for cocoa bean shells. Arlorio et al. [47] evaluated the antioxidant properties of cacao bean shell extracts obtained by means of Supercritical Fluid Extraction using CO2. These authors reported that cocoa shells had an inhibition percent comparable to those obtained with butyl-hydroxy-anisole 0.1 mM. In the same way, Martinez et al. [24] analyzed the antioxidant properties, using three different methodologies, in cocoa bean shells cultivated in two different localizations in Ecuador. The values reported in this study ranged between 4.45 and 4.56 μM Trolox equivalent/g for ABTS assay, 3.81 and 4.05 μM Trolox equivalent/g for DPPH assay, or 1.51 and 1.78 μM Trolox equivalent/g for FRAP assay.
The antioxidant properties of cocoa and cocoa coproducts might be attributed to the high content of bioactive compound that it is possible to find in their composition and, specially, the flavan-3-ol compounds such as catechin and epicatechin or methylxanthines like theobromine and caffeine. Therefore, for LCBS, ICBS and HCBS a moderate correlation (Tables S1–S3) was obtained between DPPH assay, theobromine, and caffeine with r-value ranges of 0.397–0.500 and 0.317–0.661, respectively. For this assay, epicatechin was the compound that showed a higher correlation for all particle sizes except for HCBS with r-values of 0.723 and 0.967 for LCBS and ICBS, respectively.
On the other hand, theobromine, caffeine, and ABTS assay were highly correlated (r-values of 0.961 and 0.908) in the HCBS samples. While for LCBS the correlation was low with an r-value of 0.264. However, in ICBS a moderate inverse correlation was achieved. High correlation was found, in HCBS, ICBS and LCBS, between ABTS assay and epicatechin with r-values of 0.963, 0.997 and 0.824, respectively.
For FRAP assay, a low and moderate inverse correlation was achieved, in LCBS and HCBS samples, with the theobromine (r-values of −0.277 for LCBS and −0.655 for HCBS), caffeine (r-values of −0.277 for LCBS and −0.451 for HCBS) and epicatechin (r-values of −0.536 for LCBS and −0.662 for HCBS). However, in ICBS a high correlation was observed between FRAP assay and theobromine (r-values of 0.961), caffeine (r-values of −0.891) and epicatechin (r-values of 0.812).
In all samples analyzed a high and moderate correlation was obtained between FIC assay, theobromine (r-values of 0.998 for LCBS; 0.952 for HCBS and 0.500 for ICBS), and caffeine (r-values of 0.998 for LCBS; 0.998 for HCBS and 0.655 for ICBS). For this assay, epicatechin and catechin had a higher correlation for LCBS while for HCBS and ICBS these compounds showed a moderate inverse correlation except for HCBS with r-values of 0.723 and 0.967 for LCBS and ICBS, respectively. The results obtained indicate that antioxidant activity cannot be attributed solely to a single compound or group of compounds, nevertheless, is due to the joint action of all the bioactive compounds present in its matrix.

4. Conclusions

This study suggests that cocoa bean shell constitutes an appreciated coproduct for food industry because in its composition it is possible to find a high content of valuable bioactive compounds such as dietary fiber, polyphenolic compounds (mainly epicatechin and catechin) or methylxanthines (mainly theobromine and caffeine). This coproduct could be used for further applications in the food industry as a potential ingredient. Nevertheless, it must be taken into account that when this coproduct may be used an ingredient, the reduction of the particle size has a significant effect on the physico-chemical, techno-functional and antioxidant properties as well as on the chemical composition and bioactive compounds content. The changes in these properties may be explained due to numerous reasons including increasing in surface area, reorganization of flour components as well as higher release of bioactive compounds from cells.

Supplementary Materials

The following are available online at https://www.mdpi.com/2073-4395/11/2/401/s1, Figure S1. Chromatographic profile of organic acids found in LCBS samples. Figure S2. Chromatographic profile of sugars found in LCBS samples. Figure S3. Chromatographic profile of fatty acids found in LCBS samples. Figure S4. Chromatographic profile of methylxanthines found in HCBS, ICBS and LCBS samples. Table S1: Pearson’s correlation coefficients between the different antioxidant assays (DPPH, ABTS, FRAP and FIC) and the main bioactive compounds founds in LCBS samples. Table S2: Pearson’s correlation coefficients between the different antioxidant assays (DPPH, ABTS, FRAP and FIC) and the main bioactive compounds founds in ICBS samples. Table S3: Pearson’s correlation coefficients between the different antioxidant assays (DPPH, ABTS, FRAP and FIC) and the main bioactive compounds founds in HCBS samples.

Author Contributions

Conceptualization, M.V.-M.; methodology, C.C.-L. and R.L.-G.; formal analysis and investigation, C.B.-M. and C.B.-C.; data curation, J.Á.P.-Á. and J.D.-O.; Writing—Original draft preparation C.B.-M.; Writing—Review and editing, J.F.-L. and M.V.-M. All authors have read and agreed to the published version of the manuscript.

Funding

This research received no external funding.

Conflicts of Interest

The authors declare no conflict of interest.

References

  1. Ahmad, T.; Aadil, T.R.M.; Ahmed, H.; Rahman, U.; Soares, B.C.V.; Souza, S.L.Q.; Pimentel, T.C.; Scudino, H.; Guimarães, J.T.; Esmerino, E.A.; et al. Treatment and utilization of dairy industrial waste: A review. Trends Food Sci. Technol. 2019, 88, 361–372. [Google Scholar] [CrossRef]
  2. International Cocoa Organization. Production of Cocoa Beans. ICCO Quarterly Bulletin of Cocoa Statistics, XLVI. 2020. Available online: https://www.icco.org/wp-content/uploads/QBCS-ORDER-FORM-2020.pdf (accessed on 11 November 2020).
  3. Grillo, G.; Boffa, L.; Binello, A.; Mantegna, S.; Cravotto, G.; Chemat, F.; Dizhbite, T.; Lauberte, L.; Telysheva, G. Cocoa bean shell waste valorisation; extraction from lab to pilot-scale cavitational reactors. Food Res. Int. 2019, 115, 200–208. [Google Scholar] [CrossRef] [PubMed]
  4. Hernández-Hernández, C.; Viera-Alcaide, I.; Sillero, A.M.M.; Fernández-Bolaños, J.; Rodríguez-Gutiérrez, G. Bioactive compounds in Mexican genotypes of cocoa cotyledon and husk. Food Chem. 2018, 240, 831–839. [Google Scholar] [CrossRef] [PubMed] [Green Version]
  5. Soares, I.D.; Gomes Okiyama, D.C.; da Costa Rodrigues, C.E. Simultaneous green extraction of fat and bioactive compounds of cocoa shell and protein fraction functionalities evaluation. Food Res. Int. 2020, 137, 109622. [Google Scholar] [CrossRef]
  6. Quelal-Vásconez, M.A.; Lerma-García, M.J.; Pérez-Esteve, E.; Arnau-Bonachera, A.; Barat, J.M.; Talens, P. Changes in methylxanthines and flavanols during cocoa powder processing and their quantification by near-infrared spectroscopy. LWT Food Sci. Technol. 2020, 117, 108598. [Google Scholar] [CrossRef]
  7. Mellinas, A.C.; Jiménez, A.; Garrigós, M.C. Optimization of microwave-assisted extraction of cocoa bean shell waste and evaluation of its antioxidant, physicochemical and functional properties. LWT Food Sci. Technol. 2020, 127, 109361. [Google Scholar] [CrossRef]
  8. Okiyama, D.C.G.; Navarro, S.L.B.; Rodrigues, C.E.C. Cocoa shell and its compounds: Applications in the food industry. Trends Food Sci. Technol. 2017, 63, 103–112. [Google Scholar] [CrossRef]
  9. Aprotosoaie, A.C.; Luca, S.V.; Miron, A. Flavor chemistry of cocoa and cocoa products—An overview. Comp. Rev. Food Sci Food Safety 2016, 15, 73–91. [Google Scholar] [CrossRef]
  10. Bortolini, C.; Patrone, V.; Puglisi, E.; Morelli, L. Detailed analyses of the bacterial populations in processed cocoa beans of different geographic origin, subject to varied fermentation conditions. Int. J. Food Microbiol. 2016, 236, 98–106. [Google Scholar] [CrossRef] [PubMed]
  11. Memon, A.A.; Mahar, I.; Memon, R.; Soomro, S.; Harnly, J.; Memon, N.; Bhangar, M.I.; Luthria, D.L. Impact of flour particle size on nutrient and phenolic acid composition of commercial wheat varieties. J. Food Compo. Anal. 2020, 86, 103358. [Google Scholar] [CrossRef]
  12. Rodriguez, I.F.; Pérez, M.J.; Cattaneo, F.; Zampini, I.C.; Cuello, A.S.; Mercado, M.I.; Ponessa, G.; Isla, M.I. Morphological, histological, chemical and functional characterization of Prosopis alba flours of different particle sizes. Food Chem. 2019, 274, 583–591. [Google Scholar] [CrossRef]
  13. Lucas-González, R.; Fernández-López, J.; Pérez-Álvarez, J.A.; Viuda-Martos, M. Effect of particle size on phytochemical composition and antioxidant properties of two persimmon flours from Diospyros kaki Thunb. vars. “Rojo Brillante“ and “Triumph“ co-products. J. Sci. Food Agric. 2018, 98, 504–510. [Google Scholar] [CrossRef]
  14. Association of Official Analytical Chemists. Official Methods of Analysis of AOAC International, 18th ed.; AOAC: Washington, DC, USA, 2007. [Google Scholar]
  15. Melgarejo-Sánchez, P.; Martínez, J.J.; Legua, L.; Martínez, R.; Hernández, F.; Melgarejo, P. Quality, antioxidant activity and total phenols of six Spanish pomegranates clones. Sci. Hortic. 2015, 182, 65–72. [Google Scholar] [CrossRef]
  16. Chau, C.F.; Huang, Y.L. Comparison of the chemical composition and physicochemical properties of different fibres prepared from peel of Citrus sinensis L. cv. Liucheng. J. Agric. Food Chem. 2003, 51, 2615–2618. [Google Scholar] [CrossRef]
  17. Golay, P.A.; Moulin, J. Determination of labeled fatty acids content in milk products, infant formula, and adult/pediatric nutritional formula by capillary gas chromatography: Collaborative study, Final Action 2012.13. J. AOAC Int. 2016, 99, 210–222. [Google Scholar] [CrossRef] [Green Version]
  18. Genskowsky, E.; Puente, L.A.; Pérez-Álvarez, J.A.; Fernández-López, J.; Muñoz, L.A.; Viuda-Martos, M. Determination of polyphenolic profile, antioxidant activity and antibacterial properties of maqui [Aristotelia chilensis (Molina) Stuntz] a Chilean blackberry. J. Sci. Food Agric. 2016, 96, 4235–4242. [Google Scholar] [CrossRef] [PubMed]
  19. Mpofu, A.; Sapirstein, H.D.; Beta, T. Genotype and environmental variation in phenolic content, phenolic acid composition, and antioxidant activity of hard spring wheat. J. Agric. Food Chem 2006, 54, 1265–1270. [Google Scholar] [CrossRef] [PubMed]
  20. Brand-Williams, W.; Cuvelier, M.E.; Berset, C. Use of a free radical method to evaluate antioxidant activity. LWT Food Sci Technol. 1995, 28, 25–30. [Google Scholar] [CrossRef]
  21. Gullón, B.; Pintado, M.E.; Fernández-López, J.; Pérez-Álvarez, J.A.; Viuda-Martos, M. In Vitro gastrointestinal digestion of pomegranate peel (Punica granatum) flour obtained from co-products: Changes in the antioxidant potential and bioactive compounds stability. J. Funct. Foods 2015, 19, 617–628. [Google Scholar] [CrossRef]
  22. Oyaizu, M. Studies on products of browning reaction: Antioxidative activity of products of browning reaction prepared from glucosamine. Jap J. Nut 1986, 44, 307–315. [Google Scholar] [CrossRef] [Green Version]
  23. Mahdavi, B.; Yaacob, W.A.; Din, L.B. Chemical composition, antioxidant, and antibacterial activity of essential oils from Etlingera sayapensis A.D. Poulsen & Ibrahim. Asian Pac. J. Trop. Med. 2017, 10, 819–826. [Google Scholar] [CrossRef]
  24. Martínez, R.; Torres, P.; Meneses, M.A.; Figueroa, J.G.; Pérez-Álvarez, J.A.; Viuda-Martos, M. Chemical, technological and in vitro antioxidant properties of cocoa (Theobroma cacao L.) co-products. Food Res. Int. 2012, 49, 39–45. [Google Scholar] [CrossRef]
  25. Agus, B.A.P.; Mohamad, N.N.; Hussain, N. Composition of unfermented, unroasted, roasted cocoa beans and cocoa shells from Peninsular Malaysia. J. Food Meas. 2018, 12, 2581–2589. [Google Scholar] [CrossRef]
  26. Luthria, D.L.; Noel, K.; Vinjamoori, D. Impact of sample preparation on the determination of crude fat content in corn. J. Am. Oil Chem. Soc. 2004, 81, 999–1004. [Google Scholar] [CrossRef]
  27. Rojo-Poveda, O.; Barbosa-Pereira, L.; Mateus-Reguengo, L.; Bertolino, M.; Stévigny, C.; Zeppa, G.E. effects of particle size and extraction methods on cocoa bean shell functional beverage. Nutrients 2019, 11, 867. [Google Scholar] [CrossRef] [Green Version]
  28. Lecumberri, E.; Mateos, R.; Izquierdo-Pulido, M.; Rupérez, P.; Goya, L.; Bravo, L. Dietary fibre composition, antioxidant capacity and physico-chemical properties of a fibre-rich product from cocoa (Theobroma cacao L.). Food Chem. 2007, 104, 948–954. [Google Scholar] [CrossRef]
  29. Viuda-Martos, M.; Fernández-Lopez, J.; Pérez-Alvarez, J.A. Dietary fiber as an ingredient for the meat industry. In Dietary Fiber, Sources, Properties and Their Relationship to Health; Nova: Hauppauge, NY, USA, 2013. [Google Scholar]
  30. Shah, B.R.; Li, B.; Al Sabbah, H.; Xu, W.; Mráz, J. Effects of prebiotic dietary fibers and probiotics on human health: With special focus on recent advancement in their encapsulated formulations. Trends Food Sci. Technol. 2020, 102, 178–192. [Google Scholar] [CrossRef]
  31. Hamdouche, Y.; Meile, J.C.; Lebrun, M.; Guehi, T.; Boulanger, R.; Teyssier, C.; Didier Montet, D. Impact of turning, pod storage and fermentation time on microbial ecology and volatile composition of cocoa beans. Food Res. Int. 2019, 119, 477–491. [Google Scholar] [CrossRef] [PubMed]
  32. Redgwell, R.; Trovato, V.; Merinat, S.; Curti, D.; Hediger, S.; Manez, A. Dietary fibre in cocoa shell: Characterisation of component polysaccharides. Food Chem. 2003, 81, 103–112. [Google Scholar] [CrossRef]
  33. Jokíc, S.; Gagíc, T.; Knez, Z.; Šubaríc, D.; Škerget, M. Separation of active compounds from food by-product (cocoa shell) using subcritical water extraction. Molecules 2018, 23, 1408. [Google Scholar] [CrossRef] [Green Version]
  34. Yu, D.; Chen, J.; Ma, J.; Sun, H.; Yuan, Y.; Ju, Q.; Teng, Y.; Yang, M.; Li, W.; Fujita, K.; et al. Effects of different milling methods on physicochemical properties of common buckwheat flour. LWT Food Sci. Technol. 2018, 92, 220–226. [Google Scholar] [CrossRef]
  35. Hidalgo, A.; Fongaro, L.; Brandolini, A. Wheat flour granulometry determines colour perception. Food Res. Int. 2014, 64, 363–370. [Google Scholar] [CrossRef]
  36. Jacobs, P.J.; Hemdane, S.; Dornez, E.; Delcour, J.A.; Courtin, C.M. Study of hydration properties of wheat bran as a function of particle size. Food Chem 2015, 179, 296–304. [Google Scholar] [CrossRef]
  37. Lucas-González, R.; Viuda-Martos, M.; Pérez-Álvarez, J.A.; Fernández-López, J. Evaluation of particle size influence on proximate composition, physicochemical, techno-functional and physio-functional properties of flours obtained from persimmon (Diospyros kaki Trumb.) coproducts. Plant. Foods Hum. Nutr. 2017, 72, 67–73. [Google Scholar] [CrossRef] [PubMed]
  38. Ancona, D.B.; Mercado, G.P.; Ordoñez, Y.M.; Blanco, S.F. Physicochemical characterization lima bean (Phaseolus lunatus) and Jack bean (Canavalia ensiformis) fibrous residues. Food Chem 2004, 84, 287–295. [Google Scholar] [CrossRef]
  39. Noort, M.W.; van Haaster, D.; Hemery, Y.; Schols, H.A.; Hamer, R.J. The effect of particle size of wheat bran fractions on bread quality: Evidence for fibre-protein interactions. J. Cereal Sci. 2010, 52, 59–64. [Google Scholar] [CrossRef]
  40. Lessa, O.A.; Reis, N.S.; Leite, S.G.F.; Gutarra, M.L.E.; Souza, A.O.; Gualberto, S.A.; de Oliveira, J.R.; Aguilar-Oliveira, E.; Franco, M. Effect of the solid state fermentation of cocoa shell on the secondary metabolites, antioxidant activity, and fatty acids. Food Sci. Biotechnol. 2018, 27, 107–113. [Google Scholar] [CrossRef] [PubMed]
  41. Zaiter, A.; Becker, L.; Baudelaire, E.; Dicko, A. Optimum polyphenol and triterpene contents of Hedera helix (L.) and Scrophularia nodosa (L.): The role of powder particle size. Microchem. J. 2018, 137, 168–173. [Google Scholar] [CrossRef]
  42. Meullemiestre, A.; Petitcolas, E.; Maache-Rezzoug, Z.; Chemat, F.; Rezzoug, S.A. Impact of ultrasound on solid-liquid extraction of phenolic compounds from maritime pine sawdust waste. Kinetics, optimization and large scale experiments. Ultrasonics Sonochem. 2016, 28, 230–239. [Google Scholar] [CrossRef]
  43. Hernández-Hernández, C.; Morales-Sillero, A.; Fernández-Bolaños, J.; Bermúdez-Oria, A.; Morales, A.A.; Rodríguez-Gutiérrez, G. Cocoa bean husk: Industrial source of antioxidant phenolic extract. J. Sci. Food Agric. 2019, 99, 325–333. [Google Scholar] [CrossRef]
  44. Papillo, V.A.; Locatelli, M.; Travaglia, F.; Bordiga, M.; Garino, C.; Coïsson, J.D.; Arlorio, M. Cocoa hulls polyphenols stabilized by microencapsulation as functional ingredient for bakery applications. Food Res. Int. 2019, 115, 511–518. [Google Scholar] [CrossRef]
  45. Okiyama, D.C.G.; Soares, I.D.; Cuevas, M.S.; Crevelin, E.J.; Moraes, L.A.B.; MaMelo, M.P.; Oliveira, A.L.; Rodrigues, C.E.C. Pressurized liquid extraction of flavanols and alkaloids from cocoa bean shell using ethanol as solvent. Food Res. Int. 2018, 114, 20–29. [Google Scholar] [CrossRef] [PubMed]
  46. Barbosa-Pereira, L.; Guglielmetti, A.; Zeppa, G. Pulsed electric field assisted extraction of bioactive compounds from cocoa bean shell and coffee silver skin. Food Bioproc. Technol. 2018, 11, 818–835. [Google Scholar] [CrossRef]
  47. Arlorio, M.; Coïsson, J.D.; Travaglia, F.; Varsaldi, F.; Miglio, G.; Lombardi, G.; Martelli, A. Antioxidant and biological activity of phenolic pigments from Theobroma cacao hulls extracted with supercritical CO2. Food Res. Int. 2005, 38, 1009–1014. [Google Scholar] [CrossRef]
Figure 1. Cocoa bean shell flours with different particle sizes.
Agronomy 11 00401 g001
Figure 2. Effect of particle size on Methylxanthines content (Theobromine and caffeine) of cocoa bean shell flours. Values expressed as mg/g sample. HCBS: highest cocoa bean shell (Dp > 701 µm); ICBS: intermediate cocoa bean shell (417 µm < Dp < 701 µm); LCBS: lowest cocoa bean shell (Dp < 417 µm). For each free compound, bars followed by the same small letter are not significantly different (p > 0.05) according to Tukey’s Multiple Range Test. For each bound compound, bars followed by the same capital letter are not significantly different (p > 0.05) according to Tukey’s Multiple Range Test.
Agronomy 11 00401 g002
Table 1. Effect of particle size on chemical composition values of cocoa bean shell flours.
MoistureProteinFatAshTDF
HCBS7.05 ± 0.13 a15.59 ± 0.22 b3.00 ± 0.02 b7.09 ± 0.73 a65.58 ± 0.53 a
ICBS6.90 ± 0.36 a15.95 ± 0.13 b3.60 ± 0.19 b7.03 ± 0.65 a62.03 ± 0.13 b
LCBS6.79 ± 0.19 a17.13 ± 0.17 a5.60 ± 0.24 a7.34 ± 0.35 a61.18 ± 0.94 b
Values expressed as g/100 g sample. HCBS: highest cocoa bean shell (Dp > 701 µm); ICBS: intermediate cocoa bean shell (417 µm < Dp < 701 µm); LCBS: lowest cocoa bean shell (Dp < 417 µm). TDF: total dietary fiber. Values with different letter in the same column indicates significant differences (p < 0.05) according to Tukey’s Multiple Range Test.
Table 2. Effect of particle size on organic acids and sugars contents of cocoa bean shell flours.
Organic Acids
Oxalic AcidCitric AcidSuccinic AcidTartaric AcidMalic AcidAcetic AcidTotal
HCBS1.57 ± 0.07 cB1.62 ± 0.13 cB2.50 ± 0.41 aA2.68 ± 0.02 aA2.46 ± 0.14 aA1.03 ± 0.01 cC11.85 ± 0.23 b
ICBS1.62 ± 0.04 bC1.97 ± 0.06 bB2.20 ± 0.33 aA2.61 ± 0.08 aA2.47 ± 0.10 aA1.33 ± 0.03 bD12.20 ± 0.14 b
LCBS2.33 ± 0.10 aB2.76 ± 0.11 aA2.06 ± 0.09 aC2.79 ± 0.06 aA2.67 ± 0.12 aA1.72 ± 0.17 aD14.34 ± 0.11 a
Sugars
SucroseGlucoseFructoseArabinoseTotal
HCBS1.12 ± 0.07 bC5.81 ± 0.03 cA5.06 ± 0.04 bB1.21 ± 0.04 cC13.20 ± 0.12 c
ICBS1.22 ± 0.07 abD6.17 ± 0.04 bA5.17 ± 0.14 bB1.56 ± 0.04 bC14.10 ± 0.09 b
LCBS1.34 ± 0.10 aD6.33 ± 0.01 aA5.45 ± 0.08 aB2.45 ± 0.04 aC15.57 ± 0.08 a
Values expressed as mg/g sample. HCBS: highest cocoa bean shell (Dp > 701 µm); ICBS: intermediate cocoa bean shell (417 µm < Dp < 701 µm); LCBS: lowest cocoa bean shell (Dp < 417 µm). Values with different lowercase letter in the same column indicate significant differences (p < 0.05). Values with different uppercase letter in the same row indicate significant differences (p < 0.05) according to Tukey’s Multiple Range Test.
Table 3. Effect of particle size on physico-chemical and techno-functional properties of cocoa bean shell flours.
Physic-Chemical Properties
Color Coordinates
pHAwL*a*b*
HCBS5.07 ± 0.03 a0.474 ± 0.001 b45.97 ± 0.75 c5.78 ± 0.19 c8.16 ± 0.48 c
ICBS4.93 ± 0.03 b0.495 ± 0.006 a47.84 ± 1.11 b6.53 ± 0.31 b9.45 ± 0.55 b
LCBS4.90 ± 0.06 b0.501 ± 0.004 a50.17 ± 0.31 a8.06 ± 0.09 a11.84 ± 0.18 a
Techno-functional properties
WHCOHCSWC
HCBS5.07 ± 0.27 a2.74 ± 0.08 a3.16 ± 0.05 a
ICBS4.15 ± 0.19 b1.55 ± 0.05 b2.49 ± 0.10 b
LCBS3.30 ± 0.20 c1.28 ± 0.08 c1.31 ± 0.08 c
HCBS: highest cocoa bean shell (Dp > 701 µm); ICBS: intermediate cocoa bean shell (417 µm < Dp < 701 µm); LCBS: lowest cocoa bean shell (Dp < 417 µm). WHC: water holding capacity (g water/g sample); OHC: oil holding capacity (g oil/g sample); SWC: swelling capacity (mL/g sample). Values followed by same letter in the same column are not significantly different (p > 0.05) according to Tukey’s Multiple Range Test.
Table 4. Effect of particle size on the fatty acid profile of cocoa bean shell flours.
HCBSICBSLCBS
C10:01.20 ± 0.12 c2.99 ± 0.09 b4.48 ± 0.38 a
C12:01.72 ± 0.21 c8.14 ± 0.37 a3.92 ± 0.11 b
C13:04.20 ± 0.25 aN.D.N.D.
C14:018.28 ± 0.15 c20.69 ± 0.98 b29.44 ± 2.36 a
C15:01.94 ± 0.09 c2.60 ± 0.17 b3.70 ± 0.07 a
C16:0736.82 ± 3.58 c882.50 ± 4.72 b1371.21 ± 8.74 a
C16:131.82 ± 0.96 c28.42 ± 0.14 b51.49 ± 1.58 a
C17:09.22 ± 0.41 c10.96 ± 0.32 b15.88 ± 0.45 a
C17:12.56 ± 0.18 c3.96 ± 0.17 a3.06 ± 0.09 b
C18:0834.96 ± 4.89 c1054.84 ± 10.87 b1618.40 ± 12.17 a
C18:1 (n9)1040.76 ± 5.47 c1193.81 ± 9.56 b1855.52 ± 11.23 a
C18:2 (n6,9)220.48 ± 2.47 c268.65 ± 5.63 b442.40 ± 8.96 a
C18:3 (n3,6,9)19.48 ± 0.57 c25.41 ± 0.47 b41.24 ± 1.59 a
C18:3 (n6,9,12)1.04 ± 0.07 c3.70 ± 0.03 bN.D.
C20:034.67 ± 0.68 c45.49 ± 0.89 b70.79 ± 3.56 aD
C20:15.15 ± 0.74 a3.13 ± 0.12 c7.84 ± 0.75 a
C20:2 (n11,14)0.77 ± 0.07 bN.D.4.07 ± 0.58 a
C20:3 (n8,11,14)0.47 ± 0.08 c3.05 ± 0.07 b4.62 ± 0.96 a
C20:3 (n11,14,17)2.87 ± 0.14 c1.96 ± 0.08 c4.33 ± 0.63 a
C20:5 (n5,8,11,14,17)1.30 ± 0.02 cN.D.N.D.
C22:013.19 ± 0.07 c19.00 ± 0.87 b31.07 ± 1.73 a
C22:20.35 ± 0.05 cN.D.N.D.
C22:53.96±0.04 c4.05 ± 0.11 b9.41 ± 0.68 a
C24:012.71±0.21 c16.64 ± 0.56 b27.32 ± 1.09 a
ΣSFA1668.91±5.69 c2063.85 ± 5.7 b3176.21 ± 6.91 a
ΣMUFA1080.29±4.87 c1229.31 ± 6.89 b1917.91 ± 10.89 a
ΣPUFA250.72±3.74 c306.82 ± 3.96 b506.07 ± 4.87 a
ΣPUFA/ΣSFA0.15±0.03 a0.15± 0.04 a0.16±0.04 a
N.D.: nondetected. Values expressed as mg/100 g sample. HCBS: highest cocoa bean shell (Dp > 701 µm); ICBS: intermediate cocoa bean shell (417 µm < Dp < 701 µm); LCBS: lowest cocoa bean shell (Dp < 417 µm). WHC: water holding capacity (g water/g sample); SFA: saturated fatty acid; MUFA: monounsaturated fatty acid; PUFA: polyunsaturated fatty acid. Values followed by the same small letter within the same row are not significantly different (p > 0.05) according to Tukey’s Multiple Range Test.
Table 5. Effect of particle size on the polyphenolic profile of cocoa bean shell flours.
Compound HCBSICBSLCBS
CatechinFree1966.89 ± 54.98 c2493.37 ± 32.25 b4211.82 ± 29.81 a
Bound143.91 ± 9.76 c224.12 ± 18.23 b354.76 ± 8.25 a
TOTAL2110.88 ± 12.592717.49 ± 28.964566.58 ± 16.96
EpicatechinFree4467.41 ± 31.99 c4815.92 ± 29.76 b6087.49 ± 25,87 a
Bound95.28 ± 7.34 c114.59 ± 8.76 b249.69 ± 12.92 a
TOTAL4562.69 ± 16.364930.51 ± 17.966337.18 ± 17.82
Epicatechin derivativeFree392.09 ± 8.63 c442.24 ± 9.14 b482.85 ± 11.67 a
BoundN.D.N.D.N.D.
TOTAL392.09 ± 8.63442.24 ± 9.14482.85 ± 11.67
QuercetinFree128.34 ± 8.34 c167.69± 10.89 b227.15 ± 8.52 a
Bound2.40 ± 0.12 c4.53± 0.22 b6.98 ± 0.37 a
TOTAL130.74 ± 3.57172.22 ± 4.23234.13 ± 5.36
Quercetin-3-O-glucosieFree100.35 ± 1.59 c123.07 ±3.82 b289.61 ± 4.36 a
Bound3.35 ± 0.14 c4.09± 0.27 b7.33 ± 0.48 a
TOTAL103.70 ± 0.85127.16 ± 0.98296.94 ± 2.12
Quercetin-3-O-rutinosieFree92.70 ± 3.87 c137.89 ± 8.56 b237.53 ± 9.72 a
Bound1.48 ± 0.09 c1.61 ± 0.08 b3.73 ± 0.12 a
TOTAL94.18 ± 1.14139.50 ± 3.14241.26 ± 5.21
Protocatechuic acidFreeN.D.N.D.N.D.
Bound80.53 ± 1.92 c100.79 ± 2.98 b148.93 ± 1.23 a
TOTAL80.53 ± 1.92100.79 ± 2.98148.93 ± 1.23
Values expressed as µg/g sample. N.D.: nondetected. HCBS: highest cocoa bean shell (Dp > 701 µm); ICBS: intermediate cocoa bean shell (417 µm < Dp < 701 µm); LCBS: lowest cocoa bean shell (Dp < 417 µm). Values followed by the same small letter in the same line are not significantly different (p > 0.05) according to Tukey’s Multiple Range Test.
Table 6. Effect of particle size on antioxidant properties of cocoa bean shell flours.
DPPH
(mg TE/g)
ABTS
(mg TE/g)
FRAP
(mg TE/g)
FIC
(mg EDTAE/g)
HCBS2.35 ± 0.11 c3.39 ± 0.20 c3.84 ± 0.02 c0.28 ± 0.01 c
ICBS4.21 ± 0.05 b6.49 ± 0.44 b5.30 ± 0.02 b0.40 ± 0.03 b
LCBS5.53 ± 0.04 a11.55 ± 0.46 a7.62 ± 0.04 a0.54 ± 0.02 a
HCBS: highest cocoa bean shell (Dp > 701 µm); ICBS: intermediate cocoa bean shell (417 µm < Dp < 701 µm); LCBS: lowest cocoa bean shell (Dp < 417 µm). DPPH: 2,2-diphenyl-1-picrylhydrazyl radical scavenging assay; ABTS: 2,2’-azinobis-(3-ethylbenzothiazoline-6-sulfonic acid) radical scavenging assay; FRAP: Ferric reducing antioxidant power; FIC: Ferrous ion-chelating ability assay. TE: Trolox Equivalents. EDTA: Ethylenediaminetetraacetic. Values followed by the same small letter within the same column are not significantly different (p > 0.05) according to Tukey’s Multiple Range Test.
Publisher’s Note: MDPI stays neutral with regard to jurisdictional claims in published maps and institutional affiliations.

