
FruitDet: Attentive Feature Aggregation for Real-Time Fruit Detection in Orchards

 , ,
, ,  , and
, and
Abstract
:
1. Introduction
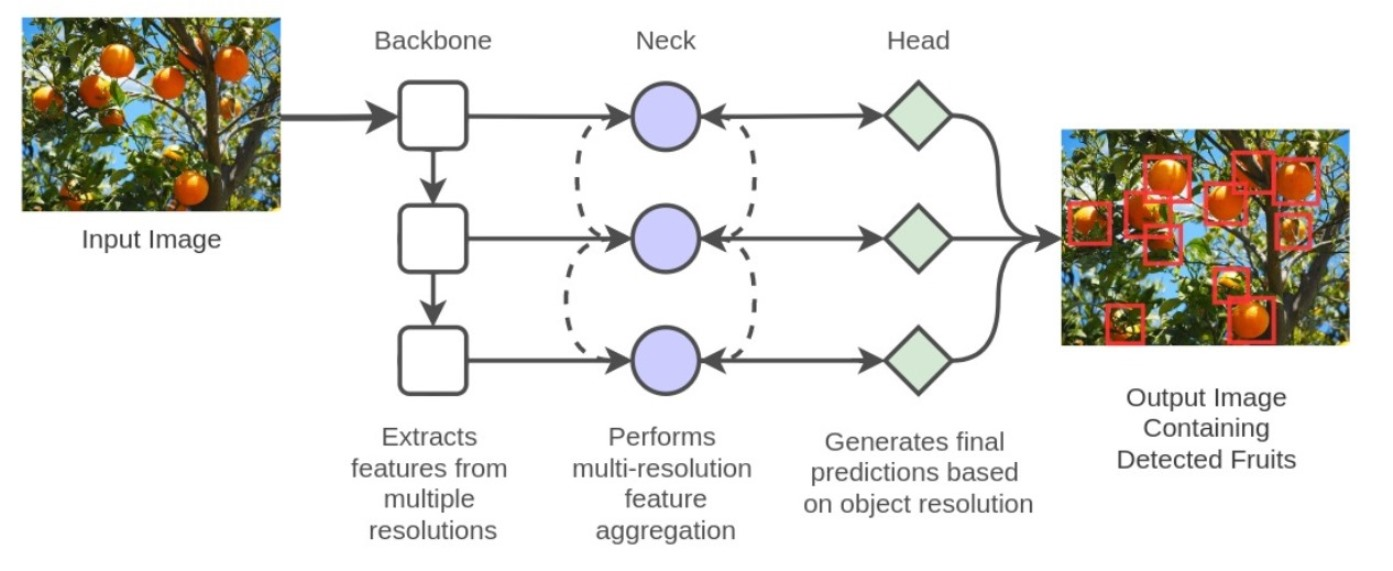
- The paper introduces a faster and robust fruit detection system, FruitDet, capable of detecting single and multiple fruits from a single model.
- The paper proposes a modified attention mechanism for better stability of the detection model.
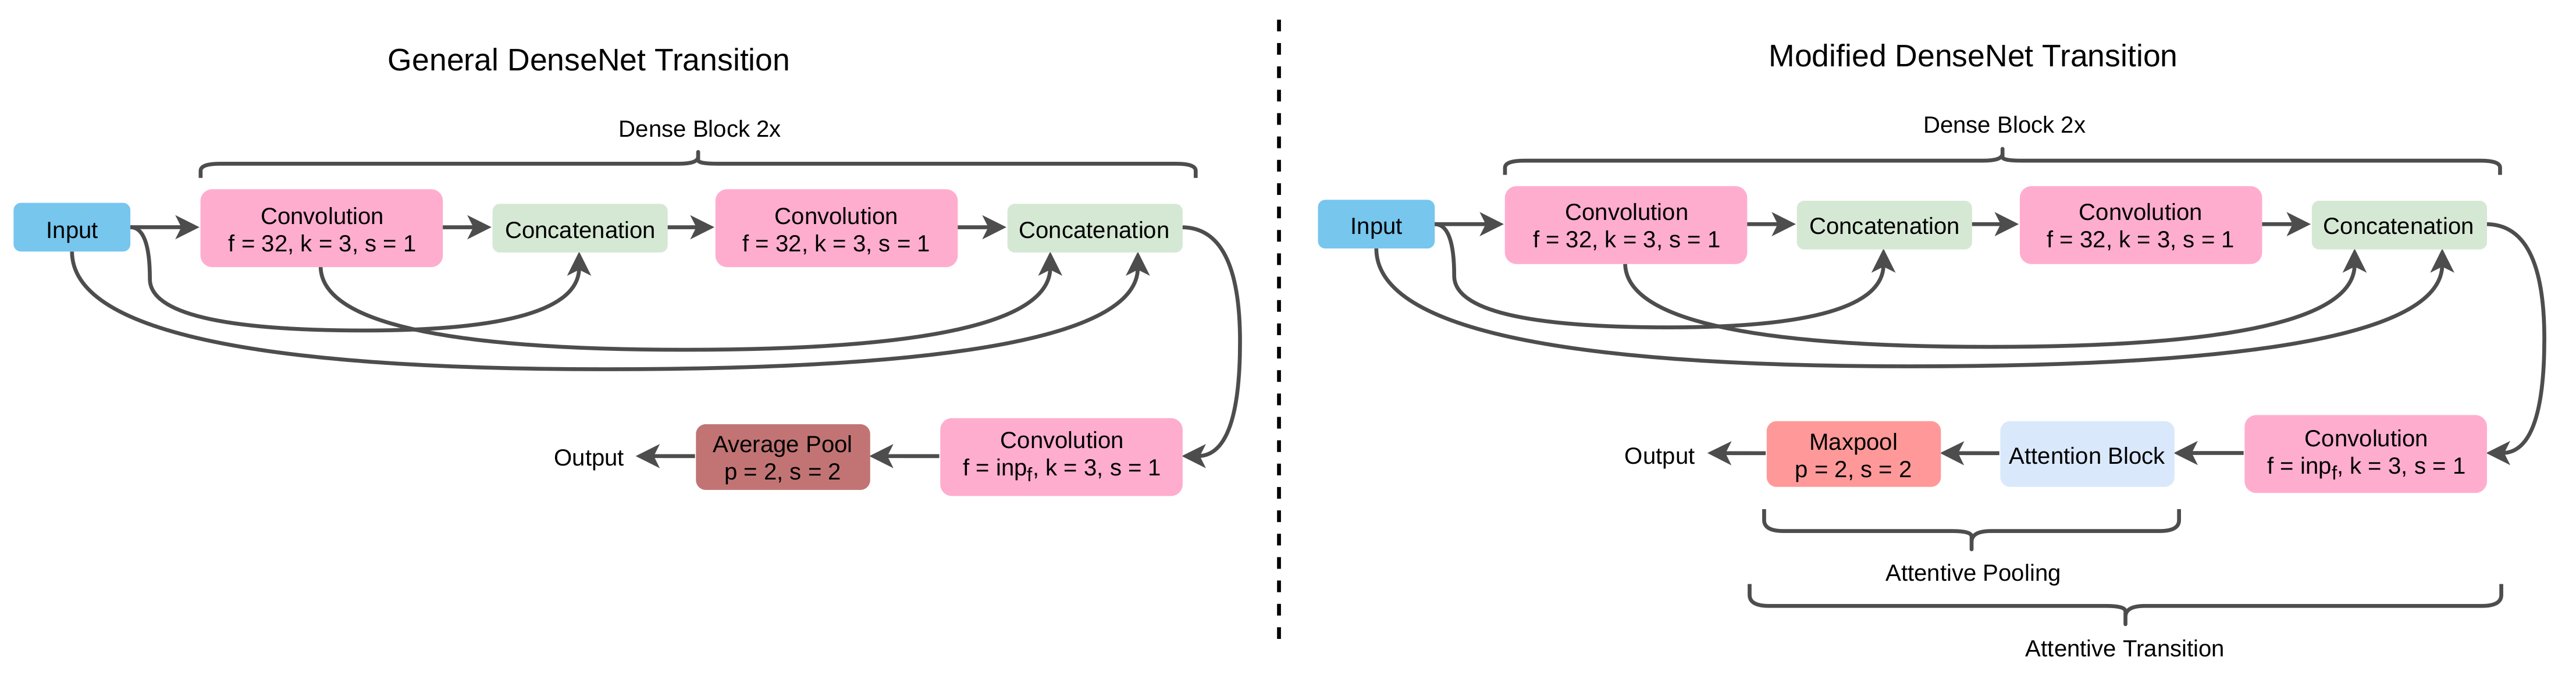
- The paper introduces an attentive pooling block, which combines the attention model and a max-pooling layer. The attentive pooling block can flow prioritize and downsample the essential features.
- The paper proposes a blackout regularization, which provides better detection capability by neglecting the object size to head detection mapping.
2. Related Work
3. FruitDet
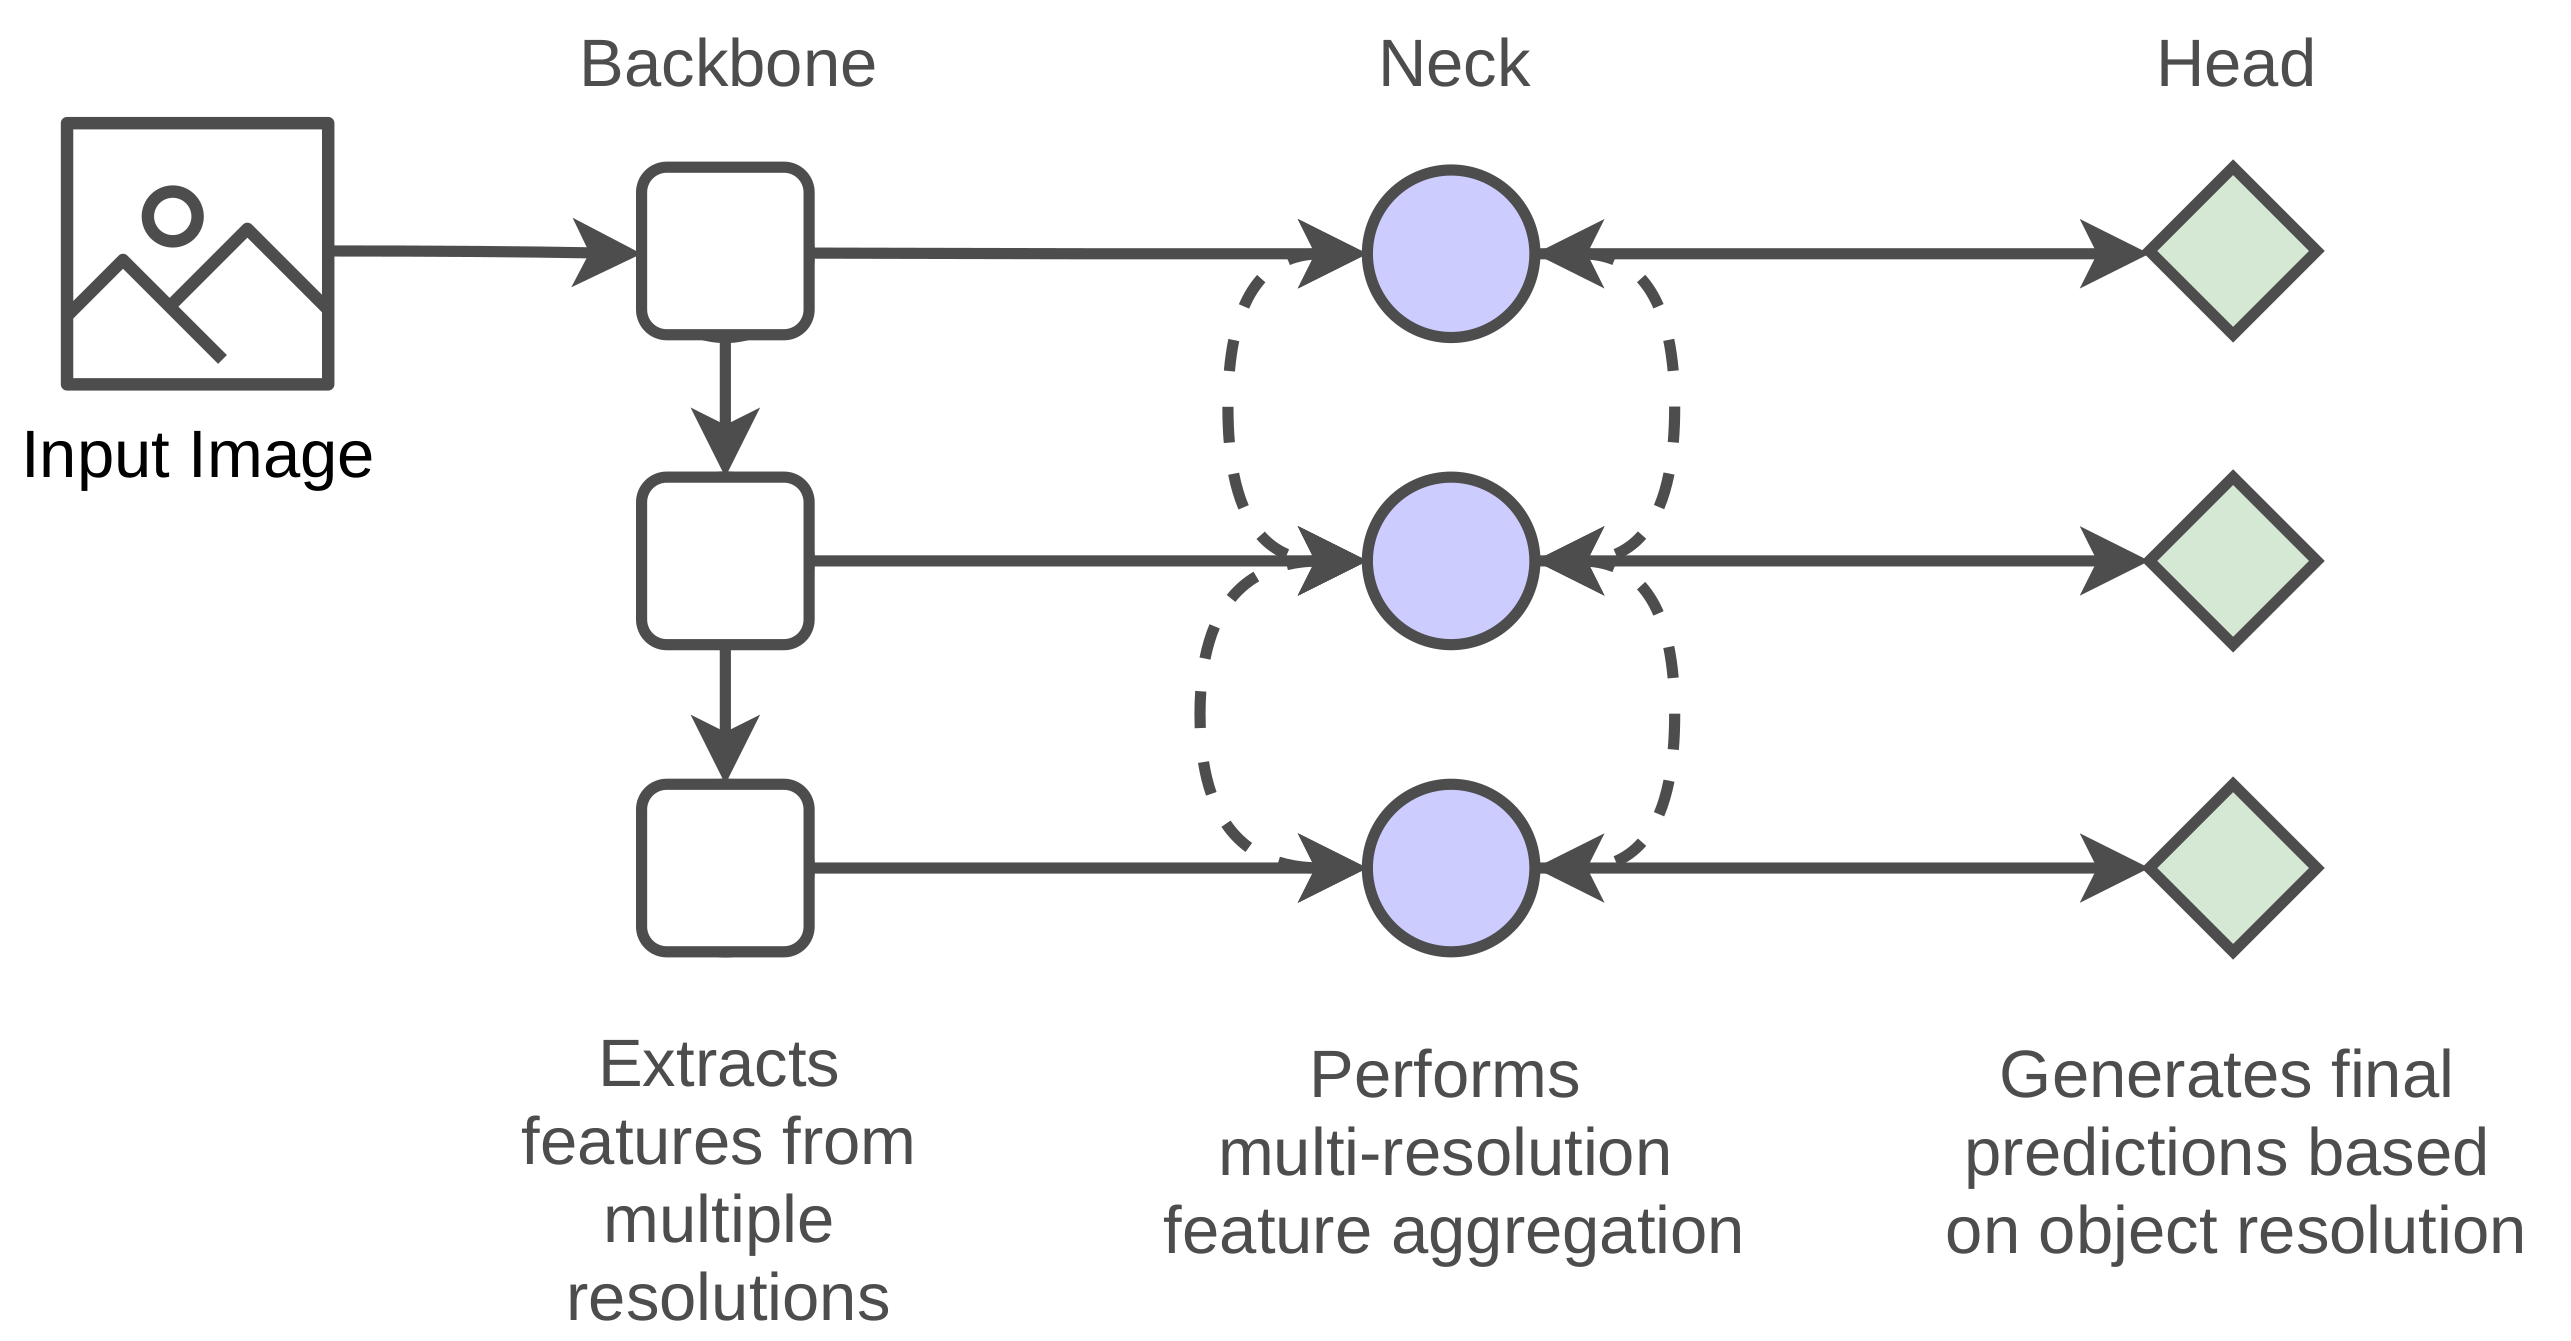
3.1. Backbone
3.1.1. Densely Connected CNN
3.1.2. Attentive Pooling: Feature Selective Pooling
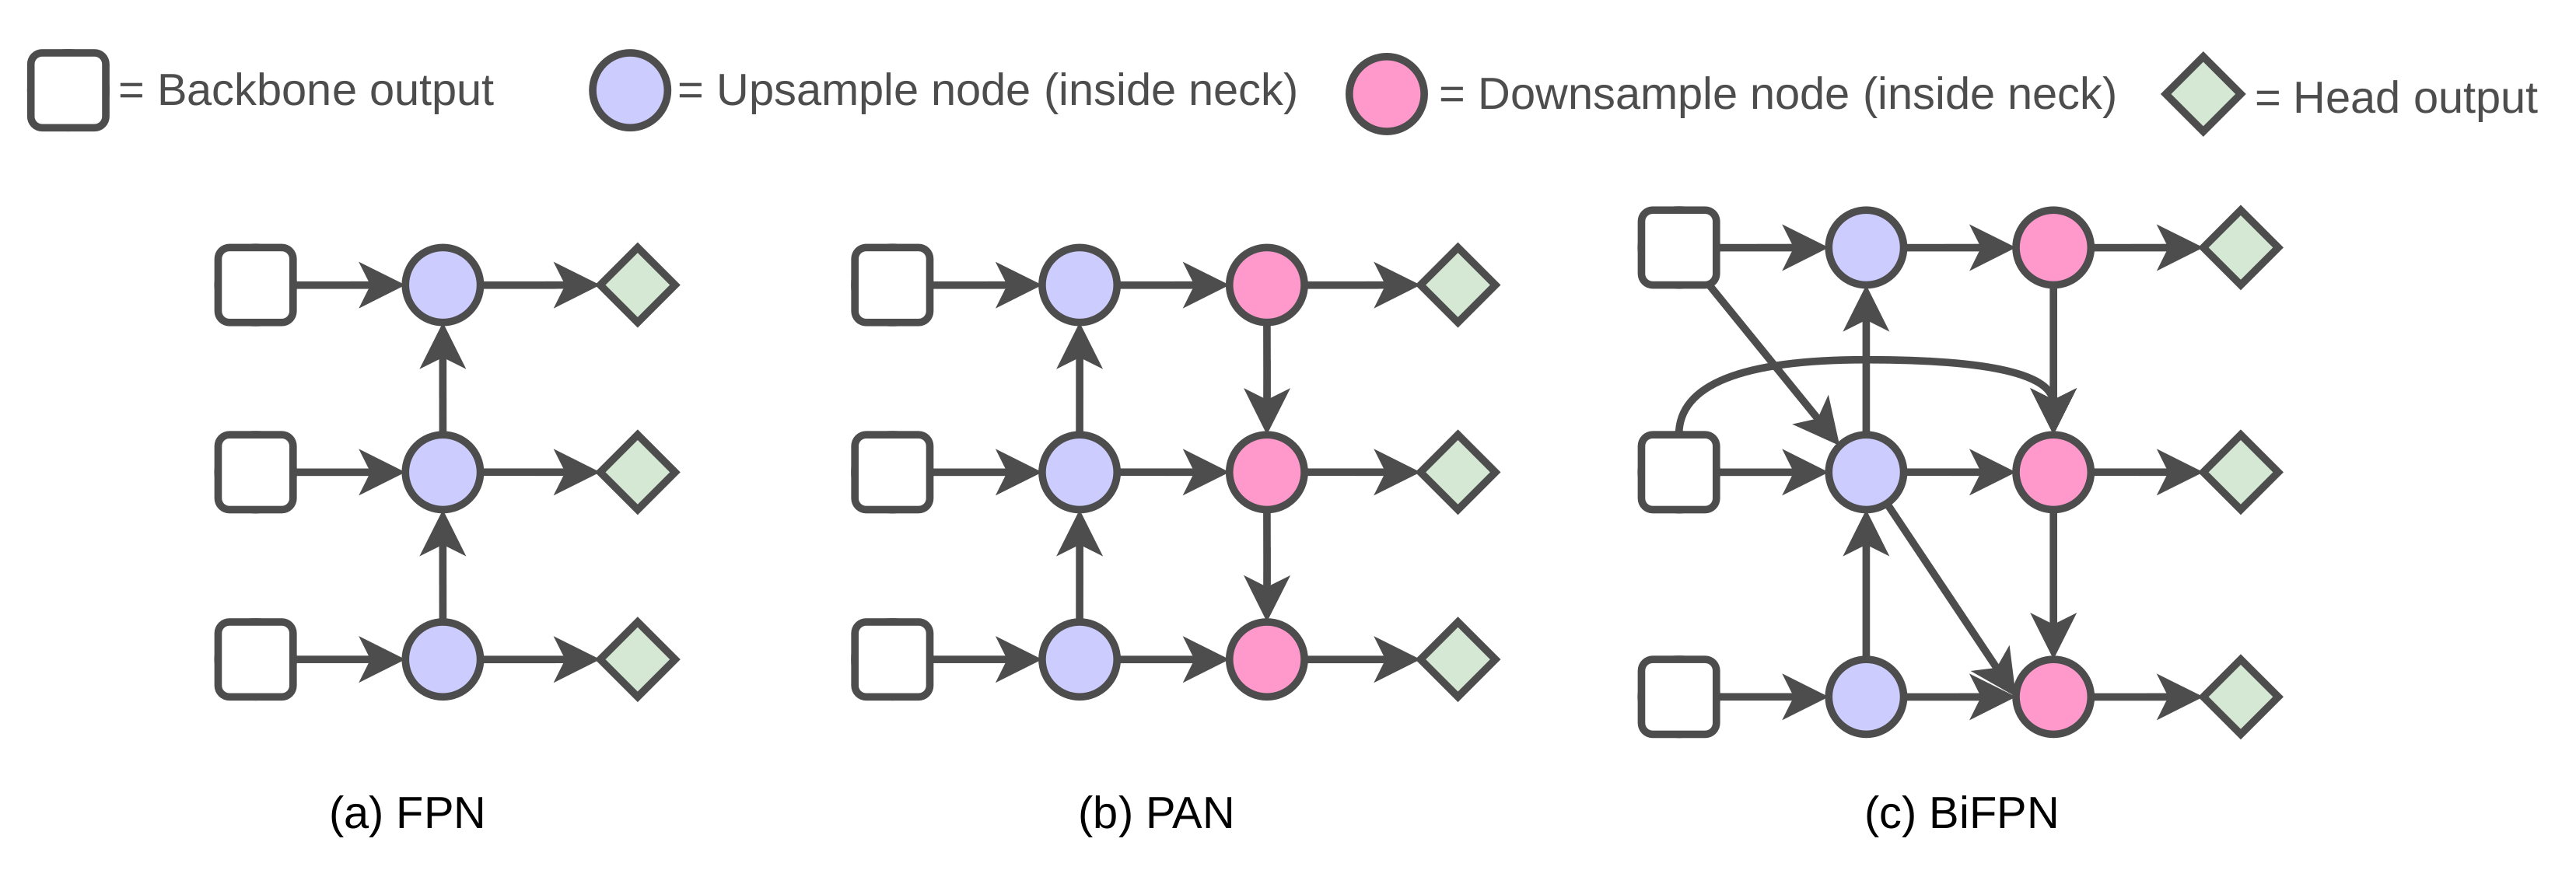
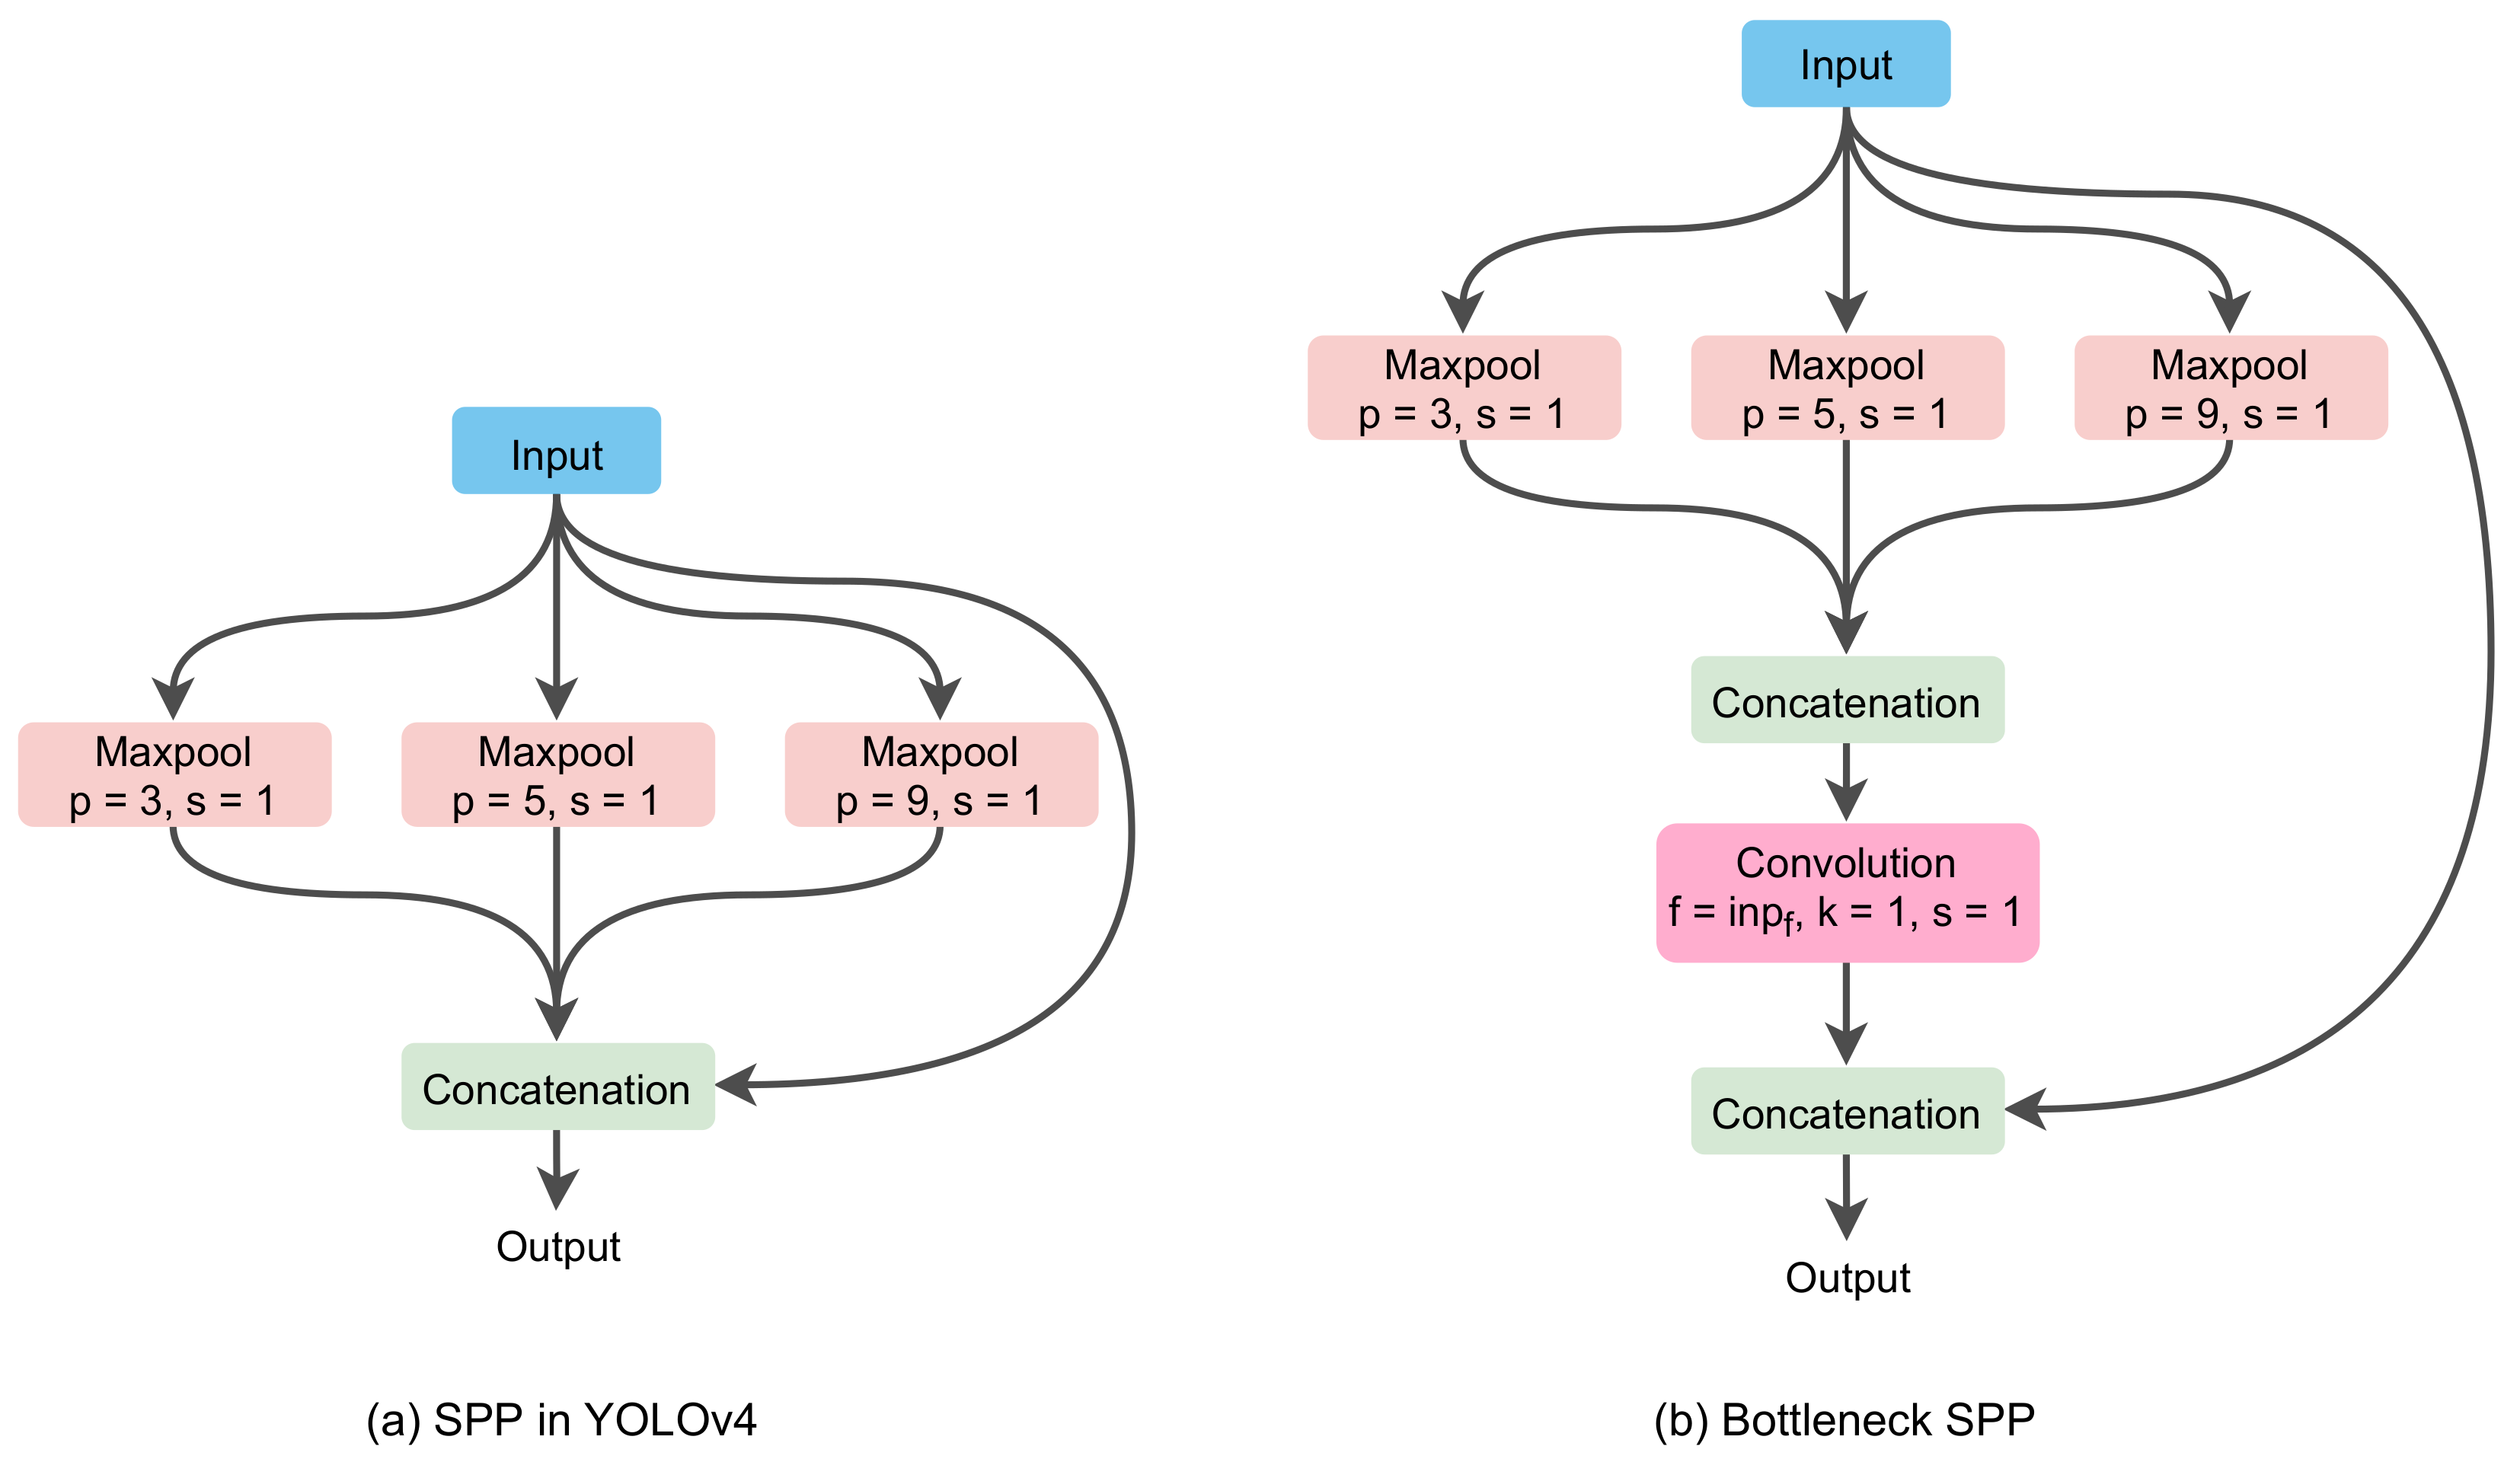
3.2. Neck
Bottleneck Spatial Pyramid Pooling
3.3. Head
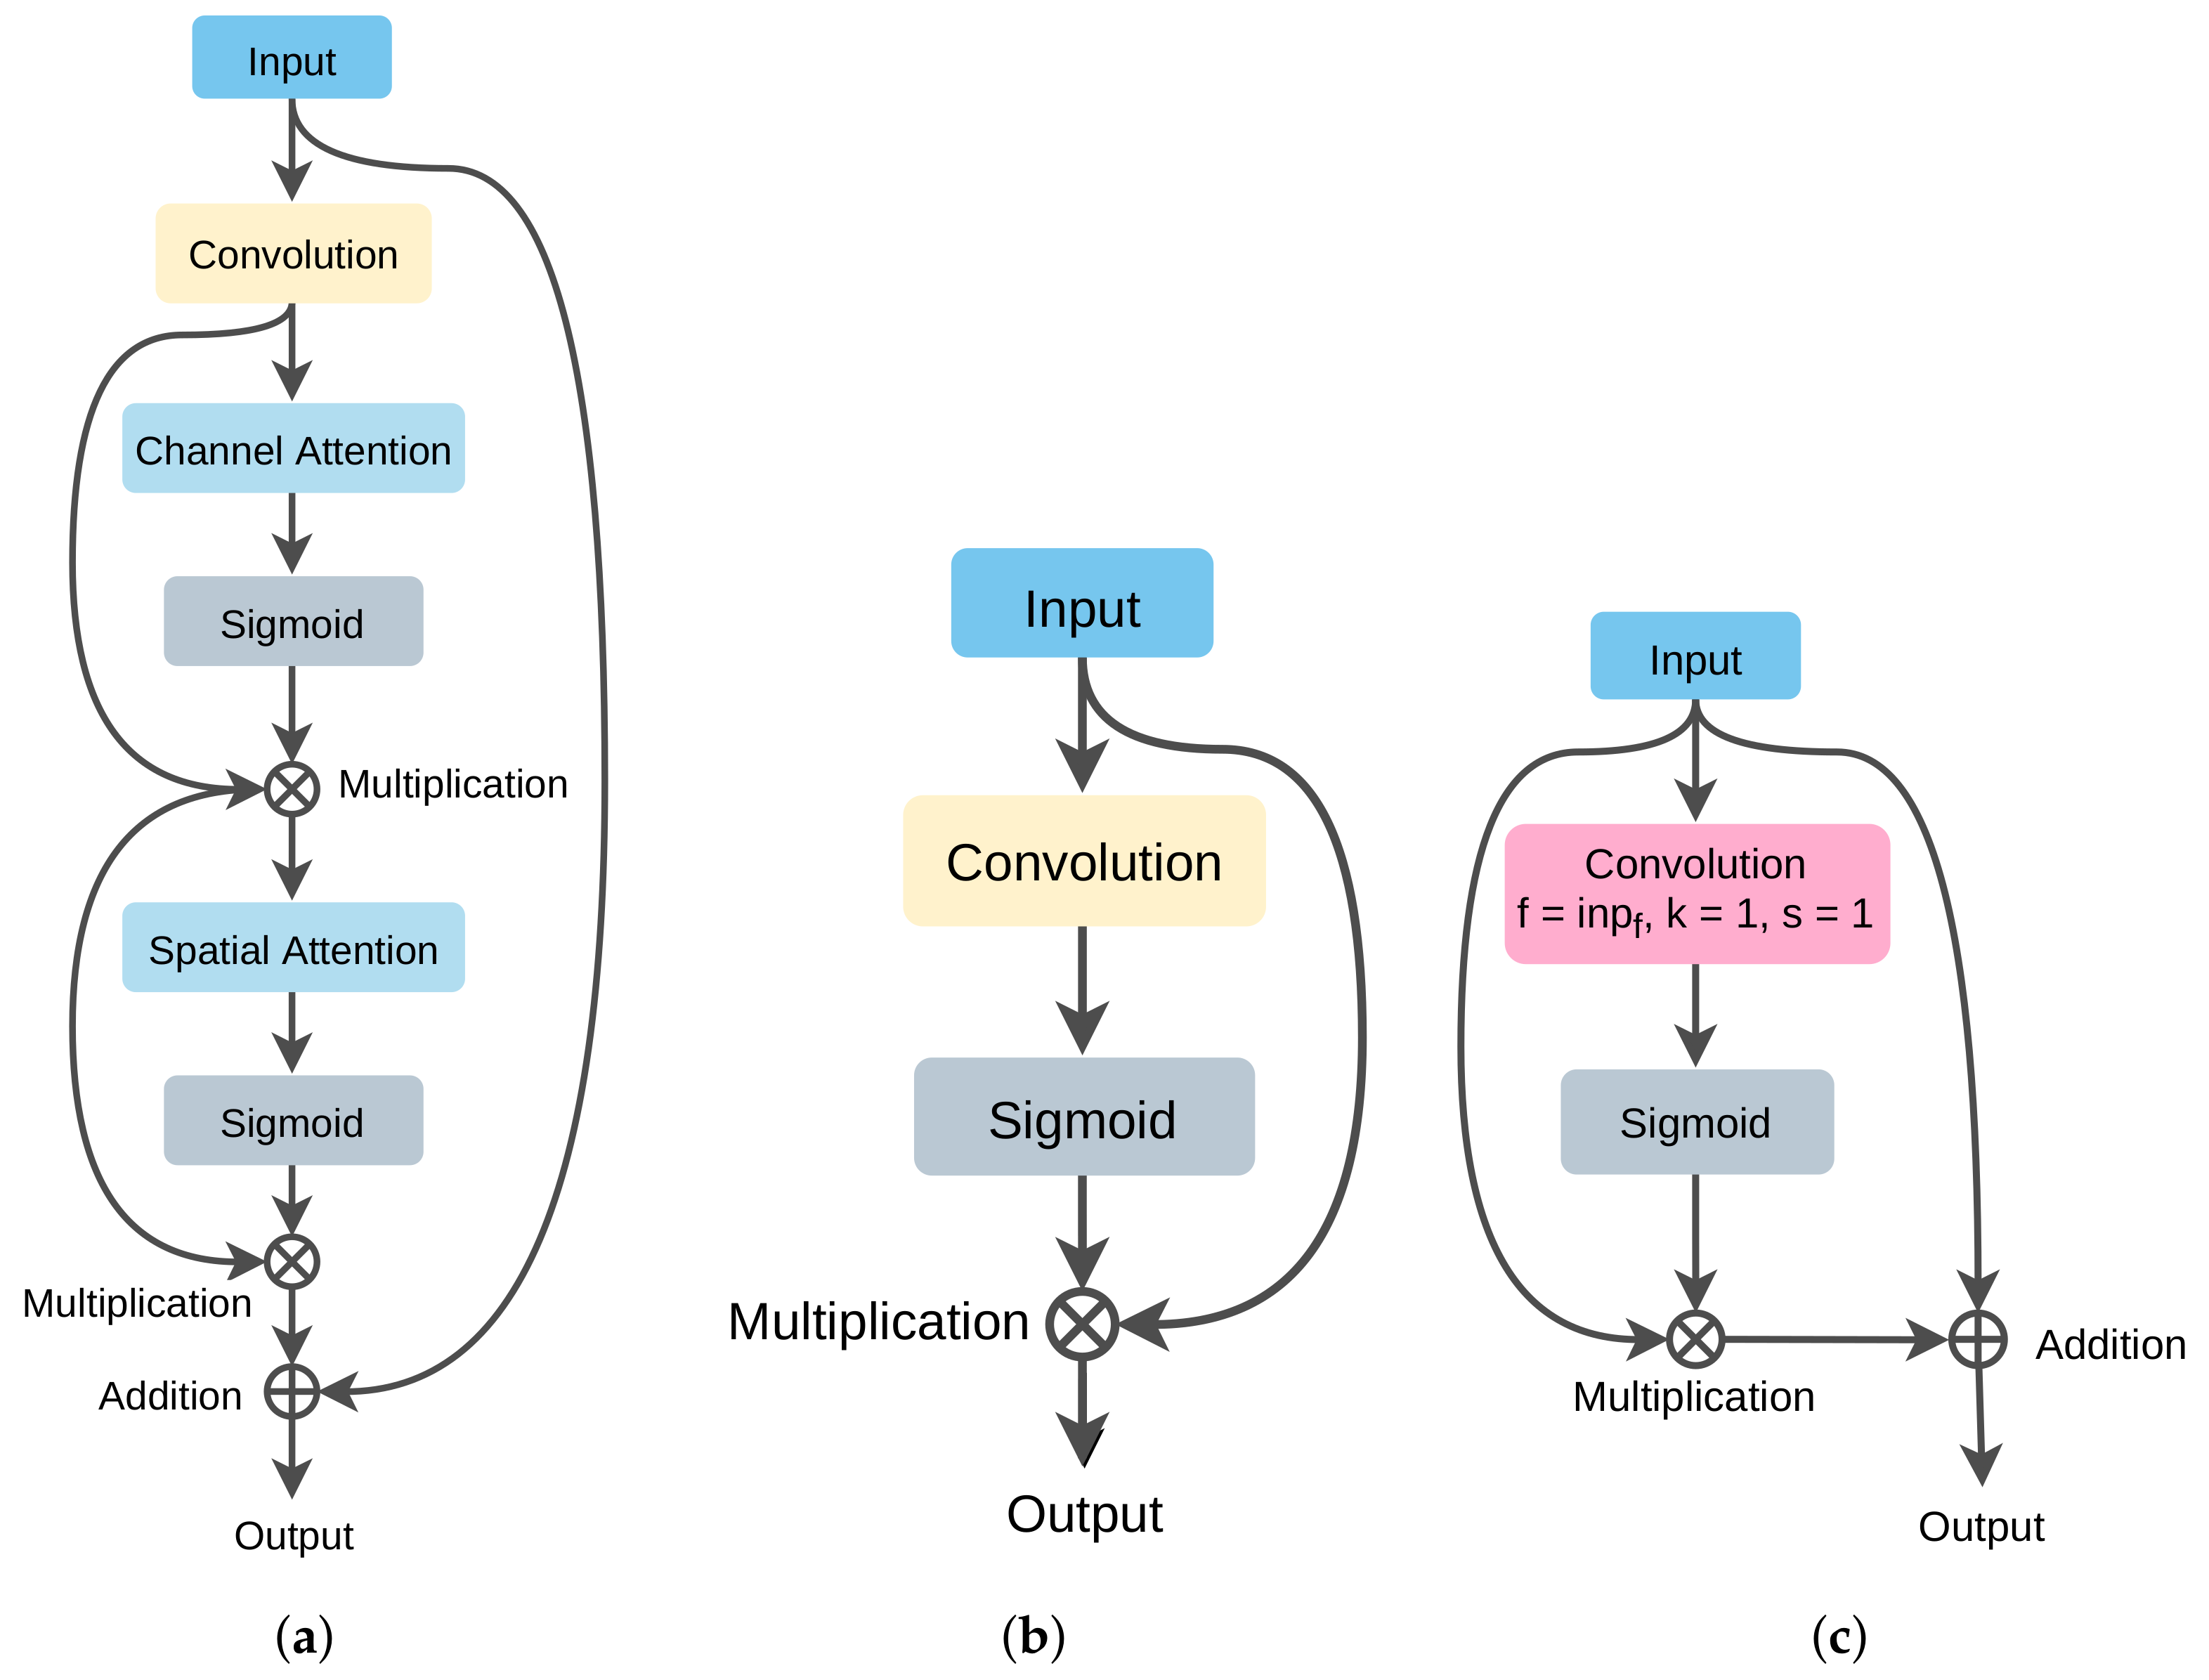
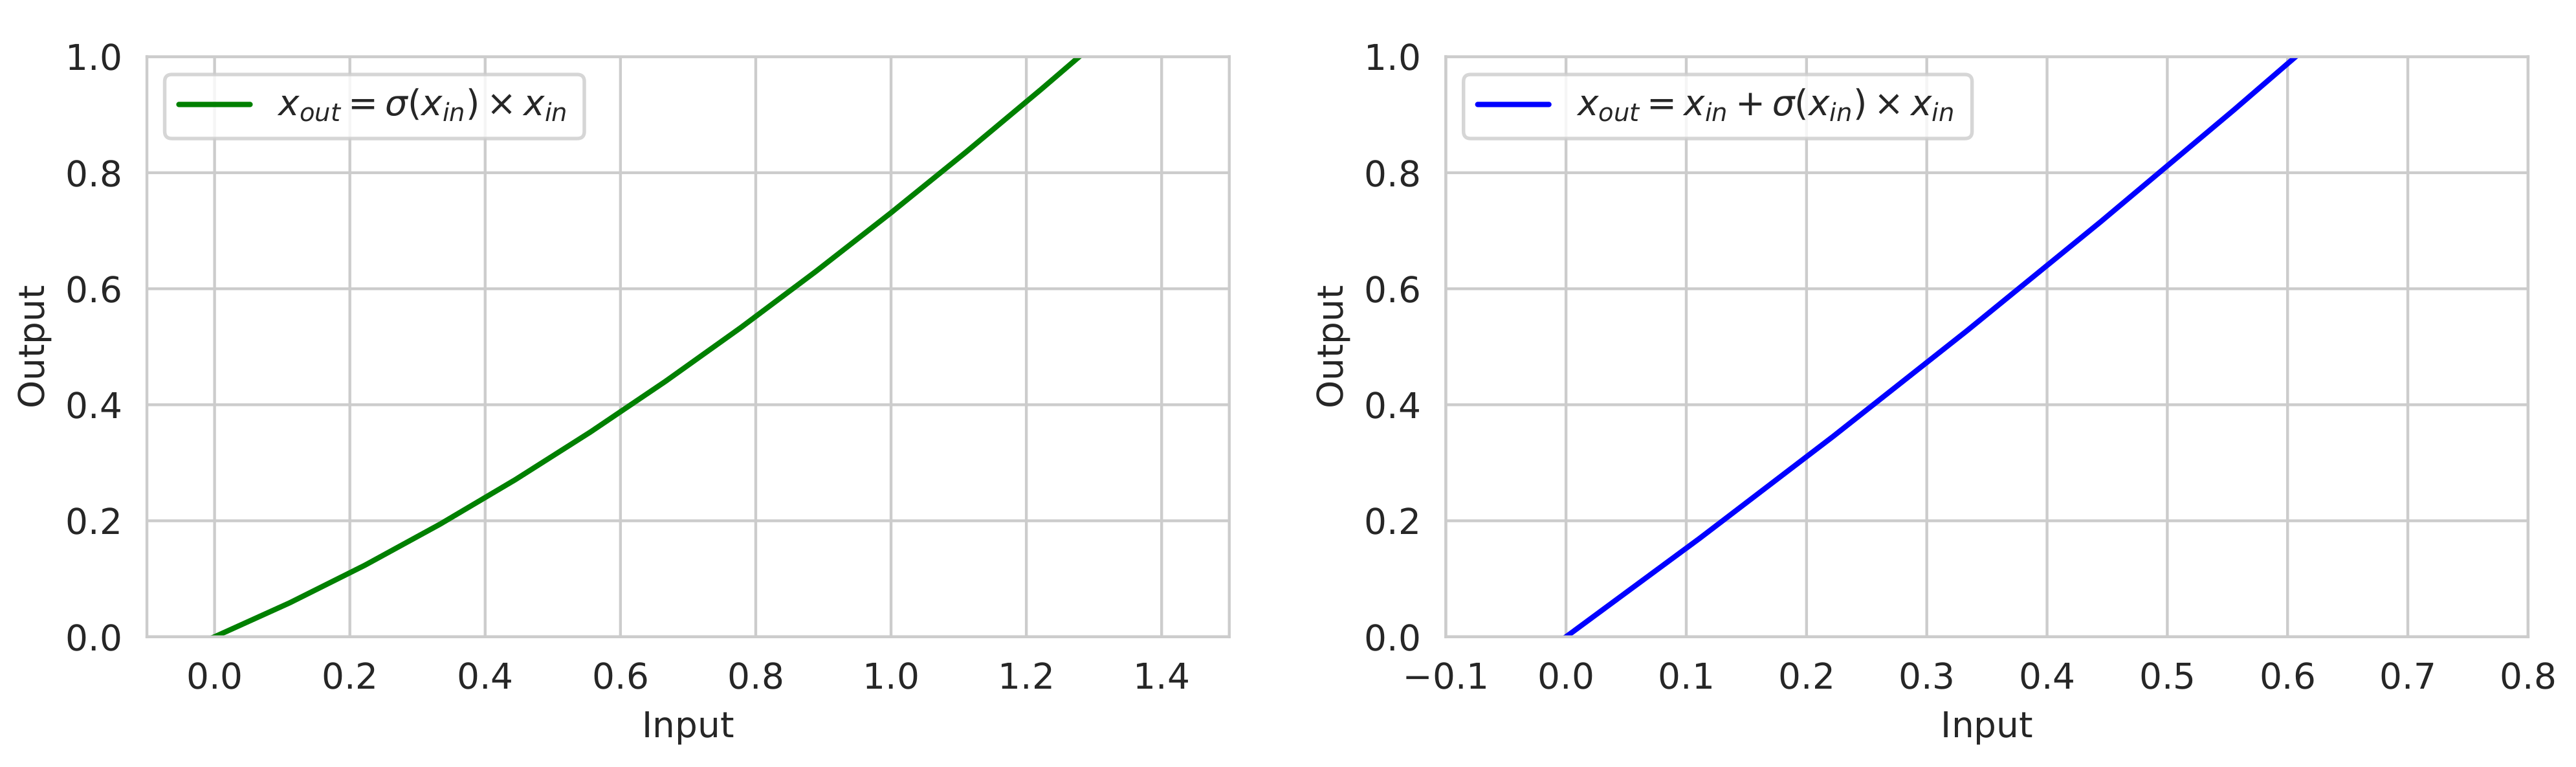
3.3.1. Modified Attention
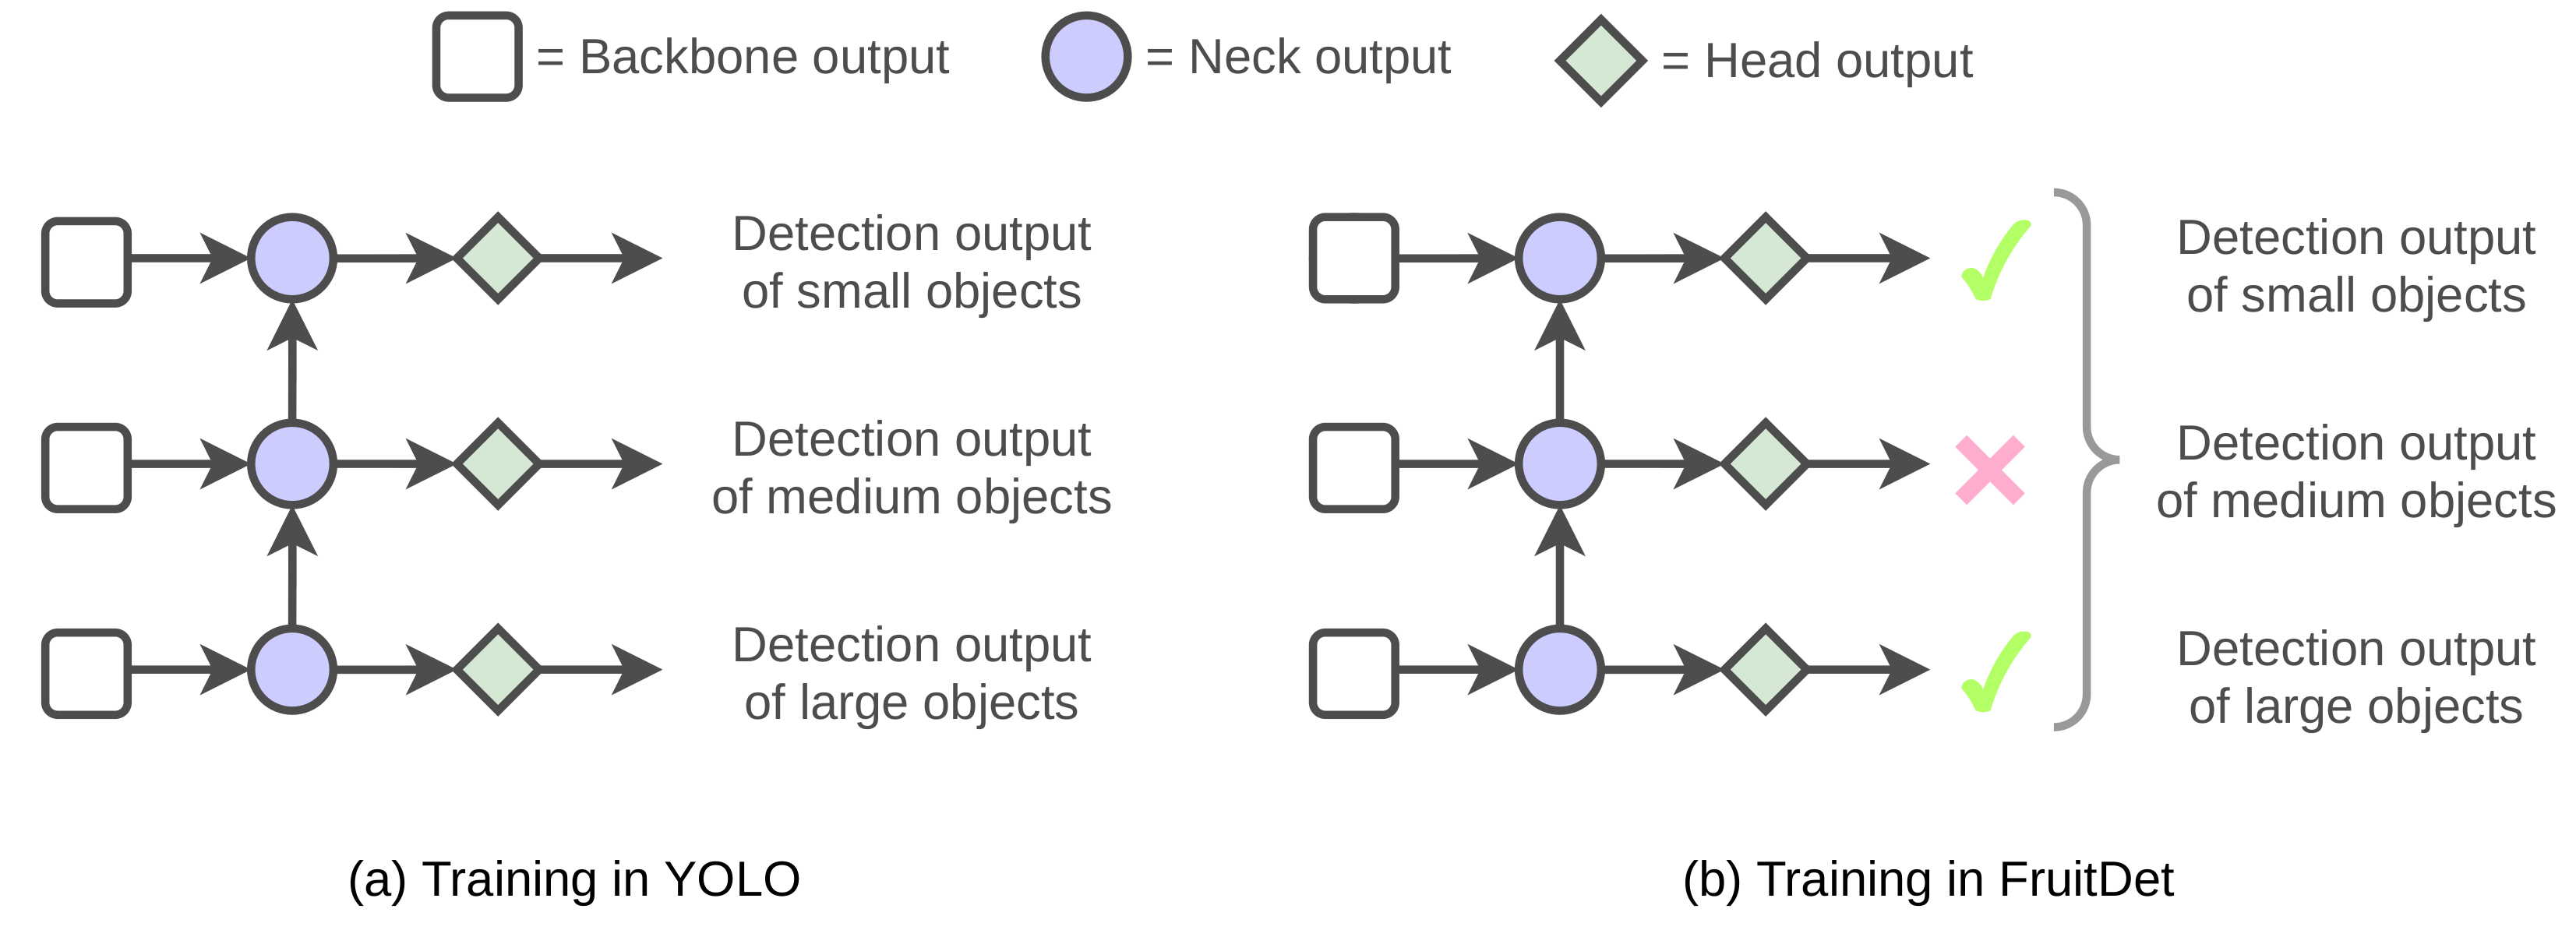
3.3.2. Blackout: A Head Dropout Mechanism
3.4. Training and Inference
4. Experimental Analysis
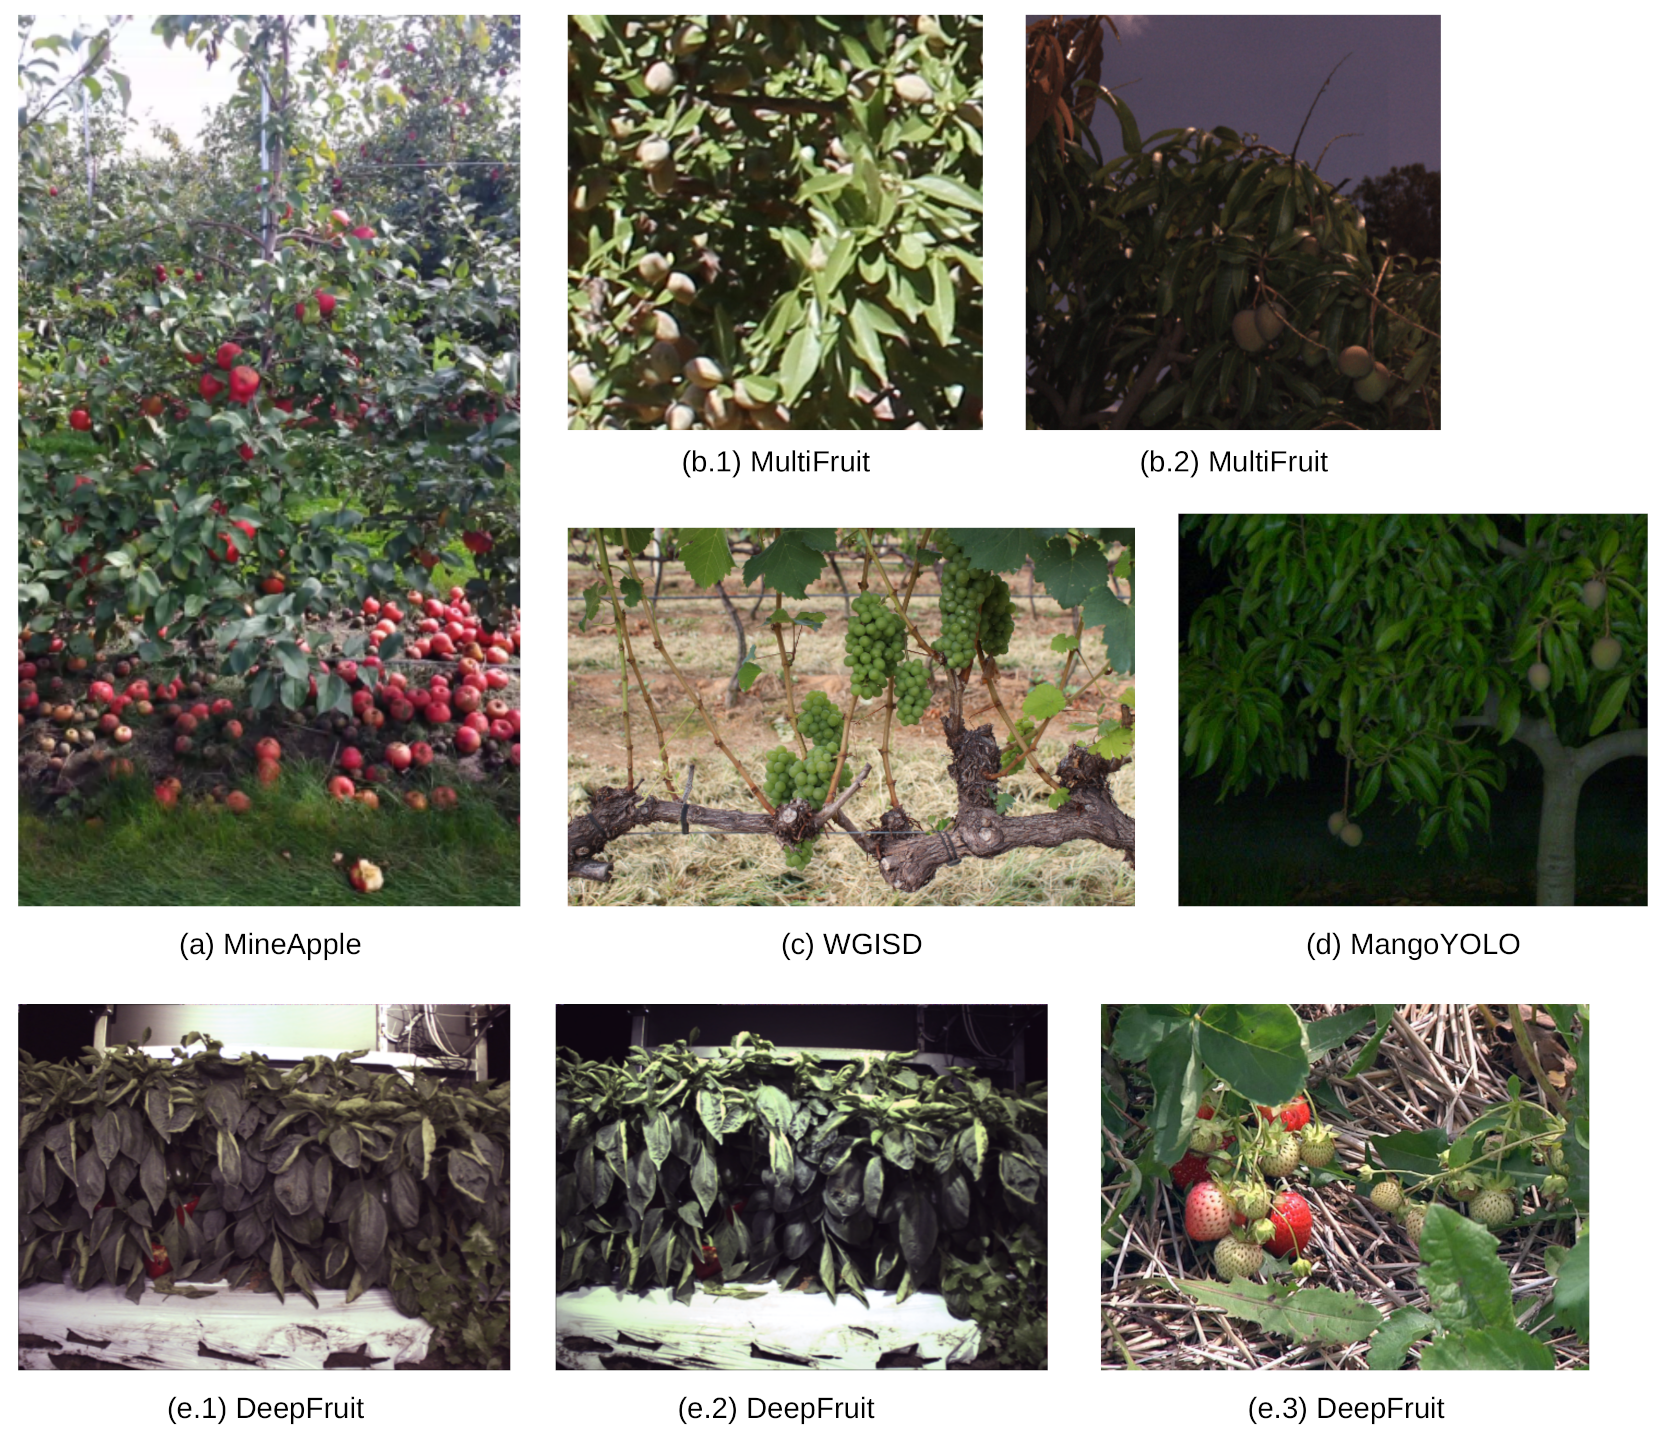
4.1. Datasets
4.2. Evaluation Metrics
4.3. Experimental Setup
4.4. Result Analysis
4.5. Inference
5. Conclusions
Author Contributions
Funding
Institutional Review Board Statement
Informed Consent Statement
Data Availability Statement
Conflicts of Interest
References
- Gebbers, R.; Adamchuk, V.I. Precision agriculture and food security. Science 2010, 327, 828–831. [Google Scholar] [CrossRef] [PubMed]
- Chen, S.; Zhang, K.; Zhao, Y.; Sun, Y.; Ban, W.; Chen, Y.; Zhuang, H.; Zhang, X.; Liu, J.; Yang, T. An Approach for Rice Bacterial Leaf Streak Disease Segmentation and Disease Severity Estimation. Agriculture 2021, 11, 420. [Google Scholar] [CrossRef]
- Shah, D.; Trivedi, V.; Sheth, V.; Shah, A.; Chauhan, U. ResTS: Residual deep interpretable architecture for plant disease detection. Inf. Process. Agric. 2021, in press. [Google Scholar] [CrossRef]
- A dos Santos Ferreira, A.; Freitas, D.M.; da Silva, G.G.; Pistori, H.; Folhes, M.T. Weed detection in soybean crops using ConvNets. Comput. Electron. Agric. 2017, 143, 314–324. [Google Scholar] [CrossRef]
- Lin, G.; Tang, Y.; Zou, X.; Wang, C. Three-dimensional reconstruction of guava fruits and branches using instance segmentation and geometry analysis. Comput. Electron. Agric. 2021, 184, 106107. [Google Scholar] [CrossRef]
- Chen, M.; Tang, Y.; Zou, X.; Huang, Z.; Zhou, H.; Chen, S. 3D global mapping of large-scale unstructured orchard integrating eye-in-hand stereo vision and SLAM. Comput. Electron. Agric. 2021, 187, 106237. [Google Scholar] [CrossRef]
- Kang, H.; Chen, C. Fruit detection, segmentation and 3D visualisation of environments in apple orchards. Comput. Electron. Agric. 2020, 171, 105302. [Google Scholar] [CrossRef] [Green Version]
- Shi, R.; Li, T.; Yamaguchi, Y. An attribution-based pruning method for real-time mango detection with YOLO network. Comput. Electron. Agric. 2020, 169, 105214. [Google Scholar] [CrossRef]
- Lawal, M.O. Tomato detection based on modified YOLOv3 framework. Sci. Rep. 2021, 11, 1447. [Google Scholar] [CrossRef]
- Kang, H.; Chen, C. Fast implementation of real-time fruit detection in apple orchards using deep learning. Comput. Electron. Agric. 2020, 168, 105108. [Google Scholar] [CrossRef]
- Zhou, Z.; Song, Z.; Fu, L.; Gao, F.; Li, R.; Cui, Y. Real-time kiwifruit detection in orchard using deep learning on Android™ smartphones for yield estimation. Comput. Electron. Agric. 2020, 179, 105856. [Google Scholar] [CrossRef]
- Yu, Y.; Zhang, K.; Yang, L.; Zhang, D. Fruit detection for strawberry harvesting robot in non-structural environment based on Mask-RCNN. Comput. Electron. Agric. 2019, 163, 104846. [Google Scholar] [CrossRef]
- Sa, I.; Ge, Z.; Dayoub, F.; Upcroft, B.; Perez, T.; McCool, C. Deepfruits: A fruit detection system using deep neural networks. Sensors 2016, 16, 1222. [Google Scholar] [CrossRef] [Green Version]
- Bargoti, S.; Underwood, J. Deep fruit detection in orchards. In Proceedings of the 2017 IEEE International Conference on Robotics and Automation (ICRA), Singapore, 29 May–3 June 2017; pp. 3626–3633. [Google Scholar]
- Bochkovskiy, A.; Wang, C.Y.; Liao, H.Y.M. Yolov4: Optimal speed and accuracy of object detection. arXiv 2020, arXiv:2004.10934. [Google Scholar]
- Lin, T.Y.; Goyal, P.; Girshick, R.; He, K.; Dollár, P. Focal loss for dense object detection. In Proceedings of the IEEE International Conference on Computer Vision, Venice, Italy, 22–29 October 2017; pp. 2980–2988. [Google Scholar]
- Ren, S.; He, K.; Girshick, R.; Sun, J. Faster r-cnn: Towards real-time object detection with region proposal networks. Adv. Neural Inf. Process. Syst. 2015, 28, 91–99. [Google Scholar] [CrossRef] [PubMed] [Green Version]
- Liu, W.; Anguelov, D.; Erhan, D.; Szegedy, C.; Reed, S.; Fu, C.Y.; Berg, A.C. Ssd: Single shot multibox detector. In European Conference on Computer Vision; Springer: Cham, Switzerland, 2016; pp. 21–37. [Google Scholar]
- Tan, M.; Pang, R.; Le, Q.V. Efficientdet: Scalable and efficient object detection. In Proceedings of the IEEE/CVF Conference on Computer Vision and Pattern Recognition, Virtual, 14–19 June 2020; pp. 10781–10790. [Google Scholar]
- Redmon, J.; Farhadi, A. Yolov3: An incremental improvement. arXiv 2018, arXiv:1804.02767. [Google Scholar]
- Koirala, A.; Walsh, K.; Wang, Z.; McCarthy, C. Deep learning for real-time fruit detection and orchard fruit load estimation: Benchmarking of ‘MangoYOLO’. Precis. Agric. 2019, 20, 1107–1135. [Google Scholar] [CrossRef]
- Koirala, A.; Walsh, K.B.; Wang, Z.; McCarthy, C. Deep learning–Method overview and review of use for fruit detection and yield estimation. Comput. Electron. Agric. 2019, 162, 219–234. [Google Scholar] [CrossRef]
- Santos, T.T.; de Souza, L.L.; dos Santos, A.A.; Avila, S. Grape detection, segmentation, and tracking using deep neural networks and three-dimensional association. Comput. Electron. Agric. 2020, 170, 105247. [Google Scholar] [CrossRef] [Green Version]
- Redmon, J.; Farhadi, A. YOLO9000: Better, faster, stronger. In Proceedings of the IEEE Conference on Computer Vision and Pattern Recognition, Honolulu, USA, 21–26 July 2017; pp. 7263–7271. [Google Scholar]
- Huang, G.; Liu, Z.; Van Der Maaten, L.; Weinberger, K.Q. Densely connected convolutional networks. In Proceedings of the IEEE Conference on Computer Vision and Pattern Recognition, Honolulu, USA, 21–26 July 2017; pp. 4700–4708. [Google Scholar]
- Lin, T.Y.; Dollár, P.; Girshick, R.; He, K.; Hariharan, B.; Belongie, S. Feature pyramid networks for object detection. In Proceedings of the IEEE Conference on computer Vision and Pattern Recognition, Honolulu, USA, 21–26 July 2017; pp. 2117–2125. [Google Scholar]
- Liu, S.; Qi, L.; Qin, H.; Shi, J.; Jia, J. Path aggregation network for instance segmentation. In Proceedings of the IEEE Conference on Computer Vision and Pattern Recognition, Salt Lake City, UT, USA, 18–23 June 2018; pp. 8759–8768. [Google Scholar]
- He, K.; Zhang, X.; Ren, S.; Sun, J. Spatial pyramid pooling in deep convolutional networks for visual recognition. IEEE Trans. Pattern Anal. Mach. Intell. 2015, 37, 1904–1916. [Google Scholar] [CrossRef] [PubMed] [Green Version]
- Woo, S.; Park, J.; Lee, J.Y.; Kweon, I.S. Cbam: Convolutional block attention module. In Proceedings of the European Conference on Computer Vision (ECCV), Munich, Germany, 8–14 September 2018; pp. 3–19. [Google Scholar]
- Zheng, Z.; Wang, P.; Liu, W.; Li, J.; Ye, R.; Ren, D. Distance-IoU loss: Faster and better learning for bounding box regression. Proc. AAAI Conf. Artif. Intell. 2020, 34, 12993–13000. [Google Scholar] [CrossRef]
- Häni, N.; Roy, P.; Isler, V. MinneApple: A benchmark dataset for apple detection and segmentation. IEEE Robot. Autom. Lett. 2020, 5, 852–858. [Google Scholar] [CrossRef] [Green Version]
- Padilla, R.; Passos, W.L.; Dias, T.L.; Netto, S.L.; da Silva, E.A. A comparative analysis of object detection metrics with a companion open-source toolkit. Electronics 2021, 10, 279. [Google Scholar] [CrossRef]
- Abadi, M.; Agarwal, A.; Barham, P.; Brevdo, E.; Chen, Z.; Citro, C.; Corrado, G.S.; Davis, A.; Dean, J.; Devin, M.; et al. Tensorflow: Large-scale machine learning on heterogeneous distributed systems. arXiv 2016, arXiv:1603.04467. [Google Scholar]
- Chollet, F. keras. 2015. Available online: https://github.com/fchollet/keras (accessed on 20 November 2021).
- Buslaev, A.; Iglovikov, V.I.; Khvedchenya, E.; Parinov, A.; Druzhinin, M.; Kalinin, A.A. Albumentations: Fast and flexible image augmentations. Information 2020, 11, 125. [Google Scholar] [CrossRef] [Green Version]
- Loshchilov, I.; Hutter, F. Sgdr: Stochastic gradient descent with warm restarts. arXiv 2016, arXiv:1608.03983. [Google Scholar]
- Tan, M.; Le, Q. Efficientnet: Rethinking model scaling for convolutional neural networks. In Proceedings of the International Conference on Machine Learning, Long Beach, CA, USA, 9–15 June 2019; pp. 6105–6114. [Google Scholar]
- Han, X.; Zhao, L.; Ning, Y.; Hu, J. ShipYolo: An enhanced model for ship detection. J. Adv. Transp. 2021, 2021, 1060182. [Google Scholar] [CrossRef]
- Abdurahman, F.; Fante, K.A.; Aliy, M. Malaria parasite detection in thick blood smear microscopic images using modified YOLOV3 and YOLOV4 models. BMC Bioinform. 2021, 22, 112. [Google Scholar] [CrossRef]
- Simonyan, K.; Zisserman, A. Very deep convolutional networks for large-scale image recognition. arXiv 2014, arXiv:1409.1556. [Google Scholar]
- Lawal, O.M. YOLOMuskmelon: Quest for fruit detection speed and accuracy using deep learning. IEEE Access 2021, 9, 15221–15227. [Google Scholar] [CrossRef]
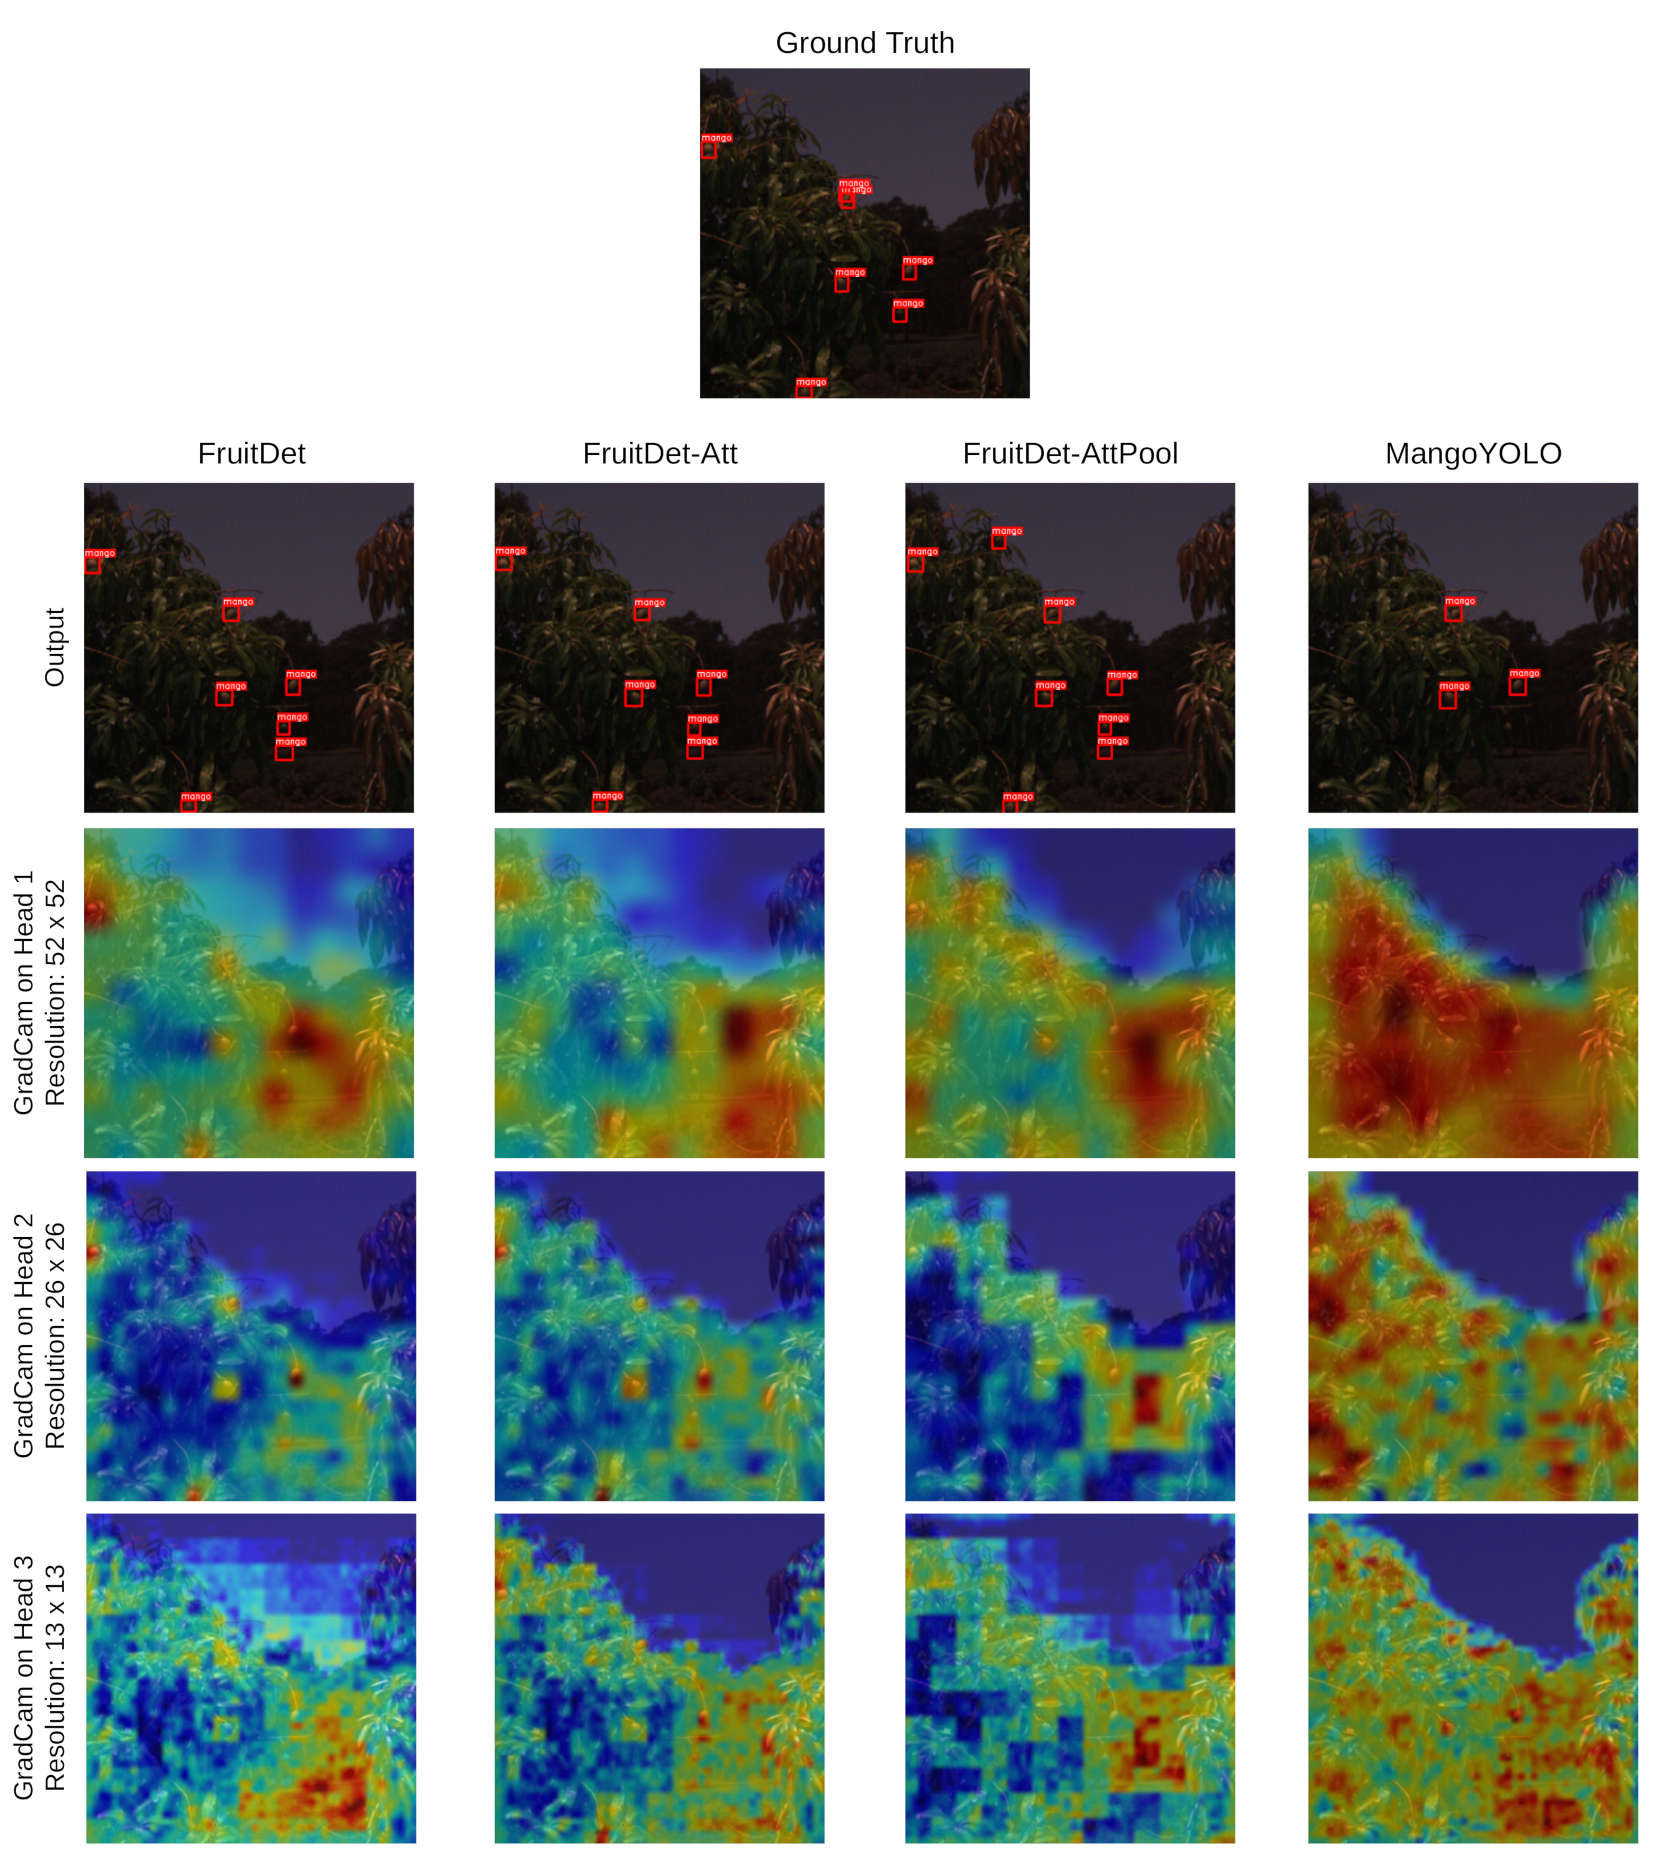
- Selvaraju, R.R.; Cogswell, M.; Das, A.; Vedantam, R.; Parikh, D.; Batra, D. Grad-cam: Visual explanations from deep networks via gradient-based localization. In Proceedings of the IEEE International Conference on Computer Vision, Venice, Italy, 22–29 October 2017; pp. 618–626. [Google Scholar]


| Dataset | Classes | Train | Test | ||
|---|---|---|---|---|---|
| Counts | Total | Counts | Total | ||
| DeepFruit [13] | Apple | 294 | 1952 | 65 | 489 |
| Avocado | 138 | 40 | |||
| Mango | 905 | 240 | |||
| Orange | 221 | 53 | |||
| Rockmelon | 123 | 14 | |||
| Strawberry | 271 | 77 | |||
| MangoYOLO [22] | Mango | 12,681 | 12,681 | 2600 | 2600 |
| MultiFruit [14] | Almond | 3980 | 15,309 | 797 | 2298 |
| Apple | 5211 | 554 | |||
| Mango | 6118 | 947 | |||
| MinneApple [31] | Apple | 24,539 | 24,539 | 3643 | 3643 |
| WGISD [23] | Chardonnay | 660 | 3582 | 180 | |
| Cabernet Franc | 910 | 159 | 850 | ||
| Cabernet Sauvignon | 532 | 111 | |||
| Sauvignon Blanc | 1034 | 283 | |||
| Syrah | 446 | 117 | |||
| Model | Construction |
|---|---|
| FruitDet | The actual FruitDet model with attentive pooling, FPN, attention, and blackout. |
| FruitDet-Blackout | The FruitDet architecture without blackout. |
| FruitDet-Att | FruitDet architecture excluding attention module. |
| FruitDet-AttPool | FruitDet architecture excluding attentive pooling module. |
| FruitDet+SAM | FruitDet architecture with SAM attention module. |
| FruitDet+PAN | FruitDet architecture with PAN network. |
| DarkNet+FPN | FruitDet architecture with DarkNet53 as backbone and FPN in the neck. |
| DarkNet+PAN | FruitDet architecture with DarkNet53 as backbone and PAN in the neck. |
| EfficientNet+PAN | FruitDet architecture with EfficientNetB0 as backbone and PAN in the neck. |
| EfficientNet+FPN | FruitDet architecture with EfficientNetB0 as backbone and FPN in the neck. |
| MangoYOLO | The default MangoYOLO architecture. |
| YOLOv4 | The default YOLOv4 architecture. |
| YOLOv3 | The default YOLOv3 architecture. |
| Dataset | Apple | Avocado | Mango | Orange | Rockmelon | Strawberry | mAP | Mean Prec. | ||||||
|---|---|---|---|---|---|---|---|---|---|---|---|---|---|---|
| AP | Prec. | AP | Prec. | AP | Prec. | AP | Prec. | AP | Prec. | AP | Prec. | |||
| FruitDet | 73.53 | 61.96 | 68.78 | 59.26 | 76.38 | 80.61 | 52.15 | 77.50 | 53.05 | 47.37 | 69.22 | 64.49 | 65.52 | 71.30 |
| FruitDet+SAM | 80.78 | 56.19 | 55.06 | 49.15 | 83.50 | 81.95 | 51.64 | 68.18 | 43.61 | 34.78 | 72.89 | 71.88 | 64.58 | 69.65 |
| EfficientNet+PAN | 75.65 | 60.23 | 53.70 | 48.15 | 73.90 | 68.28 | 61.76 | 64.71 | 54.86 | 45.00 | 71.28 | 60.18 | 65.19 | 62.82 |
| EfficientNet+FPN | 68.78 | 52.94 | 52.81 | 53.06 | 67.69 | 69.61 | 58.18 | 66.67 | 55.97 | 60.00 | 67.48 | 57.26 | 61.82 | 62.72 |
| FruitDet-Blackout | 73.10 | 59.18 | 64.24 | 51.67 | 68.53 | 74.21 | 51.80 | 75.12 | 48.40 | 46.72 | 70.42 | 64.28 | 62.75 | 61.86 |
| DarkNet+PAN | 75.29 | 60.47 | 35.27 | 45.24 | 62.56 | 64.49 | 48.37 | 50.00 | 11.11 | 11.11 | 64.93 | 71.25 | 49.59 | 60.22 |
| FruitDet-AttPool | 80.58 | 61.54 | 40.66 | 31.67 | 70.76 | 63.32 | 56.46 | 46.67 | 21.59 | 28.57 | 78.36 | 67.01 | 58.07 | 58.08 |
| FruitDet+FPN | 79.25 | 42.86 | 56.54 | 40.51 | 79.16 | 65.45 | 56.05 | 58.33 | 56.91 | 28.57 | 73.26 | 51.39 | 66.86 | 54.09 |
| DarkNet+FPN | 65.89 | 49.02 | 32.48 | 33.33 | 54.81 | 57.88 | 46.34 | 49.09 | 20.86 | 18.52 | 46.82 | 63.01 | 44.53 | 52.45 |
| FruitDet-Att | 73.16 | 48.18 | 41.12 | 39.62 | 59.53 | 58.82 | 40.28 | 22.43 | 9.09 | 11.11 | 78.42 | 69.15 | 50.27 | 50.86 |
| MangoYOLO | 46.90 | 39.17 | 18.99 | 47.06 | 37.66 | 50.59 | 17.68 | 20.93 | 1.14 | 12.50 | 16.77 | 34.18 | 23.19 | 40.67 |
| YOLOv4 | 41.27 | 20.54 | 0 | 0 | 25.64 | 30.26 | 11.98 | 13.62 | 0 | 0 | 15.39 | 22.91 | 15.71 | 23.11 |
| YOLOv3 | 60.76 | 69.49 | 27.27 | 1.00 | 15.58 | 52.70 | 22.53 | 40.74 | 0 | 0 | 27.27 | 66.67 | 25.57 | 59.80 |
| Dataset | Almond | Apple | Mango | mAP | Mean Prec. | |||
|---|---|---|---|---|---|---|---|---|
| AP | Prec. | AP | Prec. | AP | Prec. | |||
| FruitDet | 58.87 | 83.02 | 84.02 | 93.10 | 81.08 | 88.31 | 74.66 | 88.14 |
| YOLOv3 | 55.84 | 82.12 | 77.01 | 92.51 | 74.57 | 88.43 | 69.14 | 87.40 |
| MangoYOLO | 53.68 | 80.88 | 77.81 | 91.30 | 72.92 | 85.21 | 68.14 | 85.39 |
| YOLOv4 | 58.26 | 76.42 | 77.82 | 92.94 | 73.95 | 88.52 | 70.01 | 85.27 |
| FruitDet-Blackout | 58.67 | 81.40 | 83.18 | 91.33 | 80.41 | 88.10 | 74.09 | 86.94 |
| FruitDet-Att | 58.54 | 77.12 | 76.70 | 91.15 | 72.36 | 86.88 | 69.20 | 84.53 |
| FruitDet-AttPool | 59.17 | 78.59 | 76.06 | 91.22 | 78.43 | 84.74 | 71.22 | 84.27 |
| DarkNet+PAN | 57.09 | 75.57 | 76.69 | 91.20 | 68.67 | 81.28 | 67.49 | 81.57 |
| FruitDet+SAM | 58.61 | 74.34 | 81.93 | 87.24 | 77.63 | 83.77 | 72.72 | 81.28 |
| EfficientNet+FPN | 57.27 | 75.21 | 74.47 | 88.08 | 68.46 | 82.42 | 66.73 | 81.18 |
| FruitDet+PAN | 58.42 | 70.94 | 82.44 | 88.65 | 79.75 | 84.15 | 73.54 | 80.30 |
| EfficientNet+PAN | 54.78 | 70.57 | 71.99 | 82.62 | 70.56 | 82.27 | 65.78 | 78.14 |
| DarkNet+FPN | 53.67 | 73.05 | 76.60 | 88.95 | 71.81 | 75.26 | 67.36 | 77.81 |
| Dataset | Chardonnay | Cabernet Franc | Cabernet Sauvignon | Sauvignon Blanc | Syrah | mAP | Mean Prec. | |||||
|---|---|---|---|---|---|---|---|---|---|---|---|---|
| AP | Prec. | AP | Prec. | AP | Prec. | AP | Prec. | AP | Prec. | |||
| FruitDet | 75.35 | 60.00 | 70.15 | 74.07 | 60.61 | 58.06 | 75.35 | 80.00 | 70.35 | 77.68 | 70.36 | 75.63 |
| FruitDet-AttPool | 77.25 | 73.63 | 66.57 | 71.08 | 59.67 | 68.52 | 74.33 | 77.15 | 68.71 | 81.82 | 69.31 | 74.75 |
| FruitDet-Att | 67.16 | 74.07 | 68.95 | 70.06 | 59.25 | 71.28 | 63.17 | 71.34 | 70.03 | 85.86 | 65.71 | 73.35 |
| EfficientNet+PAN | 67.19 | 75.28 | 57.48 | 64.33 | 50.66 | 57.14 | 67.00 | 80.40 | 59.67 | 82.11 | 60.40 | 72.56 |
| FruitDet+SAM | 77.24 | 83.24 | 67.45 | 74.10 | 60.18 | 59.15 | 73.13 | 78.69 | 62.36 | 64.07 | 68.07 | 71.85 |
| EfficientNet+FPN | 63.03 | 61.95 | 65.78 | 64.57 | 42.25 | 63.53 | 65.56 | 73.40 | 49.73 | 66.99 | 57.27 | 67.06 |
| FruitDet+PAN | 54.68 | 55.29 | 51.13 | 62.59 | 43.36 | 67.61 | 55.07 | 65.35 | 35.15 | 68.85 | 47.88 | 62.66 |
| DarkNet+PAN | 66.87 | 63.64 | 67.59 | 55.14 | 47.18 | 43.06 | 64.83 | 70.77 | 60.21 | 50.94 | 61.34 | 58.96 |
| MangoYOLO | 48.56 | 46.43 | 48.94 | 60.29 | 27.27 | 83.78 | 48.22 | 58.66 | 35.89 | 78.00 | 41.78 | 58.25 |
| DarkNet+FPN | 64.86 | 48.54 | 66.28 | 51.75 | 44.24 | 65.06 | 65.54 | 65.55 | 62.52 | 63.72 | 60.69 | 57.73 |
| YOLOv4 | 39.17 | 39.82 | 45.63 | 53.05 | 26.65 | 75.00 | 55.64 | 49.47 | 35.59 | 43.85 | 40.53 | 48.08 |
| YOLOv3 | 12.41 | 22.64 | 1.30 | 9.09 | 0 | 0 | 1.54 | 16.98 | 9.09 | 61.54 | 4.87 | 18.21 |
| Dataset | AP | Prec. |
|---|---|---|
| FruitDet | 81.50 | 99.18 |
| FruitDet-noBlackout | 81.28 | 99.14 |
| MangoYOLO | 81.15 | 98.96 |
| FruitDet-Att | 81.14 | 98.94 |
| YOLOv4 | 81.20 | 98.62 |
| YOLOv3 | 80.90 | 98.60 |
| EfficientNet+FPN | 80.88 | 98.57 |
| FruitDet-AttPool | 80.97 | 98.52 |
| DarkNet+FPN | 80.73 | 98.33 |
| FruitDet+SAM | 80.75 | 98.22 |
| DarkNet+PAN | 80.79 | 98.04 |
| FruitDet+PAN | 80.54 | 97.88 |
| EfficientNet+PAN | 79.51 | 96.81 |
| Dataset | AP | Prec. |
|---|---|---|
| FruitDet | 79.34 | 85.07 |
| FruitDet-noBlackout | 79.01 | 84.60 |
| FruitDet-AttPool | 71.01 | 84.41 |
| FruitDet-Att | 70.50 | 84.00 |
| FruitDet+SAM | 78.28 | 83.83 |
| FruitDet+PAN | 78.00 | 83.55 |
| YOLOv4 | 68.82 | 80.04 |
| YOLOv3 | 68.59 | 80.34 |
| MangoYOLO | 68.25 | 79.36 |
| DarkNet+PAN | 66.35 | 77.68 |
| EfficientNet+PAN | 65.65 | 77.62 |
| EfficientNet+FPN | 64.20 | 75.22 |
| DarkNet+FPN | 78.20 | 73.47 |
| Model | Parameters (in Million) | FLOPs | Time (Milliseconds) |
|---|---|---|---|
| FruitDet | 6.79 | 211.0 | |
| YOLOv3 | 61.53 | 214.67 | |
| YOLOv4 | 60.28 | 221.33 | |
| MangoYOLO | 13.78 | 217.67 |
Publisher’s Note: MDPI stays neutral with regard to jurisdictional claims in published maps and institutional affiliations. |
© 2021 by the authors. Licensee MDPI, Basel, Switzerland. This article is an open access article distributed under the terms and conditions of the Creative Commons Attribution (CC BY) license (https://creativecommons.org/licenses/by/4.0/).
Share and Cite
Kateb, F.A.; Monowar, M.M.; Hamid, M.A.; Ohi, A.Q.; Mridha, M.F. FruitDet: Attentive Feature Aggregation for Real-Time Fruit Detection in Orchards. Agronomy 2021, 11, 2440. https://doi.org/10.3390/agronomy11122440
Kateb FA, Monowar MM, Hamid MA, Ohi AQ, Mridha MF. FruitDet: Attentive Feature Aggregation for Real-Time Fruit Detection in Orchards. Agronomy. 2021; 11(12):2440. https://doi.org/10.3390/agronomy11122440
Chicago/Turabian StyleKateb, Faris A., Muhammad Mostafa Monowar, Md. Abdul Hamid, Abu Quwsar Ohi, and Muhammad Firoz Mridha. 2021. "FruitDet: Attentive Feature Aggregation for Real-Time Fruit Detection in Orchards" Agronomy 11, no. 12: 2440. https://doi.org/10.3390/agronomy11122440