Article

Reduction of Nitrogen Losses in Winter Wheat Grown on Light Soils

1
Department of Bioeconomy and Systems Analysis, Institute of Soil Science and Plant Cultivation—State Research Institute, Czartoryskich 8, 24-100 Puławy, Poland
2
Department of Plant Nutrition and Fertilization, Institute of Soil Science and Plant Cultivation—State Research Institute, Czartoryskich 8, 24-100 Puławy, Poland
*
Author to whom correspondence should be addressed.
Agronomy 2021, 11(11), 2337; https://doi.org/10.3390/agronomy11112337
Submission received: 21 October 2021 / Revised: 14 November 2021 / Accepted: 15 November 2021 / Published: 18 November 2021

Abstract

:
Two 16-year-old series of experiments with winter wheat grown in rotation after winter oilseed rape were used in the study. The experiments were located in the cold temperate dry and moist climate zones on light soils. Wheat was fertilized with nitrogen in the doses of 40, 80, 120, 160, and 200 kg N·ha−1 per year. Through the several years of the experiment, critical N rates for maximum yield and gross margin from the linear-plus plateau regressions were 149 ± 23.9 and 112 ± 23.6 kg N·ha−1, respectively. The estimated nitrogen indicators for these doses were as follows: nitrogen use efficiency (NUE) 93 and 108%, N surplus (Ns) 6.8 and −10.1 kg·N·ha−1, yield-scaled Ns, N2O, and NH3 3.5 and −0.2; 0.35 and 0.30; 0.31 and 0.25 kg N·Mg−1, respectively. Experiments have shown that two strategies for reducing nitrogen losses on light soils under wheat cultivation are possible: by limiting the N dose to the critical values due to the yield requirements, or due to the gross margin. The analysis of the 11-year data for 2300 farm fields with winter wheat grown on light soils showed that only 10% of them were implementing the first strategy, and as much as 90% chose the second strategy.

1. Introduction

Nitrogen (N) is one of the most essential nutrients ensuring crop production [1]. Simultaneously, N is the most important crop yield limiting factor in the world [2]. As a main nutrient element, it is necessary in a relatively large quantity for the production of proteins, nucleic acids, and chlorophyll in plants [3]. Therefore, in agriculture, it is used to fertilize crops in the form of natural and mineral fertilizers. Over the last 100 years, the consumption of mineral fertilizers has risen in particular for nitrogen [4]. This has contributed significantly to the growth of global food, feed, and biofuel production [5]. However, the negative effect of the increase in N consumption was profound changes in the global cycle of nitrogen transformation [6,7]. Excessive consumption of N has led to an increase in the amount of reactive nitrogen diffused into the environment, contributing to the problems of human health and ecosystem degradation [6,8,9]. The volatilization of ammonia, nitrate leaching, and the emissions of di-nitrogen, nitrous oxide, and nitrogen oxide are the main loss pathways from agricultural systems [7,10].
Over time, nitrogen balancing has been used to evaluate the effects of fertilization at different levels of agroecosystem organization [11,12,13,14]. It turned out that such indicators as nitrogen use efficiency (NUE) and nitrogen surplus (Ns) are useful for characterizing nitrogen performance. The concept of NUE was defined in the 1980s [15]. It evolved later and many NUE definitions appeared which were scalable from the plant to the global agroecosystem and food system [16]. In Europe, NUE was recently defined as the ratio between N outputs and N inputs (in kg N output harvested per kg N input or in %), and N surplus as the difference between N inputs and N outputs (in kg N·ha−1) [17]. At the same time, it was assumed that for European conditions the threshold values of the N indicators are N offtake (Yn) > 80 kg ha, NUE 50–90%, and Ns < 80 kg ha [14].
Numerous studies show that less than 50% of N introduced into agroecosystems in the form of mineral and natural fertilizers is effectively used while the rest is dispersed in the environment and contributes to various negative ecological effects [18,19,20]. NUE is considered quite low on average in conventional agricultural systems in the world, including developed countries. The NUE for world cereal production has been estimated at 33% of fertilizer N recovered by the crop [21]. Nitrogen inputs, nitrogen output, and loss vary strongly in Europe [22]. On average, 145 kg N·ha−1 is added to European soils each year. The average Yn is 92 kg N·ha−1·yr−1, which implies an average NUE of 63% and Ns of 53 kg N·ha−1·yr−1 [22]. NUE of European agriculture has increased, but by far not enough to sufficiently reduce N losses and meet environmental targets [23]. Exploring nitrogen indicators of farm performance among farm types across several European case studies show a wide variation in NUE and Ns, mainly related to differences in farming systems and management [24]. Arable farms presented lower mean N input and surplus than livestock farms, and therefore had the highest median NUE. The median of data for arable farms were NUE of 61% and N surplus of 68 kg N·ha−1, for dairy farms NUE of 30% and N surplus of 155 kg N·ha−1, and for pig farms NUE of 40% and N surplus of 135 kg N·ha−1. NUE sometimes turned out to be higher than 100%, especially when soil available N before sowing a crop was high. The ambitious NUE and Ns targets for studied farm were 75% and 42 kg·N ha−1, respectively. In Europe, to achieve surface water quality targets without crop production losses, average NUE needs to increase from 64 to 78%, whereas achieving groundwater targets only requires a modest increase from 64 to 67%. In hotspot areas, however, crop production and N thresholds can only be reconciled at NUE > 0.90% [14]. Increasing NUE is practically possible by tuning the rate, timing, method, and type of N fertilizers’ application, with the goal to better adjust N supply to crop demand [25,26,27,28,29]. In general, improving NUE while reducing soil Ns constitutes an effective strategy to mitigate soil gaseous N loss through N2O and NH3 emissions [30,31].
Under optimal conditions of temperate climate, it is possible to obtain the yield of winter wheat grain of 10 Mg·ha with Yn = 250 kg·ha, F = 300 kg·ha and NUE > 80% [32]. Under the conditions of intensive nitrogen fertilization of winter wheat (245 ± 75 kg·ha), the medians Yn, NUE, and Ns were 164 kg·ha, 80%, and 78 kg·ha, respectively [33]. In the cited studies, it was found that NUE>100% was present in 20% of the studied fields. NUE values in winter wheat crops in Central Europe depended on the cultivar, N dose, and fertilizer form and ranged from 57 to 81% [34].
In open field conditions, NUE decreases while Ns increases with increasing N doses [35]. Most of the Ns in arable land is leached [36]. The amount of N leached depends on the properties of the soil, the cultivated plant, and the amount of rainfall [37,38,39,40]. A certain amount of Ns is emitted as N2O and NH3 in the nitrification and denitrification processes [41,42,43]. These emissions can be measured, modeled, or estimated using emission factors [13]. Although there is value to both measuring and modeling emissions, it is believed that a simple field- and farm-level indicator of N loss, responsive to changes in farm management practices, is likely to be both more credible and more useful to farmers [13].
Increasingly, in studies on the mitigation of N gas losses, emissions are provided as yield-scaled quantities [13,44,45,46,47,48,49,50]. This makes it possible to compare for systems of different productivity and facilitates the assessment of the effectiveness of various mitigation practices [13]. Some studies showed that the N input producing optimum amount of crop yields may minimize yield-scaled emissions in agricultural production [51].
Increasingly, nitrogen rate strategies for reducing N losses take into account not only environmental aspects (increasing NUE or lowering Ns), but also economic aspects (maximizing returns to N, economic optimum N rate) [47,50,52,53,54].
The recently formulated ‘farm to fork’ strategy assumes a reduction of nutrient losses from agriculture in the EU by at least 50% by 2030, which should lead to a reduction in the amount of fertilizers used by at least 20% [55,56]. The set goal should be achieved while maintaining soil fertility. It is likely that the reduction targets will vary between countries, as the doses of fertilizers used in each country are different in size and adjusted to the crops produced, production methods, climatic zones, and soil conditions. Due to the implementation of the strategy, the interest of farmers and advisors in the practical application of the NUE and Ns indicators will probably increase.
Objectives of the study were to (i) investigate grain yield, nitrogen uptake, nitrogen use efficiency, nitrogen surplus and yield-scaled nitrogen surplus, nitrous oxide, and ammonia responses to nitrogen input, (ii) estimate the optimum nitrogen input rate and optimum yield-scaled nitrogen losses, (iii) compare N indices from experimental fields and farm fields. The research hypothesis assumed that by applying an appropriate nitrogen dose, it would be possible to reduce nitrogen losses on light soils without deteriorating their fertility and simultaneously maintain yields of winter wheat.

2. Materials and Methods

2.1. Study Site and Experimental Design

The long-term field experiments in the split-plot layout were carried out between 2003 and 2018 at the Experimental Stations of the Institute of Soil Science and Plant Cultivation in Grabów (21°39′ E, 51°21′ N) and Baborówko (16°37′ E, 52°37′ N), Poland. Experimental Stations are located in the cold temperate dry and cold temperate moist climate zones, in which potential evapotranspiration normally exceeds rainfall during the whole vegetation period. Average annual rainfall in Baborówko was 517 mm and in Grabów 621 mm in the period of investigations. In Experimental Station Grabów, the soil under the experiment was a heterogeneous, sandy loam, (WRB: Stagnic Luvisols). In Baborówko, the experiment was located partly on a sandy loam (WRB: Albic Luvisol) and partly on black soil (WRB Gleyic Phaeozem). In Grabów, the soil was characterized as slightly acidic (pHKCl 6.2) (according to the classification of soil reaction used in Poland, based on the measurement of pH in 1 M KCl 1:5 soil solution), with medium content of available potassium (88.8 mg ·kg−1 soil), determined by Egner-Riehm DL method with UV–Vis spectrophotometry (Nicolet Evolution 300), and high content of available magnesium, determine according to the Schachtschabel method with F-AAS spectroscopy (Varian Spectra AA-240 FS). In Baborówko, the soil reaction was neutral (pHKCl 6.8), the content of potassium was high (116 mg K·kg−1 soil), and the concentration of magnesium very high (54 mg ·kg−1 soil). The detailed characteristics of soil chemical properties, soil management in the field experiment, meteorological data in the years of investigations, and the source data were presented in Supplementary Materials.
Winter wheat (Triticum aestivum L.) grown under rainfed conditions in crop rotation maize–spring barley–winter oilseed rape–winter wheat and was fertilized with nitrogen in the doses of 40, 80, 120, 160, and 200 kg N·ha−1 each year as ammonium nitrate against the background of the recommended doses of P, K, Mg, and Ca. During the experiment, no manure was applied, no leguminous plants were grown, and straw was removed from the field. The first dose of 40 kg N·ha−1·y−1 was applied at the beginning of the spring vegetation, and the successive N doses were carried out at two-week intervals. All N doses were used by spreading.
Experiments are assumed to represent average farm practices in the agricultural fields on light soils in Poland.

2.2. Measurements and Determinations

Crop Sampling

The grain and straw yields of wheat were harvested by plot harvester from an area of 17.9 m2. The grain yields were determined at a moisture level of 15%. The samples of grain and straw were collected at full maturity from an area of 1 m2 and analyzed for total N as determined by mineralization of the sample using the Kjeldahl method with Continuous Flow Analysis (CFA). The uptake of N in grain and straw was calculated from the percentage of N in the yields each year.

2.3. Data and Statistical Analysis

The dataset used in the considerations covers 32 site-years (n = 320 treatments). The grain yield (Yd) response to N rates in synthetic fertilizer treatments plus site specific atmospheric N depositions (F) was adjusted using the linear-plateau model [57] for the entire dataset (Equation (1)):
If F < C; Yd = a + b × F
If F ≥ C; Yd = Ymax = a + b × C
where Yd is the grain yield (Mg·ha−1); F is the N rate (kg N·ha−1); a (intercept, Mg·ha−1) is the yield at 0 kg N·ha−1; b (Mg·kg−1 N) is the increase in yield per unit increase in F; and C (kg N·ha−1) is the critical N rate or minimum N rate at which the maximum yield (Ymax) is obtained. The same model was used to estimate gross margin response to N rates. Yd data combined with 5-year mean grain price and cost data (variable costs: seed, N fertilizers, sprays) were used to calculate gross margin, expressed in EUR·ha−1.
Following the method proposed by the EU Nitrogen Expert Panel, N use efficiency (NUE), and nitrogen surplus (Ns) were calculated [17]. According to the approach, NUE calculations based on N input and N output at different levels provide information about resource use efficiency, the economy of food production (N in harvested yield), and the pressure on the environment (N surplus). The desired value of NUE, N uptake (Yn), and N surplus (Ns) should be in the range: NUE 50–90%, Yn >80 kg N·ha−1, and Ns < 80 kg N·ha−1 [17]. These values need further underpinning [24,33,58].
Nitrogen use efficiency (%) was calculated according to the formula [17]:
NUE = Yn F * 100
where Yn is total N uptake by the crop (kg·ha−1); F is N fertilizer rate plus N deposition (kg·ha−1).
N surplus (Ns, kg·ha−1) was calculated according to the formula [17]:
Ns = F − Yn
The net value of this indicator was used in the following considerations. It was calculated by subtracting NH3 and N2O gas losses from Ns.
Direct and indirect N2O emissions from soil (N2O-N kg·ha−1) were calculated according to the IPCC tier 1 methodology using BIOGRACE spreadsheet [59]. F and the amount of nitrogen remaining in the soil with belowground biomass were taken into account. The emission of ammonia (NH3 kg·ha−1) from ammonium nitrate was estimated assuming the emission factor of 16 g NH3 per 1 kg of applied fertilizer [60]. NH3 emissions were converted into NH3-N kg·ha−1.
Yield-scaled net Ns, N2O, and NH3 were calculated by dividing these N losses by Yd and expressed in kg N·Mg−1.
Descriptive statistics for the variables under consideration (median (Me), median absolute deviation (MAD), relative MAD ((MAD/Me) * 100)) were estimated. The regression relationships between NUE, Ns, yield-scaled Ns, N2O, NH3, and N doses were estimated. The analyses were processed over 32 site-years data. Only statistically significant and best-fitted regressions were accepted for further interpretation (p ≤ 0.05). The corrected R2-values were used for model selection in addition to standard error of estimate and mean absolute error. All statistical calculations were performed with Statgraphics Centurion 16 Package (Statgraphics Centurion, Rockville, MD, USA) [61].
The optimization with the assumption of NUE and N rate targets for Yd, NUE, yield-scaled Ns, N2O, NH3, and GM in the range of F from 90 to 173 kg N·ha−1 were carried out with the use of a genetic algorithm due to the curvilinearity of the relationship between the tested N data and F. Negative Ns values were set as values equal to 0. The optimization was carried out using the Evolver program [62]. The following parameters were adopted in the calculations: solving method—recipe; mutation rate—0.1; crossover rate—0.5; population size—50; optimization—random number seed; constraint type—hard; penalty function—100*(Exp(deviation/100) − 1)).

2.4. Data from Survey Research

Surveys were conducted in all NUTS-5 in Poland (652). In each NUTS-5, 2 farms with representative soils were selected. In 2008–2018, data were collected on, among others, the grain yield and the applied N fertilization. Grain yields and N doses for winter wheat grown on light soils were selected from the existing database. Thus, a set of 2300 yields and N doses were obtained. Yn were calculated for these data as crop yield multiplied by a crop N recovery coefficient, indicating how much N is retained in crop yield per unit (grain and straw). N2O emissions were estimated from the equation obtained for the experimental data: N2O-N (kg·ha−1) = 0.0424 + 0.0112*F + 0.0721*Yd, R2 = 98.1%. NH3 emissions (kg·ha−1) were calculated assuming that N was used as ammonium nitrate (the emission factor of 16 g NH3 per 1 kg of applied fertilizer) [60]. The gross margin (GM) was calculated from the equation obtained for the experimental data: GM (EUR·ha−1) = −204.205 + 158.320*Yd, R2 = 97.6%. Then, in accordance with the previously described methods (Section 2.3), N indices were calculated. Descriptive statistics (Me, MAD, relative MAD) for obtained N indices were calculated using Statgraphics Centurion 16 (Statgraphics Centurion, Rockville, MA, USA). Descriptive statistics were provided for data sets with NUE ≥ 90% and NUE < 90%.

3. Results

3.1. Descriptive Statistics for Experimental Data

The statistics for the entire dataset are presented in Table 1. Only Yd, GM, and Ns showed normal distribution. The other variables were characterized by significant departures from normality.
The variability in the presented data could have been caused not only by the differentiation of N doses, but also by abiotic stresses induced by differences in the timing and intensity of precipitation events, which could also affect N availability. It might also be due to cultivar differences, inefficient nutrient application, and pests and diseases. What draws attention in these data is the variability of Ns and yield-scaled Ns, which are two or one orders greater than in the case of the other variables.

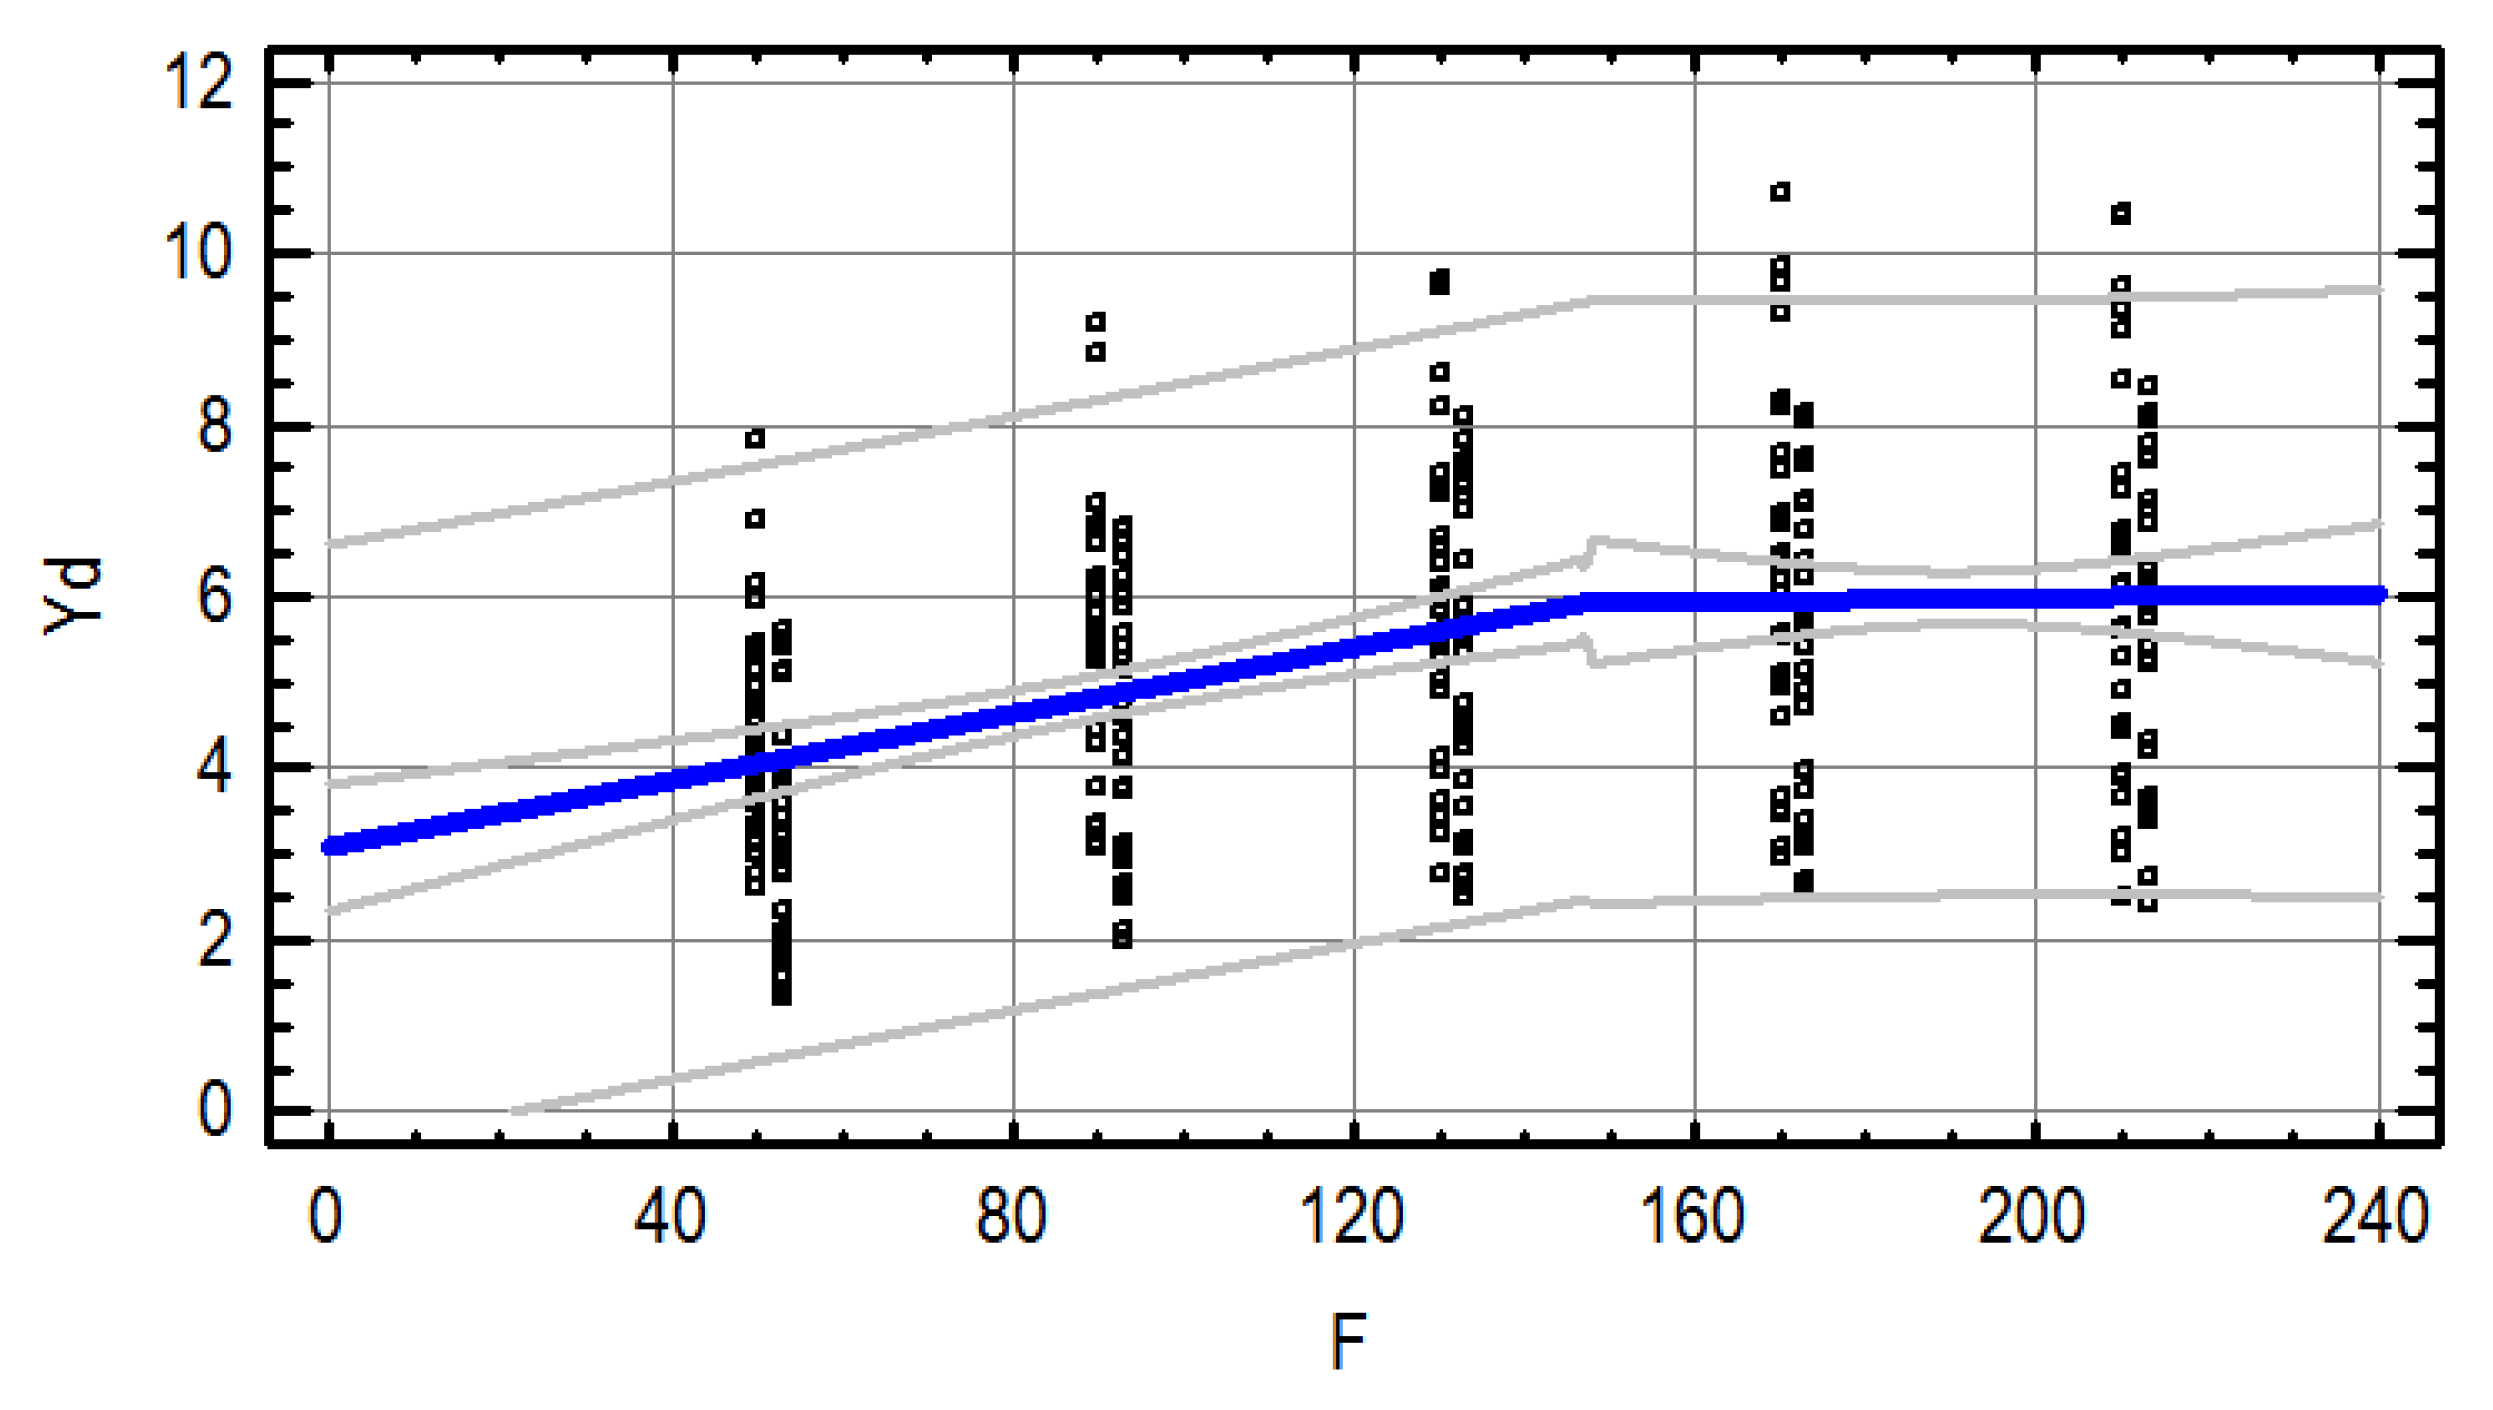
3.2. Effect of N Rate on Yield

Yd response to F was described by a linear-plus plateau regression (Figure 1). The critical N rate (C) was 149.4 kg·ha−1 and its standard error was 23.9 kg·ha−1. For this dose the Yd reached a maximum of 5.99 Mg·ha−1 and did not increase further with the increasing F. As can be seen, the observed Yd are highly scattered around the predicted curve, therefore, the coefficient of determination is relatively low (R2 = 15.3%) but statistically significant at the level p ≤ 0.01.

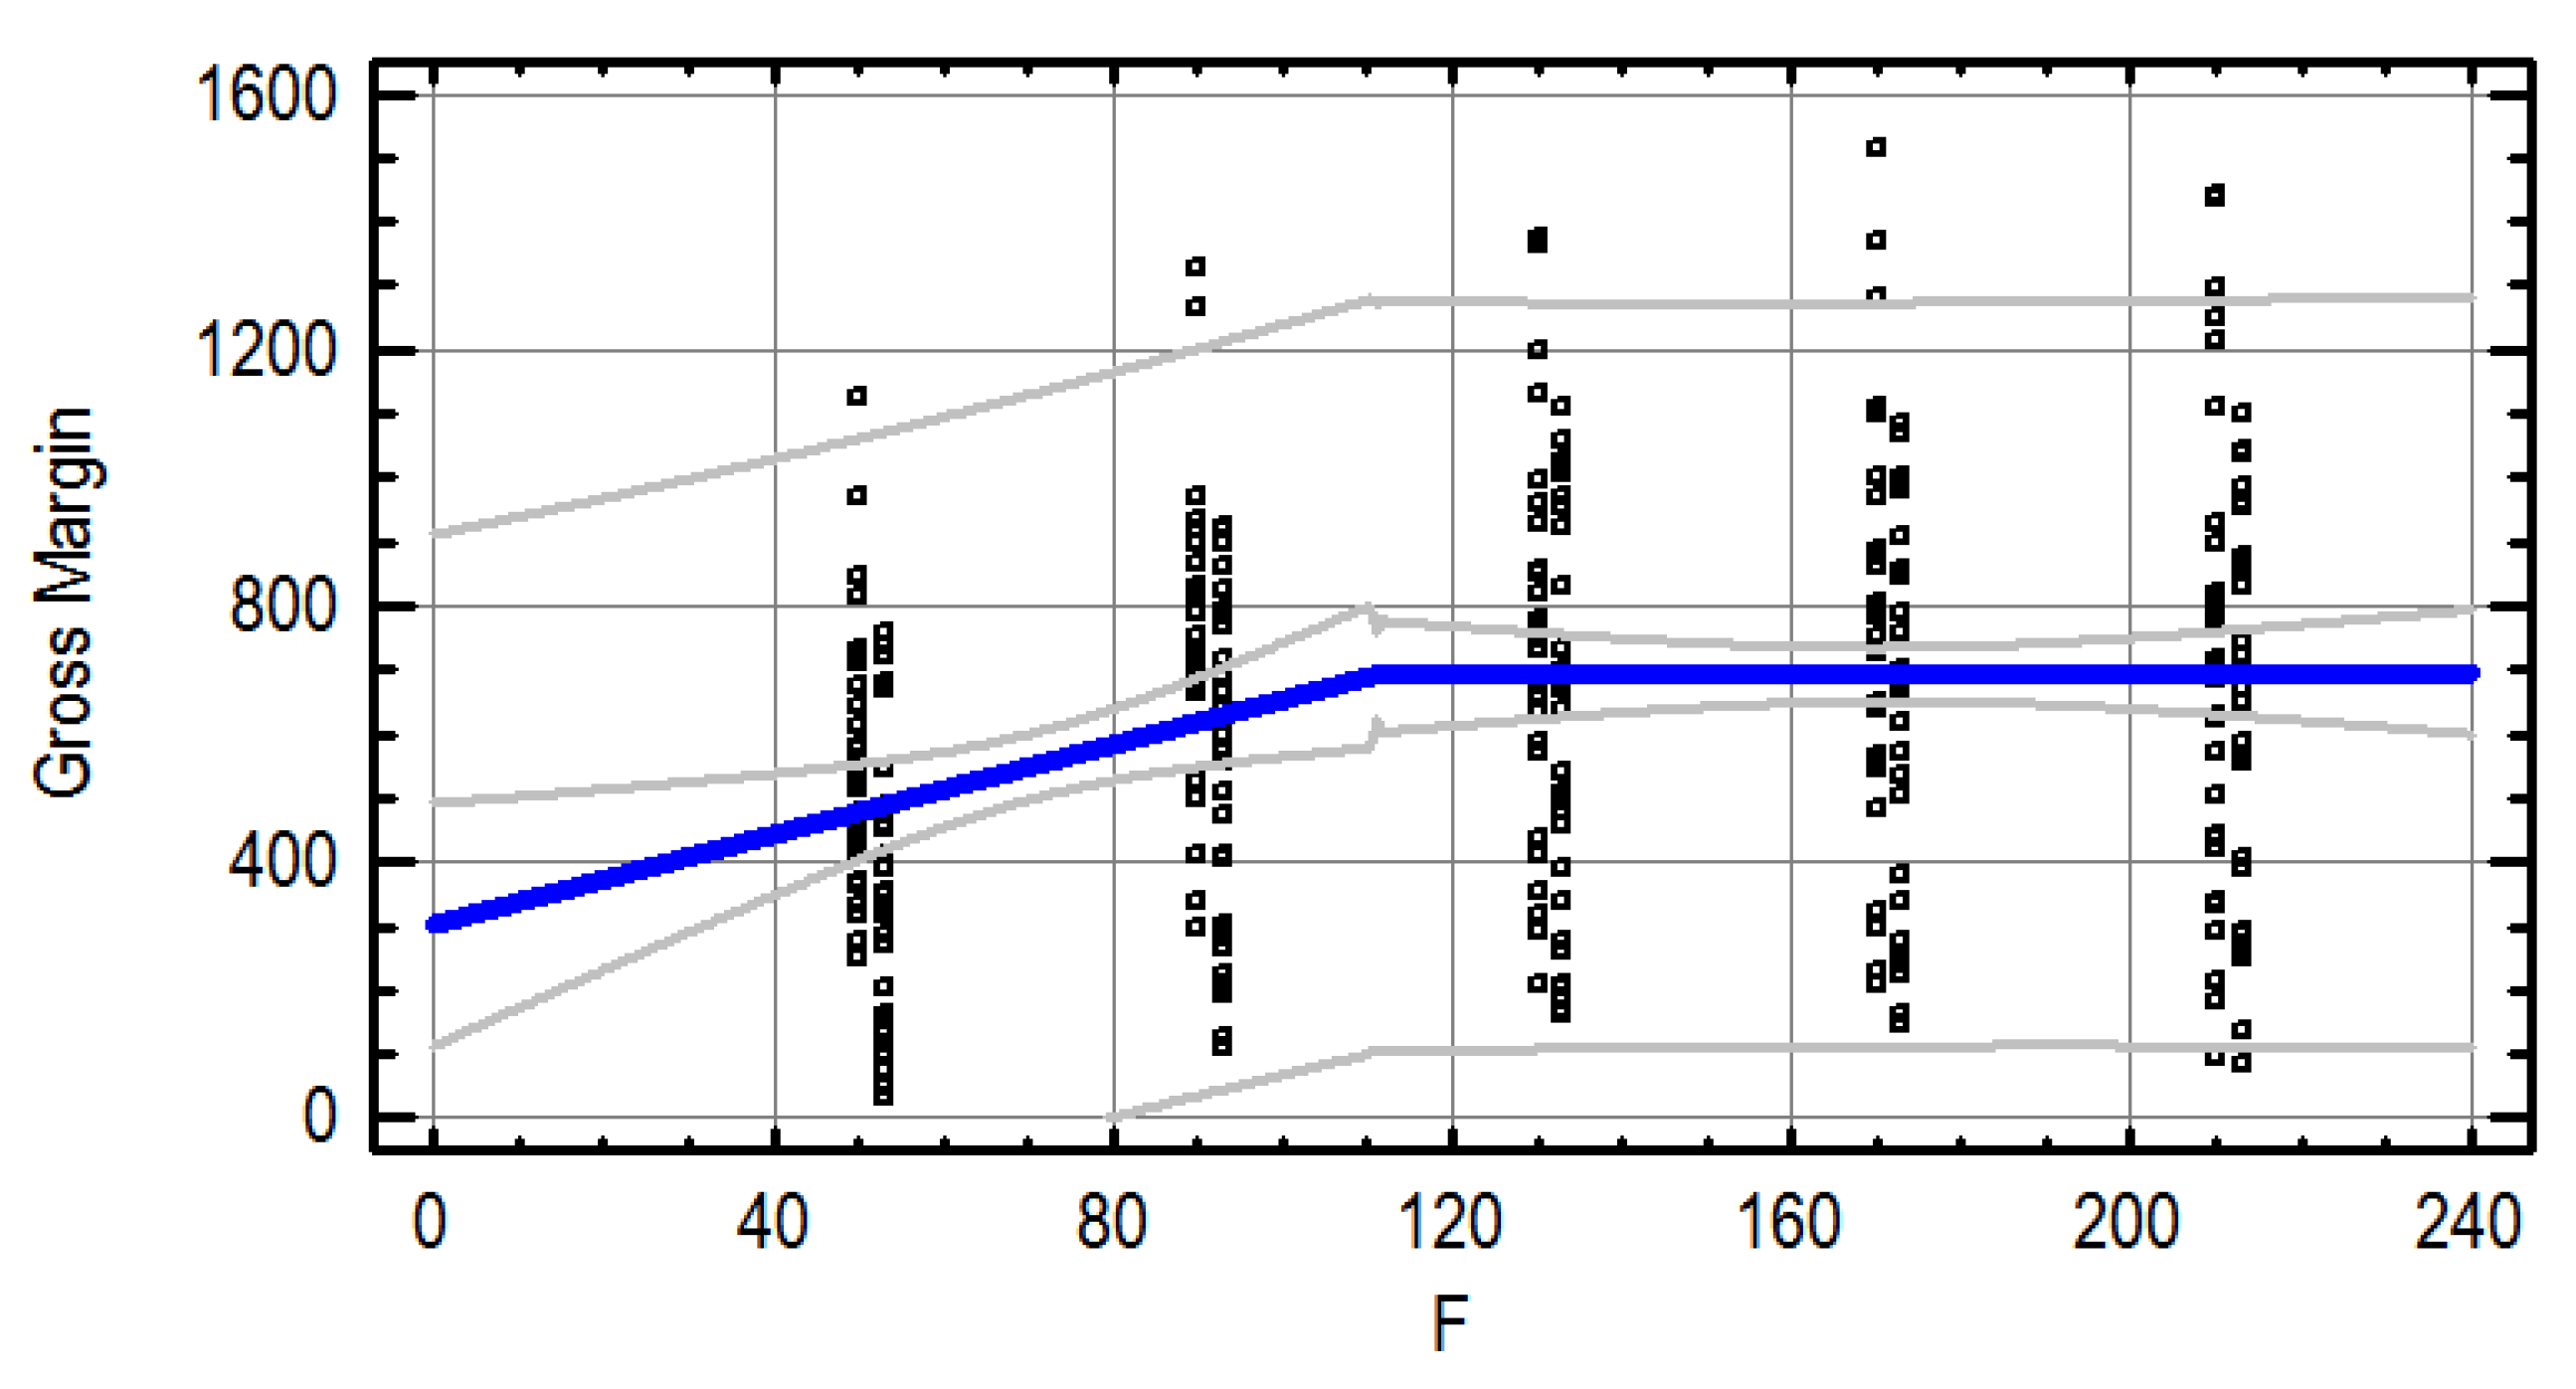
3.3. Effect of N Rate on Gross Margin

The maximum gross margin (GM) of 693 EUR·ha−1 was achieved at the critical dose of 111.9 ± 23.6 kg N·ha−1 (Figure 2). The coefficient of determination reached the value of 7.3% and was statistically significant (p ≤ 0.01).

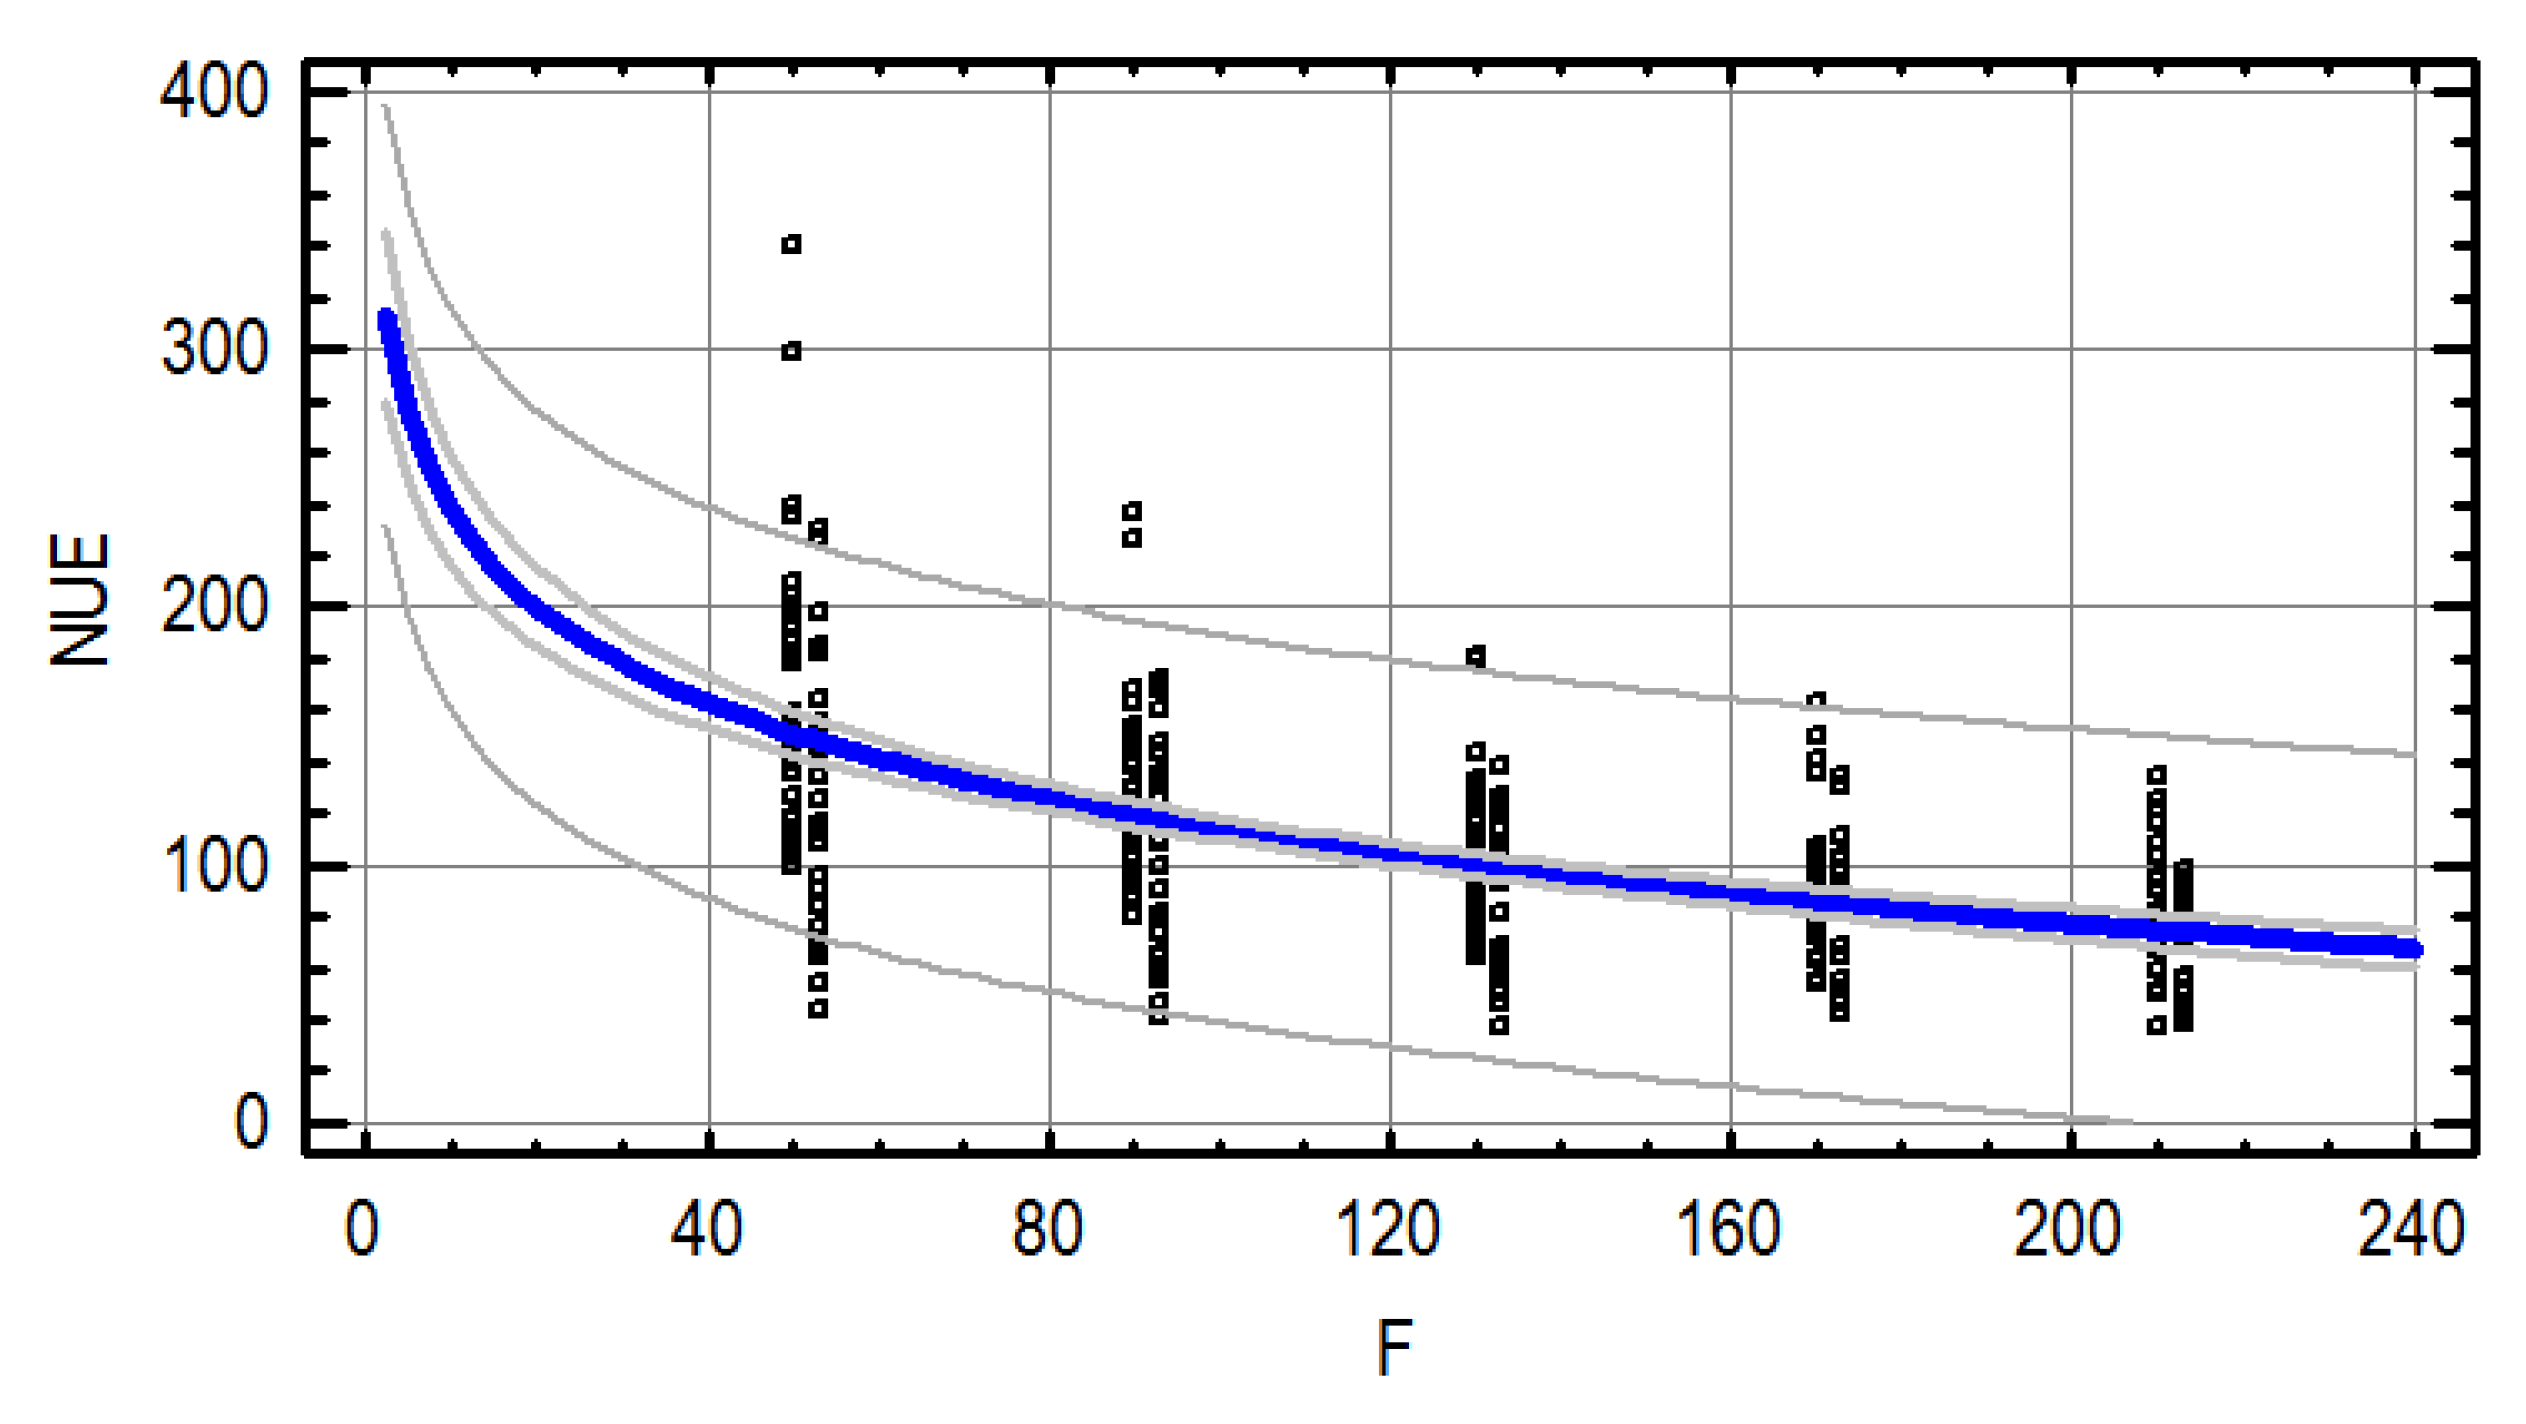
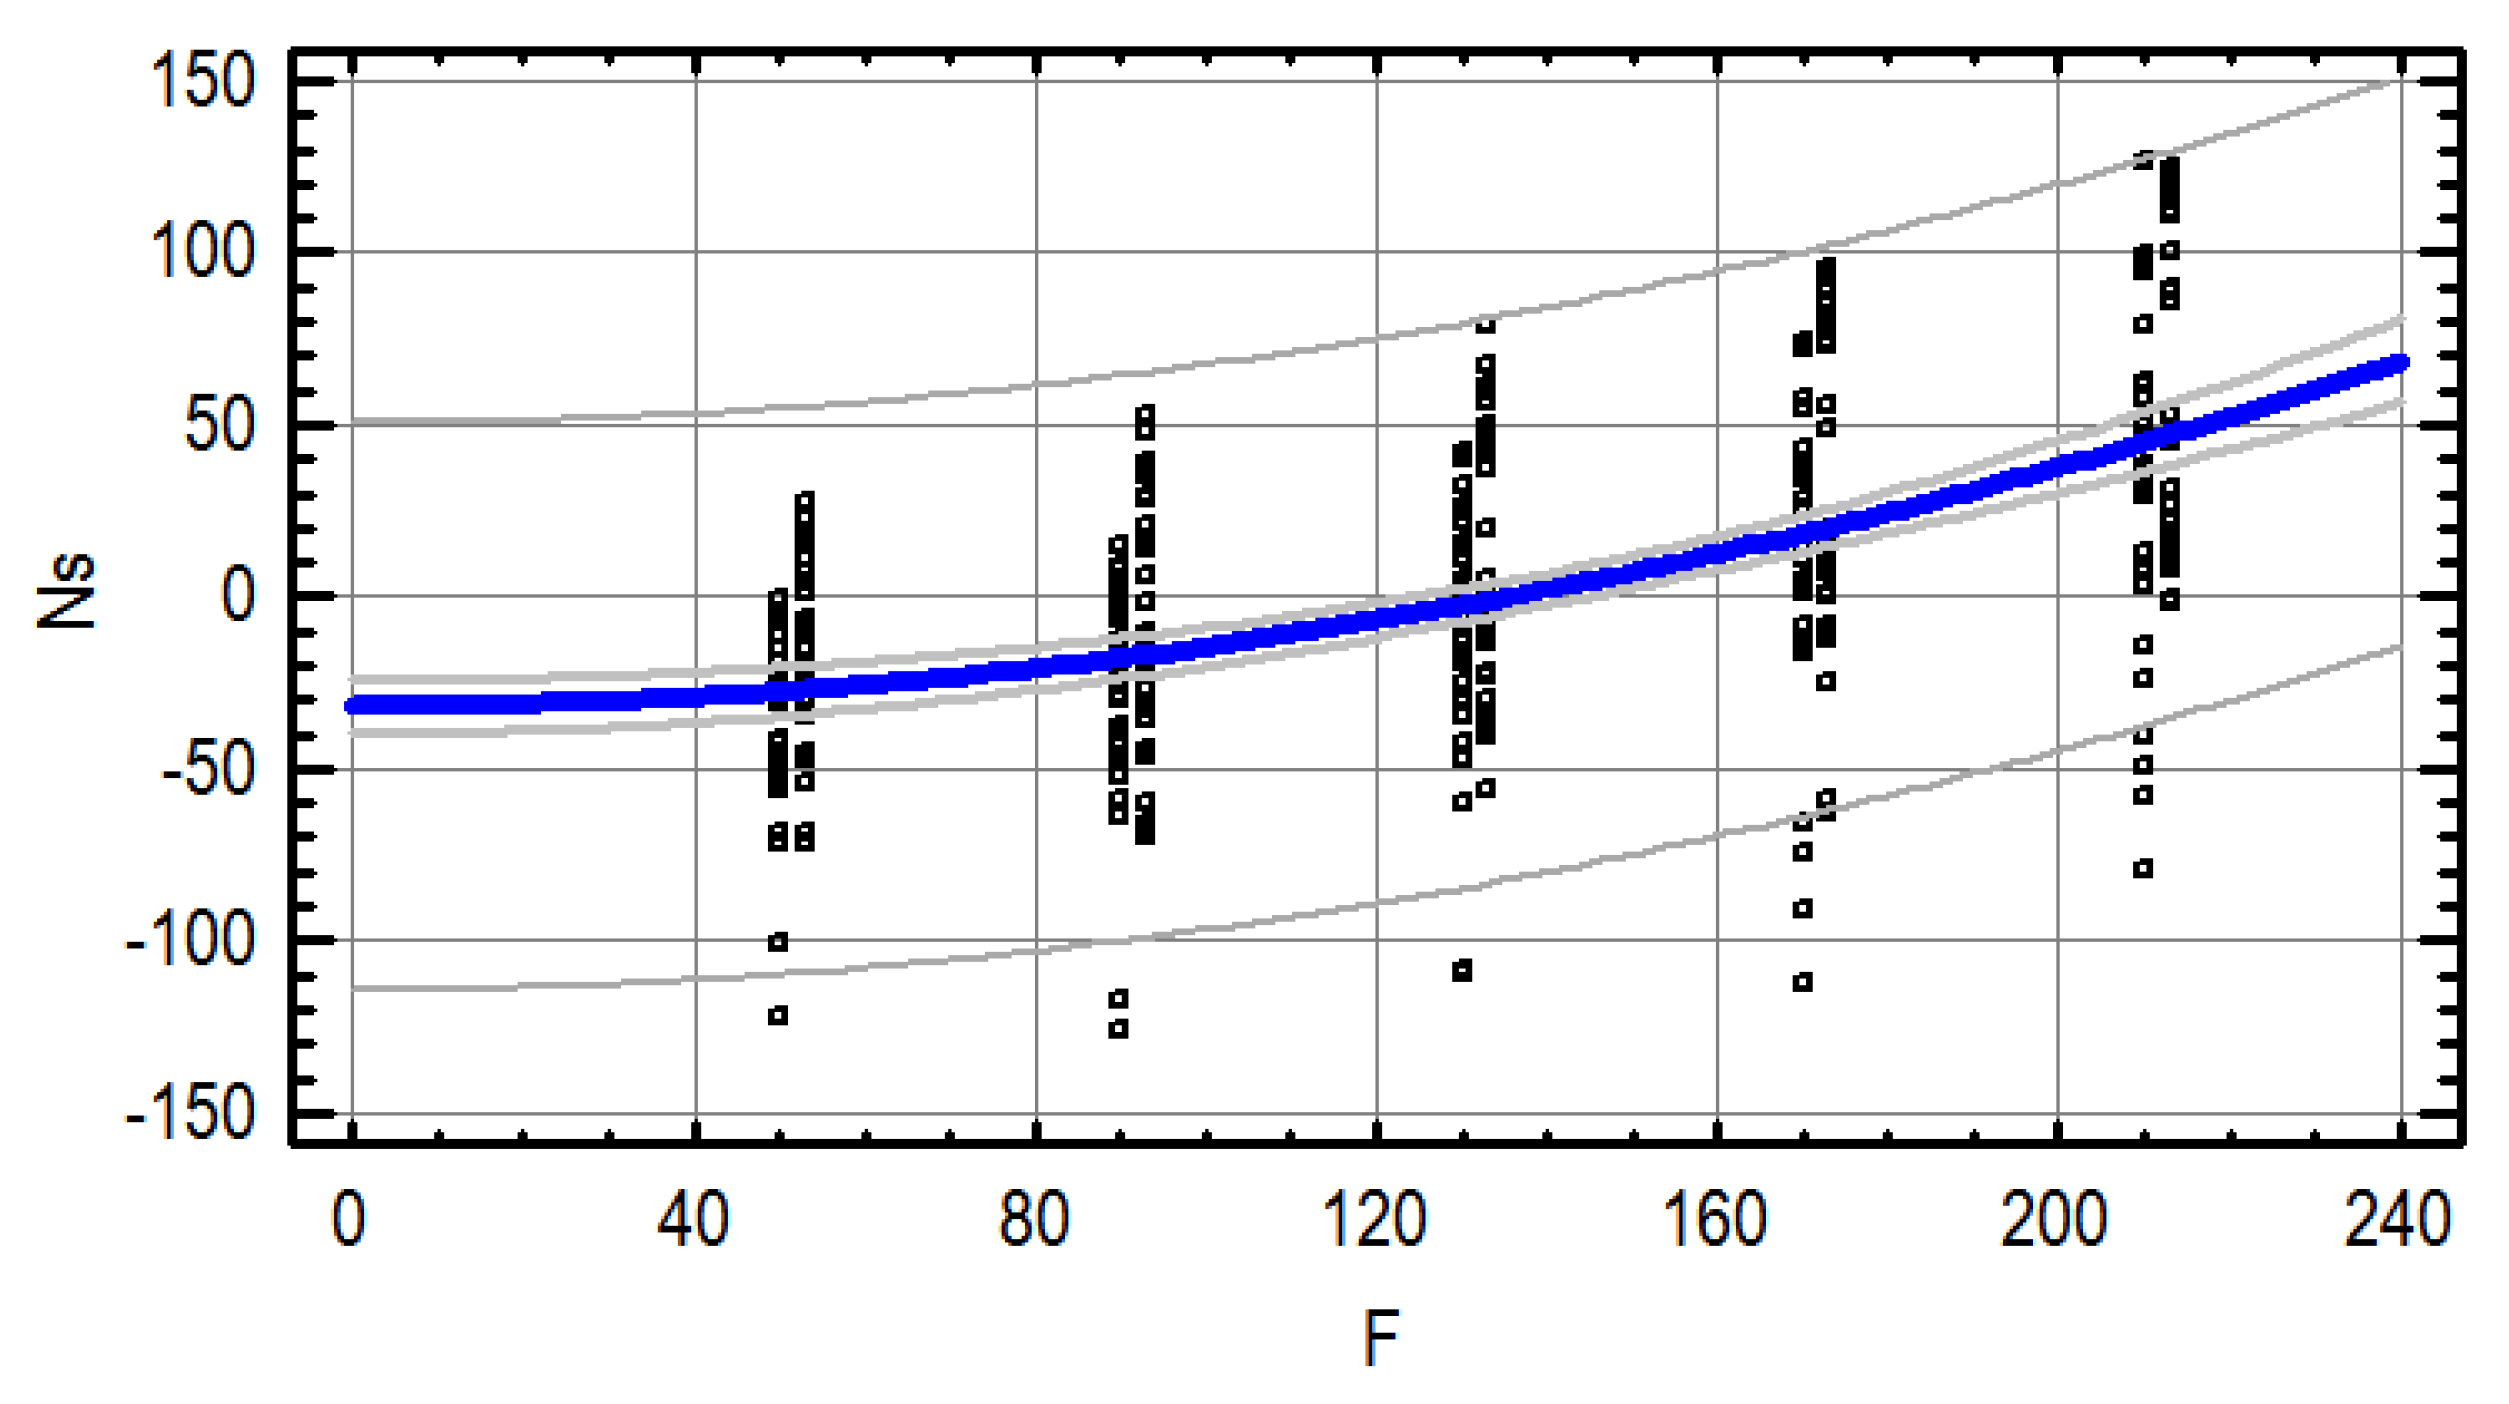
3.4. Effect of N Rates on NUE and Ns Values

The relationship between NUE and F was described by the logarithmic-X model (Figure 3). The regression equation took the form: NUE = 359.85 − 53.37*ln(F), R = 32.9% (p ≤ 0.01). The estimated NUE values for the critical doses of F 112 and 149 kg N·ha−1 were 108 and 93%, respectively. The observed NUE values were highly scattered around the estimated curve with smaller F and less scattered with larger F.
The relationship between net Ns and N doses was described by squared-X model: Ns = −31.91 + 0.00174*F2, R2 = 28.5% (Figure 4). The estimated Ns values for the critical doses of F 112 and 149 kg N·ha−1 were −10.1 and 6.8 kg N·ha−1, respectively. The curve is quite flat in the range of lower N doses and increases markedly in the range of high doses. The dispersion of the observed Ns values around the curve increases with the dose.

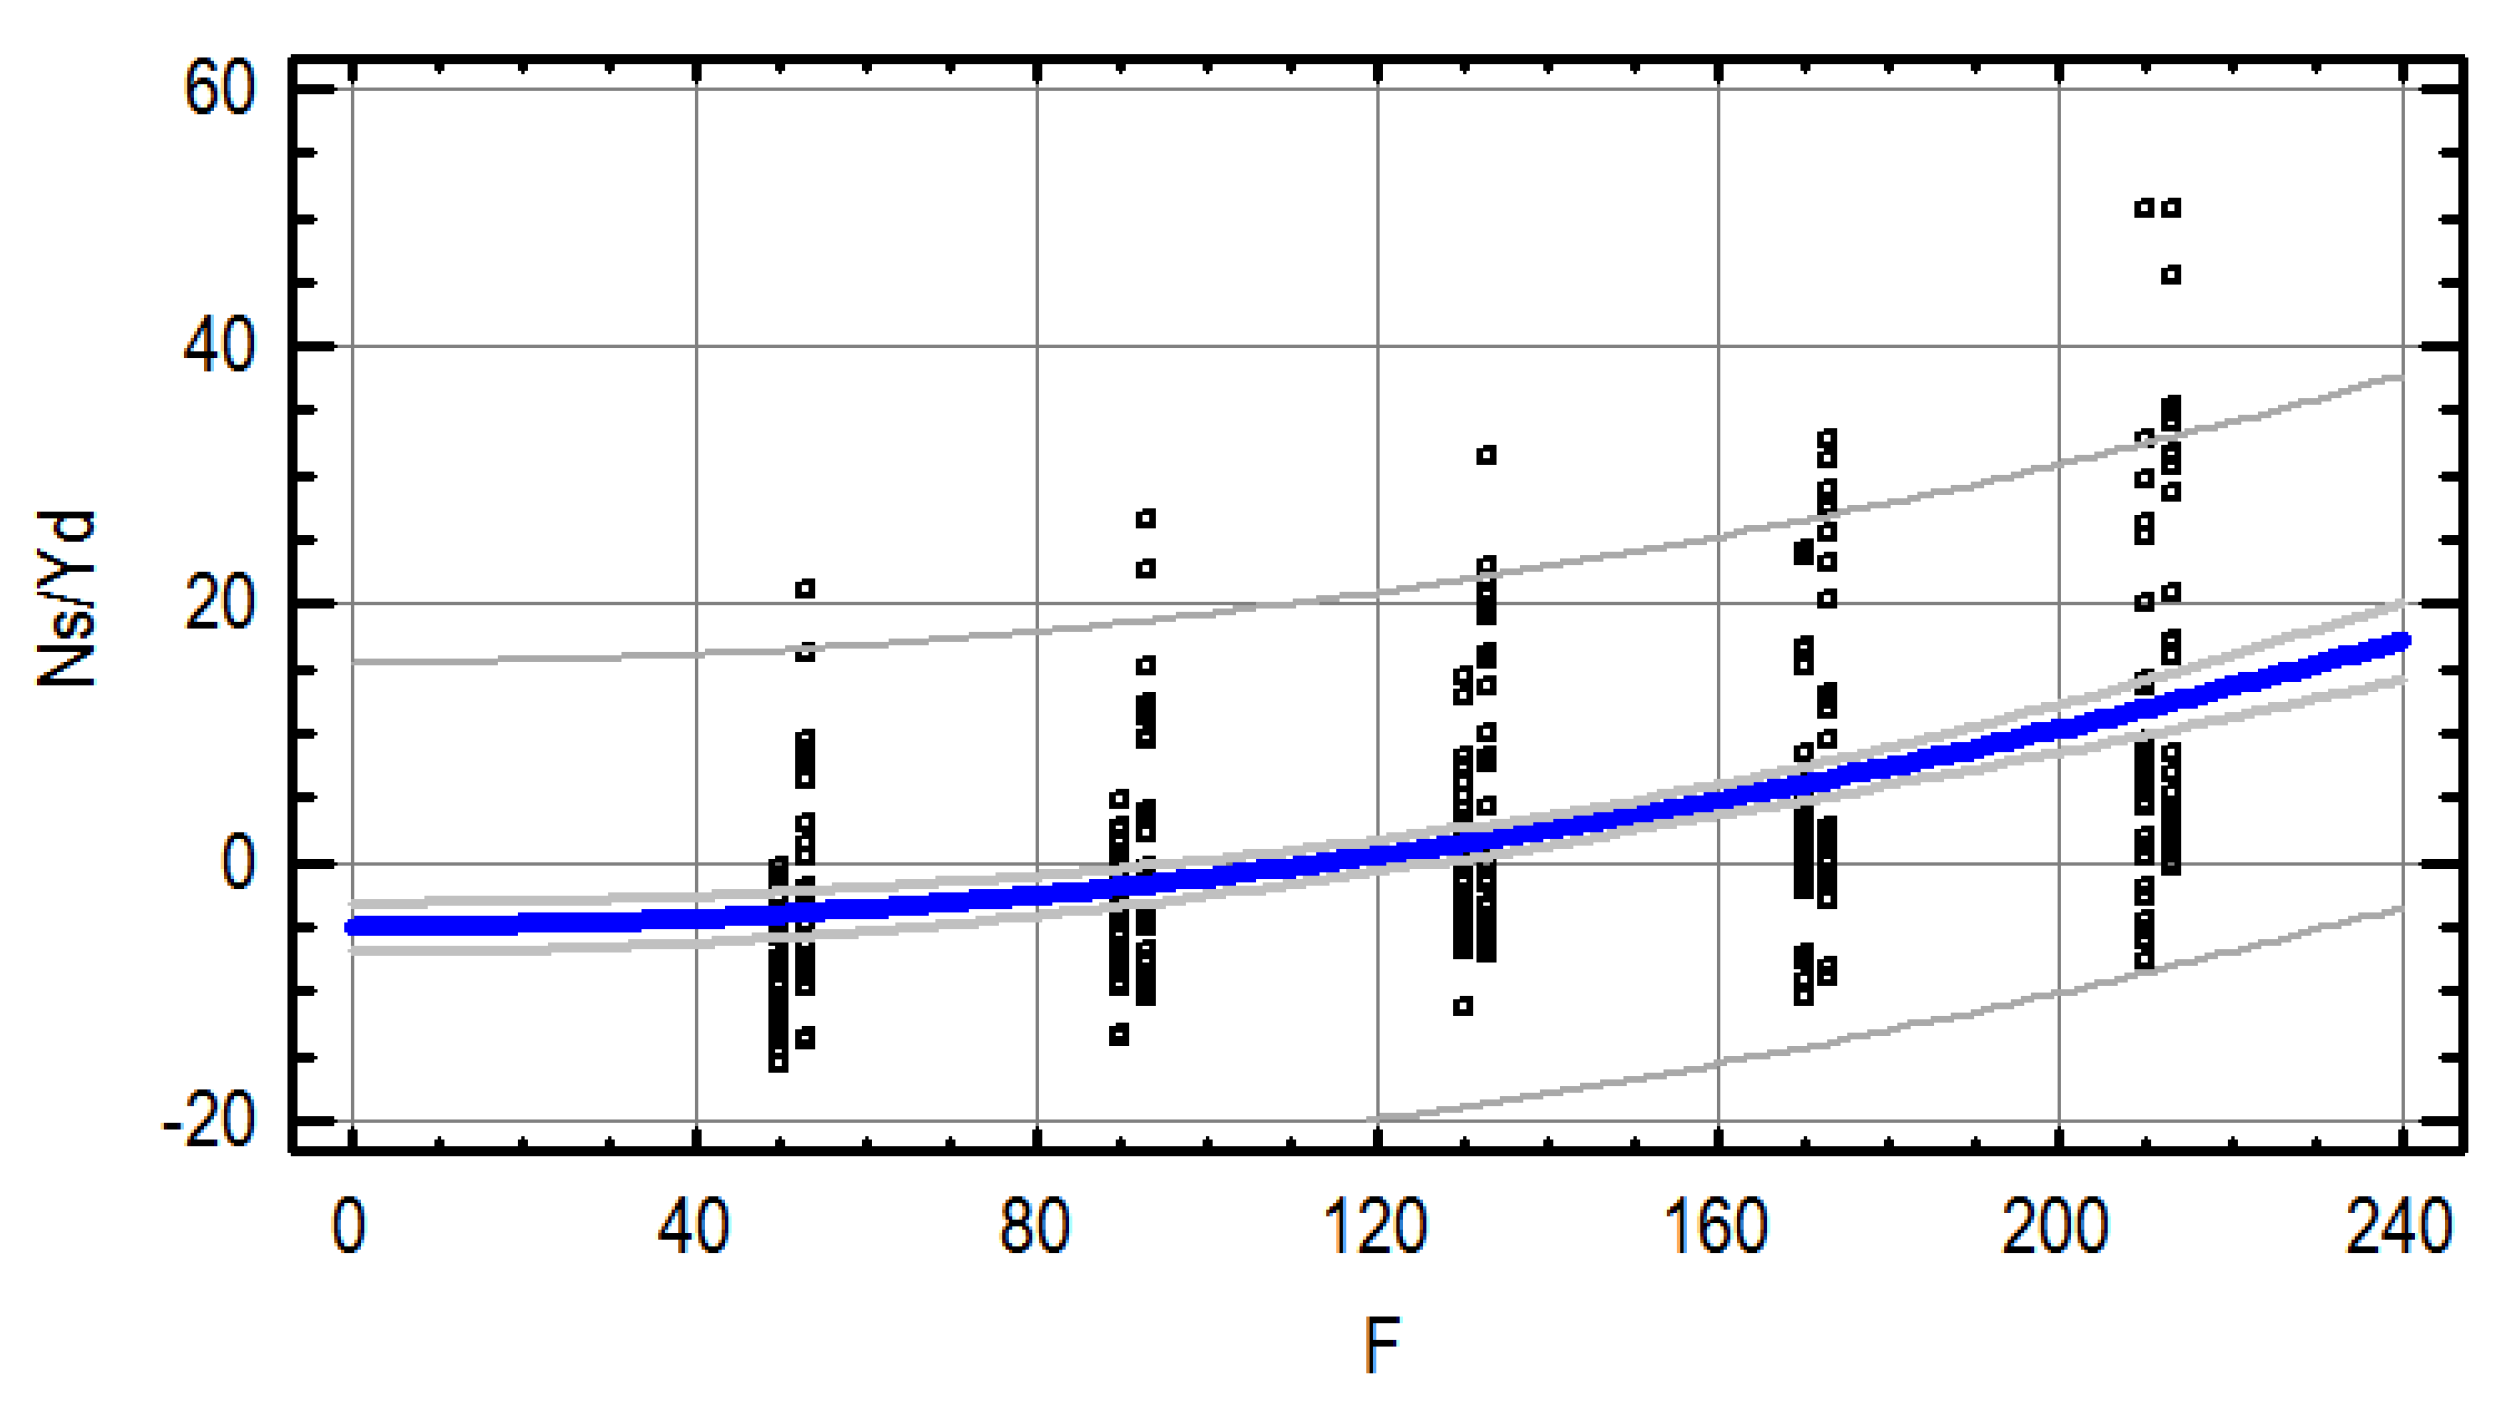
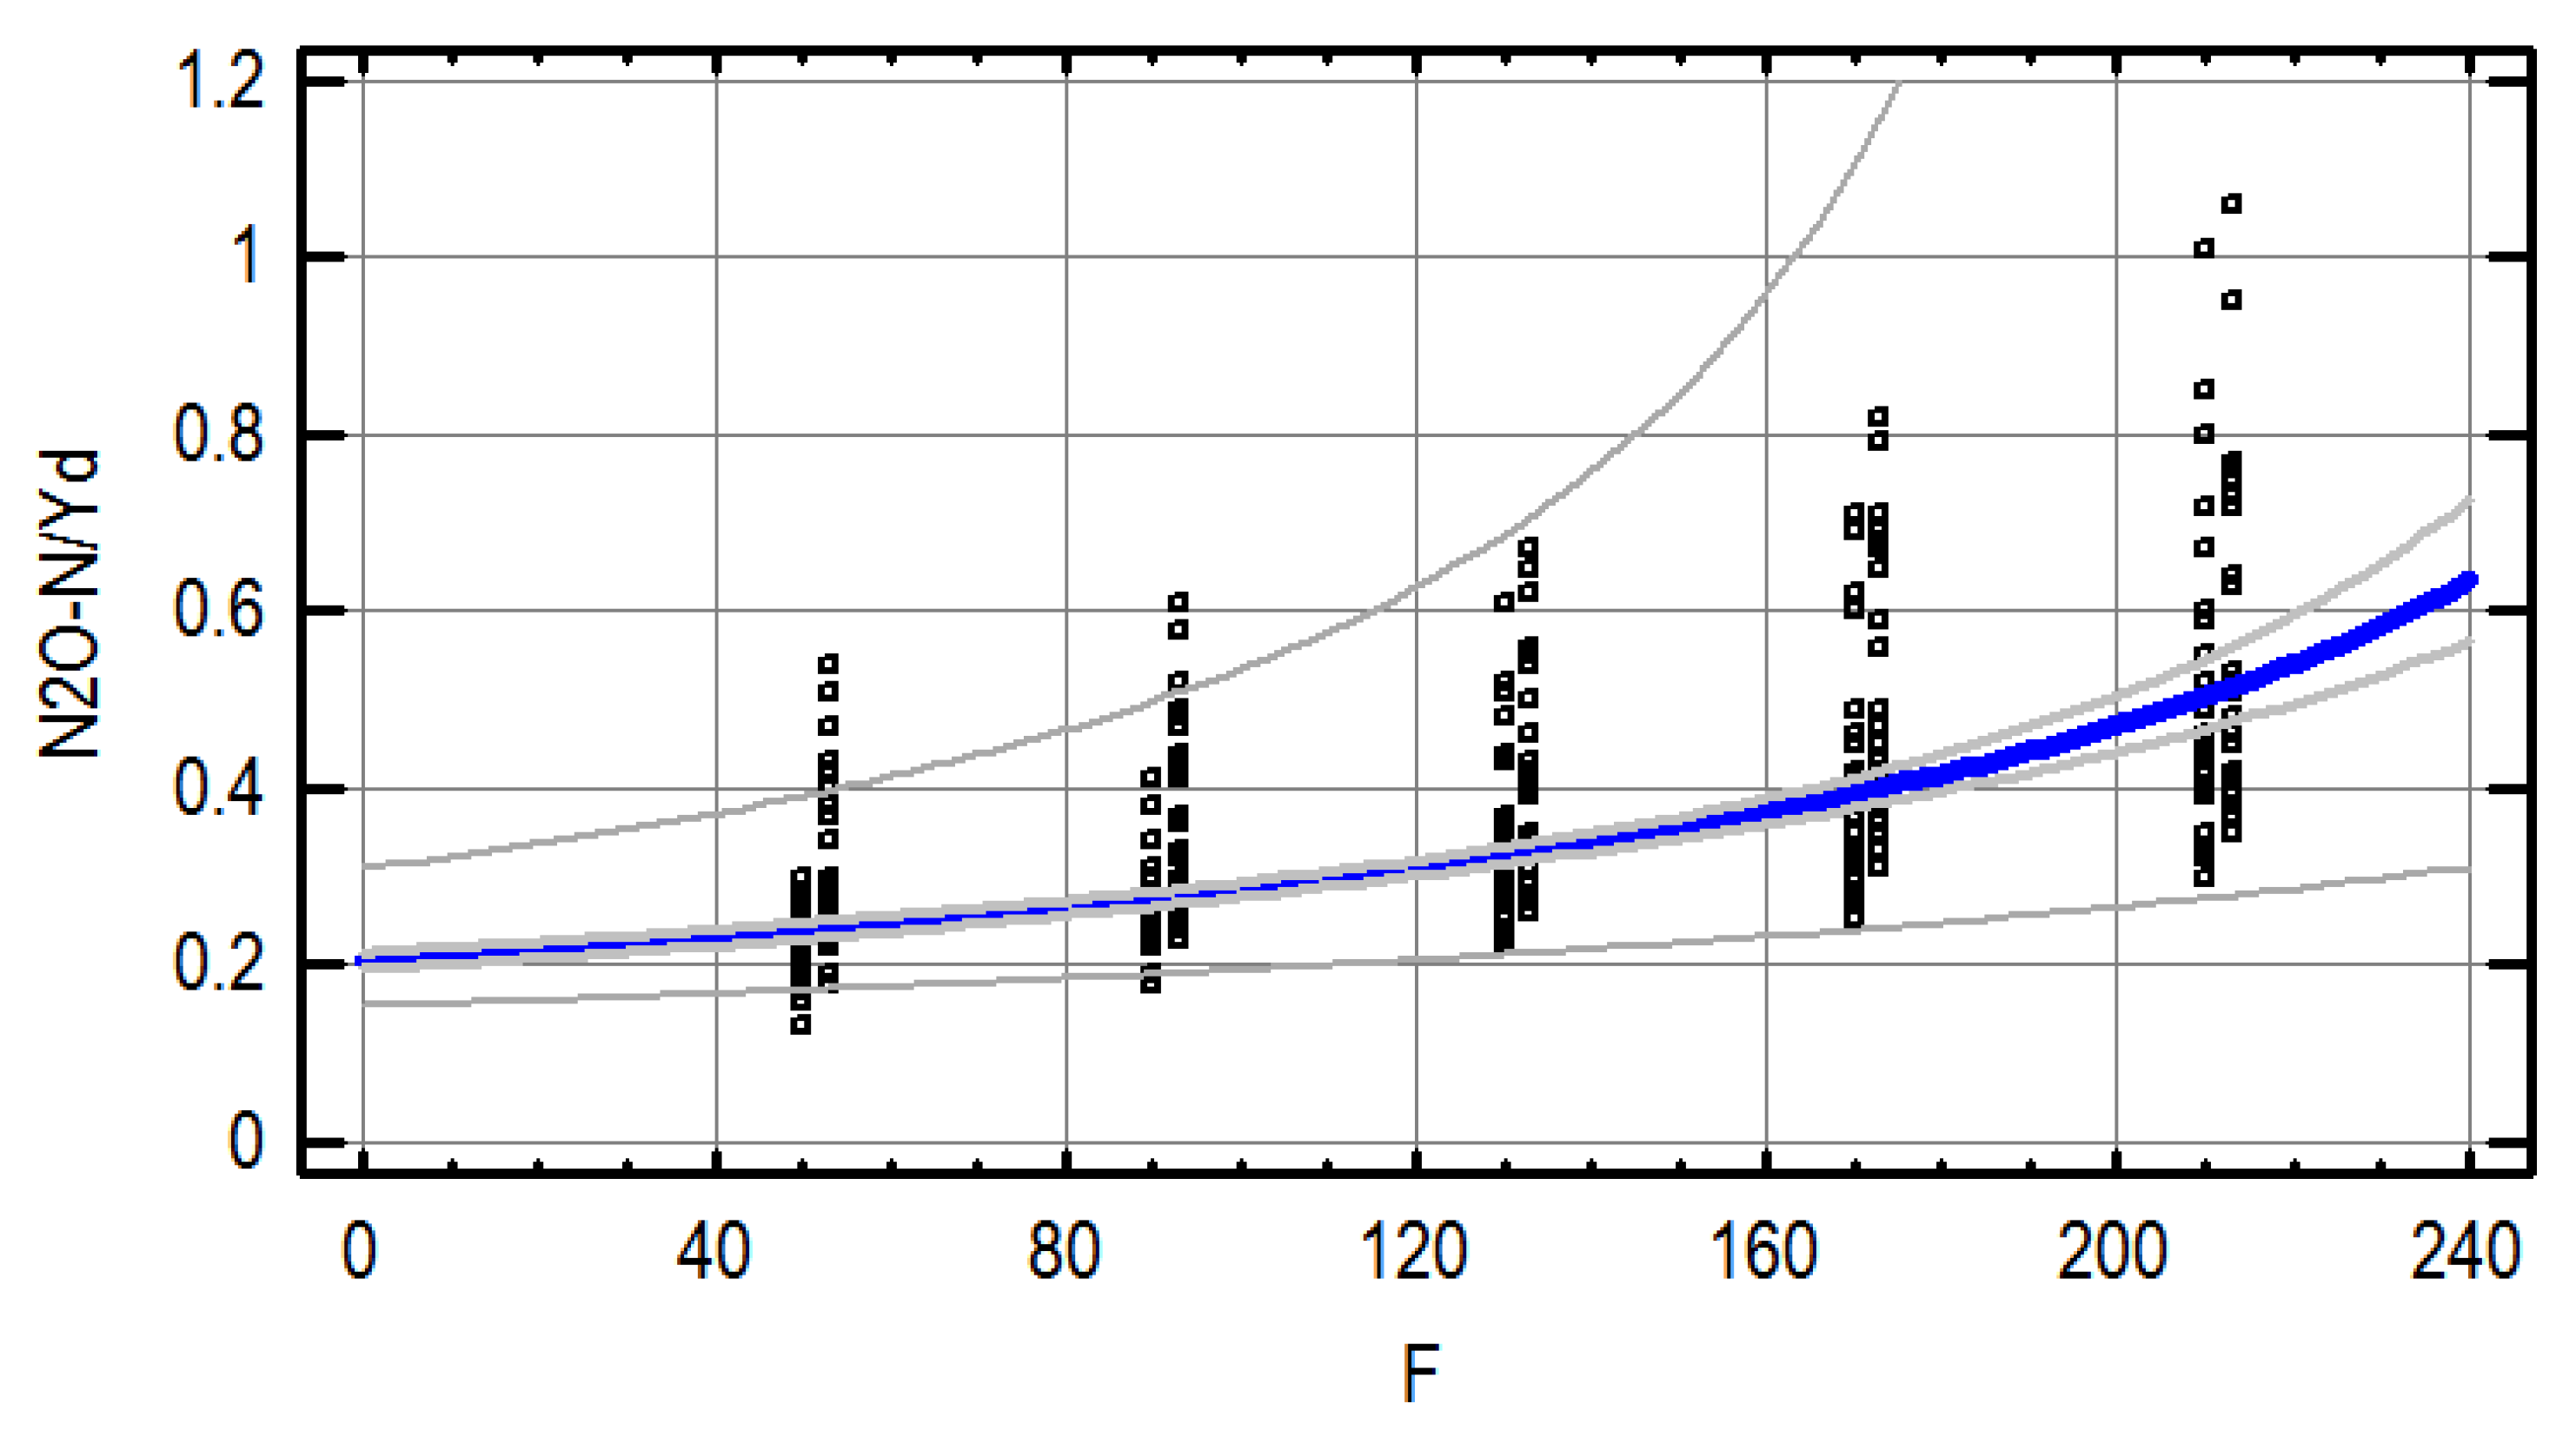
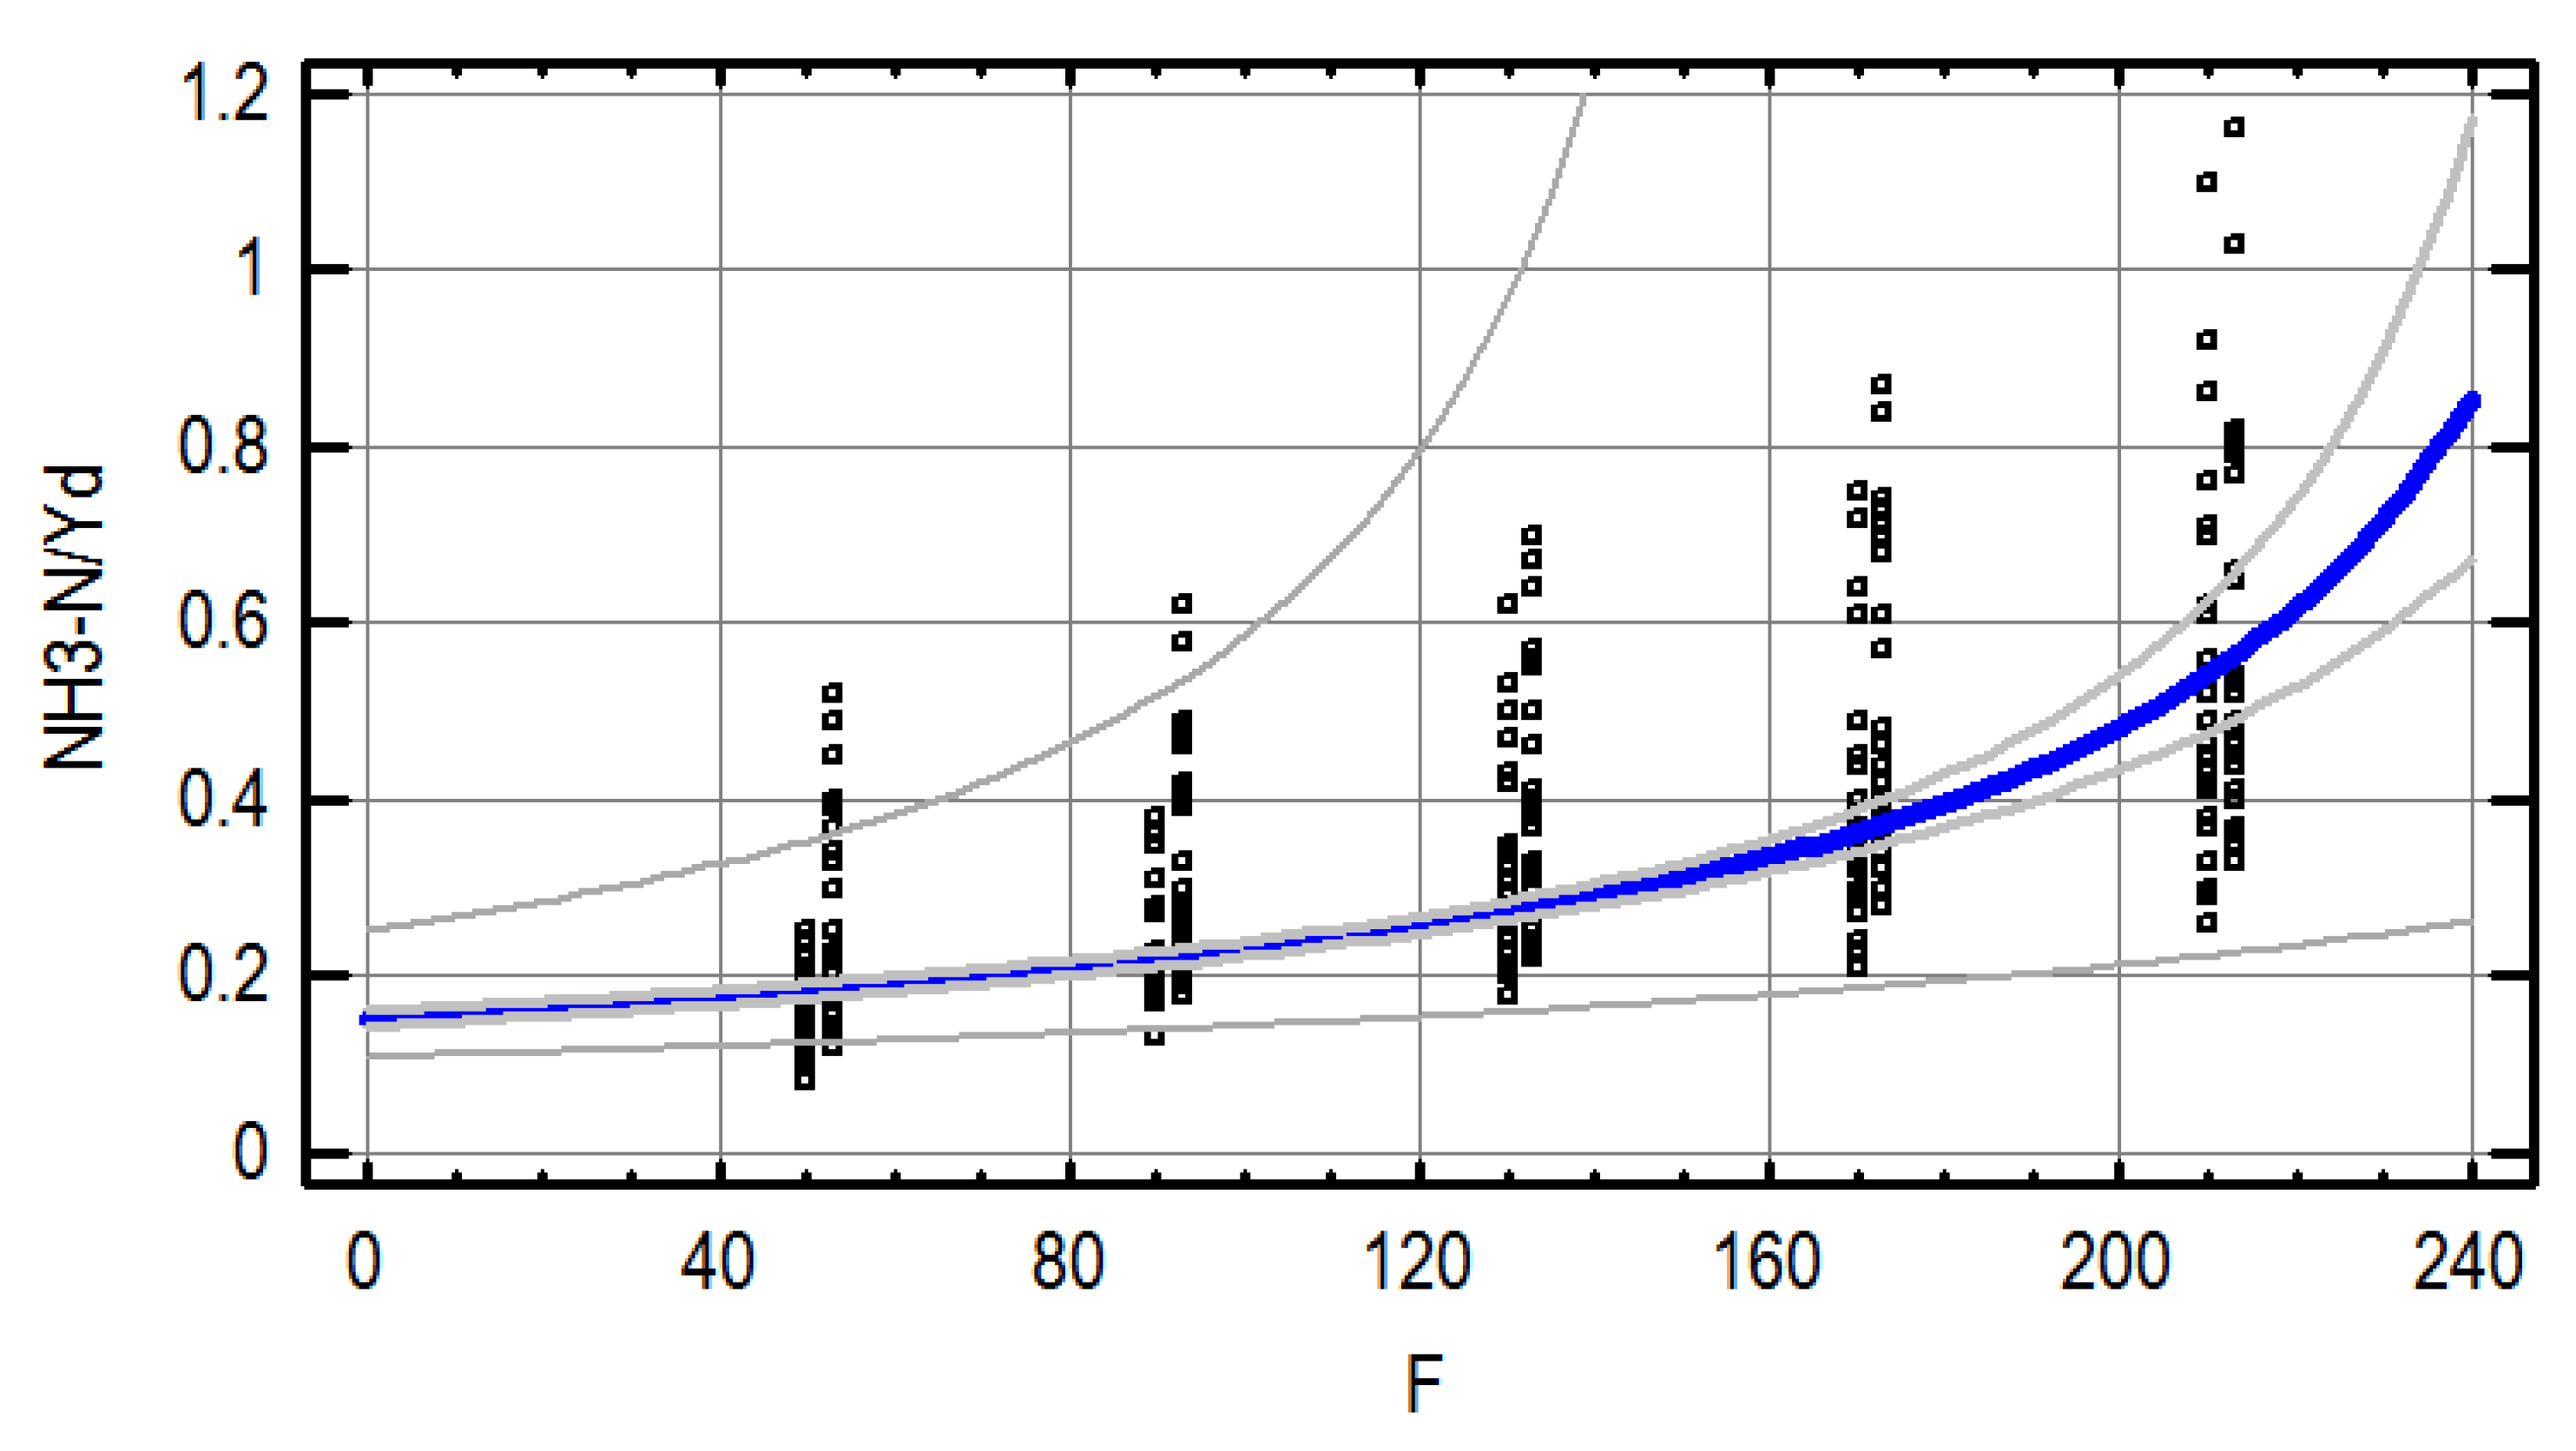
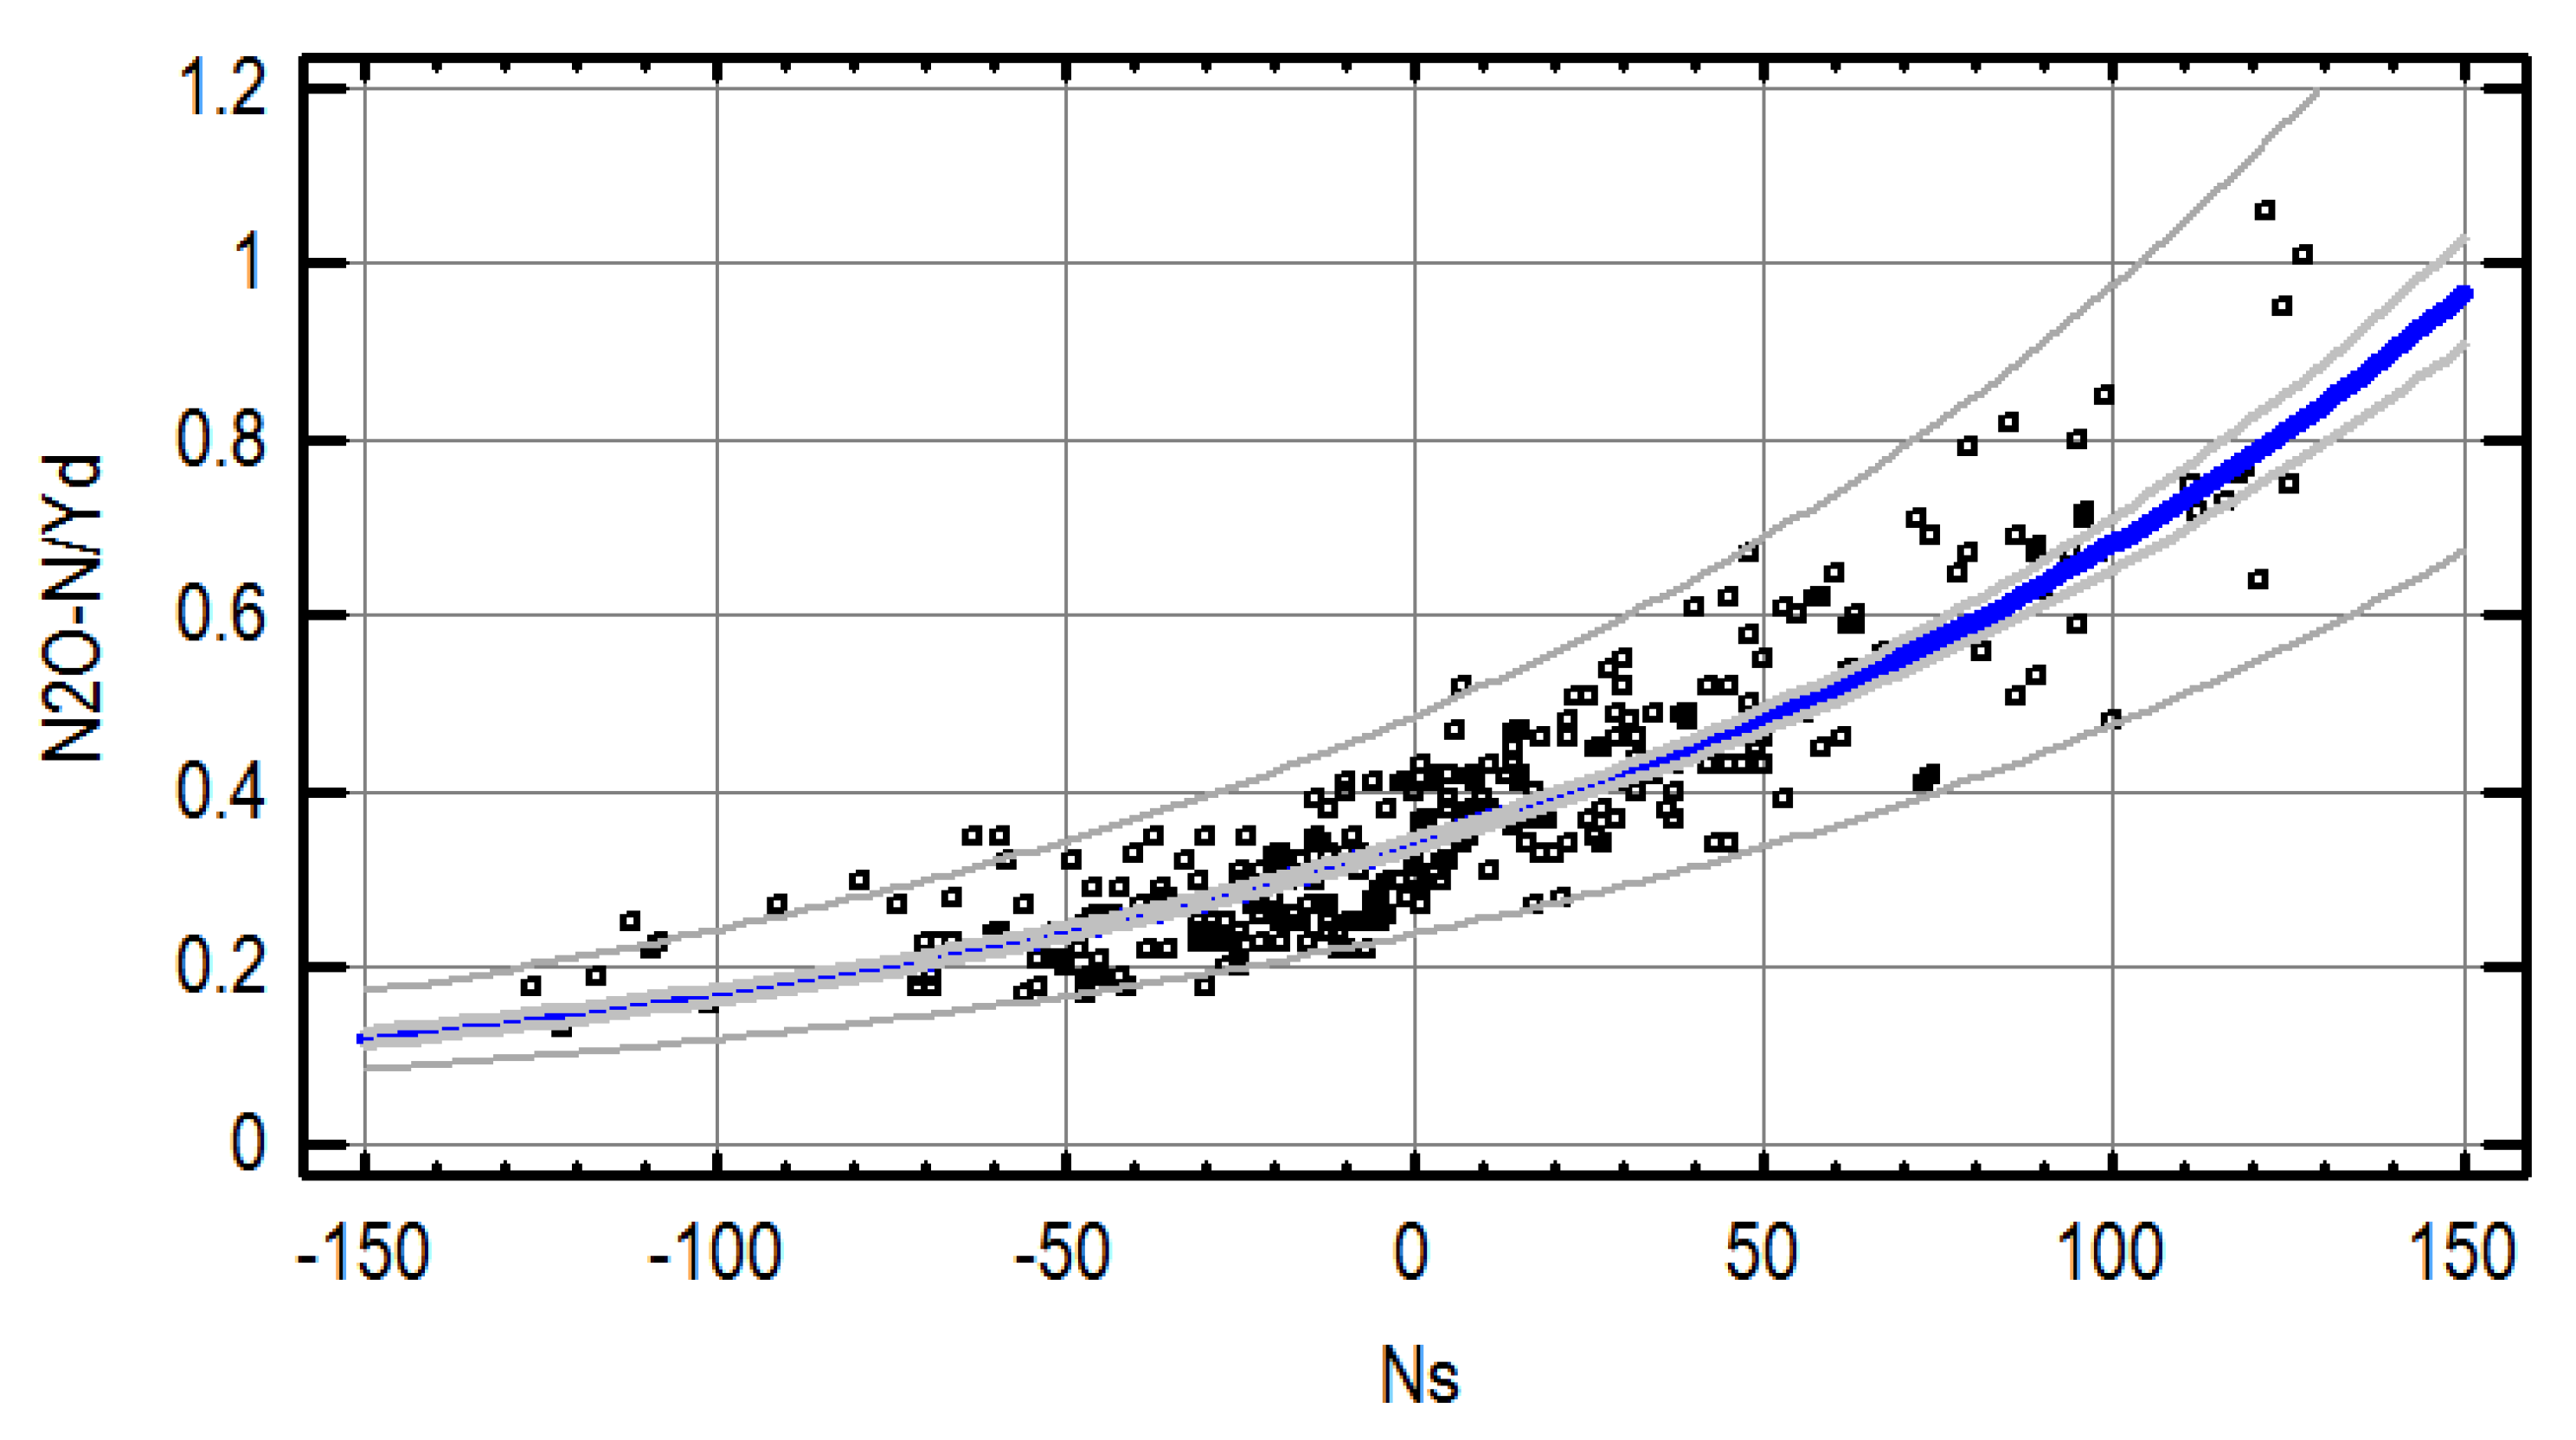
3.5. Effect of N Rates on Yield-Scaled N Losses

Yield-scaled Ns depending on the doses of N was described by squared-X model: Ns/Yd = −5.02 + 0.000385*F2, R2 = 24.1% (Figure 5). The estimated Ns values for the critical doses of F 112 and 149 kg N·ha−1 were −0.19 and 3.5 kg N·ha−1, respectively. The curve increases quite steeply after exceeding the dose of 112 kg N·ha−1. The scatter of Ns observed around the regression line increased with the N dose rise.
The relationship between N2O/Yd and N doses was described by the reciprocal-Y model: N2O/Yd = 1/(4.88 − 0.0138*F), R2 = 47.0% (Figure 6). The estimated N2O/Yd values for the critical doses of F 112 and 149 kg N·ha−1 were 0.30 and 0.35 kg N·ha−1, respectively. The curve increases steeply at higher N doses. At these doses, the spread of Ns/Yd around the regression curve also increased.
The regression between NH3/Yd and N rates was described by the reciprocal-Y model: NH3/Yd = 1/(6.58 − 0.0226*F), R2 = 48.0% (Figure 7). The estimated NH3/Yd values for the critical doses of F 112 and 149 kg N·ha1 were 0.25 and 0.31 kg N·ha1, respectively. As in the case of NH3/Yd, regression increased quite steeply for higher doses of F. The spread of NH3/Yd around the regression line also increased with the dose of N.
A fairly close regression relationship was found between Ns and yield-scaled emissions of N2O and NH3 (Figure 8 and Figure 9). In both cases it was described with the exponential model.

3.6. Data Optimization for NUE and N Rate Targets

The optimization analyses performed showed that for the NUE target 90%, F may slightly decrease, Yd may slightly increase, yield-scaled N losses may decrease significantly, and GM may increase compared to the regression estimates for critical F due to yield (Table 2). Optimization for F equal to 112 kg N·ha1 showed that the yield may slightly decrease, N2O/Yd may also decrease, whilst NUE and Ns may increase, and NH3/Yd and GM may increase relatively to the GM-critical F regression data. It is worth noting that the optimization data was obtained with random seed selections. Apart from the identified differences, it can be concluded that one-way regressions and multi-factor optimization gave similar results.

3.7. Nitrogen Indicators for Farm Fields

In the dataset from farm fields for which NUE was ≥90%, the medians were yield −6.00 Mg·ha1, NUE–118%, and Ns-26 kg N·ha1 (Table 3). The corresponding yield-scaled N losses were as follows: Ns −4.2, N2O 0.30, and NH3 0.23 kg N·ha1. The obtained gross margin reached the value of 746 EUR·ha1.
Surprisingly, when the dose of N was increased but NUE < 90%, the yields decreased (Table 4). Understandably, nitrogen losses increased with higher fertilization and lower yields.

4. Discussion

The 32 site-year experiments, the results of which have been presented here, were conducted on light soils, which are considered as typical for Poland, accounting for almost 49% of arable land in the country [63]. They are characterized by a low content of organic carbon (<2%).
The obtained yields of 5.40 ± 1.42 Mg·ha−1 were comparable to those reported in the previous studies in Poland [64]. It was found that the yields ranged from 4.35 to 5.95 Mg·ha−1 in 45 experiments carried out on light soils all over the country. The statistical yields in the study period (2003–2018) for wheat were, on average, 4.63 Mg·ha−1 [65].
The ideal N rate for any crop would be the one that promotes the goals of high crop yield and low N losses. However, such a rate should also be economically viable. The wheat yields in the conducted experiments increased until N rate reached 149 ± 23.9 kg N·ha−1, which allowed a maximum yield of 5.99 Mg·ha−1. Zhang et al. [66], also based on the linear-plus plateau model, found that the optimal N rate (for field trials conducted at 120 sites) varied from 84 to 270 kg N·ha−1, with a mean value of 138 kg N·ha−1, under which the maximum wheat yield varied from 5.21 to 8.78 Mg·ha−1 with an average value of 6.79 Mg·ha−1. These studies also showed that discrepancies in the optimal N dose and maximum yield may have resulted from environmental variability. Further analyses carried out by us showed that the maximum gross margin (693 EUR ha−1) was achieved at a dose of 112 ± 23 kg N·ha−1. Thus, increasing the dose above the given critical value was unprofitable. We also confirmed this claim by extensive research (17,870 observations of winter wheat), which showed that increasing average N rate from 107 to 147 kg ha−1 in Polish environmental conditions might not increase yield sufficiently for its use to be justified [45]. More important factors of yield variability were the use of fungicides and growth regulators, which are applied at much smaller rates than N fertilizer and positively influence efficient winter wheat production.
The meta-analytical studies show that nutrient management, including “4R” practices as well as enhanced efficiency amendments, had the largest impact, increasing crop yields and N uptake while reducing N2O and NH3 emissions as well as N surplus [25]. “4R” fertilizer strategies (right source, rate, timing, placement) can affect the yield in the range of about −20–5%·yr, and the crop of N indicators (content of N, Yn, or NUE) in the range of about −30–30%·yr [25]. These results justify the critical need to develop agricultural intensification strategies which would optimize crop productivity at N input levels that are economically and environmentally sustainable. N indicators (Yn, NUE, Ns) and yield-scaled N losses can be helpful in achieving this aim. The latter, expressed in terms of crop productivity rather than per unit area, are a simple but informative tool for identifying N application rates needed to optimize yields while lowering N losses per unit yield.
The median NUE value of 97% found in our experiments can be considered high. Values of this order were found on farms in Spain, where in a 3-year rotation NUE sometimes turned out to be higher than 100%, especially when soil available N before sowing a crop was high [24]. In our case, wheat was grown after oilseed winter rape, which leaves a significant amount of unused nitrogen [67,68]. The estimated NUE values for the critical doses of 149 and 112 kg·ha−1 were 93 and 108%, respectively. As a result of the relatively high NUE, the Ns values for these critical N doses were relatively low and equaled 6.8 and −10.1 kg N·ha−1, respectively. The analyzed values for agriculture in Poland in 2003–2018 were NUE = 59% and Ns = 50 kg N·ha−1 [69]. In the Netherlands, NUE and Ns in wheat crops were 80% and 78 kg N ha−1, respectively [33]. In general, relatively high NUE combined with high Ns for most crops is the result of high N outputs (yields) combined with high N application rates [33]. Moreover, high NUE and low Ns were mostly associated with smaller N application rates. ‘Big Data’ research on commercial farms in the Netherlands has shown that for wheat grown on the light soils target values for NUE and Ns should be 65% and 80 kg N·ha−1, respectively [33]. However, these values were determined for wheat intensively fertilized with nitrogen.
The desired maximum NUE value was proposed to be 90% [17]. Values greater than the specified may trigger a risk of mining soil N (and organic matter) and thus induce soil N depletion and degradation of soil fertility and soil carbon [24]. On light soils, it should be avoided due to low organic carbon reserves, except for high residual N soils. Additionally, desired ranges of Yn (>80 kg·ha−1), NUE (50–90%), and Ns (<80 kg·ha−1) have been proposed [17]. Farms outside the desired ranges could approach their specific targets by increasing or reducing N inputs (intensification or extensification) or adopting additional strategies (sustainable intensification) [24].
N surplus can be easily leached from the soil in the form of nitrates. The greatest leaching usually occurs from light soils [37,38,39,40]. In Poland, when fertilizing winter wheat with a dose of 70–210 kg N·ha−1 on sandy soil, N leaching in the multi-year period amounted to 26–38 kg N·ha−1 [40]. This meant that 50–73% of the Ns was leached out.
There is a close relationship between Ns and N2O fluxes [70]. It is described for meta-data as a generalized relationship between N balance and N2O losses for a wide variety of cropping systems and regions, with the following equation [70]:
N2O = exp(0.339 + 0.0047*Ns)
where N2O is annual cumulative N2O emissions and Ns is the annual N surplus, both in kg N·ha−1. The own research also revealed an exponential relationship between yield-scaled emissions of N2O and NH3, and Ns.
Yield-scaled Ns, N2O, and NH3 for the critical dose by yield (149 kg N·ha−1) were 3.5, 0.35, and 0.31 kg·ha−1, respectively. Lowering the N dose to the critical value for obtaining the maximum gross margin (112 kg N·ha−1) resulted in the reduction of these indices by 100, 17, and 19%, respectively.
In the experiments carried out in Germany, yield-scaled N2O emissions ranged from 0.23 to 0.28 kg N·ha−1 with winter wheat yields of 3.75–6.5 Mg·ha−1 obtained at doses of 0–240 kg N·ha−1. Therefore, the emissions were slightly lower than those found in our own research for similar yields and doses of N. On the other hand, the yield-scaled N2O emissions found by us fell within the range of 0.23–0.53 kg N·ha−1 with the wheat yield of 5.89 Mg·ha−1 and the fertilization dose of 225 kg N·ha−1 [46]. Worldwide, the mean of yield-scaled NO3 amounted to 5.8 kg N·ha−1 with wheat yields of 4.5 Mg·ha−1 and doses of 100–150 kg N·ha−1 [71].
Yield-scaled NH3 emissions are rarely reported in the literature. More extensive research on this topic has been carried out in Spain [72]. It showed that among the strategies analyzed, only suppression of urea application combined with incorporation of manure and N synthetic fertilizers other than urea could give a fully beneficial situation: yield scaled NH3 emissions were reduced by 82%, N surplus was reduced by 9%, NUE was increased by 19%, and yield was around 98% of the reference situation. This study shows that the adoption of viable measures may provide an opportunity for countries like Spain to meet the international agreements on NH3 mitigation, while maintaining crop yields and increasing NUE.
Improving NUE and applying N fertilizer in balance with crop demand are frequently proposed as environmental policy options for mitigating N losses. Some studies have found that two environmental N rate reduction strategies (enhancing NUE by 30% or maintaining zero N surplus) had greater potential to reduce N2O emissions on an area- and yield-scaled basis compared to the two economic strategies. However, both environmental strategies were associated with large reductions in N rate which negatively affected yields and economic returns [47]. Research in Europe has also shown that, at current NUE, reducing N inputs to comply with three environmental thresholds (critical N deposition on terrestrial ecosystems and critical N concentrations in surface water and groundwater) would reduce European crop production by 50% [14]. It is, therefore, a great challenge for science and practice to reduce N losses and, at the same time, maintain yields. The results of our experiments show that it is possible to maintain a high NUE close to the desired value of 90% employing two strategies: limiting the dose to a critical value for maximum yield or maximum revenue. Such doses for winter wheat grown on light soils were 149 ± 23.9 and 112 ± 23.6 kg N·ha−1.
Recent studies have shown that winter wheat grown on 156 production fields yielded 5.66 Mg·ha−1 and provided a gross margin of 655 EUR·ha−1 [73]. A survey conducted by us for 2300 farm fields cultivating winter wheat on light soils showed that 90% of them used, on average, (Me) 111 kg N·ha−1, obtaining a yield of 6.00 Mg·ha−1 and NUE of 118%. They were characterized by relatively low nitrogen losses. Unexpectedly, the increase in the average dose of N to 151 kg N·ha−1 ha in the remaining 10% of farm fields resulted in both a decrease in yields to 5 Mg·ha−1 and a decrease in NUE to 79%, with a simultaneous increase in yield-scaled emissions. The lack of response to the increase in N dose is in line with the results of previous extensive studies [43]. They showed, on the basis of 17,870 observations from experimental fields, that increasing the average N rate used in Polish environmental conditions from 107 to 147 kg N·ha−1 might not increase yield sufficiently enough for its application to be justified. More important factors of yield variability were the use of fungicides and growth regulators, which positively influence efficient winter wheat production. From both series of our results, it can be concluded that the low water capacity of light soils and variable rainfall makes water-limited yield potential very difficult to predict, and growers tend to keep the N dose below or close to the economic maximum, fearing economic and environmental losses of N if wheat is over-fertilized. That strategy is effective for reducing Ns and mitigating soil gaseous N loss, but at the expense of moderate soil-N mining, which, in the long run, may be detrimental to the fertility of light soils. It does not seem possible to avoid this soil-N mining in the current economic conditions.

5. Conclusions

Research carried out can help farmers in adoption of N rate reduction aimed balancing agronomic and environmental goals in winter wheat production on light soils. By combining regression models of yield, nitrogen use efficiency, N surplus, and yield-scaled Ns, N2O and NH3 losses with N rates, we found that two strategies of N rate reduction can be used. The first consisted in limiting the N dose to the amount ensuring the maximum yield, and the second one in N dose reduction to the amount enabling the maximum revenue to be obtained. Both are already used in wheat production—the first in 10% and the second in 90% of farm fields. Reduction of N dose to the amount ensuring the maximum revenue did not reduce the yields. However, it allowed for the reduction of yield-scaled Ns, N2O, and NH3 in relation to the dose ensuring the maximum yield. Unfortunately, this reduction was possible at the expense of moderate soil-N mining, which, in the current economic conditions, seems inevitable.

Supplementary Materials

The following are available online at https://www.mdpi.com/article/10.3390/agronomy11112337/s1, Table S1: Surveys data (2008-2018). Experimental data. Table S2: Experimental data. Table S3: Characteristic of soil chemical properties in the experimental sites. Table S4: Cultivation treatments performed in experimental fields. Figure S1: Precipitation. Figure S2: SPI. Figure S3: Temperature.

Author Contributions

Conceptualization, A.F., A.R., Z.J.; methodology, A.F., A.R., Z.J., T.J.; validation, A.F., A.R., Z.J., formal analysis, A.F., Z.J.; investigation, A.F., A.R., Z.J., T.J.; resources, A.R., T.J.; data curation, A.F, Z.J.; writing—original draft preparation, A.F., A.R., Z.J.; writing—review and editing, A.F., A.R., Z.J.; visualization, A.F., A.R., Z.J; supervision, A.F. All authors have read and agreed to the published version of the manuscript.

Funding

This paper was financed from task 1.3. of the Institute of Soil Science and Plant Cultivation–State Research Institute Target Grant for 2021 “Improvement of the online database on fertilizer products”.

Data Availability Statement

Own research and statements.

Conflicts of Interest

The authors declare no conflict of interest.

References

  1. Marschner, H.; Kirkby, E.A.; Cakmak, I. Effects of mineral nutrition status on shoot-root partitioning of photo assimilates and cycling of mineral nutrients. J. Exp. Bot. 1996, 47, 1255–1263. [Google Scholar] [CrossRef]
  2. Muller, N.B.; Gerber, J.S.; Johnson, M.; Ray, D.K.; Ramankuty, N.; Foley, J.A. Closing yield gaps through nutrient and water management. Nature 2012, 490, 254–257. [Google Scholar] [CrossRef] [PubMed]
  3. Fernandez, M.S.; Rosiello, R.O.P. Mineral nitrogen in plant physiology and plant nutrition. Crit. Rev. Plant Sci. 1995, 14, 111–148. [Google Scholar] [CrossRef]
  4. Vojvodic, A.; Medford, A.J.; Studt, F.; Pedersen, F.A.; Khan, T.S.; Bligaard, T.; Nørskov, J.K. Exploring the limits: A low pressure, low-temperature Haber-Bosch process. Chem. Phys. Lett. 2014, 598, 108–112. [Google Scholar] [CrossRef]
  5. Smill, V. Enriching the Earth: Fritz Haber, Carl Bosch, and the Transformation of World Wood Production; MIT Press: Cambridge, MA, USA, 2004; p. 360. [Google Scholar]
  6. Galloway, J.N.; Townsend, A.R.; Erisman, J.W.; Bekunda, M.; Cai, Z.; Freney, J.R.; Martinelli, S.P.; Seitzinger, L.A.; Sutton, M.A. Transformation of the nitrogen cycle: Recent trends, questions, and potential solutions. Science 2008, 320, 889–892. [Google Scholar] [CrossRef] [PubMed] [Green Version]
  7. Bouwman, L.; Goldewijk, K.K.; Van Der Hoek, K.W.; Beusen, A.H.W.; Van Vuuren, D.P.; Willems, J.; Rufino, M.C.; Stehfest, E. Exploring global changes in nitrogen and phosphorus cycles in agriculture induced by livestock production over the 1900–2050 period. Proc. Natl. Acad. Sci. USA 2013, 110, 20882–20887. [Google Scholar] [CrossRef] [Green Version]
  8. Sutton, M.; Howard, C.M.; Erisman, J.W.; Billen, G.; Bleeker, A.; Grennfelt, P.; van Grinsven, H.; Grizzetti, B. (Eds.) The European nitrogen Assessment: Sources, Eeffects and Policy Perspectives; Cambridge University Press: Cambridge, MA, USA, 2011; pp. 1–607. [Google Scholar]
  9. Jones, L.; Provins, A.; Holland, M.; Mills, G.; Hayes, F.; Emmetta, B.; Halla, J.; Sheppard, L.; Smith, R.; Sutton, M.; et al. A review and application of the evidence for nitrogen impacts on ecosystem services. Ecosyst. Serv. 2014, 7, 76–88. [Google Scholar] [CrossRef] [Green Version]
  10. Cameron, K.C.; Di, H.J.; Moir, J.L. Nitrogen losses from the soil/plant system: A review. Ann. Appl. Biol. 2013, 162, 145–173. [Google Scholar] [CrossRef]
  11. OECD. Gross Nitrogen Balances. Handbook. OECD and EUROSTAT. 2007. Available online: https://www.oecd.org/greengrowth/sustainable-agriculture/40820234.pdf (accessed on 1 October 2021).
  12. Piccoli, I.; Sartori, F.; Polese, R.; Borin, M.; Berti, A. Can long-term experiments predict real field N and P balance and system sustainability? Results from maize, winter wheat, and soybean trials using mineral and organic fertilisers. Agronomy 2021, 11, 1472. [Google Scholar] [CrossRef]
  13. McLellan, E.L.; Cassman, K.G.; Eagle, A.J.; Woodbury, P.B.; Sela, S.; Tonitto, C.; Marjerison, R.D.; van Es, H.M. The nitrogen balancing act: Tracking the environmental performance of food production. BioScience 2018, 68, 194–203. [Google Scholar] [CrossRef]
  14. Schulte-Uebbing, L.; de Vries, W. Reconciling food production and environmental boundaries for nitrogen in the European Union. Sci. Total Environ. 2021, 786, 147427. [Google Scholar] [CrossRef]
  15. Moll, R.H.; Kamprath, E.J.; Jackson, W.A. Analysis and interpretation of factors which contribute to efficiency of nitrogen utilization. Agron. J. 1982, 74, 562–564. [Google Scholar] [CrossRef]
  16. Congreves, K.A.; Otchere, O.; Ferland, D.; Farzadfar, S.; Williams, S.; Arcand, M.M. Nitrogen use efficiency definitions of today and tomorrow. Front. Plant Sci. 2021, 12, 637108. [Google Scholar] [CrossRef] [PubMed]
  17. EU Nitrogen Expert Panel. Nitrogen Use Efficiency (NUE) an Indicator for the Utilization of Nitrogen in Food Systems; Wageningen University, Alterra: Wageningen, The Netherlands, 2015. [Google Scholar]
  18. Erisman, J.W.; Galloway, J.N.; Seitzinger, S.; Bleeker, A.; Dise, N.B.; Petrescu, A.M.R.; Leach, A.M.; Vries, W. Consequences of human modification of the global nitrogen cycle. Philos. Trans. R. Soc. 2013, 368, 20130165. [Google Scholar] [CrossRef] [PubMed] [Green Version]
  19. Howarth, R.W.; Billen, G.; Swaney, D.; Townsend, A.; Jaworski, N.; Lajtha, K.; Downing, J.A.; Elmgren, R.; Caraco, N.; Jordan, T.; et al. Regional nitrogen budgets and riverine N & P fluxes for the drainages to the North Atlantic Ocean: Natural and human influences. In Nitrogen Cycling in the North Atlantic Ocean and Its Watersheds; Howarth, R.W., Ed.; Springer: Dordrecht, The Netherlands, 1996; pp. 75–139. [Google Scholar]
  20. Roberts, T.L.; Johnston, A.E. Phosphorus use efficiency and management in agriculture. Resour. Conserv. Recycl. 2015, 105, 275–281. [Google Scholar] [CrossRef]
  21. Raun, W.R.; Johnson, G.V. Improving nitrogen use efficiency for cereal production. Agron. J. 1999, 91, 357–363. [Google Scholar] [CrossRef] [Green Version]
  22. De Vries, W.; Schulte-Uebbing, L.; Kros, H.; Voogd, J.C.; Louwagie, G. Spatially explicit boundaries for agricultural nitrogen inputs in the European Union to meet air and water quality targets. Sci. Total Environ. 2021, 786, 147283. [Google Scholar] [CrossRef]
  23. Van Grinsven, H.J.M.; Spiertz, J.H.J.; Westhoek, H.J.; Bouwman, A.F.; Erisman, J.W. Nitrogen use and food production in European regions from a global perspective. J. Agric. Sci. 2014, 152, S9–S19. [Google Scholar] [CrossRef] [Green Version]
  24. Quemada, M.; Lassaletta, L.; Jensen, L.S.; Godinot, O.; Brentrup, F.; Buckley, C.; Foray, S.; Hvid, S.K.; Oenema, J.; Richards, K.G.; et al. Exploring nitrogen indicators of farm performance among farm types across several European case studies. Agric. Syst. 2020, 177, 102689. [Google Scholar] [CrossRef]
  25. Young, M.D.; Ros, G.H.; de Vries, W. Impacts of agronomic measures on crop, soil, and environmental indicators: A review and synthesis of meta-analysis. Agric. Ecosyst. Environ. 2021, 319, 107551. [Google Scholar] [CrossRef]
  26. Oenema, O.; Witzke, H.P.; Klimont, Z.; Lesschen, J.P.; Velthof, G.L. Integrated assessment of promising measures to decrease nitrogen losses from agriculture in EU-27. Agric. Ecosyst. Environ. 2009, 133, 280–288. [Google Scholar] [CrossRef]
  27. Snyder, C.S.; Davidson, E.A.; Smith, P.; Venterea, R.T. Agriculture: Sustainable crop and animal production to help mitigate nitrous oxide emissions. Curr. Opin. Environ. Sustain. 2014, 9–10, 46–54. [Google Scholar] [CrossRef] [Green Version]
  28. Snyder, C.S. Enhanced nitrogen fertiliser technologies support the “4R” concept to optimise crop production and minimise environmental losses. Soil Res. 2017, 55, 463. [Google Scholar] [CrossRef]
  29. Sharma, L.K.; Bali, S.K. A Review of methods to improve nitrogen use efficiency in agriculture. Sustainability 2018, 10, 51. [Google Scholar] [CrossRef] [Green Version]
  30. Kong, D.; Jin, Y.; Chen, J.; Yu, K.; Zheng, Y.; Wu, S.; Liu, S.; Zou, J. Nitrogen use efficiency exhibits a trade-off relationship with soil N2O and NO emissions from wheat-rice rotations receiving manure substitution. Geoderma 2021, 403, 115374. [Google Scholar] [CrossRef]
  31. Kravchenko, A.N.; Toosi, E.R.; Guber, A.K.; Ostrom, N.E.; Yu, J.; Azeem, K.; Rivers, M.L.; Robertson, G.P. Hotspots of soil N2O emission enhanced through water absorption by plant residue. Nat. Geosci. 2017, 10, 496–500. [Google Scholar] [CrossRef]
  32. Hawkesford, M.J. Genetic variation in traits for nitrogen use efficiency in wheat. J. Exp. Bot. 2017, 68, 2627–2632. [Google Scholar] [CrossRef]
  33. Silva, J.V.; van Ittersum, M.K.; ten Berge, H.F.M.; Spätjens, L.; Tenreiro, T.R.; Niels, P.R.; Anten, N.P.R.; Reidsma, P. Agronomic analysis of nitrogen performance indicators in intensive arable cropping systems: An appraisal of big data from commercial farms. Field Crop. Res. 2021, 269, 108176. [Google Scholar] [CrossRef]
  34. Moitzi, G.; Neugschwandtner, R.W.; Kaul, H.-P.; Helmut Wagentrist, H. Efficiency of mineral nitrogen fertilization in winter wheat under Pannonian climate conditions. Agriculture 2020, 10, 541. [Google Scholar] [CrossRef]
  35. Faber, A.; Jarosz, Z.; Jędrejek, A.; Rutkowska, A. Yield-scaled nitrous oxide emission from soils depending on nitrogen use efficiency characteristics. Pol. J. Environ. Stud. 2019, 28, 3155–3162. [Google Scholar] [CrossRef]
  36. Lasaletta, L.; Billen, G.; Grizetti, B.; Garnier, J.; Leach, A.M.; Galloway, J.N. 50 year trends in nitrogen use efficiency of world cropping systems: The relationships between yield and nitrogen input to cropland. Environ. Res. Lett. 2014, 9, 9. [Google Scholar] [CrossRef]
  37. Kühling, I.; Beiküfner, M.; Vergara, M.; Trautz, D. Effects of adapted N-fertilisation strategies on nitrate leaching and yield performance of arable crops in North-Western Germany. Agronomy 2021, 11, 64. [Google Scholar] [CrossRef]
  38. Meissner, R.; Rupp, H.; Seeger, J.; Schonert, P. Influence of mineral fertilizers and different soil types on nutrient leaching: Results of lysimeter studies in East Germany. Land Degrad. Dev. 1995, 6, 163–170. [Google Scholar] [CrossRef]
  39. Köhler, K.; Duynisveld, W.H.M.; Böttcher, J. Nitrogen fertilization and nitrate leaching into groundwater on arable sandy soils. J. Plant Nutr. Soil Sci. 2006, 169, 185–195. [Google Scholar] [CrossRef]
  40. Pondel, H.; Ruszkowska, M.; Sykut, S.; Terelak, H. Leaching of fertilizer nutrients from cultivated soils based on researches carried out by the Institute of Soil Science and Cultivation of Plants. Roczniki Gleboznawcze 1991, XLII (¾), 97–107. (In Polish) [Google Scholar]
  41. Wang, C.; Amon, B.; Schulz, K.; Mehdi, B. Factors That influence nitrous oxide emissions from agricultural soils as well as their representation in simulation models: A review. Agronomy 2021, 11, 770. [Google Scholar] [CrossRef]
  42. Fowler, D.; Steadman, C.E.; Stevenson, D.; Coyle, M.; Rees, R.M.; Skiba, U.M.; Sutton, M.A.; Cape, J.N.; Dore, A.J.; Vieno, M.; et al. Effects of global change during the 21st century on the nitrogen cycle. Atmos. Chem. Phys. 2015, 15, 13849–13893. [Google Scholar] [CrossRef] [Green Version]
  43. Abdalla, M.; Smith, P.; Williams, M. Emissions of nitrous oxide from agriculture: Responses to management and climate change. In Understanding Greenhouse Gas Emissions from Agricultural Management; American Chemical Society (ACS): Washington, DC, USA, 2011; pp. 343–370. [Google Scholar]
  44. Wójcik-Gront, E. Variables influencing yield-scaled global warming potential and yield of winter wheat production. Field Crop. Res. 2018, 227, 19–29. [Google Scholar] [CrossRef]
  45. Wan, X.; Wu, W.; Liao, Y. Mitigating ammonia volatilization and increasing nitrogen use efficiency through appropriate nitrogen management under supplemental irrigation and rain–fed condition in winter wheat. Agric. Water Manag. 2021, 225, 107050. [Google Scholar] [CrossRef]
  46. Chen, H.; Zheng, C.; Chen, F.; Qiao, Y.; Du, S.; Cao, C.; Zhang, W. Less N2O emission from newly high-yielding cultivars of winter wheat. Agric. Ecosyst. Environ. 2021, 320, 107557. [Google Scholar] [CrossRef]
  47. Zhao, X.; Nafziger, E.D.; Pittelkow, C.M. Nitrogen rate strategies for reducing yield-scaled nitrous oxide emissions in maize. Environ. Res. Lett. 2017, 12, 124006. [Google Scholar] [CrossRef]
  48. Bizimana, F.; Timilsina, A.; Dong, W.; Uwamungu, J.Y.; Li, X.; Wang, Y.; Pandey, B.; Qin, S.; Hu, C. Effects of long-term nitrogen fertilization on N2O, N2 and their yield-scaled emissions in a temperate semi-arid agro-ecosystem. J. Soils Sediments 2021, 21, 1659–1671. [Google Scholar] [CrossRef]
  49. Van Groenigen, J.W.; Velthof, G.L.; Oenema, O.; Van Groenigen, K.J.; Van Kessel, C. Towards an agronomic assessment of N2O emissions: A case study for arable crops. Eur. J. Soil Sci. 2010, 61, 903–913. [Google Scholar] [CrossRef]
  50. Guzman-Bustamante, I.; Winkler, T.; Schulz, R.; Müller, T.; Mannheim, T.; Laso Bayas, J.C.; Ruser, R. N2O emissions from a loamy soil cropped with winter wheat as affected by N-fertilizer amount and nitrification inhibitor. Nutr. Cycl. Agroecosysts. 2019, 114, 173–191. [Google Scholar] [CrossRef]
  51. Kim, D.-G.; Giltrap, D. Determining optimum nitrogen input rate and optimum yield-scaled nitrous oxide emissions: Theory, field observations, usage, and limitations. Agric. Ecosyst. Environ. 2017, 247, 371–378. [Google Scholar] [CrossRef]
  52. Swarbreck, S.M.; Wang, M.; Wang, Y.; Kindred, D.; Sylvester-Bradley, R.; Shi, W.; Varinderpal-Singh; Bentley, A.R.; Griffiths, H. A roadmap for lowering crop nitrogen requirement. Trends Plant Sci. 2019, 24, 892–904. [Google Scholar] [CrossRef]
  53. Morris, T.F.; Murrell, T.S.; Beegle, D.B.; Camberato, J.J.; Ferguson, R.B.; Grove, J.; Yang, H. Strengths and limitations of nitrogen rate recommendations for corn and opportunities for improvement. Agron. J. 2018, 110, 1–37. [Google Scholar] [CrossRef] [Green Version]
  54. Nigon, T.J.; Yang, C.; Mulla, D.J.; Kaiser, D.E. Computing uncertainty in the optimum nitrogen rate using a generalized cost function. Comput. Electron. Agric. 2019, 167, 105030. [Google Scholar] [CrossRef]
  55. European Commission. Farm to Fork Strategy. For a Fair, Healthy and Environmentally-Friendly Food System; European Commission: Brussels, Belgium, 2020; pp. 1–23. [Google Scholar]
  56. European Commission. Communication from the Commission to the European Parliament, the Council, the European Economic and Social Committee and the Committee of the Regions. A Farm to Fork Strategy for a Fair, Healthy and Environmentally-Friendly Food System; COM(2020) 381 Final; European Commission: Brussels, Belgium, 2020. [Google Scholar]
  57. SegReg: Calculator for Segmented Linear Regression with Breakpoint. Available online: https://www.waterlog.info/segreg.htm (accessed on 1 October 2021).
  58. Chukalla, A.D.; Reidsma, P.; Michelle, T.H.; van Vliet, M.T.H.; Silva, J.V.; van Ittersum, M.K.; Jomaa, S.; Rode, M.; Merbach, I.; van Oel, P.R. Balancing indicators for sustainable intensification of crop production at field and river basin levels. Sci. Total Environ. 2020, 705, 135925. [Google Scholar] [CrossRef] [PubMed]
  59. BIOGRACE, Harmonised Calculation of Biofuel Greenhouse Gas Emission in Europe. 2015. Available online: http://www.biograce.net/content/ghgcalculationtools/recognisedtool (accessed on 1 October 2021).
  60. EMEP/EEA Air Pollutant Emission Inventory Guidebook 2016. Available online: https://www.eea.europa.eu/publications/emep-eea-guidebook-2016/part-b-sectoral-guidance-chapters/4-agriculture/3-d-crop-production-and/view (accessed on 1 October 2021).
  61. STATGRAPHICS® Centurion XVI User Manual. Available online: https://cdn2.hubspot.net/hubfs/402067/PDFs/user-manual.pdf (accessed on 1 October 2021).
  62. Evolver. The Genetic Algorithm Solver for Microsoft Excel; Ver. 5.7; Palisade Corp: Ithaca, NY, USA, 2010. [Google Scholar]
  63. Krasowicz, S.; Stuczyński, T.; Doroszewski, A. Crops production in Poland on the background of the natural, economic and organizational conditions. Studia i Raporty IUNG-PIB 2009, 14, 27–54. (In Polish) [Google Scholar]
  64. Noworolnik, K. Effect of some soil properties on yielding of winter wheat and winter barley. Acta Agrophys. 2008, 12, 477–485. (In Polish) [Google Scholar]
  65. Food and Agriculture Organization Corporate Statistical Database (FAOSTAT). New Food Balances. Available online: http://www.fao.org/faostat/en/#data/FBS (accessed on 5 October 2021).
  66. Zhang, S.; Gao, P.; Tong, Y.; Norse, D.; Lu, Y.; Powlson, D. Overcoming nitrogen fertilizer over-use through technical and advisory approaches: A case study from Shaanxi Province, northwest China. Agric. Ecosyst. Environ. 2015, 209, 89–99. [Google Scholar] [CrossRef]
  67. Weiser, C.; Fuß, R.; Kage, H.; Flessa, H. Do farmers in Germany exploit the potential yield and nitrogen benefits from preceding oilseed rape in winter wheat cultivation? Arch. Agron. Soil Sci. 2017, 64, 1–13. [Google Scholar] [CrossRef]
  68. Rutkowska, A.; Skowron, P. Productive and environmental consequences of sixteen years of unbalanced fertilization with nitrogen and phosphorus—Trials in Poland with oilseed rape, wheat, maize and barley. Agronomy 2020, 10, 1747. [Google Scholar] [CrossRef]
  69. OECD. Environmental Performance of Agriculture—Nutrients Balances. OECD Agriculture Statistics (Database). 2021. Available online: https://www.oecd-ilibrary.org/agriculture-and-food/data/oecd-agriculture-statistics/environmental-performance-of-agriculture-nutrients-balances_d327d2a9-en (accessed on 17 November 2021).
  70. Eagle, A.J.; McLellan, E.L.; Brawner, E.M.; Chantigny, M.H.; Davidson, E.A.; Dickey, J.B.; Linquist, B.A.; Maaz, T.M.; Pelster, D.E.; Pittelkow, C.M.; et al. Quantifying on-farm nitrous oxide emission reductions in food supply chains. Earths Future 2020, 8, e2020EF001504. [Google Scholar] [CrossRef]
  71. Zhou, M.; Butterbach-Bahl, K. Assessment of nitrate leaching loss on a yield-scaled basis from maize and wheat cropping systems. Plant Soil. 2014, 374, 977–991. [Google Scholar] [CrossRef]
  72. Sanz-Cobena, A.; Lassaletta, L.; Estellés, F.; Del Prado, A.; Guardia, G.; Abalos, D.; Aguilera, E.; Pardo, G.; Vallejo, A.; Sutton, M.A.; et al. Yield-scaled mitigation of ammonia emission from N fertilization: The Spanish case. Environ. Res. Lett. 2014, 9, 125005. [Google Scholar] [CrossRef]
  73. Skarżyńska, A. Costs and profitability. Unit costs and income from selected products in 2018: Research results in the Agrokoszty System. Probl. Agric. Econ. 2020, 2, 142–162. [Google Scholar]
Figure 1. Observed and predicted grain yield (Yd, Mg·ha−1) depending on nitrogen doses (F, kg N·ha−1; critical F rate (C) = 149.4 kg N·ha−1, for F < C Yd = 3.09 + 0.0194*F, R2 = 15.3%, for F > C Yd = 5.99 Mg·ha−1, n = 320) (blue line—estimated regression; grey lines—confidence and prediction limits at confidence level 95%).
Agronomy 11 02337 g001
Figure 2. Observed and predicted gross margin (EUR·ha−1) depending on nitrogen doses (F, kg N·ha−1) (critical F rate (C) = 111.9 kg N·ha−1, for F < C GM = 306 + 3.46*F, R2 = 7.3%, for F > C GM = 693 EUR·ha−1, n = 320).
Agronomy 11 02337 g002
Figure 3. Observed and predicted nitrogen use efficiency (NUE, %) depending on nitrogen doses (F, kg N·ha−1) (R2 = 32.9%, n = 320).
Agronomy 11 02337 g003
Figure 4. Observed and predicted N surplus (Ns, kg N·ha1) depending on nitrogen doses (F, kg N·ha1) (R2 = 32.9%, n = 320).
Agronomy 11 02337 g004
Figure 5. Observed and predicted yield-scaled N surplus (Ns/Yd, kg N·Mg1) depending on nitrogen doses (F, kg N·ha1) (R2 = 23.9%, n = 320).
Agronomy 11 02337 g005
Figure 6. Observed and predicted yield-scaled N2O emissions (N2O/Yd, kg N·Mg1) depending on nitrogen doses (F, kg N·ha1) (R2 = 47.0%, n = 320).
Agronomy 11 02337 g006
Figure 7. Observed and predicted yield-scaled NH3 emissions (NH3/Yd, kg N·Mg1) depending on nitrogen doses (F, kg N·ha1) (R2 = 48.0%, n = 320).
Agronomy 11 02337 g007
Figure 8. Observed and predicted yield-scaled N2O emissions (N2O/Yd, kg N·Mg1) depending on nitrogen surplus (Ns, kg N·ha1) (N2O/Yd = exp(−1.0763 + 0.00695*Ns; R2 = 78,2%, n = 320).
Agronomy 11 02337 g008
Figure 9. Observed and predicted yield-scaled NH3 emissions (NH3/Yd, kg N·Mg−1) depending on nitrogen surplus (Ns, kg N·ha−1) (NH3/Yd = exp(−1.197 + 0.00895*Ns; R2 = 76.6%, n = 320).
Agronomy 11 02337 g009
Table 1. Statistics for experimental data (n = 320); Yd (Mg·ha1); Yn, Ns (kg·ha1); NUE (%); yield-scaled Ns, N2O, NH3 (kg N·Mg1), GM (EUR·ha1).
StatisticsYdYnNUENs Yield-Scaled GM
NsN2ONH3
Me1325.401209710.140.340.32669
MAD421.423828315.950.090.11227
* rMAD322631293100424263434
Min501.342437−126−15.560.130.0834
Max21310.7128334012750.731.061.161517
* relative MAD (%).
Table 2. Comparison of parameters from optimization and regression analyses; F (kg N·ha1); Yd (Mg·ha1); NUE (%); Ns/Yd, N2O/Yd, NH3/Yd (kg N·Mg1).
ParameterTargetFYdNUEYield-ScaledGM
NsN2ONH3
Data from optimizations
NUE901416.279000.250.26779
F1121125.071152.00.270.28758
Data from regressions
FCritical F for Yd1495.99933.50.350.31693
FCritical F for GM1125.26108−0.20.290.25693
Table 3. Statistics for farm fields where NUE ≥90% (n = 1830); F, Yn, Ns (kg N·ha1); Yd (Mg·ha1); yield-scaled Ns, N2O, NH3 (kg N·Mg1).
StatisticsFYdYnNUENsYield-ScaledGM
NsN2ONH3
Me1116.00142118−26−4.20.300.23746
MAD201.002318183.10.030.04158
rMAD18171615−69−73.0101721
Min382.505990−111−16.10.160.08192
Max24111.00261304152.00.370.331537
Table 4. Statistics for farm fields where NUE <90% (n = 470); F, Yn, Ns (kg N ha1); Yd (Mg ha1); yield-scaled Ns, N2O, NH3 (kg N·Mg1).
StatisticsFYdYnNUENsYield-ScaledGM
NsN2ONH3
Me1515.0011979275.50.410.37587
MAD201.00236112.30.030.03158
rMAD132019841427827
Min712.00473682.10.370.31112
Max2918.502018916540.10.810.791142
Publisher’s Note: MDPI stays neutral with regard to jurisdictional claims in published maps and institutional affiliations.

