Article

Key Cannabis Salt-Responsive Genes and Pathways Revealed by Comparative Transcriptome and Physiological Analyses of Contrasting Varieties

1
Research Team of Genetic Modification of Annual Bast Fiber Crops, Institute of Bast Fiber Crops, Chinese Academy of Agricultural Sciences, Changsha 410205, China
2
National Key Laboratory of Crop Genetic Improvement and College of Plant Science and Technology, Huazhong Agricultural University, Wuhan 430070, China
*
Authors to whom correspondence should be addressed.
J.Z. and C.Z. contributed equally to this work and are co-first authors.
Agronomy 2021, 11(11), 2338; https://doi.org/10.3390/agronomy11112338
Submission received: 24 October 2021 / Revised: 11 November 2021 / Accepted: 12 November 2021 / Published: 19 November 2021

Abstract

:
For the dissection and identification of the molecular response mechanisms to salt stress in cannabis, an experiment was conducted surveying the diversity of physiological characteristics. RNA-seq profiling was carried out to identify differential expression genes and pathway which respond to salt stress in different cannabis materials. The result of physiological diversity analyses showed that it is more sensitive to proline contents in K94 than in W20; 6 h was needed to reach the maximum in K94, compared to 12 h in W20. For profiling 0–72 h after treatment, a total of 10,149 differentially expressed genes were identified, and 249 genes exhibited significantly diverse expression levels in K94, which were clustered in plant hormone signal transduction and the MAPK signaling pathway. A total of 371 genes showed significant diversity expression variations in W20, which were clustered in the phenylpropanoid biosynthesis and plant hormone signal transduction pathway. The pathway enrichment by genes which were identified in K94 and W20 showed a similar trend to those clustered in plant hormone signal transduction pathways and MAPK signaling. Otherwise, there were 85 genes which identified overlaps between the two materials, indicating that these may be underlying genes related to salt stress in cannabis. The 86.67% agreement of the RNA-seq and qRT-PCR indicated the accuracy and reliability of the RNA-seq technique. Additionally, the result of physiological diversity was consistent with the predicted RNA-seq-based findings. This research may offer new insights into the molecular networks mediating cannabis to respond to salt stress.

1. Introduction

Cannabis is one of the oldest cultivated crop, and has been grown for over ten thousand years; it is considered to have originated from the central Asia area, and then transmitted and planted around the world [1,2]. However, the cultivated area gradually decreased or disappeared in the mid-20th century [3], especially due to restrictions by the International Narcotics Convention [4,5]. Cannabis is famous as an source of tetrahydrocannabinol (Δ9-THC), which is a primary cause of hallucinogenic effects [6]. Cannabis may be the most recognizable and controversial species around the world, because of its characterization as an illicit drug [4]. Another reason for the decrease in cultivation area is that the laws and rules related with cannabis do not distinguish the different forms of cannabis, resulting in restrictions to cultivating and scientific research, and not considering industrial cannabis which, without hallucinogenic material, could as an source of fiber, fuel and nutrition [7]. Cannabis was used to make sails and fishing nets, as well as papers, clothes and other textile products in the past [8]. Currently, cannabis represents a new prospect as an edible and inedible crop because of its various nutritional values [9]: it comprises approximately 20–30% carbohydrate, 25–35% oil [10] and 20–25% protein [11,12], along with several vitamins and minerals in seeds [13]. To date, different special applications of cannabis pose new challenges and opportunities for breeders [14,15].
Salt tolerance is a plant’s response to salt stress, i.e., a matter of abiotic stress, which could cause diverse changes in physiological, biochemical and genetic expression [16,17,18]. The mechanism of responding to salt stress in plants is through regulating osmotic pressure and salt ion absorption and transport, with the purpose of regulating water and transport and absorbing nutrients for improving the capacity of managing abiotic stress [19,20]. High salt concentrations cause an imbalance in ion and hyperosmotic stress in plants, which could inhibit growth and reduce production [21]. Plant responses to salt stress are regulated by complex metabolic pathways and mechanisms, which are related to numerous genes, and some control factors such as pertaining to the osmotic (DREB2A, DREB2B, and LEA3), ion transport (HKT2, HKT1, NHX1, and SOS1) and oxidation reaction modules (CATA and POX1) [22,23]. Contemporary studies on responding to salt stress have mainly focused on model crops and major crops; for example, in Arabidopsis thaliana, thousands of genes in response to salt stress have been verified [23,24,25]. In rice, diverse variations in plant morphology, physiology, biochemistry and gene expression related to ion balance [26], osmotic adjustment [27], ROS scavenging [28] and hormonal regulation [29] during salt stress have been identified. In maize, calcineurin B-like proteins interacting with CBL-interacting protein kinases were induced by salt and ABA treatment [29]. Numerous genes, such as ZmPIF3 (phytochrome-interacting factor 3) and ZmbZIP72 (a bZIP TF from maize), increase the capacity of stress tolerance in maize, rice and Arabidopsis through overexpression of the genes [30,31]. Transcriptome analyses of plants in response to salt stress have identified numerous response genes as well as other substantial results in plants [32,33,34].
Salt stress induces great damage to agronomic trait qualities, and causes a loss in cannabis yield. The ultimate purpose of researching the molecular mechanism response to salt stress is to enhance the capacity to tolerate salt harm in cannabis. In this study, two cannabis varieties, K94 and W20, with contrasting capacity responses to salt stress, were selected to identify the genes and pathways responding to salt harm. The transcriptome candidate genes were analyzed for diverse variations in the transcriptome levels of high-salt-stress responses. The diverse physiological characteristics were investigated at different stages after salt treatment, and the expression levels of significant candidate genes were investigated by qRT-PCR in cannabis to dissect the mechanisms by which cannabis responds to salt stress. The results of this research showed that the MAPK signaling pathway and the plant hormone signal transduction pathway are involved in the mechanism regulating responses to salt stress in cannabis. This study also provides new insights to further the understand of diverse gene expression in conditions of abiotic stress.

2. Material and Methods

2.1. Plant Material and Growth Conditions

Two cannabis varieties, W20 and K94, were used for transcriptome analyses. The W20 variety is widely cultivated in Anhui Province in China, and the K94 variety is widely cultivated in Russa. Seeds were immerged in sodium hypochlorite solution for 30 s at room temperature, and then transferred into an improved Hoagland mixture [35]. The solution was renewed every two days, and the parameters of the culture room were set as follows: 14 h day/10 h night cycle; 26 °C at day and 20 °C at night cycle temperature; 80% humidity; and 250 mmol·m−2·s−1 intense luminosity [36]. Two weeks later, the cannabis seedlings which had the same growth status were treated under 100 mmol·L−1 NaCl. The samples were collected at times of 6 h, 12 h, 18 h, 1 day and 2 days after treatment in the Hoagland liquid medium, and the samples which had undergone no treatment were the controls. Then, the samples were mixed at all stages of treatment, and the samples without salt stress were all subjected to transcriptome sequencing.

2.2. Physiological Analysis

The samples were collected at times of 6 h, 18 h, 24 h and 2 days after salt treatment, and the samples which had undergone treatment were the controls. The samples were quickly stored in liquid nitrogen. Proline contents and chlorophyll contents were determined with an ultraviolet spectrophotometer. Samples were ground in liquid nitrogen; then, 0.5 g of material was heated in a boiling water bath for 10 min after adding 5 mL sulfosalicylic acid solution. Subsequently, the 2 mL supernatant was extracted with the chromogenic reagent, which comprised ninhydrin and glacial acetic acid and bathe in boiling water for 40 min. The absorbance was determined at a wavelength of 520 nm, and finally, the proline content was determined from the absorbance through the standard curve [37].
The materials were mixed with an 80% acetone solution after grinding the sample in liquid nitrogen, and then shaking a few times over 48 h of lightless cultivation. The chlorophyll content was determined from the absorbance at a wavelength of 652 nm [38].
The relative electrical conductivity was measured with a conductometer. The leaves were cut into suitable strips, 0.1 g material was placed in 10 mL ddH2O for 12 h and the electrical conductivity was measured and classified as R1; next, the samples were heated in boiling water for 30 min, and the electrical conductivity measured and labelled as R2. The relative electrical conductivity was determined as R1/R2 × 100% [34].

2.3. RNA-Seq Library Construction and Sequencing

Total RNA was extracted using an RNA extraction kit (Sangon, Shanghai, China, SK1321) and genomic DNA was removed, following the manufacturer’s procedure. The total RNA quantity and purity were evaluated with an Agilent 2100 Bioanalyzer (Agilent Technologies, Santa Clara, CA, USA). Then, the cleaved RNA fragments were reverse-transcribed to create the final cDNA library in accordance with the protocol for the mRNA-Seq sample preparation kit (Illumina, San Diego, CA, USA). The cDNA libraries were sequenced using the Illumina PE150 platform (Illumina, San Diego, CA, USA).

2.4. Data Analysis

The quality of the raw data was validated based on the Phred quality score (Q). The raw data were filtered and trimmed for low-quality score reads, adaptor and primer sequences were removed, and raw data were filtered with Trimmomatic [39]. The reads containing ploy-N and the low-quality reads were removed; then, the clean reads were mapped to the reference genomes using HISAT2 [40]. To evaluate the assembly quality, all the paired-end reads were aligned back to these contigs using the Bowtie2 [41]. In-house Perl scripts were used to identify the length distribution of the transcripts, the number and the length of N50, and the average length, maximum length and number of contigs in different intervals.

2.5. Alignment and Annotations of New Transcripts

HISAT2 was utilized to map the clean reads to the reference genome. ANNOVAR was used to annotate the reads for alignment based on the reference genome, and the priority annotation standards were the exon region, the shear zone, intron region and the gene spacing [42]. At the same time, the distribution of the region was calculated. All the mapped reads were assembled with StringTie to construct the transcripts [43]; then, the transcripts were combined into a comprehensive transcript set of every sample with the StringTie Merge tool. The new genes and transcripts were identified by comparing the integrated transcript sets with the reference transcript, for which the genome was annotated to obtain information. The encoding capacity of the new transcription proteins was evaluated using CPAT [44].

2.6. Expression Analysis

The transcripts per million (TPM) model was used in this study to evaluate the expression of each gene based on transcript abundance [45], and the transcript accounts of each gene were identified through htseq-count [46]. The gene differential expression analysis was selected by Deseq2 v1.10.1, which estimates size factors, and the nbinom test was conducted with a p-value threshold of less than 0.05 and fold changes greater than 2 or less than 0.5 for significantly different expressions [47]. The genes detected in three replicates were considered to be the most effective expressed gene. Gene expression was identified through the average of three replicates for DEGs between treatment and control samples. Fold change refers to the expression ratio between the treatment group and the control group. By screening the log2 fold change and false discovery rate (FDR), genes with significant differences in expression between different treatments could be obtained. Generally, at a standard fold change of less than or equal to four and FDR less than 0.001, both upregulated and downregulated genes were expressed when plants were exposed to salt treatment. The pathway analyses of GO [48] and KEGG [49] enrichment of DEGs were carried out and illustrated in R. GO enrichment analyses and pathway annotation were based on the Gene Ontology Database and KEGG pathway, respectively.

2.7. qRT-PCR Analysis

A total of 15 DEGs were selected for evaluating the sequencing accuracy, which represented significant variation among the treatment and control samples. The 15 DEG-related primers are detailed in Table 1, and two housekeeping actin genes, CsACT and CsEF2, were selected as the reference genes for normalization [50]. The qRT-PCR reactions were carried out in a total system volume of 20 μL (2 µL diluted cDNA, 1 µL forward primer, 1 µL reverse primer, 10 µL SYBR premix ex taq and 6 µL ddH2O). The parameters of the qRT-PCR program were set as follows: 95 °C for 3 min, followed by 30 cycles of 95 °C for 15 s, 60 °C for 30 s, and 72 °C for 20 s. Three technical replicates were calculated under the 2−∆∆c method, and the average of three biological replicates represents their relative expression levels.

3. Results

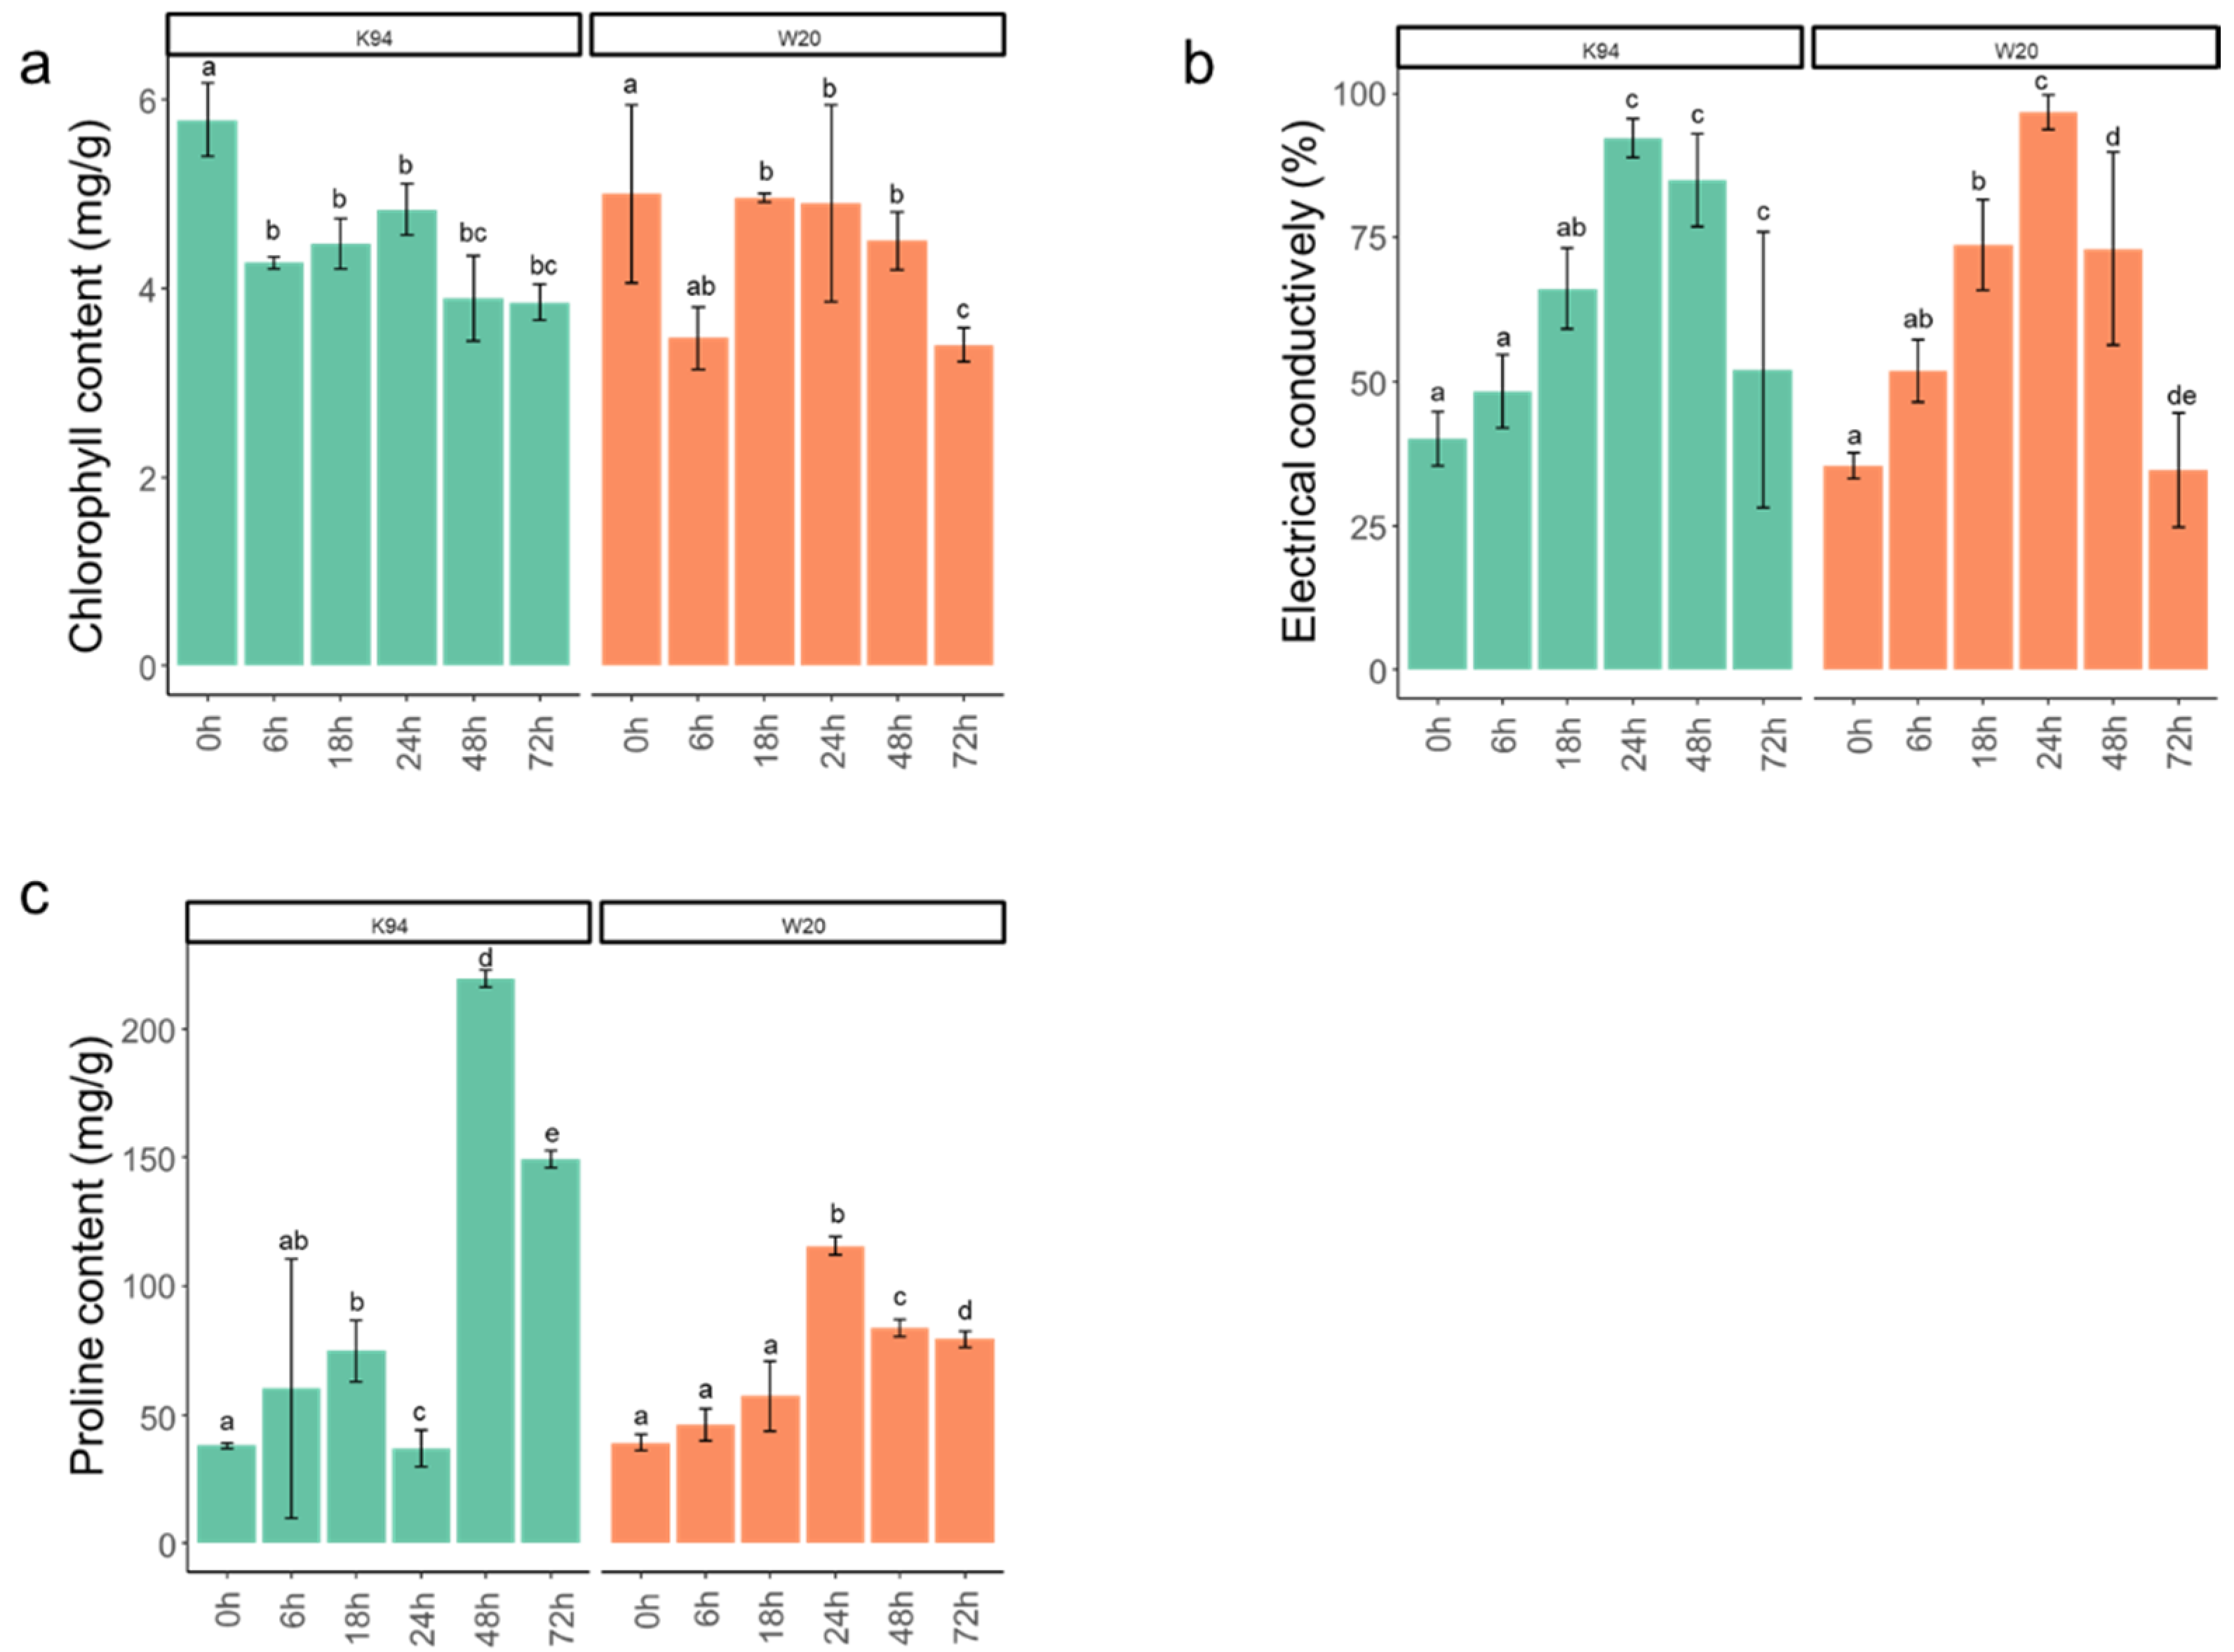
3.1. Physiological Analysis of Two Cannabis Seedling Varieties’ Responses to Salt Stress

First, at the seedlings stage, of cannabis varieties K94 and W20 were subjected to salt stress treatment of 100 mmol·L−1, which were sampled at 6 h, 18 h, 24 h, 2 days and 3 days after treatment, and sampling with no treatment was the control check (CK) in the greenhouse. The diverse variations in physiological and phenotypic responses to salt stress were investigated.
In both cannabis varieties, the chlorophyll content decreased significantly (p ≤ 0.05) in the first 6 h after salt treatment; the K94 variety reached an extremely remarkable level (p ≤ 0.01), then gradually recovered from 6 h to 24 h, and then decreased with prolonged exposure to salt stress (Figure 1a). Furthermore, the chlorophyll content reached its maximum levels 24 h after treatment in K94, whereas the maximum was reached after 18 h in W20. At 72 h after treatment, the chlorophyll content was decreased significantly in W20, but there was no significant change in K94. The results also indicated that photosynthesis was inhibited during the first 6 h, then recovered during the 6–24 h time period. Additionally, the degree of photosynthesis decreased significantly from 48 h to 72 h after treatment in W20, but not in K94.
Although exhibiting diverse physiologies, the results indicated that the two cannabis varieties responded in a similar trend to salt tolerance, with no significant differences in chlorophyll contents at different stages of treatments between K94 and W20. Electrical conductivity increased significantly with the duration of stress exposure during the first day after treatment, and reached maximum values after 24 h: 92.26% in K94 and 96.70% in W20. This trend in increasing electrical conductivity may be caused by the cell membrane being severely injured with increasing the time of salt exposure from treatment to 24 h afterwards, resulting in the outflowing of osmotic substances. Subsequently, the value gradually decreased during the next two days, potentially because the plant recovered with the salt treatment (Figure 1b). This trend indicated that the electrical conductivity of the two varieties was increasing after salt stress at first, reached the maximum after 24 h, and then decreased.
The proline contents exhibited different trends in the two varieties: it increased between 0 h (CK) and 6 h, reaching a peak at 6 h, decreased until 24 h, then rose and reached the maximum value at 48 h before decreasing in K94; however, the content of proline increased (from 0 to 24 h) and then decreased (from 24 to 72 h) in W20 (Figure 1c). Proline is one substance which can regulate abiotic stress in plants [51]. The diversities in proline content indicated that at the times of 48 h after treatment in variety K94 and 24 h after treatment in variety W20, there were sharp increases in the amount of proline content accumulated. Both reached extremely remarkable levels (p ≤ 0.01); then, the proline contents both decreased.

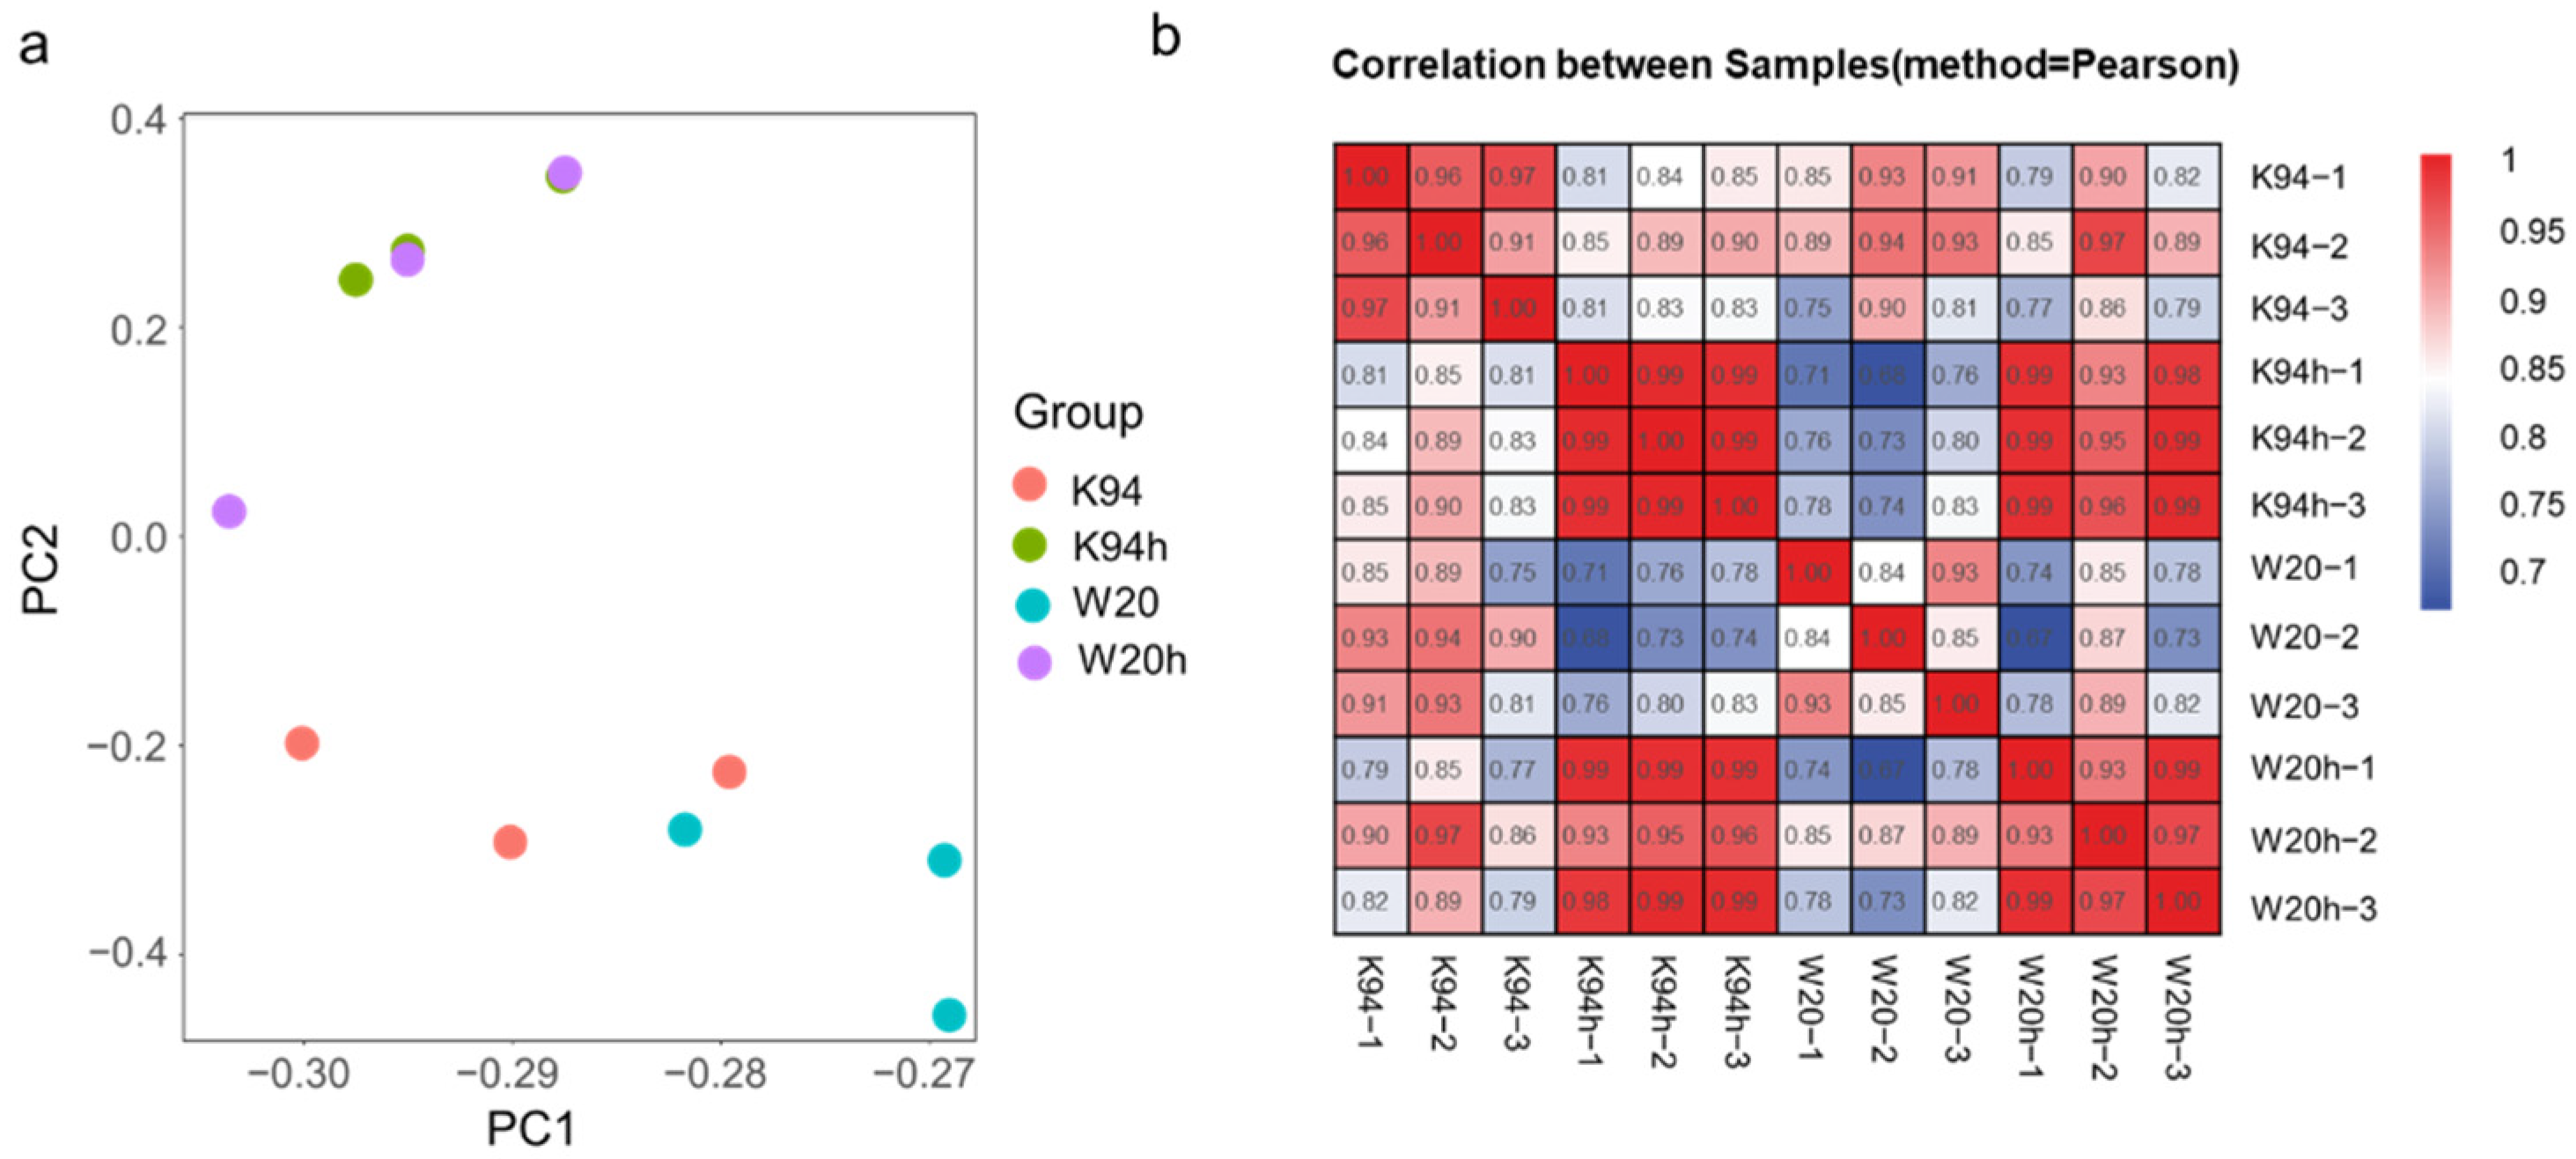
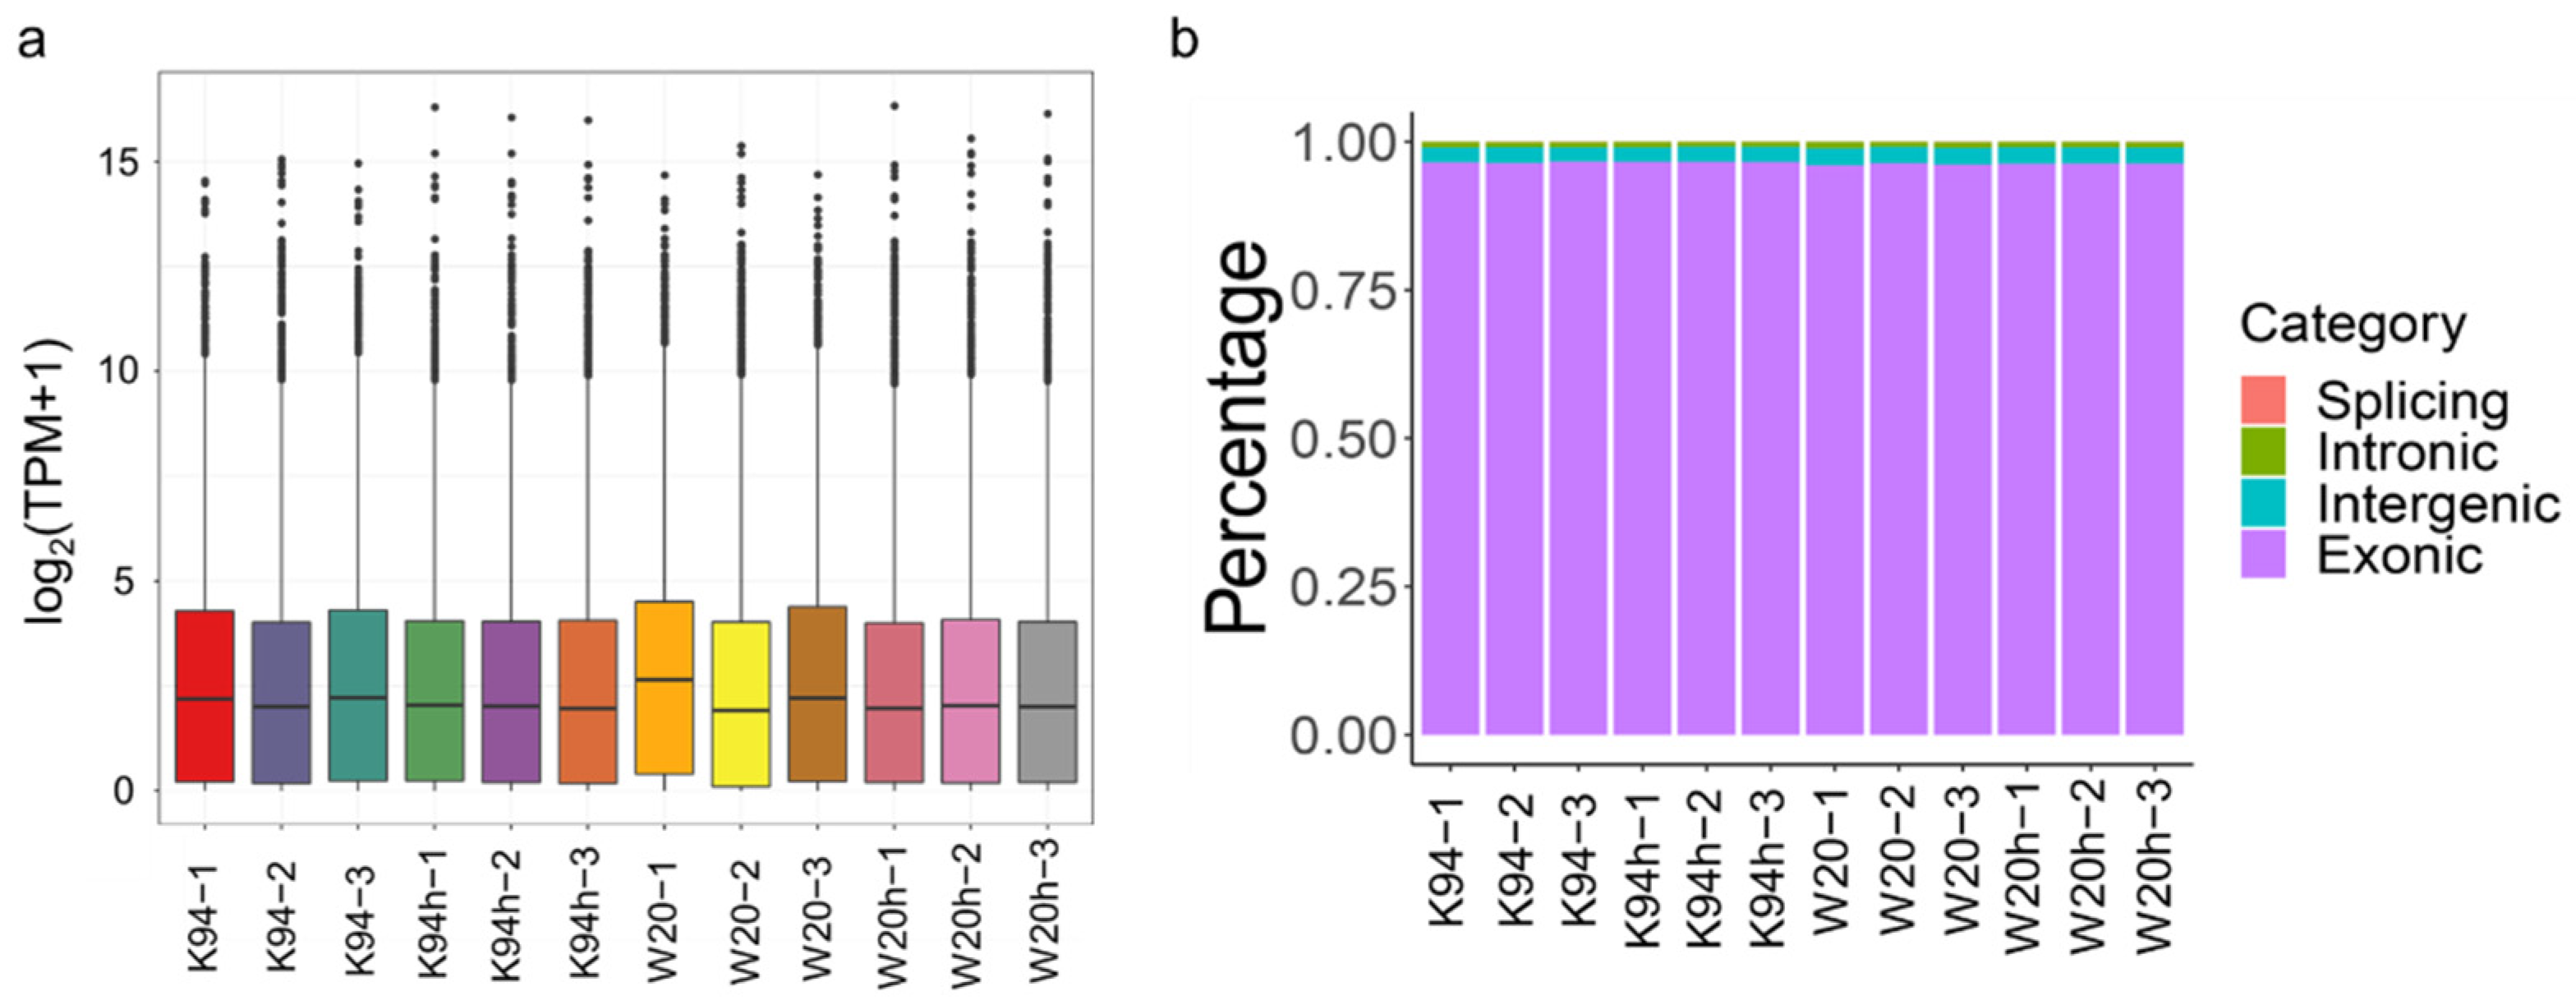
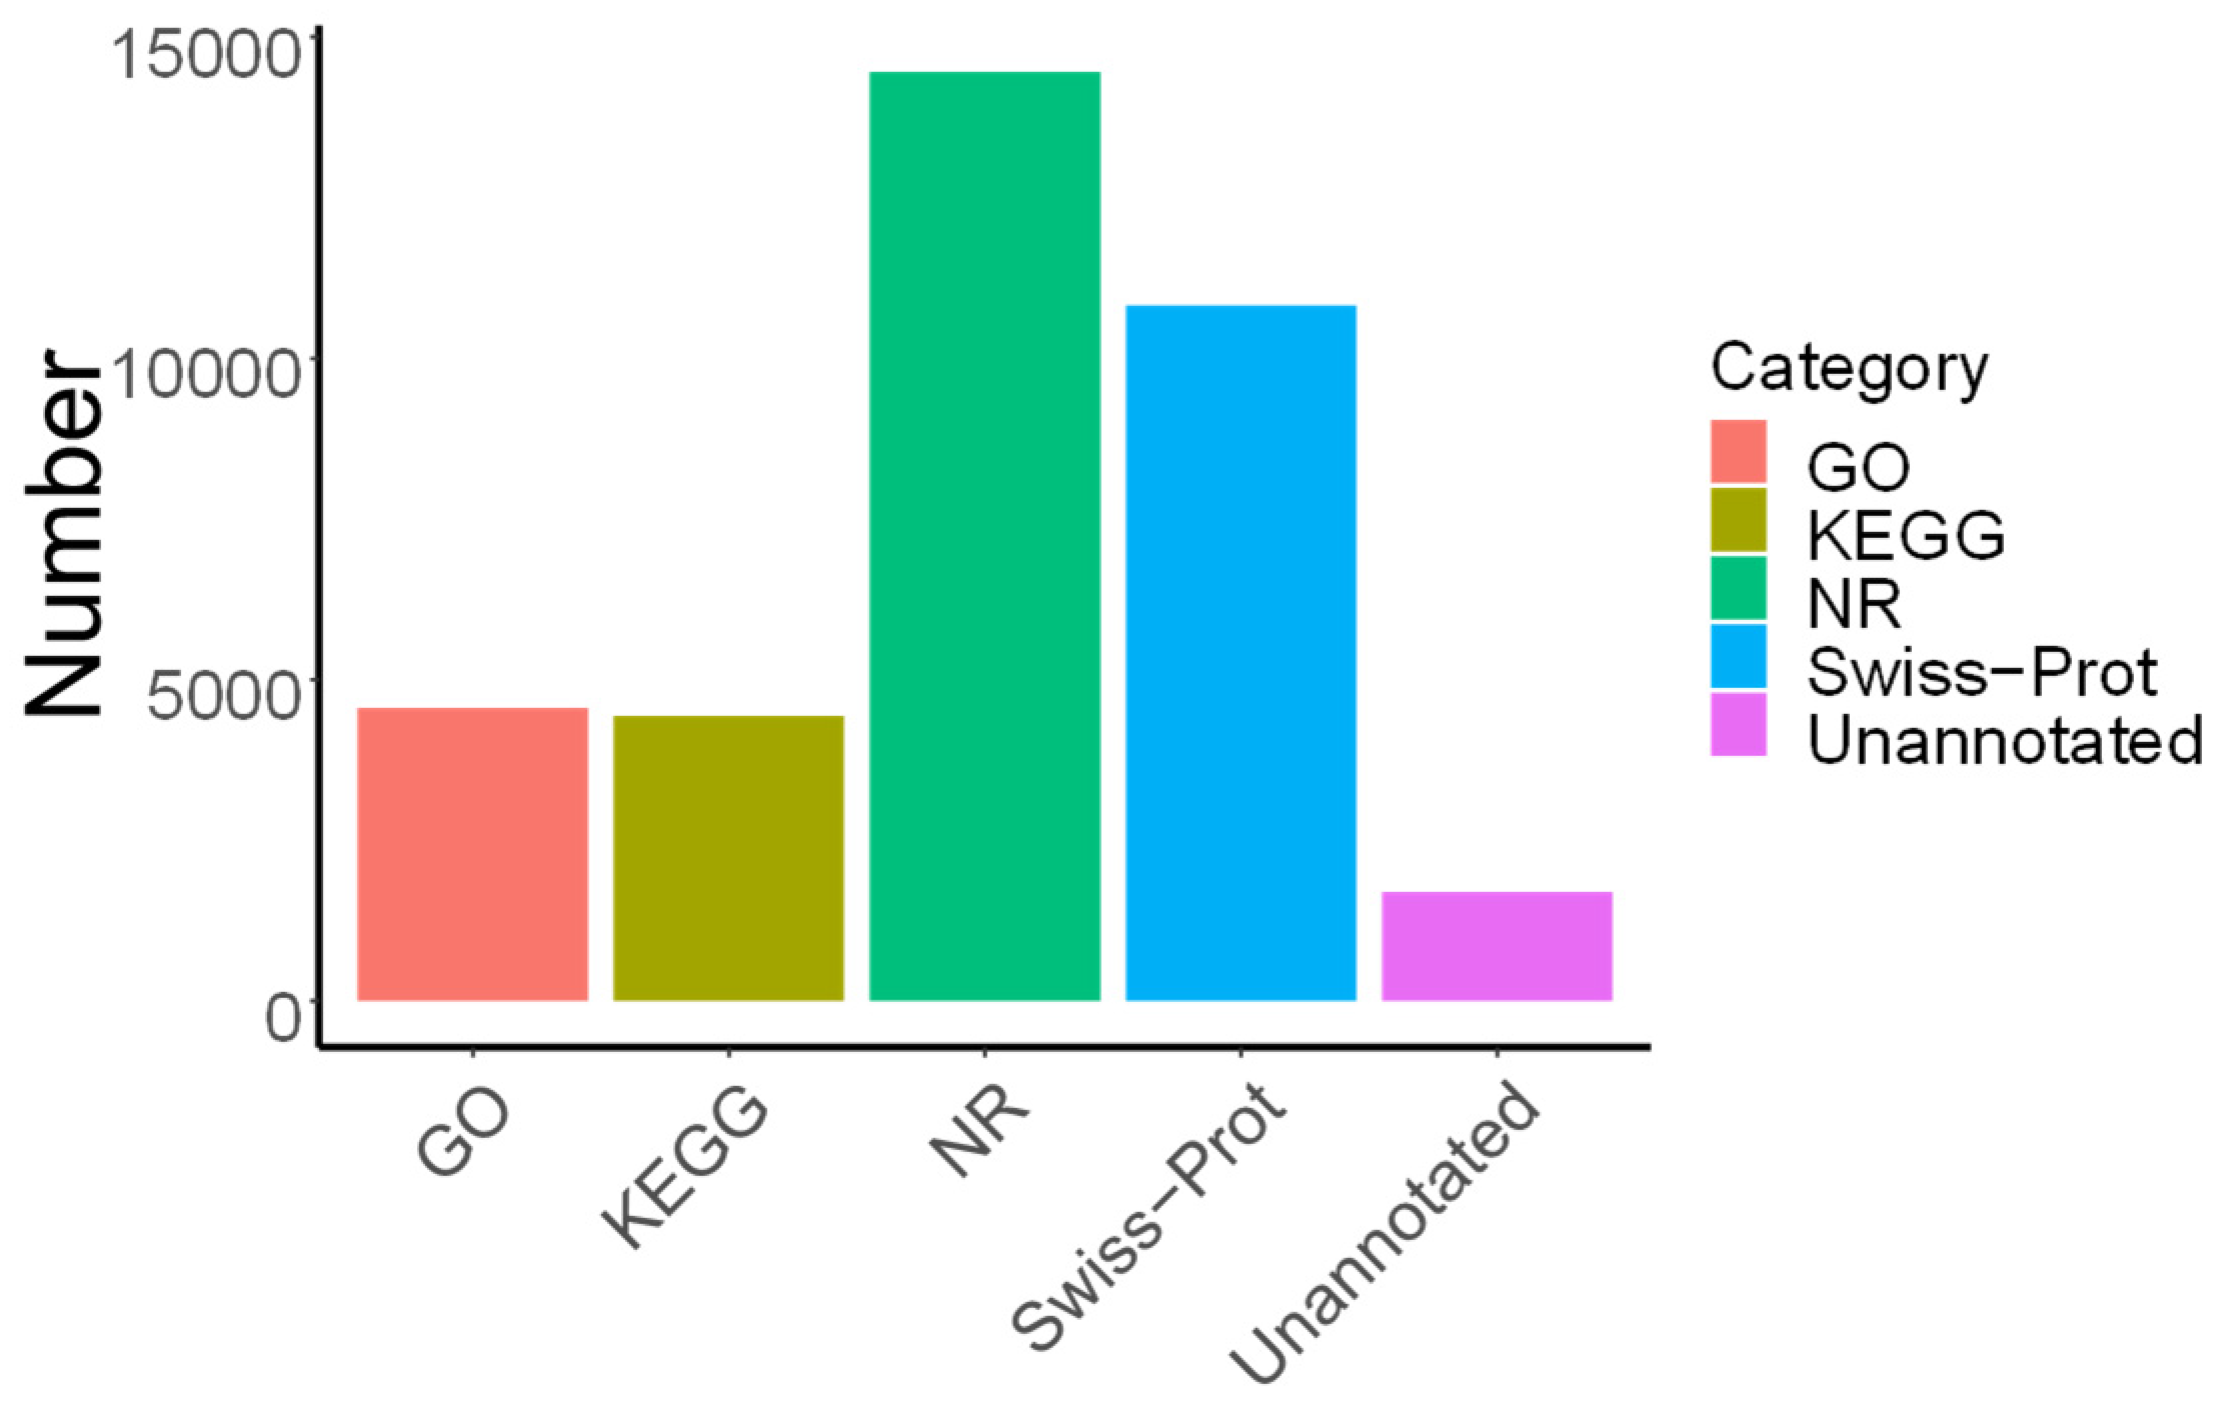
3.2. Transcriptome Sequencing Analysis

RNA extracted from the tender leaves at the cannabis seedling stage indicated that the no-treatment control samples had suffered from salt treatment. For this study, six samples of cannabis K94 (K94-1, K94-2, K94-3, K94h-1, K94h-2 and K94h-3) and six samples of cannabis W20 (W20-1, W20-2, W20-3, W20h-1, W20h-2 and W20h-3) were categorized into four groups. Samples K94-1, K94-2 and K94-3 were considered as controls, receiving no treatment, whereas samples K94h-1, K94h-2 and K94h-3 received the salt treatment regimen. Cannabis varieties W20-1, W20-2 and W20-3, as well as W20h-1, W20h-2 and W20h-3, were also categorized as control and salt treatment samples, respectively. The cDNA libraries were prepared for all 12 samples, and then sequencing was conducted on the Illumina PE150 platform (San Diego, CA, USA).
RNA-seq reads generated data for cannabis varieties K94 and W20. To ensure the accuracy of the results, three sequenced samples were randomly selected at the same stage of sampling as a biological replicate. Four categories were severed from two different varieties; in total, 12 independent RNA libraries were prepared and sequenced. Overall, 32.76 Gb of clean data were generated, and the volume of effective data for each sample ranged from 4.06 Gb to 4.22 Gb after removing the adaptor and filtering the low-quality reads with Trimmomatic software. After trimming, the GC contents in samples ranged from 43.52% to 44.14%, with an average of 44.87%; the Q30 index ranged from 91.96% to 92.35% (Table 2). All clean reads were mapped to the genome of the assembly number was GCA_900626175.2 with TopHat2 software [52]; the results showed that the average coverages of the four categories were 84.45%, 83.61%, 84.12% and 85.20%, and the trimmed high-quality reads were mapped at unique positions in the gene set of the reference genome.
A principal component analysis (PCA) was performed to verify the repeatability and reliability of the results; this indicated that the samples had extensive and diverse variations, and performing repetitions with the samples indicated relatively good repeatability of the analysis (Figure 2a). The results of expression pattern relationships between repetitions and treatments indicated that there was significant separation between the two cannabis varieties; additionally, there was significant separation between the samples before and after treatment. The repetitions between each treatment were clustered together, which indicated that the experimental procedure had relatively good repeatability and reliability (Figure 2b).
The transcript abundance of each expression genes was evaluated with the transcripts per million (TPM) model, and a total of 31,735 expression genes were identified. The expression levels among different samples were analyzed, with the results showing that there were rarely differences in the expression levels in all samples. The samples with the maximum expression values were W20 varieties before treatment (Figure 3a). The majority of transcripts in all samples were located in the exon region, as per the gene annotation (Figure 3b). There was also a situation where some transcripts were located in the intergenic region, with the second highest percentage of genes located in these intergenic regions, which indicated that the cannabis genome was insufficient. Otherwise, it was also identified that some transcript annotations were in the intronic region, although the percentage was relatively low, which may have been the result of alternative splicing, because the main type of alternative splicing was intron retention in plants [53].
There were also numerous reads which failed to map the cannabis genome; novel transcripts were assembled with Stringtie v1.3.6 software, and a total of 16,149 novel transcripts were identified, along with 11,304 annotations of 5392 known genes, accounting for 70.00% of new transcripts. This study also predicted the protein coding ability of new transcripts by software CPAT v1.2.4, a total of 6032, accounting for 37.35% of novel transcripts, were predicted to be lncRNAs. The novel transcripts were annotated by NR, GO, KEGG and Swiss-Prot database, with the maximum proportion of annotation performed with NR blast, which could annotate 89.50% of the new transcripts with the NR database, followed by Swiss-Prot (67.00%), GO (28.27%) and KEGG (27.44%) (Figure 4).

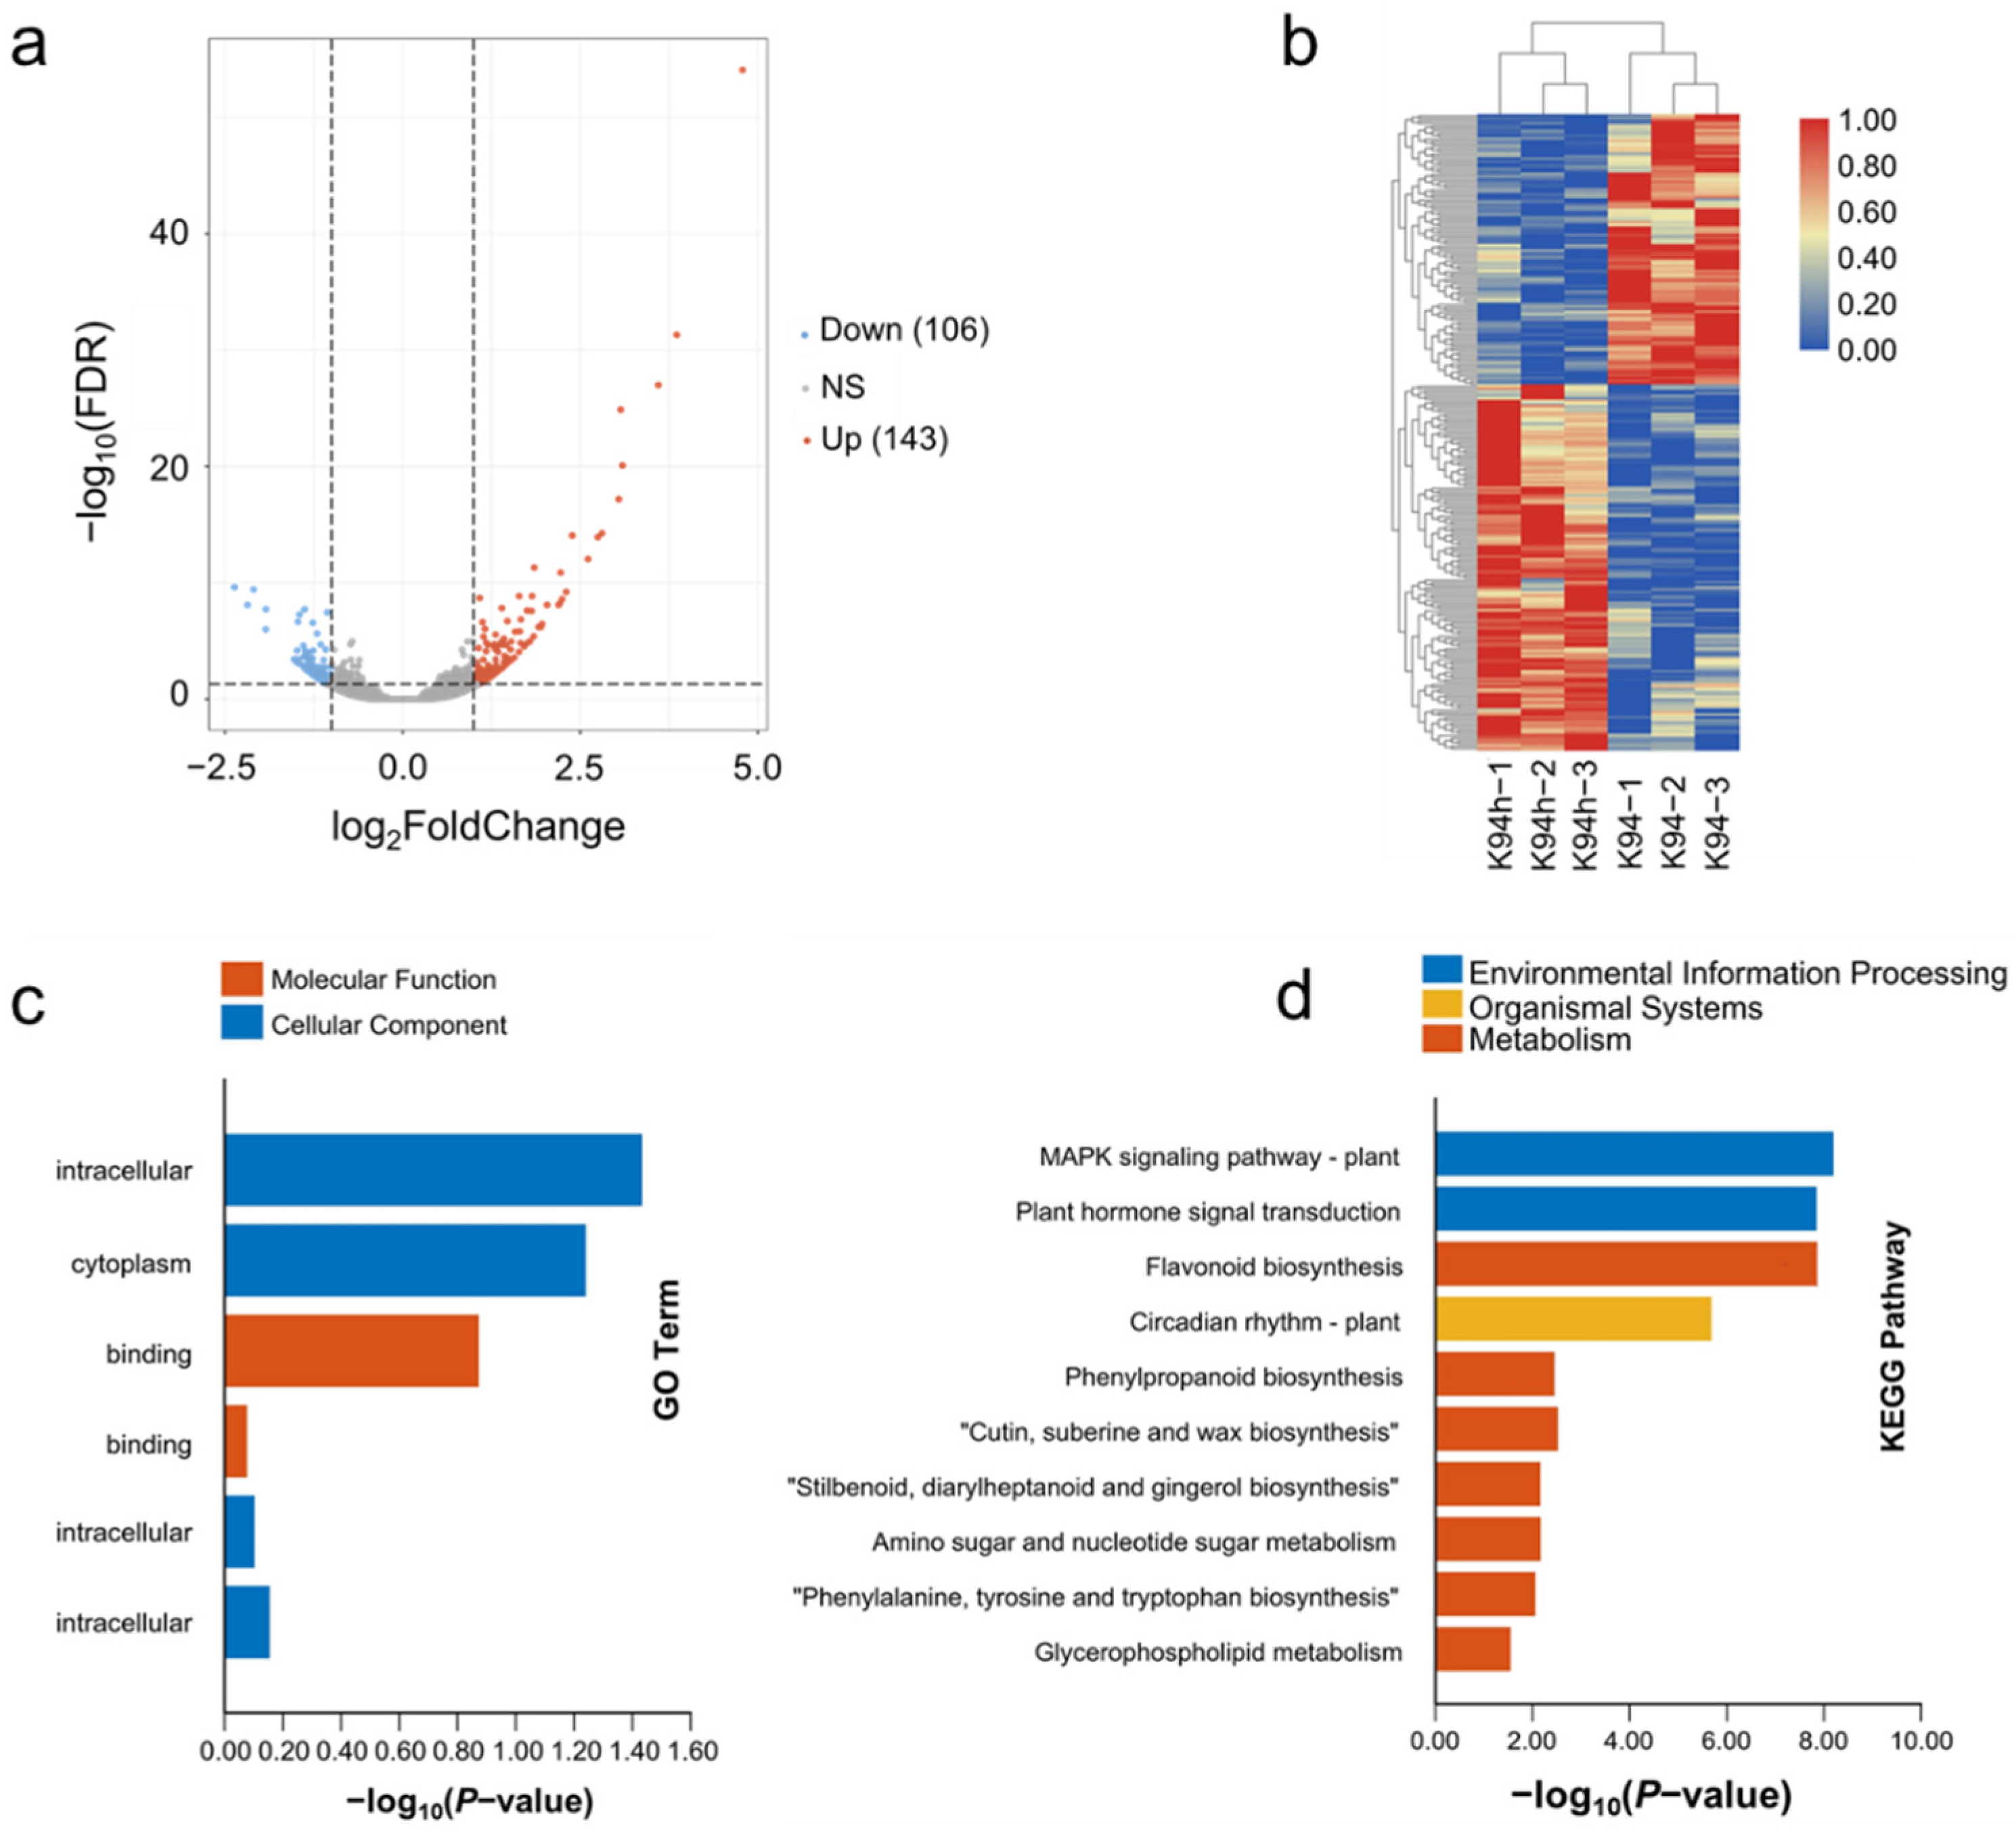
3.3. The Expression Pattern of the Differential Expression Genes Analyzed in K94

The differential expression genes (DEGs) were identified with Deseq2 v1.10.1 software. A total of 249 differentially expressed genes with significant variation were identified before and after treatment with K94, in which 143 genes were upregulated and 106 genes were downregulated (Figure 5a). The number of upregulated DEGs was greater than the number of downregulated DEGs in the clustering analysis (Figure 5b). The clusters analysis of the samples based on the expression was divided into two categories, which divided the samples into controls and treatment of variety K94. All the DEGs’ broad biological functions were determined and unique DEGs were identified by Gene Ontology (GO) enrichment analysis. The results based on the DEGs in the K94 variety showed that the vacuole, cytosol, mitochondrion and lysosome were enriched with the top cellular component, and DNA binding and RNA binding were enriched with the top molecular function (Figure 5c). Further KEGG (Kyoto Encyclopedia of Genes and Genomes) enrichment analyses were conducted; the results indicated that 18 pathways were significantly enriched, based on the 0.05 threshold Q-value, and the top 10 pathways are illustrated in Figure 5d. The pathways of peroxisome, plant hormone signal transduction, flavonoid biosynthesis and plant circadian rhythm were the most enriched cellular processes; environment information processing, metabolism and organismal systems were also enriched. In our study, environmental information processing was the focus; the plant hormone signal transduction pathway and MAPK signaling pathway were the most enriched pathways.
There was diverse variation in the expression profiles of DEGs which were related to the plant hormone signal transduction pathway through KEGG enrichment (Figure 6a). The results showed that nine DEGs exhibited significant variations in expression, where five of them were downregulated and four were upregulated. One of them was the novel gene, in which the expression was also significantly decreased after salt treatment. We also analyzed the expression variation of DEGs which were associated with the MAPK signaling pathway, and the results showed that six DEGs were significantly enriched in this pathway, where two of them were downregulated and four were upregulated. One of the DEGs was the novel gene. There were more upregulated genes than downregulated genes with the MAPK signaling pathway (Figure 6b); there were more downregulated genes in the pathway of plant hormone signal transduction. It was interesting that there were five overlapping DEGs, which was related to both pathways; these may be the pathways with the closest relationship to cannabis responses to salt stress.

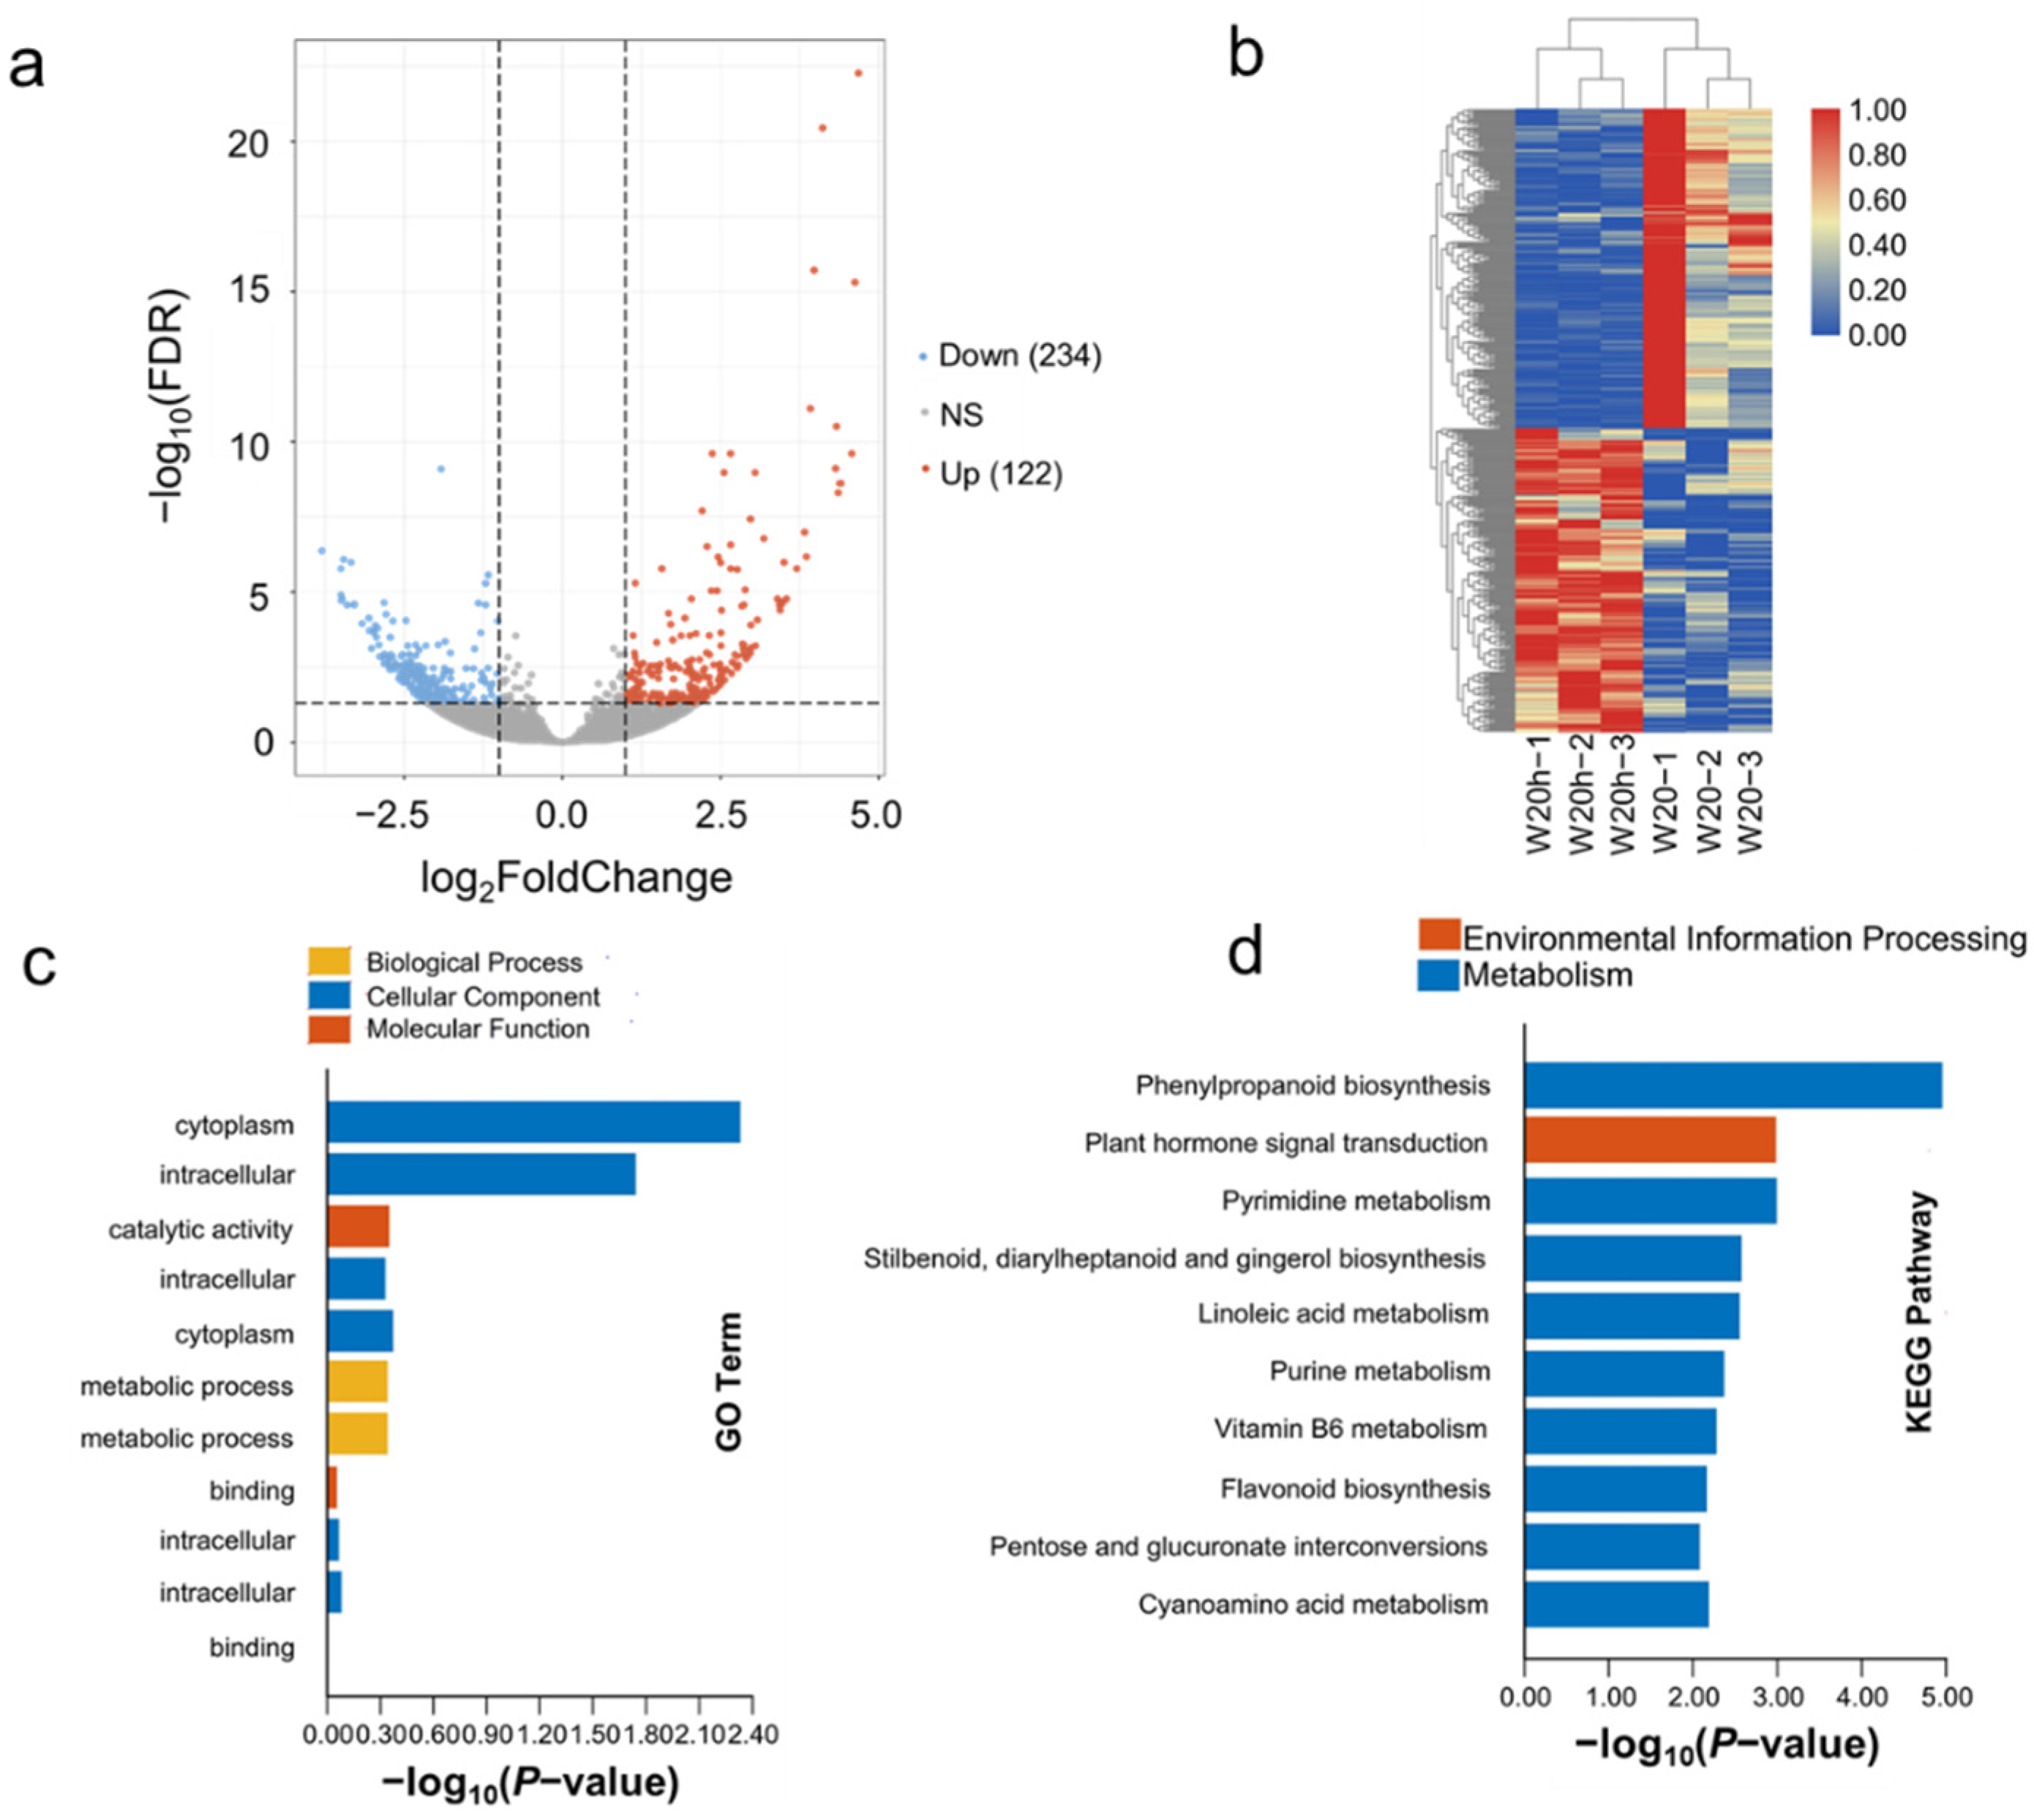
3.4. The Expression Pattern of DEGs Analyzed in W20

There were 456 DEGs identified, with significant variation in DEG expression after salt treatment in W20: 122 upregulated genes and 234 downregulated genes (Figure 7a). The upregulated and downregulated DEGs were divided into two categories based on the expression profile. The heatmaps of the DEGs’ expression levels indicated that the samples were clustered in two categories, dividing control and treatment samples. The expression profiles of downregulated DEGs in W20 were at extremely high levels (Figure 7b).
Analysis of GO enrichment (Figure 7c) showed that the intracellular cytoplasm, related with the cellular component; the catalytic activity, binding of which is related to molecular functions; and the metabolic process, i.e., the biological process, were significantly enriched. Combining this with the results of the KEGG enrichment (Figure 7d) indicated that the phenylpropanoid biosynthesis pathway, plant hormone signal transduction, pyrimidine metabolism and linoleic acid metabolism were significantly enriched.
DEGs related to the phenylpropanoid biosynthesis pathway (Figure 8a) and plant hormone signal transduction pathway (Figure 8b) exhibited expression patterns. There were nine DEGs related to the phenylpropanoid biosynthesis, three of which were upregulated genes, and six were downregulated genes in comparison to the expression levels between control and treatment samples in W20. There were seven DEGs related to the plant hormone signal transduction pathway, all of which were downregulated. The DEGs did not overlap between two pathways, which indicated the high diversity variations for responding to salt treatment in W20.

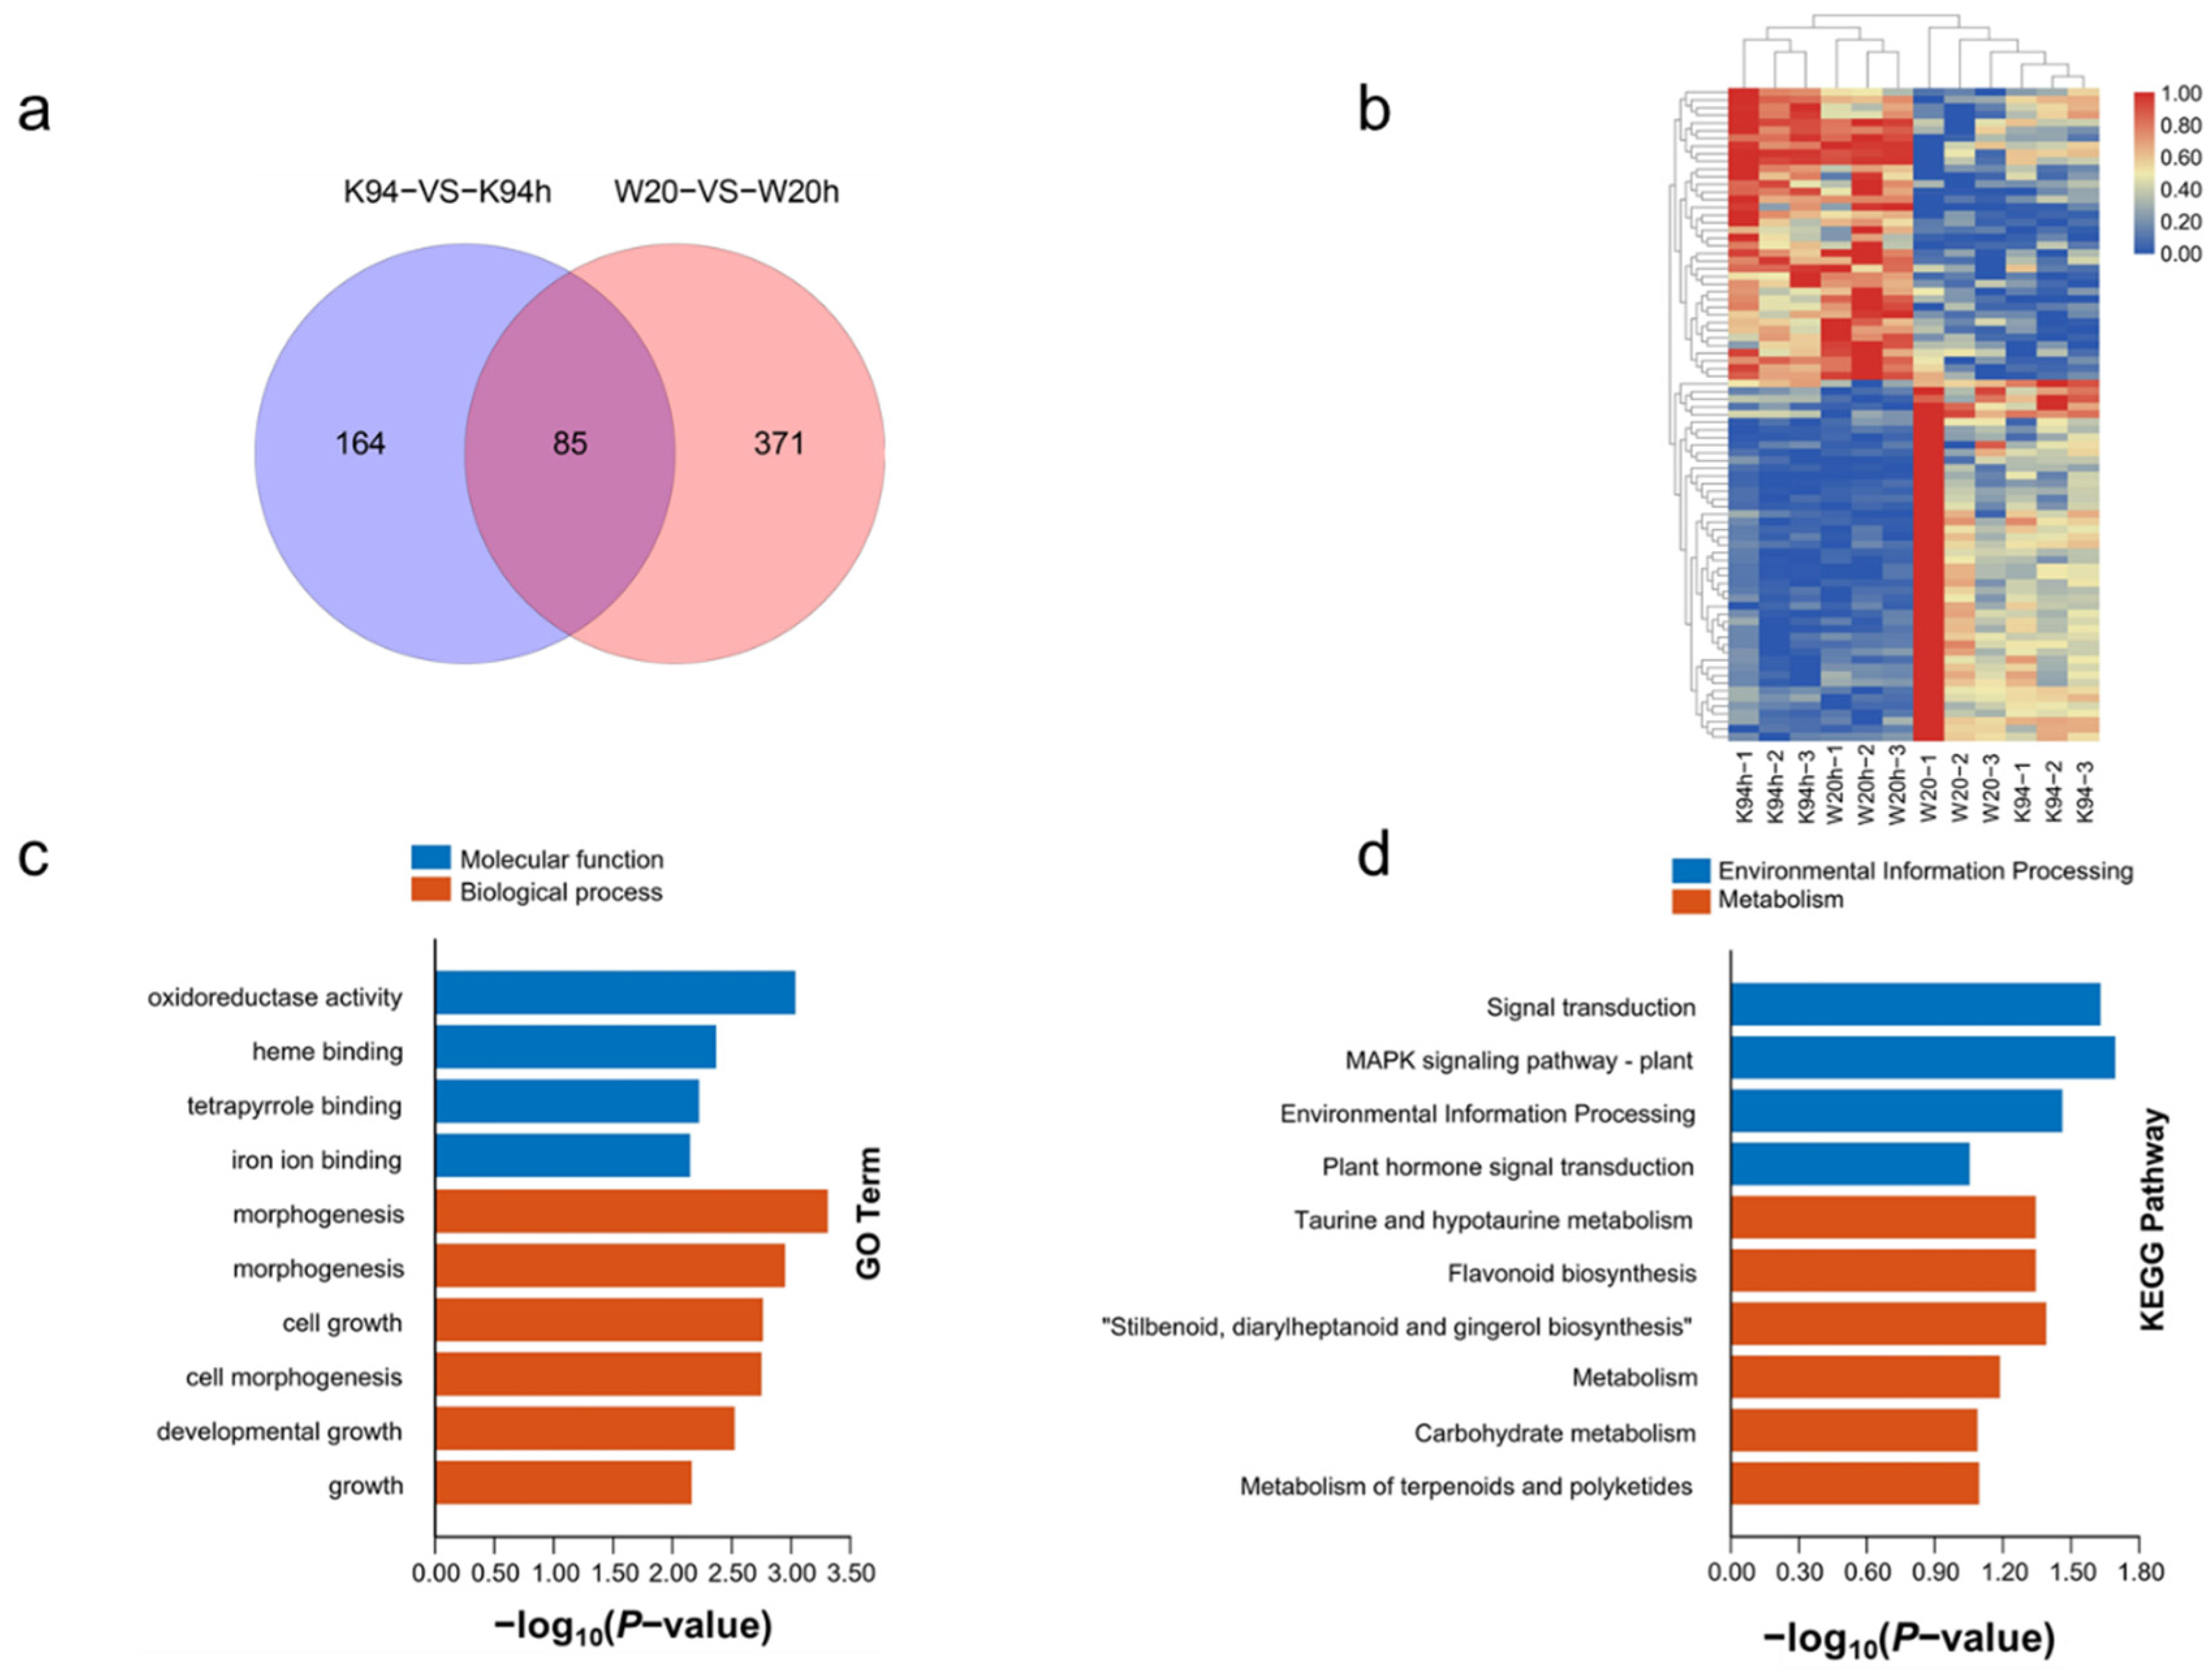
3.5. Identification of DEGs between K94 and W20

There were 85 DEGs overlapping K94 and W20 among the control and treatment samples for responding to salt treatment (Figure 9a). The heatmap shows that some DEGs significantly reduced the expression levels among the control samples in comparison to treatment samples. There were more downregulated DEGs than the upregulated DEGs (Figure 9b). The downregulated DEGs in the W20-1 sample had the highest expression level in comparison with the other 11 samples. The oxidoreductase activity, heme binding, etc., related to the molecular function (Figure 9c); and morphogenesis, cell growth, etc., related to the biological process, were identified through GO enrichment for the responses to salt treatment in K94 and W20 cannabis varieties. The signal transduction pathway, MAPK signaling pathway and plant hormone signal transduction were related to salt tolerance, based on the KEGG enrichment analysis (Figure 9d). The MAPK signaling pathway and plant hormone signal transduction were identified to overlap in K94 and W20.
The expression patterns of the DEGs which were related to the signal transduction pathway, MAPK signaling pathway, environmental information processing and plant hormone signal transduction are presented in Figure 10a–d. Interestingly, the DEGs which were related to the signal transduction pathway and MAPK signaling pathway were the same: three were upregulated and two were downregulated. The DEGs related to other pathway expression profiles were the same 5 genes, which showed that these DEGs with significantly diverse variations in expression levels which could enriched two different pathways. This result may indicate that these five DEGs which regulated the mechanism presented different capacities for responding to the salt treatment in cannabis.

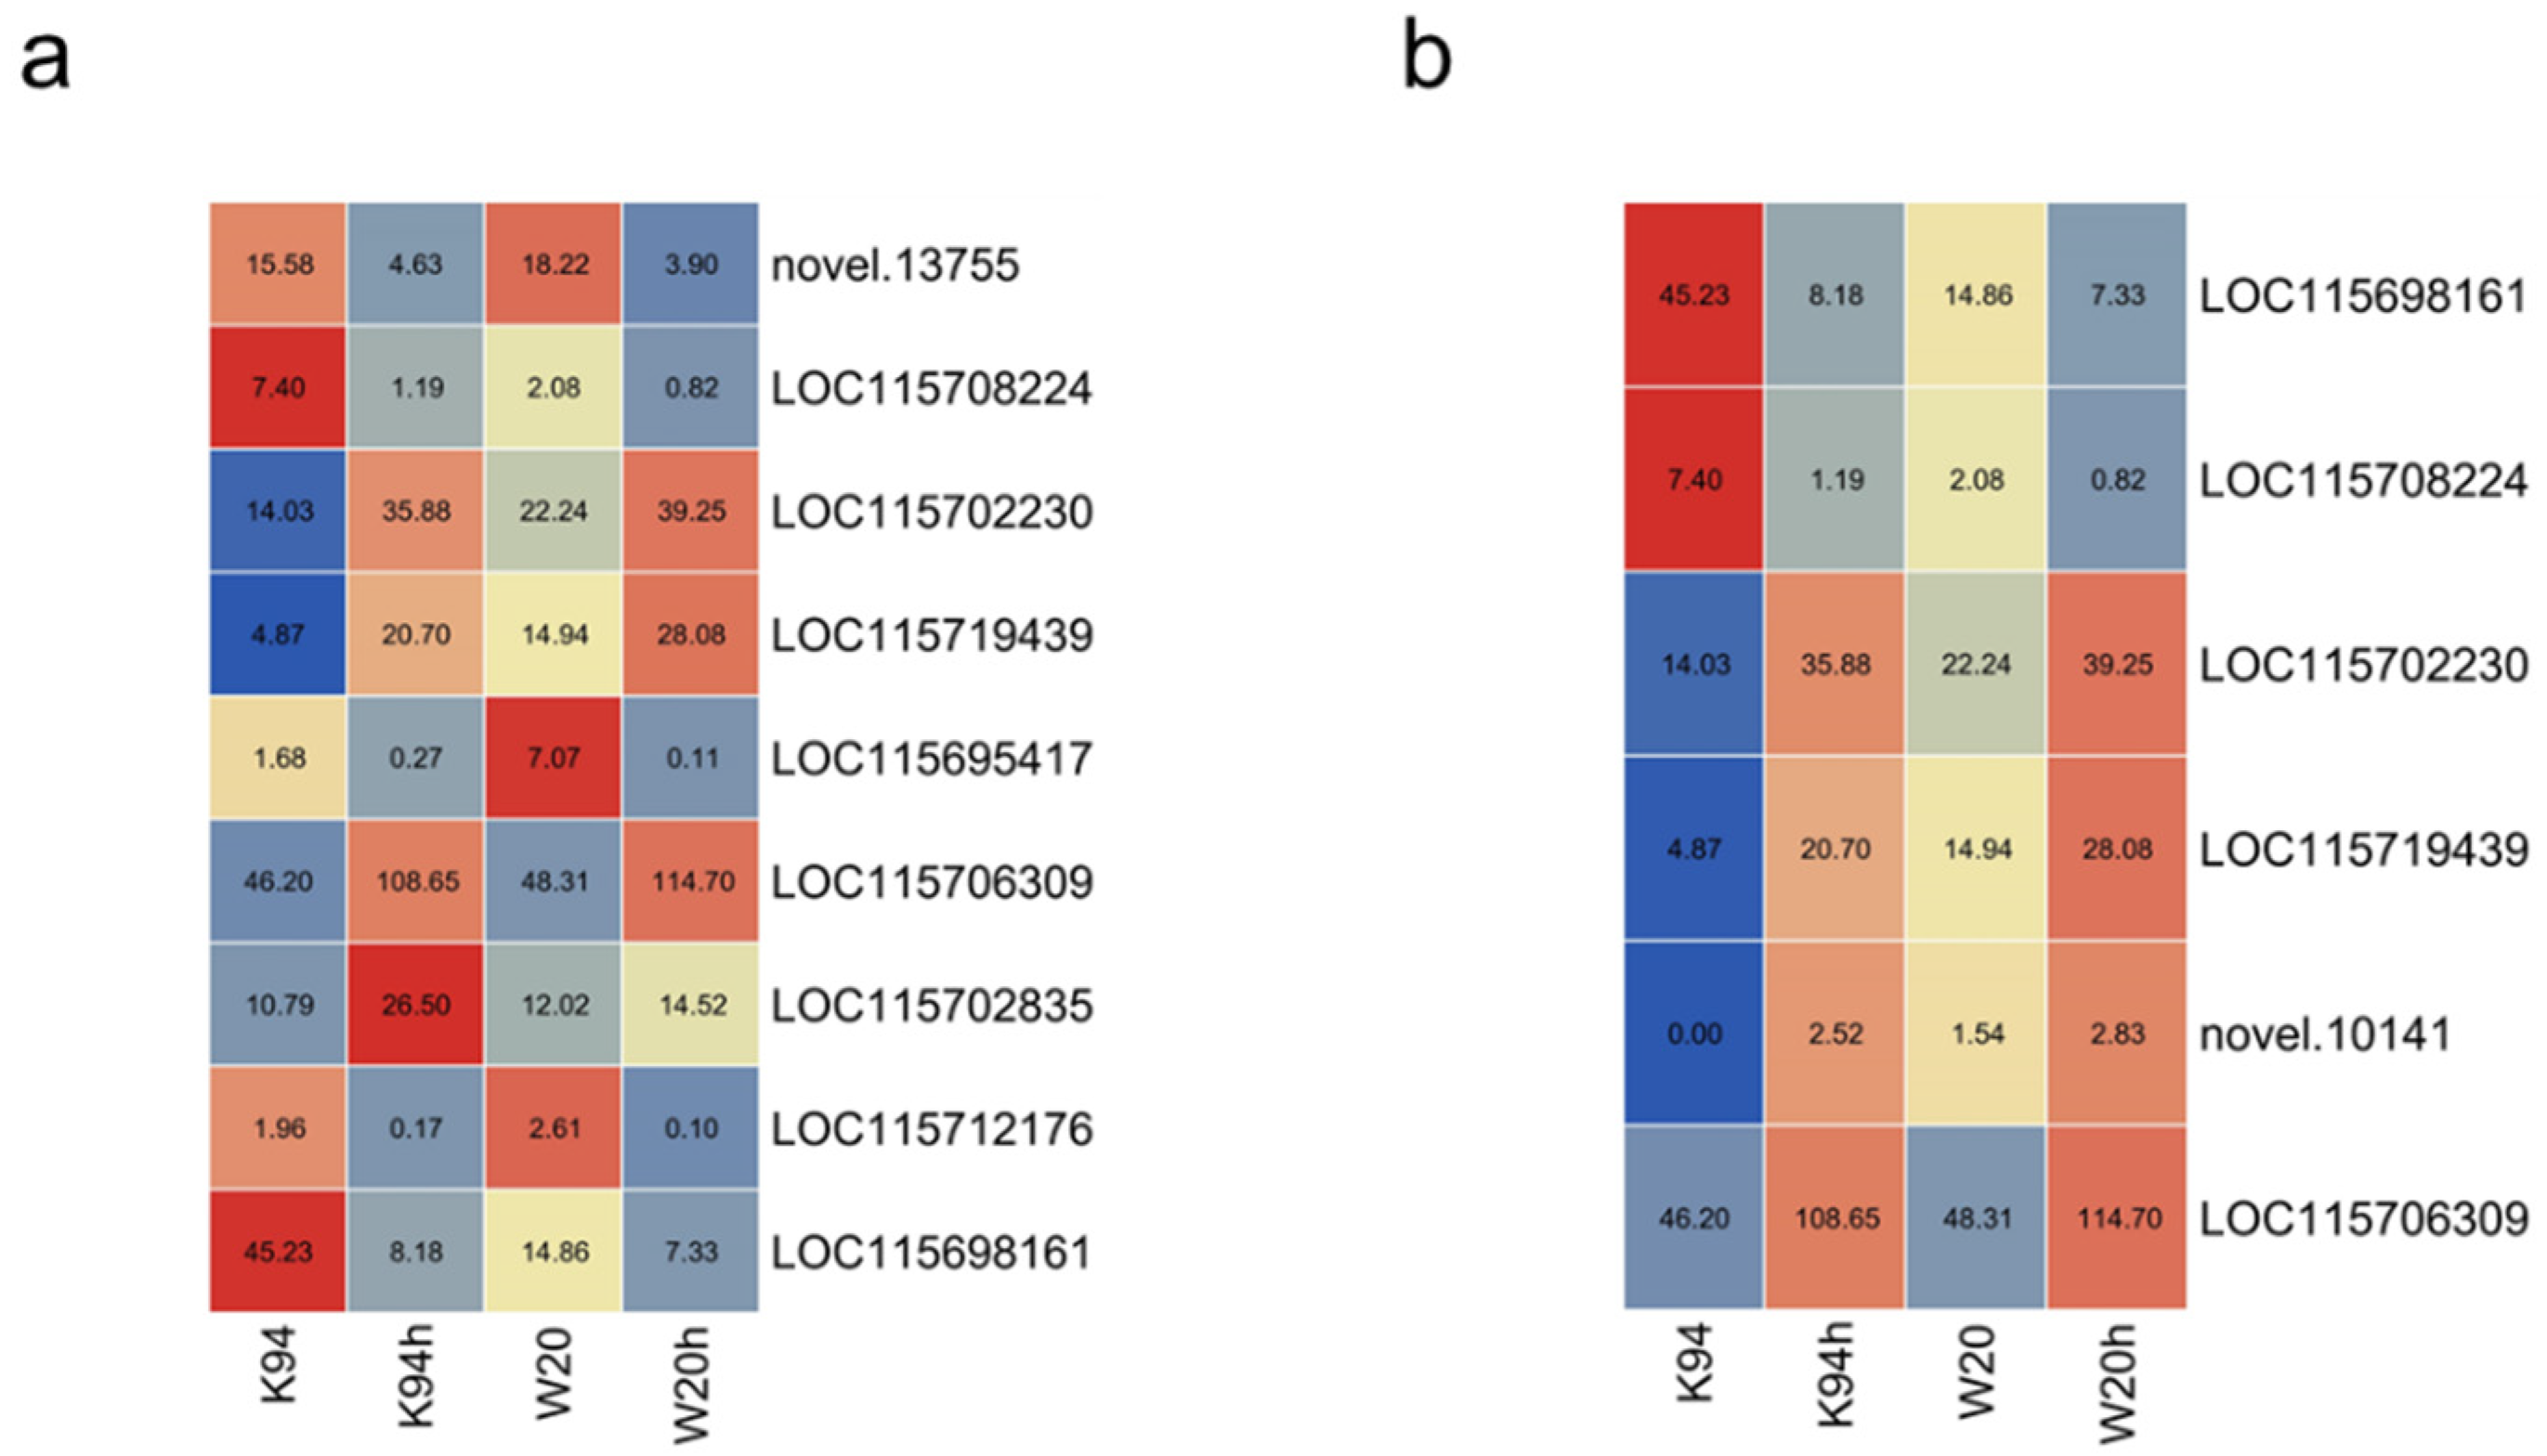
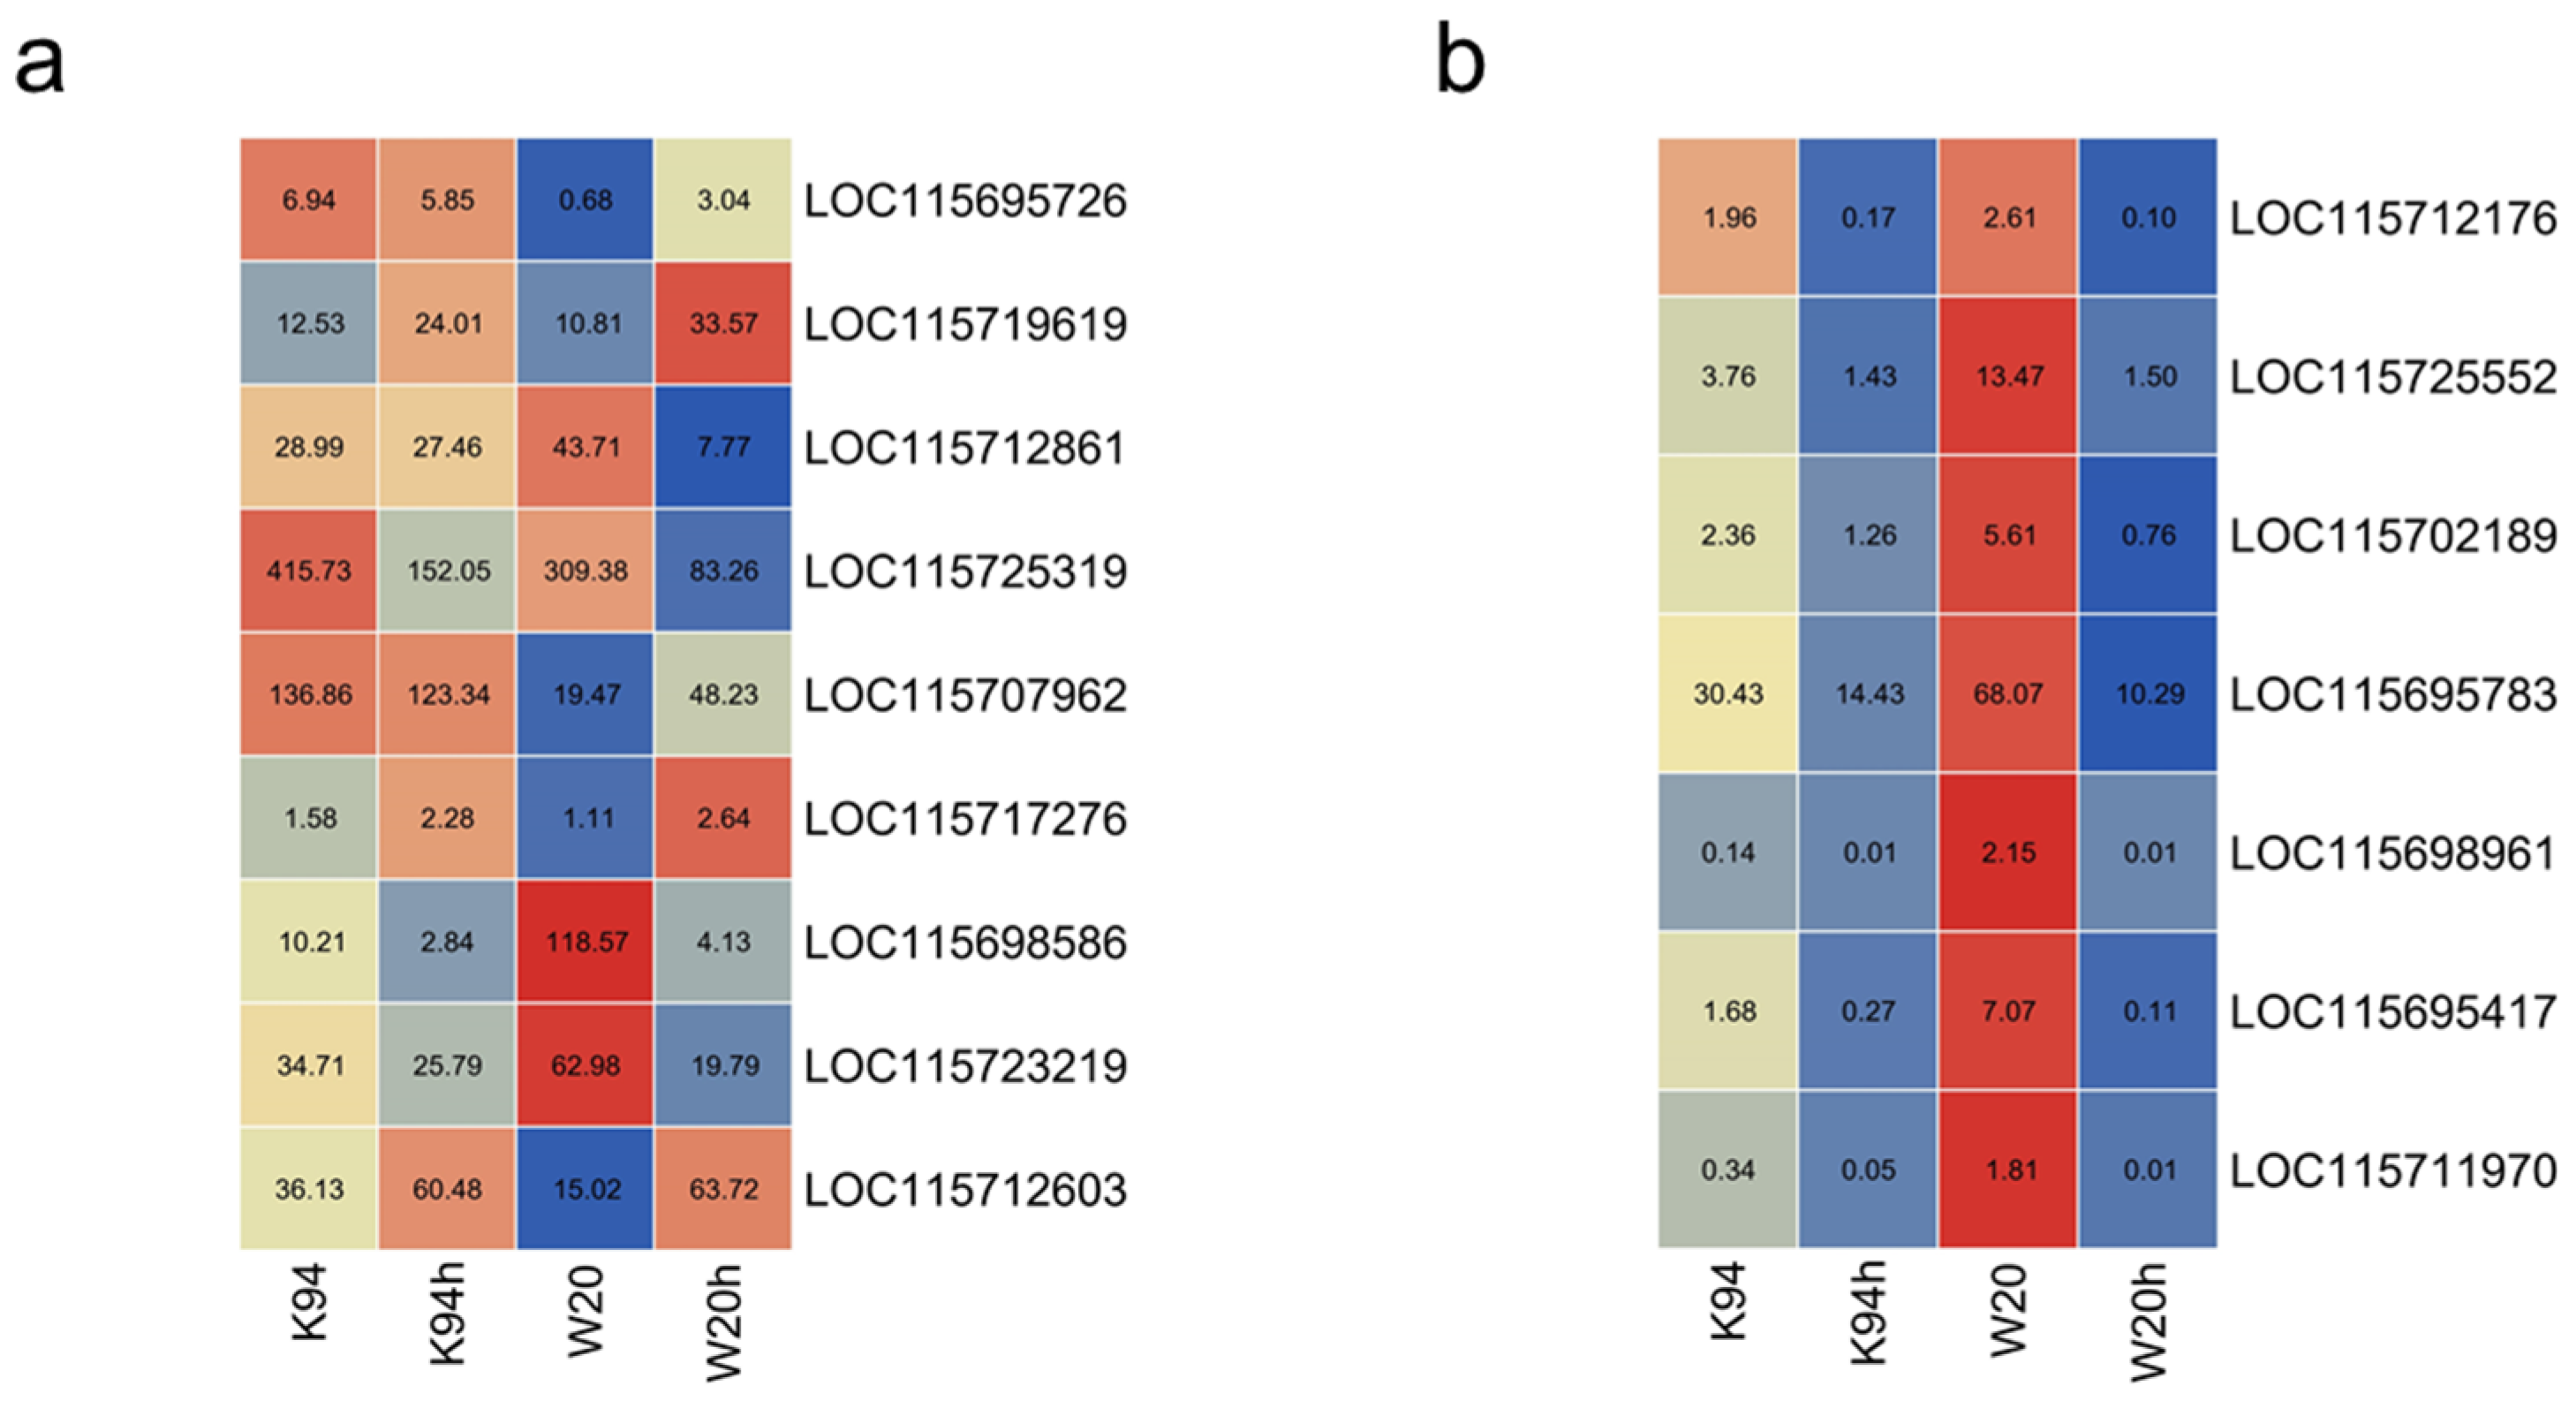
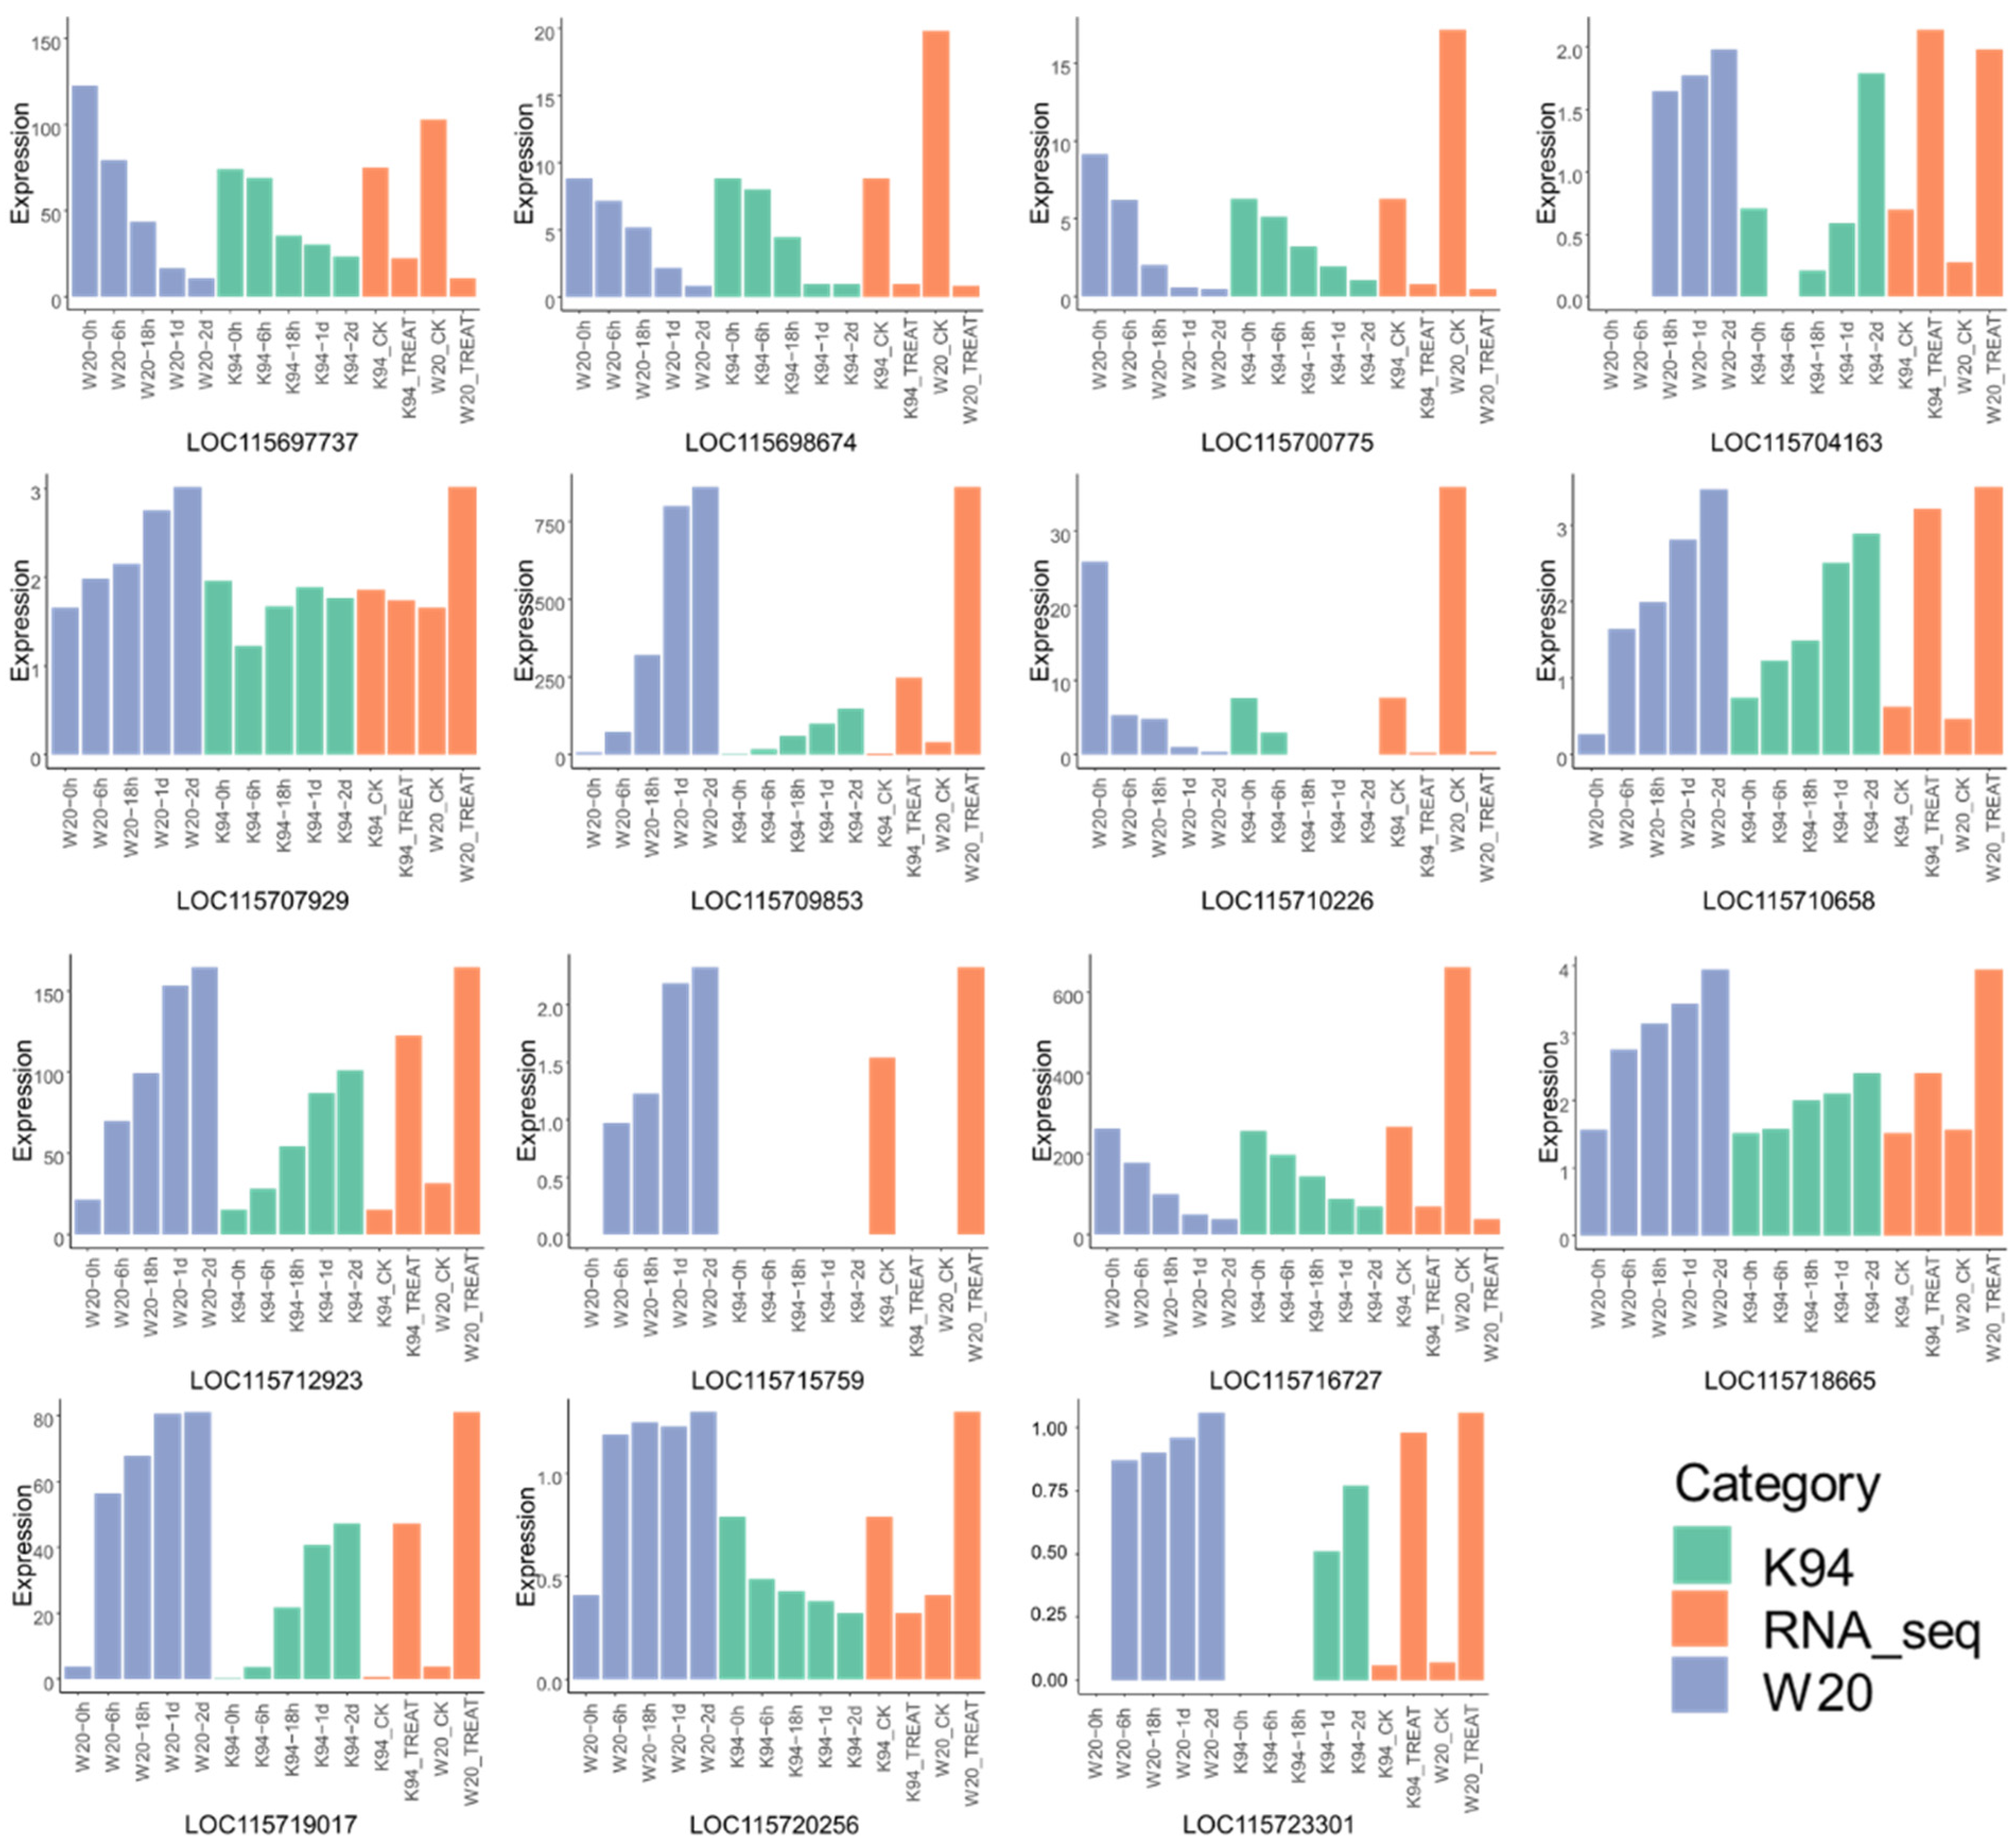
3.6. Comparison of DEG Tag Data with qRT-PCR

To validate the expression profiles obtained by RNA-seq, real-time PCR was carried out to identify the 15 DEGs that exhibited significant variation in expression between control and treatment samples (Figure 11). The DEGs which were selected had great variation in expression before and after the salt treatment. Overall, thirteen DEGs had the same variation trends in the TPM, with two other DEGs which had different patterns were identified in the RNA-seq profile analysis among the control and treatment samples. The 86.67% agreement of the RNA-seq with the qRT-PCR illustrated the high accuracy of RNA-seq, which indicated that the pathway and candidate DEGs which were identified were reliable for the salt stress response in cannabis. There were no expression levels detected for genes in some samples, indicating that the DEGs were not expressed at that stage. The expression levels of DEGs LOC115697737, LOC115698674, LOC115710226, LOC115716727 and LOC115700775 were accompanied by decreasing variation with the time of salt treatment; the expression levels were relatively low between 1 day and 2 days after treatment. Eight DEGs exhibited a gradual decline in expression level after the salt stress; the same was observed with the TPM level. There was no detected expression level of LOC115704163 at the time of 0 h or 6 h in W20, and 6 h in K94, indicating that the DEG was not expressed until responding to the salt stress in W20; the expression level of this DEG decreased first and then increased in K94, with the level especially low between 0 h and 6 h. With the same trend in other DEGs, the expression level in LOC115709853 similarly increased after salt treatment. The expression levels of LOC115715759 and LOC115707929 were not consistent with the TPM values. Interestingly, there were variations in the expression levels in LOC115715759; the expression was gradually increased in W20 after salt treatment, but the expression levels were not detected in K94.

4. Discussion

Over 20% of the agricultural land around the world is affected by soil salinization [54], which seriously affects crop yields and security. Some researchers have divided plants into two categories based on their capacity of responding to salt stress: halophytic and glycophytic [55]. Those in the halophyte category could adapt to the salinized environment and have a high capacity to cope with soil salinization; in contrast, those in the glycophyte category are severely damaged by a salinized environment.
Under salt stress, plants are affected at every stage of growth. Salt toxicity to plants mainly includes osmotic and ionic stress, reactive oxygen species (ROS), and nutrient depletion. When the salt content of soil is increased, the water potential of the soil is lower than that of the plant root tissue, resulting in plant dehydration [56,57,58]. In addition, osmotic stress could lead to stomatal closure; this phenomenon inhibits the absorption and transition of water [59], and also leading to reduced photosynthesis and the induced expression of many stress-responsive genes [60,61,62,63,64]. Ionic stress is mainly caused by the accumulation of sodium (Na+) and chlorine (Cl) in cells, with variations in ionic stress mainly affecting Ca+ signaling; some protein kinases are Ca+ -dependent [65,66,67]. The toxicity of sodium is mainly due to the inhibitory effects on enzyme activity, which could negatively affect metabolism. The pathways affected by Na+ accumulated under salt tolerance mainly include photosynthesis, the Calvin cycle, etc. Additionally, plants can regulate the harm caused by salt stress, such as by restricting Na+ accumulation and stabilizing K+ concentrations [26,62,68]. In addition, excess Na+ accumulated in the cytoplasm can also affect the absorption and transportation of K+, Ca+ and other mineral elements such as nitrogen, phosphorus and zinc. If there is excess Cl in the cytoplasm, the absorption and transition capacities of key macronutrients, such as nitrogen and sulphone, are affected, which leads to deficiencies. Non-selective anion transporters such as Cl mediate the uptake channels of NO3− and SO42− in plants [69,70,71]. Furthermore, salt stress induces variations in osmotic and ionic stress, and could also induce the accumulation of ROS, which severely damages the cell structure and macromolecules, such as DNA, lipids, enzymes, etc.
Soil salinity is a severe abiotic stress which severely restricts crop productivity [72,73]; for coping with the effects of ionic toxicity [74] and osmotic shock [75,76], plants have evolved a series of response mechanisms. With the development of salt stress research, many genes which are associated with salt tolerance have been identified or cloned in different plants. The HKT gene family [77], SNRK gene family [78], SPL gene family [79] and PGDH gene family [80], among others, have been identified to regulate salt stress. Correlational research has presented considerable progress in exploring the salt responses of major plants, such as Arabidopsis [81,82,83], soybean [84,85,86], rice [87,88,89] and maize [90,91,92]. Plant breeders and biotechnologists have tried to develop crop varieties with a strong capacity to respond to salt stress, mainly including improving the plant’s salt tolerant and salt resistance. However, satisfactory results have not yet been achieved in agroecologically important crops due to many factors. Melatonin was discovered to accumulate in response to salt stress; this strategy could enhance the capacity of plant resistance to salt stress, predominantly through eliminating the reactive oxygen species and enhancing antioxidant enzyme activity [93].
Similarly to common crops, cannabis was able to accumulate high levels of NaCl in its roots and shoots in a short-term hydroponic experiment. Through the analysis of Illumina high-throughput mRNA sequencing, over 31,000 high-quality transcript contigs have been identified in cannabis for responding to salt stress. Furthermore, a total of 16,149 novel transcripts have been identified, including some candidate DEGs and pathways which respond to salt stress in cannabis. One key observation in this study was the response of different strains of cannabis to salt stress.
Transcriptome analysis showed that a large number of genes were upregulated or downregulated under salt stress: there were more upregulated DEGs than downregulated DEGs in cannabis varieties K94 and W20, with some overlapping DEGs also identified. In addition, there are significant differences in the pathways which control the efficiency of different cannabis varieties to respond salt stress. These conclusions were consistent with previous studies in rice [45,83,84,85,86] and maize [94,95,96] responses to salt stress. The “plant hormone signal transduction” pathway, “MAPK signal pathway” and “phenylpropanoid biosynthesis” were detected to be significantly associated with the salt stress through the analysis of GO enrichment and KEGG enrichment based on the DGEs which were identified in K94 and W20 varieties. The diversity in molecular variation was strongly related with the phenotypical and physicochemical properties, namely, salt stress can induce increases in lipid peroxidation and ROS in cannabis, and upregulate the expression of antioxidant genes in plants to cope with ionic toxicity [82,97,98,99,100].
The “MAPK signal pathway” is strongly involved in the response to salt stress in plants; the Ca+-dependent protein kinase CPK3 is required for the MAPK pathway in Arabidopsis [101]. Several modules of the MAPK pathway are active in receiving and transporting signals under salt stress, and these MAPK modules regulate the production, transportation and distribution of auxin, which enhances the capacity to tolerate salt stress in wild barley [102]. Overexpressing the GhCIPK6a gene could enhance the capacity to respond to salt stress, involving ROS scavenging in the MAPK pathway in cotton [103]. The “plant hormone signal transduction” pathway has also previously been reported to play an essential role. In pumpkins, enrichment analyses of the DEGs which are related to “plant hormone signal transduction” indicate that the ethylene signal transduction genes may be related to this pathway, exhibiting important effects in responding to salt stress [104]. In sophora, auxin, cytokinin and brassinosteroids have been identified to influence the recovery after salt stress through plant hormone signal transduction [105]. In cotton, the ABA- and GA-related DEGs of plant hormone signal transduction are regulated by mediating the expression of hormone-related DEGs to respond to salt stress [106].
Among the enrichment analyses of GO and KEGG in the K94 and W20 cannabis varieties, the results indicated that the “plant hormone signal transduction” pathway, “MAPK signal pathway” were both detected, and the DEGs related to these pathways were the main candidate genes for cannabis to respond to salt stress. However, other different pathways were enriched between the two varieties, showing different strategies in the capacity for resisting salt stress among different of cannabis varieties.
It is necessary to develop a comprehensive understanding of the physiology, biochemistry, metabolism and gene expression of cannabis under salt stress in order to improve yield. In this study, the capacity and expression variation of DEGs in salt stress responses were identified for two cannabis varieties with different genetic backgrounds. Moreover, more gene expression profiles were identified in cannabis, enabling further understanding of cannabis genomic genetics, and which will be beneficial for improving agricultural traits in cannabis.

Author Contributions

Conceptualization, S.H., D.L. and L.Z.; formal analysis, L.C., J.L. and S.D.; experiment conducting, H.T., C.Z., A.B. and S.D.; writing, review and editing, J.Z. and D.D. All authors have read and agreed to the published version of the manuscript.

Funding

This research was funded by the China Agriculture Technology Research System (CARS-16-02); China Agriculture Technology Research System and Agricultural Science and Technology Innovation Program (ASTIP-IBFC03); and the National Natural Science Foundation of China (Grant No. 31871674).

Institutional Review Board Statement

Not applicable.

Informed Consent Statement

Not applicable.

Data Availability Statement

Not applicable.

Conflicts of Interest

The authors declare no conflict of interest.

References

  1. Herbig, C.; Sirocko, F. Palaeobotanical evidence for agricultural activities in the Eifel region during the Holocene: Plant macro-remain and pollen analyses from sediments of three maar lakes in the Quaternary Westeifel Volcanic Field (Germany, Rheinland-Pfalz). Veg. Hist. Archaeobot. 2013, 22, 447–462. [Google Scholar] [CrossRef]
  2. Li, H.L. An archaeological and historical account of cannabis in China. Econ. Bot. 1973, 28, 437–448. [Google Scholar] [CrossRef]
  3. Amaducci, S.; Scordia, D.; Liu, F.H.; Zhang, Q.; Guo, H.; Testa, G.; Cosentino, S.L. Key cultivation techniques for hemp in Europe and China. Ind. Crops Prod. 2015, 68, 2–16. [Google Scholar] [CrossRef]
  4. Duvall, C.S. Drug laws, bioprospecting and the agricultural heritage of Cannabis in Africa. Space Polity 2016, 20, 10–25. [Google Scholar] [CrossRef]
  5. Obradovic, I. From prohibition to regulation: A comparative analysis of the emergence and related outcomes of new legal cannabis policy models (Colorado, Washington State and Uruguay). Int. J. Drug Policy 2019, 91, 102590. [Google Scholar] [CrossRef]
  6. Aliferis, K.A.; Bernard-Perron, D. Cannabinomics: Application of Metabolomics in Cannabis (Cannabis sativa L.) Research and Development. Front. Plant Sci. 2020, 11, 554. [Google Scholar] [CrossRef]
  7. Hall, W.; Degenhardt, L. Prevalence and correlates of cannabis use in developed and developing countries. Curr. Opin. Psychiatry 2007, 20, 393–397. [Google Scholar] [CrossRef]
  8. Cromack, H.T.H. The effect of cultivar and seed density on the production and fiber content of Cannabis sativa: In southern England. Ind. Crops Prod. 1998, 7, 205–210. [Google Scholar] [CrossRef]
  9. Salentijn, E.M.J.; Zhang, Q.; Amaducci, S.; Yang, M.; Trindade, L.M. New developments in fiber hemp (Cannabis sativa L.) breeding. Ind. Crops Prod. 2015, 68, 32–41. [Google Scholar] [CrossRef]
  10. Callaway, J.C. Hempseed as a nutritional resource: An overview. Euphytica 2004, 140, 65–72. [Google Scholar] [CrossRef]
  11. House, J.D.; Neufeld, J.; Leson, G. Evaluating the quality of protein from hemp seed (Cannabis sativa L.) products through the use of the protein digestibility-corrected amino acid score method. J. Agric. Food Chem. 2010, 58, 11801–11807. [Google Scholar] [CrossRef] [PubMed]
  12. Galasso, I.; Russo, R.; Mapelli, S.; Ponzoni, E.; Brambilla, I.M.; Battelli, G.; Reggiani, R. Variability in seed traits in a collection of cannabis sativa L. genotypes. Front. Plant Sci. 2016, 7, 688. [Google Scholar] [CrossRef] [Green Version]
  13. Tang, C.H.; Ten, Z.; Wang, X.S.; Yang, X.Q. Physicochemical and functional properties of hemp (Cannabis sativa L.) protein isolate. J. Agric. Food Chem. 2006, 54, 8945–8950. [Google Scholar] [CrossRef]
  14. Deferne, J.; Pate, D.W. Hemp seed oil: A source of valuable essential fatty acids. J. Int. Hemp Assoc. 1996, 3, 4–7. [Google Scholar]
  15. Crescente, G.; Piccolella, S.; Esposito, A.; Scognamiglio, M.; Fiorentino, A.; Pacifico, S. Chemical composition and nutraceutical properties of hempseed: An ancient food with actual functional value. Phytochem. Rev. 2018, 17, 733–749. [Google Scholar] [CrossRef]
  16. Yamaguchi, T.; Blumwald, E. Developing salt-tolerant crop plants: Challenges and opportunities. Trends Plant Sci. 2005, 10, 615–620. [Google Scholar] [CrossRef] [PubMed]
  17. Rajendran, K.; Tester, M.; Roy, S.J. Quantifying the three main components of salinity tolerance in cereals. Plant Cell Environ. 2009, 33, 237–249. [Google Scholar] [CrossRef]
  18. Sanower, H.M.; Sultan, A.S.J. Present Scenario of Global Salt Affected Soils, its Management and Importance of Salinity Research. Int. Res. J. Biol. Sci. 2019, 1, 1–3. [Google Scholar]
  19. Munns, R. Genes and salt tolerance: Bringing them together. New Phytol. 2005, 167, 645–663. [Google Scholar] [CrossRef]
  20. Oliveira, M.; Hoste, H.; Custódio, L. A systematic review on the ethnoveterinary uses of mediterranean salt-tolerant plants: Exploring its potential use as fodder, nutraceuticals or phytotherapeutics in ruminant production. J. Ethnopharmacol. 2021, 267, 113464. [Google Scholar] [CrossRef]
  21. Passaia, G.; Spagnolo Fonini, L.; Caverzan, A.; Jardim-Messeder, D.; Christoff, A.P.; Gaeta, M.L.; de Araujo Mariath, J.E.; Margis, R.; Margis-Pinheiro, M. The mitochondrial glutathione peroxidase GPX3 is essential for H2O2 homeostasis and root and shoot development in rice. Plant Sci. 2013, 208, 93–101. [Google Scholar] [CrossRef]
  22. Singh, V.; Singh, A.P.; Bhadoria, J.; Giri, J.; Singh, J.; Vineeth, T.V.; Sharma, P.C. Differential expression of salt-responsive genes to salinity stress in salt-tolerant and salt-sensitive rice (Oryza sativa L.) at seedling stage. Protoplasma 2018, 255, 1667–1681. [Google Scholar] [CrossRef] [PubMed]
  23. Jiang, Y.; Deyholos, M.K. Comprehensive transcriptional profiling of NaCl-stressed Arabidopsis roots reveals novel classes of responsive genes. BMC Plant Biol. 2006, 6, 25. [Google Scholar] [CrossRef] [PubMed] [Green Version]
  24. Geng, Y.; Wu, R.; Wee, C.W.; Xie, F.; Wei, X.; Chan, P.M.Y.; Tham, C.; Duan, L.; Dinneny, J.R. A spatio-temporal understanding of growth regulation during the salt stress response in Arabidopsis. Plant Cell 2013, 25, 2132–2154. [Google Scholar] [CrossRef] [PubMed] [Green Version]
  25. Wang, Y.; Fang, Z.; Yang, L.; Chan, Z. Transcriptional variation analysis of Arabidopsis ecotypes in response to drought and salt stresses dissects commonly regulated networks. Physiol. Plant. 2021, 172, 77–90. [Google Scholar] [CrossRef] [PubMed]
  26. Fukuda, A.; Nakamura, A.; Hara, N.; Toki, S.; Tanaka, Y. Molecular and functional analyses of rice NHX-type Na+/H+ antiporter genes. Planta 2011, 233, 175–188. [Google Scholar] [CrossRef]
  27. He, S.; Tan, L.; Hu, Z.; Chen, G.; Wang, G.; Hu, T. Molecular characterization and functional analysis by heterologous expression in E. coli under diverse abiotic stresses for OsLEA5, the atypical hydrophobic LEA protein from Oryza sativa L. Mol. Genet. Genom. 2012, 287, 39–54. [Google Scholar] [CrossRef]
  28. Zhang, F.; Li, L.; Jiao, Z.; Chen, Y.; Liu, H.; Chen, X.; Fu, J.; Wang, G.; Zheng, J. Characterization of the calcineurin B-Like (CBL) gene family in maize and functional analysis of ZmCBL9 under abscisic acid and abiotic stress treatments. Plant Sci. 2016, 253, 118–129. [Google Scholar] [CrossRef]
  29. Postiglione, A.E.; Muday, G.K. The Role of ROS Homeostasis in ABA-Induced Guard Cell Signaling. Front. Plant Sci. 2020, 11, 968. [Google Scholar] [CrossRef]
  30. Gao, Y.; Jiang, W.; Dai, Y.; Xiao, N.; Zhang, C.; Li, H.; Lu, Y.; Wu, M.; Tao, X.; Deng, D.; et al. A maize phytochrome-interacting factor 3 improves drought and salt stress tolerance in rice. Plant Mol. Biol. 2015, 87, 413–428. [Google Scholar] [CrossRef]
  31. Ying, S.; Zhang, D.F.; Fu, J.; Shi, Y.S.; Song, Y.C.; Wang, T.Y.; Li, Y. Cloning and characterization of a maize bZIP transcription factor, ZmbZIP72, confers drought and salt tolerance in transgenic Arabidopsis. Planta 2012, 235, 253–266. [Google Scholar] [CrossRef]
  32. Zhang, D.; Jiang, S.; Pan, J.; Kong, X.; Zhou, Y.; Liu, Y.; Li, D. The overexpression of a maize mitogen-activated protein kinase gene (ZmMPK5) confers salt stress tolerance and induces defence responses in tobacco. Plant Biol. 2013, 16, 558–570. [Google Scholar]
  33. Riechmann, J.L. Transcriptional Regulation: A Genomic Overview. Arab. Book 2002, 1, e0085. [Google Scholar] [CrossRef] [PubMed] [Green Version]
  34. Gong, X.; Liu, X.; Pan, Q.; Mi, G.; Chen, F.; Yuan, L. Combined physiological, transcriptome, and genetic analysis reveals a molecular network of nitrogen remobilization in maize. J. Exp. Bot. 2020, 70, 5061–5073. [Google Scholar] [CrossRef]
  35. Bamsey, M.; Berinstain, A.; Dixon, M. Development of a potassium-selective optode for hydroponic nutrient solution monitoring. Anal. Chim. Acta 2012, 737, 72–82. [Google Scholar] [CrossRef]
  36. Amirbakhtiar, N.; Ismaili, A.; Ghaffari, M.R.; Firouzabadi, F.N.; Shobbar, Z.S. Transcriptome response of roots to salt stress in a salinity-tolerant bread wheat cultivar. PLoS ONE 2019, 14, e0213305. [Google Scholar] [CrossRef] [PubMed]
  37. Bates, L.S.; Waldren, R.P.; Teare, I.D. Rapid determination of free proline for water-stress studies. Plant Soil 1973, 39, 205–207. [Google Scholar] [CrossRef]
  38. Porra, R.J.; Thompson, W.A.; Kriedemann, P.E. Determination of accurate extinction coefficients and simultaneous equations for assaying chlorophylls a and b extracted with four different solvents: Verification of the concentration of chlorophyll standards by atomic absorption spectroscopy. Biochim. Et Biophys. Acta (BBA)-Bioenerg. 1989, 975, 384–394. [Google Scholar] [CrossRef]
  39. Bolger, A.M.; Lohse, M.; Usadel, B. Trimmomatic: A flexible trimmer for Illumina sequence data. Bioinformatics 2014, 30, 2114–2120. [Google Scholar] [CrossRef] [PubMed] [Green Version]
  40. Kim, D.; Paggi, J.M.; Park, C.; Bennett, C.; Salzberg, S.L. Graph-based genome alignment and genotyping with HISAT2 and HISAT-genotype. Nat. Biotechnol. 2019, 37, 907–915. [Google Scholar] [CrossRef]
  41. Langdon, W.B. Performance of genetic programming optimised Bowtie2 on genome comparison and analytic testing (GCAT) benchmarks. BioData Min. 2015, 8, 1. [Google Scholar] [CrossRef] [PubMed] [Green Version]
  42. Wang, K.; Li, M.; Hakonarson, H. ANNOVAR: Functional annotation of genetic variants from high-throughput sequencing data. Nucleic Acids Res. 2010, 38, e164. [Google Scholar] [CrossRef] [PubMed]
  43. Pertea, M.; Kim, D.; Pertea, G.M.; Leek, J.T.; Salzberg, S.L. RNA-seq experiments with HISAT, StringTie and Ballgown. Nat. Protoc. 2016, 11, 1650–1667. [Google Scholar] [CrossRef] [PubMed]
  44. Wang, L.; Park, H.J.; Dasari, S.; Wang, S.; Kocher, J.P.; Li, W. CPAT: Coding-potential assessment tool using an alignment-free logistic regression model. Nucleic Acids Res. 2013, 41, e74. [Google Scholar] [CrossRef]
  45. Wagner, G.P.; Kin, K.; Lynch, V.J. Measurement of mRNA abundance using RNA-seq data: RPKM measure is inconsistent among samples. Theory Biosci. 2012, 131, 281–285. [Google Scholar] [CrossRef]
  46. Anders, S.; Pyl, P.T.; Huber, W. HTSeq-A Python framework to work with high-throughput sequencing data. Bioinformatics 2015, 31, 166–169. [Google Scholar] [CrossRef]
  47. Love, M.I.; Huber, W.; Anders, S. Moderated estimation of fold change and dispersion for RNA-seq data with DESeq2. Genome Biol. 2014, 15, 550. [Google Scholar] [CrossRef] [Green Version]
  48. Gene Ontology Consortium. The Gene Ontology resource: Enriching a GOld mine. Nucleic Acids Res. 2021, 49, D325–D334. [Google Scholar] [CrossRef]
  49. Kanehisa, M.; Sato, Y. KEGG Mapper for inferring cellular functions from protein sequences. Protein Sci. 2020, 29, 28–35. [Google Scholar] [CrossRef] [Green Version]
  50. Adal, A.M.; Doshi, K.; Holbrook, L.; Mahmoud, S.S. Comparative RNA-Seq analysis reveals genes associated with masculinization in female Cannabis sativa. Planta 2021, 253, 17. [Google Scholar] [CrossRef]
  51. Zenda, T.; Liu, S.; Wang, X.; Jin, H.; Liu, G.; Duan, H. Comparative proteomic and physiological analyses of two divergent maize inbred lines provide more insights into drought-stress tolerance mechanisms. Int. J. Mol. Sci. 2018, 19, 3225. [Google Scholar] [CrossRef] [PubMed] [Green Version]
  52. Kim, D.; Pertea, G.; Trapnell, C.; Pimentel, H.; Kelley, R.; Salzberg, S.L. TopHat2: Accurate alignment of transcriptomes in the presence of insertions, deletions and gene fusions. Genome Biol. 2013, 14, R36. [Google Scholar] [CrossRef] [PubMed] [Green Version]
  53. Song, L.; Pan, Z.; Chen, L.; Dai, Y.; Wan, J.; Ye, H.; Nguyen, H.T.; Zhang, G.; Chen, H. Analysis of whole transcriptome rna-seq data reveals many alternative splicing events in soybean roots under drought stress conditions. Genes 2020, 11, 1520. [Google Scholar] [CrossRef] [PubMed]
  54. Qadir, M.; Quillérou, E.; Nangia, V.; Murtaza, G.; Singh, M.; Thomas, R.J.; Drechsel, P.; Noble, A.D. Economics of salt-induced land degradation and restoration. Nat. Resour. Forum. 2014, 38, 282–295. [Google Scholar] [CrossRef]
  55. Su, T.; Li, X.; Yang, M.; Shao, Q.; Zhao, Y.; Ma, C.; Wang, P. Autophagy: An Intracellular Degradation Pathway Regulating Plant Survival and Stress Response. Front. Plant Sci. 2020, 28, 164. [Google Scholar] [CrossRef] [Green Version]
  56. Zhang, H.X.; Blumwald, E. Transgenic salt-tolerant tomato plants accumulate salt in foliage but not in fruit. Nat. Biotechnol. 2001, 19, 765–768. [Google Scholar] [CrossRef]
  57. Zhang, H.X.; Hodson, J.N.; Williams, J.P.; Blumwald, E. Engineering salt-tolerant Brassica plants: Characterization of yield and seed oil quality in transgenic plants with increased vacuolar sodium accumulation. Proc. Natl. Acad. Sci. USA 2001, 98, 12832–12836. [Google Scholar] [CrossRef] [Green Version]
  58. Yang, Y.; Guo, Y. Elucidating the molecular mechanisms mediating plant salt-stress responses. New Phytol. 2018, 217, 523–539. [Google Scholar] [CrossRef] [Green Version]
  59. Jiang, Z.; Zhou, X.; Tao, M.; Yuan, F.; Liu, L.; Wu, F.; Wu, X.; Xiang, Y.; Niu, Y.; Liu, F.; et al. Plant cell-surface GIPC sphingolipids sense salt to trigger Ca2+ influx. Nature 2019, 572, 341–346. [Google Scholar] [CrossRef]
  60. Kamran, M.; Parveen, A.; Ahmar, S.; Malik, Z.; Hussain, S.; Chattha, M.S.; Saleem, M.H.; Adil, M.; Heidari, P.; Chen, J.T. An overview of hazardous impacts of soil salinity in crops, tolerance mechanisms, and amelioration through selenium supplementation. Int. J. Mol. Sci. 2020, 21, 148. [Google Scholar] [CrossRef] [Green Version]
  61. Lodeyro, A.F.; Carrillo, N. Salt stress in higher plants: Mechanisms of toxicity and defensive responses. In Stress Responses in Plants: Mechanisms of Toxicity and Tolerance; Springer: Cham, Switzerland, 2015; pp. 1–33. [Google Scholar]
  62. Qin, H.; Huang, R. The phytohormonal regulation of Na+/K+ and reactive oxygen species homeostasis in rice salt response. Mol. Breed. 2020, 40, 47. [Google Scholar] [CrossRef]
  63. Hussain, M.; Ahmad, S.; Hussain, S.; Lal, R.; Ul-Allah, S.; Nawaz, A. Rice in Saline Soils: Physiology, Biochemistry, Genetics, and Management. Adv. Agron. 2018, 148, 231–287. [Google Scholar]
  64. Razzaq, A.; Ali, A.; Safdar, L.B.; Zafar, M.M.; Rui, Y.; Shakeel, A.; Shaukat, A.; Ashraf, M.; Gong, W.; Yuan, Y. Salt stress induces physiochemical alterations in rice grain composition and quality. J. Food Sci. 2020, 85, 14–20. [Google Scholar] [CrossRef] [PubMed]
  65. Yasar, F.; Uzal, O. Effect of calcium applications on ion accumulation in different organs of pepper plant under salt stress. BIO Web Conf. 2020, 17, 00231. [Google Scholar] [CrossRef] [Green Version]
  66. Zhang, H.; Zhang, Y.; Deng, C.; Deng, S.; Li, N.; Zhao, C.; Zhao, R.; Liang, S.; Chen, S. The Arabidopsis Ca2+ -dependent protein kinase CPK12 is involved in plant response to salt stress. Int. J. Mol. Sci. 2018, 19, 4062. [Google Scholar] [CrossRef] [Green Version]
  67. Slabu, S.; Zorb, C.; Steffens, D.; Schubert, S. Is salt stress of faba bean (Vicia faba) caused by Na+ or Cl- toxicity? J. Plant Nutr. Soil Sci. 2009, 172, 644–650. [Google Scholar] [CrossRef]
  68. Suzuki, K.; Yamaji, N.; Costa, A.; Okuma, E.; Kobayashi, N.I.; Kashiwagi, T.; Katsuhara, M.; Wang, C.; Tanoi, K.; Murata, Y.; et al. OsHKT1;4-mediated Na+ transport in stems contributes to Na+ exclusion from leaf blades of rice at the reproductive growth stage upon salt stress. BMC Plant Biol. 2016, 16, 22. [Google Scholar] [CrossRef] [PubMed] [Green Version]
  69. Machado, R.M.A.; Serralheiro, R.P. Soil salinity: Effect on vegetable crop growth. Management practices to prevent and mitigate soil salinization. Horticulturae 2017, 3, 30. [Google Scholar] [CrossRef]
  70. Yasir, M.; He, S.; Sun, G.; Geng, X.; Pan, Z.; Gong, W.; Jia, Y.; Du, X. A genome-wide association study revealed key SNPs/genes associated with salinity stress tolerance in upland cotton. Genes 2019, 10, 829. [Google Scholar] [CrossRef] [Green Version]
  71. Munns, R. Comparative physiology of salt and water stress. Plant Cell Environ. 2002, 25, 239–250. [Google Scholar] [CrossRef]
  72. Sellamuthu, G.; Jegadeeson, V.; Sajeevan, R.S.; Rajakani, R.; Parthasarathy, P.; Raju, K.; Shabala, L.; Chen, Z.H.; Zhou, M.; Sowdhamini, R.; et al. Distinct Evolutionary Origins of Intron Retention Splicing Events in NHX1 Antiporter Transcripts Relate to Sequence Specific Distinctions in Oryza Species. Front. Plant Sci. 2020, 11, 267. [Google Scholar] [CrossRef] [Green Version]
  73. Yang, Y.; Smith, S.A. Optimizing de novo assembly of short-read RNA-seq data for phylogenomics. BMC Genom. 2013, 14, 328. [Google Scholar] [CrossRef] [Green Version]
  74. Zeng, P.; Zhu, P.; Qian, L.; Qian, X.; Mi, Y.; Lin, Z.; Dong, S.; Aronsson, H.; Zhang, H.; Cheng, J. Identification and fine mapping of qGR6.2, a novel locus controlling rice seed germination under salt stress. BMC Plant Biol. 2021, 21, 36. [Google Scholar] [CrossRef]
  75. Trapnell, C.; Williams, B.A.; Pertea, G.; Mortazavi, A.; Kwan, G.; Van Baren, M.J.; Salzberg, S.L.; Wold, B.J.; Pachter, L. Transcript assembly and quantification by RNA-Seq reveals unannotated transcripts and isoform switching during cell differentiation. Nat. Biotechnol. 2010, 28, 511–515. [Google Scholar] [CrossRef] [Green Version]
  76. Roberts, A.; Trapnell, C.; Donaghey, J.; Rinn, J.L.; Pachter, L. Improving RNA-Seq expression estimates by correcting for fragment bias. Genome Biol. 2011, 12, R22. [Google Scholar] [CrossRef] [PubMed] [Green Version]
  77. Zhang, S.; Tong, Y.; Li, Y.; Cheng, Z.M.; Zhong, Y. Genome-wide identification of the HKT genes in five Rosaceae species and expression analysis of HKT genes in response to salt-stress in Fragaria vesca. Genes Genom. 2019, 41, 325–336. [Google Scholar] [CrossRef]
  78. Wang, Y.; Yan, H.; Qiu, Z.; Hu, B.; Zeng, B.; Zhong, C.; Fan, C. Comprehensive analysis of SNRK gene family and their responses to salt stress in eucalyptus grandis. Int. J. Mol. Sci. 2019, 20, 2786. [Google Scholar] [CrossRef] [Green Version]
  79. Wang, J.; Ye, Y.; Xu, M.; Feng, L.; Xu, L.A. Roles of the SPL gene family and miR156 in the salt stress responses of tamarisk (Tamarix chinensis). BMC Plant Biol. 2019, 19, 370. [Google Scholar] [CrossRef] [Green Version]
  80. Rosa-Téllez, S.; Anoman, A.D.; Alcántara-Enguídanos, A.; Garza-Aguirre, R.A.; Alseekh, S.; Ros, R. PGDH family genes differentially affect Arabidopsis tolerance to salt stress. Plant Sci. 2020, 290, 110284. [Google Scholar] [CrossRef] [PubMed]
  81. Luo, L.; Zhang, P.; Zhu, R.; Fu, J.; Su, J.; Zheng, J.; Wang, Z.; Wang, D.; Gong, Q. Autophagy is rapidly induced by salt stress and is required for salt tolerance in Arabidopsis. Front. Plant Sci. 2017, 8, 1459. [Google Scholar] [CrossRef] [PubMed] [Green Version]
  82. Awlia, M.; Alshareef, N.; Saber, N.; Korte, A.; Oakey, H.; Panzarová, K.; Trtílek, M.; Negrão, S.; Tester, M.; Julkowska, M.M. Genetic mapping of the early responses to salt stress in Arabidopsis thaliana. Plant J. 2021, 107, 544–563. [Google Scholar] [CrossRef] [PubMed]
  83. Fan, D.; Subramanian, S.; Smith, D.L. Plant endophytes promote growth and alleviate salt stress in Arabidopsis thaliana. Sci. Rep. 2020, 10, 12740. [Google Scholar] [CrossRef] [PubMed]
  84. Li, Y.; Chen, Q.; Nan, H.; Li, X.; Lu, S.; Zhao, X.; Liu, B.; Guo, C.; Kong, F.; Cao, D. Overexpression of GmFDL19 enhances tolerance to drought and salt stresses in soybean. PLoS ONE 2017, 12, e0179554. [Google Scholar] [CrossRef] [Green Version]
  85. Sun, L.; Song, G.; Guo, W.; Wang, W.; Zhao, H.; Gao, T.; Lv, Q.; Yang, X.; Xu, F.; Dong, Y.; et al. Dynamic Changes in Genome-Wide Histone3 Lysine27 Trimethylation and Gene Expression of Soybean Roots in Response to Salt Stress. Front. Plant Sci. 2019, 10, 1031. [Google Scholar] [CrossRef]
  86. Li, M.; Chen, R.; Jiang, Q.; Sun, X.; Zhang, H.; Hu, Z. GmNAC06, a NAC domain transcription factor enhances salt stress tolerance in soybean. Plant Mol. Biol. 2021, 105, 333–345. [Google Scholar] [CrossRef]
  87. Verma, P.K.; Verma, S.; Tripathi, R.D.; Pandey, N.; Chakrabarty, D. CC-type glutaredoxin, OsGrx_C7 plays a crucial role in enhancing protection against salt stress in rice. J. Biotechnol. 2021, 329, 192–203. [Google Scholar] [CrossRef]
  88. Yan, F.; Wei, H.; Ding, Y.; Li, W.; Liu, Z.; Chen, L.; Tang, S.; Ding, C.; Jiang, Y.; Li, G. Melatonin regulates antioxidant strategy in response to continuous salt stress in rice seedlings. Plant Physiol. Biochem. 2021, 165, 239–250. [Google Scholar] [CrossRef] [PubMed]
  89. Yan, F.; Zhang, J.; Li, W.; Ding, Y.; Zhong, Q.; Xu, X.; Wei, H.; Li, G. Exogenous melatonin alleviates salt stress by improving leaf photosynthesis in rice seedlings. Plant Physiol. Biochem. 2021, 163, 367–375. [Google Scholar] [CrossRef]
  90. Li, P.C.; Yang, X.Y.; Wang, H.M.; Pan, T.; Yang, J.Y.; Wang, Y.Y.; Xu, Y.; Yang, Z.F. Metabolic responses to combined water deficit and salt stress in maize primary roots. J. Integr. Agric. 2021, 20, 109–119. [Google Scholar] [CrossRef]
  91. Ren, J.; Ye, J.; Yin, L.; Li, G.; Deng, X.; Wang, S. Exogenous melatonin improves salt tolerance by mitigating osmotic, ion, and oxidative stresses in maize seedlings. Agronomy 2020, 10, 663. [Google Scholar] [CrossRef]
  92. Weng, Q.; Zhao, Y.; Yanan, Z.; Song, X.; Yuan, J.; Liu, Y. Identification of salt stress-responsive proteins in maize (Zea may) seedlings using itraq-based proteomic technique. Iran. J. Biotechnol. 2021, 19, e2512. [Google Scholar] [PubMed]
  93. Li, J.; Liu, J.; Zhu, T.; Zhao, C.; Li, L.; Chen, M. The role of melatonin in salt stress responses. Int. J. Mol. Sci. 2019, 20, 1735. [Google Scholar] [CrossRef] [Green Version]
  94. Luo, M.; Zhao, Y.; Wang, Y.; Shi, Z.; Zhang, P.; Zhang, Y.; Song, W.; Zhao, J. Comparative Proteomics of Contrasting Maize Genotypes Provides Insights into Salt-Stress Tolerance Mechanisms. J. Proteome Res. 2018, 17, 141–153. [Google Scholar] [CrossRef]
  95. Luo, M.; Zhang, Y.; Chen, K.; Kong, M.; Song, W.; Lu, B.; Shi, Y.; Zhao, Y.; Zhao, J. Mapping of quantitative trait loci for seedling salt tolerance in maize. Mol. Breed. 2019, 39, 64. [Google Scholar] [CrossRef]
  96. Zhang, M.; Liang, X.; Wang, L.; Cao, Y.; Song, W.; Shi, J.; Lai, J.; Jiang, C. A HAK family Na+ transporter confers natural variation of salt tolerance in maize. Nat. Plants 2019, 5, 1297–1308. [Google Scholar] [CrossRef] [PubMed]
  97. Zhu, J.K. Salt and drought stress signal transduction in plants. Annu. Rev. Plant Biol. 2002, 53, 247–273. [Google Scholar] [CrossRef] [PubMed] [Green Version]
  98. Zhu, J.K. Abiotic Stress Signaling and Responses in Plants. Cell 2016, 167, 313–324. [Google Scholar] [CrossRef] [Green Version]
  99. Sandhu, D.; Pudussery, M.V.; Kumar, R.; Pallete, A.; Markley, P.; Bridges, W.C.; Sekhon, R.S. Characterization of natural genetic variation identifies multiple genes involved in salt tolerance in maize. Funct. Integr. Genom. 2020, 20, 261–275. [Google Scholar] [CrossRef]
  100. Luo, M.; Zhang, Y.; Li, J.; Zhang, P.; Chen, K.; Song, W.; Wang, X.; Yang, J.; Lu, X.; Lu, B.; et al. Molecular dissection of maize seedling salt tolerance using a genome-wide association analysis method. Plant Biotechnol. J. 2021, 19, 1937–1951. [Google Scholar] [CrossRef]
  101. Mehlmer, N.; Wurzinger, B.; Stael, S.; Hofmann-Rodrigues, D.; Csaszar, E.; Pfister, B.; Bayer, R.; Teige, M. The Ca2+-dependent protein kinase CPK3 is required for MAPK-independent salt-stress acclimation in Arabidopsis. Plant J. 2010, 63, 484–498. [Google Scholar] [CrossRef] [Green Version]
  102. Abulfaraj, A.A. Stepwise signal transduction cascades under salt stress in leaves of wild barley (Hordeum spontaneum). Biotechnol. Biotechnol. Equip. 2020, 34, 860–872. [Google Scholar] [CrossRef]
  103. Su, Y.; Guo, A.; Huang, Y.; Wang, Y.; Hua, J. GhCIPK6a increases salt tolerance in transgenic upland cotton by involving in ROS scavenging and MAPK signaling pathways. BMC Plant Biol. 2020, 20, 421. [Google Scholar] [CrossRef] [PubMed]
  104. Li, Q.; Zhang, L.; Pan, F.; Guo, W.; Chen, B.; Yang, H.; Wang, G.; Li, X. Transcriptomic analysis reveals ethylene signal transduction genes involved in pistil development of pumpkin. PeerJ 2020, 8, e9677. [Google Scholar] [CrossRef] [PubMed]
  105. Zhu, Y.; Wang, Q.; Gao, Z.; Wang, Y.; Liu, Y.; Ma, Z.; Chen, Y.; Zhang, Y.; Yan, F.; Li, J. Analysis of phytohormone signal transduction in sophora alopecuroides under salt stress. Int. J. Mol. Sci. 2021, 22, 7313. [Google Scholar] [CrossRef] [PubMed]
  106. Chen, L.; Lu, B.; Liu, L.; Duan, W.; Jiang, D.; Li, J.; Zhang, K.; Sun, H.; Zhang, Y.; Li, C.; et al. Melatonin promotes seed germination under salt stress by regulating ABA and GA3 in cotton (Gossypium hirsutum L.). Plant Physiol. Biochem. 2021, 162, 506–516. [Google Scholar] [CrossRef] [PubMed]
Figure 1. Physiological diversity variations in the response to salt stress in cannabis. (a) The diversity in chlorophyll contents; (b) the diversity in electrical conductivity; (c) the diversity in proline contents. Green represents the K94 variety; orange represents the W20 variety. The letters at the top of the histogram stand for the variation comparisons with the data before and/or after treatment: the same letters stand for data with no significant differences (p ≤ 0.05); two different letters represent differences in the data reaching extremely remarkable level (p ≤ 0.01).
Agronomy 11 02338 g001
Figure 2. Sample correlations: (a) PCA of the samples; (b) correlation analysis of the samples. The different colors in (a) represent the different samples; colors ranging from blue to red indicate that the correlation is becoming stronger, i.e., the redder the color, the closer the correlation.
Agronomy 11 02338 g002
Figure 3. The quality and quantity of the RNA sequencing: (a) boxplot of the expressions of 12 samples; (b) categorization of the annotation region. The expression density of genes in twelve samples was mapped using transcripts per million (TPM) reads. The abscissa was the sample name, and the ordinate was log2 (TPM + 1). The box chart for each region is divided into five statistics (from top to bottom are the maximum, upper quartile, median, lower quartile and minimum).
Agronomy 11 02338 g003
Figure 4. Annotation of the novel transcripts. There were more NR-annotated transcripts in comparison than the others, with the minimum number of transcripts left unannotated.
Agronomy 11 02338 g004
Figure 5. Identification and functional annotation of DEGs in treatment and control samples, generated using high-throughput deep sequencing technology. (a) Volcano plot showing the expression of the DEGs in the K94 versus K94h experimental comparison varieties. (b) Clustering analysis of DEGs in treatment and control samples. The scale bar indicates upregulated (red) and downregulated (blue) DEGs. The darker the color, the higher the expression; the lighter the color, the lower the expression. (c) The GO classification of all the DEGs of K94 cannabis in the seedling stage. (d) The enriched KEGG pathways of all the DEGs of K94 cannabis in the seedling stage.
Agronomy 11 02338 g005
Figure 6. The heatmap of the expression profiles of DEGs which are related to plant hormone signal transduction (b) and the plant MAPK signaling pathway (a) in K94 after salt treatment. The scale bar indicates upregulated (red) and downregulated (blue) DEGs. The darker the color, the higher the expression; the lighter the color, the lower the expression.
Agronomy 11 02338 g006
Figure 7. Identification and functional annotation of DEGs between treatment and control, generated using high-throughput deep sequencing technology. (a) Volcano plot comparing the expression profiles of DEGs between the W20 and W20h experimental samples. (b) Clustering analysis of DEGs between treatments and controls. The scale bar indicates upregulated (red) and downregulated (blue) DEGs. The darker the color, the higher the expression; the lighter the color, the lower the expression. (c) Top 3 GO classification of all DEGs of W20 cannabis in the seedling stage. (d) The top 10 enriched KEGG pathways of all DEGs of W20 cannabis in the seedling stage.
Agronomy 11 02338 g007
Figure 8. The heatmap of expression profiles of DEGs which are related to phenylpropanoid biosynthesis (a) and the plant hormone signal transduction pathway (b) in W20 after salt treatment. The scale bar indicates upregulated (red) and downregulated (blue) DEGs. The darker the color, the higher the expression; the lighter the color, the lower the expression.
Agronomy 11 02338 g008
Figure 9. Identification of the functional annotation of DEGs between treatment and control samples, generated using high-throughput deep sequencing technology. (a) Venn diagram showing the number of overlapping DEGs in the experimental comparison between W20 and K94 varieties. (b) Clustering analysis of overlapping DEGs. The scale bar indicates upregulated (red) and downregulated (blue) DEGs. The darker the color, the higher the expression; the lighter the color, the lower the expression. (c) Top three GO classifications of overlapping DEGs in cannabis. (d) The top 10 enriched KEGG pathways of all the overlapping DEGs.
Agronomy 11 02338 g009
Figure 10. The heatmap of expression profiles of DEGs related to the top 4 enrichment pathways: (a) heatmap of the signal transduction pathway; (b) heatmap of the MAPK signaling pathway; (c) heatmap of the environmental information processing pathway; (d) heatmap of plant hormone signal transduction. The scale bar indicates upregulated (red) and downregulated (blue) DEGs. The darker the color, the higher the expression; the lighter the color, the lower the expression.
Agronomy 11 02338 g010
Figure 11. Expression profiles of DEGs which were selected based on qRT-PCR and the TPM. Green represents the expression of the K94 variety at different stages after treatment based on the qRT-PCR; orange represents the TPM expression of treatment and control samples based on the RNA-seq; blue-violet represents the expression of the W20 variety at different stages after treatment based on qRT-PCR.
Agronomy 11 02338 g011
Table 1. Primer sequences of DEGs for qRT-PCR.
NamePrimer (5′->3′)
LOC115697737GCTGTTGAGATTTCAGTACTTGCC//TACCTCCTCAAACCATGCAC
LOC115698674ACTGTTTTATACACTTGGTTCCTTT//AAGTGGAGCGTGAAGAGTGG
LOC115700775TGATTGAGCGTAGTGGGAAGC//TCCCTGCCAAAAACCTCCAA
LOC115704163ACCTGCATTCTACATTAGGCA//TGCGTGCATGTAACAAGATTAAA
LOC115707929ACTAATCAAGGCACAACACACC//TTCTCCCAGCCCAGGTGTAA
LOC115709853GCAGCTCTATGCGAGTATGC//AGTGTCAACCCTAAAATGAGTTGAT
LOC115710226AGCAAGTGAAACAGCAACCAA//TCTTCTGTGTTCATTCCTACTTCT
LOC115710658AGTCTTTAAAATCTCATTGCGCGT//CTTGGCCAGTAAAACGCTCG
LOC115712923GGATGGGTTGTGTGGAGGAG//GTGCAAATTTAAAAGCACCTTTGGA
LOC115715759TGTGAGTGACTTGGACTGTGT//AAACTACGAAGCACCTGCAA
LOC115716727TGGCTCAGTTGCTCTTGATGA//GGGTATCATGGTCGGTGCC
LOC115718665CGGAACTTCTATAAATATTCGGTGT//GGCTTAGAAGCCTTACAACCAT
LOC115719017ATGAGTGGGTCACACAGTGG//ATGAGTGGGTCACACAGTGG
LOC115720256GGGCACAACAGAAGCACTTG//ACAACACATGTTCATGCCACAA
LOC115723301ACAAAGCTCTTGCGTTTGGTT//TTGGGAGCTAGTTGTGACCT
Table 2. Summary of RNA sequencing responses to salt stress in cannabis varieties.
SampleClean Base (bp)Total Read PairsGC (%)Q30 (%)Total Mapped ReadsUnique Mapped ReadsMultiple Mapped Reads
K94-18,004,702,30026,682,34143.86; 43.8393.21; 92.3322,619,678 (84.77%)21,793,155 (81.68%)826,523 (3.10%)
K94-28,138,507,40027,128,35844.05; 44.0393.39; 93.2222,827,417 (84.15%)21,999,162 (81.09%)828,255 (3.05%)
K94-37,414,971,00024,716,57043.88; 43.8493.33; 90.7920,871,006 (84.44%)20,066,538 (81.19%)804,468 (3.25%)
K94h-16,796,399,80022,654,66643.86; 43.8392.79; 90.5719,084,286 (84.24%)18,423,842 (81.32%)660,444 (2.92%)
K94h-27,230,943,80024,103,14643.91; 43.8992.77; 90.5420,036,029 (83.13%)19,334,787 (80.22%)701,242 (2.91%)
K94h-37,273,562,70024,245,20943.82; 43.7992.69; 90.8220,235,640 (83.46%)19,532,476 (80.56%)703,164 (2.90%)
W20-17,413,545,70024,711,81943.54; 43.5293.68; 93.3520,677,010 (83.67%)19,893,900 (80.50%)783,110 (3.17%)
W20-28,590,370,10028,634,56744.14; 44.0993.95; 92.4124,162,827 (84.38%)23,211,655 (81.06%)951,172 (3.32%)
W20-38,981,841,90029,939,47343.74; 43.7293.85; 93.3225,241,745 (84.31%)24,270,435 (81.07%)971,310 (3.24%)
W20h-17,666,976,10025,556,58743.9; 43.8893.24; 92.7321,712,432 (84.96%)20,915,160 (81.84%)797,272 (3.12%)
W20h-26,863,257,50022,877,52544.1; 44.0893.56; 93.4319,593,613 (85.65%)18,902,678 (82.63%)690,935 (3.02%)
W20h-37,034,013,30023,446,71143.86; 43.8193.49; 92.2219,928,289 (84.99%)19,227,153 (82.00%)701,136 (2.99%)
Sample, sample name; Clean reads, the number of clean reads obtained after filtering; Total read pairs, total number of read pairs obtained; GC, the total number of G and C in clean bases constituting the percentage of the total number of bases; Q30, the percentage of bases whose phred QC value is greater than 30 in the RAW bases; Total mapped reads, statistics on the number of sequenced sequences that are located on a genome; in general, if there is no contamination and the reference genome selection is appropriate, the percentages of these data are greater than 70%; Unique mapped reads, statistical count of the number of sequencing sequences with unique alignment positions on the reference sequence; non-spliced reads, whole-segment alignment to exon sequencing sequence statistics; Multiple mapped reads, statistical enumeration of sequencing sequences with multiple alignment locations on the reference sequence.
Publisher’s Note: MDPI stays neutral with regard to jurisdictional claims in published maps and institutional affiliations.

