Article

Water Quality for Agricultural Irrigation and Aquatic Arsenic Health Risk in the Altay and Tianshan Mountains, Central Asia

1
State Key Laboratory of Desert and Oasis Ecology, Xinjiang Institute of Ecology and Geography, Chinese Academy of Sciences, Urumqi 830011, China
2
Research Center for Ecology and Environment of Central Asia, Chinese Academy of Sciences, Urumqi 830011, China
3
University of Chinese Academy of Sciences, Beijing 100049, China
*
Author to whom correspondence should be addressed.
Agronomy 2021, 11(11), 2270; https://doi.org/10.3390/agronomy11112270
Submission received: 3 October 2021 / Revised: 7 November 2021 / Accepted: 9 November 2021 / Published: 10 November 2021
(This article belongs to the Section Water Use and Irrigation)

Abstract

:
Due to a lack of water-quality studies compared with water-quantity studies, an investigation into the factors influencing the hydrochemical composition of the rivers in the Tianshan and Altay Mountains was conducted with a model of multiple linear regression, while the suitability of the water quality for irrigation and the health risks of arsenic (As) were assessed with classical evaluation methods. The results suggest that 44.0% of the water samples from the Altay Mountains fell into the Ca-HCO3 category type, 48.0% of the water samples were of the Ca-HCO3-Cl type, and the remaining samples belonged to the Ca-Na-HCO3-Cl type. In the Tianshan Mountain area, 58.6% of the water samples fell into the Ca-HCO3 hydrochemical category, 20.7% of the water samples were of the Ca-HCO3-Cl type, and 20.7% of the water samples belonged to the Ca-Na-HCO3-Cl type. The major ions in the water were dominated by the control of the water and rock interaction. The interaction between water and rock in the Altay area controlled 69.2% of the overall variance in the As content in the river waters, and it dominated 76.2% of the variance in the Tianshan region. The river waters in the Altay and Tianshan Mountain regions are suitable for agricultural irrigation with excellent-to-good water quality. The results also suggest that there is no non-carcinogenic risk and that the carcinogenic risk is between the acceptable/tolerable risk range of 10−6–10−4, except only one sample in Tianshan Mountain region. The research methodology provided a reference for revealing the potential sources of toxic element pollution, and the results provided a scientific basis for regional agricultural irrigation, as well as a reference for decision making on the environmental protection of the watershed.

1. Introduction

Water resources are important for human survival and development and are an important strategic resource to ensure sustainable social development, particularly for arid regions [1]. For a long time, water shortages and water pollution have been the most difficult issues in the management and protection of water-environment safety at home and abroad, and in some areas, water safety has become a major problem limiting the sustainable and healthy development of agriculture [2,3,4]. The mountain–oasis (basin) system in arid Central Asia has obvious spatial distribution characteristics [5,6]. The mountain system is the formation area for water resources in arid areas and is also an important mineral nutrient reservoir. The oasis system is an area with relatively high agricultural and industrial productivity and is the center of human survival and development. The river becomes the link between the mountain system and the oasis system and is the foundation for ecological construction and economic development in arid areas. The composition of major ions in river water is one of the most important indicators of river water quality and contains important environmental information on things, such as climate, bedrock type, and human activity in the watershed [7], and it is the most basic indicator for irrigation evaluation and drinking-water-safety evaluation [8,9]. In recent years, scholars have paid much attention to the water-resource and environmental problems in the western part of the Tianshan [10,11] and Altay [12,13] Mountains (Mts.), and among these, the soil problems [14,15,16] and overall water quantity of the rivers [17,18,19] in the regions of the Tianshan and Altay Mts. have been studied; however, there is still a lack of basic information on water quality. The study of the water chemistry of rivers and influencing factors is not only of great practical significance for domestic and industrial water uses and agricultural irrigation, but can also provide important support for ecological protection and the sustainable use of water resources.
The issue of potentially toxic elements in river waters has received widespread attention worldwide due to the easy accumulation of these elements, environmental toxicity, and persistence [20,21]. With rapid population growth and the expansion of industrial and agricultural production scales, many hazardous substances, particularly potentially toxic elements, are discharged into rivers, causing a direct or indirect threat to direct drinking water and indirect irrigation [22,23]. Although trace amounts of potentially toxic elements are necessary for organisms, higher concentrations are extremely toxic to the human body, causing liver and kidney dysfunction, genetic toxicity, and carcinogenesis [24,25]. In view of the arsenic (As) toxicity among the potentially toxic elements [26], As pollution has always been a focus of concern [27,28,29]. From the existing research, the As content of groundwater in Central Asia is at a global high level [30], and there are few studies on As in surface water [31,32]. Studying the basic characteristics of the content, spatial distribution, and source of As in water bodies is of great significance to the proposal of effective measures for regional-water-resources protection and pollution control. The unknown As content in the surface waters of Central Asia affects the utilization of water resources, agricultural irrigation, and aquaculture in the basin, and ultimately, human health.
To reveal: (1) the spatial differences in the water chemistry of the rivers in the Altay and Tianshan Mts.; (2) the main factors affecting the water-chemistry characteristics of the rivers; and (3) the suitability of the rivers for agricultural irrigation and the risks to human health from As, the water chemistry in the Altay and Tianshan Mts. region was studied using statistical methods, hydrochemical diagrams, and evaluation methods for agricultural irrigation and human health in this paper. The study provides a scientific basis for the conservation and sustainable use of regional water resources.

2. Materials and Methods

2.1. Regional Setting

The Altay Mountains (Figure 1) stretch from northwest to southeast and stand in the arid desert and arid semi-desert zone in the hinterland of Asia. The entire region has a typical temperate continental climate. The Altay Mountains lie on the borders of China, Russia, and Mongolia. The Altay Mountains are affected by a westerly airflow all year round, which deepens along the Irtysh River valley and is blocked by the Altay Mountains and uplifted, producing precipitation. There are two large rivers originating from the southern slope of the mountain in China: the Irtysh River and the Ulungur River [33]. The two rivers flow from southeast to northwest along the structural line. The Irtysh River is the only river in China that flows into the Arctic Ocean. Its tributaries merge roughly in parallel on the north side of the Irtysh River, forming a comb-like water system, with the amount of water increasing along the way. The tributaries of the Ulungur River are braided water systems. They have no tributaries below the site of A05 (Figure 2), and the water volume decreases along the way. Ultimately, they flow into the Ulungur Lake and become an inland river.
The Tianshan Mountains (Figure 1) lie across Central Asia. They are mainly distributed in Xinjiang in China. The east-west length is about 2500 km, the north-south width is approximately 250–300 km, and the average altitude is about 2 km. The total area is 5.7 × 10⁴ km2 [34]. The Tianshan Mountains divide Xinjiang into two parts: the Tarim Basin in the south and the Junggar Basin in the north. Due to its location in the westerly zone and its enormous height and unique mountain orientation, the Tianshan Mountains intercept a large amount of water vapor from the Atlantic and Arctic Oceans, which brings a large amount of precipitation, making it a water tower in arid areas, with many inland rivers originating here [35]. The Bortala River is in the Bortala Mongolian Autonomous Prefecture in northwestern Xinjiang, China. It is the most important water source for Lake Ebinur (Figure 2).

2.2. Sample Collection and Analysis

During the farmland irrigation period, in May 2020, 25 river water samples (A01–A25) were collected in the Altay Mountains and 29 river water samples in the Tianshan area (T01–T29) (Figure 2). The distribution of sample points is shown in Figure 2. A multiparameter water-quality meter (Hana HI 9828, Hanna Instruments, Inc., Padova, Italy) was used to measure the pH and electrical conductivity (EC) on site. All containers for storing and processing the samples were soaked in 10% nitric acid for 24 h, then washed with deionized water for use. They were then rinsed three times with raw water onsite before sampling, and water samples were collected 0.5 m below the water surface with an upright sampler. After that, the collected river water samples were stored in a 1.5 L polyethylene terephthalate bottle, which was rinsed with sampling water three times. After the water sample was collected, it was filtered through a 0.45 µm filter (cellulose acetate) and collected in a high-density polyethylene tube for measuring the ion content. The cations Ca2+, K+, Mg2+, and Na+, as well as the anions Cl and SO42−, were determined with an ion chromatography system (Dionex ICS-5000, Thermo Fisher Scientific Inc., Waltham, MA, USA). The concentration of the anions HCO3 and CO32− was measured by potentiometric titration with a Mettler G20 potentiometric titrator (Mettler Toledo AG, Greifensee, Switzerland). The charge balance error percentage (CBE) [36] was between 0.4 and 4.5, which is less than ±5%. After the water samples were filtered through a 0.45 μm microporous membrane, 200 mL was acidified with a 0.6 mL nitric acid solution (volume ratio 1:1), and the As content in the solution was analyzed with an Agilent 8800 inductively coupled plasma mass spectrometer (Agilent Technologies, Santa Clara, CA, USA) [7,37].
To ensure the accuracy of the data during the experiment, national standard samples, blank samples, and parallel samples were used in the analysis and determination for the whole analytical quality control process, and the recovery rate was between 98.1% and 103.1%. The detection limit (LOD) of As was 0.0627 µg L−1. After all the samples were tested, 15% of the total samples were taken for repeatability inspection. The test results show that the relative error of this test was about 5%.

2.3. Risks of Aquatic As on Water Quality for Irrigation and Human Health

The human health risks for non-carcinogenic and carcinogenic elements were calculated using Equations (1)–(8) below [38,39,40].
A D D i n g = C × I n g R × E F × E D B W × A T
A D D d e r m = C × S A × K p × E T × E F × E D × f 1 B W × A T
H Q i n g = A D D i n g / R f D i n g
H Q d e r m = A D D d e r m / R f D d e r m
H I = H Q i n g + H Q d e r m
C R i n g = A D D i n g × C S F i n g
C R d e r m = A D D d e r m × C S F d e r m
C I = C R i n g + C R d e r m
The parameters used in the equations are defined in Table S1. HQ < 1 means no significant risk, and HQ > 1 means non-carcinogenic effects may occur [41]. The acceptable/tolerable risk range for CI is 10−6–10−4 [41].

2.4. Mathematical Methods and Classification Diagrams

In a Piper diagram, the relative content of cations is shown in the triangle on the left, and the relative content of anions is shown in the triangle on the right. The diamond is a comprehensive result of the relative content of all ions in the water sample [42]. Using a United States salinity diagram (USSL) [43], the irrigation waters were divided into 16 categories according to the sodium adsorption ratio (SAR) [43] and conductivity. A Wilcox diagram [44], reflecting the relationship between conductivity and Na% [45], was used to evaluate the water quality of the irrigation water. Gibbs diagrams [46] and mixing diagrams [47] were used to determine the influences of the river hydrochemistry.
Multiple linear regression [48] and correlation analysis [49] were used to reveal the relationship among the major ions and As and to discuss the possible factors influencing the content of As in the waters. The above-mentioned statistical methods were conducted with OriginPro 2022 (64-bit) Beta4 (OriginLab, Northampton, MA, USA).

3. Results

3.1. Water Chemistry of Rivers in Tianshan and Altay Mts.

A descriptive statistical analysis of the river-water-chemistry variables in the regions of the Tianshan and Altay Mts. are shown in Table 1 and Table 2, respectively. pH was used as the standard to measure the acidity and alkalinity of natural waters. The pH value of the river waters in the Tianshan Mts. varied from 8.21 to 8.95, with an average value of 8.53. The pH value of the river waters in the Altay Mts. varied from 7.42 to 8.23, with an average value of 7.83. The river water was generally alkaline, and the range of change was not large; in addition, the pH characteristics were also in line with the environmental quality standards for surface water in China (GB 3838–2002) (the standard for pH is 6–9).
Electrical conductivity (EC) reflects the ionic strength of water and is an important indicator of water chemical composition. The electrical conductivity of natural water has a certain correlation with the total dissolved solids (TDS) in the water. The EC value of the river waters in the Altay Mts. ranged from 65.9 to 573 μS cm−1, with an average value of 202 μS cm−1. The EC value of the river waters in the Tianshan Mts. ranged from 137 to 595 μS cm−1, with an average value of 356 μS cm−1.
Total dissolved solids (TDS) is one of the most important indicators for evaluating basin-water quality. The content of TDS is comprehensively affected by the geological conditions in the basin, the source of supply, climatic factors, human activities, and so on. The TDS of the river waters in the Altay Mts. ranged from 31.0 to 405 mg L−1, with an average of 126 mg L−1. The TDS of the river waters in the Tianshan Mts. ranged from 86.1 to 450 mg L−1, with an average value of 246 mg L−1.
Analyzing the cation content in the water samples from the Altay Mts. (Table 2), it was found that the concentration of each cation in the river water was Ca2+ > Na+ > Mg2+ > K+, and the average values of Ca2+, Na+, Mg2+, and K+ were 32.4 mg L−1, 12.6 mg L−1, 4.26 mg L−1, and 1.50 mg L−1, respectively. The highest content of Ca2+ was between 11.7 and 80.4 mg L−1, accounting for a total mass concentration of cations of 52.2–73.7%, while K+ only accounted for 1.63–3.98% of the total mass cation concentration. The order of the anion concentration was HCO3 > SO42 > Cl, and the average ion content for HCO3, SO42, and Cl was 65.7 mg L−1, 35.2 mg L−1, and 7.06 mg L−1, respectively. The highest content of HCO3 fell in between 18.6 and 147 mg L−1, accounting for 45.3–78.0% of the total mass concentration of anions.
For the cation content in the water samples from the Tianshan Mts. (Table 1), it was found that the concentration of each cation in the river water was also Ca2+ > Na+ > Mg2+ >K+, and the average values of Ca2+, Na+, Mg2+, and K+ were 52.8 mg L−1, 21.4 mg L−1, 7.83 mg L−1, and 2.32 mg L−1, respectively. The highest content of Ca2+ was between 25.0 and 98.8 mg L−1, accounting for a total mass cation concentration of 57.5–82.0%, while K+ only accounted for 2.95% of the total mass cation concentration. The order of the anion concentration was HCO3 > SO42 > Cl > CO32−, and the average ion content for HCO3, SO42, Cl, and CO32− was 157.3 mg L−1, 67.5 mg L−1, 14.3 mg L−1, and 1.52 mg L−1, respectively. The highest content of HCO3 fell between 79.4 and 240 mg L−1, accounting for 55.8–83.7% of the total mass concentration of anions, while SO42 accounted for 15.1–35.2% of the total anion concentration. In addition, Cl accounted for 1.12–8.33% and CO32− for 0–0.680% of the total anion concentration. There were obvious differences in As content in the two regions. The average level of As in the rivers in the Tianshan Mountains was 12.2 μg L−1, which exceeds the safety limit of 10 μg L−1 [50].
Piper diagrams were produced based on the equivalent concentrations of anions and cations (milliequivalents per liter, mEq L−1) in the water samples. In the cation triangle diagram (Figure 3), the distribution of water samples in the Altay Mts. was relatively concentrated, mainly in the lower left corner. Ca2+ was the main cation, accounting for 28.3–37.9% of the total ions in milliequivalents per liter, with Mg2+ accounting for 6.04–10.02%, and Na+ + K+ accounting for 6.65–17.2%. In the anion triangle diagram, the sample points mainly fell in the left line. The HCO3 with the highest anion content accounted for 17.0–36.8% of the total ions in milliequivalents; the second was SO42−, which accounted for 4.63–21.1%, and the Cl content was the lowest, 1.87–7.84%. Regarding the classification types [51], 11 water samples fell under the Ca-HCO3 category type (A01, A02, A03, A05, A09, A10, A11, A18, A21, A22, and A24), 12 water samples were of the Ca-HCO3-Cl type (A04, A06, A07, A12, A13, A14, A15, A16, A17, A19, A20, and A23), and 2 water samples belonged to the Ca-Na-HCO3-Cl type (A08 and A25).
In the cation triangle diagram for the river waters in the Tianshan Mts (Figure 4), the distribution of water samples was relatively scattered compared with the water samples in the Altay Mts. Ca2+ was also the main cation, accounting for 15.5–28.7% of the total ions in milliequivalents per liter, with Mg2+ accounting for 3.15–10.7% and Na+ + K+ accounting for 3.20–13.6%. Compared with the river waters in the Altay Mountains, the relative equivalent content of calcium was significantly lower. The HCO3 + CO32− with the highest anion content accounted for 18.5–29.2% of the total ions in milliequivalents. Regarding the classification type, 17 water samples fell under the Ca-HCO3 category type, 6 water samples were of the Ca-HCO3-Cl (T18, T19, T21, T25, T27, and T29) type, and 6 water samples belonged to the Ca-Na-HCO3-Cl type (T20, T22, T23, T24, T26, and T28). According to the distribution of sample points in Figure 1, the latter two types of water bodies were mainly distributed in the lower reaches of the river.

3.2. Applicability for Irrigation and Human Health Risk Evaluation

First, as can be seen from the USSL diagram (Figure 5), the degree of salinity risk and sodium hazard was divided into: C1 (low salinity risk) in the range of <250 μS cm−1, C2 (medium salinity risk) of 250 μS cm−1–750 μS cm−1, C3 (high salinity risk) of 750 μS cm−1–2250 μS cm−1, and C4 (high salinity risk) of >2250 μS cm−1. Subsequently, according to the degree of hazard, waters were divided into S1 (low), S2 (medium), S3 (high), and S4 (very high). It can be seen from the USSL diagram (Figure 5) that the range of EC varied from 65.90 to 573.00 μS cm−1 for the water in the Altay Mts. The range of EC for the rivers in the Tianshan Mts. region was 137 μS cm−1–595 μS cm−1. The samples all fell under the C1 and C2 categories. Among those, 84% of the water samples from the Altay Mts. rivers and 27.6% of the Tianshan Mts. river water samples belonged to the C1–S1 category, with a low salinity risk and a low sodium hazard. In addition, 16% of the water samples from the Altay Mts. rivers and 72.4% of the Tianshan Mts. river water samples belonged to the C1–S2 category, with a low salinity risk and a medium sodium hazard. In general, the water quality of the rivers is suitable for irrigation.
Generally, the water quality in the Wilcox diagram is divided into five types (Figure 6): excellent-to-good water quality, good-to-permissible water quality, permissible-to-doubtful water quality, doubtful-to-unsuitable water quality, and unsuitable water quality categories. If the water-sample points fall in a category with excellent-to-good water quality, this agricultural irrigation water will not cause soil alkalization. However, if they fall in the category where the water quality is good-to-permissible, irrigation may cause the risk of soil alkalization, but the risk is relatively small and appropriate measures can be taken to prevent the occurrence of soil alkalization. From the water samples in the Wilcox diagram (Figure 6), 100% of the water samples from the rivers in the Altay and Tianshan Mts. fell in the irrigation water category with excellent-to-good water quality.
From the perspective of non-carcinogenic risk (Figure 7), the risk of As in the water in the two regions was less than 1, reflecting that there was no non-carcinogenic risk. For river water in the Altay Mts., the maximum non-carcinogenic risk from ingestion and dermal contact was 3.31 × 10⁻³ and the minimum was 4.88 × 10⁻⁴. For the Tianshan area, the maximum value was 7.26 × 10⁻² and the minimum value was 2.50 × 10⁻³.
For river water in the Altay Mts., the minimum carcinogenic risk from ingestion and dermal contact was 9.78 × 10⁻⁶ and the maximum was 6.65 × 10⁻⁵. For the Tianshan area, the maximum value was 1.46 × 10⁻³ and the minimum value was 5.01 × 10⁻⁵.

4. Discussion

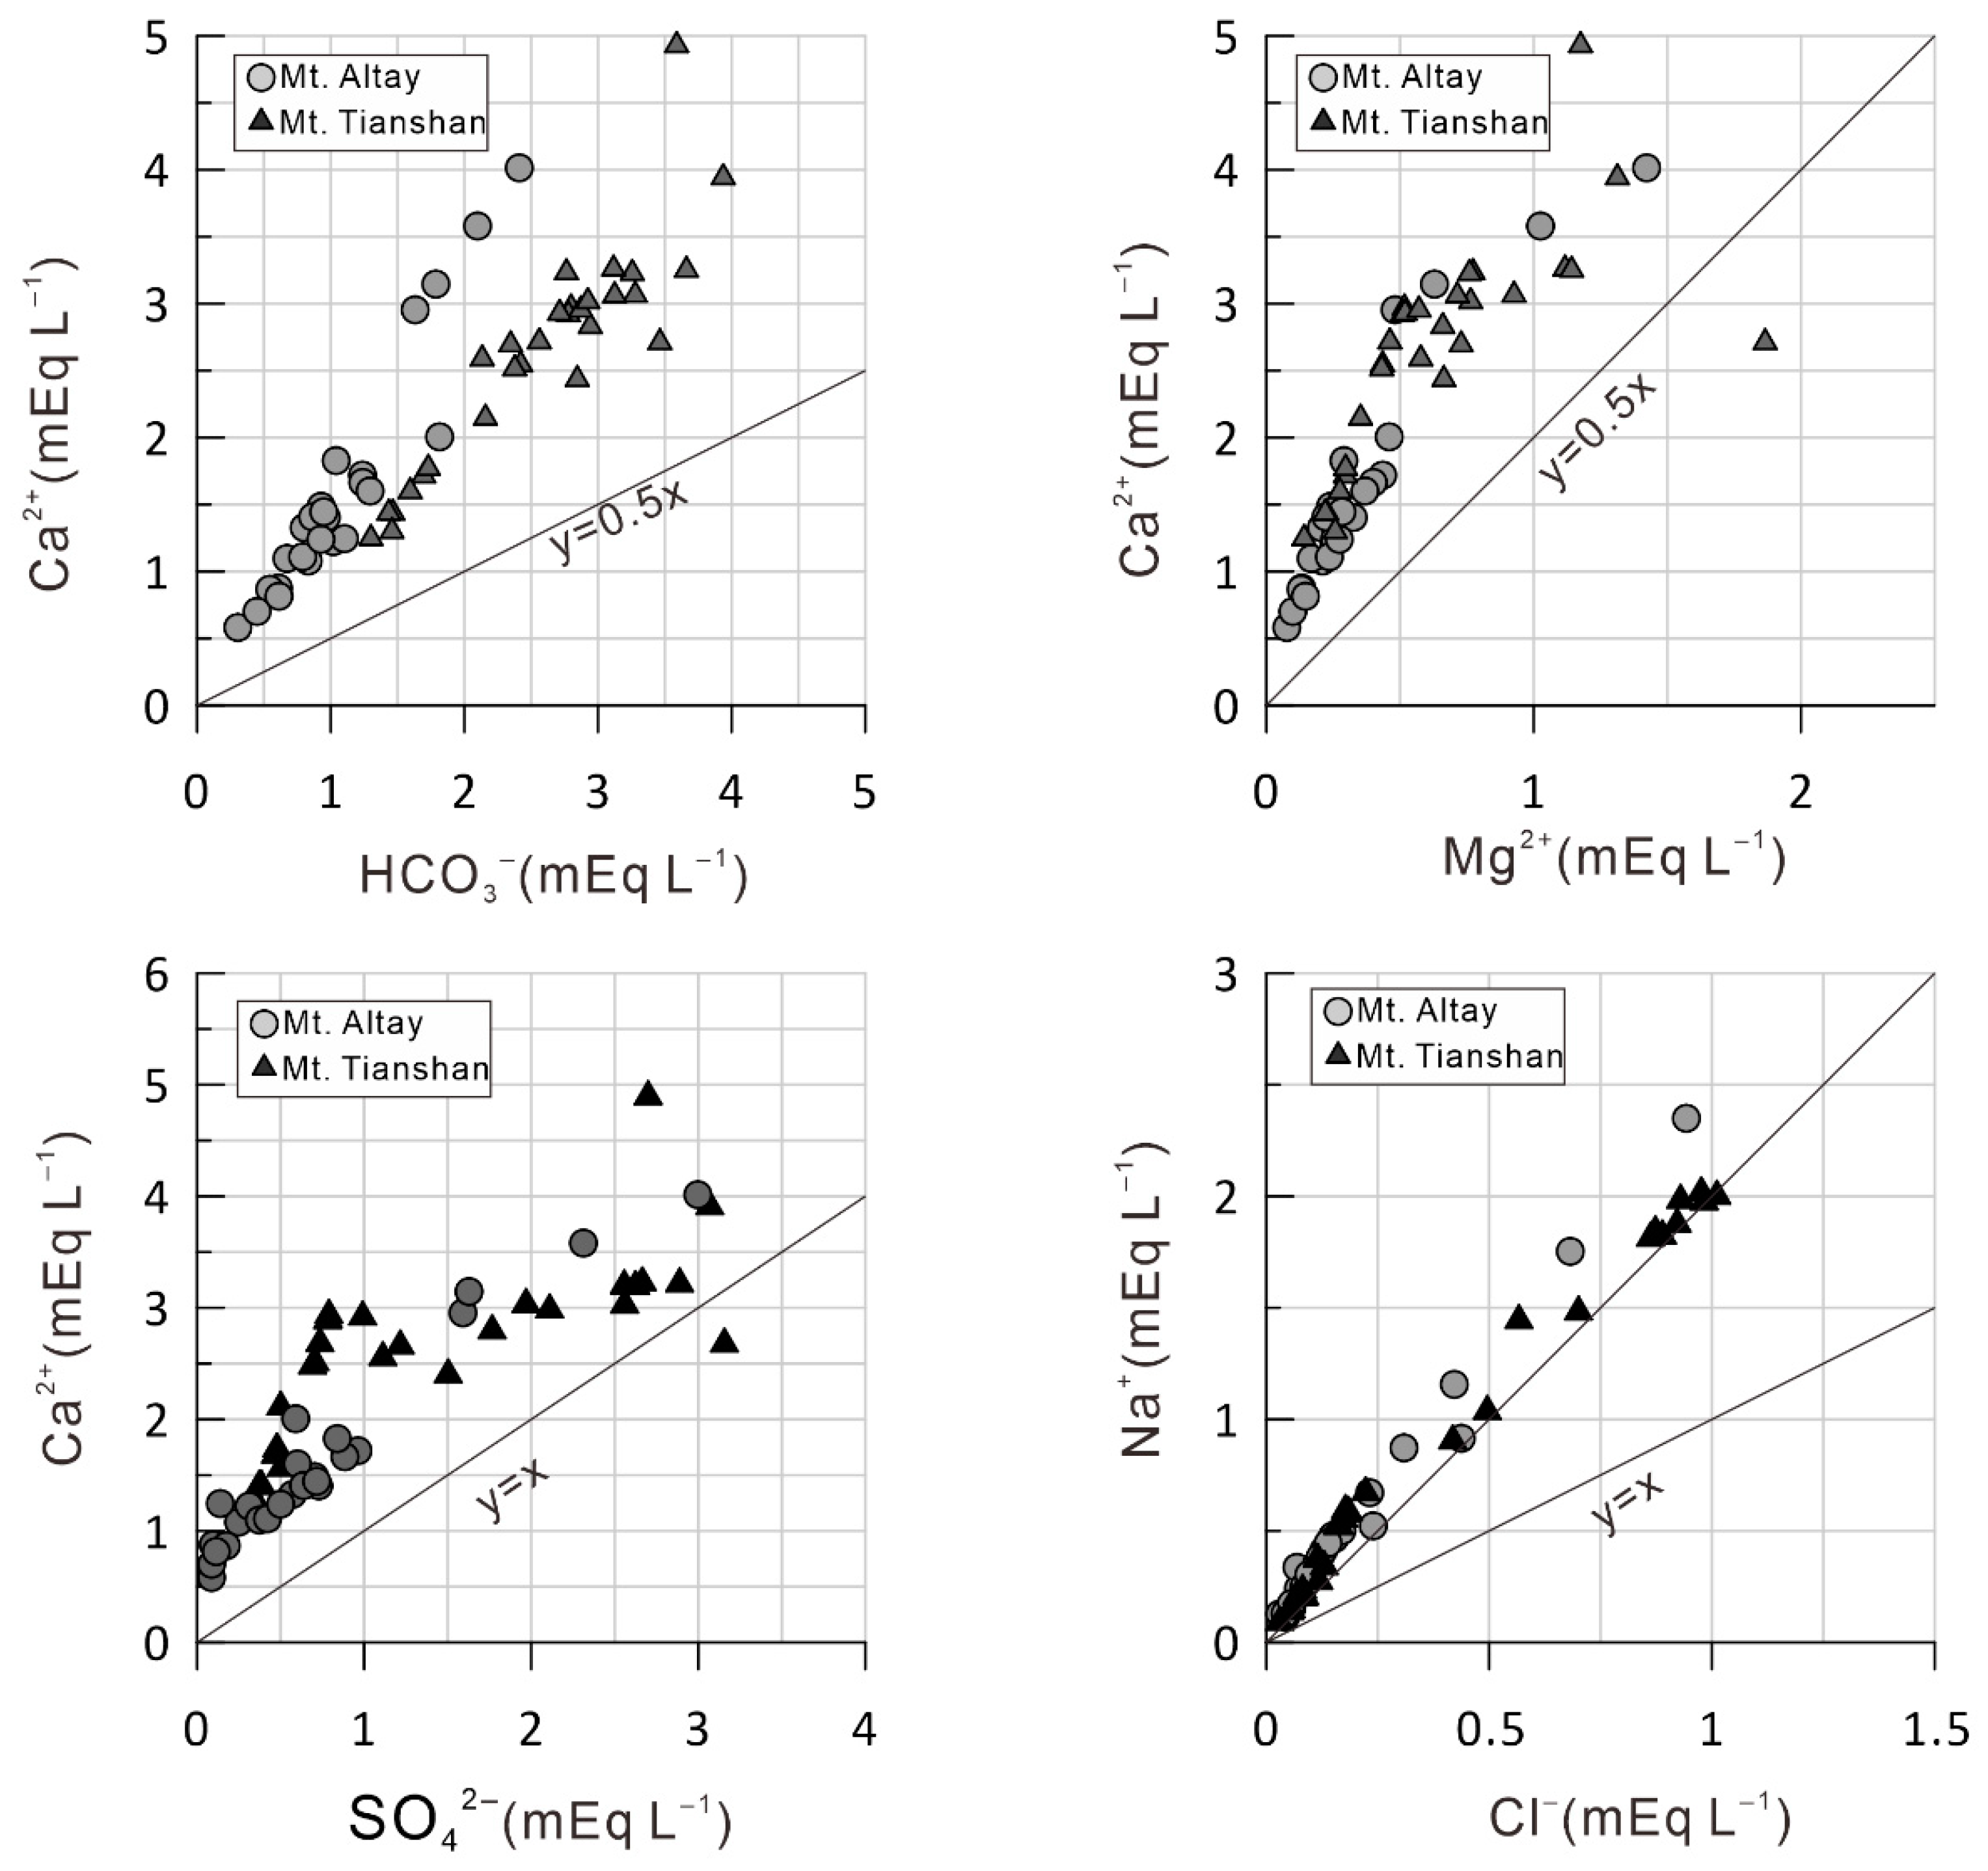
4.1. The Sources of Major Ions for the Waters in the Altay and Tianshan Mts.

The hydrochemical type of water chemistry is a direct reflection of the ion composition in the water. The ions in river water mainly come from inputs from rock weathering, atmospheric precipitation, and human activity. They are a comprehensive manifestation of the influence of climatic conditions, evaporation, the dissolved salt cycle from atmospheric precipitation, rock composition, and human activity. A Gibbs diagram can intuitively express three water-chemistry control modes in a watershed. The process of water-chemical composition is atmospheric precipitation control, rock weathering control, and evaporation and crystallization control [47,52,53,54]. As shown in Figure 8, the Cl/(Cl + HCO3) values of most of the river water samples were between 0.05 and 0.28, and the value of Na+/(Na+ + Ca2+) was between 0.12 and 0.37 in the Altay Mts. The Cl/(Cl + HCO3) value of the river water samples in the Tianshan Mts. was between 0.02 and 0.26, and the value of Na+/(Na+ + Ca2+) was between 0.08 and 0.40. Therefore, in general, almost all the sampling data of the Tianshan and Altay Mts. rivers fall within the rock weathering control. The main components of the water from the two watersheds basically belong to “rock dominance”. From the mixing diagram [55,56] with end-members of carbonate, granite/silicate, and evaporites, the ionic components of the river water bodies in the two regions come from a mixture of three rock types.
For a single ion component, if the Ca2+ originated from gypsum dissolution, the Ca2+/SO42− ratio would be close to 1 [57]. However, in the present study, the Ca2+/SO42− ratio was much greater than 1 (Figure 9), indicating that the excess Ca2+ came from the dissolution of carbonate or silicate minerals. When the basin water is mainly affected by carbonate weathering, due to the subsequent chemical weathering process, the (Ca2+ + Mg2+)/HCO3 equivalent concentration ratio is about 0.5 [37,58]. From the water equivalent ratio diagram of the Tianshan and Altay Mts. (Figure 9), the points of the samples all fell above the 1:1 ratio line. The slope for the Tianshan Mts. was 1.0, and the slope for the Altay Mts. was 1.6, indicating that the water ions in the two basins were only affected by carbonate weathering. If the Ca2+/Mg2+ ion ratio is higher than 2, the natural process is silicate weathering [57]. Similarly, in this region, Ca2+/Mg2+ ratios were much higher than 2, suggesting that the main Ca2+ ions were mainly influenced by silicate weathering processes. This is consistent with the fact that the sample point in the mixed diagram was closer to the silicate end-member.
Generally, the Na+ in river water comes from the weathering of evaporite and silicate. If the equivalent concentration ratio is 1:1, this indicates that the Na+ in the water body in the basin mainly comes from the dissolution of evaporite. The ratio points of river water samples all fell on the 1:1 relationship line, which is above the 1:2 line. It can be inferred that the amount of Na+ from the weathering of silicate was slightly more than the amount from the dissolution of evaporite.
For the arid regions of Central Asia, rivers are the lifeblood of agriculture. Through analysis, it was found that the river water in the Tianshan and Altay Mts. is suitable for agricultural irrigation. However, there is a certain feedback effect. With the increase in the intensity of oasis development, and while a large amount of river water is used for irrigation, the river will bring a large amount of salt into it through the interaction with the soil, and it will be used for irrigation again. Thus, the irrigation water will become too alkaline or too salty. The growth of crops has an impact. Therefore, oasis development must be controlled at an appropriate scale to achieve a harmonious coexistence of the river environment with the oasis environment.

4.2. The Influencing Factors on As and Health Risk Assessment in the Altay and Tianshan Mts. Waters

There was a certain correlation between As and the single major ion, but the correlation was not significant (Figure 10). Does the inconsistency with the single major ion indicate a difference in chemical origin? In this paper, through the establishment of a multivariate review model (the units for the major ion are mEq L−1), it was found that As did not originate from a single rock, but was a mixed product of multiple types. The model for the river waters in the Altay Mts. was As = −0.94 × Ca − 4.61 × (Na + K) − 1.69 × Mg + 3.91 × Cl + 3.33 × SO4 + 1.16 × (HCO3 + CO3) + 0.770 (R2 = 0.692). The model for the Tianshan Mts. was As = –1.49 × Ca + 26.8 × (Na + K) + 31.8 × Mg − 3.76 × Cl − 24.7 × SO4 + 1.25 × (HCO3 + CO3) + 2.0 (R2 = 0.762) (Figure 11). Since the ion composition is mainly affected by the interaction between water and rock, the interaction between water and rock in the river water in the Altay area controlled 69.2% of the overall variance of the As content. Furthermore, it reflected 76.2% of variance in the Tianshan Mts. The difference in As content reflected the difference in regional geological background. However, the As content in the river waters of the Tianshan Mountains was much higher than that in the Altay region, but this did not indicate that the former was more strongly affected by human activity. However, we also need to realize that the As content in 58.6% of the sampling points in the Tianshan Mountains exceeded the safety limit in this study, even if the safety limit was set at 10 µg L−1 [50].
From the perspective of the factors that control the As level in the water, although As is mainly affected by the interaction of water and rock, the influence of human activity is also a factor that cannot be ignored. From the perspective of carcinogenic risk, the risk of As in the water in Altay Mts. was within the acceptable/tolerable risk range of 10−6–10−4 [41,59,60]. However, the carcinogenic risks of As in the rivers of the Tianshan area were significantly higher than that in the Altay region. Except for one sample point (TS25) that exceeded the acceptable range, the rest of the sample points were within the acceptable range. It is necessary to strengthen the analysis of the source of As pollutants and environmental controls. The above mentioned was based on the results of health risks caused by direct contact between the human body and water bodies. However, river waters in arid areas are used as direct sources of irrigation water, and arsenic in water bodies accumulates in the soil through irrigation, then transfers to food crops, which has an impact on humans [61,62,63]. Research in the geochemical study of As in the whole chain of river–soil–crop–human also needs to be strengthened in the future, especially in the Tianshan oasis area with its high As content in the river water bodies.

5. Conclusions

In this study, the influencing factors on the water-chemical characteristics of the two main rivers in the Tianshan and Altay Mountains were discussed, and the suitability of the water quality for irrigation and the health risks of As were evaluated. The main conclusions of the discussion are as follows.
(1).
In the area of the Altay Mts., following the Piper diagram classification type, 44.0% of the water samples fell into the Ca-HCO3category, 48.0% of the water samples were of the Ca-HCO3-Cl type, and the remainder belonged to the Ca-Na-HCO3-Cl type. In the area of the Tianshan Mts., 58.6% of the water samples fell into the Ca-HCO3 hydrochemical type, 20.7% of the water samples were of the Ca-HCO3-Cl type, and 20.7% of the water samples belonged to the Ca-Na-HCO3-Cl type. The major ions in the water were dominated by the control of the water and rock interaction.
(2).
The interaction between the water and the rock in the Altay Mts. area controlled 69% of the overall variance in the As content in the river waters, and it dominated 76% of the variance in the Tianshan Mts. The difference in As content reflected the difference in regional geological background.
(3).
Of the water samples from the rivers in the Altay and Tianshan Mts., 100% were suitable for agricultural irrigation with excellent-to-good water quality. From the perspective of non-carcinogenic/carcinogenic risks, it was found that there was no non-carcinogenic risk and the carcinogenic risk was within the acceptable/tolerable range of 10−6–10−4. However, the non-carcinogenic/carcinogenic risks of As in rivers in the Tianshan area were significantly higher at 1.66 times the risks in the Altay area.

Supplementary Materials

The following are available online at https://www.mdpi.com/article/10.3390/agronomy11112270/s1, Table S1: Definitions and values of parameters used in Equations (1)–(8) for human health risk calculations.

Author Contributions

Conceptualization, L.M.; formal analysis, W.L.; funding acquisition, L.M.; investigation, L.M.; methodology, W.L. and L.M.; supervision, J.A.; visualization, W.L.; writing—original draft, W.L.; writing—review and editing, L.M. and J.A. All authors have read and agreed to the published version of the manuscript.

Funding

This research was funded by National Natural Science Foundation of China (U1903115); the K.C. Wong Education Foundation (GJTD-2020-14), and the High-level Training Project of Xinjiang Institute of Ecology and Geography, CAS (E050030101).

Institutional Review Board Statement

Not applicable.

Informed Consent Statement

Not applicable.

Data Availability Statement

Not applicable.

Conflicts of Interest

The authors declare no conflict of interest.

References

  1. Torabi Haghighi, A.; Abou Zaki, N.; Rossi, P.M.; Noori, R.; Hekmatzadeh, A.A.; Saremi, H.; Kløve, B. Unsustainability syndrome—From meteorological to agricultural drought in arid and semi-arid regions. Water 2020, 12, 838. [Google Scholar] [CrossRef] [Green Version]
  2. Chen, H.; Chen, A.; Xu, L.; Xie, H.; Qiao, H.; Lin, Q.; Cai, K. A deep learning CNN architecture applied in smart near-infrared analysis of water pollution for agricultural irrigation resources. Agric. Water Manag. 2020, 240, 106303. [Google Scholar] [CrossRef]
  3. Xiao, L.; Liu, J.; Ge, J. Dynamic game in agriculture and industry cross-sectoral water pollution governance in developing countries. Agric. Water Manag. 2021, 243, 106417. [Google Scholar] [CrossRef]
  4. Li, C.; Li, G. Impact of China’s water pollution on agricultural economic growth: An empirical analysis based on a dynamic spatial panel lag model. Environ. Sci. Pollut. Res. 2021, 28, 6956–6965. [Google Scholar] [CrossRef] [PubMed]
  5. Cai, P.; Hamdi, R.; He, H.; Luo, G.; Wang, J.; Zhang, M.; Li, C.; Termonia, P.; De Maeyer, P. Numerical study of the interaction between oasis and urban areas within an arid mountains-desert system in Xinjiang, China. Atmosphere 2020, 11, 85. [Google Scholar] [CrossRef] [Green Version]
  6. Zhang, Z.; Ding, J.; Zhu, C.; Chen, X.; Wang, J.; Han, L.; Ma, X.; Xu, D. Bivariate empirical mode decomposition of the spatial variation in the soil organic matter content: A case study from NW China. CATENA 2021, 206, 105572. [Google Scholar] [CrossRef]
  7. Ma, L.; Li, Y.; Abuduwaili, J.; Abdyzhapar uulu, S.; Liu, W. Hydrochemical composition and potentially toxic elements in the Kyrgyzstan portion of the transboundary Chu-Talas river basin, Central Asia. Sci. Rep. 2020, 10, 14972. [Google Scholar] [CrossRef] [PubMed]
  8. Li, X.; Zhang, Y.; Wu, T.; Sun, X.; Yang, T.; Wang, L.; Li, X.; Wang, J.; Wang, Y.; Yu, H. Major ions in drinking and surface waters from five cities in arid and semi-arid areas, NW China: Spatial occurrence, water chemistry, and potential anthropogenic inputs. Environ. Sci. Pollut. Res. 2020, 27, 5456–5468. [Google Scholar] [CrossRef] [PubMed]
  9. Liu, J.; Han, G. Distributions and source identification of the major ions in Zhujiang River, Southwest China: Examining the relationships between human perturbations, chemical weathering, water quality and health risk. Expo. Health 2020, 12, 849–862. [Google Scholar] [CrossRef]
  10. Gao, D.; Long, A.; Yu, J.; Xu, H.; Su, S.; Zhao, X. Assessment of inter-sectoral virtual water reallocation and linkages in the Northern Tianshan Mountains, China. Water 2020, 12, 2363. [Google Scholar] [CrossRef]
  11. Fan, M.; Xu, J.; Chen, Y.; Li, W. Reconstructing high-resolution temperature for the past 40 years in the Tianshan Mountains, China based on the Earth system data products. Atmos. Res. 2021, 253, 105493. [Google Scholar] [CrossRef]
  12. Zheng, L.; Xia, Z.; Xu, J.; Chen, Y.; Yang, H.; Li, D. Exploring annual lake dynamics in Xinjiang (China): Spatiotemporal features and driving climate factors from 2000 to 2019. Clim. Chang. 2021, 166, 1–20. [Google Scholar] [CrossRef]
  13. Liu, D.; Wang, X.; Nie, L.; Liu, H.; Zhang, B.; Wang, W. Comparison of geochemical patterns from different sampling density geochemical mapping in Altay, Xinjiang Province, China. J. Geochem. Explor. 2021, 106761. [Google Scholar] [CrossRef]
  14. Goenster-Jordan, S.; Ingold, M.; Jannoura, R.; Buerkert, A.; Joergensen, R.G. Soil microbial properties of subalpine steppe soils at different grazing intensities in the Chinese Altai Mountains. Sci. Rep. 2021, 11, 1–8. [Google Scholar] [CrossRef] [PubMed]
  15. Zhuang, Q.; Shao, Z.; Huang, X.; Zhang, Y.; Wu, W.; Feng, X.; Lv, X.; Ding, Q.; Cai, B.; Altan, O. Evolution of soil salinization under the background of landscape patterns in the irrigated northern slopes of Tianshan Mountains, Xinjiang, China. CATENA 2021, 206, 105561. [Google Scholar] [CrossRef]
  16. Li, Q.; Wu, J.; Zhou, J.; Sakiev, K.; Hofmann, D. Occurrence of polycyclic aromatic hydrocarbon (PAH) in soils around two typical lakes in the western Tian Shan Mountains (Kyrgyzstan, Central Asia): Local burden or global distillation? Ecol. Indic. 2020, 108, 105749. [Google Scholar] [CrossRef]
  17. Wang, X.; Yang, T.; Xu, C.-Y.; Xiong, L.; Shi, P.; Li, Z. The response of runoff components and glacier mass balance to climate change for a glaciated high-mountainous catchment in the Tianshan Mountains. Nat. Hazards 2020, 104, 1239–1258. [Google Scholar] [CrossRef]
  18. Wufu, A.; Chen, Y.; Yang, S.; Lou, H.; Wang, P.; Li, C.; Wang, J.; Ma, L. Changes in Glacial Meltwater Runoff and Its Response to Climate Change in the Tianshan Region Detected Using Unmanned Aerial Vehicles (UAVs) and Satellite Remote Sensing. Water 2021, 13, 1753. [Google Scholar] [CrossRef]
  19. Min, Y.; Huang, W.; Ma, M.; Zhang, Y. Simulations in the Topography Effects of Tianshan Mountains on an Extreme Precipitation Event in the Ili River Valley, China. Atmosphere 2021, 12, 750. [Google Scholar] [CrossRef]
  20. Jiménez-Oyola, S.; Escobar Segovia, K.; García-Martínez, M.-J.; Ortega, M.; Bolonio, D.; García-Garizabal, I.; Salgado, B. Human Health Risk Assessment for Exposure to Potentially Toxic Elements in Polluted Rivers in the Ecuadorian Amazon. Water 2021, 13, 613. [Google Scholar] [CrossRef]
  21. Sharma, S.; Nagpal, A.; Kaur, I. Potentially toxic elements in river water and associated health risks in Ropar Wetland, India and its vicinity. Int. J. Environ. Sci. Technol. 2021, 1–24. [Google Scholar] [CrossRef]
  22. Vareda, J.P.; Valente, A.J.; Durães, L. Assessment of heavy metal pollution from anthropogenic activities and remediation strategies: A review. J. Environ. Manag. 2019, 246, 101–118. [Google Scholar] [CrossRef] [PubMed]
  23. Kumar, V.; Parihar, R.D.; Sharma, A.; Bakshi, P.; Sidhu, G.P.S.; Bali, A.S.; Karaouzas, I.; Bhardwaj, R.; Thukral, A.K.; Gyasi-Agyei, Y. Global evaluation of heavy metal content in surface water bodies: A meta-analysis using heavy metal pollution indices and multivariate statistical analyses. Chemosphere 2019, 236, 124364. [Google Scholar] [CrossRef]
  24. Chen, Q.Y.; DesMarais, T.; Costa, M. Metals and mechanisms of carcinogenesis. Annu. Rev. Pharmacol. Toxicol. 2019, 59, 537–554. [Google Scholar] [CrossRef] [PubMed]
  25. Rebello, S.; Sivaprasad, M.; Anoopkumar, A.; Jayakrishnan, L.; Aneesh, E.M.; Narisetty, V.; Sindhu, R.; Binod, P.; Pugazhendhi, A.; Pandey, A. Cleaner technologies to combat heavy metal toxicity. J. Environ. Manag. 2021, 296, 113231. [Google Scholar] [CrossRef]
  26. Sodhi, K.K.; Kumar, M.; Agrawal, P.K.; Singh, D.K. Perspectives on arsenic toxicity, carcinogenicity and its systemic remediation strategies. Environ. Technol. Innov. 2019, 16, 100462. [Google Scholar] [CrossRef]
  27. Kumar, R.; Patel, M.; Singh, P.; Bundschuh, J.; Pittman Jr, C.U.; Trakal, L.; Mohan, D. Emerging technologies for arsenic removal from drinking water in rural and peri-urban areas: Methods, experience from, and options for Latin America. Sci. Total Environ. 2019, 694, 133427. [Google Scholar] [CrossRef]
  28. Han, L.; Gao, B.; Hao, H.; Lu, J.; Xu, D. Arsenic pollution of sediments in China: An assessment by geochemical baseline. Sci. Total Environ. 2019, 651, 1983–1991. [Google Scholar] [CrossRef]
  29. Alka, S.; Shahir, S.; Ibrahim, N.; Ndejiko, M.J.; Vo, D.-V.N.; Abd Manan, F. Arsenic removal technologies and future trends: A mini review. J. Clean. Prod. 2021, 278, 123805. [Google Scholar] [CrossRef]
  30. Podgorski, J.; Berg, M. Global threat of arsenic in groundwater. Science 2020, 368, 845–850. [Google Scholar] [CrossRef]
  31. Li, Y.; Ma, L.; Abuduwaili, J.; Li, Y.; Abdyzhapar uulu, S. Spatiotemporal Distributions of Fluoride and Arsenic in Rivers with the Role of Mining Industry and Related Human Health Risk Assessments in Kyrgyzstan. Expo. Health 2021. [Google Scholar] [CrossRef]
  32. Jawadi, H.A.; Malistani, H.A.; Moheghy, M.A.; Sagin, J. Essential Trace Elements and Arsenic in Thermal Springs, Afghanistan. Water 2021, 13, 134. [Google Scholar] [CrossRef]
  33. Bi, X.; Chang, B.; Hou, F.; Yang, Z.; Fu, Q.; Li, B. Assessment of spatio-temporal variation and driving mechanism of ecological environment quality in the Arid regions of central asia, Xinjiang. Int. J. Environ. Res. Public Health 2021, 18, 7111. [Google Scholar] [CrossRef] [PubMed]
  34. Fan, Y.; Shang, H.; Wu, Y.; Li, Q. Tree-Ring Width and Carbon Isotope Chronologies Track Temperature, Humidity, and Baseflow in the Tianshan Mountains, Central Asia. Forests 2020, 11, 1308. [Google Scholar] [CrossRef]
  35. Guan, X.; Yao, J.; Schneider, C. Variability of the precipitation over the Tianshan Mountains, Central Asia. Part I: Linear and nonlinear trends of the annual and seasonal precipitation. Int. J. Climatol. 2021. [Google Scholar] [CrossRef]
  36. He, X.; Li, P. Surface water pollution in the middle Chinese Loess Plateau with special focus on hexavalent chromium (Cr 6+): Occurrence, sources and health risks. Expo. Health 2020, 12, 385–401. [Google Scholar] [CrossRef]
  37. Ma, L.; Abuduwaili, J.; Li, Y.; Abdyzhaparuulu, S.; Mu, S. Hydrochemical Characteristics and Water Quality Assessment for the Upper Reaches of Syr Darya River in Aral Sea Basin, Central Asia. Water 2019, 11, 1893. [Google Scholar] [CrossRef] [Green Version]
  38. Singh, U.K.; Ramanathan, A.L.; Subramanian, V. Groundwater chemistry and human health risk assessment in the mining region of East Singhbhum, Jharkhand, India. Chemosphere 2018, 204, 501–513. [Google Scholar] [CrossRef]
  39. Wang, J.; Liu, G.; Liu, H.; Lam, P.K.S. Multivariate statistical evaluation of dissolved trace elements and a water quality assessment in the middle reaches of Huaihe River, Anhui, China. Sci. Total Environ. 2017, 583, 421–431. [Google Scholar] [CrossRef]
  40. Ma, Y.; Egodawatta, P.; McGree, J.; Liu, A.; Goonetilleke, A. Human health risk assessment of heavy metals in urban stormwater. Sci. Total Environ. 2016, 557–558, 764–772. [Google Scholar] [CrossRef]
  41. Ferreira-Baptista, L.; De Miguel, E. Geochemistry and risk assessment of street dust in Luanda, Angola: A tropical urban environment. Atmos. Environ. 2005, 39, 4501–4512. [Google Scholar] [CrossRef] [Green Version]
  42. Rakotondrabe, F.; Ndam Ngoupayou, J.R.; Mfonka, Z.; Rasolomanana, E.H.; Nyangono Abolo, A.J.; Ako Ako, A. Water quality assessment in the Bétaré-Oya gold mining area (East-Cameroon): Multivariate Statistical Analysis approach. Sci. Total Environ. 2018, 610–611, 831–844. [Google Scholar] [CrossRef] [PubMed]
  43. Adimalla, N. Groundwater Quality for Drinking and Irrigation Purposes and Potential Health Risks Assessment: A Case Study from Semi-Arid Region of South India. Expo. Health 2019, 11, 109–123. [Google Scholar] [CrossRef]
  44. Subramani, T.; Elango, L.; Damodarasamy, S.R. Groundwater quality and its suitability for drinking and agricultural use in Chithar River Basin, Tamil Nadu, India. Environ. Geol. 2005, 47, 1099–1110. [Google Scholar] [CrossRef]
  45. Zhang, B.; Song, X.; Zhang, Y.; Han, D.; Tang, C.; Yu, Y.; Ma, Y. Hydrochemical characteristics and water quality assessment of surface water and groundwater in Songnen plain, Northeast China. Water Res. 2012, 46, 2737–2748. [Google Scholar] [CrossRef]
  46. Dehbandi, R.; Moore, F.; Keshavarzi, B. Geochemical sources, hydrogeochemical behavior, and health risk assessment of fluoride in an endemic fluorosis area, central Iran. Chemosphere 2018, 193, 763–776. [Google Scholar] [CrossRef]
  47. Qu, B.; Zhang, Y.; Kang, S.; Sillanpää, M. Water quality in the Tibetan Plateau: Major ions and trace elements in rivers of the “Water Tower of Asia”. Sci. Total Environ. 2019, 649, 571–581. [Google Scholar] [CrossRef]
  48. Abba, S.I.; Hadi, S.J.; Sammen, S.S.; Salih, S.Q.; Abdulkadir, R.A.; Pham, Q.B.; Yaseen, Z.M. Evolutionary computational intelligence algorithm coupled with self-tuning predictive model for water quality index determination. J. Hydrol. 2020, 587, 124974. [Google Scholar] [CrossRef]
  49. Yang, K.; Luo, Y.; Chen, K.; Yang, Y.; Shang, C.; Yu, Z.; Xu, J.; Zhao, Y. Spatial–temporal variations in urbanization in Kunming and their impact on urban lake water quality. Land Degrad. Dev. 2020, 31, 1392–1407. [Google Scholar] [CrossRef]
  50. Ahmad, A.; Bhattacharya, P. Arsenic in drinking water: Is 10 μg/L a safe limit? Curr. Pollut. Rep. 2019, 5, 1–3. [Google Scholar] [CrossRef] [Green Version]
  51. McPhillips, L.E.; Creamer, A.E.; Rahm, B.G.; Walter, M.T. Assessing dissolved methane patterns in central New York groundwater. J. Hydrol. Reg. Stud. 2014, 1, 57–73. [Google Scholar] [CrossRef] [Green Version]
  52. Thapa, R.; Gupta, S.; Gupta, A.; Reddy, D.V.; Kaur, H. Geochemical and geostatistical appraisal of fluoride contamination: An insight into the Quaternary aquifer. Sci. Total Environ. 2018, 640–641, 406–418. [Google Scholar] [CrossRef] [PubMed]
  53. Rashid, A.; Guan, D.-X.; Farooqi, A.; Khan, S.; Zahir, S.; Jehan, S.; Khattak, S.A.; Khan, M.S.; Khan, R. Fluoride prevalence in groundwater around a fluorite mining area in the flood plain of the River Swat, Pakistan. Sci. Total Environ. 2018, 635, 203–215. [Google Scholar] [CrossRef] [PubMed] [Green Version]
  54. Weynell, M.; Wiechert, U.; Zhang, C. Chemical and isotopic (O, H, C) composition of surface waters in the catchment of Lake Donggi Cona (NW China) and implications for paleoenvironmental reconstructions. Chem. Geol. 2016, 435, 92–107. [Google Scholar] [CrossRef]
  55. Tenorio, G.E.; Vanacker, V.; Campforts, B.; Álvarez, L.; Zhiminaicela, S.; Vercruysse, K.; Molina, A.; Govers, G. Tracking spatial variation in river load from Andean highlands to inter-Andean valleys. Geomorphology 2018, 308, 175–189. [Google Scholar] [CrossRef]
  56. Gaillardet, J.; Dupré, B.; Louvat, P.; Allègre, C.J. Global silicate weathering and CO2 consumption rates deduced from the chemistry of large rivers. Chem. Geol. 1999, 159, 3–30. [Google Scholar] [CrossRef]
  57. Zhang, Y.; Xu, M.; Li, X.; Qi, J.; Zhang, Q.; Guo, J.; Yu, L.; Zhao, R. Hydrochemical characteristics and multivariate statistical analysis of natural water system: A case study in Kangding County, Southwestern China. Water 2018, 10, 80. [Google Scholar] [CrossRef] [Green Version]
  58. van Geldern, R.; Schulte, P.; Mader, M.; Baier, A.; Barth, J.A.C.; Juhlke, T.R.; Lee, K. Insights into agricultural influences and weathering processes from major ion patterns. Hydrol. Process. 2018, 32, 891–903. [Google Scholar] [CrossRef] [Green Version]
  59. Jiang, Y.; Chao, S.; Liu, J.; Yang, Y.; Chen, Y.; Zhang, A.; Cao, H. Source apportionment and health risk assessment of heavy metals in soil for a township in Jiangsu Province, China. Chemosphere 2017, 168, 1658–1668. [Google Scholar] [CrossRef] [PubMed]
  60. Lu, X.; Zhang, X.; Li, L.Y.; Chen, H. Assessment of metals pollution and health risk in dust from nursery schools in Xi’an, China. Environ. Res. 2014, 128, 27–34. [Google Scholar] [CrossRef] [PubMed]
  61. Jahan, I.; Abedin, M.A.; Islam, M.R.; Hossain, M.; Hoque, T.S.; Quadir, Q.F.; Hossain, M.I.; Gaber, A.; Althobaiti, Y.S.; Rahman, M.M. Translocation of Soil Arsenic towards Accumulation in Rice: Magnitude of Water Management to Minimize Health Risk. Water 2021, 13, 2816. [Google Scholar] [CrossRef]
  62. Harine, I.J.; Islam, M.R.; Hossain, M.; Afroz, H.; Jahan, R.; Siddique, A.B.; Uddin, S.; Hossain, M.A.; Alamri, S.; Siddiqui, M.H.; et al. Arsenic Accumulation in Rice Grain as Influenced by Water Management: Human Health Risk Assessment. Agronomy 2021, 11, 1741. [Google Scholar] [CrossRef]
  63. Kamiya, T.; Islam, R.; Duan, G.; Uraguchi, S.; Fujiwara, T. Phosphate deficiency signaling pathway is a target of arsenate and phosphate transporter OsPT1 is involved in As accumulation in shoots of rice. Soil Sci. Plant Nutr. 2013, 59, 580–590. [Google Scholar] [CrossRef]
Figure 1. The location of the Altay and Tianshan Mts. in Central Asia and the geographical location of Figure 2a,b). The topography was based on SRTM 90m Digital Elevation Database v4.1 (http://srtm.csi.cgiar.org, accessed on 20 August 2021).
Agronomy 11 02270 g001
Figure 2. The water-sample locations in the regions of the Tianshan (a) and Altay (b) Mts. The globe land cover map was based on GlobCover2009 from European Space Agency GlobCover Portal (http://due.esrin.esa.int/page_globcover.php, accessed on 20 August 2021).
Agronomy 11 02270 g002
Figure 3. Piper diagram with hydrochemical types for water samples from the region of the Altay Mts.
Agronomy 11 02270 g003
Figure 4. Piper diagram with hydrochemical types for water samples from the region of the Tianshan Mts.
Agronomy 11 02270 g004
Figure 5. The irrigation assessment for the water samples from the regions of the Tianshan and Altay Mts. using a United States salinity diagram (USSL).
Agronomy 11 02270 g005
Figure 6. The irrigation assessment for the water samples from the regions of the Tianshan and Altay Mts. using a Wilcox diagram.
Agronomy 11 02270 g006
Figure 7. The non-carcinogenic (a) and carcinogenic (b) health risks for waters in the regions of the Tianshan and Altay Mts.
Agronomy 11 02270 g007
Figure 8. The Gibbs and mixing diagrams for the waters in the regions of the Tianshan and Altay Mts.
Agronomy 11 02270 g008
Figure 9. The relationship among the major ions of waters in the regions of the Tianshan and Altay Mts.
Agronomy 11 02270 g009
Figure 10. The correlation plots for the relationship among the major ions and arsenic (As) for waters in the regions of the Tianshan and Altay Mts. The flatness of the ellipse is consistent with the absolute value of the correlation coefficient. When the ellipse is close to the circle, the correlation coefficient is close to zero. The color of the ellipse corresponds to the sign of the correlation.
Agronomy 11 02270 g010
Figure 11. The observed value of arsenic (As) versus the predicated value from the multiple regression mode for waters in the regions of the Altay Mts. (a), and Tianshan Mts. (b).
Agronomy 11 02270 g011
Table 1. Descriptive statistical analysis of river-water-chemistry variables in Tianshan Mts. area (n = 29). Parameters include: mean value, standard deviation (SD), standard error of mean (SE), minimum (Min), median, and maximum (Max) value.
VariableUnitMeanSDSEMinMedianMax
TDSmg L−1246 115 21.5 86.1 209 450
pH/8.53 0.160 0.03 8.21 8.50 8.95
ECμS cm−1356 155 28.9 137 311 595
Clmg L−114.3 13.0 2.41 1.06 6.44 35.9
SO42−mg L−167.5 47.38.78 14.4 47.6 152
Ca2+mg L−152.8 16.5 3.06 25.0 54.4 98.8
K+mg L−12.32 0.760 0.1411.30 2.02 3.60
Mg2+mg L−17.83 4.73 0.878 1.72 6.94 22.7
Na+mg L−121.4 16.5 3.06 2.48 13.8 46.8
CO32−mg L−11.52 0.810 0.150 0 1.30 2.94
HCO3mg L−1157 45.1 8.38 79.4 168 240
Asμg L−112.2 7.82 1.45 1.21 11.2 35.0
Table 2. Descriptive statistical analysis of river-water-chemistry variables in Altay Mts. region (n = 25). Parameters include: mean value, standard deviation (SD), standard error of mean (SE), minimum (Min), median, and maximum (Max) value.
VariableUnitMeanSDSEMinMedianMax
TDSmg L−1126 89.9 18.0 31.0 148 405
pH/7.83 0.210 0.0420 7.42 7.95 8.23
ECμS cm−1202 120 24.0 65.9 233 573
Clmg L−17.06 7.72 1.54 1.07 8.22 33.4
SO42−mg L−135.0 34.4 6.88 4.18 40.3 144
Ca2+mg L−132.4 17.9 3.57 11.7 34. 5 80.4
K+mg L−11.50 0.560 0.112 0.630 1.89 2.52
Mg2+mg L−14.26 3.64 0.728 0.930 4.86 17.3
Na+mg L−112.6 12.2 2.44 2.600 12.0 54.0
CO32−mg L−10 0 0 000
HCO3mg L−165.7 31.7 6.35 18.675.7147
Asμg L−10.730 0.400 0.080 0.240 1.04 1.60
Publisher’s Note: MDPI stays neutral with regard to jurisdictional claims in published maps and institutional affiliations.

