1. Introduction
Radiation use efficiency (RUE), also known as light use efficiency (LUE), is defined as the plant’s ability to convert photosynthetically active radiation (PAR) into biomass on a per unit basis [
1]. This measurement of photosynthetic performance is important for crop growth modeling [
2]. RUE varies between species and even among cultivars, but generally, cultivar-dependent RUE values are unavailable [
3].
There is no uniform procedure for RUE estimation. Of the three commonly used methods to estimate RUE (i) from incoming radiation (RUE
inc), (ii) total absorbed light (RUE
total), and (iii) radiation absorbed by photosynthetically active vegetation (RUE
green) [
4], Tewes and Schellberg [
5] made the case to have RUE
green (Equation (1)) be the standard method. By only considering the photosynthetically active vegetation to determine the fraction of absorbed photosynthetically active radiation (fAPAR
green) (Equation (2)), RUE estimation becomes sensitive to the changes of the photosynthetically active radiation (PAR) absorption through the reproductive stages, senescence, and potentially to disease.
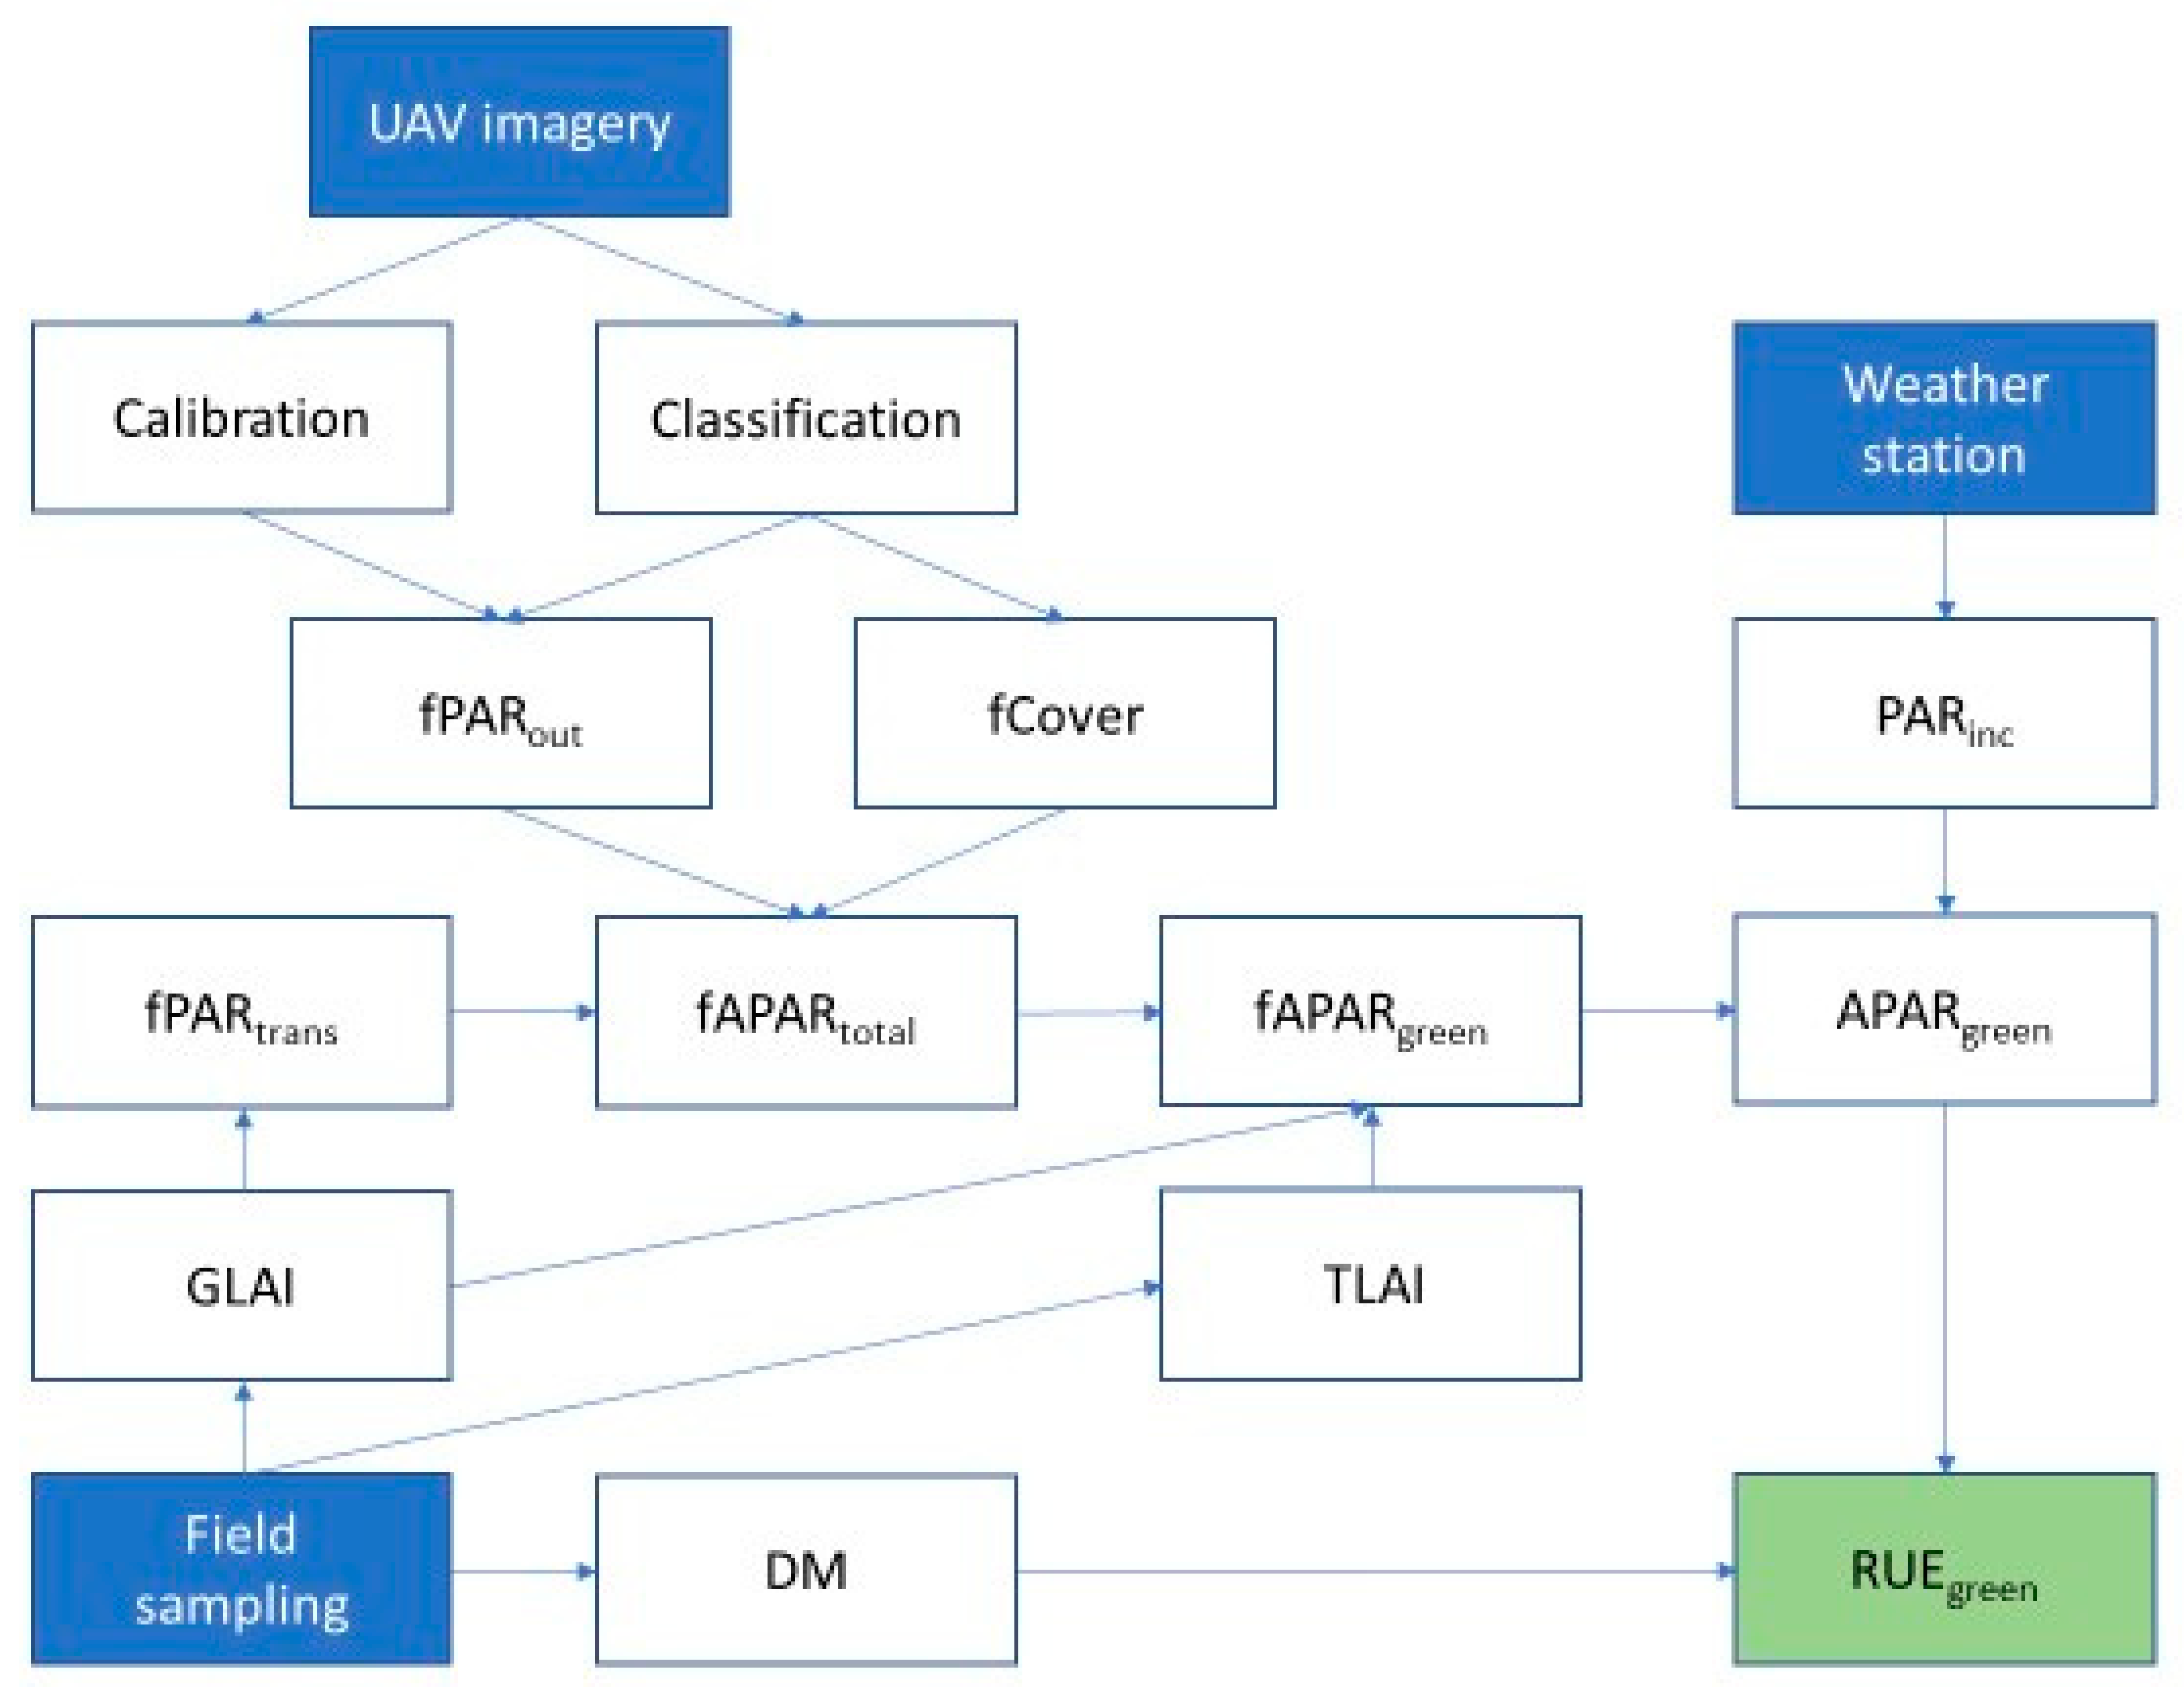
RUE estimation uses in-field sensors and destructive sampling to acquire the needed components consisting of incoming radiation, reflectance data, total leaf area index (TLAI), green leaf area index (GLAI), and dry matter (DM). Sensors are placed below the canopy facing the soil for PAR
soil, above the canopy facing down to gather reflectance (PAR
out), above the canopy facing up for PAR
inc, and beneath the canopy facing up to determine the PAR passing through the canopy (PAR
trans). This cumbersome method makes RUE estimation on a small plot scale with various treatments unreasonable. However, applications involving Unmanned Aerial Vehicles (UAV) provides a potential workaround. Tewes and Schellberg [
5] demonstrated the derivation of reflectance (PAR
out) for estimation of RUE in corn (
Zea mays, L.) using a UAV and a consumer-grade camera. Their RUE estimations were similar to previously published values for maize [
5].
Soybean (
Glycine max L.) RUE values range from 0.60 to 2.53 g Mj
−1 [
6,
7] (
Table 1). RUE values are assumed to be constant. However, Gitelson et al. [
8] describe facultative and constitutive changes that result in diurnal and seasonal fluctuations of RUE
green [
9]. For example, soybean plants experience stress from diseases or disorders during the growing season, which may negatively affect RUE values.
Foliar disease would be considered a constitutive property since disease development may be relatively slow and irreversible. Foliar diseases such as soybean rust (SBR) and frogeye leafspot (FLS) caused by the pathogens
Phakopsora pachyrhizi Syd. and
Cercospora sojina Hara, respectively, reduce green leaf area. The severity of the foliar disease often increases over the growing season. Specifically, Kumudini et al. [
16] showed biomass reductions were correlated to the reduction of photosynthetically active radiation (APAR) and the RUE of non-lesion green LAI caused by SBR lesions. With respect to disease severity, the lesion area of the foliar pathogen SBR reduced APAR between 5% and 20% [
16].
The use of foliar fungicides has increased since 2005 in soybean to manage foliar diseases [
17]. In addition, the quinone outside inhibitor (QoI) containing fungicides have been promoted to have plant health benefits in the absence of disease, called the “greening effect” [
17,
18,
19]. This phenomenon is described as improved photosynthetic efficiency by maintaining green leaf area to allow for additional dry matter accumulation, resulting in increased yields [
20,
21,
22]. However, yield benefits have been inconsistent [
22,
23,
24]. Conversely, Phillips et al. [
25] cautioned that prophylactic applications of QoI fungicides increased the likelihood of developing green stem disorder (GSD).
With new technology, soybean RUE may be estimated using remote sensing. The efficient estimation may encourage the incorporation of RUE into soybean small plot research, improvements of yield models, and to evaluate the usefulness of in-season management practices. The objectives of this study were to: (i) demonstrate RUE estimation of soybean from reflectance data derived from consumer-grade UAV imagery and (ii) investigate the impact of foliar fungicides on RUE in Iowa.
2. Materials and Methods
Soybean cultivar NK S29-K3X was planted near Kanawha, IA on 16 May 2019 at a rate of 395,362 seeds ha
−1 in eight row plots that were 7.8-m long and spaced 76-cm apart (
Table 2). Location soil type was Nicollet clay loam with a slope of 1 to 3 percent. Three fungicide treatments were organized in a randomized complete block design (RCBD) with six replications. The three treatments were (1) non-treated control, (2) fluxapyroxad + pyraclostrobin (Priaxor©, 0.05-L ha
−1, BASF, Research Triangle Park, NC), and (3) flutriafol + fluoxastrobin (Preemptor©, 0.06-L ha
−1, FMC Agricultural Solutions, Philadelphia, PA, USA). Pyraclostrobin and fluxastrobin are QoI (FRAC code 11) fungicides, while fluxapyroxad is a succinate dehydrogenase inhibitor (SDHI; FRAC code 7) and flutriafol is a demethylation inhibitor (DMI; FRAC code 3) fungicide. Fungicides were applied 67 days after planting at the R3 growth stage, beginning pod [
26], with a self-propelled research sprayer powered by a CO
2 tank that delivered fungicides using XR 11002 nozzles at 142 to 189 L ha
–1 at 241 kpa. The middle two rows of each plot were harvested on 29 October 2019 to assess yield using a 2009 Almaco SPC20 research plot combine (ALMACO, Nevada, IA, USA). Yield calculations were adjusted to 13% seed moisture.
Field data were collected every 6 to 11 days from the VC through R7.5 growth stage (22–130 days after planting) [
26] for a total of 14 sampling dates. At each sampling date (SD), a single 0.5-m section from one of the three outermost rows was examined. To avoid edge effects, this sampling section was kept 0.5-m from row ends and previously sampled sections [
27]. From this portion of the row, total plant count, disease severity, leaf area, and dry mass data were obtained. FLS severity was determined from the upper and lower canopies of all plants and averaged for each experimental unit, a single plot. Leaf area and DM measurements were derived from a maximum of 10 plants cut at the soil line and bundled together. After cutting, plant bundles were stored in labeled plastic bags at 4 °C until further processing 2 to 10 days later.
The leaf area of the measured section of the row was determined using an LI-3100C (LI-COR, Inc., Lincoln, NE, USA). All leaves were stripped from the collected plants and separated into two groups, green and non-green (>50% non-green for any reason). A single leaf area value, consisting of the sum area of all leaves, was assigned to each green and non-green group. This partitioning allowed us to collect GreenLAI (GLAI) and YellowLAI (YLAI) values to be used in the APAR equation.
Leaf area was converted to m
2 and used to estimate leaf area index (LAI; m
2 m
−2) based on the number of plants sampled and the number of plants in the sampled area [
28]. All above-ground plant parts from each plot were dried for seven days in brown paper bags placed in drying bins with fans at 60 °C [
25]. Dried samples were weighed in bags and adjusted to exclude bag weight to obtain dry matter of the entire plant including seeds (DM; Taylor Precision Products, Oak Brook, IL, Glass Digital Food Scale, model: 3842BL9).
True color aerial imagery was obtained during each collection date using a Phantom 4 ProV2.0 (DJI, Shenzhen, China), a UAV, with an onboard 2.54-cm CMOS 20 MP camera. Individual plot images were taken for the first four sampling dates at an above-ground altitude (AGL) of 9-m. Mission planning and image stitching of the remaining 10 sampling dates were completed through service acquired from DroneDeploy (DroneDeploy, San Francisco, CA, USA). The 14 min flight plan was consistent across sampling dates 9-m above ground altitude (AGL), with 75% overlap, and a flight speed of 3-m s−1. Images (~670) were uploaded to and stitched together by DroneDeploy. The resulting orthomosaic had a resolution of 0.69-cm/px and was exported as a geotiff for image processing in ArcGIS (ArcGIS Pro 2.4.2, Esri, Redlands, CA, USA).
Three 1.2-m portable fabric targets (Group 8 Technology, Inc., Provo, UT, USA) with reflectance values of approximately 3%, 13%, and 56% were placed at the field edge during each flight for calibration from digital number (DN) to reflectance (
Table 3). The DN’s of each target of all three bands were extracted and averaged for each sampling date. The empirical line method [
29] was used for calibration. However, since the raw target DN vs. reflectance plot showed an exponential relationship, a natural logarithm transformation of the reflectance values for the calibration targets was performed to obtain a linear relationship [
30]. A line of best fit was added to the scatter plot and the resulting linear regression equation was used to convert the DNs of each band to -ln(reflectance) (
Table S1). This was then converted to reflectance using the exponential term [
30].
In ArcGIS (ArcGIS Pro 2.4.2), the three-band orthomosaics were converted into a single raster layer using the raster calculator and the excess green (ExG) index [
31]. The resulting raster was examined manually to identify a threshold value to separate foliage from the background [
32]. Using the manually identified threshold value, the raster was binarized into “foliage” and “other”. The “foliage” class contained both yellow and green soybean foliage. The “other” class contained bare soil, undecipherable shadowed area, and residue. Only the inner two rows used for yield were used in the image analysis. The binary raster was used as a mask to extract only the DNs of the “foliage” class from the three collected bands (red, green, and blue) of the respective images and orthomosaics. The fraction of foliar cover (
fCover) was determined by extracting the sum of the areas of each class and determining the percent of the “foliar” class with respect to the combined total area. Plot summaries containing average DNs of each band were exported to Microsoft Excel after image processing (
Figure 1).
The fAPAR
green and fAPAR
total values were calculated using Equations (2) and (3), as described by Tewes and Schellberg [
5] with the exception of excluding fPAR
soil from the calculations [
33,
34]. fPAR
trans was estimated using the Lambert–Beer law equation using an extinction coefficient (k) of 0.523 [
35] based on crop and row spacing. PAR
inc was determined by taking the total incoming solar radiation collected from a weather station near the experiment location and multiplying it by 0.5 [
36]. It was assumed that the RGB camera collected bands within the range of photosynthetically active radiation (PAR; 400–700-nm). The definite integral of the running total of PAR during the growing season vs. fAPAR
green was then plotted against the DM [
5]. RUE was determined from the slope value obtained by the regression equation from the plot of the sum of DM vs. the sum of APAR
green.
Disease severity ratings taken during each destructive sample date were removed from the GLAI by converting the severity rating to a 0–1 scale and multiplying this by the GLAI value (Equation (4)) [
16,
37]. This reduced only the GLAI by the observed percent of disease severity to result in GLAI
Dx. A handheld GreenSeeker (Trimble, Sunnyvale, CA, USA) was used to collect Normalized Difference Vegetation Index (NDVI) values. Values were collected on the last four sampling dates to avoid soil background noise early in the season and value saturation during full canopy. A yield row was walked with the GreenSeeker and NDVI values were recorded beginning and ending approximately 0.5m from the ends of the plot to avoid edge-effects [
27].
Statistical analyses were performed in SAS 9.4 (SAS Institute, Cary, NC, USA). All measured variables were subjected to an analysis of variance using the Glimmix procedure. For testing the fungicide effect, fungicide treatment was set as a fixed factor while replication and days after planting (DAP) were considered random factors. Replication was nested within DAP. Least squared means (LS-means) were estimated using the Lsmeans statement in PROC GLIMMIX. Means were separated by using “PDIFF lines” option in the LSmeans statement at an α level of 0.10. Since fungicide treatments were applied after 63 DAP, a separate data set only using sampling periods after the fungicide treatment was used to determine treatment effects on collected variables using the same statistical methods. The Wyffeos slope comparison was used to determine the significance of the RUE values. The effect of fungicides was determined using orthogonal contrasts of the RUE values.
3. Results
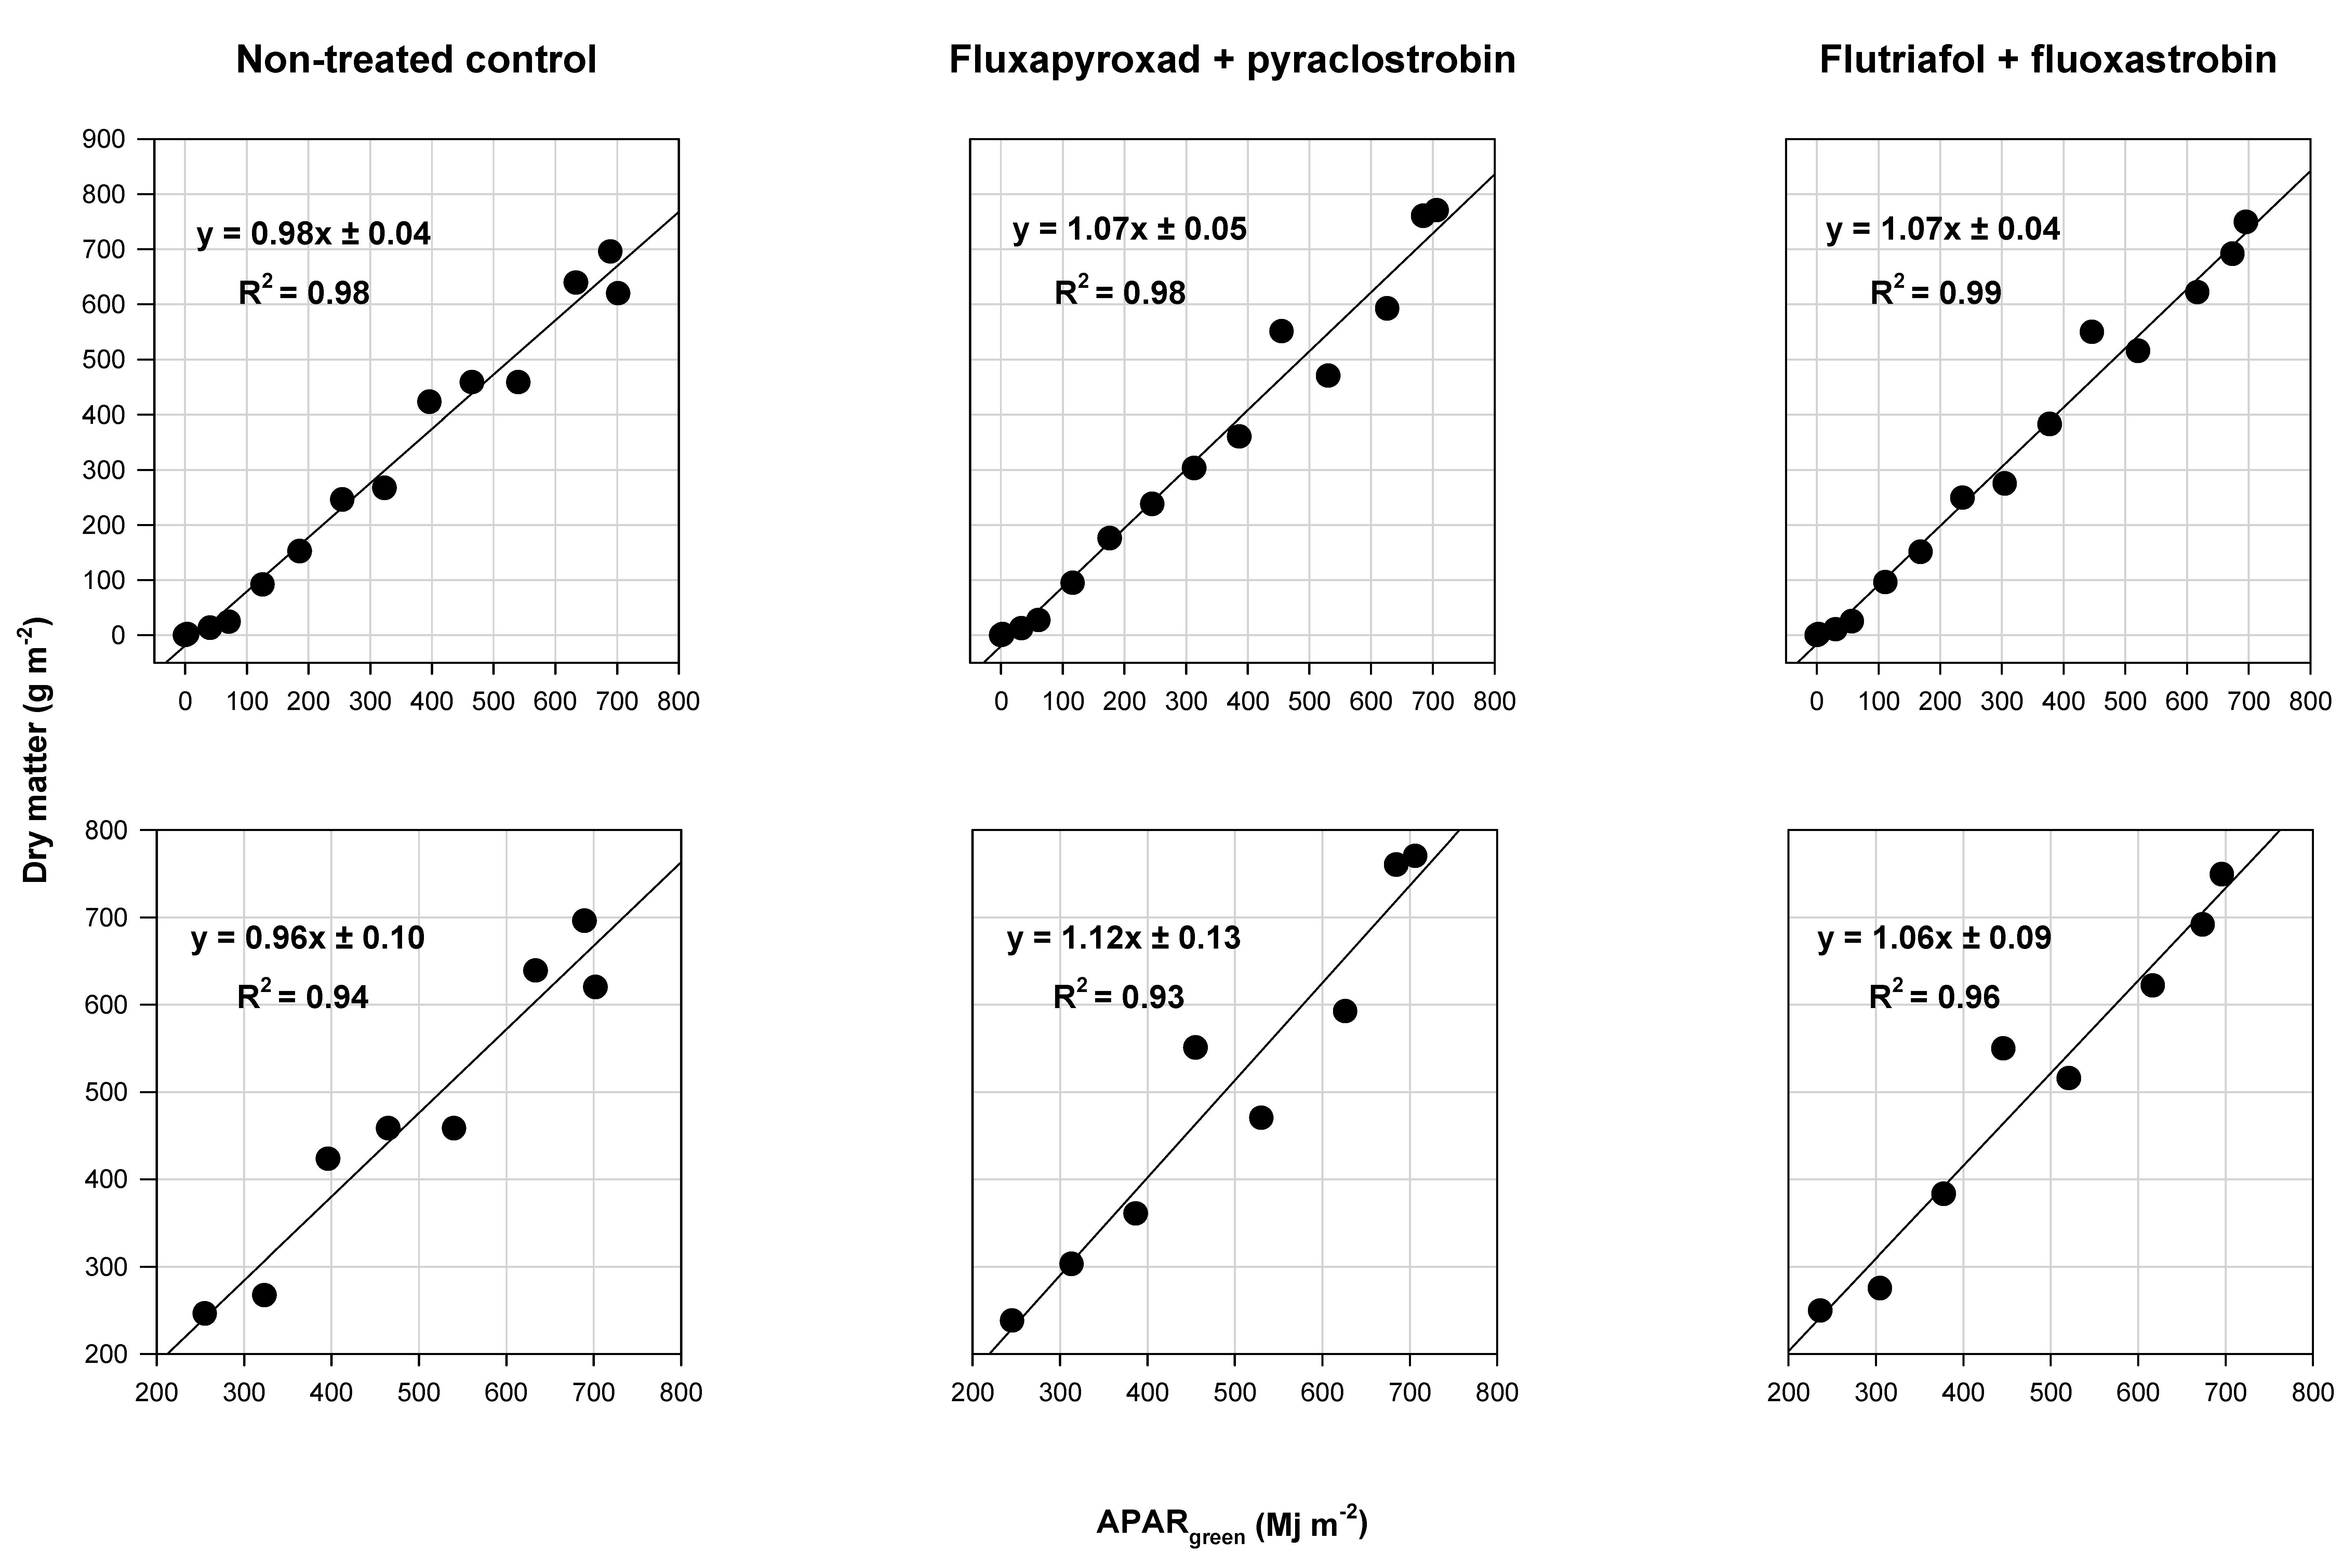
RUE values of soybean from VC to R7.5 (22 to 130 DAP) were estimated to be 0.98, 1.07, and 1.07 g MJ
−1 for the non-treated control, fluxapyroxad + pyraclostrobin, and the flutriafol + fluoxastrobin fungicide treatments, respectively (
Figure 2). R
2 values of the line of best fit were 0.98, 0.98, and 0.99 for the non-treated control, fluxapyroxad + pyraclostrobin, and flutriafol + fluoxastrobin treatments, respectively. RUE values from R3 to R7.5 (70 to 130 DAP) were estimated to be 0.96, 1.12, and 1.06 g MJ
−1 for the non-treated control, the fluxapyroxad + pyraclostrobin, and the flutriafol + fluoxastrobin treatments, respectively (
Figure 2). R
2 values of the line of best fit were 0.98, 0.98, and 0.99 for the non-treated control, fluxapyroxad + pyraclostrobin, and flutriafol + fluoxastrobin treatments, respectively, from R3 to R7.5 (70–130 DAP). Orthogonal contrasts showed the estimated RUE values did not differ (
p > 0.10) among the treatments within either timeframe (
Table 4).
Canopy cover increased rapidly following 29 DAP, plateaued at 90 DAP, and reached a maximum coverage of nearly 100% then began to decline 120 DAP (
Figure 3). An interaction (
p = 0.025) was detected between treatment and DAP for the percent of foliage cover (
Table 5). At 130 DAP (SD 14), the last sampling date, plots treated with fluxapyroxad + pyraclostrobin had approximately 10% more foliage cover than the non-treated control (
p < 0.1;
Table 5). Foliar cover of the flutriafol + fluoxastrobin treatment was approximately 5% greater (
p > 0.1) than the non-treated control (
Table 5).
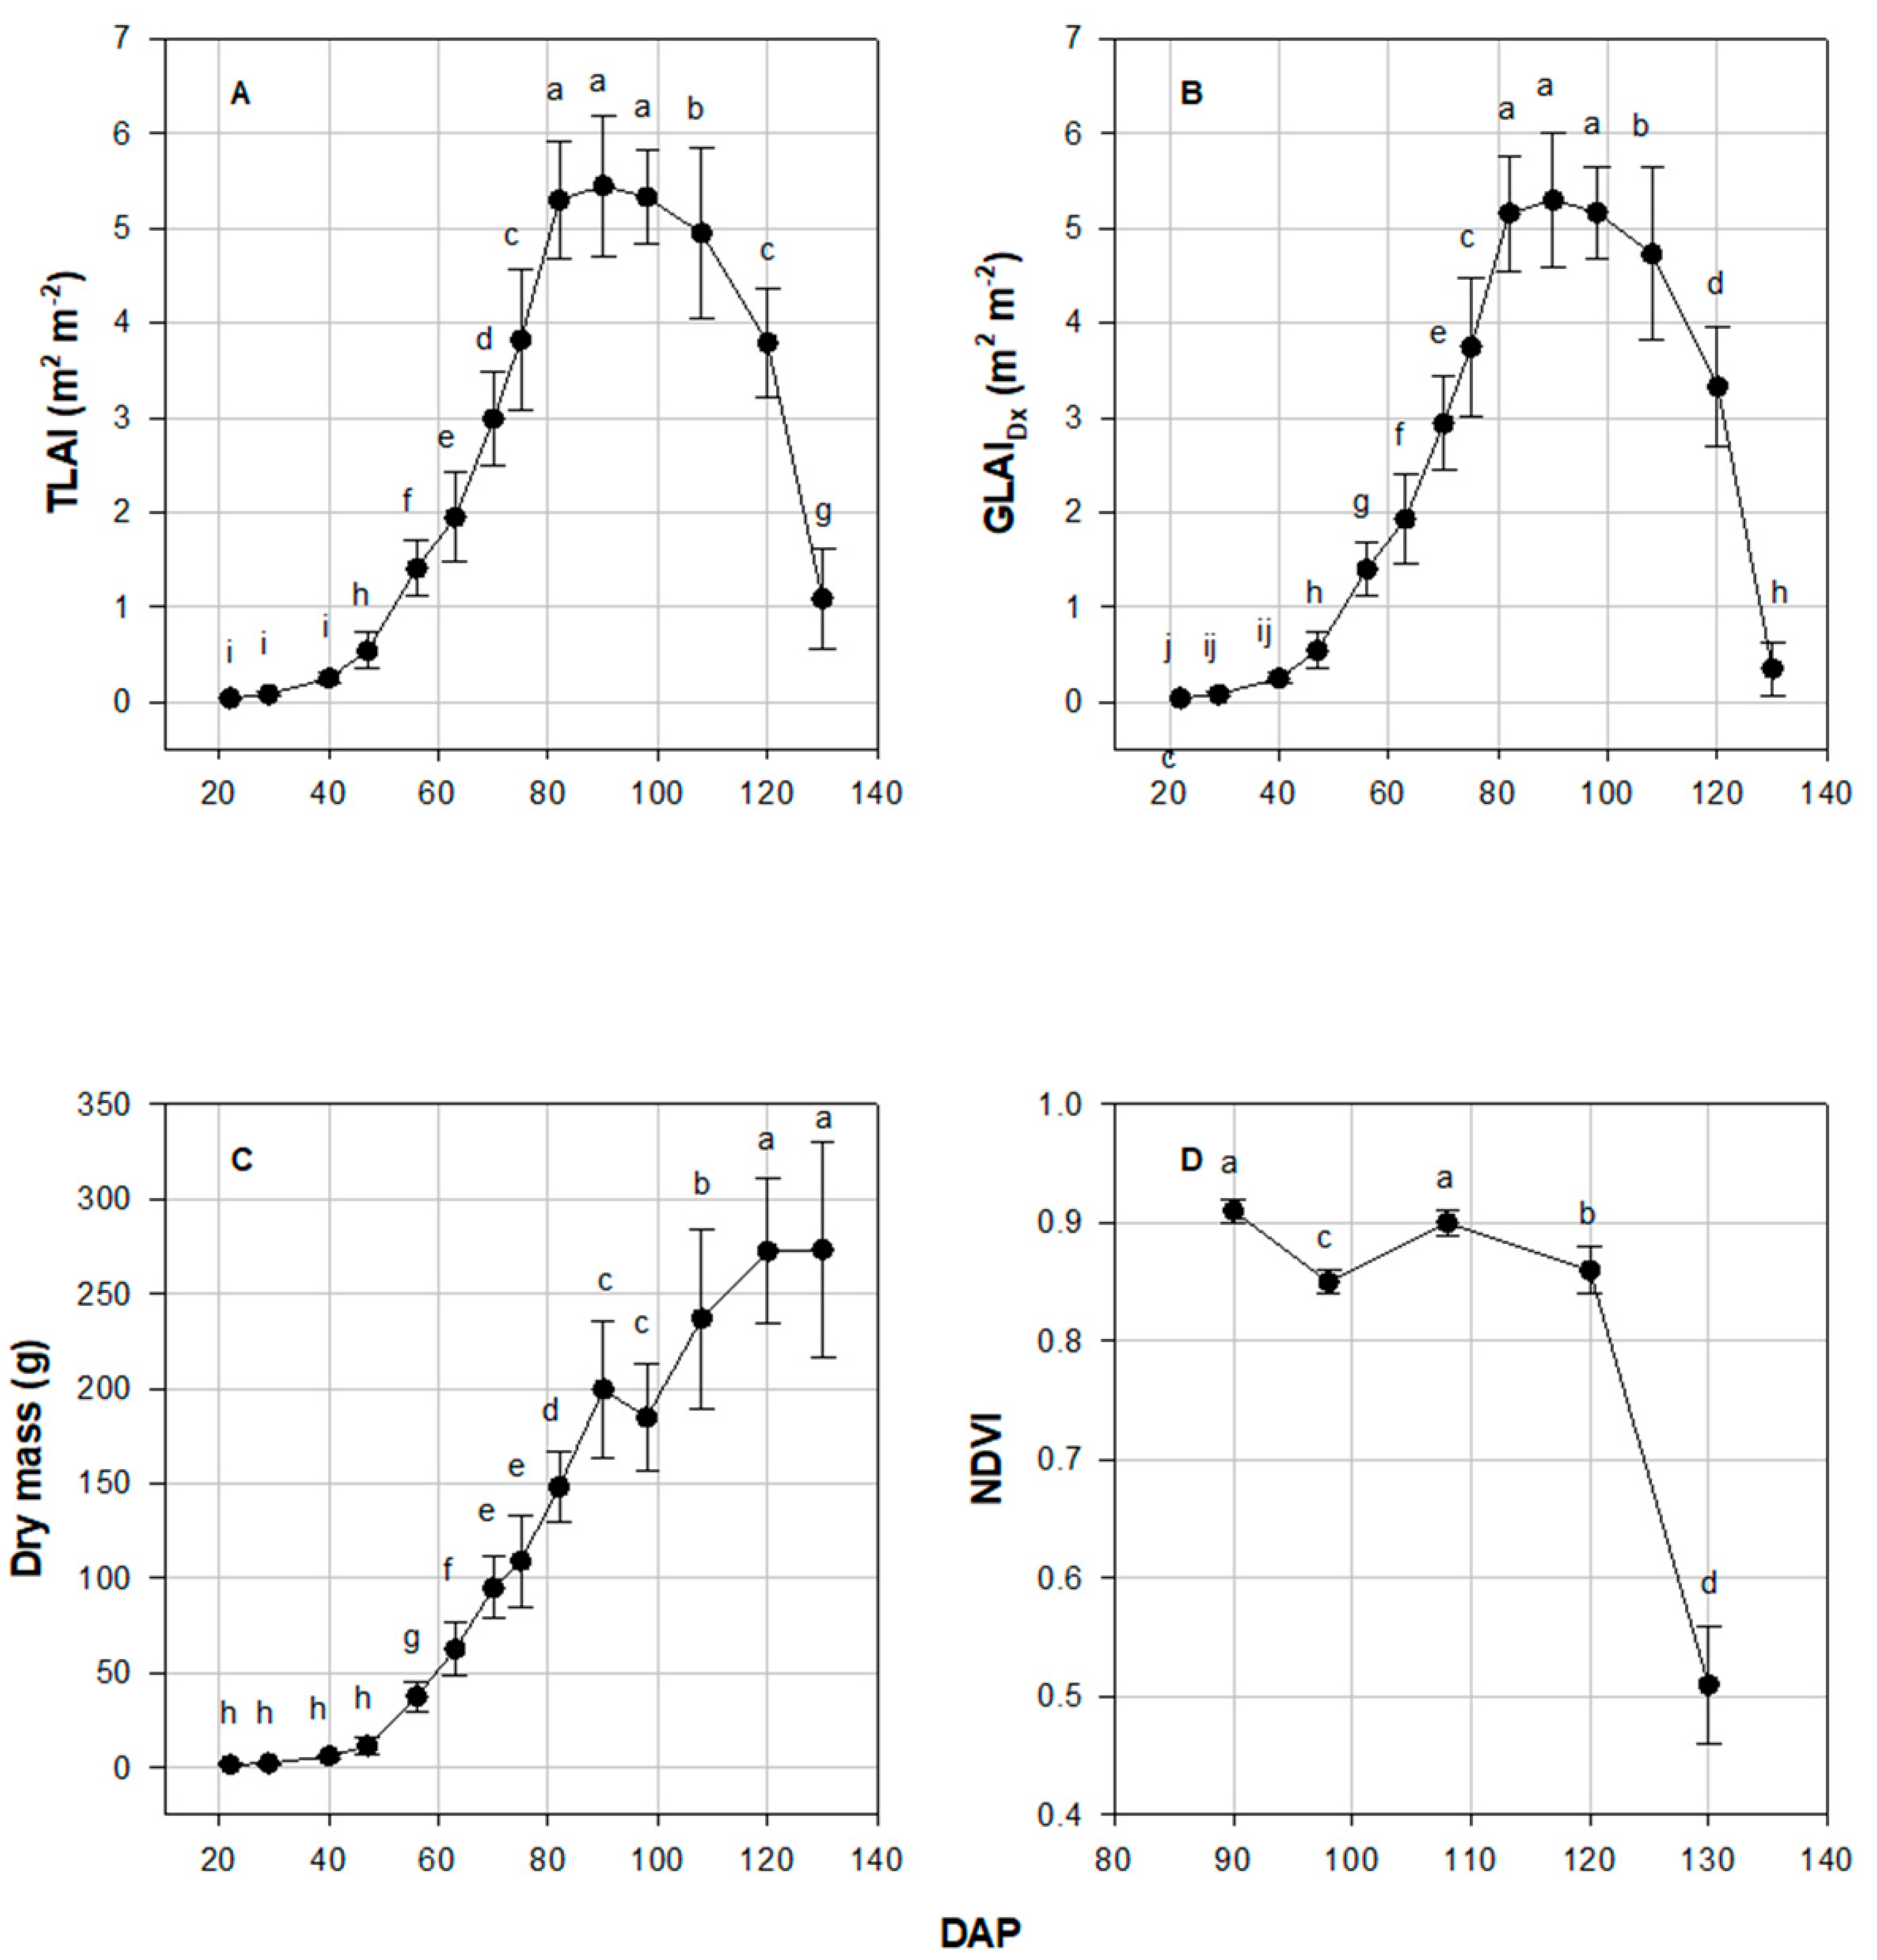
DAP effect was significant (
p ≤ 0.001) for TLAI, GLAI
Dx, DM, and NDVI values. The TLAI reached a maximum value of 5.45 at 90 DAP (SD 10;
Figure 4A). At 82, 90, and 98 DAP (SD 9, 10, and 11), TLAI did not differ (
Figure 4A). The TLAI decreased after 90 DAP. TLAI at 108 DAP and later were all significantly less than that at 98 DAP (
Figure 4A). GLAI
Dx reached a maximum value of 5.30 at 90 DAP (SD 10;
Figure 4B). Samples collected after 90 DAP showed significantly diminishing GLAI
Dx (
Figure 4B). Average DM was not significantly different between the first four sampling dates and was relatively low. It sharply increased beginning 49 DAP and continued to increase up to the last sampling date (
Figure 4). The greatest NDVI values were measured at 0.91, at 90 DAP (SD 10;
Figure 4D). The value was significantly less than 130 DAP (SD 14) than the previous four sampling dates, with a value of 0.51.
A treatment by date interaction (
p = 0.025) was seen for FLS severity. FLS was not observed until 108 DAP (SD 12). Severity was low, not exceeding 2% during the entire experiment. However, the non-treated control had significantly more FLS on the SD 13 than either of the fungicide treatments on the same date (
Table 6). FLS severity of the non-treated control was numerically, however not significantly (
p = 0.358), less on the last sampling date (130 DAP) than either fungicide treatment (
Table 6). Treatment had a significant (
p < 0.001) effect on yield (
Table 6). The non-treated control and the fluxapyroxad + pyraclostrobin treatment had greater yields than the flutriafol + fluoxastrobin treatment by approximately 134.5 kg ha
−1 (
Table 6).
p-values of date, treatment, and the date*treatment interaction for all variables can be viewed in
Table S2.
4. Discussion
This is the first study to estimate soybean RUE using consumer-grade UAV imagery. Our robust data set, albeit a single year, was built by using six replications collected every 6–11 days, as Tewes and Schellberg [
5] did with corn RUE estimation. Using this technology, we could estimate the impact of certain QoI-containing fungicides on RUE at low levels of FLS severity in Iowa.
Littleton et al. [
38] and Muchow [
6] reported RUE declined during pod fill. Muchow et al. [
2] postulated that the decline of RUE was due to leaf drop and a reduction in specific leaf nitrogen. Here, the RUE values of the non-treated control and the flutriafol + fluoxastrobin treatment were slightly less for the post-fungicide application timeframe beginning at R3 (beginning pod), while the RUE values for fluxapyroxad + pyraclostrobin treatment were numerically greater for the post-fungicide application timeframe beginning at R3 (beginning pod) compared to the season long estimated RUE values.
The RUE values of the non-treated control of both the season-long and the post-fungicide sampling periods were numerically, but not significantly, less than the fungicide treatments for the same sampling periods. The beneficial effect of these fungicides was not captured with the estimated RUE values. Our sampling dates may not have captured the main benefit of the “greening effect”, which extends the period of photosynthetic activity by the leaves [
39].
At the last sampling date (130 DAP), canopy cover of the fluxapyroxad + pyraclostrobin treatment was significantly greater than the control. This significant retention of canopy cover in the fluxapyroxad + pyraclostrobin treatment did not contribute enough to impact the TLAI or DM. However, we did not collect fallen leaves to be included with the DM and LAI measurements, and we speculate this may have altered the other components of RUE enough to show an effect.
LAI values followed the typical logistic curve until senescence began [
40]. The average maximum value found in this experiment was slightly lower than the range of 6 to 7 identified by Dermody et al. [
41] and Tagliapietra et al. [
42]. The number of plants collected for LAI determination match or exceed previous studies [
2,
28]. TLAI and GLAI
Dx plots and values were very similar. This is reasonable since the severity of FLS was low. Because soybeans overinvest in leaves, this small amount of leaf area loss is unlikely to impact yield [
41,
43,
44,
45].
Fungicide application did not have a significant effect on DM, so the entire sampling period (22–130 DAP) was analyzed similarly to the TLAI and GLAI
Dx. The average DM of the last two sampling dates (120 and 130 DAP) was the greatest of all the dates and not significantly different from one another. However, during these same sampling periods, TLAI, GLAI
Dx, and NDVI values were at their lowest (
Figure 4). At the last sampling date (130 DAP), TLAI was reduced to approximately 28% of the previous date (
p < 0.001; 120 DAP). In addition, the GLAI
Dx was approximately one-tenth of the prior date, and NDVI values were also significantly less than the prior date (
p < 0.001;
Figure 4). Despite these large and significant reductions in LAI, they were not enough to show a change in DM.
During June-August 2019, total precipitation was 20% less and average temperature (F°) was 0.3% below the 30-year average (
http://mesonet.agron.iastate.edu). Thus, environmental conditions for FLS were not highly conducive, and severity was low. However, there was a significant effect with both fungicide treatments, showing less disease. This low level of severity did not correspond to the yield data and was not captured by the estimated RUE. Yield of the fluxapyroxad + pyraclostrobin treatment did not differ from the non-treated control, despite showing greater canopy cover at the last sampling date (
p = 0.078; 130 DAP). Treatment did not have an effect on the DM or either LAI values. Perhaps the sink was reduced and resulted in an imbalance that favored the source. Thus, additional photosynthates may have been stored in the stem, which the DM measurements failed to capture. In this study, the components of the plant were not separated into individual plant parts (pods, stems, and leaves). Doing so may have provided insight into these contradictions.
The “greening effect” of the canopy cover as described by Balba [
18] and Bartlett et al. [
19] may have been beginning, but NDVI values collected by a handheld GreenSeeker did not detect a treatment effect. Phillips et al. [
25] found that the application of pyraclostrobin + fluxapyroxad applied at R3 increased the dry mass of stems at harvest. Perhaps the potential benefit of these QoI chemistries would have developed if sampling would have been extended to include samples closer to plant maturity.
Although we do not know the exact sensitivity of the consumer-grade unmodified camera that was used in our study, our RUE estimates fell within previously estimated values. Berra et al. [
46] found the consumer-grade unmodified cameras they tested covered the 400–700 nm window of PAR. Burggraaff et al. [
47] found that the stock camera of the Phantom 4 Pro covered the window of PAR but with a near-infrared (NIR) cut-off of approximately 670 nm. The UAV used in this study is stated to have the same camera as the one tested by Burggraaff et al. [
47]. We assumed, as Tewes and Schellberg [
5] did, that our sensor captured the PAR region.


