Soil Monitoring Methods to Assess Immediately Available Soil N for Fertigated Sweet Pepper


 ,
, 
Abstract
:1. Introduction
2. Materials and Methods
2.1. Experimental Site and Crops
2.2. Experimental Design and Treatments
2.3. Obtaining and Analysis of Samples of Soil Solution and 1:2 Soil to Water (v/v) Extract
2.3.1. Soil Solution
2.3.2. The 1:2 Soil to Water (v/v) Extract Method
2.4. Determination of Crop Nitrogen Nutrition Index (NNI)
2.5. Data Analysis
3. Results
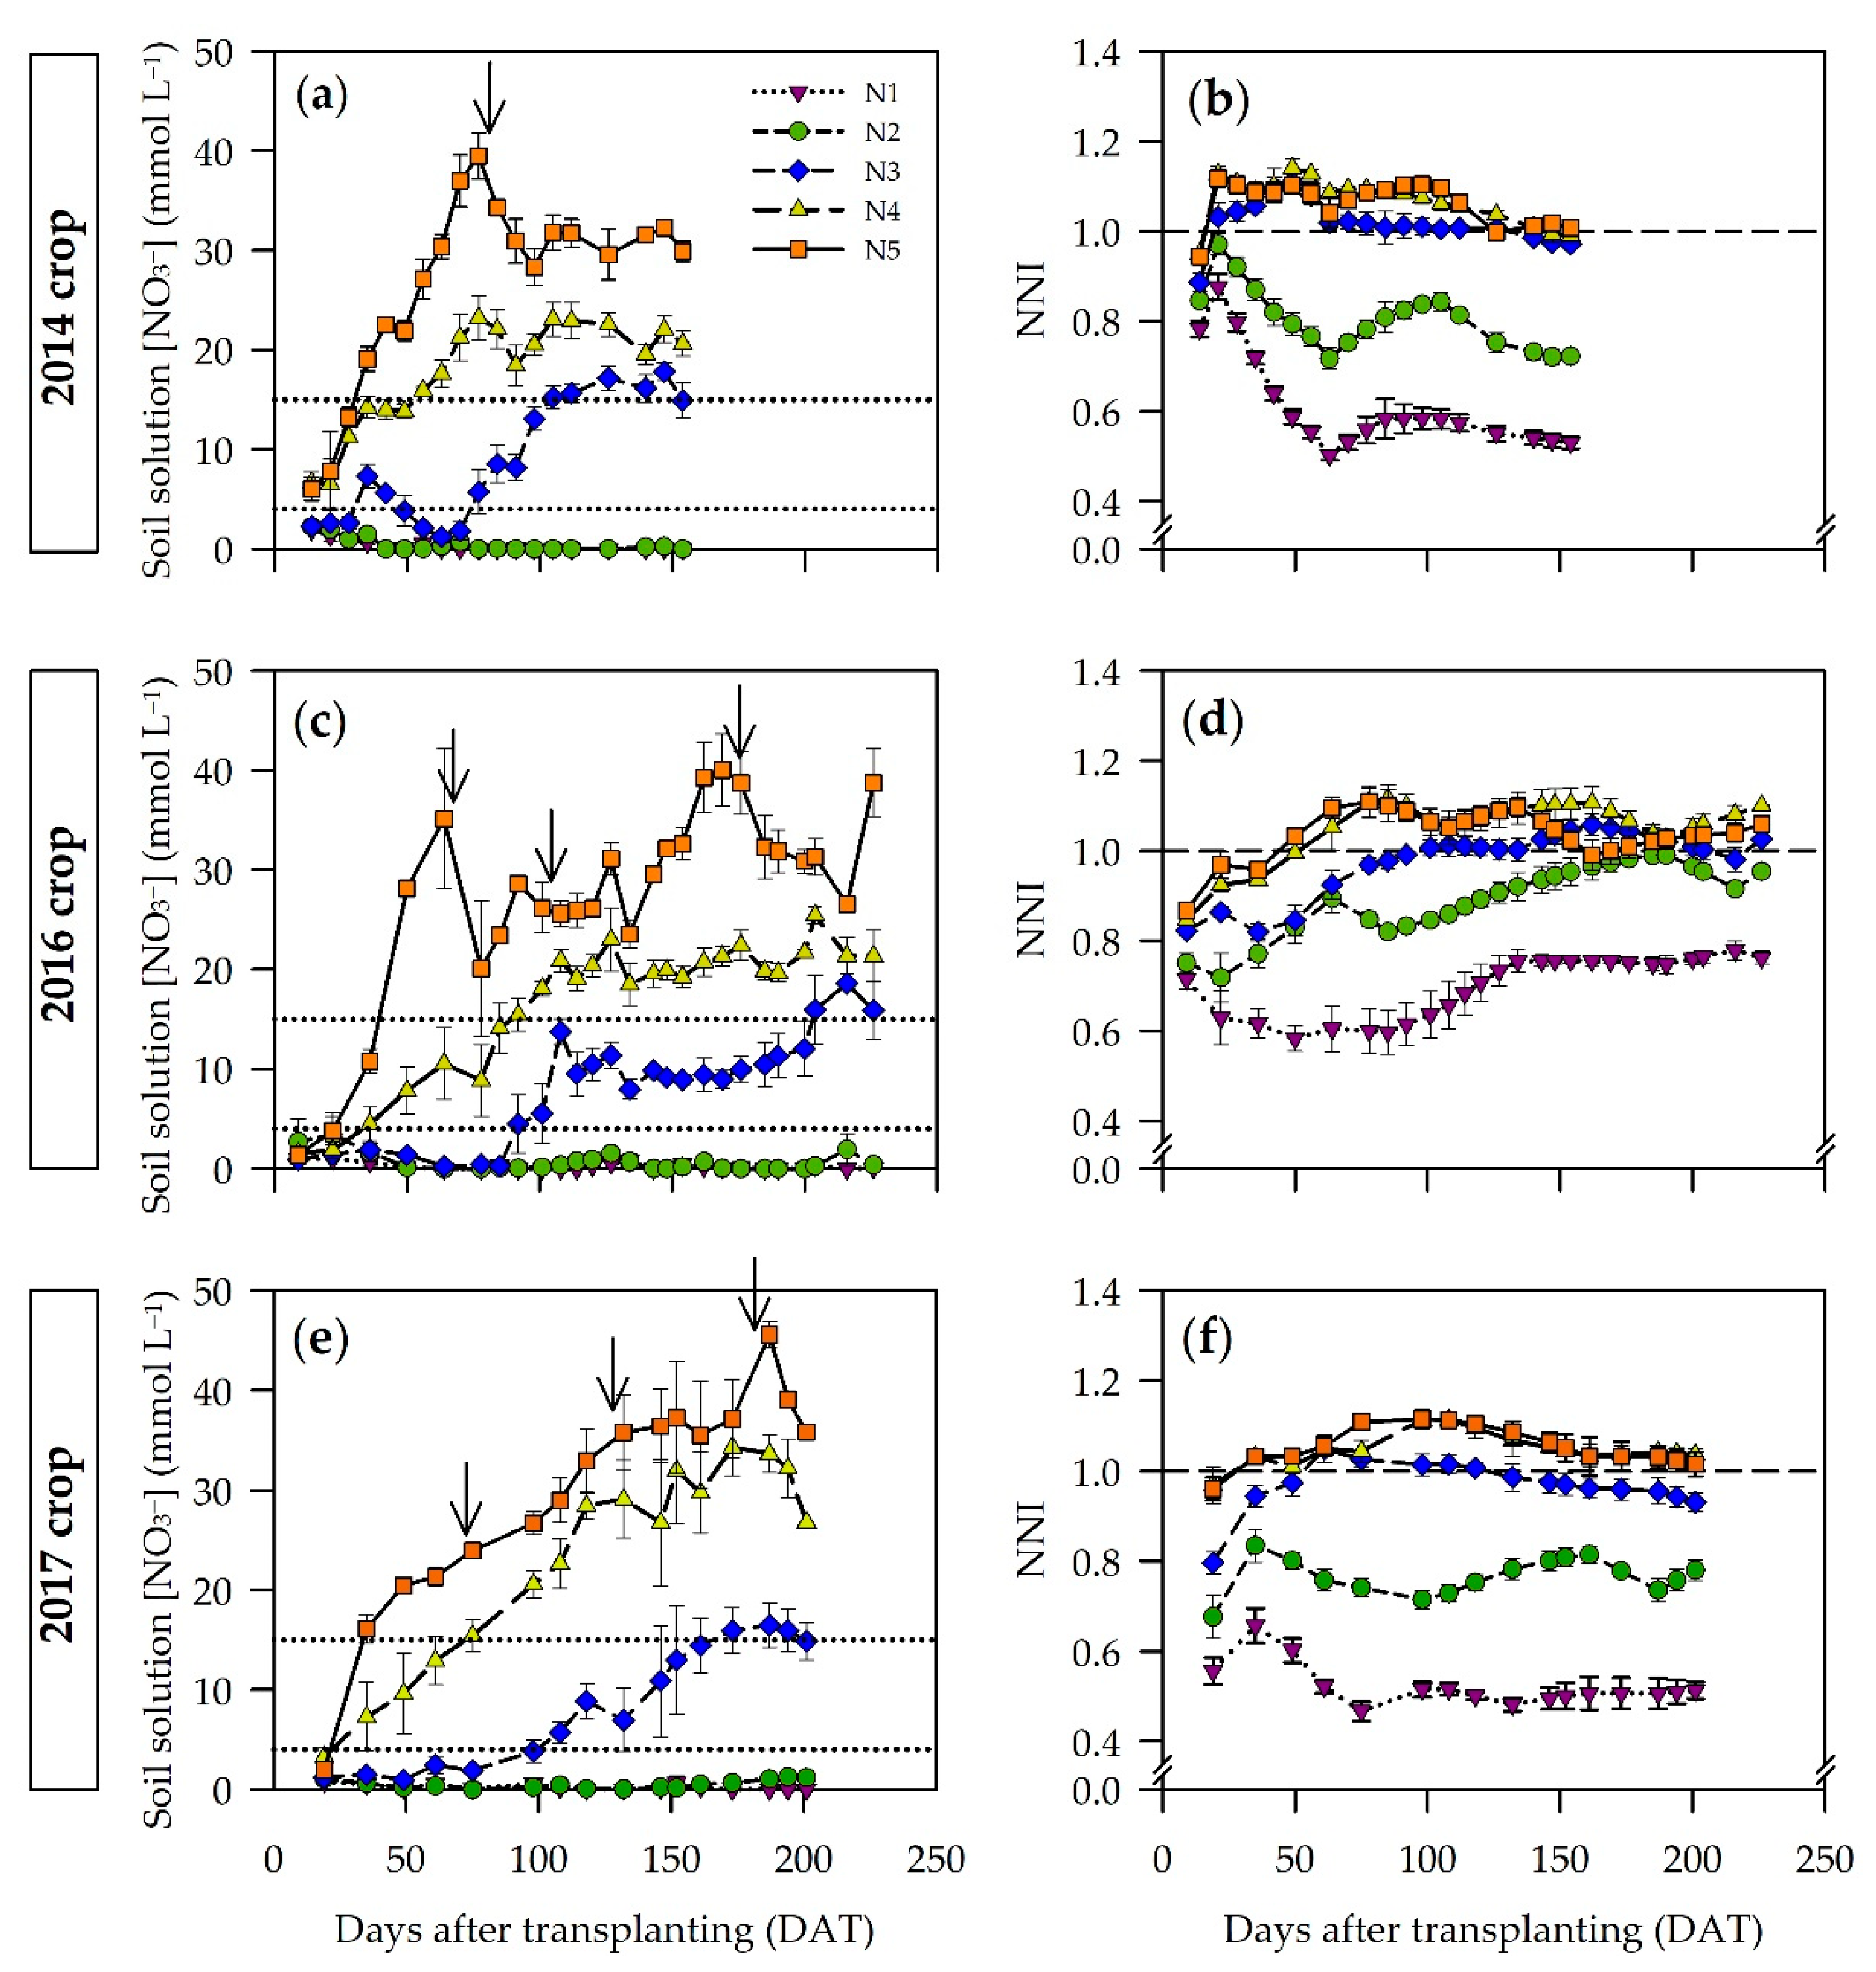
3.1. Soil Solution [NO3−]
3.1.1. Responses of Soil Solution [NO3−] to N Treatments
3.1.2. Response of NNI to N Treatments
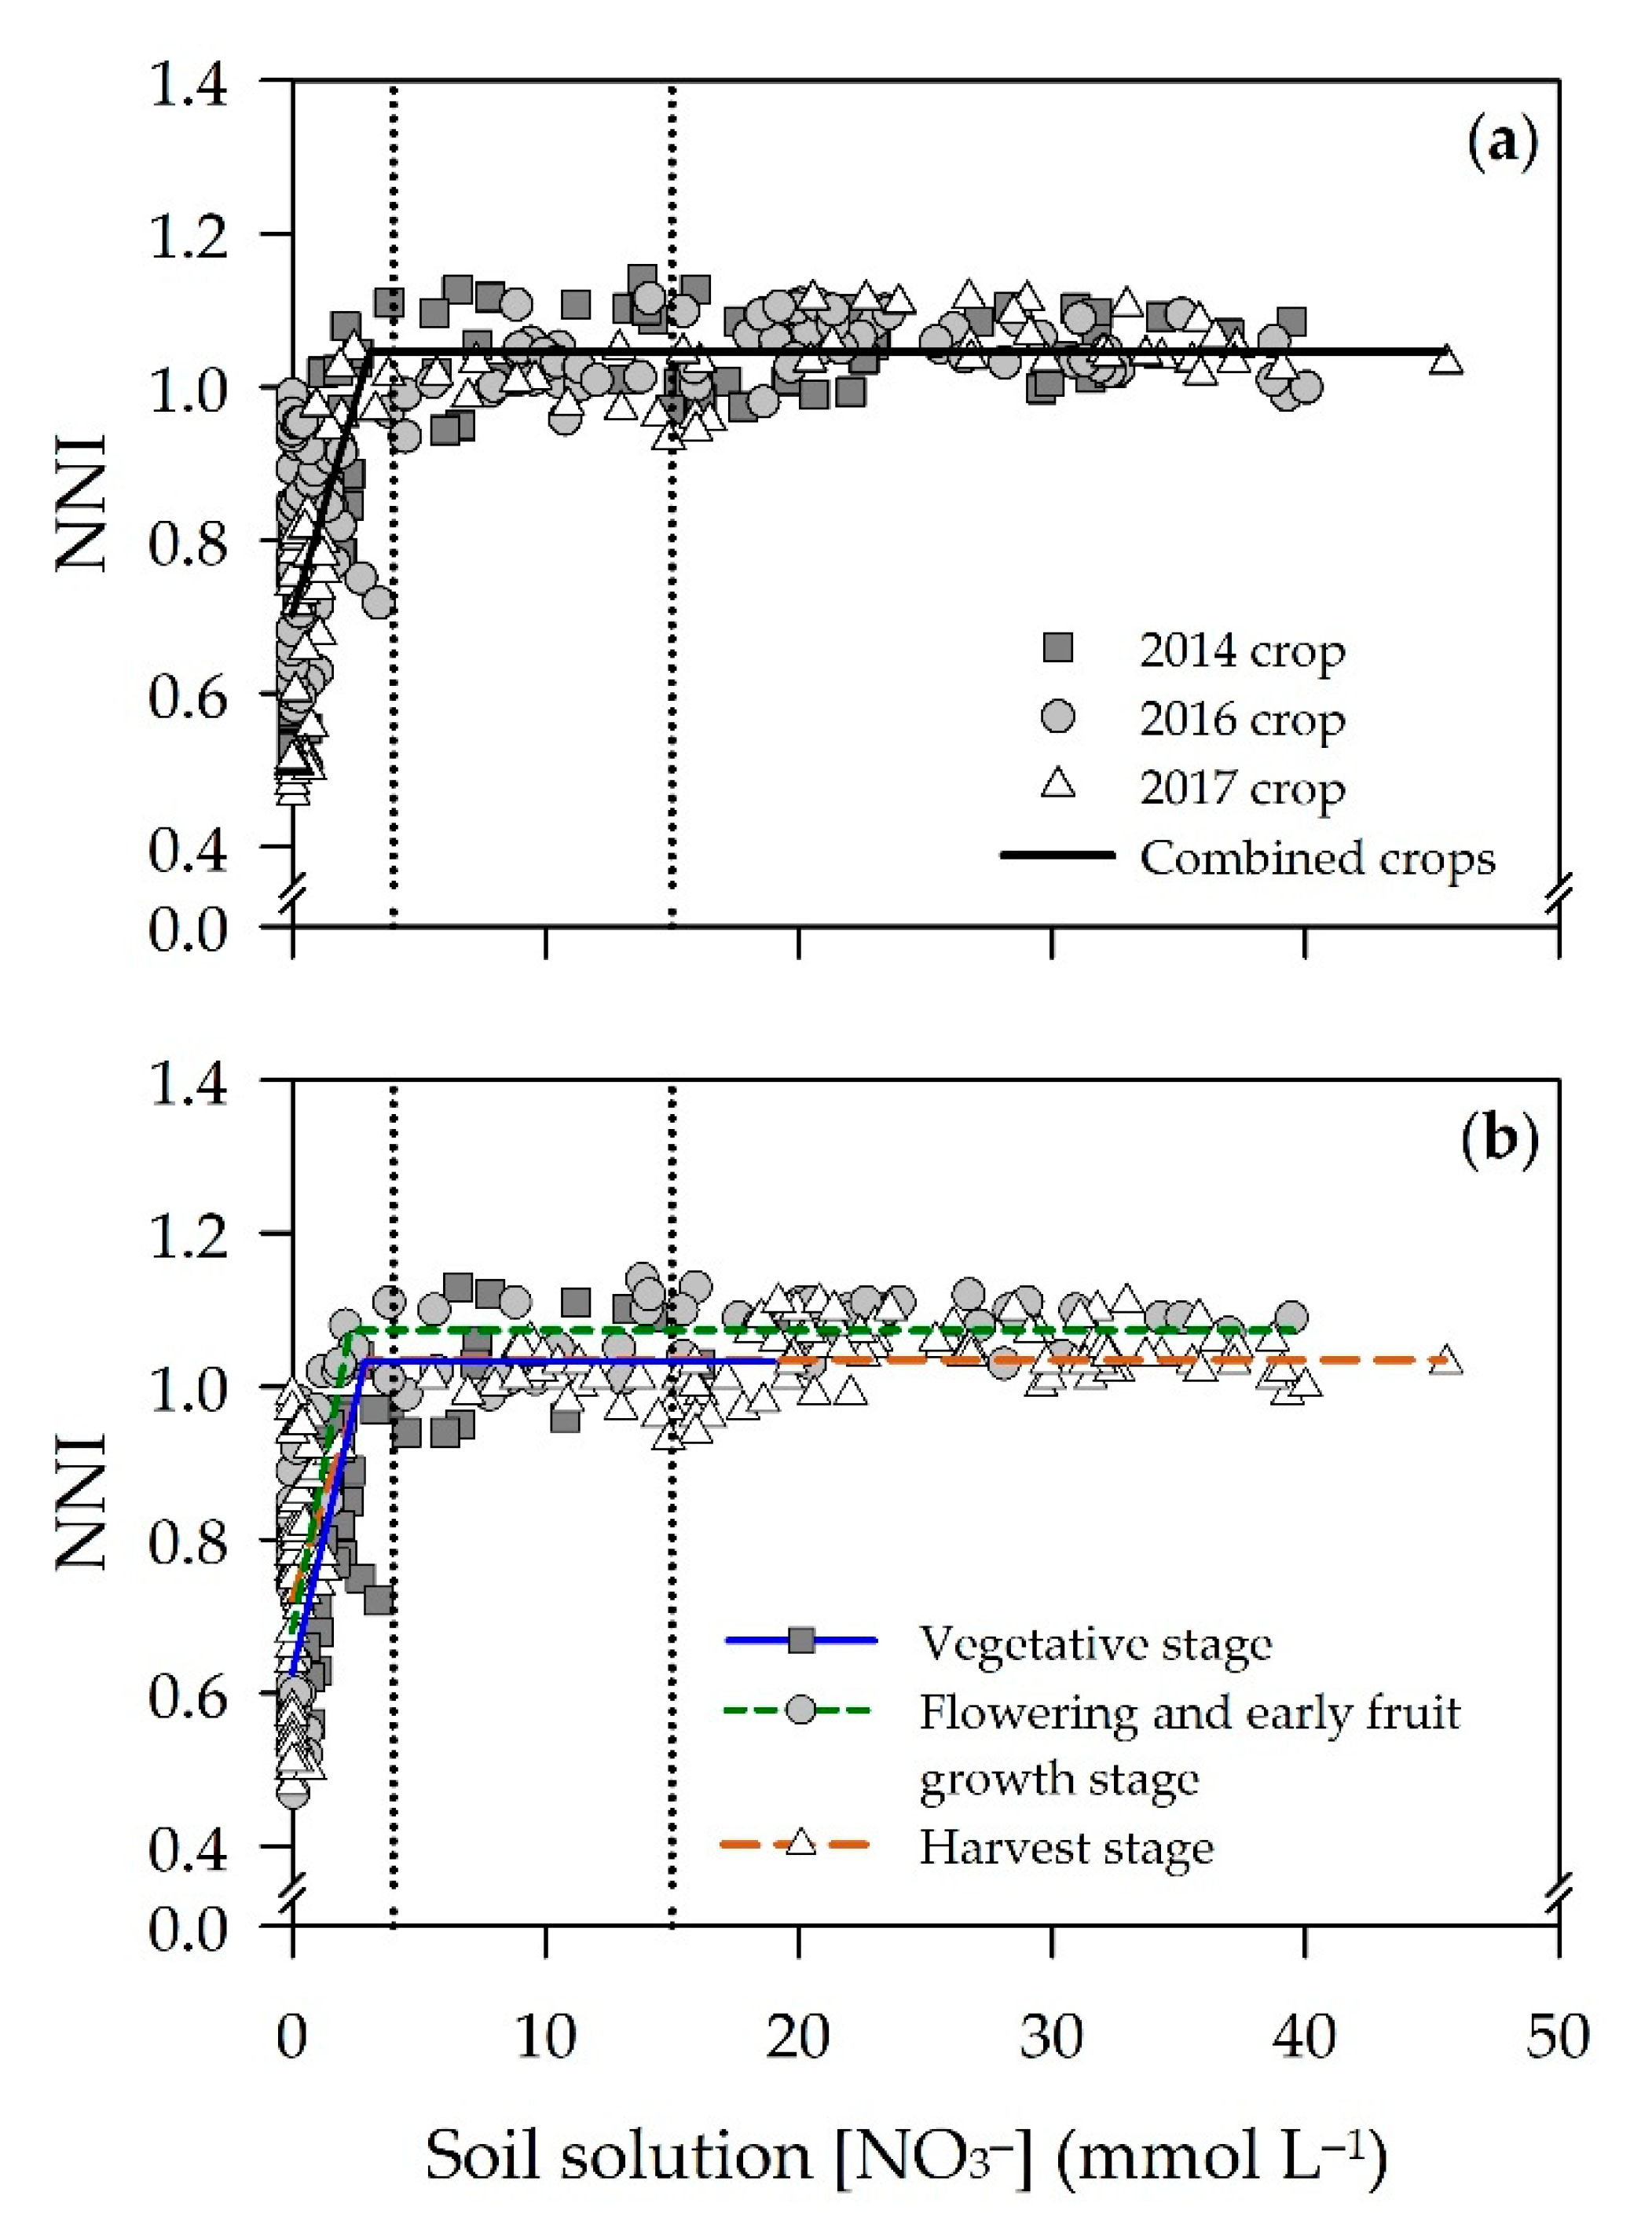
3.1.3. Relationship between NNI and Soil Solution [NO3−]
3.1.4. Sufficiency Values of Soil Solution [NO3−] for Optimal N Nutrition
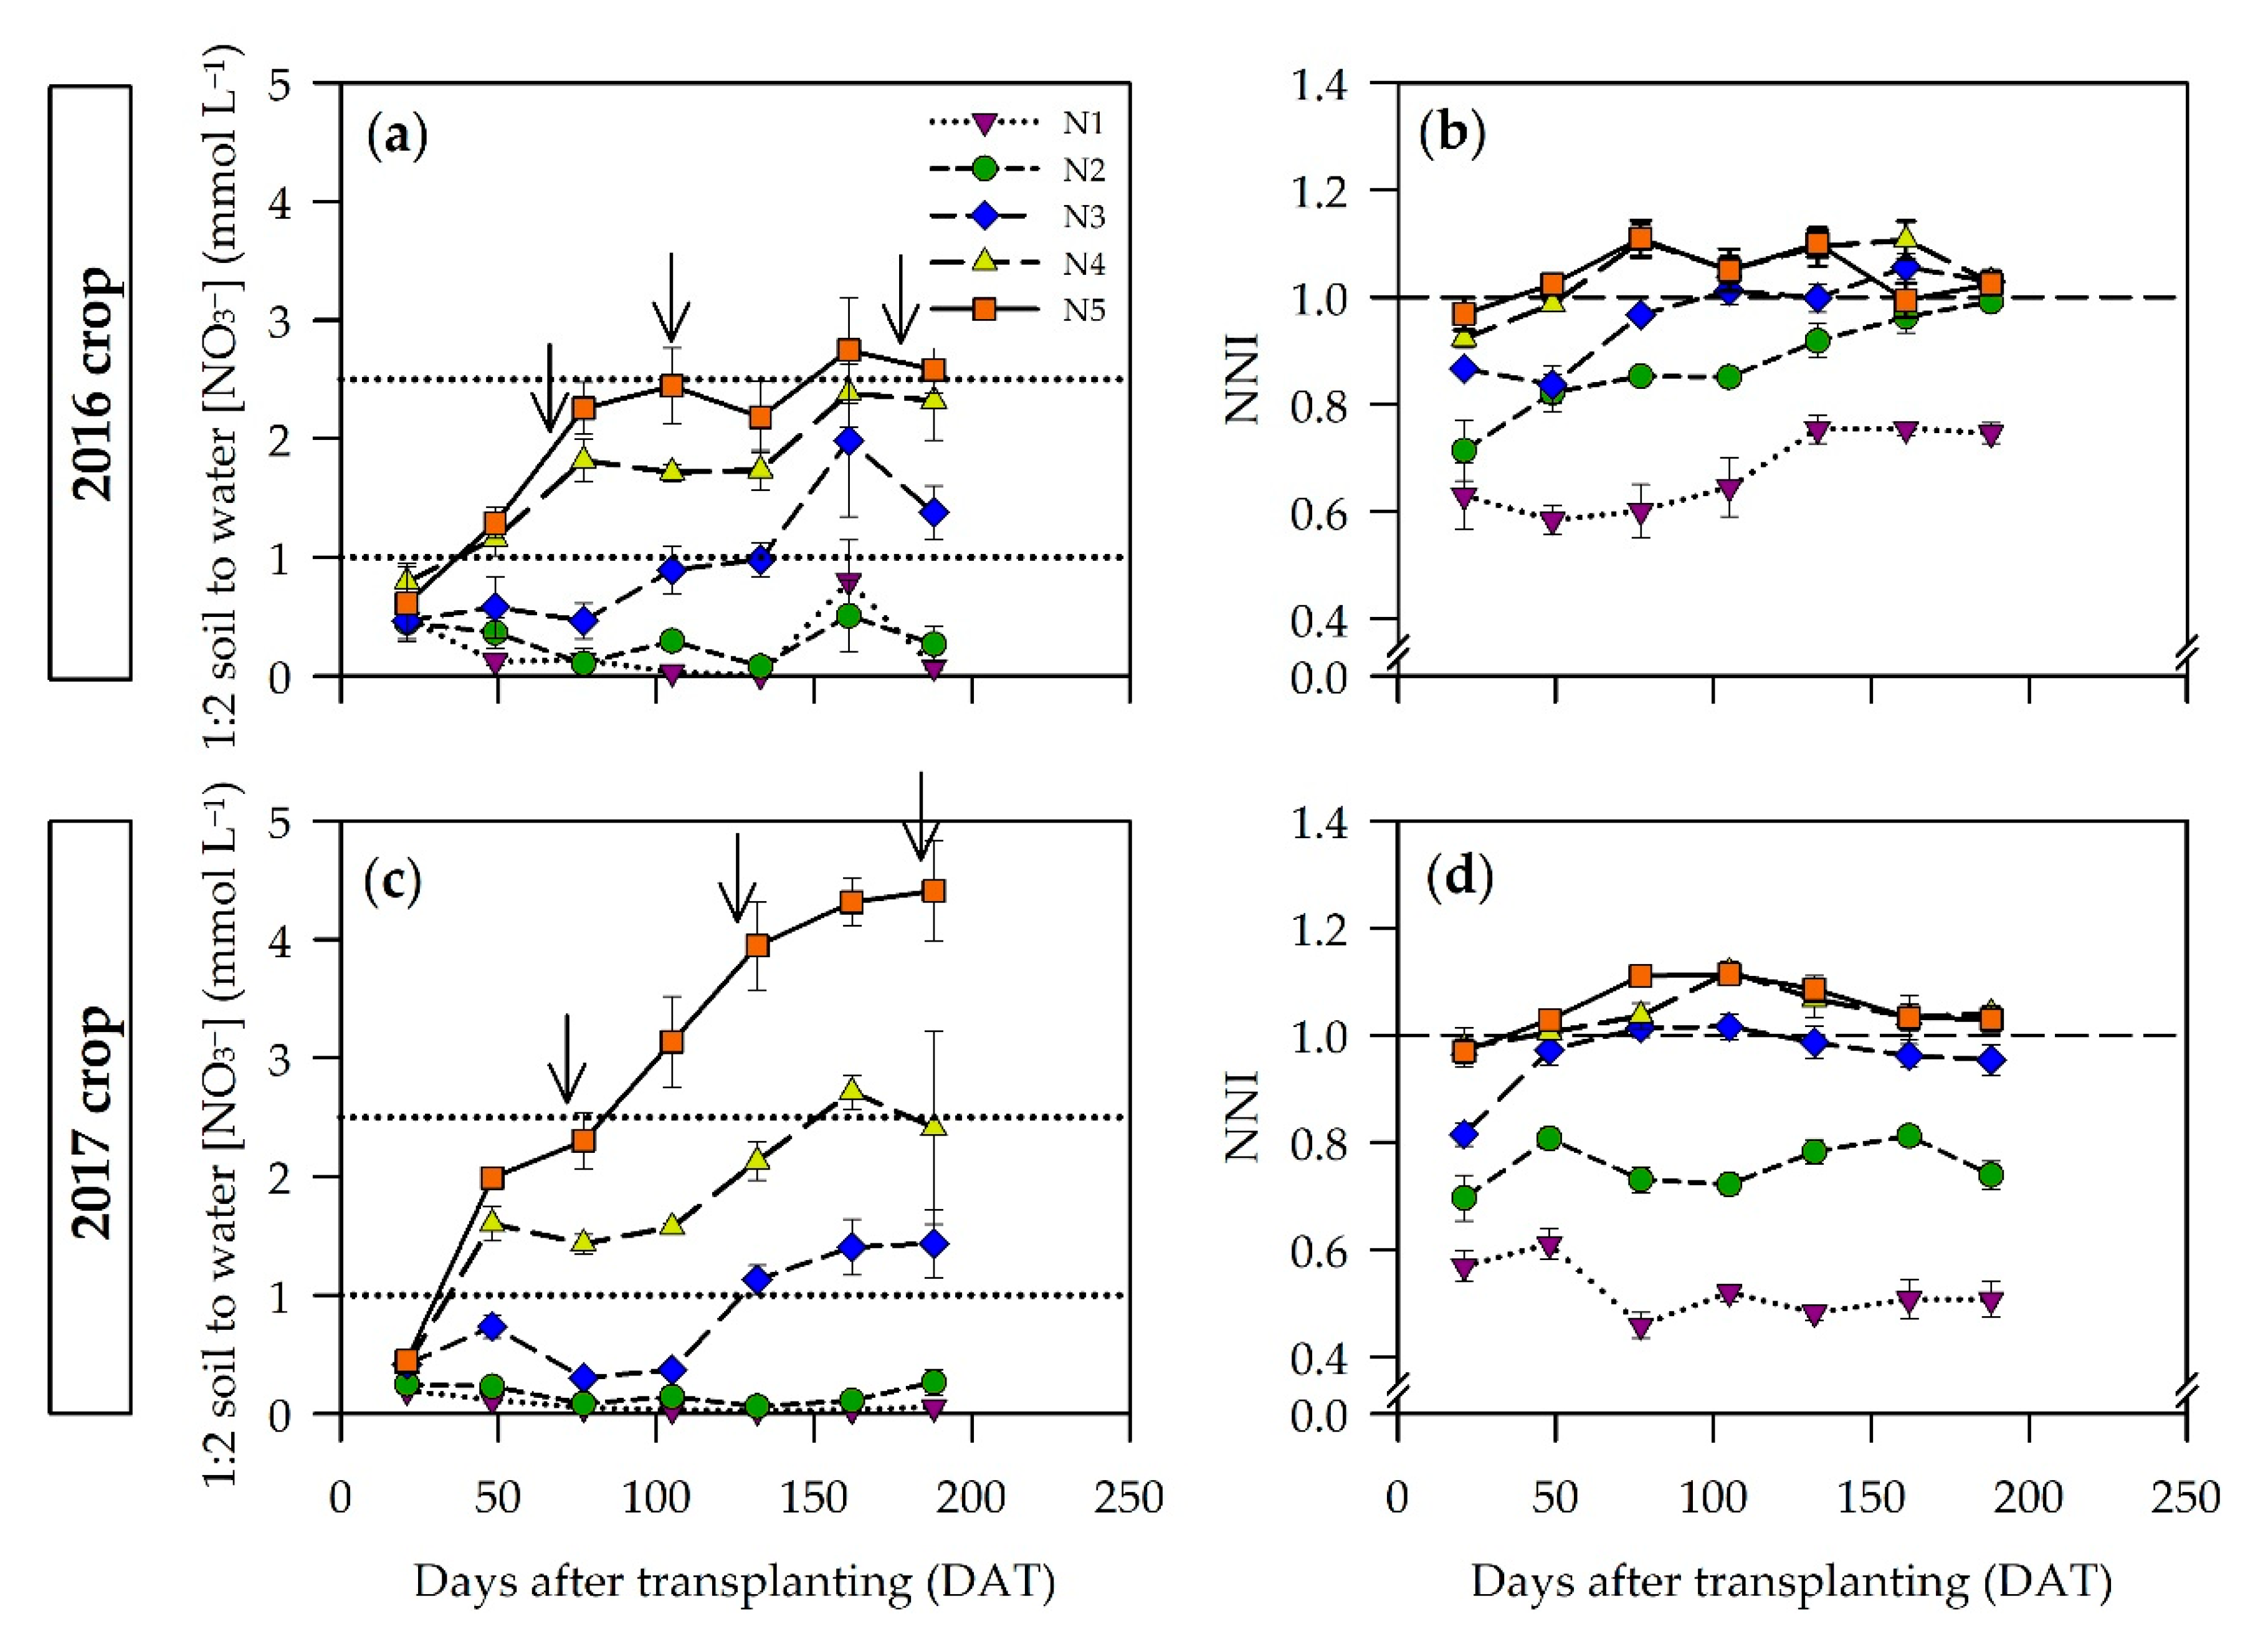
3.2. [NO3−] in the 1:2 Soil to Water (v/v) Extract
3.2.1. Response of [NO3−] in the 1:2 Soil to Water (v/v) Extract to N Treatments
3.2.2. Response of NNI to N Treatments
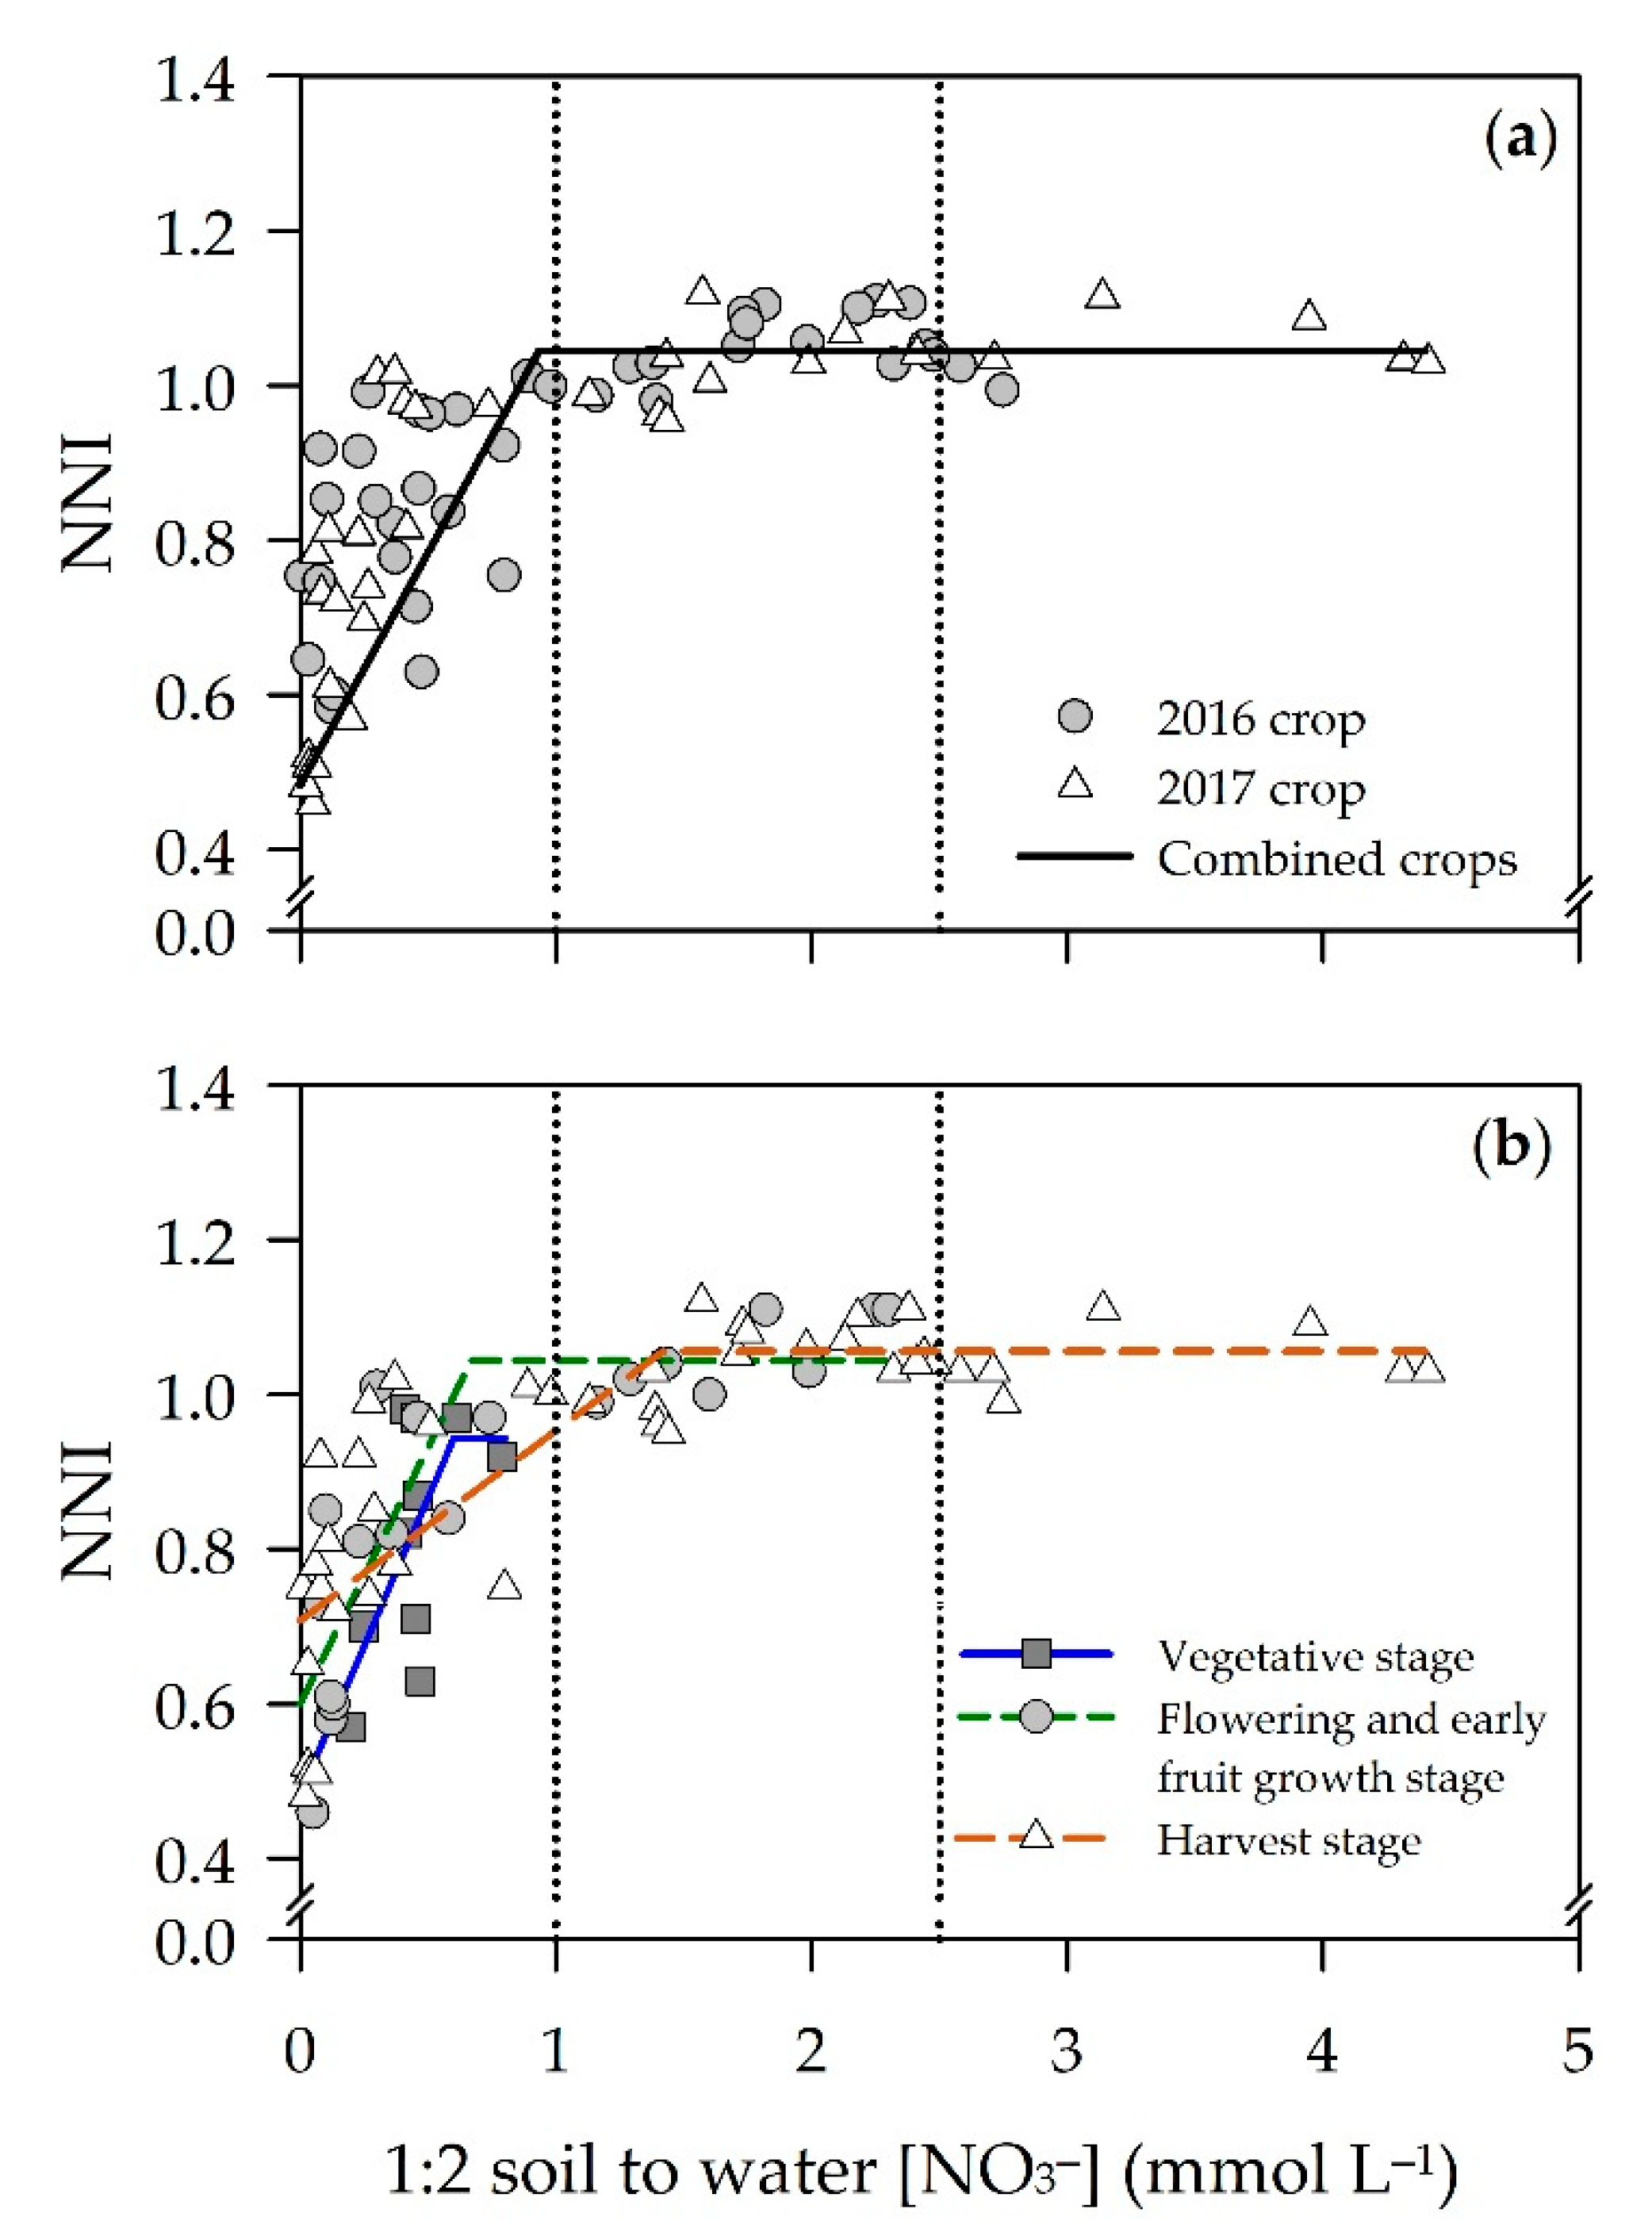
3.2.3. Relationship between NNI and [NO3−] of the 1:2 Soil to Water (v/v) Extract
3.2.4. Sufficiency Values of [NO3−] of the 1:2 Soil to Water (v/v) Extract for Optimal N Nutrition
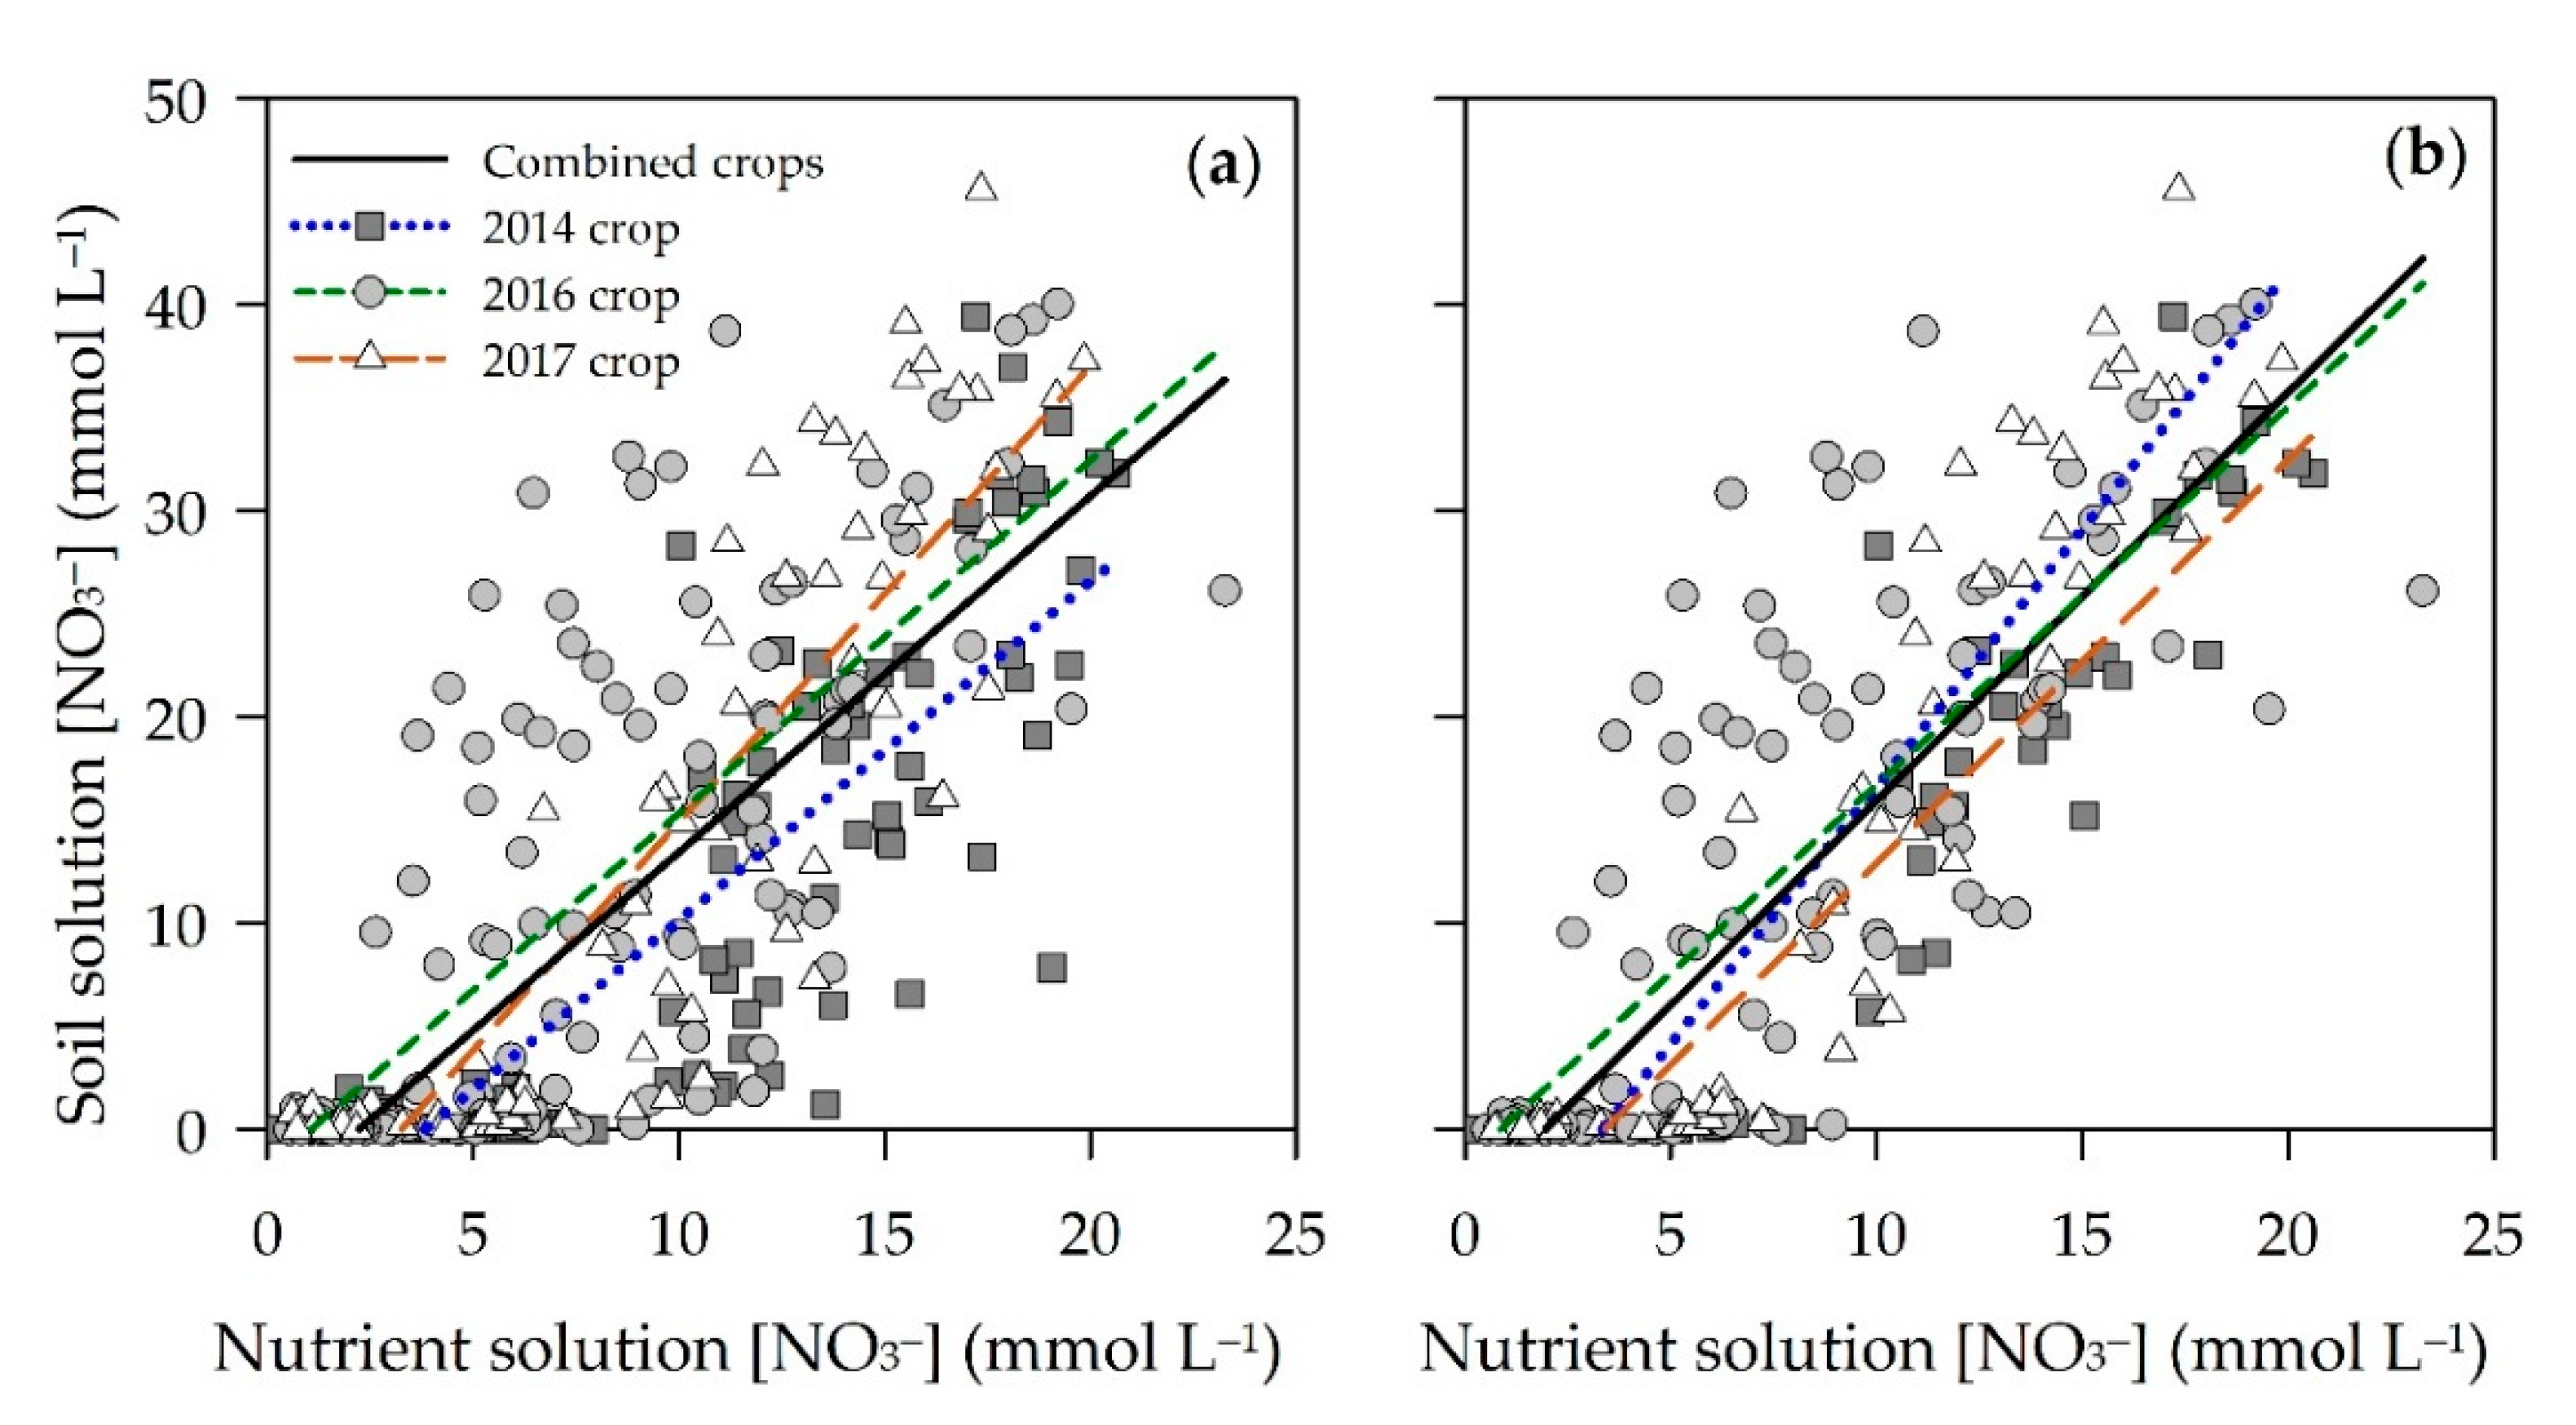
3.3. Relationship between Soil Solution [NO3−] and Applied Nutrient Solution [NO3−]
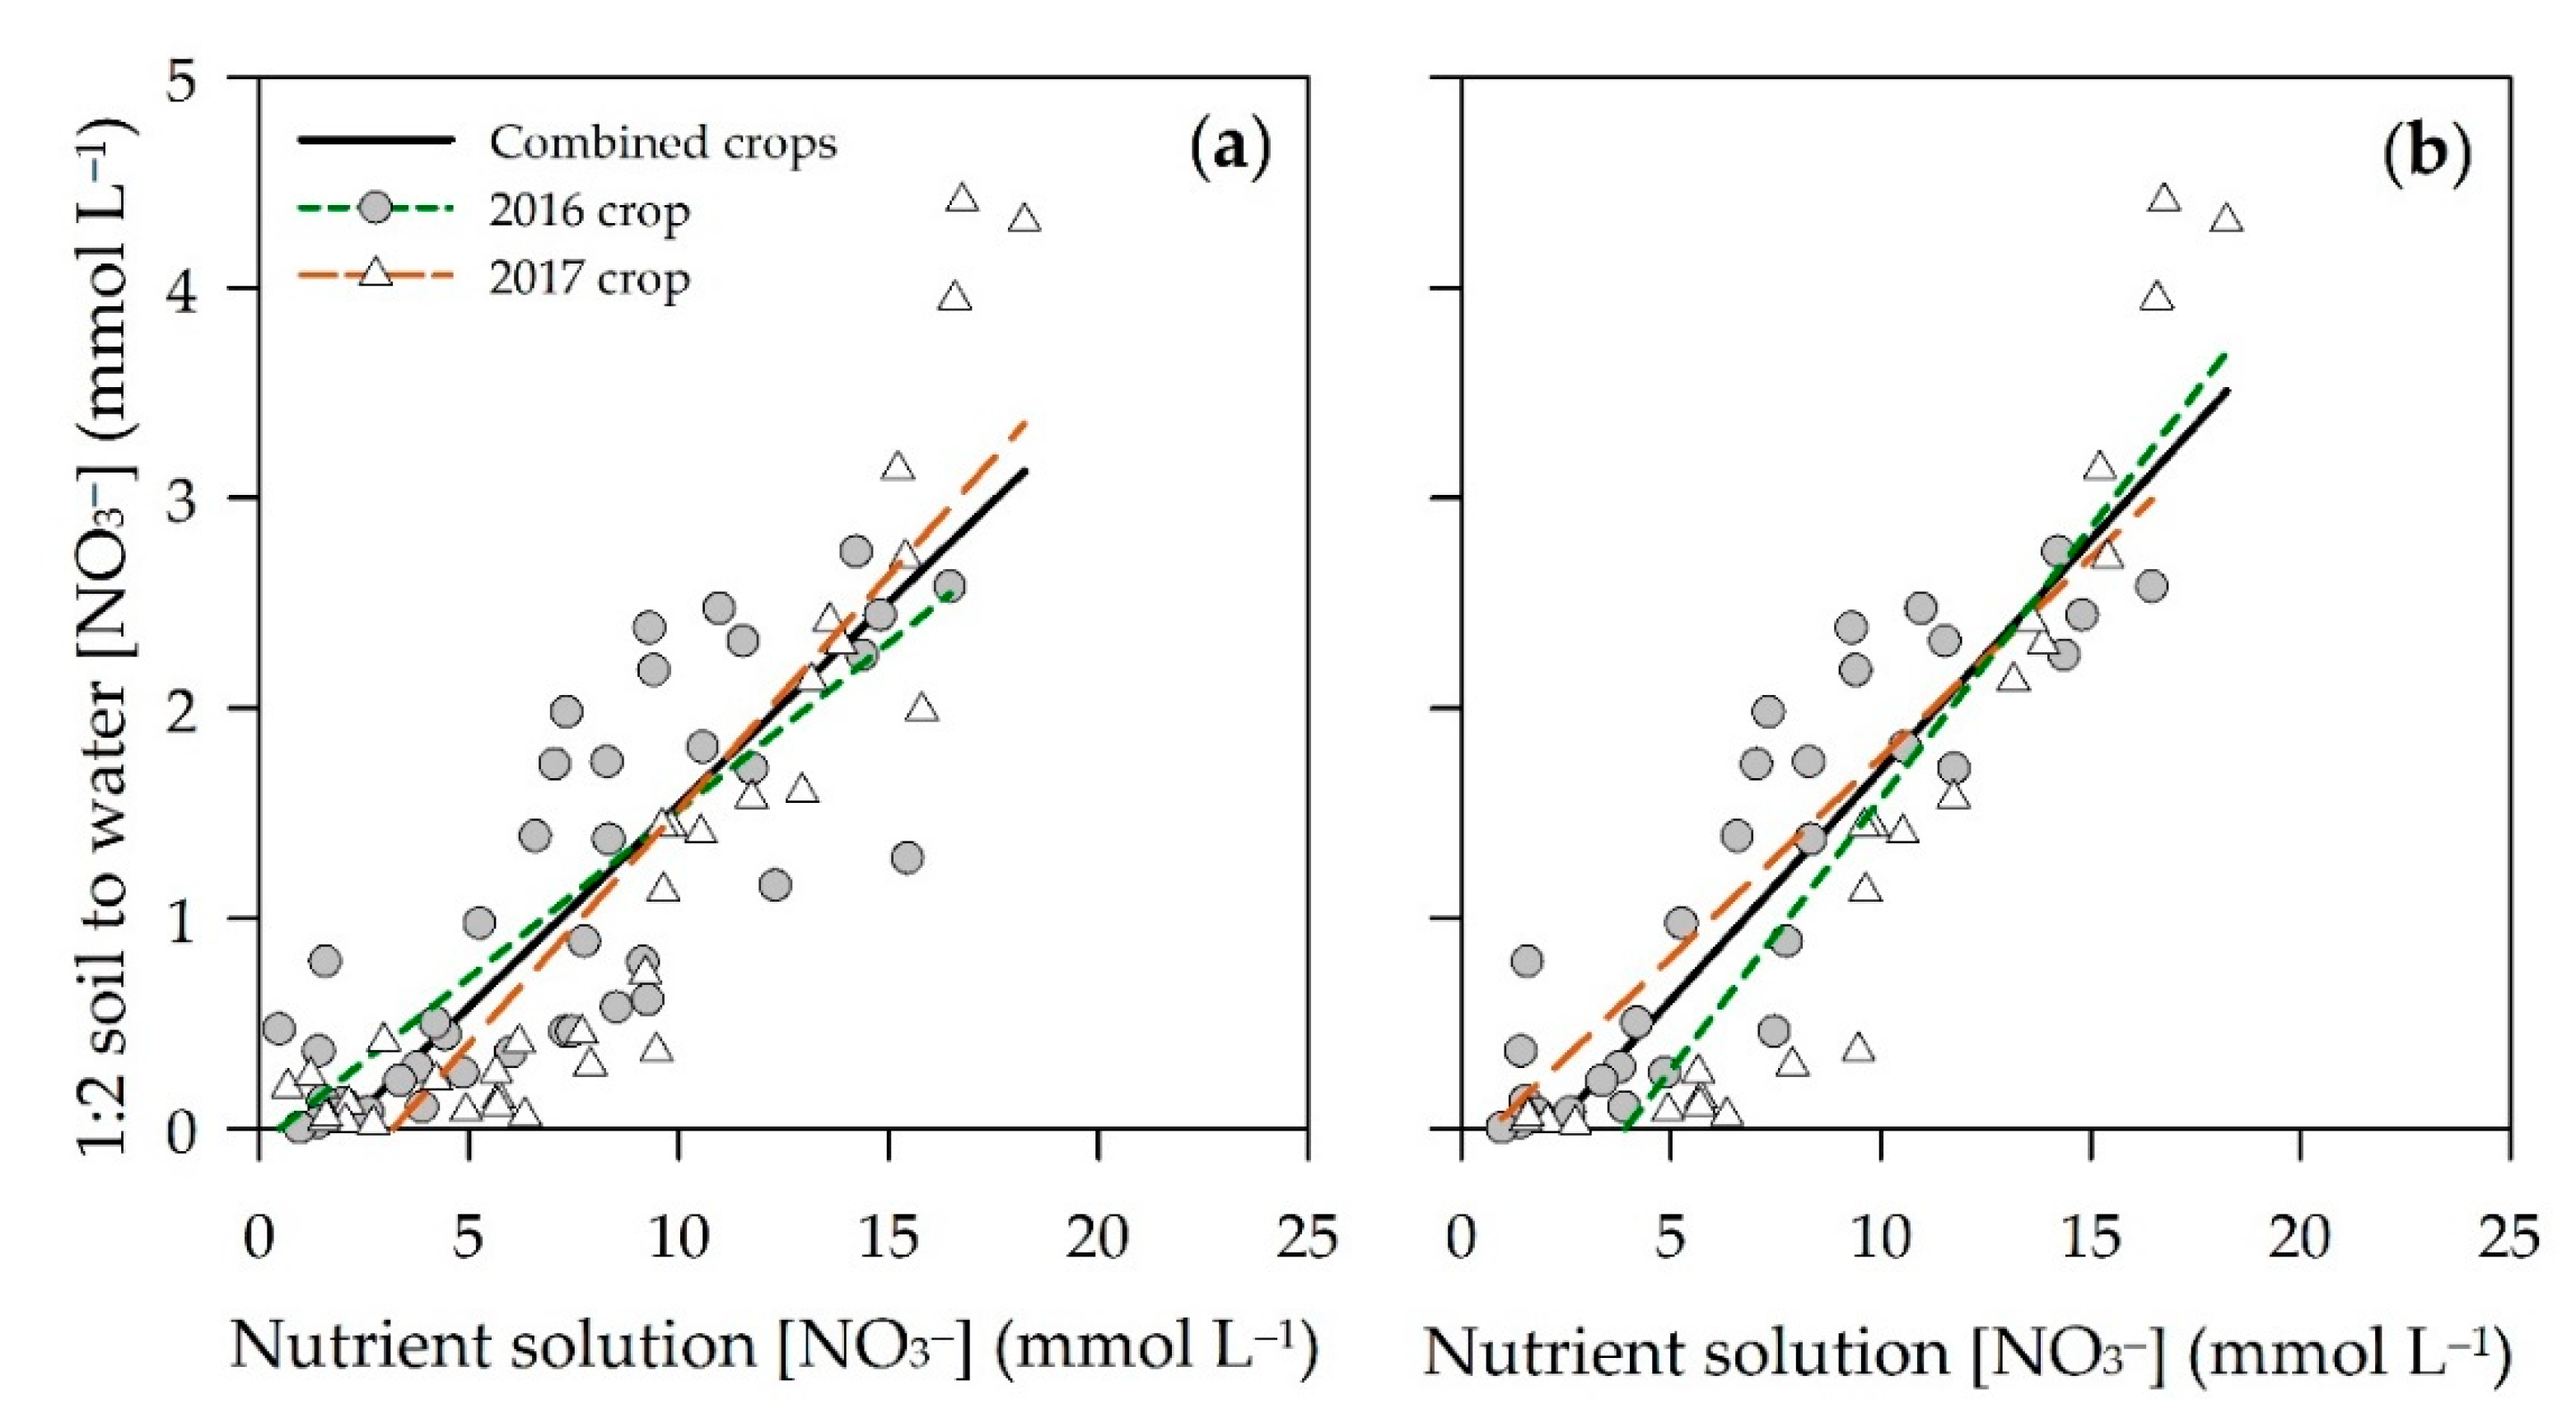
3.4. Relationship between [NO3−] of the 1:2 Soil to Water (v/v) Extract and the Applied Nutrient Solution [NO3−]
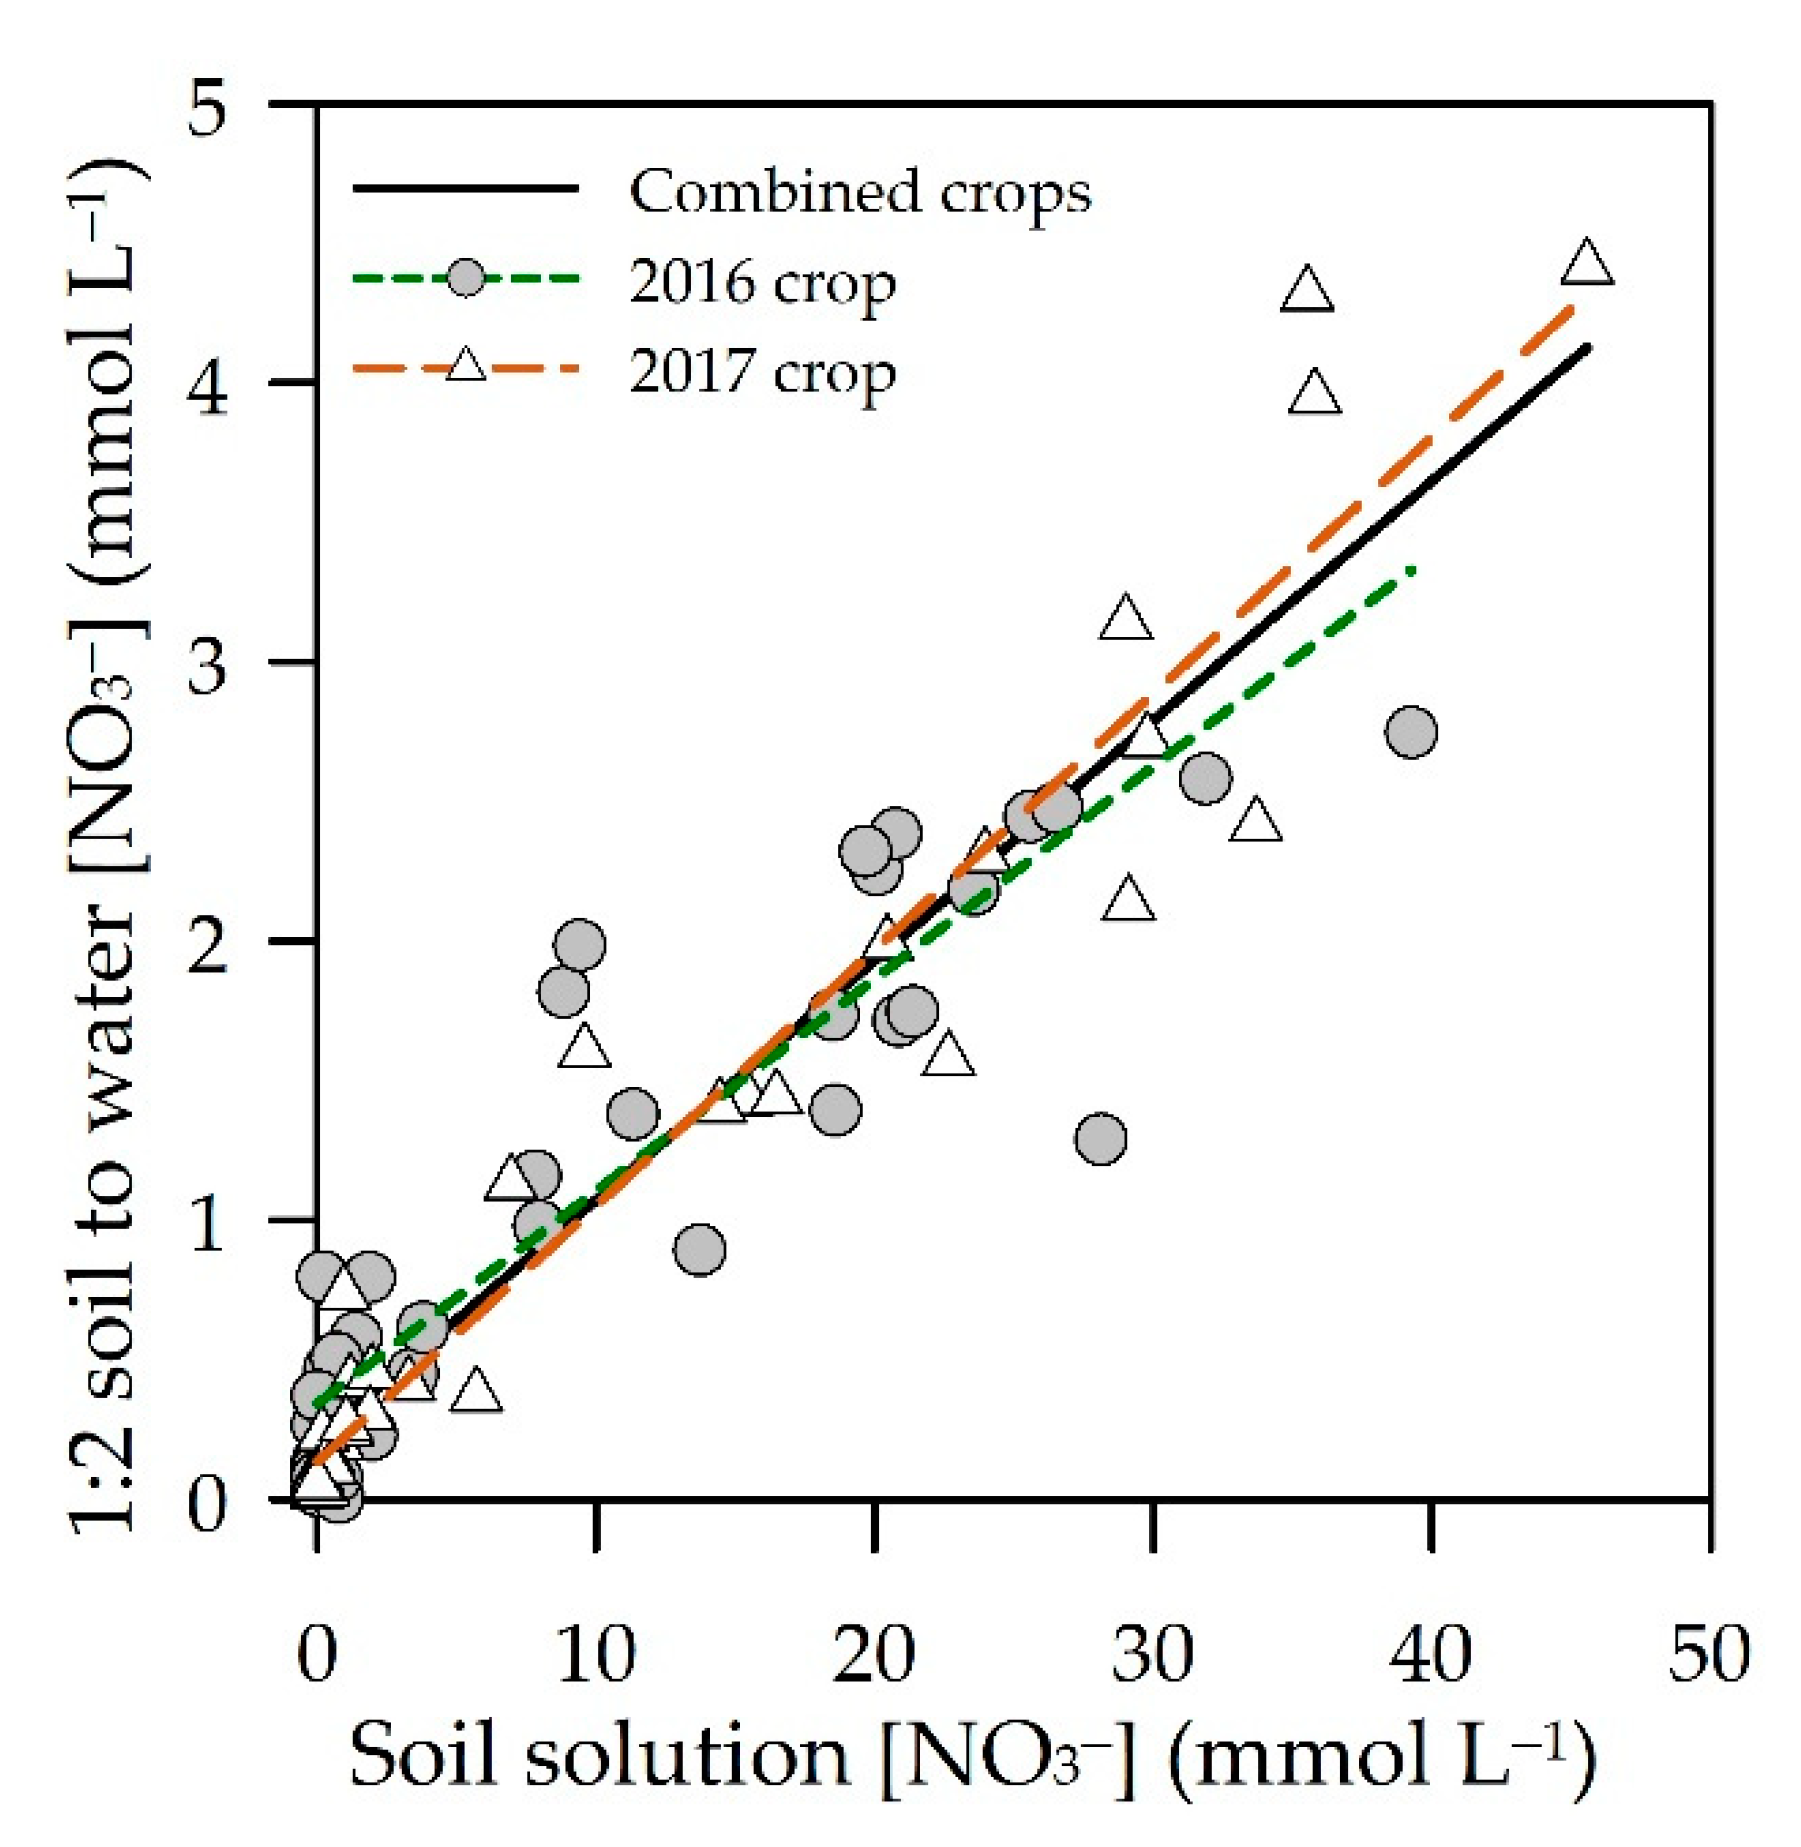
3.5. Relationship between Soil Solution [NO3−] and [NO3−] of the 1:2 Soil to Water (v/v) Extract
3.6. Variability of the Measurements of the Soil Solution [NO3−] and [NO3−] of the 1:2 Soil to Water (v/v) Extract
4. Discussion
4.1. Relationships of [NO3−] in Soil Solution and 1:2 Soil to Water (v/v) Extract, to N Supply and NNI
4.2. Sufficiency Values
4.3. General Considerations of the Use of the Soil Solution and 1:2 Soil to Water (v/v) Extract Methods
4.4. General Application of Results
5. Conclusions
Author Contributions
Funding
Acknowledgments
Conflicts of Interest
References
- Pardossi, A.; Tognoni, F.; Incrocci, L. Mediterranean Greenhouse Technology. Chron. Horticult. 2004, 44, 28–34. [Google Scholar]
- Tei, F.; De Neve, S.; de Haan, J.; Kristensen, H.L. Nitrogen management of vegetable crops. Agric. Water Manag. 2020, 240, 106316. [Google Scholar] [CrossRef]
- Thompson, R.B.; Martínez-Gaitan, C.; Gallardo, M.; Giménez, C.; Fernández, M.D. Identification of irrigation and N management practices that contribute to nitrate leaching loss from an intensive vegetable production system by use of a comprehensive survey. Agric. Water Manag. 2007, 89, 261–274. [Google Scholar] [CrossRef]
- Fernández, M.D.; González, A.M.; Carreño, J.; Pérez, C.; Bonachela, S. Analysis of on-farm irrigation performance in Mediterranean greenhouses. Agric. Water Manag. 2007, 89, 251–260. [Google Scholar] [CrossRef]
- Peña-Fleitas, M.T.; Thompson, R.B.; Gallardo, M.; Fernández-Fernández, M.D. Regional model of nitrate leaching for an intensive vegetable production system. In Nitrogen, Environment and Vegetables, Proceedings of the NEV 2013, Turín, Italy, 15–17 April 2013; Fontana, E., Grignani, C., Nicola, S., Eds.; Università degli Studi di Torino, 10095 Grugliasco: Turín, Italy, 2013; pp. 73–74. [Google Scholar]
- Thompson, R.B.; Padilla, F.M.; Peña-Fleitas, M.T.; Gallardo, M. Reducing nitrate leaching losses from vegetable production in Mediterranean greenhouses. Acta Hortic. 2020, 1268, 105–117. [Google Scholar] [CrossRef]
- Thompson, R.B.; Gallardo, M.; Fernández-Fernández, M.D. Measurement of Nitrate Leaching in Commercial Vegetable Production in SE Spain. In Nitrogen, Environment and Vegetables, Proceedings of the NEV 2013, Turín, Italy, 15–17 April 2013; Fontana, E., Grignani, C., Nicola, S., Eds.; Università degli Studi di Torino, 10095 Grugliasco: Turín, Italy, 2013; pp. 67–69. [Google Scholar]
- Pulido-Bosch, A.; Rigol-Sanchez, J.P.; Vallejos, A.; Andreu, J.M.; Ceron, J.C.; Molina-Sanchez, L.; Sola, F. Impacts of agricultural irrigation on groundwater salinity. Environ. Earth Sci. 2018, 77, 1–14. [Google Scholar] [CrossRef] [Green Version]
- Valera, L.D.; Belmonte, L.J.; Molina, F.D.; López, A. Greenhouse Agriculture in Almeria. A Comprehensive Techno-Economic Analysis; Cajamar Caja Rural: Almeria, Spain, 2016. [Google Scholar]
- Junta de Andalucía. Cartografía de Invernaderos en Almería, Granada y Málaga. Año. 2019. Available online: https://www.juntadeandalucia.es/export/drupaljda/Cartografia_inv_AL_GR_MA_180725.pdf (accessed on 13 May 2020).
- García, M.C.; Céspedes, A.J.; Pérez, J.J.; Lorenzo, P. El Sistema de la Producción Hortícola Protegido de la Provincia de Almería; IFAPA: Almeria, España, 2016. [Google Scholar]
- BOJA. Orden de 7 de Julio de 2009, por el que se Designan las Zonas Vulnerables y se Establecen Medidas Contra la Contaminación por Nitratos de Origen Agrario. Boletín Oficial de la Junta de Andalucía. N°157, 48–51. Año. 2009. Available online: http://www.juntadeandalucia.es/agriculturaypesca/cocow/archivos/orden_7_julio_2009_modificacion_decreto_36_2008.pdf (accessed on 22 October 2020).
- Anonymous. Council Directive 91/676/EEC concerning the protection of waters against pollution caused by nitrates from agricultural sources. Off. J. Eur. Commun. 1991, L375, 1–8. [Google Scholar]
- Domínguez, P. Estado Actual de los Acuíferos del Sur de la Sierra de Gádor-Campo de Dalías. Instituto Geológico y Minero de España. Ministerio de Economía y Competitividad. Año. 2014. Available online: http://info.igme.es/ConsultaSID/presentacion.asp?Id=166757 (accessed on 21 May 2019).
- BOJA. Orden de 1 de Junio de 2015, por la que se Aprueba el Programa de Actuación Aplicable en las Zonas Vulnerables a la Contaminación por Nitratos de Fuentes Agrarias Designadas en Andalucía, Boletín Oficial de la Junta de Andalucía. N°111. Año. 2015. Available online: https://www.juntadeandalucia.es/boja/2015/111/index.html (accessed on 22 October 2020).
- Thompson, R.B.; Incrocci, L.; van Ruijven, J.; Massa, D. Reducing contamination of water bodies from European vegetable production systems. Agric. Water Manag. 2020, 240, 106258. [Google Scholar] [CrossRef]
- Thompson, R.B.; Incrocci, L.; Voogt, W.; Pardossi, A.; Magán, J.J. Sustainable irrigation and nitrogen management of fertigated vegetable crops. Acta Hortic. 2017, 363–378. [Google Scholar] [CrossRef]
- Thompson, R.B.; Tremblay, N.; Fink, M.; Gallardo, M.; Padilla, F.M. Tools and Strategies for Sustainable Nitrogen Fertilisation of Vegetable Crops. In Advances in Research on Fertilization Management of Vegetable Crops; Tei, F., Nicola, S., Benincasa, P., Eds.; Springer: Heidelberg, Germany, 2017; pp. 11–63. [Google Scholar]
- Padilla, F.M.; Farneselli, M.; Gianquinto, G.; Tei, F.; Thompson, R.B. Monitoring nitrogen status of vegetable crops and soils for optimal nitrogen management. Agric. Water Manag. 2020, 241, 106356. [Google Scholar] [CrossRef]
- Peña-Fleitas, M.T.; Gallardo, M.; Thompson, R.B.; Farneselli, M.; Padilla, F.M. Assessing crop N status of fertigated vegetable crops using plant and soil monitoring techniques. Ann. Appl. Biol. 2015, 167, 387–405. [Google Scholar] [CrossRef] [PubMed]
- Granados, M.R.; Thompson, R.B.; Fernández, M.D.; Martínez-Gaitán, C.; Gallardo, M. Prescriptive-corrective nitrogen and irrigation management of fertigated and drip-irrigated vegetable crops using modeling and monitoring approaches. Agric. Water Manag. 2013, 119, 121–134. [Google Scholar] [CrossRef]
- Thompson, R.B.; Gallardo, M.; Joya, M.; Segovia, C.; Martínez-Gaitán, C.; Granados, M.R. Evaluation of rapid analysis systems for on-farm nitrate analysis in vegetable cropping. Spanish J. Agric. Res. 2009, 7, 200–211. [Google Scholar] [CrossRef] [Green Version]
- Sonneveld, C.; Van den Ende, J.; De Bes, S.S. Estimating the chemical compositions of soil solutions by obtaining saturation extracts or specific 1:2 by volume extracts. Plant Soil 1990, 122, 169–175. [Google Scholar] [CrossRef]
- Sonneveld, C.; Voogt, W. Plant Nutrition of Greenhouse Crops; Springer: Dordrecht, The Netherlands, 2009. [Google Scholar]
- Sonneveld, C.; Van den Ende, J. Soil Analysis by Means of a 1:2 Volume Extract. Plant Soil 1971, 505–516. [Google Scholar] [CrossRef]
- Gysi, C. A simple procedure to express results of soil analysis (1:2 volume extract) on a volume basis. Plant Soil. 1981, 63, 523–526. [Google Scholar] [CrossRef]
- Incrocci, L.; Massa, D.; Pardossi, A. New trends in the fertigation management of irrigated vegetable crops. Horticulturae 2017, 3, 37. [Google Scholar] [CrossRef]
- De Kreij, C.; Kavvadias, V.; Assimakopoulou, A.; Paraskevopoulos, A. Development of Fertigation for Trickle Irrigated Vegetables under Mediterranean Conditions. Int. J. Veg. Sci. 2007, 13, 81–99. [Google Scholar] [CrossRef]
- Incrocci, L.; University of Pisa, Pisa, Italy. Personal communication, 2020.
- Lemaire, G.; Jeuffroy, M.H.; Gastal, F. Diagnosis tool for plant and crop N status in vegetative stage. Theory and practices for crop N management. Eur. J. Agron. 2008, 28, 614–624. [Google Scholar] [CrossRef]
- Lemaire, G.; Gastal, F. N uptake and distribution in plant canopies. In Diagnosis of Nitrogen Status in Crops; Lemaire, G., Ed.; Springer: Berlin, Germany, 1997; pp. 3–41. [Google Scholar]
- Greenwood, D.J.; Lemaire, G.; Gosse, G.; Cruz, P.; Draycott, A.; Neeteson, J.J. Decline in Percentage N of C3 and C4 Crops with Increasing Plant Mass. Ann. Bot. 1990, 66, 425–436. [Google Scholar] [CrossRef] [Green Version]
- de Souza, R.; Peña-Fleitas, M.T.; Thompson, R.B.; Gallardo, M.; Grasso, R.; Padilla, F.M. The Use of Chlorophyll Meters to Assess Crop N Status and Derivation of Sufficiency Values for Sweet Pepper. Sensors 2019, 19, 2949. [Google Scholar] [CrossRef] [PubMed] [Green Version]
- Padilla, F.M.; de Souza, R.; Peña-Fleitas, M.T.; Gallardo, M.; Giménez, C.; Thompson, R.B. Different responses of various chlorophyll meters to increasing nitrogen supply in sweet pepper. Front. Plant Sci. 2018, 9, 1–14. [Google Scholar] [CrossRef] [PubMed] [Green Version]
- Padilla, F.M.; Peña-Fleitas, M.T.; Gallardo, M.; Thompson, R.B. Determination of sufficiency values of canopy reflectance vegetation indices for maximum growth and yield of cucumber. Eur. J. Agron. 2017, 84, 1–15. [Google Scholar] [CrossRef]
- Gázquez, J.C.; Pérez, C.; Meca, D.E.; Segura, M.D.; Domene, M.A.; De La Cruz, E.; López, J.C.; Buendía, D. Comparative study of tomato production strategies for long-cycle crop in enarenado and for inter-planting in different substrates systems in the Mediterranean area. Acta Hortic. 2017, 1170, 773–776. [Google Scholar] [CrossRef]
- Padilla, F.M.; Peña-Fleitas, M.T.; Gallardo, M.; Thompson, R.B. Evaluation of optical sensor measurements of canopy reflectance and of leaf flavonols and chlorophyll contents to assess crop nitrogen status of muskmelon. Eur. J. Agron. 2014, 58, 39–52. [Google Scholar] [CrossRef]
- Rodríguez, A.; Peña-Fleitas, M.T.; Gallardo, M.; de Souza, R.; Padilla, F.M.; Thompson, R.B. Sweet pepper and nitrogen supply in greenhouse production: Critical nitrogen curve, agronomic responses and risk of nitrogen loss. Eur. J. Agron. 2020, 117, 126046. [Google Scholar] [CrossRef]
- Gallardo, M.; Thompson, R.B.; López-Toral, J.R.; Fernández, M.D.; Granados, R. Effect of Applied N Concentration in a Fertigated Vegetable Crop on Soil Solution Nitrate and Nitrate Leaching Loss. Acta Hortic. 2006, 700, 221–224. [Google Scholar] [CrossRef]
- Hartz, T.K.; Hochmuth, G.J. Fertility Management of Drip-Irrigated Vegetables; UC Davis, Vegetable Research and Information Center: Davis, CA, USA, 1991. [Google Scholar]
- Burt, C.; O’Connor, K.; Ruehr, T. Fertigation; Irrigation Training and Research Center, California Polytechnic State University: San Luis Obisbo, CA, USA, 1995. [Google Scholar]
- Magán, J.J.; Gallardo, M.; Fernández, M.D.; García, M.L.; Granados, M.R.; Padilla, F.M.; Thompson, R.B. Showcasing a fertigation management strategy for increasing water and nitrogen use efficiency in soil-grown vegetable crops in the FERTINNOWA project. Acta Hortic. 2019, 1253, 17–24. [Google Scholar] [CrossRef]
- Hartz, T.K. The assessment of soil and crop nutrient status in the development of efficient fertilizer recommendations. Acta Hortic. 2003, 627, 231–240. [Google Scholar] [CrossRef]


| Crop Year | Date of Transplanting | Date End of the Crop (Duration) | N Treatment a | Mineral N Applied (kg N ha−1) b | Irrigation Amount (mm) c | [N] in Nutrient Solution (mmol L−1) b | DMP (t ha−1) | TY (t ha−1) |
|---|---|---|---|---|---|---|---|---|
| 2014 | 12 August 2014 | 29 January 2015 | N1 | 64 | 190 | 2.4 | 5.7 | 38.7 |
| (170 days) | N2 | 189 | 216 | 6.2 | 7.9 | 52.2 | ||
| N3 | 516 | 294 | 12.6 | 8.6 | 52.9 | |||
| N4 | 804 | 357 | 16.1 | 9.7 | 51.1 | |||
| N5 | 990 | 354 | 20.0 | 9.3 | 46.4 | |||
| 2016 | 19 July 2016 | 24 March 2017 | N1 | 88 | 319 | 2.0 | 8.8 | 67.2 |
| (248 days) | N2 | 302 | 404 | 5.3 | 12.6 | 86.4 | ||
| N3 | 561 | 414 | 9.7 | 15.2 | 91.5 | |||
| N4 | 1052 | 557 | 13.5 | 14.4 | 94.2 | |||
| N5 | 1320 | 532 | 17.7 | 13.6 | 89.7 | |||
| 2017 | 21 July 2017 | 20 February 2018 | N1 | 86 | 304 | 2.0 | 5.1 | 33.3 |
| (214 days) | N2 | 304 | 383 | 5.7 | 9.3 | 54.4 | ||
| N3 | 519 | 383 | 9.7 | 10.5 | 61.0 | |||
| N4 | 870 | 475 | 13.1 | 12.6 | 65.1 | |||
| N5 | 1198 | 513 | 16.7 | 12.6 | 68.9 |
| Data | Segmented Equation | Value [NO3−] (mmol L−1) | Maximum NNI Value | R2 | SE | |
|---|---|---|---|---|---|---|
| Pepper crop | ||||||
| 2014 | y = 0.1408x + 0.6602 | 2.8 | 1.05 | 0.81 | 0.09 | 93 |
| 2016 | y = 0.0302x + 0.7999 | 8.4 | 1.05 | 0.66 | 0.10 | 130 |
| 2017 | y = 0.1915x + 0.5868 | 2.3 | 1.03 | 0.81 | 0.09 | 80 |
| Combined crops | y = 0.1116x + 0.7029 | 3.1 | 1.05 | 0.70 | 0.10 | 303 |
| Phenological stage | ||||||
| Vegetative | y = 0.1412x + 0.6264 | 2.9 | 1.04 | 0.72 | 0.10 | 45 |
| Flowering and early fruit growth | y = 0.1723x + 0.6804 | 2.3 | 1.08 | 0.76 | 0.09 | 95 |
| Harvest | y = 0.1034x + 0.7229 | 3.0 | 1.03 | 0.68 | 0.09 | 163 |
| Data | Segmented Equation | Value [NO3−] (mmol L−1) | Maximum NNI Value | R2 | SE | |
|---|---|---|---|---|---|---|
| Pepper crop | ||||||
| 2016 | y = 0.2056x + 0.7471 | 1.55 | 1.07 | 0.64 | 0.09 | 40 |
| 2017 | y = 1.0310x + 0.5278 | 0.49 | 1.03 | 0.83 | 0.09 | 35 |
| Combined crops | y = 0.4132x + 0.6588 | 0.93 | 1.04 | 0.68 | 0.10 | 75 |
| Phenological stage | ||||||
| Vegetative | y = 0.7659x + 0.4835 | 0.60 | 0.94 | 0.42 | 0.12 | 10 |
| Flowering and early fruit growth | y = 0.6619x + 0.6005 | 0.67 | 1.04 | 0.74 | 0.10 | 20 |
| Harvest | y = 0.2452x + 0.7079 | 1.42 | 1.06 | 0.68 | 0.10 | 45 |
| Crop Year | Entire Crop | R2 | ±SE | Crop after 70 DAT | R2 | ±SE | ||
|---|---|---|---|---|---|---|---|---|
| 2014 | y = 1.6565x − 6.3849 | 0.71 | 6.2 | 93 | y = 1.9555x − 6.6405 | 0.86 | 4.8 | 48 |
| 2016 | y = 1.6959x − 1.5405 | 0.56 | 8.0 | 130 | y = 1.8308x − 1.5868 | 0.61 | 7.6 | 110 |
| 2017 | y = 2.2113x − 7.2355 | 0.77 | 6.8 | 80 | y = 2.4963x − 8.3451 | 0.85 | 5.7 | 60 |
| Combined crops | y = 1.7146x − 3.6156 | 0.62 | 7.6 | 303 | y = 1.9800x − 3.8567 | 0.72 | 6.9 | 218 |
| Crop Year | Entire Crop | R2 | ±SE | Crop after 70 DAT | R2 | ±SE | ||
|---|---|---|---|---|---|---|---|---|
| 2016 | y = 0.1591x − 0.0773 | 0.66 | 0.5 | 40 | y = 0.1899x − 0.1338 | 0.82 | 0.4 | 30 |
| 2017 | y = 0.2226x − 0.7094 | 0.82 | 0.6 | 35 | y = 0.2576x − 1.0090 | 0.87 | 0.5 | 25 |
| Combined crops | y = 0.1923x − 0.3819 | 0.74 | 0.6 | 75 | y = 0.2185x − 0.4792 | 0.82 | 0.5 | 55 |
| Crop Year | Entire Crop | R2 | ±SE | |
|---|---|---|---|---|
| 2016 | y = 0.0705x + 0.3621 | 0.84 | 0.4 | 40 |
| 2017 | y = 0.0917x + 0.1337 | 0.93 | 0.3 | 35 |
| Combined crops | y = 0.0824x + 0.2408 | 0.89 | 0.4 | 75 |
| [NO3−] Extract Method | Coefficient of Variation (CV) | |
|---|---|---|
| Average (%) | Range (%) | |
| Soil solution | ||
| 2014 crop | 11.4 | 1.6–49.3 |
| 2016 crop | 13.7 | 0.2–65.2 |
| 2017 crop | 18.0 | 0.1–51.4 |
| 1:2 soil to water (v/v) | ||
| 2016 crop | 17.0 | 2.7–49.1 |
| 2017 crop | 11.0 | 2.1–33.7 |
Publisher’s Note: MDPI stays neutral with regard to jurisdictional claims in published maps and institutional affiliations. |
© 2020 by the authors. Licensee MDPI, Basel, Switzerland. This article is an open access article distributed under the terms and conditions of the Creative Commons Attribution (CC BY) license (http://creativecommons.org/licenses/by/4.0/).
Share and Cite
Rodríguez, A.; Peña-Fleitas, M.T.; Padilla, F.M.; Gallardo, M.; Thompson, R.B. Soil Monitoring Methods to Assess Immediately Available Soil N for Fertigated Sweet Pepper. Agronomy 2020, 10, 2000. https://doi.org/10.3390/agronomy10122000
Rodríguez A, Peña-Fleitas MT, Padilla FM, Gallardo M, Thompson RB. Soil Monitoring Methods to Assess Immediately Available Soil N for Fertigated Sweet Pepper. Agronomy. 2020; 10(12):2000. https://doi.org/10.3390/agronomy10122000
Chicago/Turabian StyleRodríguez, Alejandra, M. Teresa Peña-Fleitas, Francisco M. Padilla, Marisa Gallardo, and Rodney B. Thompson. 2020. "Soil Monitoring Methods to Assess Immediately Available Soil N for Fertigated Sweet Pepper" Agronomy 10, no. 12: 2000. https://doi.org/10.3390/agronomy10122000