Article

Variation of Phenotypic Traits in Twelve Bambara Groundnut (Vigna subterranea (L.) Verdc.) Genotypes and Two F2 Bi-Parental Segregating Populations

1
Future Food Beacon, School of Biosciences, University of Nottingham Malaysia, Jalan Broga, Semenyih 43500, Selangor Darul Ehsan, Malaysia
2
Crops for the Future, Jalan Broga, Semenyih 43500, Selangor Darul Ehsan, Malaysia
3
CSIR-Savannah Agriculture Research Institute, Off Tamale-Tolon Road, Nyankpala, Tolon District, Tamale P.O. Box TL 52, Ghana
4
Tanzania Agricultural Research Institute (TARI), Naliendele Centre, 10 Newala Road, Mtwara P.O. Box 509, Tanzania
5
Department of Crop Science, Usmanu Danfodiyo University, Sokoto P.M.B. 2346, Sokoto State, Nigeria
6
Plant and Crop Sciences, School of Biosciences, University of Nottingham, Sutton Bonington Campus, Leics, Loughborough LE12 5RD, UK
7
Crops for the Future (UK) CIC 76-80 Baddow Road, Chelmsford, Essex CM2 7PJ, UK
*
Author to whom correspondence should be addressed.
Agronomy 2020, 10(10), 1451; https://doi.org/10.3390/agronomy10101451
Submission received: 15 July 2020 / Revised: 21 August 2020 / Accepted: 22 August 2020 / Published: 23 September 2020
(This article belongs to the Special Issue Genotype× Environment Interactions in Crop Breeding)

Abstract

:
Underutilised species such as bambara groundnut (Vigna subterranea (L.) Verdc.) have the potential to contribute significantly to meeting food and nutritional needs worldwide. We evaluated phenotypic traits in twelve bambara groundnut genotypes from East, West and Southern Africa and Southeast Asia and two F2 bi-parental segregating populations derived from IITA-686 ×Tiga Nicuru and S19-3 ×DodR to determine phenotypic trait variation and their potential contribution to the development of improved crop varieties. All phenotypic traits in twelve genotypes were significantly influenced (p < 0.01) by genotypes. Principal component analysis (PCA) showed that PC1 accounted for 97.33% variation and was associated with four genotypes collected from East and Southern Africa. PC2 accounted for 2.48% of the variation and was associated with five genotypes collected from East, West and Southern Africa. Transgressive segregation for a number of traits was observed in the two F2 bi-parental populations, as some individual lines in the segregating populations showed trait values greater or less than their parents. The variability between twelve genotypes and the two F2 bi-parental segregating populations and the negative relationship between plant architectural traits and yield related traits provide resources for development of structured populations and breeding lines for bambara groundnut breeding programme.

1. Introduction

Bambara groundnut [Vigna subterranea (L.) Verdc.] is an underutilised legume crop, mainly grown by subsistence farmers in Africa [1,2,3,4]. Underutilised crops are still grown in their centres of origin or centres of diversity and are adapted to local conditions and marginal environments, while playing a significant role in food security, nutrition, income generation and cultural functions for people who grow them [2,5,6,7,8,9]. The potential of underutilised species to contribute to global food security and nutrition in the context of their significance for diversifying dietary and agriculture systems has been gaining prominence in recent times [2,6,7,8,10,11,12]. However, as the third most important food legume crop in semi-arid Africa after groundnut (Arachis hypogaea L.) and cowpea (Vigna unguiculata L. Walp) [13], bambara groundnut has often received limited support from government and international agencies [9,14,15].
The bambara groundnut plant life cycle is genotype dependent, ranging from 90 to 150 days and requiring 30 to 40 days to form pods after fertilisation, and generally reaches maturity most quickly under a photoperiod of 12 h [16,17]. Flowering in the bambara groundnut starts 30 to 45 days after planting and may continue until the end of life cycle, which is dependent on landraces and the environment [18]. The nodules formed on the roots fix atmospheric nitrogen, which is an important trait for soil fertility improvement and beneficial in crop rotation and intercropping [19]. The seed contains approximately 24% protein, 64% carbohydrates (53% starch, 10% dietary fibre), and 6% total fat, providing nutrition and a balanced diet for humans [20,21,22].
As with most of the underutilised and neglected crop species which lack established breeding programmes, landraces of bambara groundnut have remained the main source of planting materials used by farmers and the crop is still largely grown as landraces [14,23,24,25,26]. A major crop improvement programme is needed to enhance the genetic potential of bambara groundnut and to ensure sustainability and resilience, along with reasonable yield and quality. Development of improved varieties will bring into the market new materials and desirable traits such as early maturity, high yield and protein content, large pods and fast cooking to boost production and utilization of bambara groundnut [16,25]. Hybridization approaches for bambara groundnut have been reported and optimised [16,20,27]. The development of breeding resources that contribute towards variety development can also serve as material for genetic studies related to abiotic and biotic stress adaptive mechanisms.
In the present study, we characterised twelve genotypes from East, West and Southern Africa and Southeast Asia and two F2 bi-parental segregating populations generated from four genotypes, IITA-686 ×Tiga Nicuru, S19-3 × DodR. This study aims to provide a better understanding of phenotypic trait variations among twelve genotypes collected from different geographical locations and the relationship between plant architectural traits and yield components, and to explore phenotypic trait variations in the segregating populations for potential contribution to crop variety development.

2. Materials and Methods

2.1. Plant Material and Growing Conditions

Twelve genotypes (developed by single plant descent (SPD) of bambara groundnut and two F2 bi-parental segregating populations generated from four genotypes, IITA-686 × Tiga Nicuru (156 individual lines) and S19-3 × DodR (116 individual lines) were evaluated for phenotypic traits in a rainout shelter at the School of Biosciences, University of Nottingham Malaysia (2°56′46.74″ N; 101°52′24.35″ E) with mean 31 ± 4 °C/25 ± 1 °C day/night air temperature between February and June 2017. These twelve genotypes were collected from Africa and Southeast Asia, namely S19-3, Uniswa Red, DipC and AHM from Southern Africa, IITA-686, DodR and TAN385 from East Africa, LunT, Tiga Nicuru, Ankpa-4 and Getso from West Africa, Gresik from Southeast Asia (Table 1). Ten replicates of twelve genotypes were arranged in randomised complete block design (RCBD). Two F2 bi-parental segregating populations, IITA-686 × Tiga Nicuru (156 individual lines) and S19-3 × DodR (116 individual lines) were planted in the separate plots with their parental lines.
The seeds of the twelve genotypes and the two segregating populations were soaked at room temperature (approximately 28 °C) for one day in the distilled water before sowing. A planting distance of 50 cm × 30 cm was established for the trials between the rows and between the plants. Fertiliser, including 1.86 kg nitrogen (N), phosphorus (P) and potassium (K) NPK (15:15:15) (133 kg/ha), 0.662 kg triple super phosphate (TSP) fertiliser (44 kg/ha) and 0.933 kg muriate of potash (MOP) (67 kg/ha) was applied two weeks after sowing. All the other agronomic procedures, such as watering, weeding and spraying of pesticides were carried out as and when necessary.

2.2. Traits Recorded

Phenotypic traits, i.e., days to flowering, number of leaves per plant, petiole length, internode length, petiole internode ratio, plant height, 100-seed weight, harvest index and shelling percentage, were recorded based on the bambara groundnut descriptor list [35] with minor modification. Measurements included:
Days to flowering, number of leaves per plant, petiole length, internode length and plant height. Petiole internode ratio (P/I) was recorded based on the classification, Bunch type (P/I ≥ 9); Semi-bunch type (P/I = 7–9) and Spreading type (open) (P/I ≤ 7).
Yield data included 100-seed weight, harvest index and shelling percentage recorded after pods were dried in a high-volume oven (Memmert, Germany) at 40 °C for 14 days.

2.3. Data Analysis

Analysis of variance (ANOVA), Tukey’s multiple comparison test, W-test normality tests, principal components analysis (PCA) and Pearson’s correlation coefficient tests were carried out for all phenotypic traits of twelve genotypes using 18th edition Genstat Statistical package (18th edition, VSN International, Hemel Hempstead, UK). Moreover, phenotypic traits of the two F2 bi-parental segregating populations were subjected to Frequency distribution, Pearson’s correlation coefficient tests and regression test using 18th edition Genstat Statistical package (18th edition, VSN International, UK).

3. Results

3.1. Phenotypic Trait Variation in Twelve Bambara Groundnut Genotypes

Plant height, petiole length, internode length and 100-seed weight showed normal trait distribution in the twelve genotypes (p > 0.05). All phenotypic traits were significantly influenced (p < 0.01) by genotypes (Table 2). Comparing among twelve genotypes, Tiga Nicuru showed the earliest days to flowering the shortest plant height, petiole length and internode length while IITA-686 showed fewer number of leaves per plant but high harvest index. DodR was reported to have long internode length, high number of leavers per plant, 100-seed weight, while S19-3 had fewer number of leaves per plant, but high harvest index and shelling percentage. Growth habit ranged from bunch (LunT, Tiga Nicuru and Uniswa Red) to spreading types (DodR) and most genotypes classified as semi-bunch types (AHM, Ankpa4, Getso, Gresik, IITA-686, S19-3 and TAN385). The spreading growth habit type showed not only the longest internode length and but also the highest plant height in comparison to other growth habit types.
Number of leaves per plant (r = 0.64, p < 0.05), plant height (r = 0.79, p < 0.01) and petiole length (r = 0.74, p < 0.01) showed a strong linear relationship with internode length (Table 3). Both number of leaves per plant (r = 0.61, p < 0.05) and plant height (r = 0.86, p < 0.01) showed a strong linear relationship with petiole length. The negative correlation was observed between harvest index and number of leaves per plant (r = −0.60, p < 0.05). Yield related traits, namely 100-seed weight, harvest index, shelling percentage showed a negative correlation with the key vegetative growth indices, number of leaves per plant, plant height, petiole length, internode length and petiole internode ratio (r < 0.04). A positive correlation between harvest index and shelling percentage (r = 0.59, p < 0.05) was observed.

3.2. Principal Components Analysis for Twelve Genotypes Based on Phenotypic Traits

A principal component analysis (PCA) was carried out in order to investigate whether the trait variation observed among genotypes was influenced by the geographical locations where these genotypes were originally collected from. The first two principal components (PC), PC1 and PC2, accounted for 97.33% and 2.48% of the variation, respectively, with a cumulative variation of 99.81% (Figure 1). PC1 was associated with four genotypes collected from East and Southern Africa, i.e., TAN385 and DodR from East Africa and AHM and DipC from Southern Africa. The genotype TAN385 contributed 73% of the variation in the PC1. PC2 was associated with five genotypes from East, West and Southern Africa, i.e., IITA-686 from East Africa, Tiga Nicuru and Getso from West Africa, S19-3 and Uniswa Red from Southern Africa.

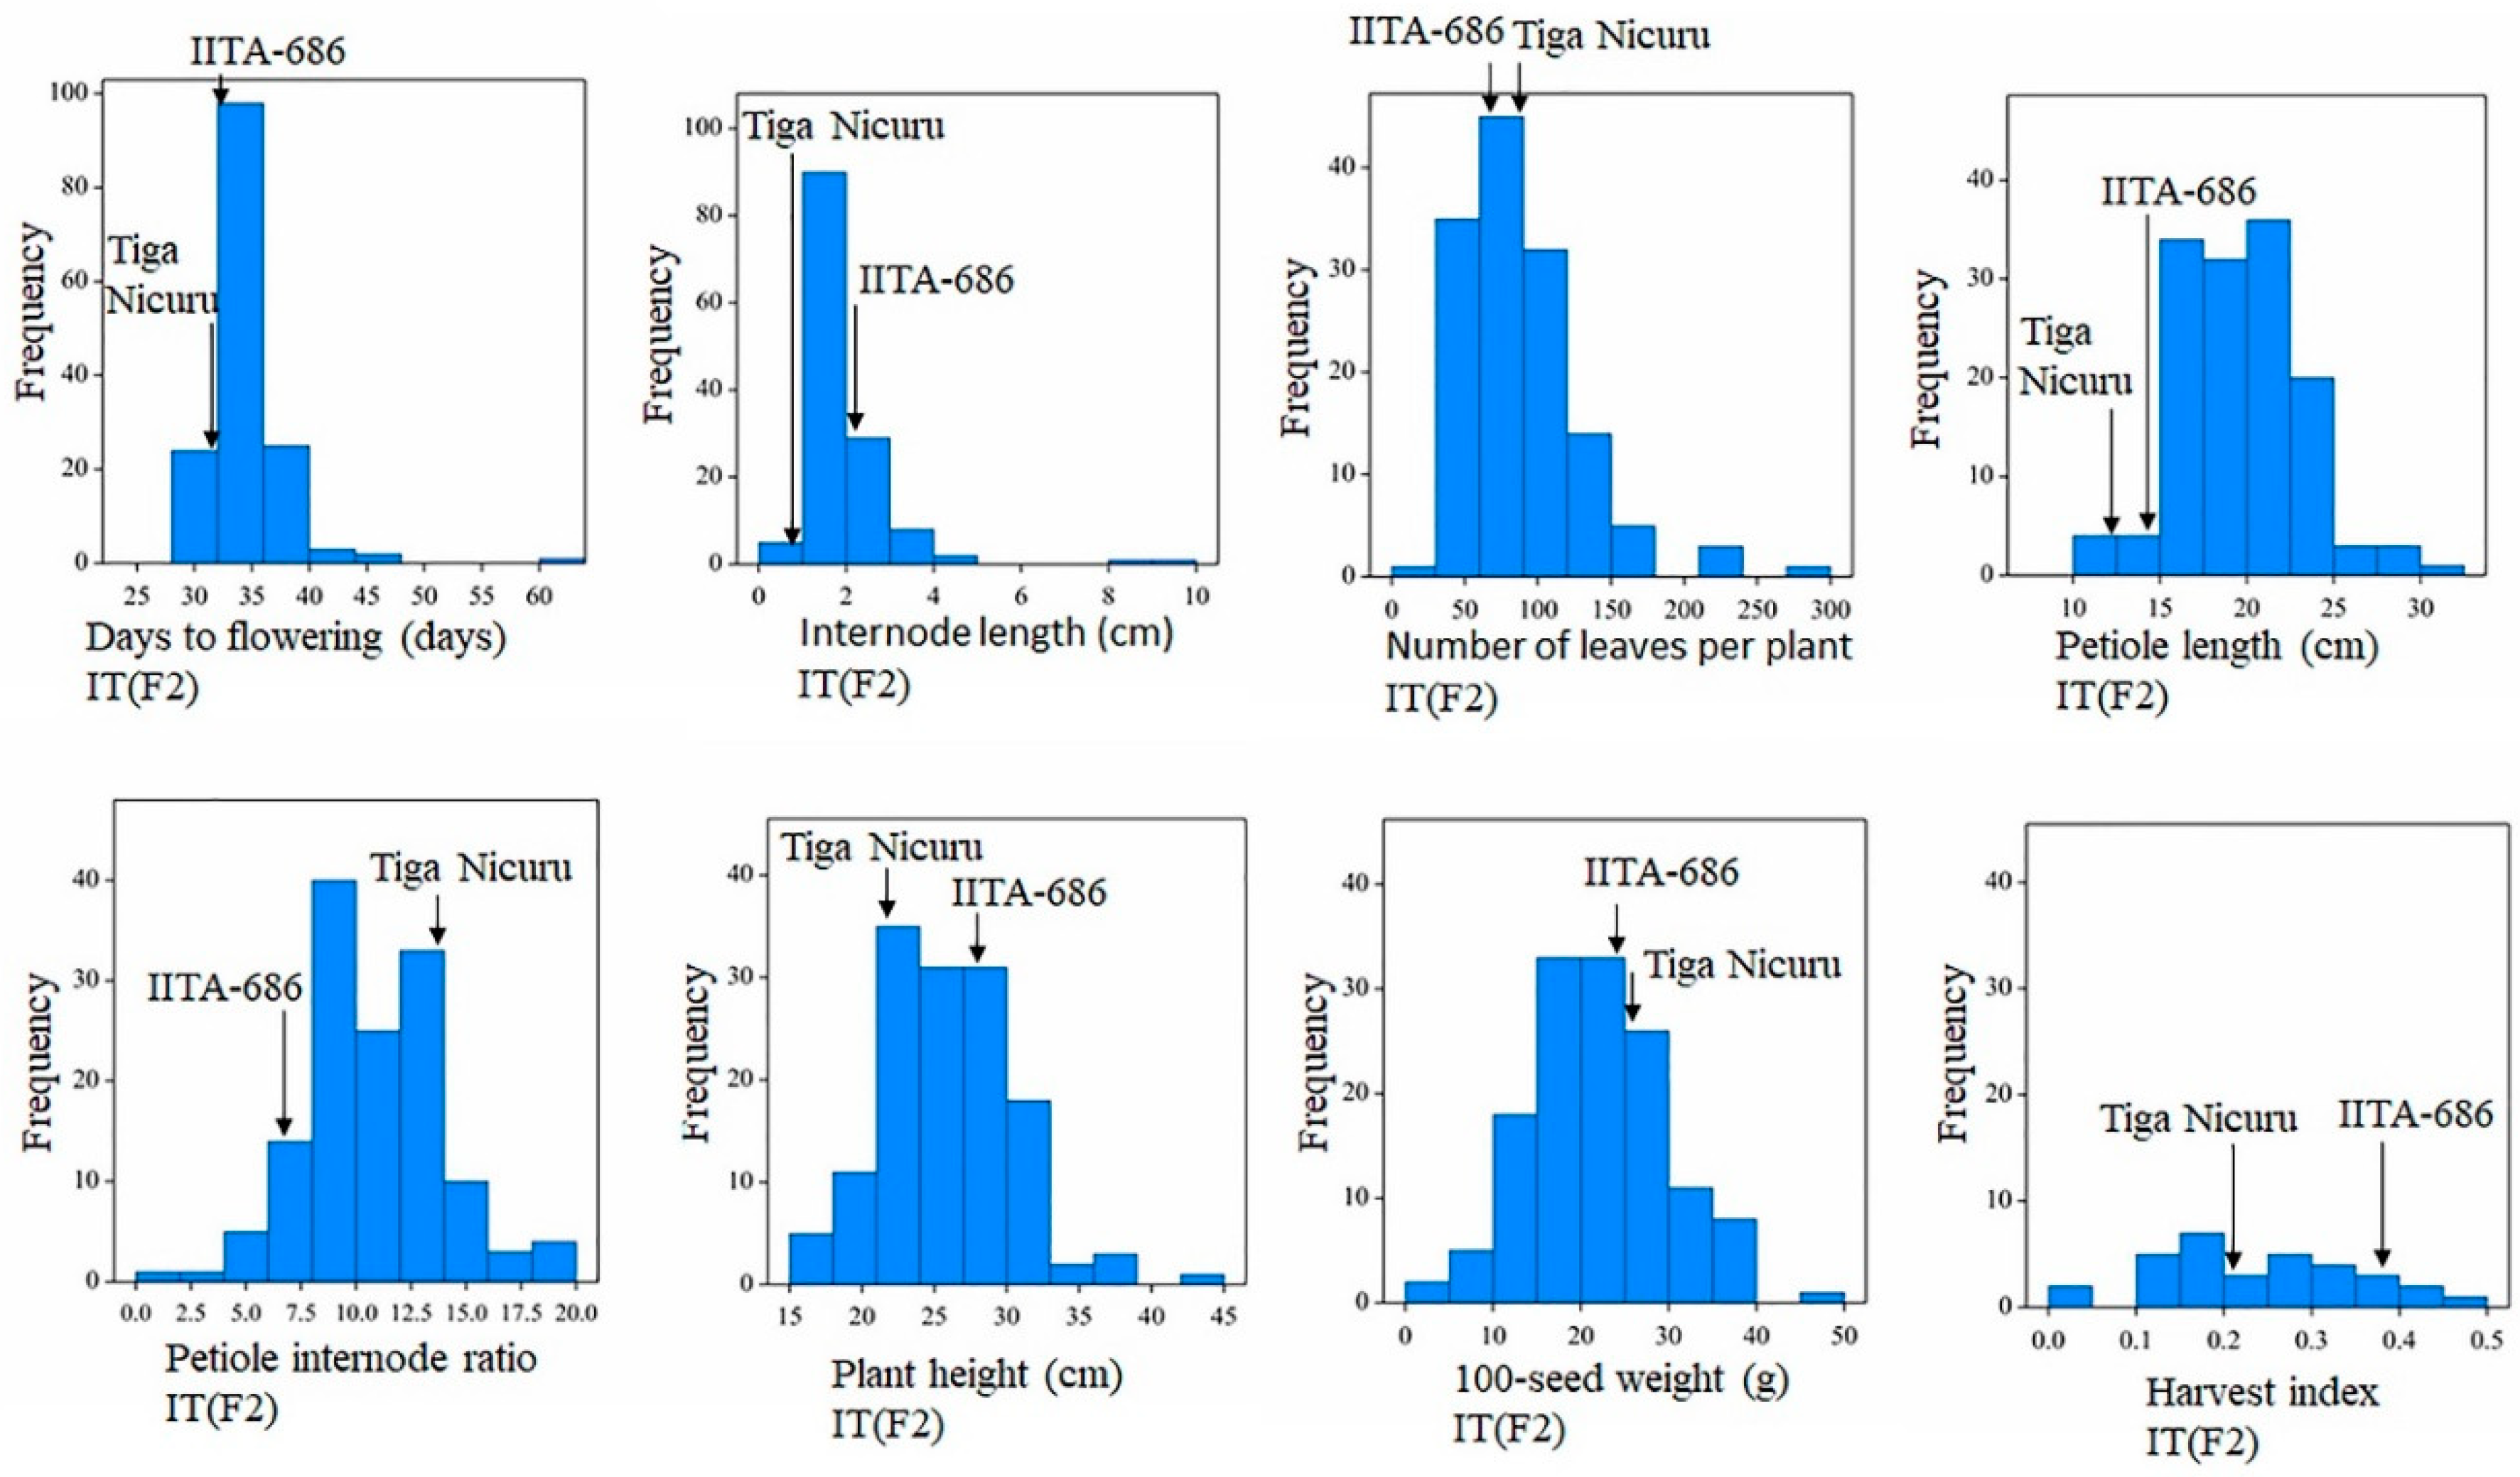
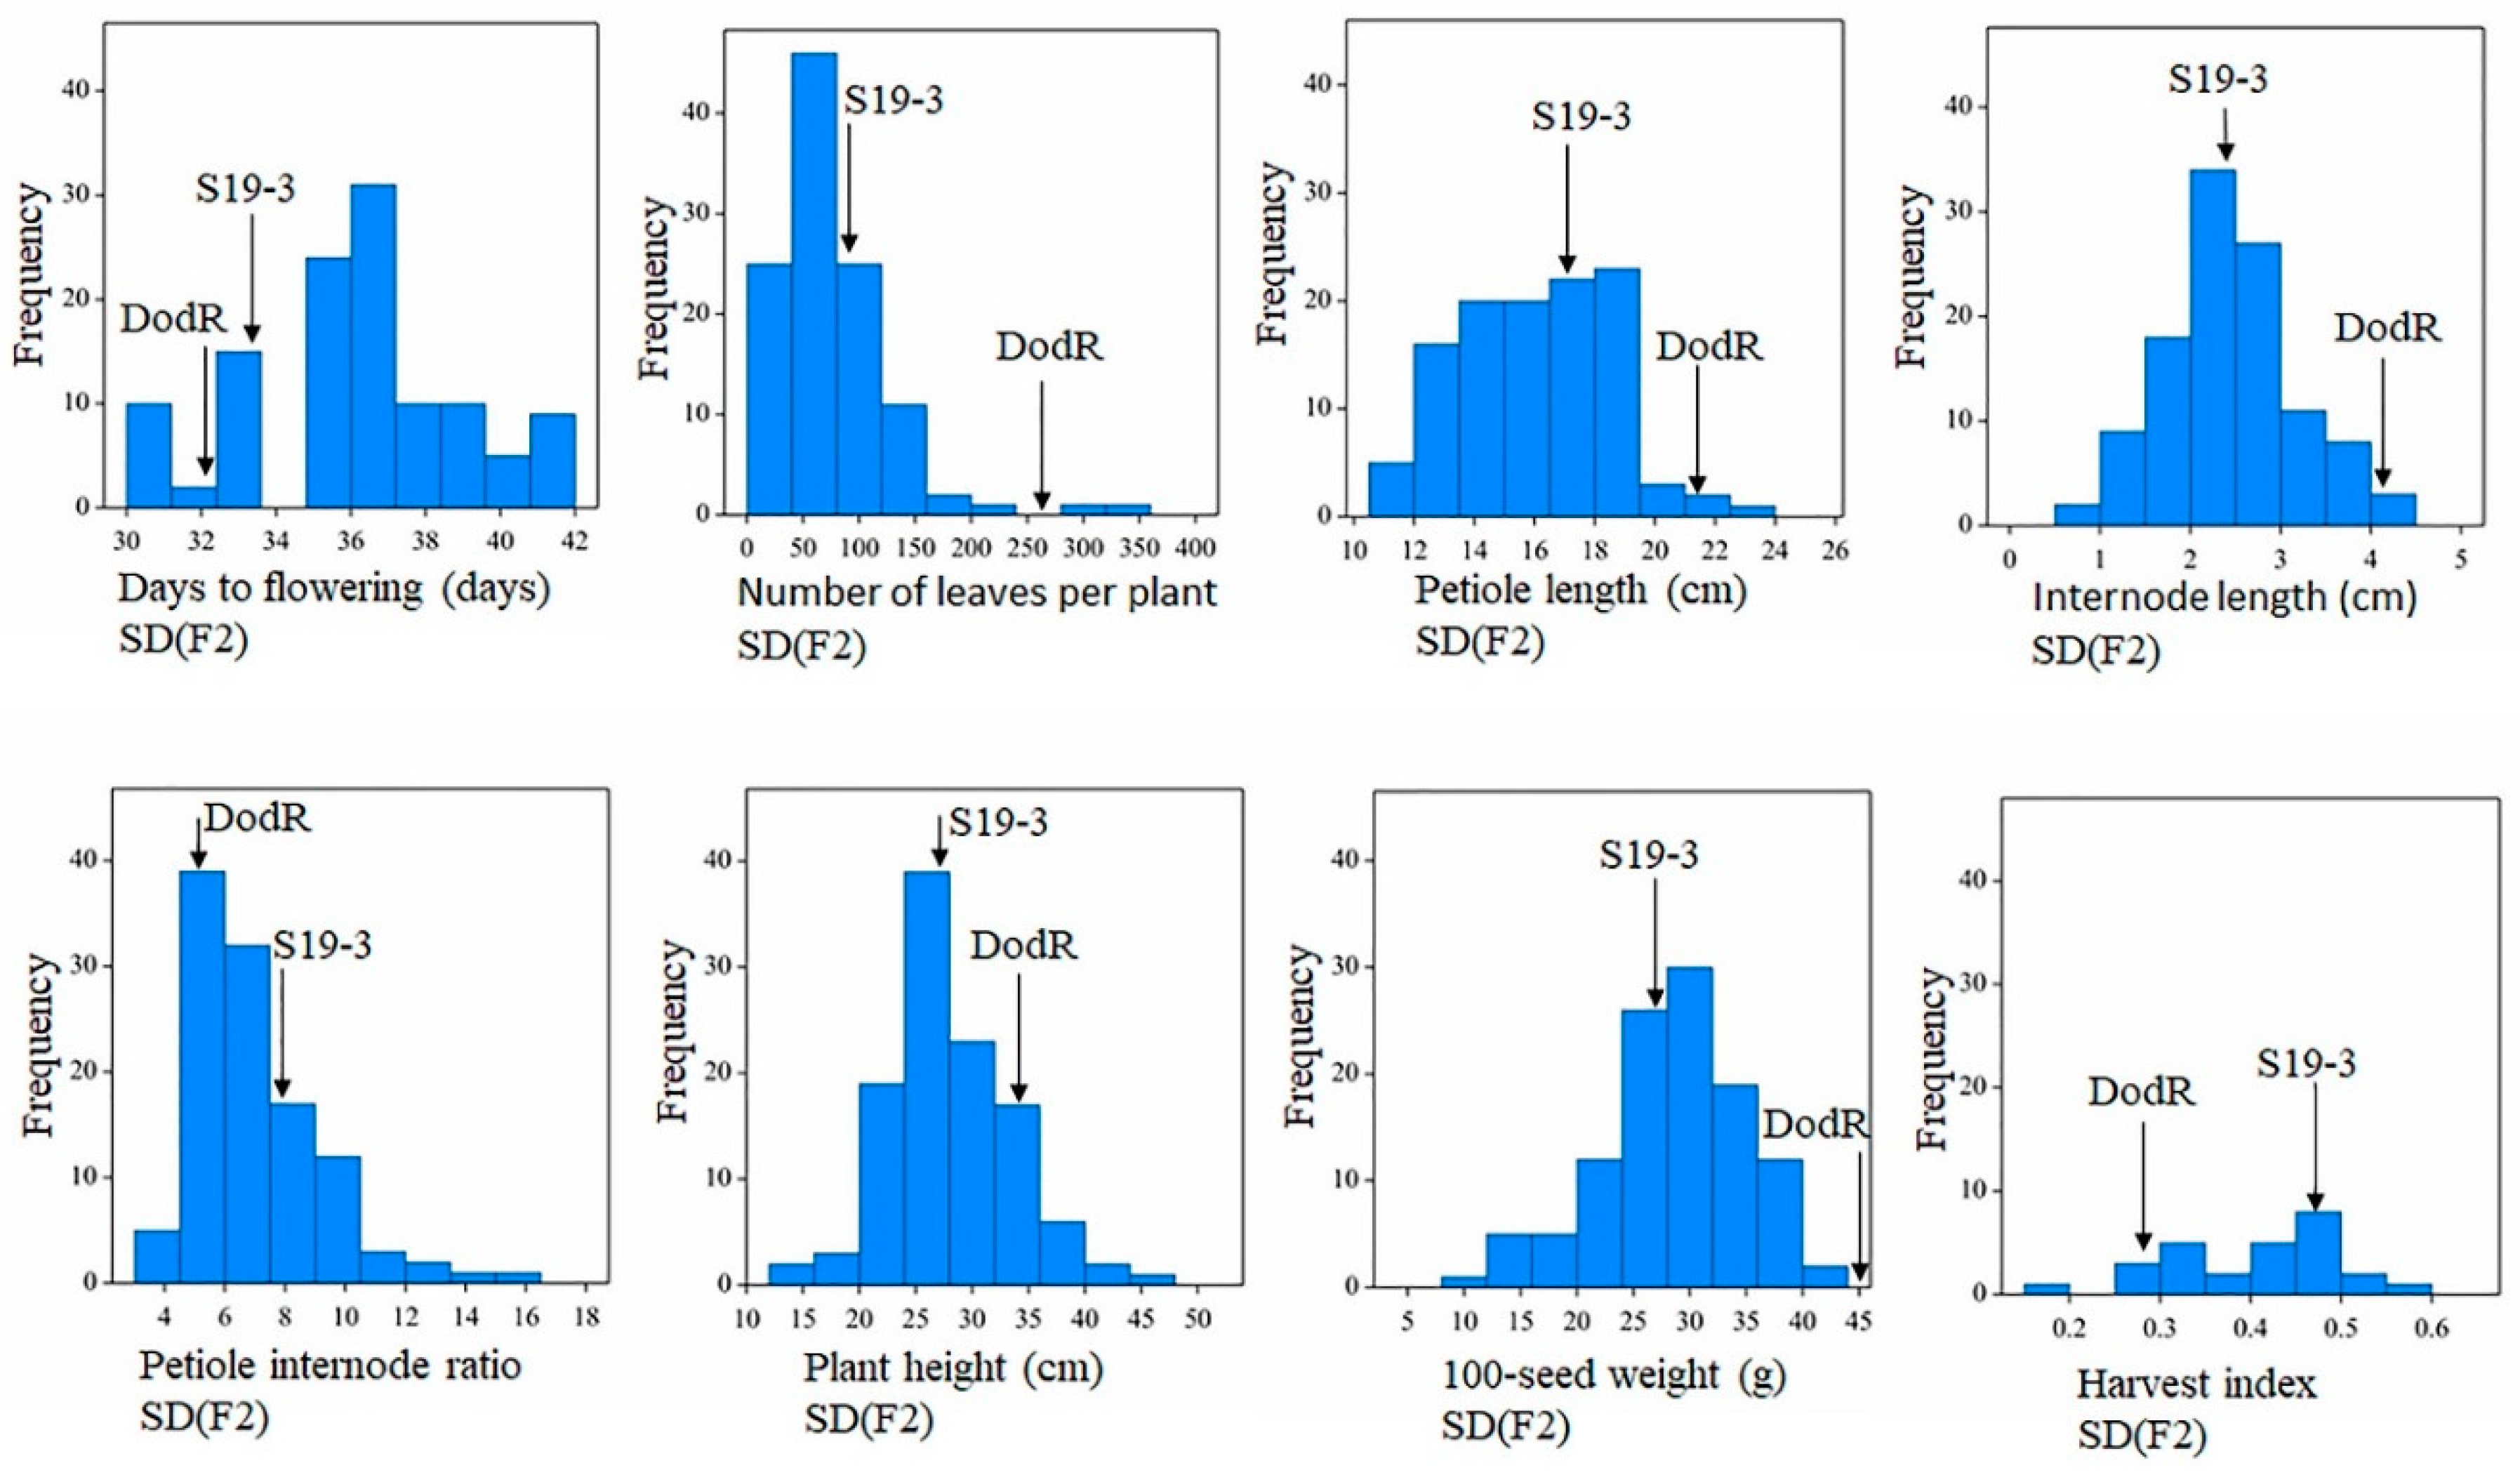
3.3. Phenotypic Trait Variations in the F2 bi-Parental Segregating Populations

Plant height, petiole length, 100-seed weight and harvest index showed normal trait distribution in the F2 bi-parental segregating population, IITA-686 × Tiga Nicuru and S19-3 × DodR (p > 0.01) (Table 4 and Table 5). Transgressive segregation for traits was observed in the F2 bi-parental segregating populations, IITA-686 × Tiga Nicuru and S19-3 × DodR (Figure 2 and Figure 3). For example, the F2 individual lines derived from IITA-686 × Tiga Nicuru had a petiole length that ranged from 11.83 cm (Line-66) to 30.67 cm (Line-125) whereas the petiole length in IITA-686 ranged from 10.10 cm to 19.75 cm (IITA-686 mean, 14.79 ± 0.87 cm; s.d. 2.73; n = 10) and Tiga Nicuru ranged from 10.60 cm to 15.57 cm (Tiga Nicuru mean, 12.52 ± 0.53 cm; s.d. 1.51, n = 10) (Table 4 and Figure 2). The F2 individual lines derived from S19-3 × DodR had a 100-seed weight that ranged from 10.79 g (Line-29) to 41.75 g (Line-96) whereas the 100-seed weight in S19-3 ranged from 16.70 g to 39.58 g (S19-3 mean, 27.47 ± 2.95 g; s.d. 7.81; n = 10) and DodR ranged from 37.88 g to 52.70 g (DodR mean, 45.49 ± 1.57 g; s.d. 4.96, n = 10) (Table 5 and Figure 3).

3.4. Correlation Coefficient Analysis of Phenotypic Traits in the F2 bi-Parental Segregating Populations

Number of leaves per plant showed positive correlation with plant height and internode length in the two F2 bi-parental segregating populations, IITA-686 × Tiga Nicuru (r = 0.54, p < 0.01; r = 0.54, p < 0.01) and S19-3 × DodR (r = 0.62, p < 0.01; r = 0.51, p < 0.01) (Tables S1 and S2). Harvest index and 100-seed weight showed strong positive linear relationship (r = 0.81, p < 0.05) in the F2 segregating population derived from IITA-686 × Tiga Nicuru (Table S1, Figure 4A), and weak correlation (r = 0.40, p < 0.05) in the F2 segregating population derived from S19-3 × DodR (Table S2).
Harvest index showed a negative correlation with the key vegetative growth indices, number of leaves per plant (r = −0.50, p < 0.01), plant height (r = −0.70, p < 0.01), petiole length (r = −0.49, p < 0.01), internode length (r = −0.69, p < 0.01) and positive correlation with petiole internode ratio (r = 0.44, p < 0.05) (Table S2). The negative linear relationships between harvest index and both internode length and plant height were observed in the F2 segregating population derived from S19-3 × DodR (Figure 4B,C).

4. Discussion

The significance of single plant descent (SPD) in the context of deploying various short-to-medium term variety development strategies within bambara groundnut breeding programmes have been highlighted [16,36,37]. High inbreeding co-efficient and heterozygosity (Ho) below 5% observed in 119 landrace-derived genotypes (through SPD) of bambara groundnut studied by Molosiwa et al. [36] indicates that these cleistogamous landraces are likely to be composed of a series of inbred lines.
In the present study, PCA showed a total of 99.81% of the variation across the twelve genotypes based on days to flowering, number of leaves per plant, petiole length, internode length, petiole internode ratio, plant height, 100-seed weight, harvest index and shelling percentage, and the distribution was suggested to be related to geographic origins (Figure 1). PC1 was associated with high loadings in genotypes collected from moderate annual rainfall areas (600–1000 mm annual rainfall) and semi-arid areas (200–600 mm annual rainfall) in Africa, including TAN385 and DodR from Tanzania, East Africa with 1000 mm mean annual rainfall, and AHM from Namibia and DipC from Botswana, Southern Africa with less than 600 mm mean annual rainfall [28,29]. PC2 was associated with high loadings in genotypes from different origins with semi-arid areas, moderate and high (above 1000 mm annual rainfall) annual rainfall in East, West and Southern Africa. Tiga Nicuru was collected from Mali, West Africa and S19-3 was collected from Namibia, Southern Africa with less than 450 mm mean rainfall per year [29,32]. IITA-686 was collected from Tanzania, East Africa with 1000 mm mean annual rainfall [28,29]. Getso collected from northern Nigeria, West Africa with more than 2000 mm mean annual rainfall [29,31]. Uniswa Red was collected from the Kingdom of Eswatini, Southern Africa with 1390 mm mean annual rainfall [32]. Furthermore, the high genotypic variability between landraces of bambara groundnut allows breeders to select parents for controlled crossing to develop and release new improved varieties with desirable traits. S19-3, TAN385, ZAM696, AHM753 and BOTS1 were recommended as the best performing genotypes with good yield component traits in Botswana [36,38]. Tiga Nicuru and S19-3 are likely to avoid terminal drought stress by early maturity or reduced respiration and stomata closure at a comparatively lower water threshold coupled with fast phenological development [14,32,33,34,39,40] and longer tap roots, as well as greater root length distribution in deeper (60–90cm) soil depths [31]. The variation of genotypes provides opportunities to develop ideotypes with drought tolerant, high yield, short life cycle or other favourable traits in breeding programmes of bambara groundnut.
In the present study, the negative correlation between the plant architectural traits, i.e., number of leaves per plant (NL), petiole length (PL), internode length (IL), petiole internode ratio (P/I), plant height (PH) and yield-related traits, i.e., 100-seed weight (100SW), harvest index (HI) and shelling percentage (SP), would suggest that fewer leaves, reduced PL and IL and shorter plants could lead to high 100SW and HI. Similar findings have been reported in pea (Pisum sativum L.) that the increased generative shoots and fruiting nodes had a negative impact on the harvest index [41]. Furthermore, plant height was negatively correlated with a key yield component, number of tillers in a bushy rice mutant [42]. Flowering time, typically after the vegetative stage, is a decisive trait for yield improvement in crop plants under different environmental conditions [43]. Mabhaudhi et al. [44] reported that early flowering to escape drought stress can lead to early maturity but has a yield penalty (reduced seed yield) in bambara groundnut. However, no significant correlation between flowering time and other phenotypic traits was observed in the twelve genotypes and two F2 segregating populations in the present study. From the present study and previous report [45], the semi-bunch growth type was the most common growth habit type (58.3%), followed by bunch (33.3%) and spreading (8%) (Table 2). The significantly negative correlation between internode length and petiole internode ratio in the present study, suggests internode length is the most critical trait to determine the plant growth habit type in bambara groundnut, similar to Basu et al. [23].
The two sets of parental genotypes in the present study had contrasting traits and were selected for controlled crossing to develop two segregating populations for the selection of breeding lines for variety development and to act as mapping populations for genetic studies. Results showed high variability and transgressive segregation in the F2 bi-parental segregating lines [40]. Transgressive segregation identified for trait values including days to flowering, number of leaves per plant, petiole length, internode length, plant height, petiole internode ratio, 100-seed weight, harvest index, and shelling percentage in the two F2 bi-parental segregating populations, provides an opportunity for selection of superior individuals for breeding purposes. The significant and negative correlation between harvest index, plant height and internode length in the F2 segregating population, S19-3 × DodR (Table S2), which was also confirmed by regression analysis (Figure 4B,C), suggested the possibility of developing individual lines with high yield through selection of target genotypes with short internode or height for breeding improvement. For example, Some individual lines, i.e., Line-6, 38, 44, 48, 50 in the F2 bi-parental segregating population, IITA-686 × Tiga Nicuru and Line-51, 73, 86, 108, 111 in the F2 bi-parental segregating population, S19-3 × DodR, combined with desirable traits, such as earlier flowering, higher harvest index, 100-seed weight, shorter plant height and internode length than average of the population are recommended for further field investigation to develop improved varieties (Tables S3 and S4). However, it is worth taking note that final yield is rather complex due to the possible interaction between genetic and environmental factors, which could contribute to the high variability observed between genotypes and within segregating lines [38,40,46]. As offspring segregate for agronomically important traits, breeders can select target lines that are adapted to the target environments based on their breeding and selection plan. In addition to selection of lines, the development of structured populations and breeding lines provides resources for genetic analysis and trait dissection, i.e., genetic mapping and identification of regions of the genome correlated with phenotypic traits.

5. Conclusions

The present study provides initial results from the two F2 structured populations and clears a path to develop the first ever advanced structured populations and improved varieties of bambara groundnut. The variation within twelve genotypes of bambara groundnut provides a breeding resource pool for use in controlled crossing to develop ideotype varieties with desirable phenotypic traits, i.e., high harvest index, 100-seed weight, early days to flowering or short life cycle. Two F2 bi-parental segregating populations of bambara groundnut derived from different geographical origins, IITA-686 (high harvest index, collected from a moderate annual rainfall area, Tanzania, East Africa) × Tiga Nicuru (early days to flowering, collected from semi-arid area, Mali, West Africa) and S19-3 (high harvest index, collected from semi-arid area, Namibia, Southern Africa,) × DodR (high 100-seed weight, collected from moderate annual rainfall area, Tanzania, East Africa), were developed to obtain structured populations and breeding lines for genetic analysis and trait dissection. The negative correlation between the plant architectural traits, i.e., number of leaves per plant, petiole length, internode length, petiole internode ratio and plant height and yield-related traits, i.e., 100-seed weight, harvest index and shelling percentage, would suggest a competition for assimilates between vegetative development and yield accumulation. Therefore, a balanced development of vegetative growth and yield accumulation is a critical strategy to obtain improved varieties for breeding programme. Individual lines in the segregating populations with higher harvest index or 100-seed weight, earlier flowering and shorter plant height and internode length could be selected as potential high yield genotypes for improved variety development. Further studies would focus on advanced generations to investigate the correlation between plant architectural traits, yield-related traits and final yield and to identify potential genomic regions involved in the regulation of key agronomic traits in bambara groundnut.

Supplementary Materials

The following are available online at https://www.mdpi.com/2073-4395/10/10/1451/s1, Table S1: Correlation coefficient analysis of phenotypic traits in the F2 bi-parental segregating population derived from IITA-686 × Tiga Nicuru. Table S2: Correlation coefficient analysis of phenotypic traits in the F2 bi-parental segregating population derived from S19-3 × DodR. Table S3: Potential lines (cross IITA-686 × Tiga Nicuru) with superior performance than population mean for advancement based on days to flowering, harvest index and 100-seed weight, plant height and internode length. Table S4: Potential lines (cross S19-3 × DodR) with superior performance than population mean for advancement based on days to flowering, harvest index and 100-seed weight, plant height and internode length.

Author Contributions

Conceptualization, X.G. and F.M.; methodology, X.G., H.H.C. and F.M.; formal analysis, X.G.; investigation, X.G., A.S.A.B., A.C.K., and M.M.; writing—original draft preparation, X.G.; writing—review and editing, X.G., A.S.A.B., K.I.M., H.H.C., W.K.H., S.M. and F.M.; supervision, F.M. and H.H.C.; funding acquisition, F.M. and S.M. All authors have read and agreed to the published version of the manuscript.

Funding

This work has been supported and funded by The University of Nottingham Malaysia and the Crops for the Future—Nottingham Malaysia Campus Doctoral Training Partnership (CFF-UNMC DTP) programme.

Conflicts of Interest

The authors declare no conflict of interest.

References

  1. Azam-Ali, S.N.; Sesay, A.; Karikari, S.K.; Massawe, F.J.; Aguilar-Manjarrez, J.; Bannayan, M.; Hampson, K.J. Assessing the potential of an underutilized crop–A case study using bambara groundnut. Exp. Agric. 2001, 37, 433–472. [Google Scholar] [CrossRef]
  2. Massawe, F.; Mayes, S.; Cheng, A. Crop diversity: An unexploited treasure trove for food security. Trends Plant Sci. 2016, 21, 365–368. [Google Scholar] [CrossRef] [PubMed]
  3. Atoyebi, J.O.; Oyatomi, O.; Osilesi, O.; Adebawo, O.; Abberton, M. Morphological characterisation of selected african accessions of bambara groundnut (Vigna subterranea (L.) Verdc.). Int. J. Plant Res. 2017, 7, 29–35. [Google Scholar] [CrossRef]
  4. Mabhaudhi, T.; Chibarabada, T.P.; Chimonyo, V.G.P.; Modi, A.T. Modelling climate change impact: A Case of bambara groundnut (Vigna subterranea). Phys. Chem. Earth 2018, 105, 25–31. [Google Scholar] [CrossRef]
  5. Blay, E.T.; Offei, S.K.; Danquah, E.Y. Genetic diversity in cocoyam as revealed by random amplified polymorphic DNA (RAPD) markers. In Proceedings of the Final Research Coordination Meeting on Genetic Improvement Of Under-utilized And Neglected Crops In low Income Food Defict Countires Through Irradiation And Related Techiques, Pretoria, South Africa, 19–23 May 2003; pp. 131–142. [Google Scholar]
  6. Padulosi, S.; Hoeschle-Zeledon, I. Underutilized Plant Species: What Are They? Leisa Mag. 2004, 20, 5–6. [Google Scholar]
  7. Jaenicke, H.; Höschle-Zeledon, I. (Eds.) Strategic Framework for Underutilized Plant Species Research and Development, with Special Reference to Asia and the Pacific, and to Sub-Saharan Africa; International Centre for Underutilised Crops, Colombo, Sri Lanka and Global Facilitation Unit for Underutilized Species: Rome, Italy, 2006; p. 33. [Google Scholar]
  8. Mayes, S.; Massawe, F.J.; Alderson, P.G.; Roberts, J.A.; Azam-Ali, S.N.; Hermann, M. The potential for underutilized crops to improve security of food production. J. Exp. Bot. 2012, 63, 1075–1079. [Google Scholar] [CrossRef] [Green Version]
  9. Mayes, S.; Ho, W.K.; Chai, H.H.; Gao, X.; Kundy, A.C.; Mateva, K.I.; Zahrulakmal, M.; Hahiree, M.K.I.M.; Kendabie, P.; Licea, L.C.S.; et al. Bambara groundnut: An exemplar underutilised legume for resilience under climate change. Planta 2019, 250, 803–820. [Google Scholar] [CrossRef] [Green Version]
  10. Williams, J.T.; Haq, N. Global Research on Underutilised Crops: An Assessment of Current Activities and Proposals for Enhanced Cooperation; International Centre for Underutilised Crops: Southampton, UK, 2000; Volume 50. [Google Scholar]
  11. Tanzi, A.S.; Ho, W.K.; Massawe, F.; Mayes, S. Development and interaction between plant architecture and yield-related traits in winged bean (Psophocarpus Tetragonolobus (L.) DC.). Euphytica 2019, 215, 1–14. [Google Scholar] [CrossRef]
  12. Sarkar, A.; Sensarma, S.R.; VanLoon, G.W. Sustainable Solutions for Food Security: Combating Climate Change by Adaptation; Springer: Cham, Switzerland, 2019. [Google Scholar] [CrossRef]
  13. Aremu, M.O.; Olaofe, O.; Akintayo, E.T. Chemical composition and physicochemical characteristics of two varieties of bambara groundnut (Vigna Subterrenea) flours. J. Appl. Sci. 2006, 6, 1900–1903. [Google Scholar] [CrossRef] [Green Version]
  14. Massawe, F.; Mwale, S.S.; Azam-Ali, S.; Roberts, J. Breeding in Bambara Groundnut (Vigna subterranea (L.) Verdc.): Strategic Considerations. Afr. J. Biotechnol. 2005, 4, 463–471. [Google Scholar]
  15. Oyeyinka, S.A.; Singh, S.; Adebola, P.O.; Gerrano, A.S.; Amonsou, E.O. Physicochemical Properties of starches with variable amylose contents extracted from bambara groundnut genotypes. Carbohydr. Polym. 2015, 133, 171–178. [Google Scholar] [CrossRef] [PubMed]
  16. Massawe, F.; Schenkel, W.; Basu, S.; Temba, E.M. Artificial hybridisation in bambara groundnut (Vigna subterranea (L.) Verdc.). In Proceedings of the International Bambara Groundnut Symposium, Gaborone, Botswana, 5–12 September 2003; Botswana Colleage of Agriculture: Francistown, Botswana, 2003; pp. 1193–1209. [Google Scholar]
  17. Basu, S.; Mayes, S.; Davey, M.; Roberts, J.A.; Azam-Ali, S.N.; Mithen, R.; Pasquet, R.S. Inheritance of “domestication” traits in bambara groundnut (Vigna subterranea (L.) Verdc.). Euphytica 2007, 157, 59–68. [Google Scholar] [CrossRef]
  18. Berchie, J.N.; Sarkodie-Addo, J.; Adu-Dapaah, H.; Agyemang, A.; Addy, S.; Asare, E.; Donkor, J. Yield evaluation of three early maturing bambara groundnut (Vigna subterranea L. Verdc) Landraces at the CSIR-Crops research institute, Fumesua-Kumasi, Ghana. J. Agron. 2010, 9, 175–179. [Google Scholar] [CrossRef]
  19. Victoria, L.; Benson, O.; Beatrice, A.; Regina, N.; Koech, P.K.; Skilton, R.A.; Francesca, S. Morphological, genetic and symbiotic characterization of Root Nodule Bacteria Isolated from Bambara Groundnuts (Vigna subterranea L. Verdc) from soils of Lake Victoria Basin, Western Kenya. J. Appl. Biol. Biotechnol. 2015. [Google Scholar] [CrossRef] [Green Version]
  20. Suwanprasert, J.; Toojinda, T.; Srinives, P.; Chanprame, S. Hybridization Technique for Bambara Groundnut. Breed. Sci. 2006, 56, 125–129. [Google Scholar] [CrossRef] [Green Version]
  21. Okpuzor, J.; Ogbunugafor, H.A.; Okafor, U.; Sofidiya, M.O. Identification of Protein Types in Bambara Nut Seeds: Perspectives for Dietary Protein Supply in Developing Countries. EXCLI J. 2010, 9, 17–28. [Google Scholar] [CrossRef]
  22. Azman Halimi, R.; Barkla, B.J.; Mayes, S.; King, G.J. The potential of the underutilized pulse bambara groundnut (Vigna subterranea (L.) Verdc.) for nutritional food security. J. Food Compos. Anal. 2019, 77, 47–59. [Google Scholar] [CrossRef]
  23. Basu, S.; Roberts, J.A.; Azam-Ali, S.N.; Mayes, S. Development of microsatellite markers for bambara groundnut (Vigna subterranea L. Verdc.)—An underutilized african legume crop species. Mol. Ecol. Notes 2007, 7, 1326–1328. [Google Scholar] [CrossRef]
  24. Olukolu, B.A.; Mayes, S.; Stadler, F.; Ng, N.Q.; Fawole, I.; Dominique, D.; Azam-Ali, S.N.; Abbott, A.G.; Kole, C. Genetic Diversity in bambara groundnut (Vigna subterranea (L.) Verdc.) as Revealed by phenotypic descriptors and DArT marker analysis. Genet. Resour. Crop EVol 2012, 59, 347–358. [Google Scholar] [CrossRef]
  25. Aliyu, S.; Massawe, F.; Mayes, S. Beyond Landraces: Developing improved germplasm resources for underutilized species—A case for bambara groundnut. Biotechnol. Genet. Eng. Rev. 2015, 30, 127–141. [Google Scholar] [CrossRef]
  26. Mayes, S.; Ho, W.K.; Kendabie, P.; Chai, H.H.; Aliyu, S.; Feldman, A.; Halimi, R.A.; Massawe, F.; Azam-Ali, S. Applying molecular genetics to underutilised species—Problems and opportunities. Malays. Appl. Biol. 2015, 44, 1–9. [Google Scholar]
  27. Kendabie, P.; Jorgensen, S.T.; Massawe, F.; Fernandez, J.; Azam-Ali, S.; Mayes, S. Photoperiod control of yield and sink capacity in Bambara groundnut (Vigna subterranea) genotypes. Food Energy Secur. 2020, e240. [Google Scholar] [CrossRef]
  28. Camberlin, P.; Martiny, N.; Philippon, N.; Richard, Y. Determinants of the interannual relationships between remote sensed photosynthetic activity and rainfall in tropical africa. Remote Sens. Environ. 2007, 106, 199–216. [Google Scholar] [CrossRef] [Green Version]
  29. Siebert, A. Hydroclimate extremes in africa: Variability, observations and modeled projections. Geogr. Compass 2014, 8, 351–367. [Google Scholar] [CrossRef]
  30. Redjeki, E.S.; Mayes, S.; Azam-Ali, S. Evaluating the stability and adaptability of bambara groundnut (Vigna subterranea (L.) Verd.) landraces in different agro-ecologies. Acta Hortic. 2013, 979, 389–400. [Google Scholar] [CrossRef]
  31. Mateva, K.I.; Chai, H.H.; Mayes, S.; Massawe, F. Root foraging capacity in bambara groundnut (Vigna subterranea (L.) Verdc.) core parental lines depends on the root system architecture during the pre-flowering stage. Plants 2020, 9, 645. [Google Scholar] [CrossRef] [PubMed]
  32. Jørgensen, S.T.; Liu, F.; Ouédraogo, M.; Ntundu, W.H.; Sarrazin, J.; Christiansen, J.L. Drought responses of two bambara groundnut (Vigna subterranea L. Verdc.) landraces collected from a dry and a humid area of africa. J. Agron. Crop Sci. 2010, 196, 412–422. [Google Scholar] [CrossRef]
  33. Mwale, S.S.; Azam-Ali, S.N.; Massawe, F.J. Growth and development of bambara groundnut (Vigna subterranea) in response to soil moisture. 2. resource capture and conversion. Eur. J. Agron. 2007, 26, 354–362. [Google Scholar] [CrossRef]
  34. Mwale, S.S.; Azam-Ali, S.N.; Massawe, F.J. Growth and development of bambara groundnut (Vigna subterranea) in response to soil moisture: 1. dry matter and yield. Eur. J. Agron. 2007, 26, 345–353. [Google Scholar] [CrossRef]
  35. IPGRI/IITA/BAMNET. Descriptors for Vigna subterranea bambara groundnut (Vigna subterranea). In International Plant Genetic Resources Institute, Rome; International Institute of Tropical Agriculture, Ibadan; The International Bambara Groundnut Network: Hamburg, Germany, 2000. [Google Scholar]
  36. Molosiwa, O.O.; Aliyu, S.; Stadler, F.; Mayes, K.; Massawe, F.; Kilian, A.; Mayes, S. SSR marker development, genetic diversity and population structure analysis of bambara groundnut [Vigna subterranea (L.) Verdc.] landraces. Genet. Resour. Crop EVol 2015, 62, 1225–1243. [Google Scholar] [CrossRef]
  37. Aliyu, S.; Massawe, F.; Mayes, S. Genetic diversity and population structure of bambara groundnut (Vigna subterranea (L.) Verdc.): Synopsis of the past two decades of analysis and implications for crop improvement programmes. Genet. Resour. Crop EVol 2016, 63, 925–943. [Google Scholar] [CrossRef] [Green Version]
  38. Karikari, S.K.; Tabona, T.T. Constitutive traits and selective indices of bambara groundnut (Vigna subterranea (L) Verdc) landraces for drought tolerance under botswana conditions. Phys. Chem. Earth 2004, 29, 1029–1034. [Google Scholar] [CrossRef]
  39. Pedercini, M.; Kanamaru, H.; Derwisch, S. Potential Impacts of Climate Change on Food Security in Mali Potential Impacts of Climate Change on Food Security in Mali; Natural Resources Management and Environment Department, Food and Agriculture Organization of the United Nations (FAO): Rome, Italy, 2012. [Google Scholar]
  40. Chai, H.H.; Massawe, F.; Mayes, S. Effects of mild drought stress on the morpho-physiological characteristics of a bambara groundnut segregating population. Euphytica 2016, 208, 225–236. [Google Scholar] [CrossRef]
  41. Klimek-Kopyra, A.; Zajac, T.; Oleksy, A.; Kulig, B.; Slizowska, A. The value of different vegetative indices (NDVI, GAI) for the assessment of yield potential of pea (Pisum Sativum L.) at different growth stages and under varying management practices. Acta Agrobot. 2018, 71. [Google Scholar] [CrossRef]
  42. Xing, Y.; Zhang, Q. Genetic and molecular bases of rice yield. Annu. Rev. Plant Biol. 2010, 61, 421–442. [Google Scholar] [CrossRef] [PubMed]
  43. Mathan, J.; Bhattacharya, J.; Ranjan, A. Enhancing crop yield by optimizing plant developmental features. Development 2016, 143, 3283–3294. [Google Scholar] [CrossRef] [Green Version]
  44. Mabhaudhi, T.; Modi, A.T. Growth, phenological and yield responses of a bambara groundnut (Vigna subterranea (L.) Verdc.) landrace to imposed water stress under field conditions. S. Afr. J. Plant Soil 2013, 30, 69–79. [Google Scholar] [CrossRef]
  45. Ntundu, W.H.; Shillah, S.A.; Marandu, W.Y.F.; Christiansen, J.L. Morphological diversity of bambara groundnut [Vigna subterranea (L.) Verdc.] landraces in Tanzania. Genet. Resour. Crop EVol 2006, 53, 367–378. [Google Scholar] [CrossRef]
  46. Mickelbart, M.V.; Hasegawa, P.M.; Bailey-Serres, J. Genetic mechanisms of abiotic stress tolerance that translate to crop yield stability. Nat. Rev. Genet. 2015, 16, 237–251. [Google Scholar] [CrossRef]
Figure 1. Principal component analysis (PCA) graph and loading scores for each component (PC1 and PC2) from latent vectors (loading), performed with Genstat Statistical package (18th edition, VSN International, Hemel Hempstead, UK) using phenotypic traits data of twelve genotypes. Data was coloured based on geographical collection origins.
Agronomy 10 01451 g001
Figure 2. The frequency distribution of phenotypic traits in the F2 bi-parental segregating population, IITA-686 × Tiga Nicuru and their parental lines. IT (F2), F2 individual lines derived from IITA-686 × Tiga Nicuru.
Agronomy 10 01451 g002
Figure 3. The frequency distribution of phenotypic traits in the F2 bi-parental segregating population, S19-3 × DodR and their parental lines. SD (F2), F2 individual lines derived from S19-3 × DodR.
Agronomy 10 01451 g003
Figure 4. Regression for (A), harvest index and 100-seed weight (g) in the F2 bi-parental segregating population derived from IITA-686 × Tiga Nirucru; (B), harvest index and internode length (cm) and (C), harvest index and plant height (cm) and in the F2 bi-parental segregating population derived from S19-3 × DodR.
Agronomy 10 01451 g004aAgronomy 10 01451 g004b
Table 1. Geographic origins and distinctive characteristics of twelve bambara groundnut genotypes.
Geographical OriginLandracesCollected CountryAnnual Rainfall (mm)Distinctive Characteristics
East AfricaDodRTanzania1000 [28,29]Quantitative for short days, high 100-seed weight and yield [27,30]
IITA-686Tanzania1000 [28,29]Quantitative for long days, shallow and highly branched root growth habit [27,31]
TAN385Tanzania1000 [28,29]-
West AfricaLunTSierra Leone˃2000 [31]Quantitative for short days, shallow and highly branched root growth habit [27,31]
Tiga NicuruMali450 [28,32]Quantitative for short days, bunchy growth habit, early maturity [27,33,34]
Ankpa4Nigeria>2000 [29,31]Qualitative for short days [27]
GetsoNigeria>2000 [29,31]Quantitative for short days [27]
Southern AfricaS19-3Namibia365 [29,32]Quantitative for long days, early maturity, drought tolerant long taproots and great root length distribution [27,31,32,34]
Uniswa redKingdom of Eswatini1390 [32]Quantitative for long days, long growth cycle [27,34]
DipCBotswana500 [31]Quantitative for long days, long taproots and great root length distribution [27,31]
AHMNamibia365 [29,32]-
Southeast AsiaGresikIndonesia˃2000 [31]Quantitative for short days, shallow and highly branched root growth habit [27,31]
Table 2. Characterization of phenotypic traits in twelve genotypes of bambara groundnut.
TraitsDTFNLPHPLILP/IHI100SWSP
(days) (cm)(cm)(cm)(ratio) (g)(%)
AHM35.50 cd532.80 a35.20 a26.13 ab3.76 ab7.08 d0.09 cd21.45 efg77.70 a
Ankpa442.40 b198.20 b33.79 ab23.49 abc2.86 c8.23 cd0.04 d20.09 fg39.58 d
DipC38.57 bc250.40 b34.50 a27.04 a2.49 cde10.89 ab0.14 cd29.03 cdef75.10 a
DodR32.10 de266.50 b34.35 a21.60 c4.04 a5.55 e0.28 abc45.49 cdef78.01 a
Getso30.80 e82.10 c31.05 abc15.23 de1.83 ef8.49 cd0.16 bcd52.07 a62.74 bc
Gresik51.19 a159.60 b31.30 abc15.23 de2.11 de7.20 d0.26 abc33.32 cd74.54 a
IITA-68632.50 de66.00 c28.15 bcd14.79 de2.09 de7.15 d0.38 ab24.68 def75.73 a
LunT33.00 de184.00 b34.44 a25.36 abc2.60 cd9.65 bc0.26 abc37.26 bc71.53 ab
S19-333.40 de84.80 c27.33 cd17.44 d2.46 cde7.30 d0.47 a27.47 cdef77.87 a
TAN38533.50 de768.10 a34.50 a23.07 bc3.15 bc7.42 d0.03 d13.04g61.74 c
Tiga Nicuru27.13 f81.10 c22.71 d12.52 e0.96 g13.36 a0.21 bcd24.58 def74.08 a
Uniswa Red33.44 de80.30 c28.33 bcd14.64 de1.13 fg13.24 a0.18 bcd31.05 cde73.21 a
Mean35.30229.4231.3119.712.468.800.2129.9570.15
F pr<0.001<0.001<0.001<0.001<0.001<0.001<0.001<0.001<0.001
Note: DTF days to flowering, NL number of leaves per plant, PH plant height, PL petiole length, IL internode length, P/I petiole internode ratio, HI harvest index, 100SW 100-seed weight, SP shelling percentage. Different letters indicate significant difference at p < 0.05 level (Tukey’s multiple comparison test), mean values (n = 10), F pr = F-probability (p < 0.01).
Table 3. The correlation coefficient analysis of phenotypic traits in twelve genotypes of bambara groundnut.
TraitsDTFNLPHPLILP/IHI100SWSP
DTF---------
NL0.05--------
PH0.370.62 *-------
PL0.170.61 *0.86 **------
IL0.150.64 *0.79 **0.74 **-----
P/I−0.28−0.35−0.50−0.27−0.77 **----
HI−0.15−0.60 *−0.49−0.45−0.18−0.18---
100SW−0.13−0.500.04−0.21−0.07−0.070.31--
SP−0.23−0.12−0.25−0.18−0.040.030.59 *0.22-
Note: DTF, days to flowering; NL, number of leaves per plant; PH, plant height; PL, petiole length; IL, internode length; P/I, petiole internode ratio; HI, harvest index; 100SW, 100-seed weight; SP, shelling percentage * = Significant at (p = 0.05), ** = Significant at (p = 0.01). Highlighted values represent highly significant correlation between phenotypic traits.
Table 4. Summary phenotypic traits of the F2 bi-parental segregating population derived from IITA-686 × Tiga Nicuru and their parental genotypes.
IITA-686Tiga Nicuru
TraitsMeanMinMaxSDVarianceNormalityMinMaxMinMax
DTF34.9831.0061.003.5412.51<0.00129.0034.0027.0028.00
NL87.2417.00297.0042.561811.00<0.00128.00114.0043.00116.00
PH (cm)26.1816.0044.004.6922.010.0318.0034.5019.5027.00
PL (cm)19.7211.8330.673.5012.230.1310.1019.7510.6015.57
IL (cm)2.030.854.900.690.48<0.0011.532.750.731.13
P/I11.225.2122.903.2410.480.095.528.859.7116.91
HI0.240.010.460.110.010.450.060.760.060.36
100SW (g)21.854.6945.567.7059.310.5715.6729.5019.9035.21
Note: DTF, days to flowering; NL, number of leaves per plant; PH, plant height; PL, petiole length; IL, internode length; P/I, petiole internode ratio; HI, harvest index; 100SW, 100-seed weight. SD, standard deviation.
Table 5. Summary phenotypic traits of the F2 bi-parental segregating population derived from S19-3 × DodR and their parental genotypes.
S19-3DodR
TraitsMeanMinMaxSDVarianceNormalityMinMaxMinMax
DTF36.4131.0042.002.817.90<0.00129.0036.0029.0036.00
NL77.6715.00325.0050.612561.00<0.0016.00133.0095.00396.00
PH (cm)28.3413.3046.505.6632.020.0218.3033.0027.0044.00
PL (cm)16.2010.8323.332.546.430.447.1724.5018.1024.50
IL (cm)2.480.734.500.770.590.551.173.553.005.00
P/I7.093.8916.362.154.64<0.0015.639.373.817.50
HI0.400.160.560.100.010.330.320.850.160.40
100SW (g)28.7210.7941.756.4040.910.0516.7039.5837.8852.70
Note: DTF, days to flowering; NL, number of leaves per plant; PH, plant height; PL, petiole length; IL, internode length; P/I, petiole internode ratio; HI, harvest index; 100SW, 100-seed weight. SD, standard deviation.

