Article

Broomrape as a Major Constraint for Grass Pea (Lathyrus sativus) Production in Mediterranean Rain-Fed Environments

1
Institute for Sustainable Agriculture, CSIC, Avda. Menéndez Pidal s/n, 14004 Córdoba, Spain
2
Departamento de Ciencias Agroforestales. E.T.S.I. Campus El Carmen, Universidad de Huelva, Avda. Fuerzas Armadas s/n, 21007 Huelva, Spain
*
Author to whom correspondence should be addressed.
Agronomy 2020, 10(12), 1931; https://doi.org/10.3390/agronomy10121931
Submission received: 3 November 2020 / Revised: 1 December 2020 / Accepted: 3 December 2020 / Published: 8 December 2020
(This article belongs to the Special Issue Genotype× Environment Interactions in Crop Breeding)

Abstract

:
Grass pea (Lathyrus sativus) is an annual legume crop that is currently underutilized but has the potential for reintroduction into Mediterranean rain-fed farming systems. In this study, we compared the adaptation of breeding lines in multi-environment field testing, which had wide variation for precocity, grain yield and broomrape infection. Heritability-adjusted genotype plus genotype-by-environment interaction (HA-GGE) biplot and non-metric multidimensional scaling (NMDS) were performed to determine the effect on genotype (G), environment (E) and G × E interaction on grain yield, precocity and broomrape infection. Precocity was associated with reduced broomrape infection, and this with increased grain yield. Step-wise regression analysis revealed that the broomrape infection had the highest influence on grain yield, whereas precocity had a lower effect. Rain and humidity and mild temperatures before and during flowering were the climatic factors most influential on broomrape. Accessions with a shorter growth cycle suffered lower broomrape infection and were more productive in the environments with a high broomrape incidence. Accessions with longer growth cycle suffered overall higher broomrape infection and were therefore more productive in the environments with low or moderate broomrape incidence.

1. Introduction

Grass pea (Lathyrus sativus L.) is an annual temperate legume widely grown in South Asia and sub-Saharan Africa, but which is in regression in Mediterranean environments [1]. Common experience in Mediterranean countries is a severe decrease in grass pea cultivation during the last century, with little or negligible trade. For instance, in Spain, the acreage decreased from 250,000 ha in 1925 to 636 ha in 2018 [2,3]. A major factor for this was the ban for human consumption in some countries due to the occurrence of lathyrism, a neurodegenerative disease in humans and domestic animals [4,5]. However, the ban is being reassessed due to the current understanding that the neurotoxin β-ODAP content is highly influenced by climatic and edaphic conditions [6,7,8], and that lathyrism disease is caused only when there is an overconsumption of grass pea in a non-balanced diet, that can be prevented by the addition of sufficient cereals, fruits and vegetables [9]. Therefore, for instance, this ban has been removed recently in Spain [2]. Variation for β-ODAP content is available in grass pea which is considered to be lower in Mediterranean white seed types, although also selected into colored seeds [6,10,11].
Reducing β-ODAP would be desirable, however, there is no particular risk in the occasional intake of grass pea as part of a balanced diet [2,4]. In this study, we focused on the adaptation and grain yield, which should be improved in order to make the crop’s cultivation feasible. Due to its rusticity and potential in marginal environments, there is a renewed interest to re-introduce the grass pea into Mediterranean rain-fed cropping systems. In Mediterranean regions, the root parasitic weed crenate broomrape (Orobanche crenata Forsk.) is known as one of the major constraints for grass pea cultivation [12,13]. Therefore, efforts have been made to gather and characterize the adaptation of landraces and to submit them to breeding in order to exploit the potential of the species [4,6,12,14,15,16,17].
The present study aimed at evaluating the yield performance and stability among grass pea accessions in Mediterranean rain-fed cropping systems.

2. Materials and Methods

2.1. Plant Materials and Experimental Design

The performance of 8 grass pea breeding lines was studied at 17 location–year environments (Table 1). These lines were selected from previous field studies [12,13], gathering among the best yielders in those studies, four lines with colored flowers and seeds (Ilat3, Ilat10, Ilat11 and Ilat18) and four with white and large seeds (Tblanco, Tpinto, Titana and Lasana), which are preferred by Mediterranean consumers [11].
At each location, a randomized complete block design with three replications was used. The experimental unit consisted of 3 m-long rows per accession separated by 0.35 m, 10 plants per row. Seeding was performed manually by mid-December at each site–year. Weeds were controlled by hand weeding, with no herbicides or pesticides applied. Days to flowering (DtF) was estimated in five environments by weekly recording the date in which 50% of the plants of each plot had at least one fully opened flower. Numbers of emerged broomrape plants per row were recorded and referred to as the number of broomrapes per grass pea plant. The presence of naturally occurring pest and disease was also recorded, estimating the percentage of canopy coverage or seed damage. The plots were harvested manually at full maturity by late April, early May, depending on the environment. Seeds were then threshed and the grain yield assessed.

2.2. Statistical Analysis

A combined ANOVA for randomized complete-block designs within each year-location environment was carried out using SAS® 9.3 (SAS Institute Inc., Cary, NC, USA). F ratios, used to test effects for randomized complete block experiments combining location–year environments (Table 1), were determined according to McIntosh [18]. Prior to each ANOVA, tests for the normality and equality of variance were conducted for each dependent variable.
To determine the stability and identify superior accessions across environments, heritability-adjusted genotype plus genotype × environment interaction (HA-GGE) biplot analyses were conducted [19,20], comprising the seasons from 2008 to 2018, since it takes into consideration any heterogeneity among environments by giving weights to the test environments proportional to their root square heritability. As the environments have different heritabilities (data not shown) for the same trait, the HA-GGE biplot was most appropriate for the visual evaluation of the test environments and genotypes [19]. Analyses were made with the SAS® 9.3 (SAS Institute Inc.) program developed by Burgueño et al. [21] to graph GGE biplots.
The genotype × environment (G × E) two-way tables were first centered with the respective means for the environments, multiplied by √H and then divided by the SD of the respective environment [19]. The HA-GGE biplot shows the first two principal components (PC1 and PC2) derived from the previous two-way table of yield to the singular value decomposition [22,23].
Singular value partitioning is achieved by providing a scaling factor f to obtain alternative accessions and environment scores. We chose the most straightforward variant called symmetric scaling (f = 0.5) since it bears most of the properties associated with other scaling methods [24].
The target environment axis abscissa (TEAa) is represented by a straight line drawn through the biplot origin and the average environment, which was defined by the mean ordinates of all environments in the biplot. The main effects of genotypes (G) are represented by the projection of genotypes onto this axis. These projections provide us with the contribution of each genotype to G, so genotypes may be ranked along the TEAa, with the arrow pointing to a higher mean yield. The TEA ordinate (TEAo) shows the contribution of each genotype to the interaction G × E, thus giving information about the genotypic stability or instability (consistency or inconsistency across environments). The best genotype would be that with the highest yield (higher positive projection on TEAa) and the highest stability, i.e., projection on TEAo close to 0 [22]. Similarly, the ideal environment would be the one showing a high projection value onto the TEA abscissa (further discriminating the principal effects of genotypes) and a small absolute projection value onto TEAo (more representative of all the tested environments) [22].
To evaluate the influence of environmental factors on the broomrape infection, 21 climate variables (Supplementary Table S1) were subjected to non-metric multi-dimensional scaling ordination (NMDS) [25]. These climate variables were obtained from the Junta de Andalucía (https://www.juntadeandalucia.es/agriculturaypesca/ifapa/ria/servlet/FrontController) and included the maximum, minimum and average temperature, maximum, minimum and average humidity, accumulated radiation, evapotranspiration and accumulated rain during pre-flowering, at flowering and post-flowering period. To decrease the probability that the result of the NMDS analysis would reflect a local stress minimum rather than the overall minimum, we repeated the NMDS analysis 20 times, each time starting from a different random configuration, and selected the two-dimensional solution with the lowest stress. Analysis was made using the PAST software [26].
Stepwise linear regression was applied to describe the impact of broomrape, of flowering date, and all the climatic parameters on yield. Significance levels for introducing and deleting a variable was set at α = 0.05.

3. Results

3.1. Analysis of Variance

The combined analysis of variance revealed that all main effects (environments (E), genotypes (G) and G × E interaction) were statistically significant for the grain yield, number of broomrapes per plant and flowering date (Table 2). The environment explained 52 to 81% of the total variation (G + E + G × E sum of squares), G and G × E accounted 3 for 29% and 11 to 18%, respectively.
Grain yields of the accessions for each environment are shown in Table 3 and Figure 1. The average yield per environment over accessions was the highest at TOM09 (4675 kg ha−1) and ALM17 (4550 kg ha−1) and lowest at ESC10 (209 kg ha−1). The average grain yield over environments and accessions was 2143 kg ha−1 for L. sativus, the highest for Titana (2643 kg ha−1) and Lasana (2517 kg ha−1) and the lowest was for Tblanco (1714 kg ha−1) and Tpinto (1865 kg ha−1).

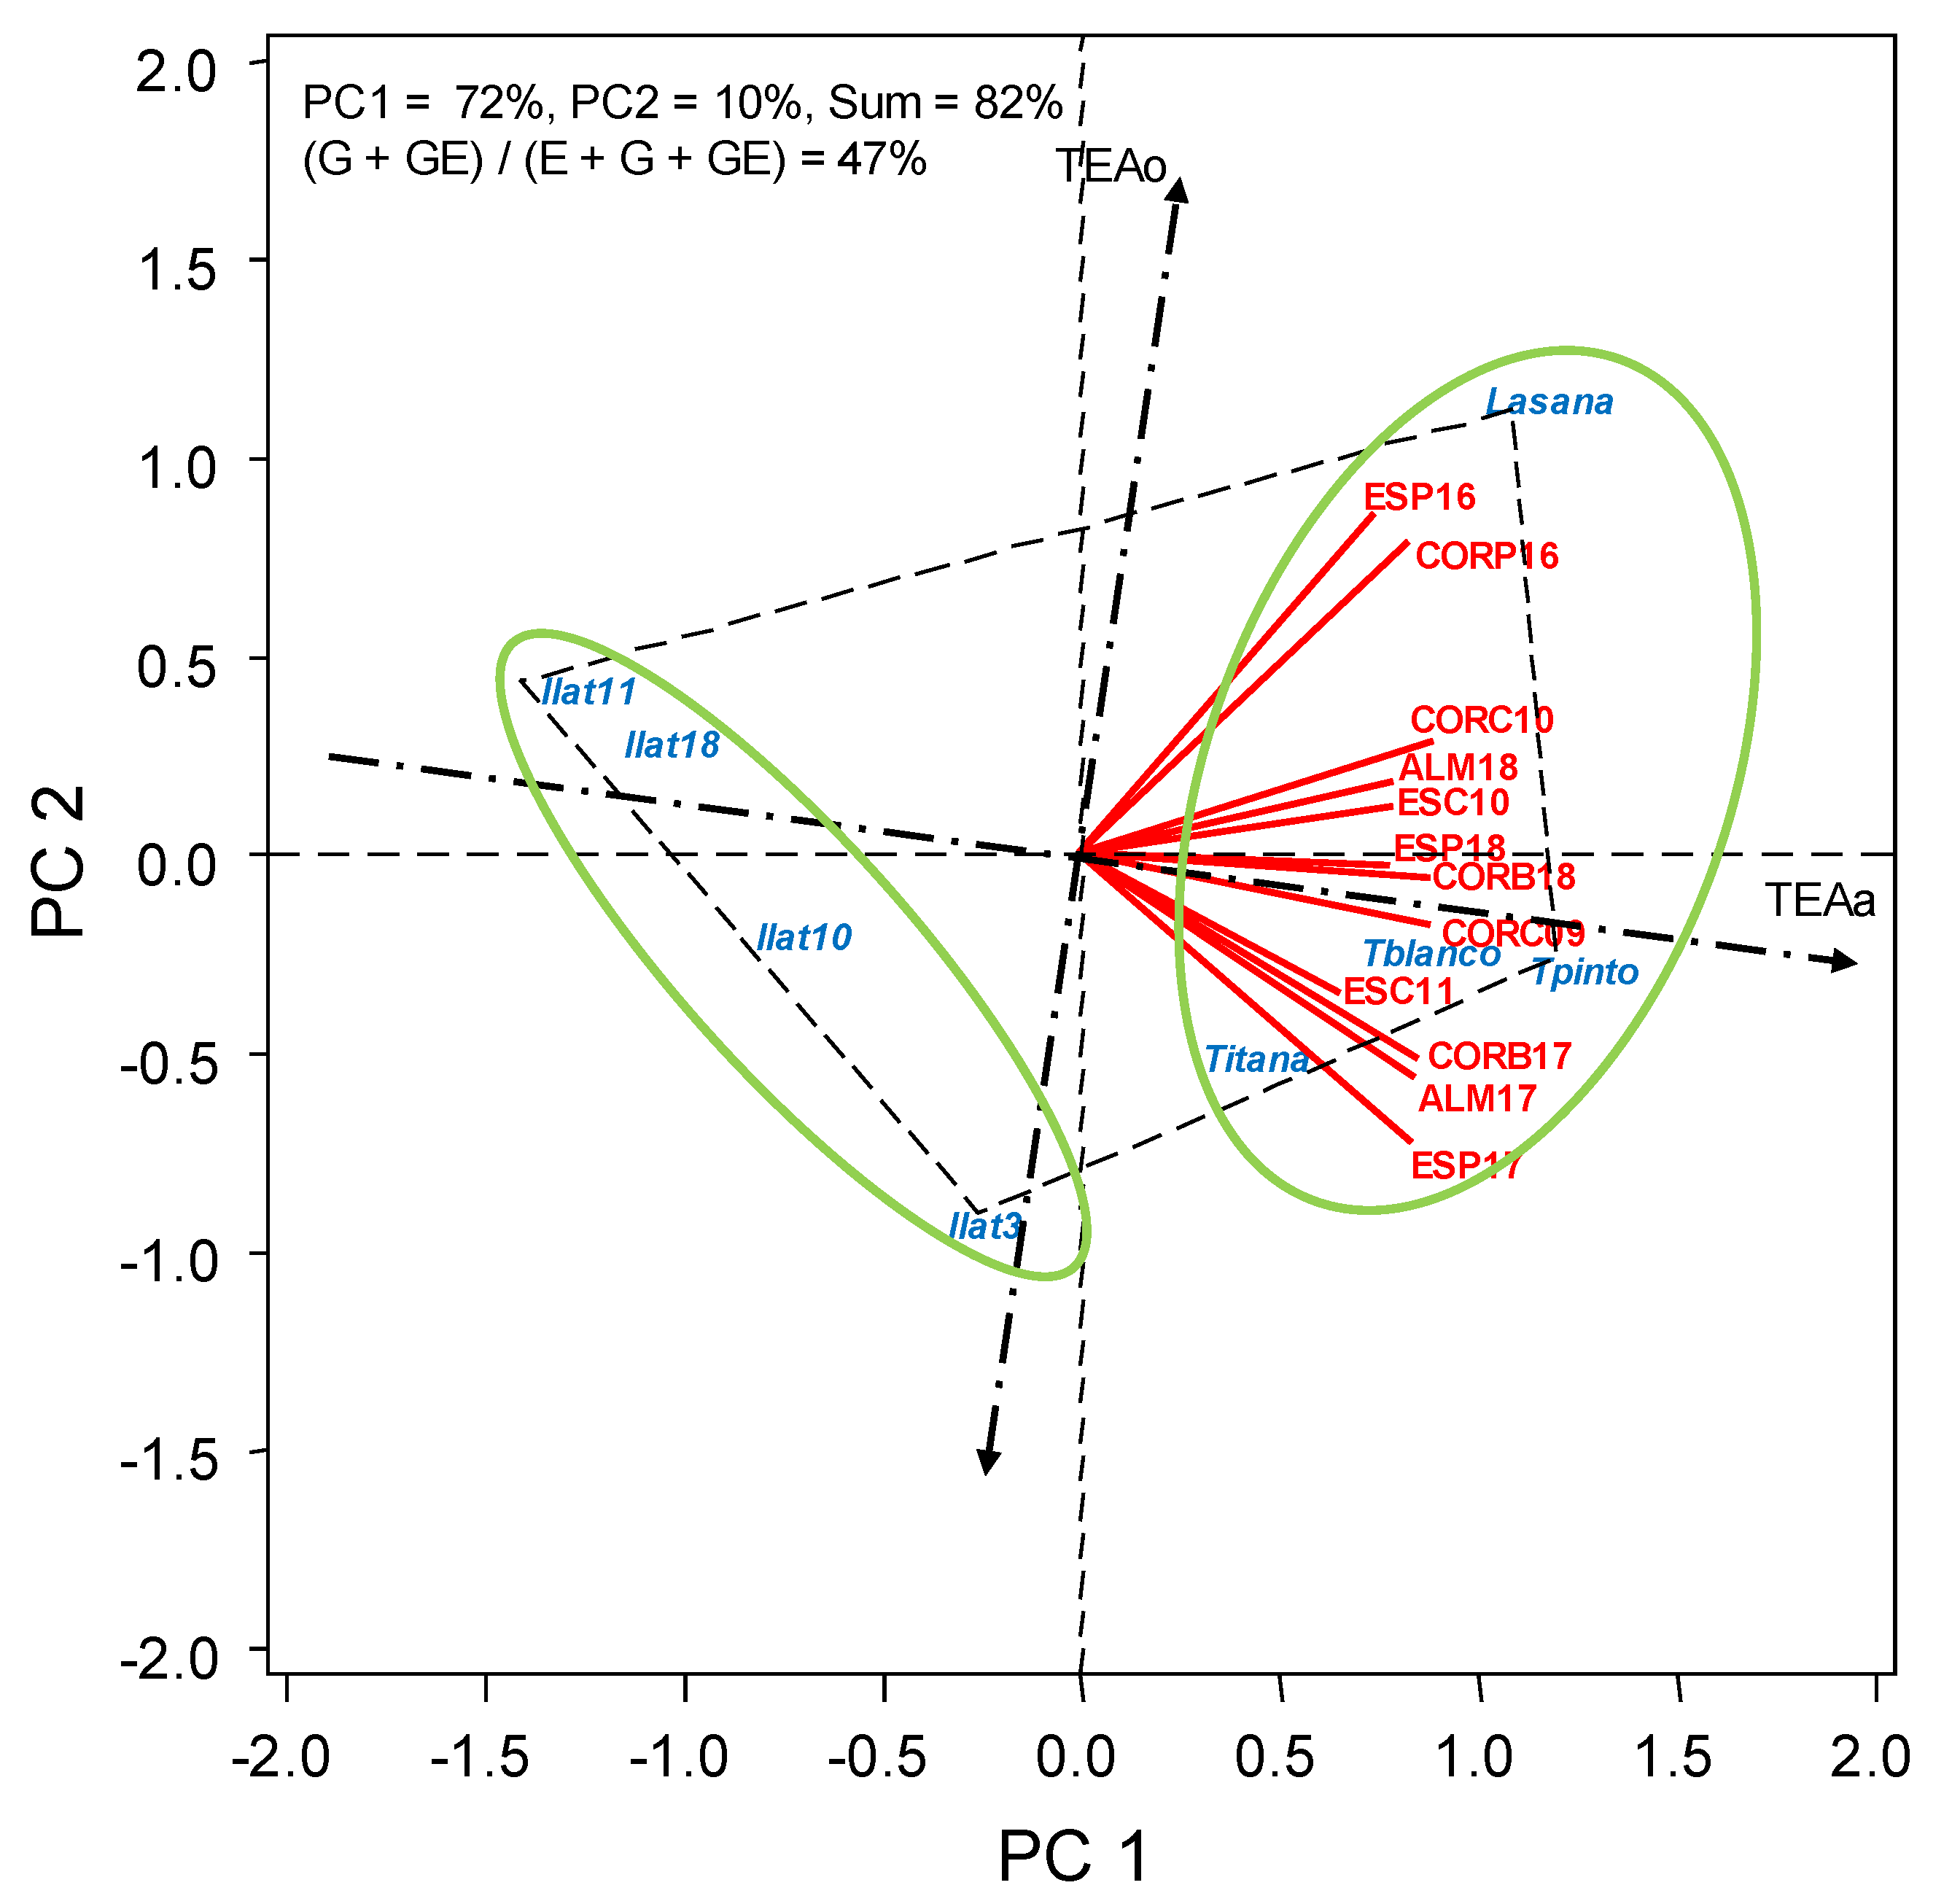
3.2. HA-GGE Analysis

The first two PCs of the HA-GGE model for yield, number of broomrapes per plant and days to flowering explained 77%, 93% and 82%, respectively, of total G + G × E. On the other hand, (G + G × E)/(E + G + G × E) yielded a values of 19%, 30% and 47%, respectively (Figure 1, Figure 2 and Figure 3). This fulfilled the requirements of Yang et al. [24], who established that for a biplot to be useful, the first two PCs should be higher than 60% and the (G + G × E)/(E + G + G × E) ratio should be higher than 10%.
The yielding ability and the stability of an accession is shown in the biplot (Figure 1) by the “TEA”. The projection of an accession over the average environment axe (TEAa) indicates its mean performance across all environments, and its projection over the TEAo indicates its stability [27]. Figure 1 shows that Titana, and Lasana were the highest yielding accessions on average (high absolute primary scores, TEAa). Tblanco and Tpinto were the lowest yielding and most stable over the environments (low absolute secondary scores, TEAo) [27].
Among biotic constraints, our study showed broomrape as the most significant one. Little incidence of any other pest or disease was observed, with the exception of some powdery mildew appearing late in the season, with disease severity lower than 20%, and bruchus weevil seed infestation lower than 20% (data not shown). These values are lower than those reported in pea in those locations (up to 100% for powdery mildew and 80% for weevil) [28]. The global average of broomrape infection over accessions and environments was 0.69 broomrapes per grass pea plant (Table 4). Average infection over environments was lower for the Ilat accessions (range of 0.35–0.47 broomrapes/plat) and highest for Titana and Tblanco (>1 broomrapes/plant).
Ilat3, Ilat10, Ilat11 and Ilat18 are more distantly located on the left to TEAo vector (lowest infection), whereas Titana and T blanco are more to the right (highest infection) (Figure 2). The response of the four Ilat accessions was rather stable among environments, as shown by their shorter projection on TEAo (the closer to the TEAa vector). On the contrary, the response of Lasana and Tblanco was less stable, with Lasana being more infected in some environments and Tblanco in others.
Environments ALM17, ALM18, ESP17, ESP18 were free from broomrape infection (Table 4) and therefore they did not appear in Figure 2. Very low levels of broomrape infection (average < 0.25 broomrapes/plant) were observed at CORB17, CORP16, ESP16, CORB18 and TOM09; moderate levels (0.44–0.55 broomrapes/plant) at ESC12 and CAMP08; and very high levels (average > 0.8 broomrapes/plant) at ESC08, ESC09, ESC10, ESC11, COR09 and CORC10, respectively (Figure 2). Titana, Lasana, Tpinto and Tblanco were more productive in the environments with low or moderate broomrape infection, whereas Ilat lines performed better in the environments with high infection (Figure 1).
The earlier accessions (Table 5) were the Ilat accessions (88 to 98 DtF), with the remaining accessions having >104 DtF. This is shown in the biplot (Figure 3) with the earlier accessions to the left of TEAo, so the DtF increase as we move to the right. The closer they are to TEAa, the more stable the trait, which was more affected by environment for Ilat3 and Lasana.
Pearson correlations of our results revealed a significant but negative correlation between the grain yield and days to flowering (r = −0.48; p < 0.0001), positive between days to flowering and broomrape infection (r = 0.62; p < 0.0001) and negative between broomrape infection and grain yield (r= −0.78; p < 0.0001), which indicated the effect of precocity reducing broomrape infection, and of broomrape infection reducing yield.

3.3. Effect of Climate Variables on Broomrape Inffection

Biplot from NMDS analysis gave a stress value of 0.022, indicative of an excellent fit [25], which allowed for a nice separation of the environments (Figure 4) with a clear gradation fitting level of broomrape infection, increasing to the right of the figure. Figure 4 shows how in the environments with high broomrape infection (those at the right of the figure: ESC10, ESC11, CORC09 and CORC10), the climatic factors favoring broomrape infection (shown by the length of their vectors to the right) were the accumulated rain and humidity and higher minimum temperatures at pre-flowering and higher radiation at flowering.

3.4. Effect of Broomrape Infection, Flowering Date and All Climate Variables on Yield

The produced regression model is based on 21 climatic parameters, with the broomrape infection and flowering date as the independent variables. The dependent feature refers to the yield of grass pea (kg ha−1). The most appropriate model obtained in the step-wise regression analysis was:
Seed Yield = 17,059 + 20.3 (DtF) − 471 (NBPP) − 32 (FLOWEto) − 193 (FLOWHMAX) + 16 (POSTEto) + 10 (POSTRAIN),
where DtF = days to 50% flowering, NBPP = number of broomrapes per plant, FLOWEto = ETo in flowering period, FLOWHMAX = maximum humidity in flowering period, POSTEto = ETo in post-flowering period and POSTRAIN = accumulates rain in the post-flowering period. The rest of climatic parameters did not have a significant effect as to be included in the model. The determination coefficient for the produced multiple regression model took the following value Adj R2 of 0.82. This result shows that the model is on a high adjustment to the empirical data on which the multiple regression model was created. For the coefficients of independent variables obtained the highest values were for NBPP with −471 and for FLOWHMAX with −193. This means that both broomrape infection and maximum humidity at flowering had the greatest impact negative on the shaping of the volume of the harvest grass pea yield.
This result is in agreement with the coefficients of correlation, so the coefficient above commented between the broomrape infection and grain yield (r = −0.78; p < 0.0001) and between maximum humidity at flowering and grain yield (r = −0.48; p < 0.0001).

4. Discussion

Great morphological variation is reported in grass pea, showing a clear grouping in two major types, one with a covering blue flower and colored seeds that is typical of the Indian subcontinent, and other types with white flowers and seeds that have a more western distribution [29]. Ilat studied accessions, originating from ICARDA-CGIAR (International Center for Agricultural Research in the Dry Areas) programs, that happened to fit into to the first group, having blue flowers and colored seeds, whereas Tblanco, Tpinto, and Titana, deriving by selection among Iberian landraces, and Lasana, deriving from a landrace of unknown origin, fitted the second group, with mostly white flowers and larger and whiter seeds. This is the seed type preferred by Mediterranean consumers [11,29]. We found that these accessions have a later phenology, which is in line with previous reports [11,12].
Grass pea breeding efforts in past decades focused on reducing the β-ODAP content. However, the long-term results of these efforts are often questioned as the β-ODAP content is highly influenced by climatic and edaphic conditions and lathyrism is caused only when there is an overconsumption of grass pea in a non-balanced diet (2,4-8), which made breeders reconsider the yield stability as a higher concern. We therefore focused on the adaptation and grain yield, which should be improved in order to make the crop feasible. We found wide variation for precocity, grain yield and broomrape infection, which have major implications in the crop performance.
In Mediterranean regions, the broomrape is acknowledged as a major constraint for grass pea cultivation [12,13]. Broomrape is also a constraint to other grain and forage legumes [30], but the grass pea seems to be particularly sensitive, suffering a higher yield penalty than other legumes [31]. Some levels of resistance have been reported in grass pea [13,32], which might be the result of a combination of different escape and resistance mechanisms [33]. We observed an association between late phenology and broomrape infection, which is in agreement with previous reports of grass pea [12,13] and other legumes [34,35,36,37]. In addition to the host, the infection severity of broomrape strongly depends on parasitic seedbank density and on environmental factors such as temperature and rain. We found that rain and mild temperatures before and during flowering were the climatic factors most influential on broomrape infection. These effects have been well documented, with cool winters and limited rain reported to reduce infection [34,38,39].
In agreement with previous reports [12], we found broomrape infection to be reduced with grass pea precocity, and this with increased grain yield. Accessions with a shorter growth cycle suffered lower broomrape infection and were more productive in the environments with high infection. Those with a longer growth cycle (Titana, Lasana, Tpinto and Tblanco) suffered overall a higher broomrape infection and were therefore more productive in the environments with low or moderate broomrape infection. However, step-wise regression revealed that is reduced broomrape infection which has the highest influence on grain yield, with precocity alone having very little effect. This might be due to a compensation of the beneficial effect of grass pea precocity facilitating the escape from broomrape and drought [13], with the detrimental effects of reducing the crop cycle and limiting the potential yield [7,16,17].
We concluded that the grass pea has potential for reintroduction into Mediterranean rain-fed farming systems. Broomrape infection appears as a serious constraint, having a major influence on grain yield. Early cultivars are recommended for areas prone to high broomrape infection. Cultivars with a longer growth cycle suffer higher broomrape infection but can be more productive in the environments with low or moderate broomrape incidence.

Supplementary Materials

The following are available online at https://www.mdpi.com/2073-4395/10/12/1931/s1, Table S1: Climate variables including: maximum temperature (Tmax), minimum temperature (Tmin), maximum humidity (Hmax), minimum humidity (Hmin), radiation (Rad), rain and evapotranspiration (ETo) during different growing stages pre-flowering (Pre), flowering (Flow) and post-flowering (Post), characterizing the 17 environments (combinations of location and season) of the trials.

Author Contributions

D.R. and E.B. designed and performed the trials; D.R. and F.F. analyzed the data and wrote the manuscript. All authors have read and agreed to the published version of the manuscript.

Funding

This research was funded by the Spanish Agencia Estatal Investigación (AEI) grant AGL2017-82019.

Acknowledgments

Authors are deeply indebted to late Ana Moral whose enthusiasm inspired these studies. ICARDA is acknowledged for providing the Ilat accessions studied that were selected at Córdoba from LITP 2007/2008 nursery (our Ilat3, Ilat10, Ilat11 and Ilat 18 derive from Sel387, Sel289, Sel288 and Sel290, respectively).

Conflicts of Interest

The authors declare no conflict of interest.

References

  1. Gonςalves, L.; Rubiales, D.; Vaz Patto, M.C. Grass pea prospective at the Mediterranean Basin. Legume Perspect. 2015, 10, 8–9. [Google Scholar]
  2. AESAN. Informe del Comité Científico de la Agencia Española de Seguridad Alimentaria y Nutrición (AESAN) Sobre el Consumo Humano Ocasional de Almortas (Lathyrus sativus). Revista Comité Científico nº 11. AESAN-2009-12. 2009. Available online: https://www.aesan.gob.es/AECOSAN/docs/documentos/seguridad_alimentaria/evaluacion_riesgos/informes_comite/ALMORTAS_CONSUMO.pdf (accessed on 2 November 2020).
  3. MAPAMA. 2019. Available online: https://www.mapa.gob.es/estadistica/pags/anuario/2019-Avance/CAPITULOSPDF/CAPITULO07/pdfc07_2.10.2.pdf (accessed on 2 November 2020).
  4. Lambein, F.; Travella, S.; Kuo, Y.; Van Montagu, M.; Heidje, M. Grass pea (Lathyrus sativus L.): Orphan crop, nutraceutical or just plain food? Planta 2019, 250, 821–838. [Google Scholar] [CrossRef] [PubMed] [Green Version]
  5. Dixit, G.P.; Parihar, A.K.; Bohra, A.; Singh, N.P. Achievements and prospects of grass pea (Lathyrus sativus L.) improvement for sustainable food production. Crop J. 2016, 4, 407–416. [Google Scholar] [CrossRef] [Green Version]
  6. Girma, D.; Korbu, L. Genetic improvement of grass pea (Lathyrus sativus) in Ethiopia: An unfulfilled promise. Plant Breed. 2012, 131, 231–236. [Google Scholar] [CrossRef]
  7. Fikre, A.; Negwo, T.; Kuo, Y.H.; Lambein, F.; Ahmed, S. Climatic, edaphic and altitudinal factors affecting yield and toxicity of Lathyrus sativus grown at five locations in Ethiopia. Food Chem. Toxicol. 2011, 49, 623–630. [Google Scholar] [CrossRef]
  8. Jiao, C.J.; Jiang, J.L.; Ke, L.M.; Cheng, W.; Li, F.M.; Li, Z.X.; Wang, C.Y. Factors affecting beta-ODAP content in Lathyrus sativus and their possible physiological mechanisms. Food Chem. Toxicol. 2011, 49, 543–549. [Google Scholar] [CrossRef]
  9. Getahun, H.; Lambein, F.; Vanhoorne, M.; Van der Stuyft, P. Food-aid cereals to reduce neurolathyrism related to grass-pea preparations during famine. Lancet 2003, 362, 1808–1810. [Google Scholar] [CrossRef]
  10. Kumar, S.; Gupta, P.; Barpete, S.; Sarker, A.; Amri, A.; Mathur, P.N.; Baum, M. Grass pea. In Genetic and Genomic Resources of Grain Legume Improvement; Singh, M., Upadhyaya, H.D., Bisht, I.S., Eds.; Elsevier Science: Oxford, UK, 2013; pp. 269–292. [Google Scholar]
  11. Hillocks, R.J.; Maruthi, M.N. Grass pea (Lathyrus sativus): Is there a case for further crop improvement? Euphytica 2012, 186, 647–654. [Google Scholar] [CrossRef]
  12. Rubiales, D.; Emeran, A.A.; Flores, F. Adaptation of grass pea (Lathyrus sativus) to Mediterranean environments. Agronomy 2020, 10, 1295. [Google Scholar] [CrossRef]
  13. Fernández-Aparicio, M.; Flores, F.; Rubiales, D. Escape and true resistance to crenate broomrape (Orobanche crenata Forsk.) in grass pea (Lathyrus sativus L.) germplasm. Field Crops Res. 2011, 125, 92–97. [Google Scholar] [CrossRef]
  14. Vaz Patto, M.C.; Skiba, B.; Pang, E.C.K.; Ochatt, S.J.; Lambein, F.; Rubiales, D. Lathyrus improvement for resistance against biotic and abiotic stresses: From classical breeding to marker assisted selection. Euphytica 2006, 147, 133–147. [Google Scholar] [CrossRef]
  15. Tavoletti, S.; Iommarini, L.; Crinò, P.; Granati, E. Collection and evaluation of grasspea (Lathyrus sativus L.) germplasm of central Italy. Plant Breed. 2005, 124, 388–391. [Google Scholar] [CrossRef]
  16. Piergiovanni, A.R.; Lupo, F.; Zaccardelli, M. Environmental effect on yield, composition and technological seed traits of some Italian ecotypes of grass pea (Lathyrus sativus L.). J. Sci. Food Agric. 2011, 91, 122–129. [Google Scholar] [CrossRef] [PubMed]
  17. Grela, E.R.; Rybiński, W.; Matras, J.; Sobolewska, S. Variability of phenotypic and morphological characteristics of some Lathyrus sativus L. and Lathyrus cicera L. accessions and nutritional traits of their seeds. Genet. Resour. Crop Evol. 2012, 59, 1687–1703. [Google Scholar] [CrossRef] [Green Version]
  18. McIntosh, M.S. Analysis of combined experiments. Agron. J. 1983, 75, 153–155. [Google Scholar] [CrossRef]
  19. Yan, W.; Holland, J.B. A heritability-adjusted GGE biplot for test environment evaluation. Euphytica 2010, 171, 355–369. [Google Scholar] [CrossRef] [Green Version]
  20. Flores, F.; Hybl, M.; Knudsen, J.C.; Marget, P.; Muel, F.; Nadal, S.; Narits, L.; Raffiot, B.; Sass, O.; Solis, I.; et al. Adaptation of spring faba bean types across European climates. Field Crops Res. 2013, 145, 1–9. [Google Scholar] [CrossRef] [Green Version]
  21. Burgueño, J.; Crossa, J.; Vargas, M. SAS Programs for Graphing GE and GGE Biplots; Biometrics and Statistics Unit, CIMMYT, Int.: El Batan, Mexico, 2003. [Google Scholar]
  22. Yan, W.K.; Hunt, L.A.; Sheng, Q.L.; Szlavnics, Z. Cultivar evaluation and mega-environment investigation based on the GGE biplot. Crop Sci. 2000, 40, 597–605. [Google Scholar] [CrossRef]
  23. Anderson, M.J. A new method for non-parametric multivariate analysis of variance. Austral. Ecol. 2001, 26, 32–46. [Google Scholar]
  24. Yang, R.C.; Crossa, J.; Cornelius, P.L.; Burgueño, J. Biplot analysis of genotype × environment interaction: Proceed with caution. Crop Sci. 2009, 49, 1564–1576. [Google Scholar] [CrossRef] [Green Version]
  25. Kruskal, J.B. Multidimensional scaling by optimizing goodness of fit to a nonmetric hypothesis. Psychometrika 1964, 29, 1–27. [Google Scholar] [CrossRef]
  26. Hammer, Ø.; Harper, D.A.T.; Ryan, P.D. PAST: Paleontological statistics software package for education and data analysis. Palaeontol. Electron. 2001, 4, 4. Available online: http://palaeo-electronica.org/2001_1/past/issue1_01.htm (accessed on 2 November 2020).
  27. Yan, W.K. GGE biplot. A windows application for graphical analysis of multienvironment trial data and other types of two-way data. Agron. J. 2001, 93, 1111–1118. [Google Scholar] [CrossRef] [Green Version]
  28. Aznar-Fernández, T.; Carrillo-Perdomo, E.; Flores, F.; Rubiales, D. Identification and multi-environment validation of resistance to pea weevil (Bruchus pisorum) in Pisum germplasm. J. Pest. Sci. 2017, 91, 505–514. [Google Scholar] [CrossRef]
  29. Hanbury, C.D.; Siddique, K.H.M.; Galwey, N.W.; Cocks, P.S. Genotype-environment interaction for seed yield and ODAP concentration of Lathyrus sativus L. and L. cicera L. in Mediterranean type environments. Euphytica 1999, 110, 45–60. [Google Scholar] [CrossRef]
  30. Rubiales, D.; Fernández-Aparicio, M. Innovations in parasitic weeds management in legume crops. A review. Agron. Sustain. Dev. 2012, 32, 433–449. [Google Scholar] [CrossRef]
  31. Fernández-Aparicio, M.; Flores, F.; Rubiales, D. The Effect of Orobanche crenata Infection Severity in Faba Bean, Field Pea, and Grass Pea Productivity. Front. Plant Sci. 2016, 7, 1409. [Google Scholar] [CrossRef] [Green Version]
  32. Linke, K.H.; Abd El-Moneim, A.M.; Saxena, M.C. Variation in resistance of some forage legumes species to Orobanche crenata Forsk. Field Crops Res. 1993, 32, 277–285. [Google Scholar] [CrossRef]
  33. Rubiales, D. Parasitic plants, wild relatives and the nature of resistance. New Phytol. 2003, 160, 459–461. [Google Scholar] [CrossRef]
  34. Rubiales, D.; Alcántara, C.; Pérez-de-Luque, A.; Gil, J.; Sillero, J.C. Infection of chickpea (Cicer arietinum) by crenate broomrape (Orobanche crenata) as influenced by sowing date and weather conditions. Agronomie 2003, 23, 359–362. [Google Scholar] [CrossRef]
  35. Sauerborn, J.; Masri, H.; Saxena, M.C.; Erskine, W. A rapid test to screen lentil under laboratory conditions for susceptibility to Orobanche. Lens Newsl. 1987, 14, 15–16. [Google Scholar]
  36. Fondevilla, S.; Fernández-Aparicio, M.; Satovic, Z.; Emeran, A.A.; Torres, A.M.; Moreno, M.T.; Rubiales, D. Identification of quantitative trait loci for specific mechanisms of resistance to Orobanche crenata in pea. Mol. Breed. 2010, 25, 259–272. [Google Scholar] [CrossRef] [Green Version]
  37. Rubiales, D. Can we breed for durable resistance to broomrapes? Phytopathol. Mediterr. 2018, 57, 170–185. [Google Scholar] [CrossRef]
  38. Pérez-de-Luque, A.; Flores, F.; Rubiales, D. Differences in Crenate Broomrape Parasitism Dynamics on Three Legume Crops Using a Thermal Time Model. Front. Plant Sci. 2016, 7, 1910. [Google Scholar] [CrossRef] [PubMed] [Green Version]
  39. Pérez-de-Luque, A.; Sillero, J.C.; Moral, A.; Cubero, J.I.; Rubiales, D. Effect of sowing date and host resistance on the establishment of Orobanche crenata in faba bean and common vetch. Weed Res. 2004, 44, 282–288. [Google Scholar] [CrossRef]
Figure 1. HA-GGE biplot based on yield (kg ha−1) of 8 selected grass pea accessions in 17 environments (combination location–year). The genotypes are in italics and the environments are abbreviated as in Table 1. TEAa is the target environment axis abscissa and TEAo is the target environment axis ordinate.
Agronomy 10 01931 g001
Figure 2. HA-GGE biplot based on the number of broomrapes per plant of 8 selected grass pea accessions in 13 environments (combination location–year). The genotypes are in italics and the environments are abbreviated as in Table 1. Environments ALM17, ALM18, ESP17, ESP18 were free of broomrape infection and therefore are not included in this biplot.
Agronomy 10 01931 g002
Figure 3. HA-GGE biplot based on the flowering date of 8 selected grass pea accessions in 12 environments (combination season–location).
Agronomy 10 01931 g003
Figure 4. Non-metric multidimensional scaling (NMDS) analysis of the climate variables characterizing the 17 environments, used for phenotyping grain yield.
Agronomy 10 01931 g004
Table 1. The description of the environments (combination of location and season) of the trials.
Environm.LocationGrowing SeasonSoil TypeSoil pHLatit.Longit.Altit.AvTmax (°C)AvTmin (°C)Rain (mm)
CAMP08Campillo2007–2008Vertisol7.5–837°20′ N4°51′ W46118.87.8264
TOM09Tomejil2008–2009Vertisol7–7.537°30′ N5°57′ W1222.67.5219
CORC09Córdoba2008–2009Cambisol6.5–737°50′ N4°50′ W9021.77.9280
CORC10Córdoba2009–2010Cambisol6.5–737°50′ N4°50′ W9021.39.4626
ESC08Escacena2007–2008Fluvisol7–7.537°25′ N6°15′ W8820.710.1391
ESC09Escacena2008–2009Fluvisol7–7.537°25′ N6°15′ W8821.49.4252
ESC10Escacena2009–2010Fluvisol7–7.537°25′ N6°15′ W8820.910.5886
ESC11Escacena2010–2011Fluvisol7–7.537°25′ N6°15′ W8822.111.8534
ESC12Escacena2011–2012Fluvisol7–7.537°25′ N6°15´W8821.910.1164
CORP16Córdoba2015–2016Cambisol7–7.237°86′ N4°79′ W9425.911.3519
CORB17Córdoba2016–2017Vertisol7.2–7.837°87′ N4°78′ W9727.612467
CORB18Córdoba2017–2018Vertisol7.2–7.837°87′ N4°78′ W9725.510.7488
ESP16Espiel2015–2016Cambisol7.8–838°19′ N5°01′ W58723.99.9485
ESP17Espiel2016–2017Cambisol7.8–838°19′ N5°01′ W58723.59.5464
ESP18Espiel2017–2018Cambisol7.8–838°19′ N5°01′ W58721.47.7558
ALM17Almodóvar2016–2017Fluvisol8–8.337°77′ N5°03´W8426.110.9424
ALM18Almodóvar2017–2018Fluvisol8–8.337°77′ N5°03′ W8424.510.2589
Table 2. Genotype (G), field–year environment (E) and genotype by field–year environment interaction (GE) terms for grain yield, days to flowering and number of broomrapes per plant of eight genotypes of L. sativus.
TraitSourcedf aSum Squares bExplained Variation c% of PC1 + PC2 d
E16876430554 ***81
Grain yield (kg ha−1)G732860384 ***348 + 29
GE112165378470 ***16
E1126099 ***52
Flowering dateG714534 ***2972 + 10
GE779004 ***18
E12208 ***70
Broomrapes infectionG755 ***1984 + 9
GE8434 ***11
a degrees of freedom; b, *** significant at the 0.0001 level of probability; c percentage sums of the squares with respect to the E + G + GE sums of squares; d proportions of the first two principal components derived from the singular value decomposition of the heritability-adjusted genotype plus genotype × environment interaction (HA-GGE) analysis.
Table 3. Mean grain yield (kg ha−1) of 8 grass pea accessions grown at 17 location–year.
EnvironmentGrain Yield (kg ha−1)MeanSE
TblancoTpintoIlat11Ilat18Ilat10Ilat3LasanaTitana
ESC1084301287255322476556020934
ESC111717145592146864557423962
CAMP0813710660754717334081051040459
CORC10116292062969680013812942391
ESC083333019081227153464570363478699
CORC093717020111197155613701065100967156
ESC094377681619146423431614198814871465136
ESC12171110771422143612271589182728691645120
ESP1817651872212723142069234826832975226998
CORB18188219542224232921682767351527362447169
ESP16280720472933312319632490315439302806174
ALM18243225543417288432452790385838163125133
CORB17275328952610258230183177412544673203148
CORP16246024932270229730903707380268073366326
ESP17329133513060351735534033471852463846150
ALM17379938693810448842014898531160254550182
TOM09536581314325408339633631498529154675358
Mean17441865204120572075220825172634214383
SE21728218418719120125730883
Table 4. Number of broomrapes per plant on 8 grass pea accessions grown at 17 location–year environments.
EnvironmentNo. Broomrapes per Plant by AccessionMeanSE
Ilat3Ilat18Ilat11Ilat10LasanaTpintoTitanaTblanco
ESP170000000000
ALM170000000000
ESP180000000000
ALM180000000000
TOM0900000.650000.080.08
CORB1800000.270.360.510.830.180.06
ESP1600000.150.350.410.680.200.01
CORP1600000.190.360.450.640.200.01
CORB1700000.310.400.420.870.250.06
ESC120.050.080.170.160.380.630.971.130.440.09
CAMP080.100.030.10.100.501.001.101.500.550.11
ESC080.300.570.400.500.831.240.901.830.820.10
ESC090.470.460.390.531.401.261.381.800.960.12
CORC090.400.280.831.630.982.602.462.281.430.34
ESC111.621.191.501.532.362.432.222.241.890.13
CORC101.081.380.831.082.163.162.912.621.900.22
ESC102.012.152.122.444.112.093.833.782.810.22
Mean0.350.360.370.470.840.931.031.190.690.06
SE0.090.090.080.100.160.150.160.160.06
Table 5. Days to 50% flowering (DtF) in 12 environments (in increasing order).
EnvironmentDays to 50% FloweringMeanSE
Ilat11Ilat10Ilat18Ilat3TitanaTblancoLasanaTpinto
CORP167878787884849484821.1
ESP167878787884849484821.1
ALM1886868693869898101921.3
CORB1888878788929993101921.1
CORC099696961001071091071091031.3
ESC119198101981201041051121042.2
ESP1877801111121091091211131043.2
ESP179198921131151131091151062.0
ESC108710698911041181161281063.3
ALM179198911141151131131161062.3
CORB1790106921121141141141181072.1
CORC101051051041051141191181181111.5
Mean889393981041051071081000.8
SE1.41.91.62.12.42.11.72.30.8
Publisher’s Note: MDPI stays neutral with regard to jurisdictional claims in published maps and institutional affiliations.

