
Influence of Injection Molding Parameters on the Peel Strength between Plasma-Treated Fluoropolymer Films and Polycarbonate

 , , , ,
Abstract
: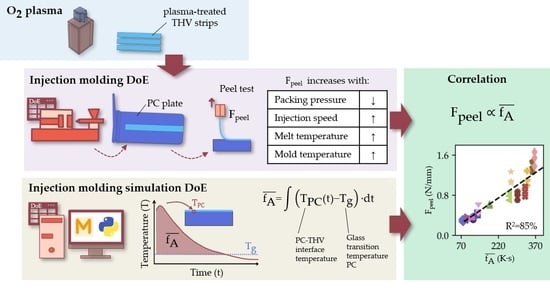
1. Introduction
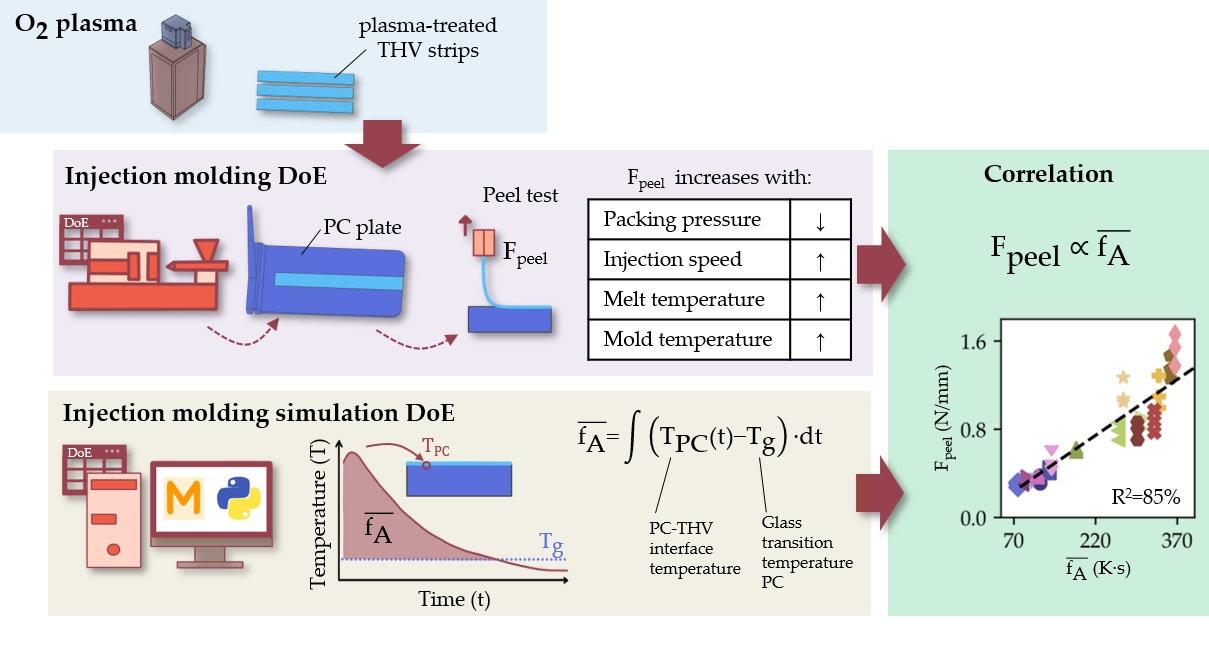
2. Materials and Methods
2.1. THV Film Preparation and O2 Plasma Treatment
2.2. X-ray Photoelectron Spectroscopy (XPS) and Water Contact Angle (WCA)
2.3. Atomic Force Microscopy (AFM)
2.4. Injection Molding
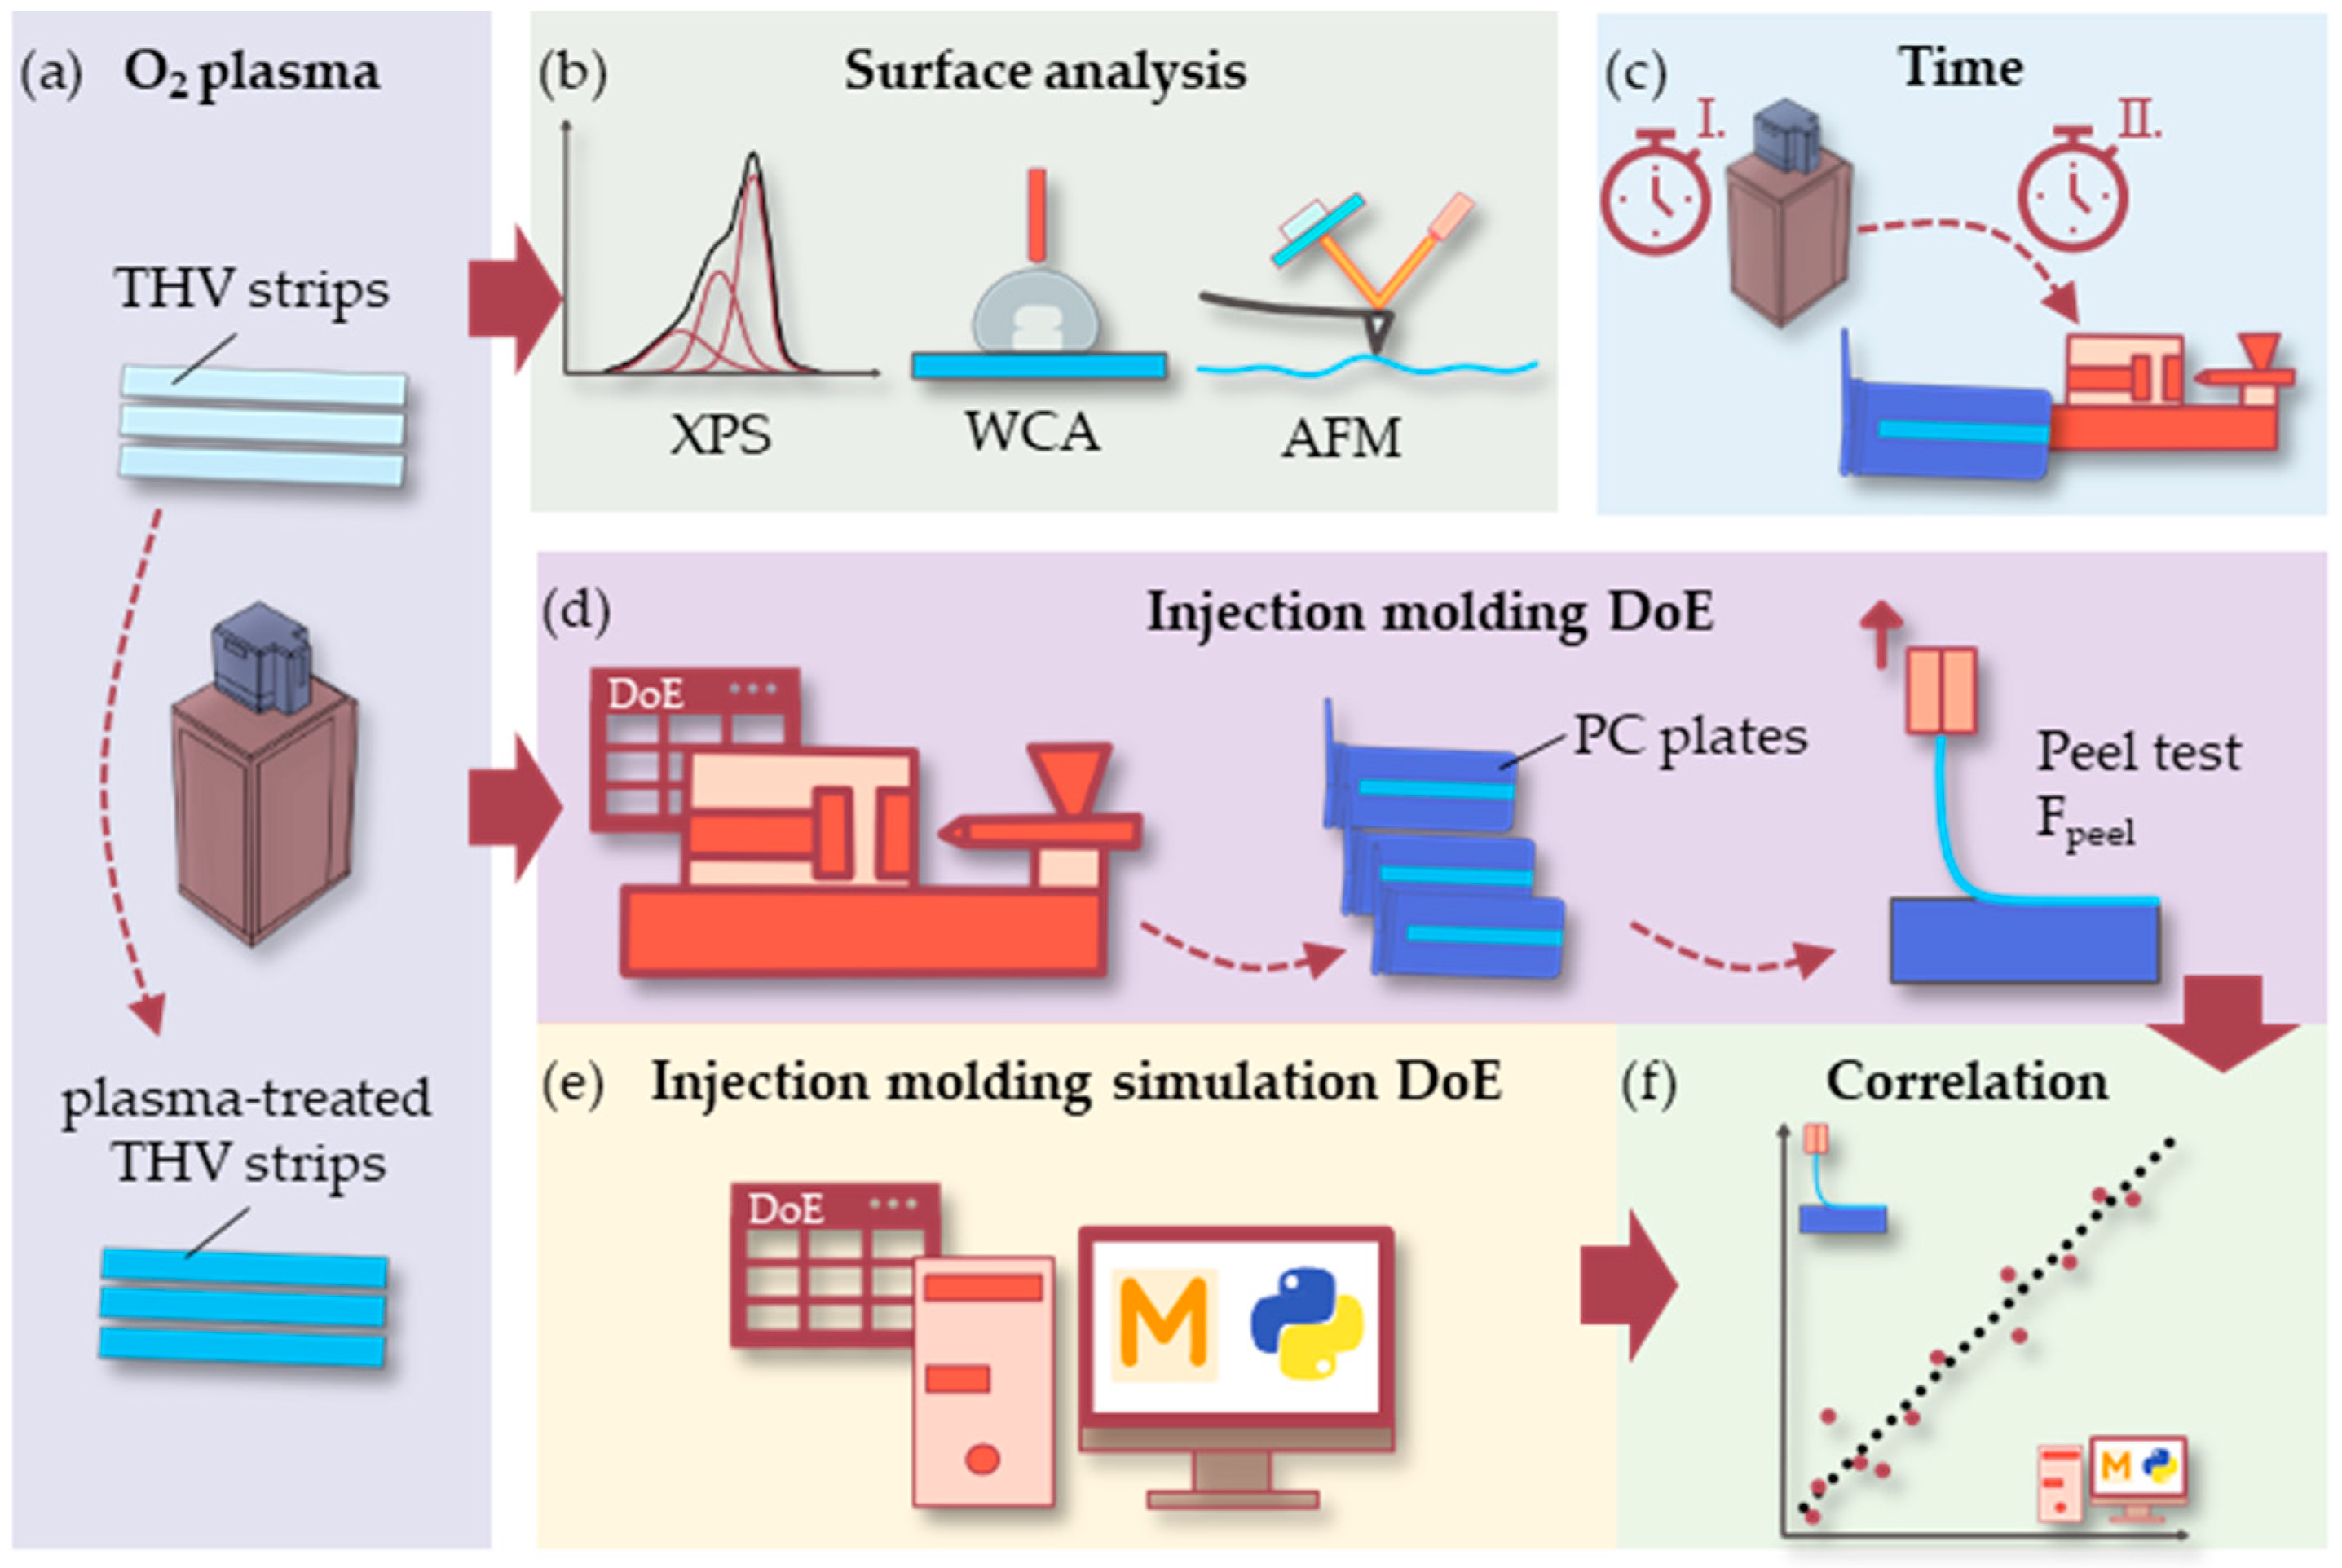
2.5. Peel Test Analysis Procedure
2.6. Experimental Design
2.6.1. Variation of Time of Plasma Exposure
2.6.2. Variation of Time from Plasma Treatment to Overmolding
2.6.3. Variation of Molding Parameters (Design of Experiment, DoE)
2.7. Injection Molding Simulation of DoE
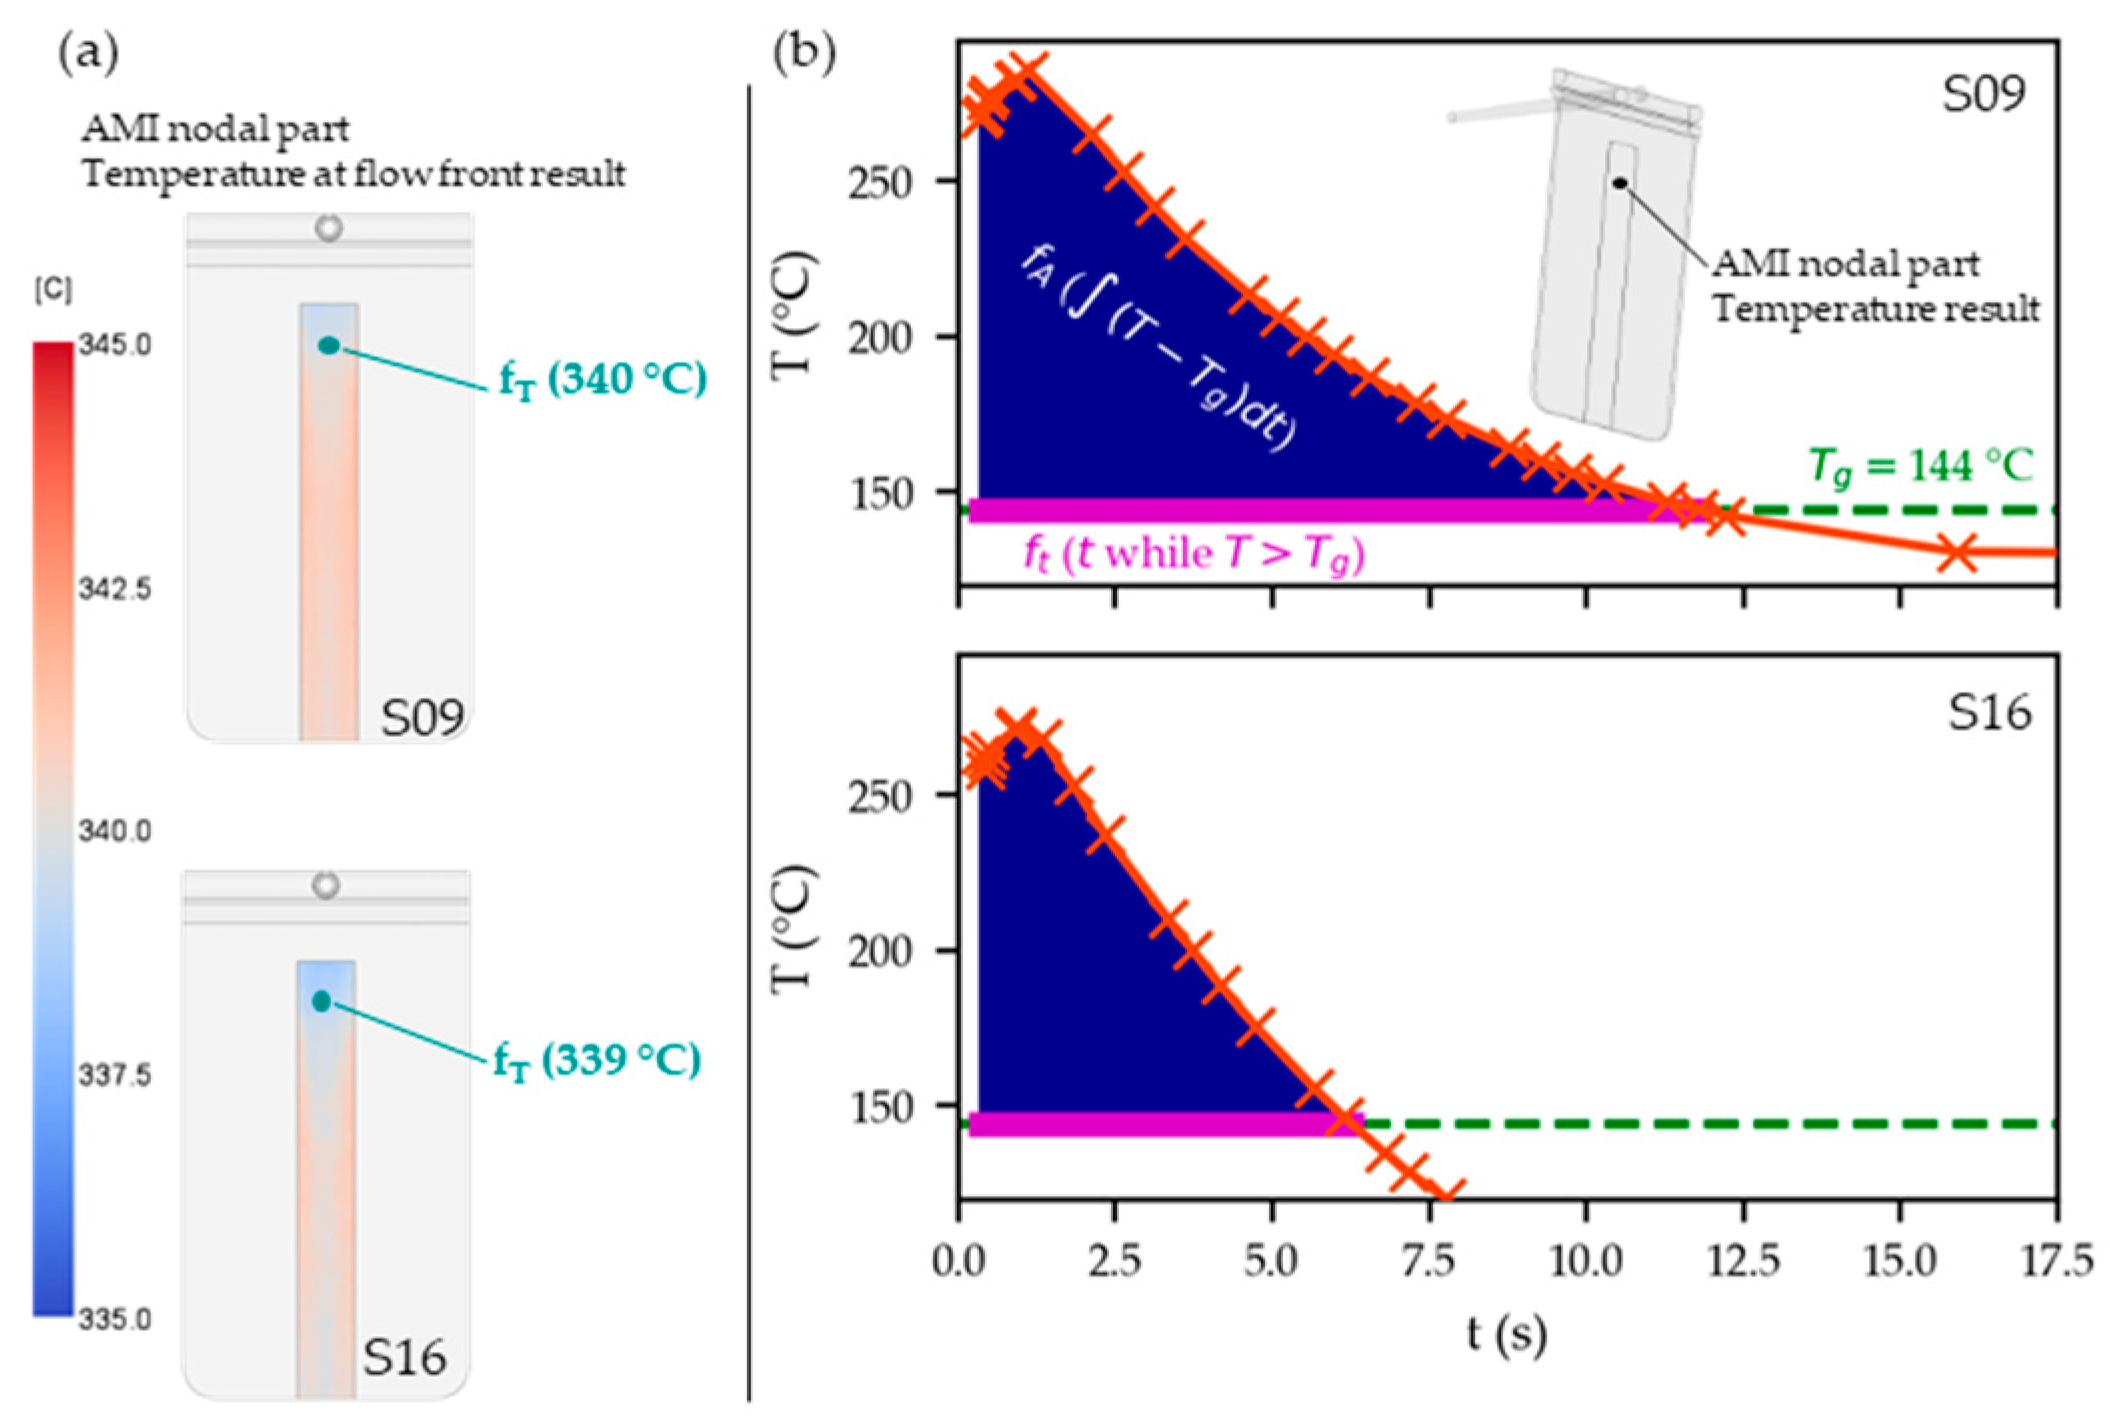
2.7.1. Simulation Model Preparation
2.7.2. Simulation Analysis Procedure
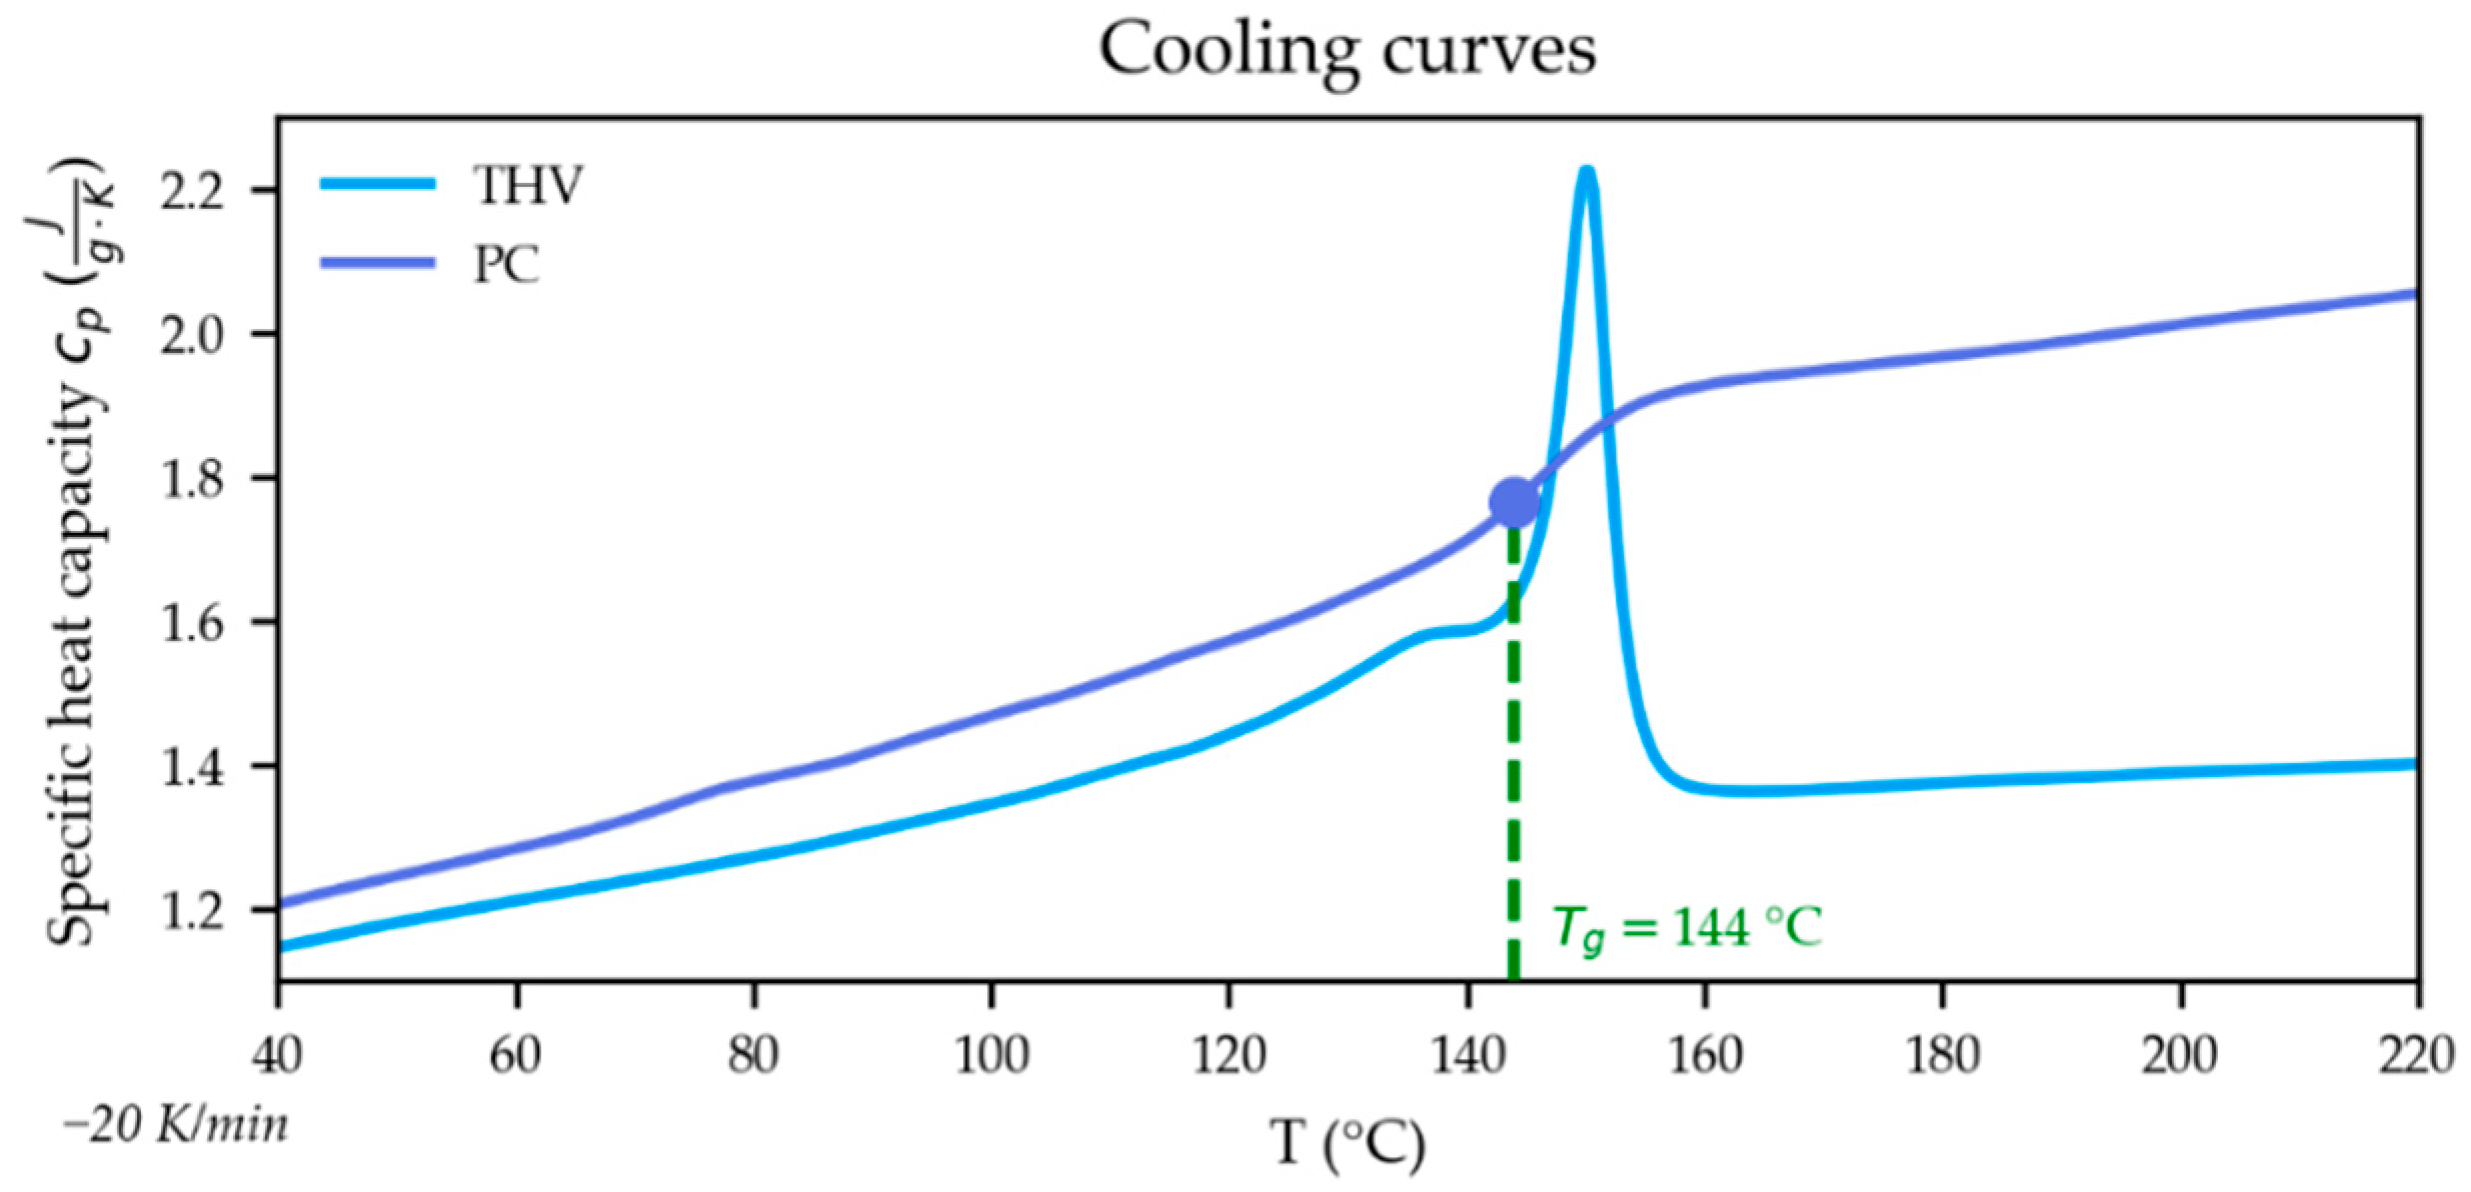
- —temperature at flow front;
- —time the PC melt is above its ;
- —temperature–time integral while the PC melt is above its defined as
3. Results and Discussion
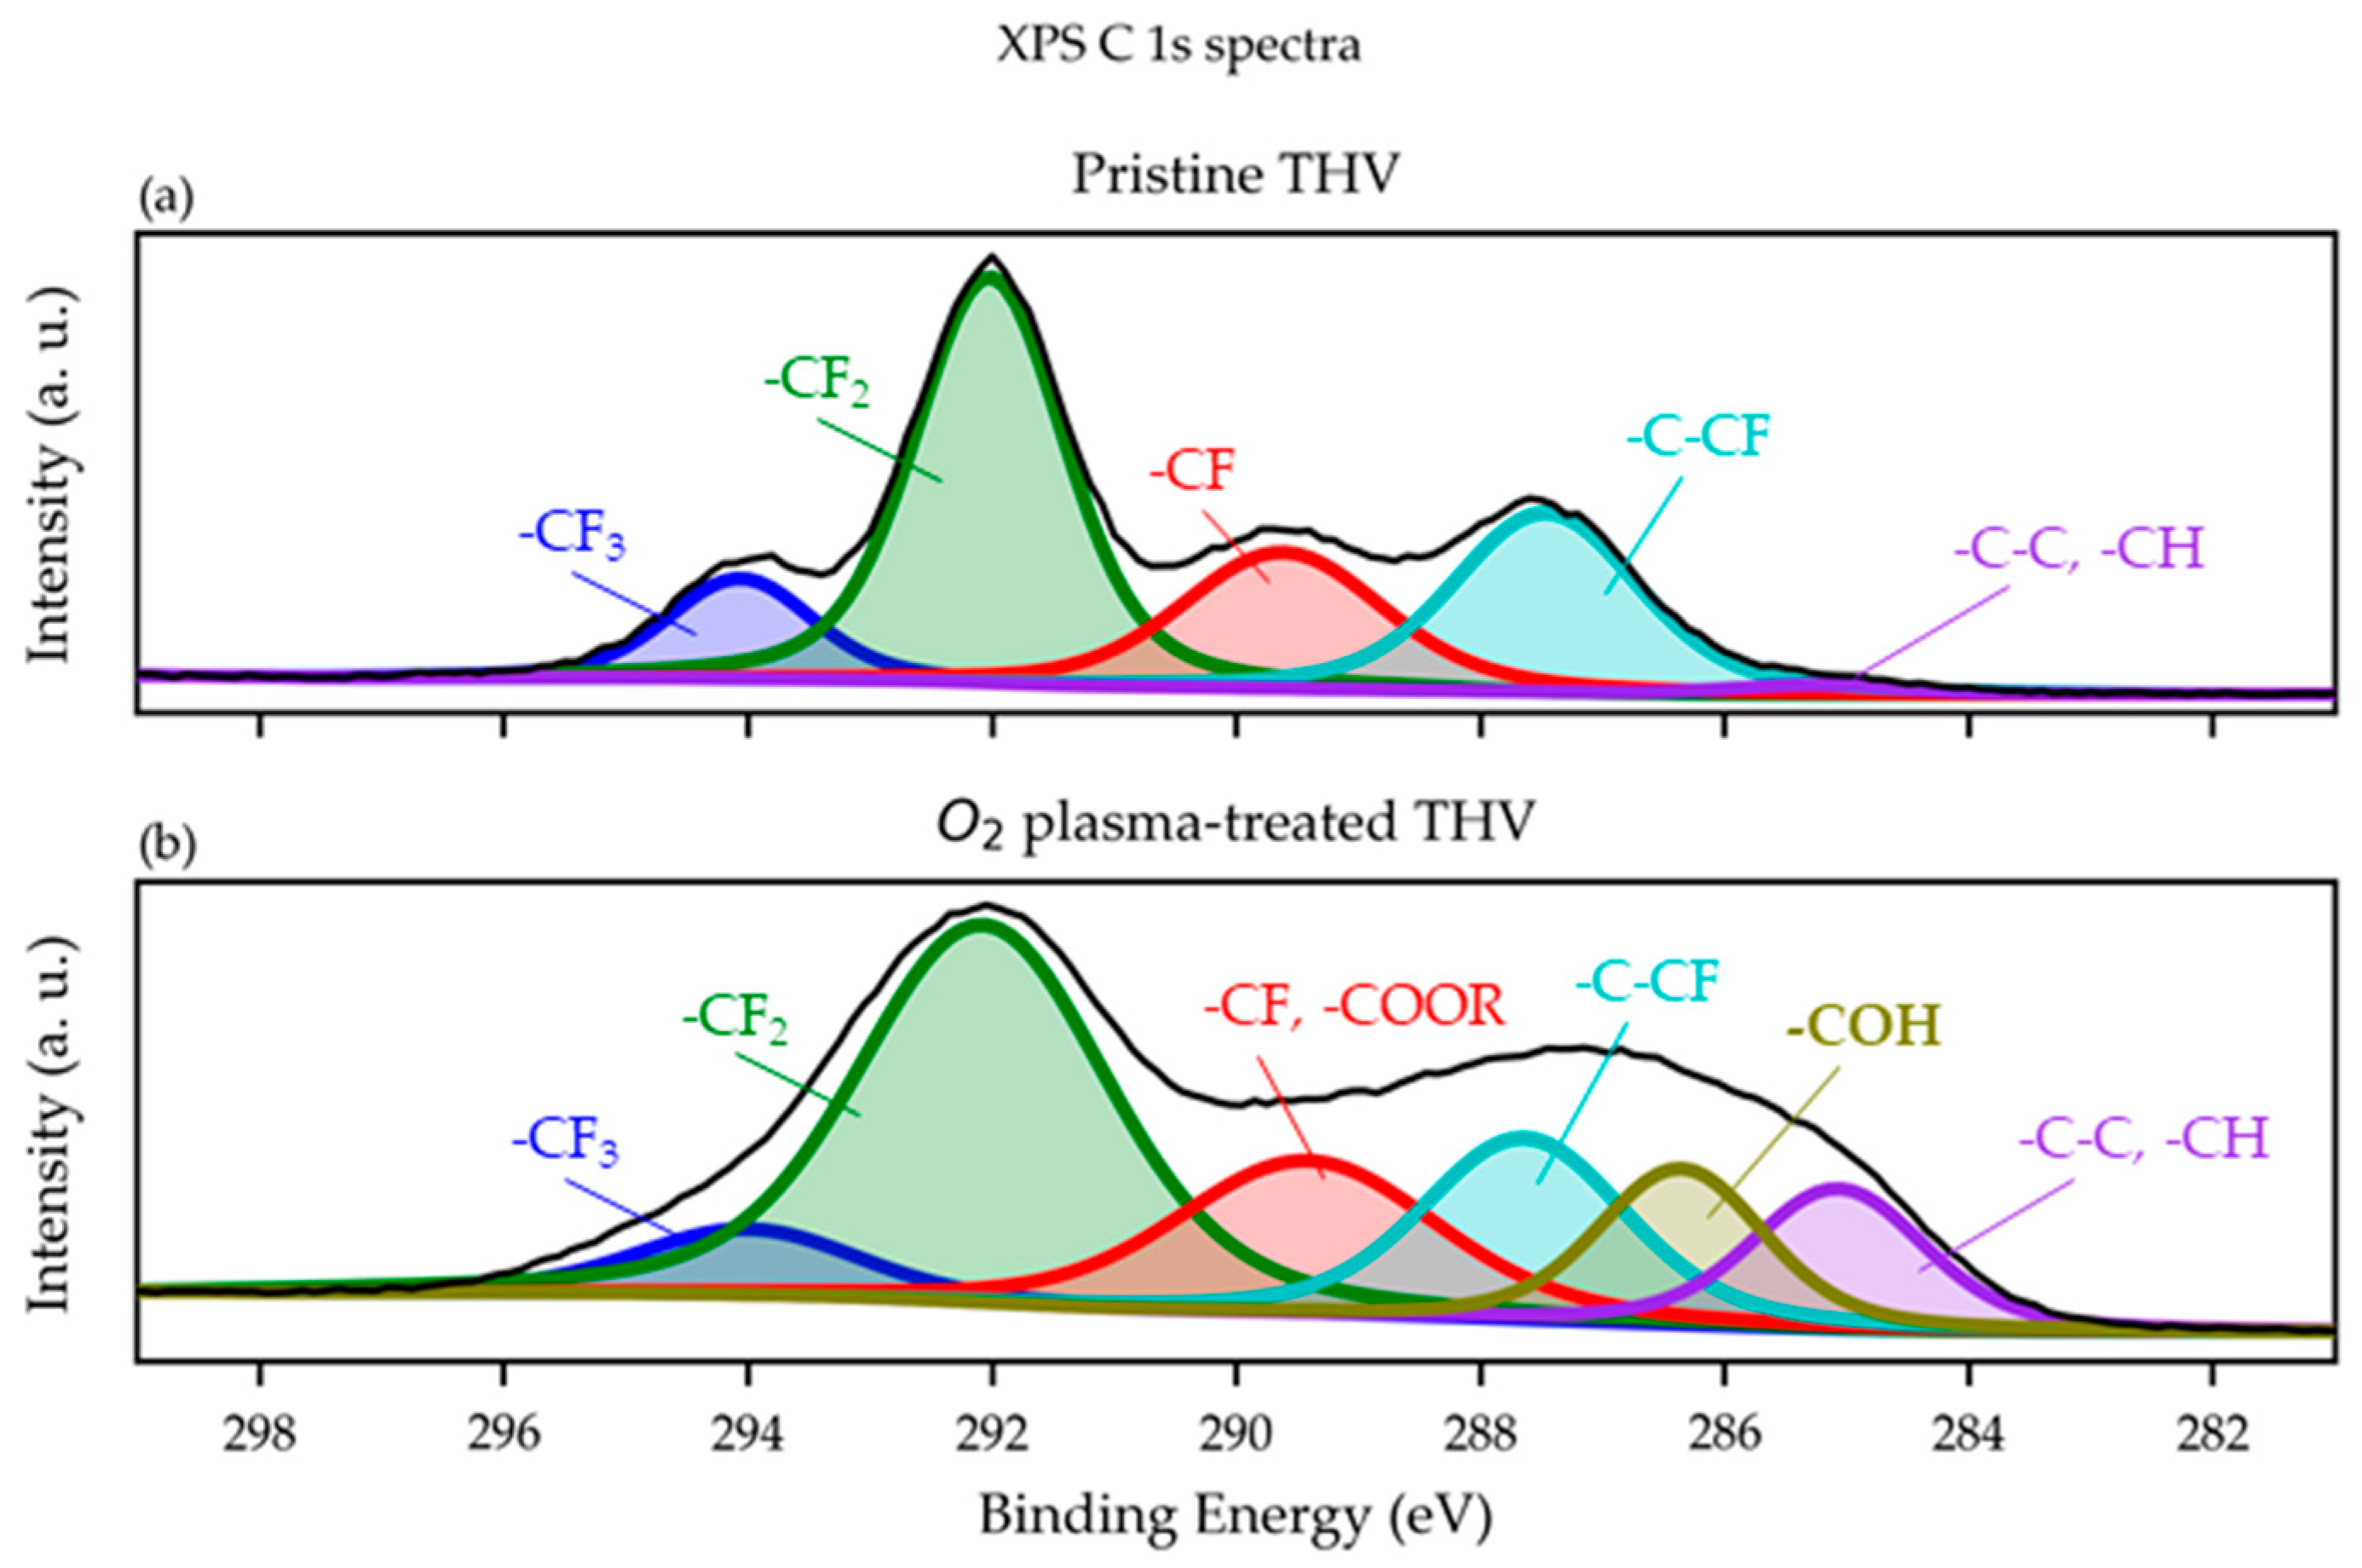
3.1. X-ray Photoelectron Spectroscopy (XPS) Evaluation
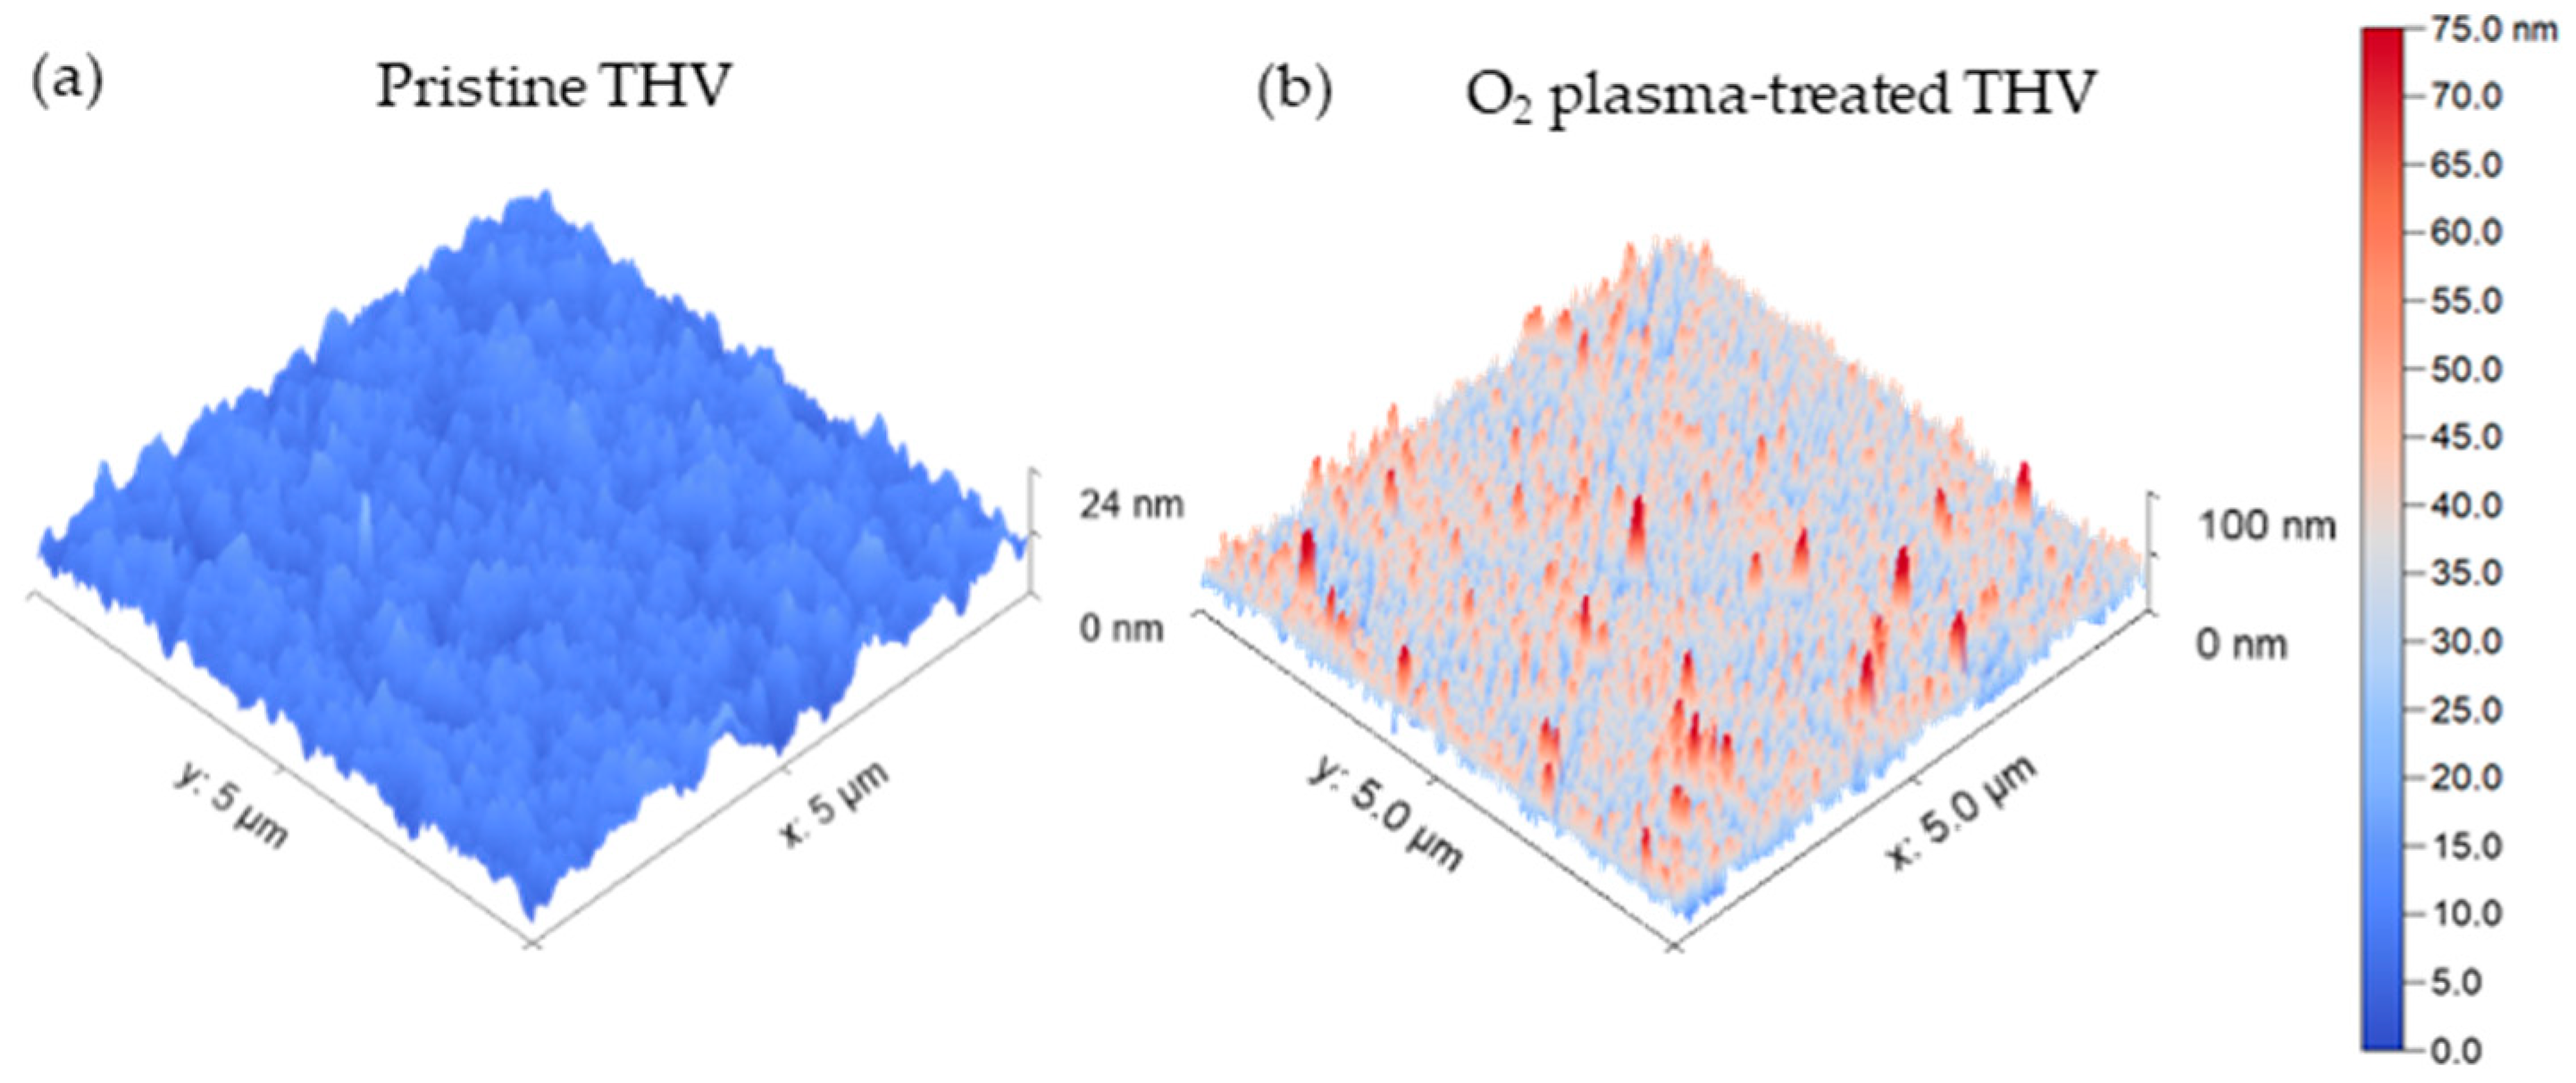
3.2. Atomic Force Microscopy (AFM) Evaluation
3.3. Peel Test Evaluation
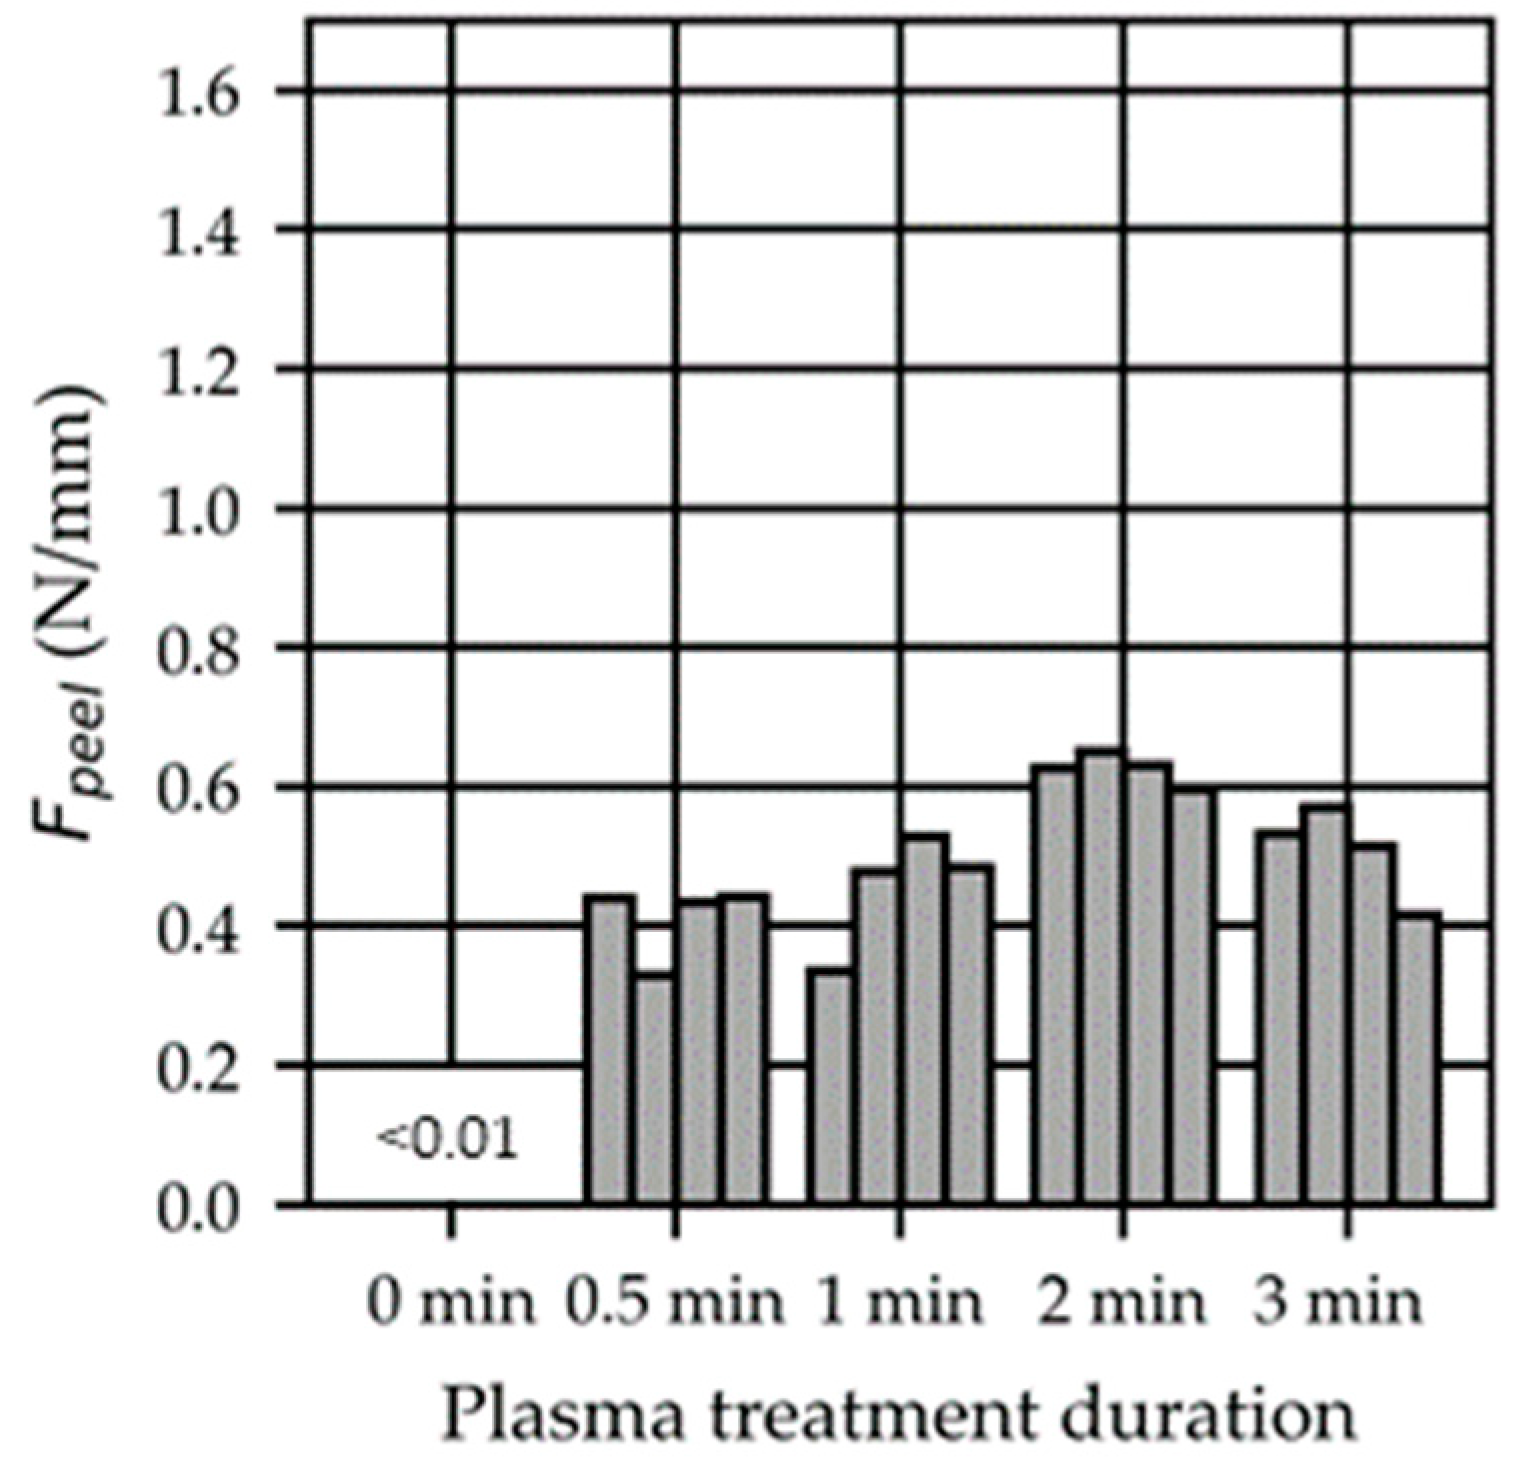
3.3.1. Study of Time of Plasma Exposure
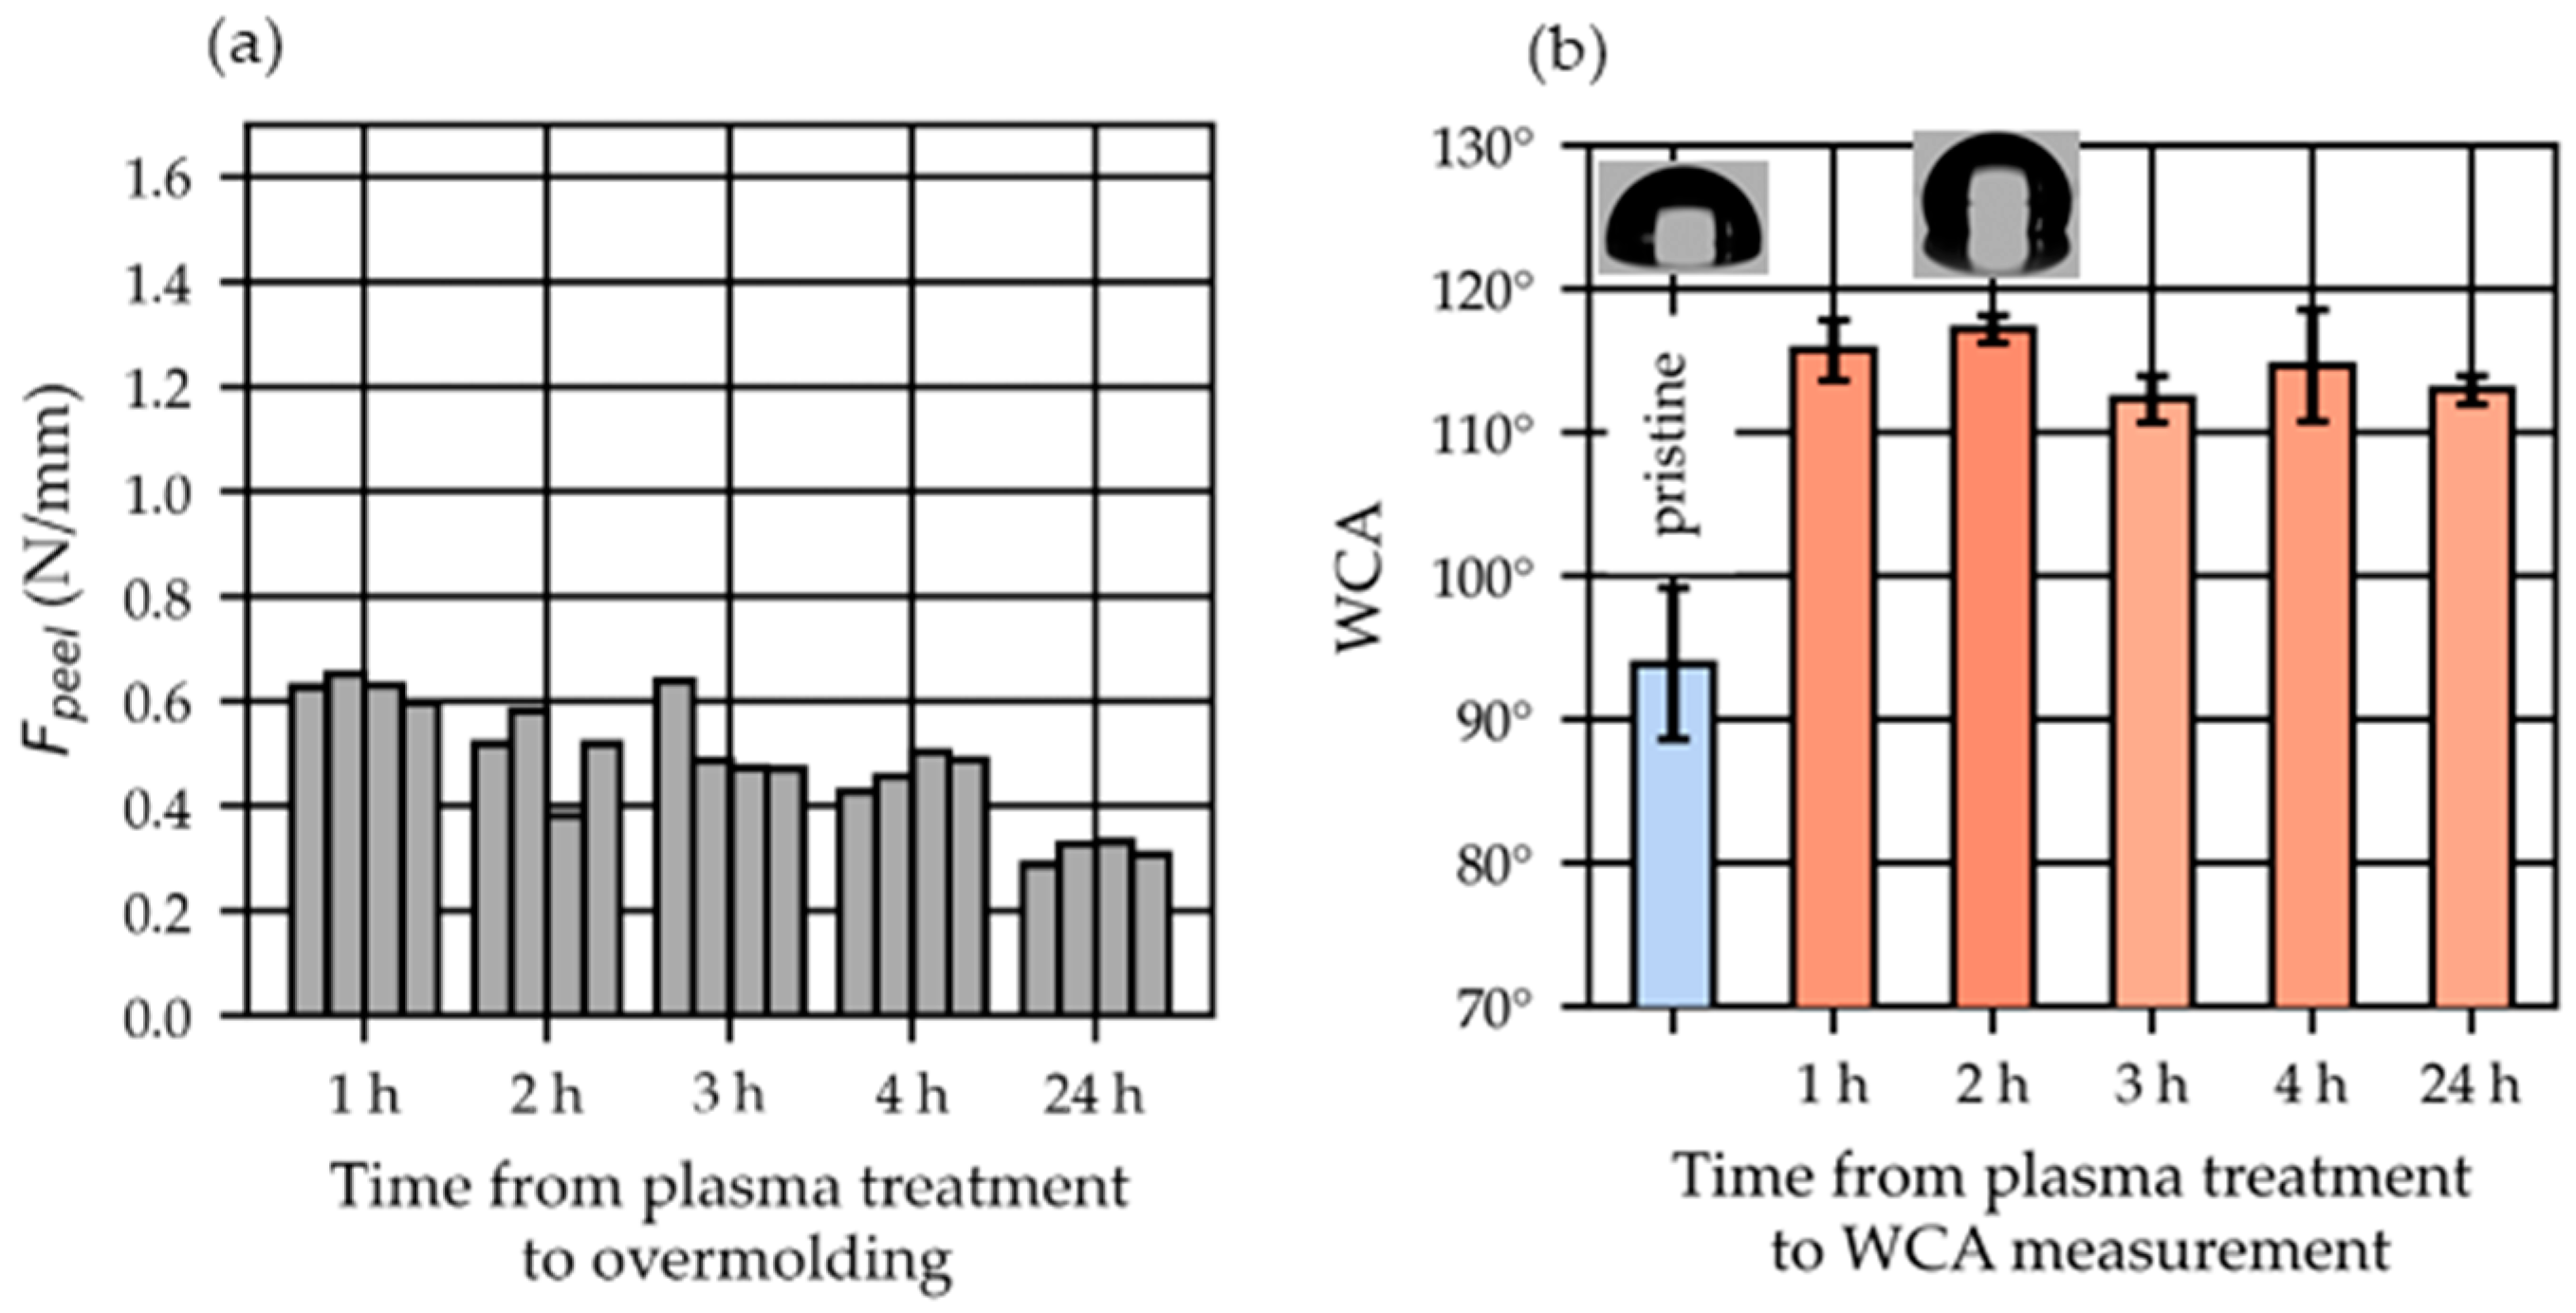
3.3.2. Study of Time from Plasma Treatment to Overmolding and Water Contact Angle (WCA)
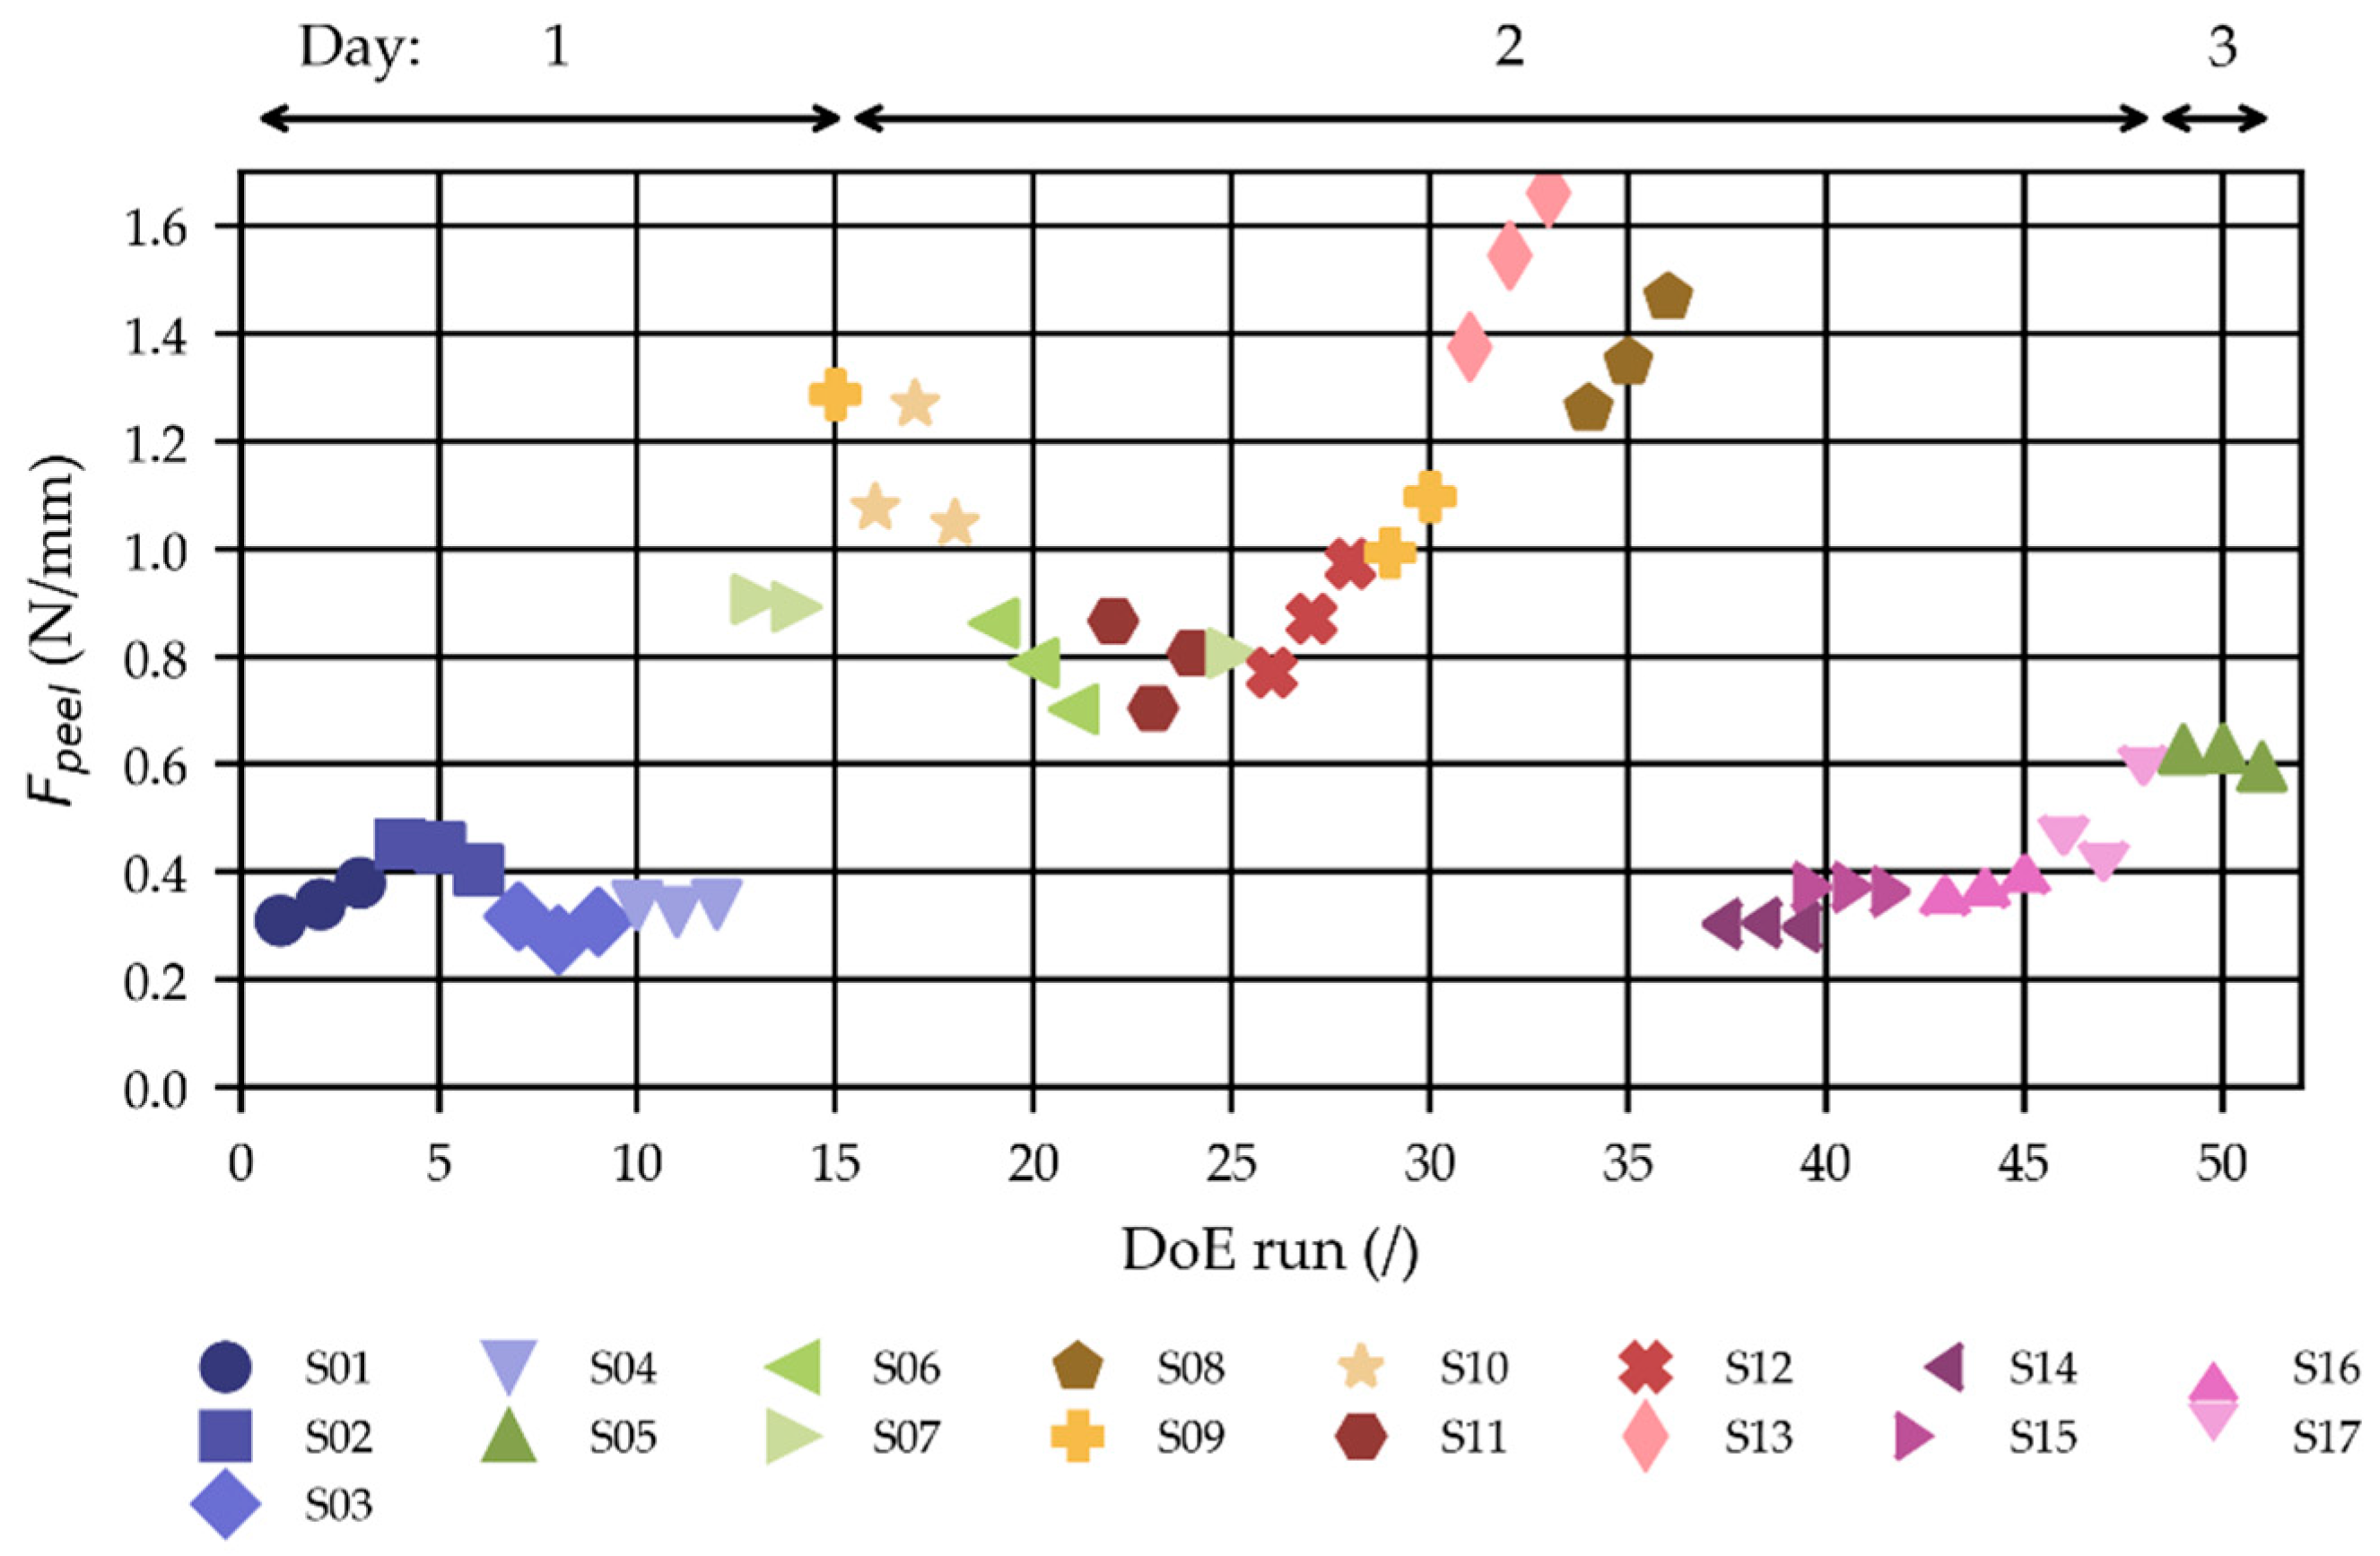
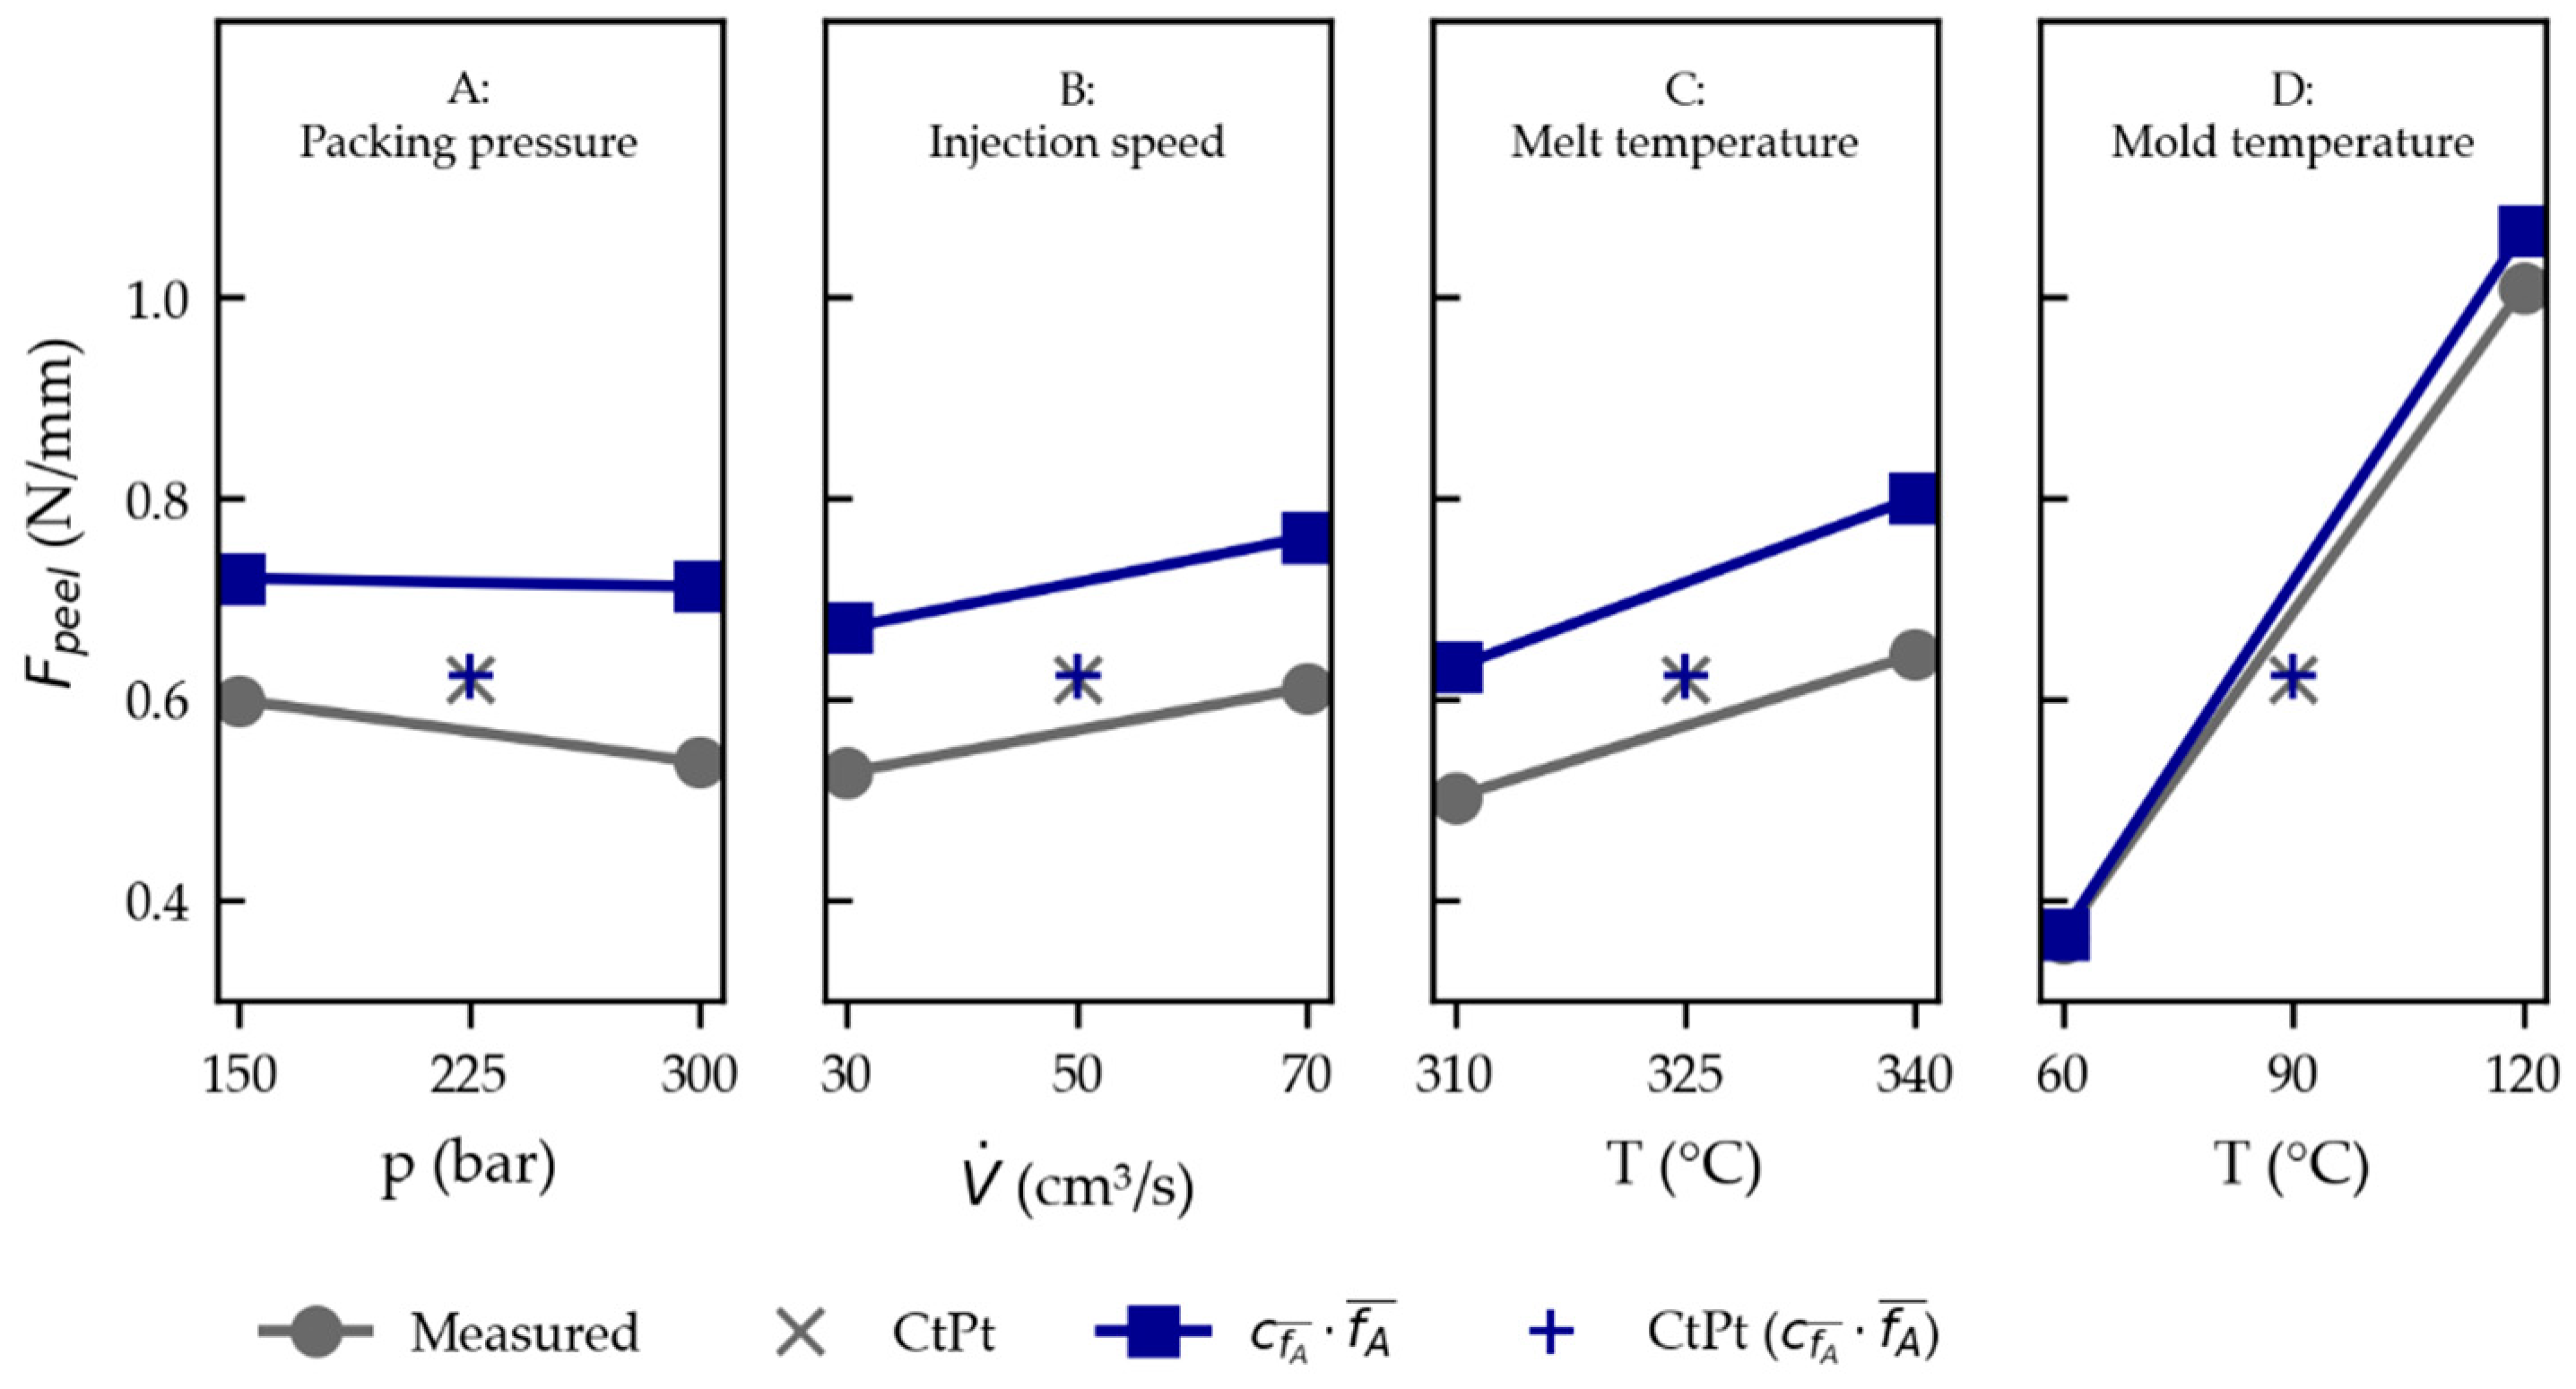
3.3.3. Study of Molding Parameters
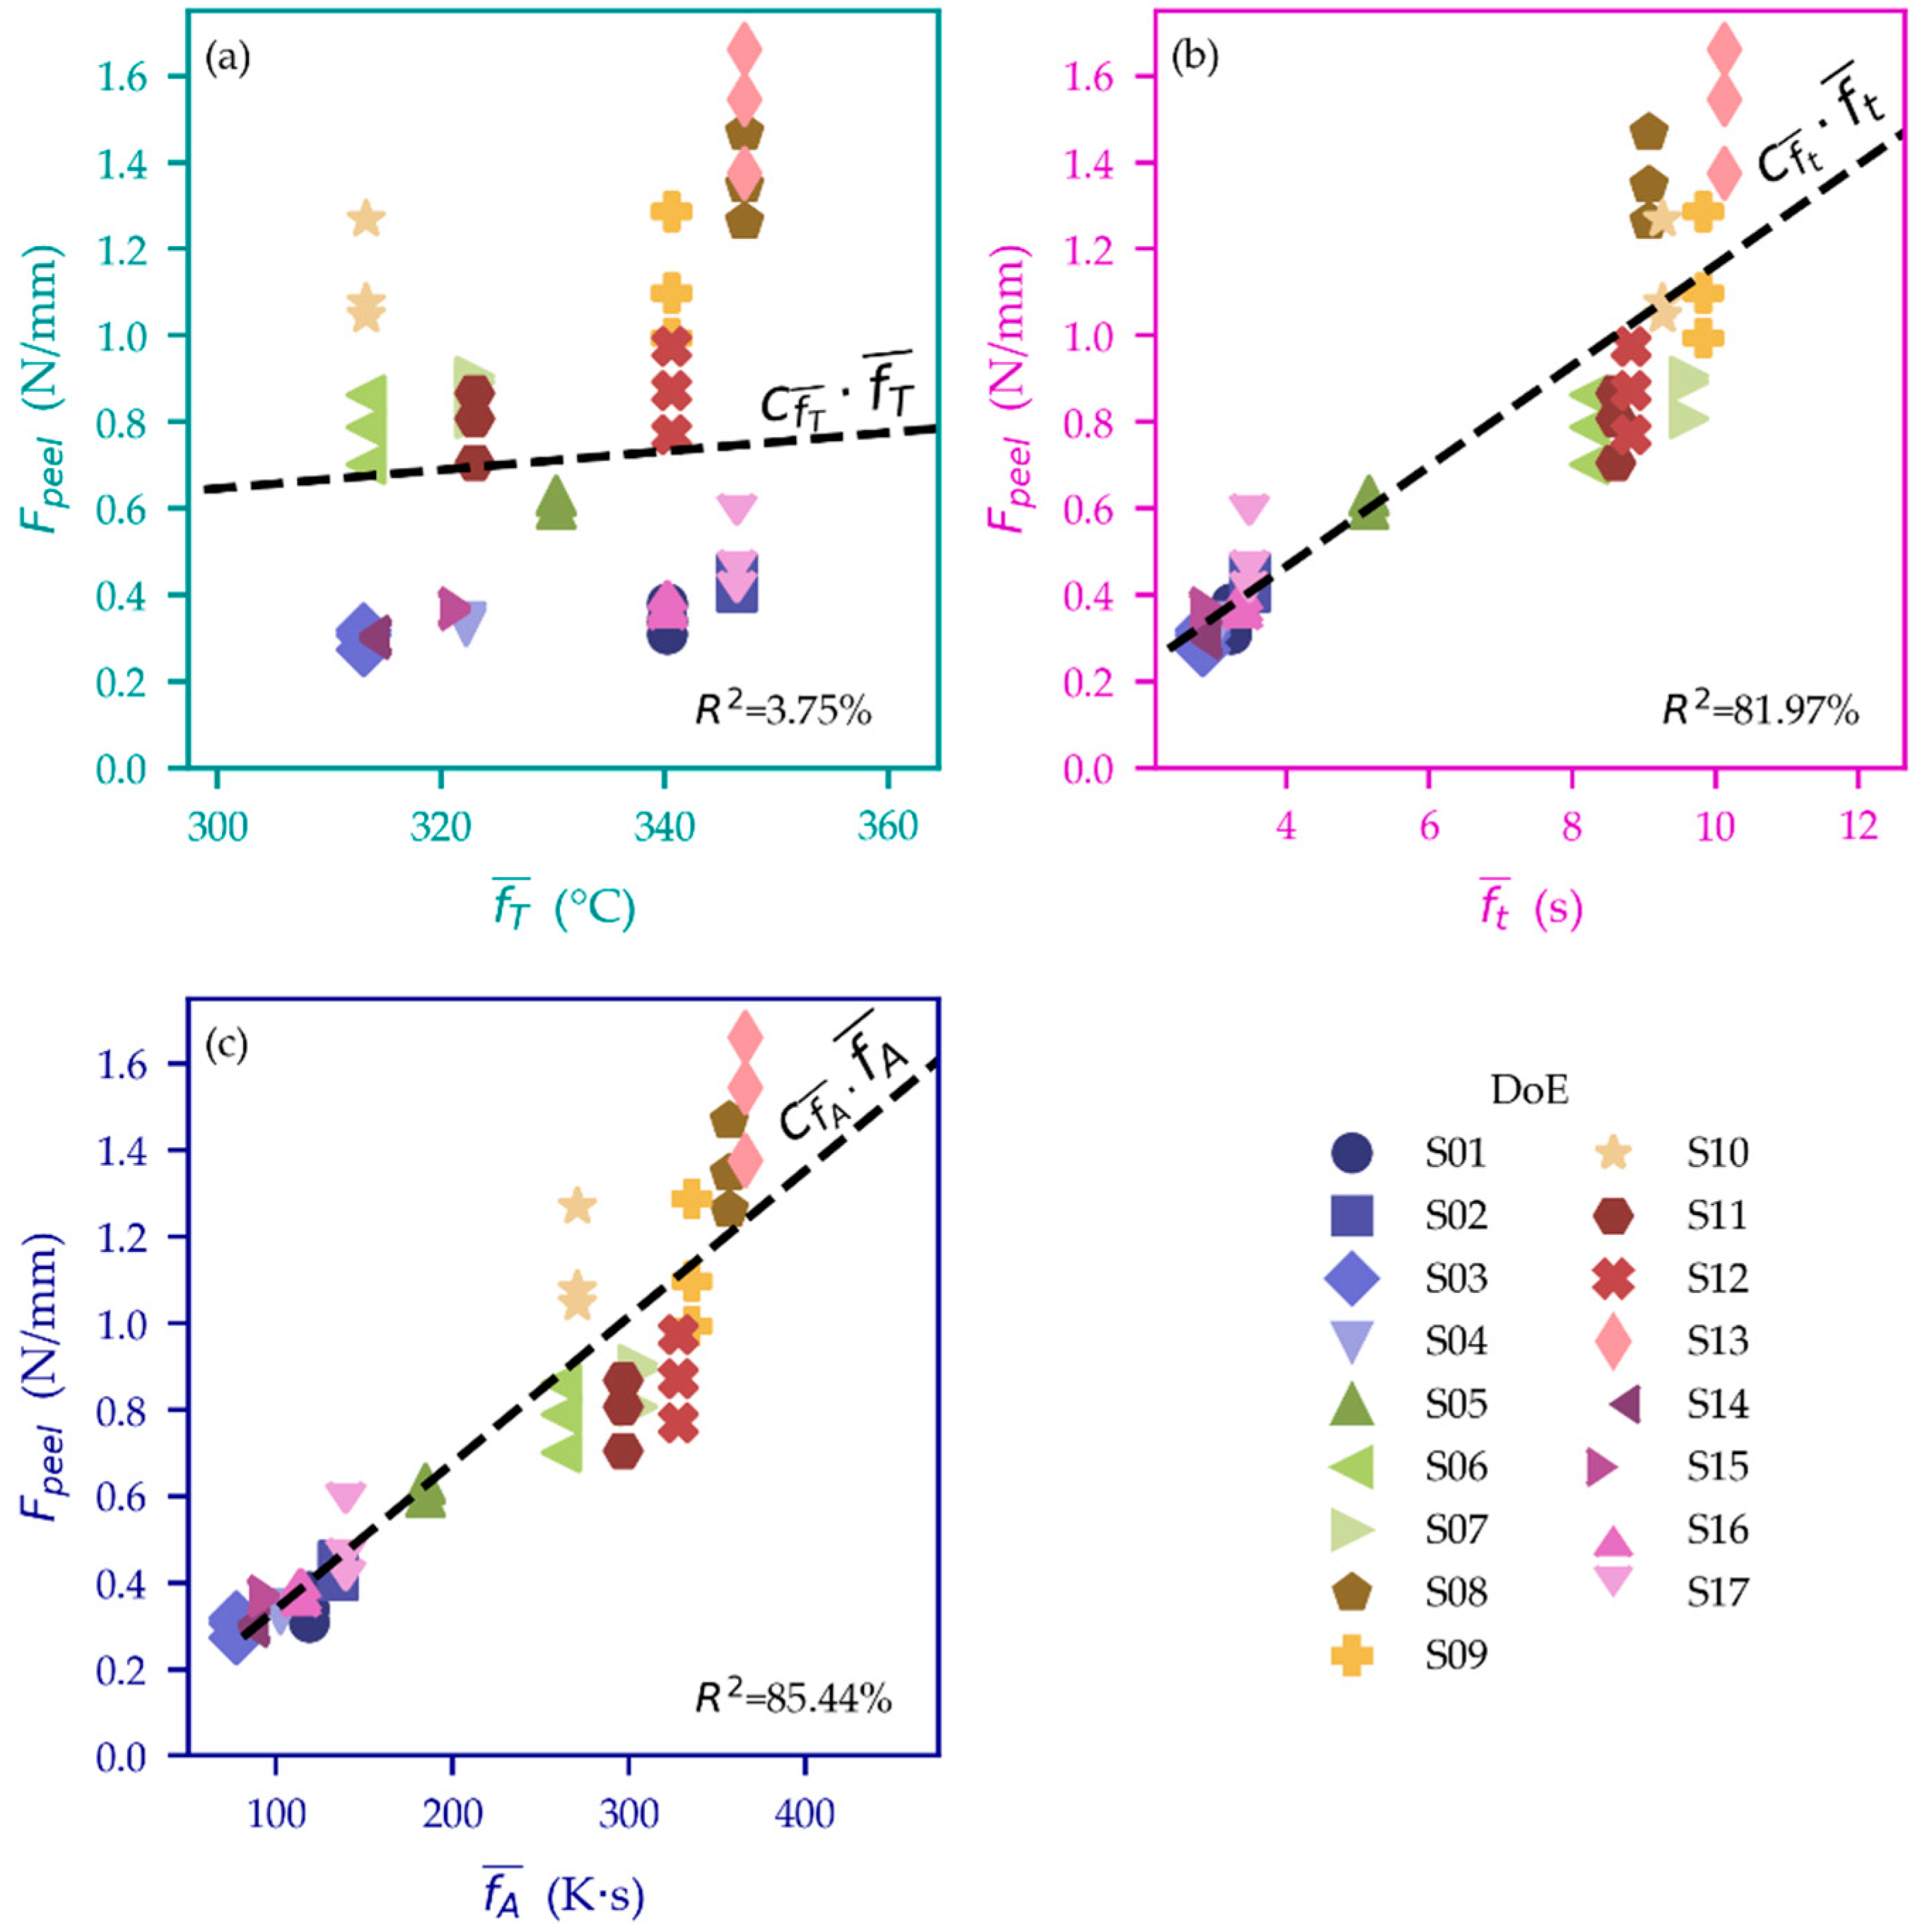
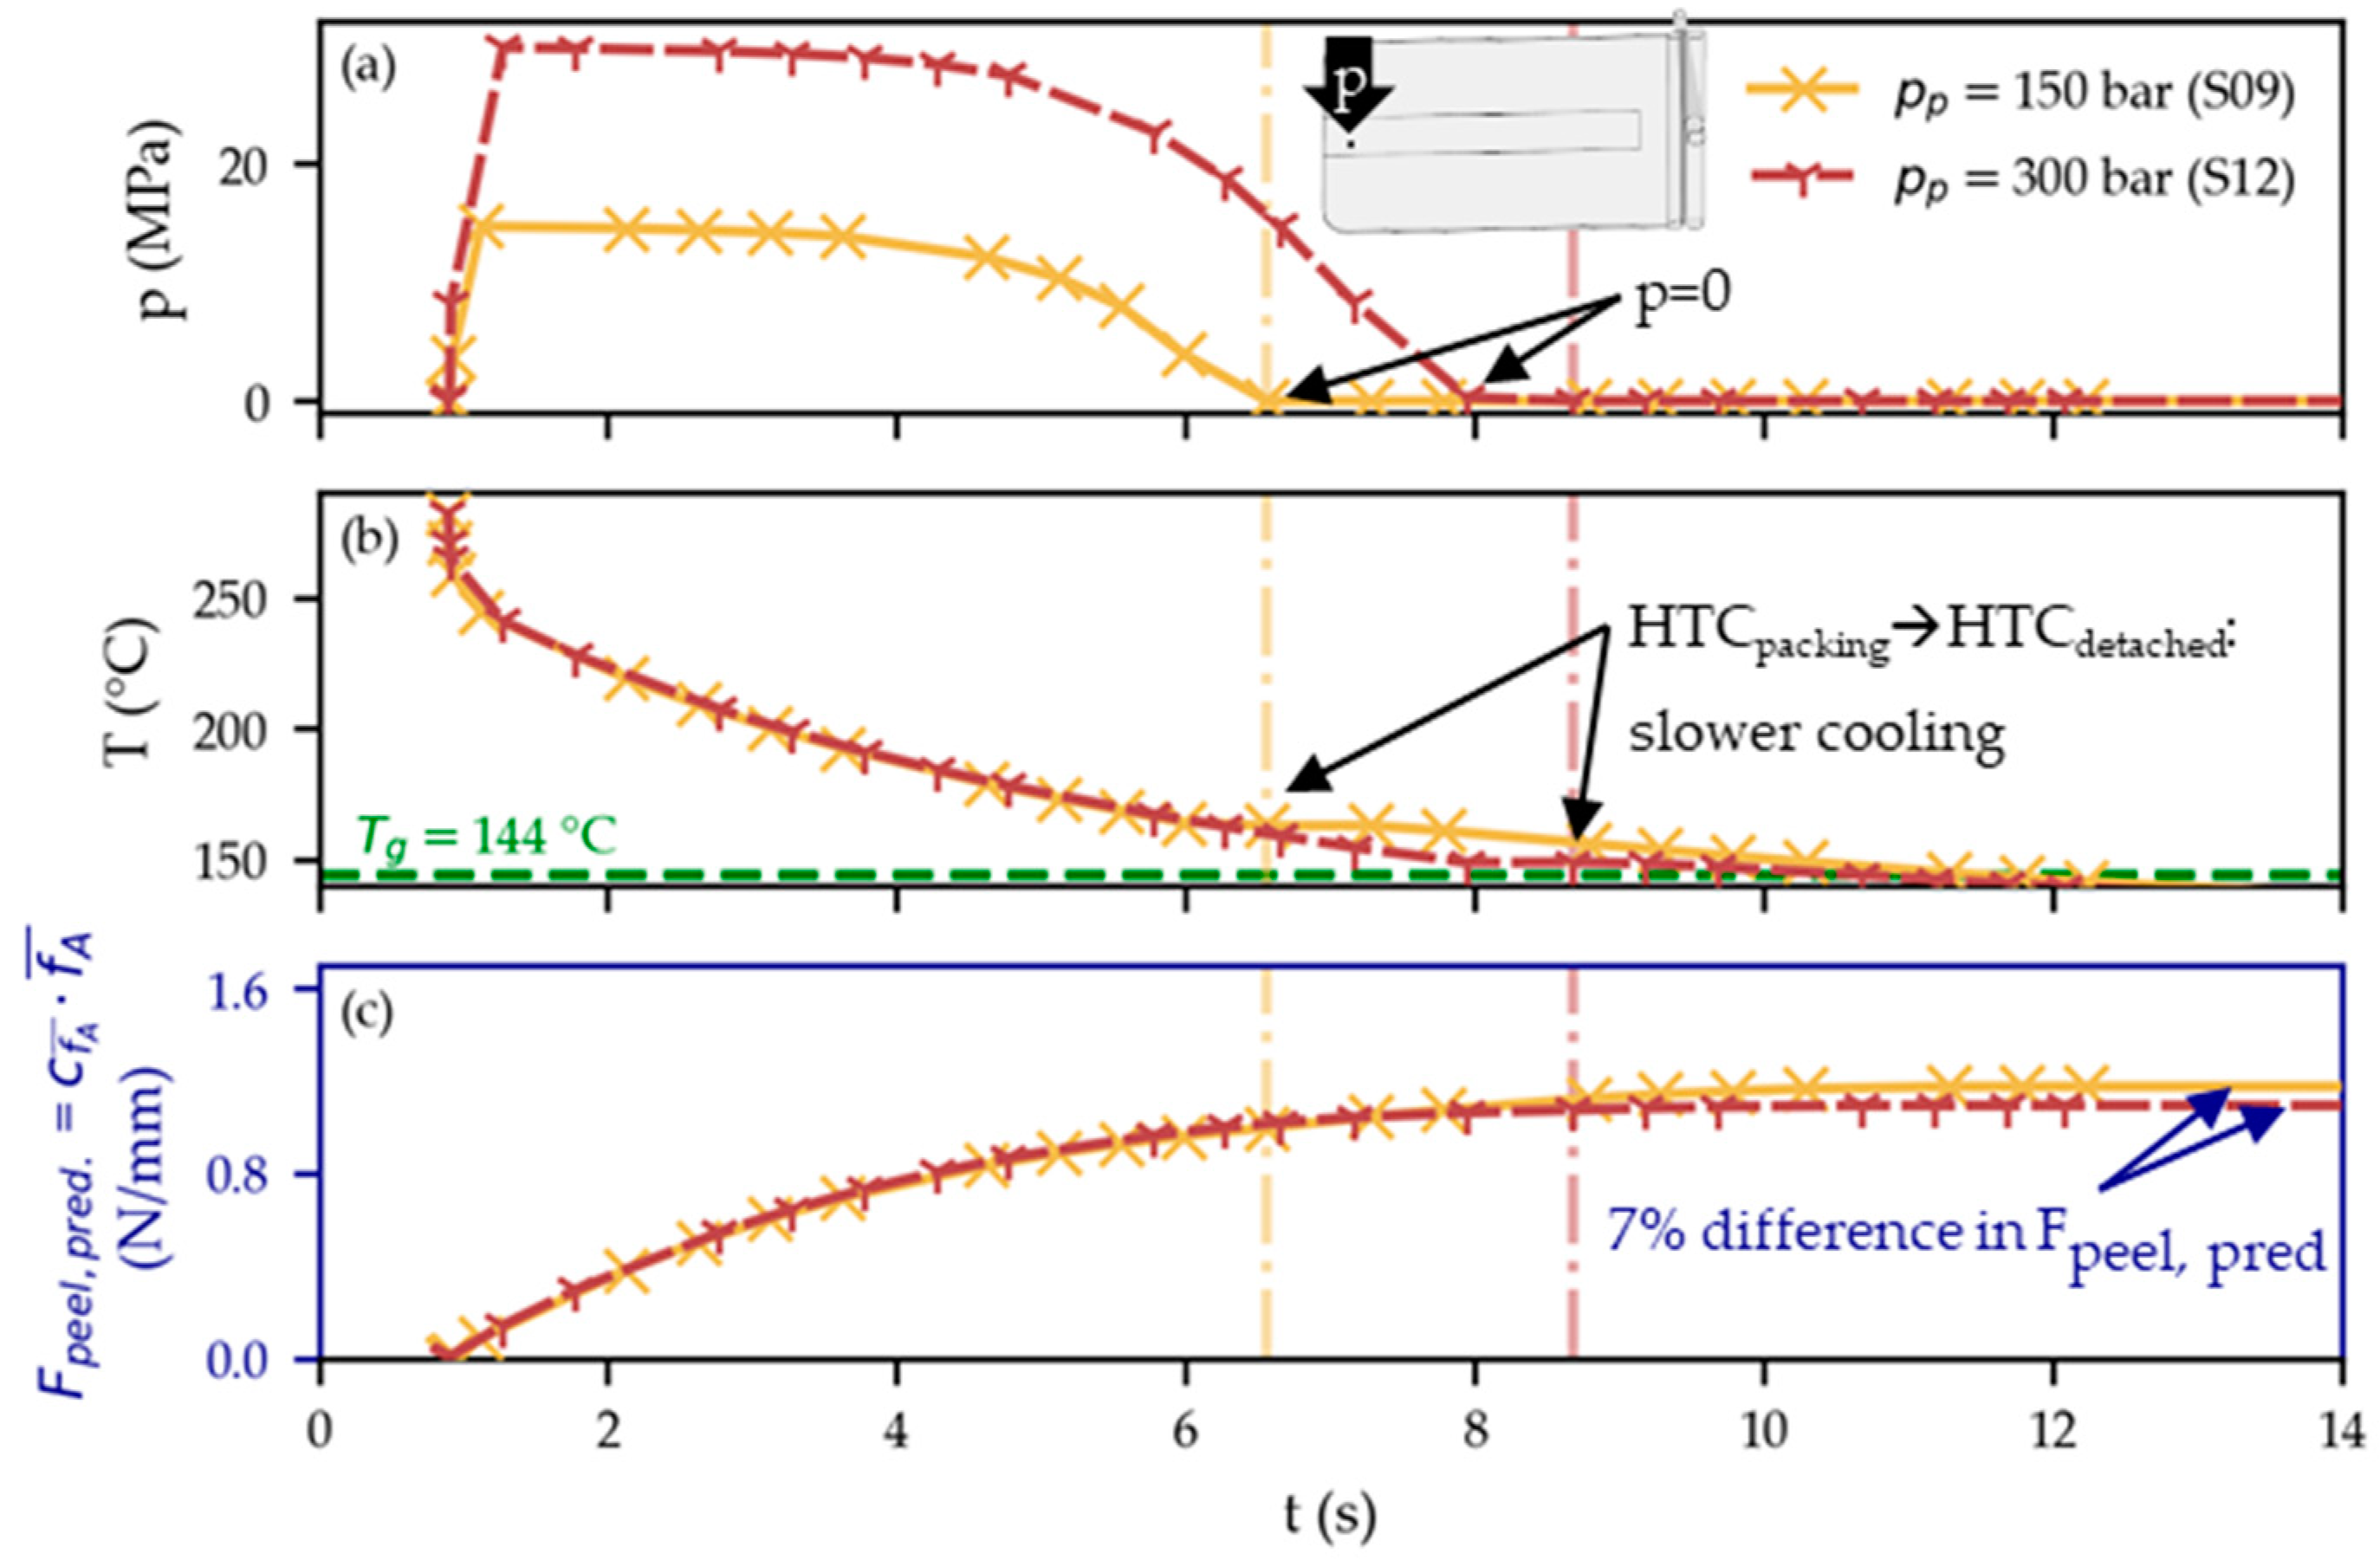
3.4. Analysis of Simulated DoE Concerning Peel Test Results
- ;
- ;
- .
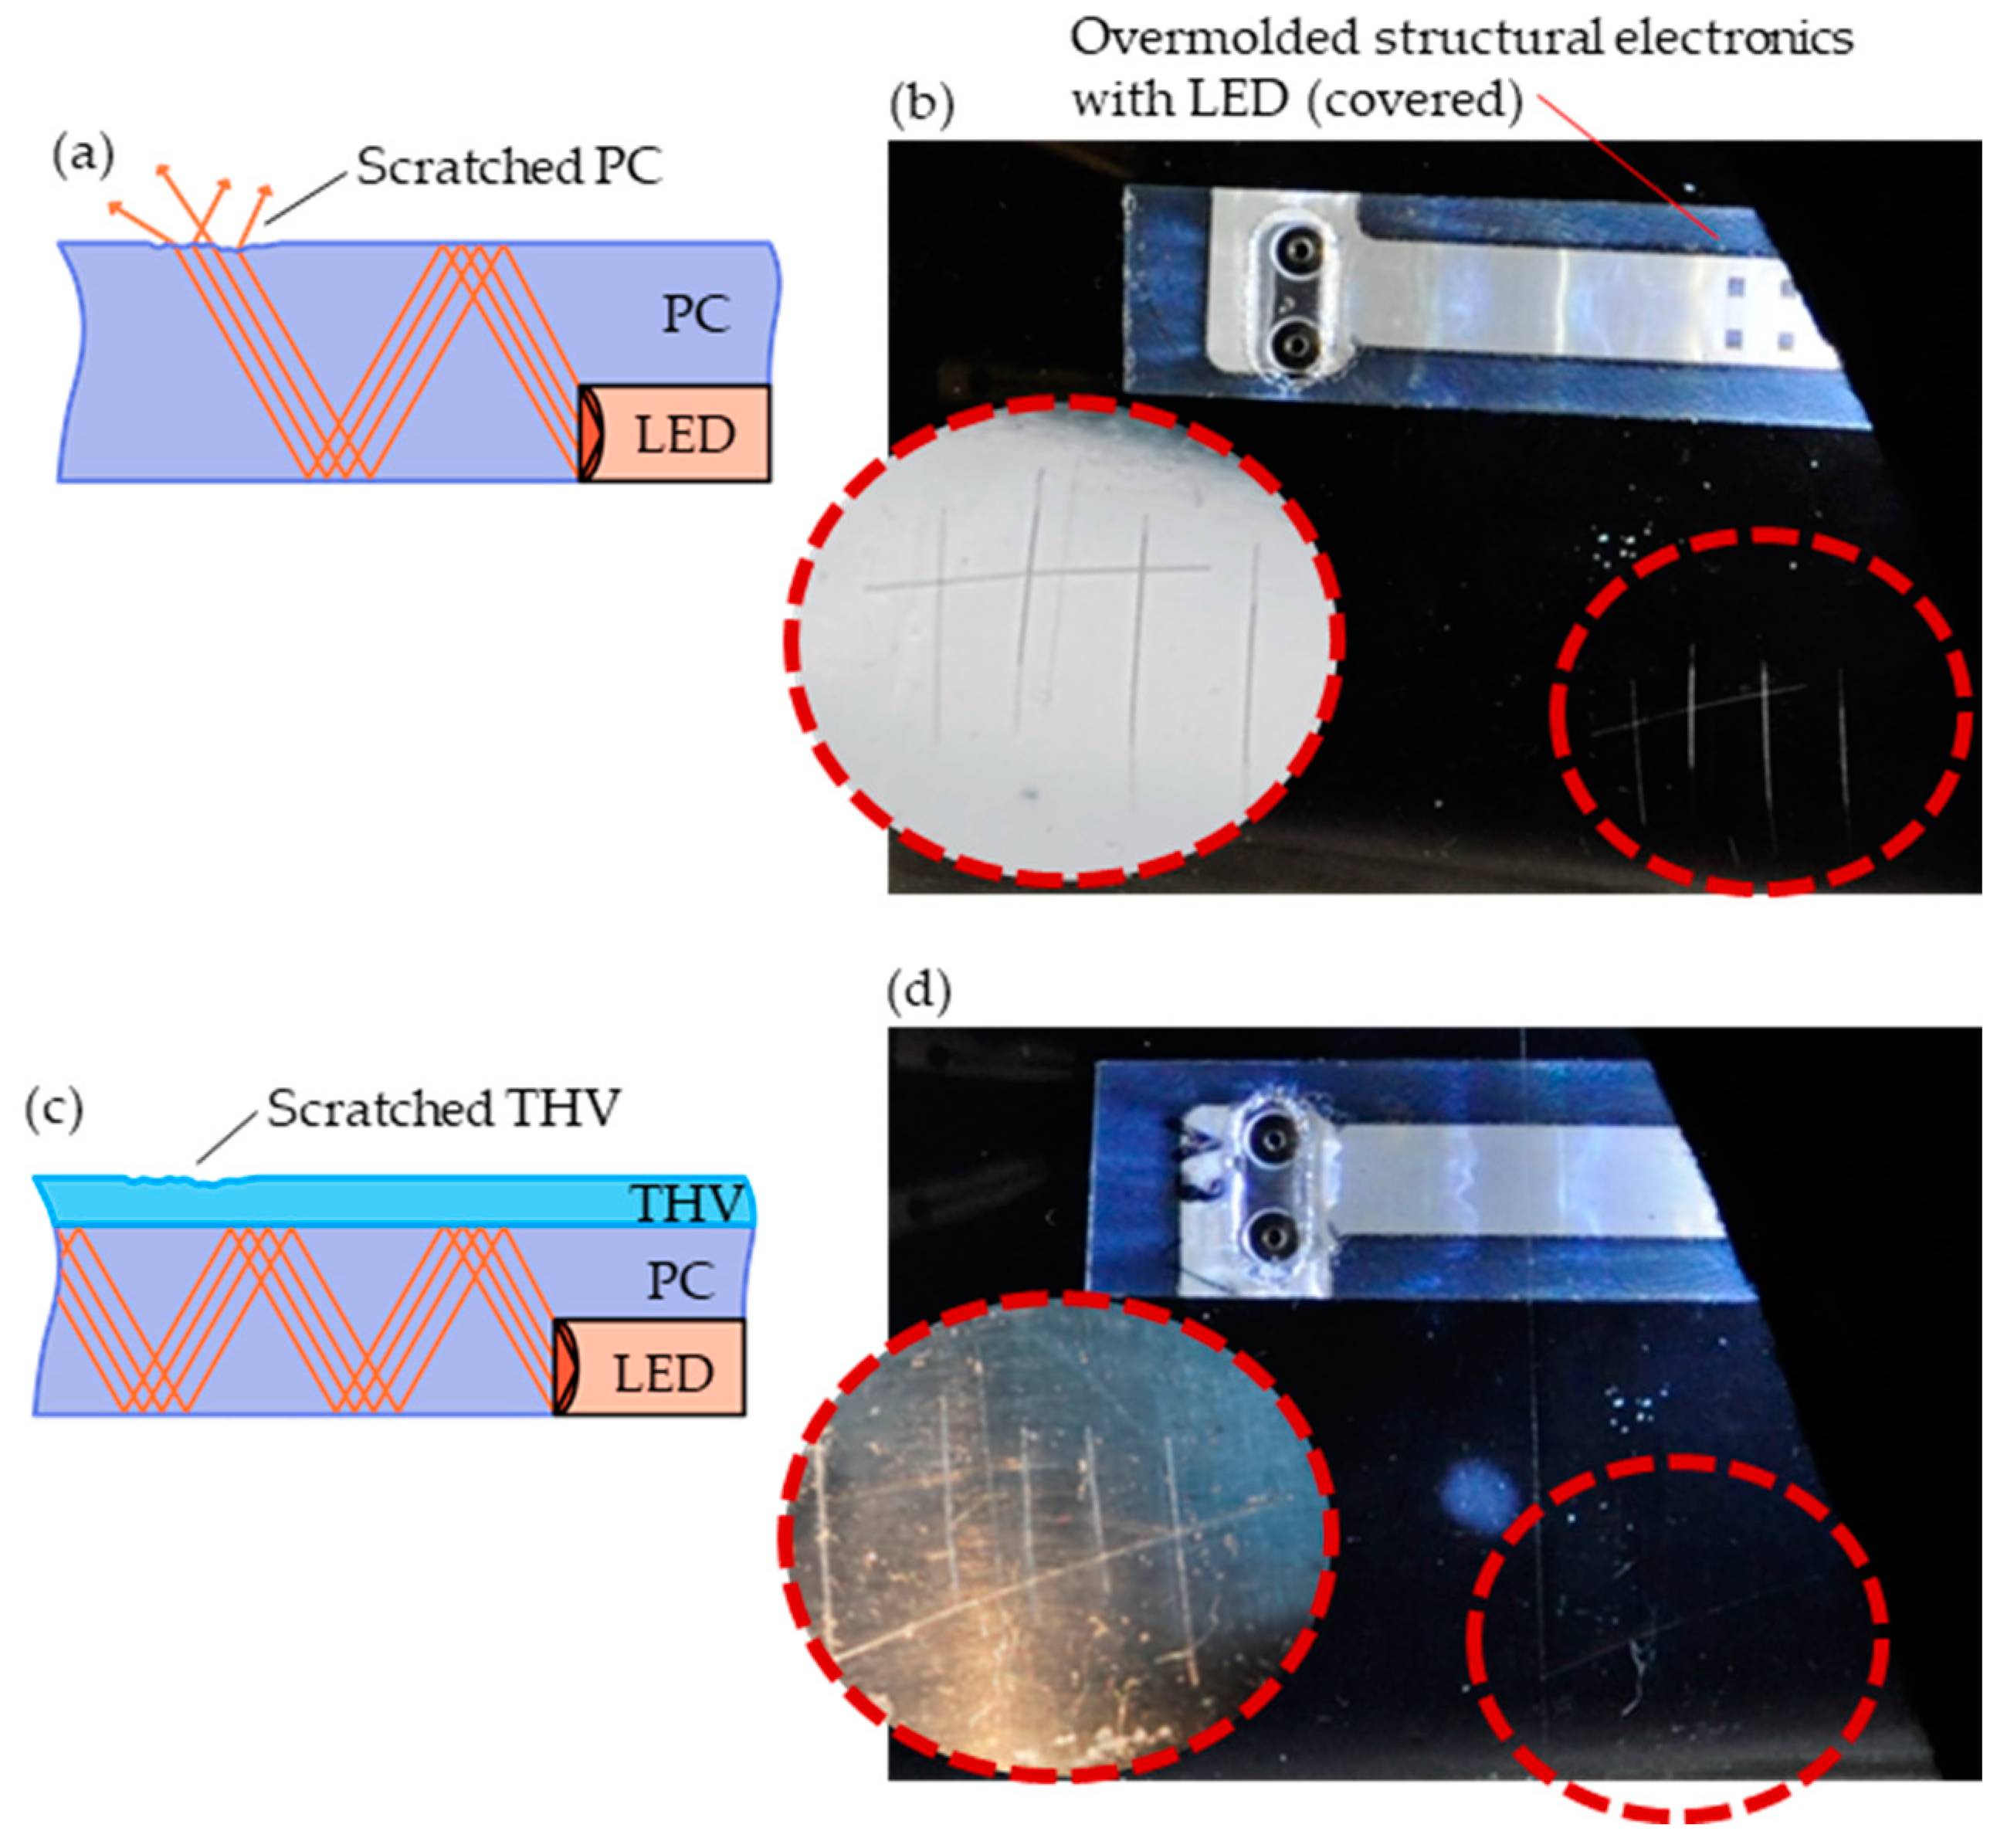
3.5. Application Concept
4. Conclusions
Author Contributions
Funding
Institutional Review Board Statement
Informed Consent Statement
Data Availability Statement
Conflicts of Interest
References
- Kao, H. In-Mold Decorating: A Review of Process and Technology. Plast. Eng. 2018, 74, 40–43. [Google Scholar] [CrossRef]
- Rusanen, O.; Simula, T.; Niskala, P.; Lindholm, V.; Heikkinen, M. Injection Molded Structural Electronics Brings Surfaces to Life. In Proceedings of the 2019 22nd European Microelectronics and Packaging Conference & Exhibition (EMPC), Pisa, Italy, 16–19 September 2019; pp. 1–7. [Google Scholar]
- Juntunen, E.; Ihme, S.; Huttunen, A.; Mäkinen, J.-T. R2R process for integrating LEDs on flexible substrate. In Proceedings of the 2017 IMAPS Nordic Conference on Microelectronics Packaging (NordPac), Gothenburg, Sweden, 18–20 June 2017; pp. 12–16. [Google Scholar]
- Wimmer, A.; Reichel, H.; Schmidt, K. New standards for 3D-userinterfaces-manufactured by a Film Insert Molding process. In Proceedings of the 2018 13th International Congress Molded Interconnect Devices (MID), Würzburg, Germany, 25–26 September 2018; pp. 1–5. [Google Scholar]
- Alajoki, T.; Koponen, M.; Tuomikoski, M.; Heikkinen, M.; Keränen, A.; Keränen, K.; Mäkinen, J.-T.; Aikio, J.; Rönkä, K. Hybrid in-mould integration for novel electrical and optical features in 3D plastic products. In Proceedings of the 2012 4th Electronic System-Integration Technology Conference, Amsterdam, The Netherlands, 17–20 September 2012; pp. 1–6. [Google Scholar]
- Uyor, U.O.; Popoola, A.P.I.; Popoola, O.M.; Aigbodion, V.S. Polymeric cladding materials under high temperature from optical fibre perspective: A review. Polym. Bull. 2020, 77, 2155–2177. [Google Scholar] [CrossRef]
- Moslan, M.S.; Othman, M.H.D.; Samavati, A.; Salim, M.A.M.; Rahman, M.A.; Ismail, A.F.; Bakhtiar, H.; Sokri, M.N.M. A new potential polymeric cladding material for polycarbonate fibre optic core for high temperature use. Opt. Fiber Technol. 2021, 67, 102723. [Google Scholar] [CrossRef]
- 3M Company. 3M™ Dyneon™ Fluoroplastic THV 500GZ. Available online: https://multimedia.3m.com/mws/media/688841O/td-thv-500gz-eng.pdf (accessed on 12 September 2013).
- SABIC. LEXAN™ RESIN OQ1028. Available online: https://www.sabic.com/en/products/documents/lexan-resin_oq1028_europe_technical_data_sheet/en (accessed on 23 September 2022).
- Leong, Y.W.; Yamaguchi, S.; Mizoguchi, M.; Hamada, H.; Ishiaku, U.S.; Tsujii, T. The effect of molding conditions on mechanical and morphological properties at the interface of film insert injection molded polypropylene-film/polypropylene matrix. Polym. Eng. Sci. 2004, 44, 2327–2334. [Google Scholar] [CrossRef]
- Hu, Z.; Zhang, A.; Wang, Z.; Li, Y. Study on the Influence of Process Parameters on Interface Strength of Film-insert Molding. IOP Conf. Ser. Mater. Sci. Eng. 2018, 436, 12023. [Google Scholar] [CrossRef]
- Leong, Y.W.; Kotaki, M.; Hamada, H. Effects of the molecular orientation and crystallization on film–substrate interfacial adhesion in poly(ethylene terephthalate) film-insert moldings. J. Appl. Polym. Sci. 2007, 104, 2100–2107. [Google Scholar] [CrossRef]
- Leong, Y.W.; Ishiaku, U.S.; Kotaki, M.; Hamada, H.; Yamaguchi, S. Interfacial characteristics of film insert molded polycarbonate film/polycarbonate-acrylonitrile-butadiene-styrene substrate, part 1: Influence of substrate molecular weight and film thickness. Polym. Eng. Sci. 2006, 46, 1674–1683. [Google Scholar] [CrossRef]
- Vetter, M.; Heinle, C.; Drummer, D.; Amesöder, S. Adhesive bonding between multi-material assembly injection molding parts with an adhesive interlayer. J. Polym. Eng. 2011, 31, 539–548. [Google Scholar] [CrossRef]
- Jiang, G.; Wu, H.; Yan, B.; Guo, S. Effect of a tie film on the enhanced interfacial adhesion between polyethylene and polyamide-6 in a sequential injection molding. Polym. Eng. Sci. 2010, 50, 719–729. [Google Scholar] [CrossRef]
- Liston, E.M.; Martinu, L.; Wertheimer, M.R. Plasma surface modification of polymers for improved adhesion: A critical review. J. Adhes. Sci. Technol. 1993, 7, 1091–1127. [Google Scholar] [CrossRef]
- Awaja, F.; Gilbert, M.; Kelly, G.; Fox, B.; Pigram, P.J. Adhesion of polymers. Prog. Polym. Sci. 2009, 34, 948–968. [Google Scholar] [CrossRef]
- Ladner, Y.; D’Orlyé, F.; Perréard, C.; Da Silva, B.; Guyon, C.; Tatoulian, M.; Griveau, S.; Bedioui, F.; Varenne, A. Surface Functionalization by Plasma Treatment and Click Chemistry of a New Family of Fluorinated Polymeric Materials for Microfluidic Chips. Plasma Process. Polym. 2014, 11, 518–523. [Google Scholar] [CrossRef]
- Vasilets, V.N.; Hermel, G.; König, U.; Werner, C.; Müller, M.; Simon, F.; Grundke, K.; Ikada, Y.; Jacobasch, H.-J. Microwave CO2 plasma-initiated vapour phase graft polymerization of acrylic acid onto polytetrafluoroethylene for immobilization of human thrombomodulin. Biomaterials 1997, 18, 1139–1145. [Google Scholar] [CrossRef] [PubMed]
- Barshilia, H.C.; Gupta, N. Superhydrophobic polytetrafluoroethylene surfaces with leaf-like micro-protrusions through Ar + O2 plasma etching process. Vacuum 2014, 99, 42–48. [Google Scholar] [CrossRef]
- Vandencasteele, N.; Nisol, B.; Viville, P.; Lazzaroni, R.; Castner, D.G.; Reniers, F. Study of plasma modified-PTFE for biological applications: Relationship between protein resistant properties, plasma treatment, surface composition and surface roughness. Plasma Process. Polym. 2008, 5, 661–671. [Google Scholar] [CrossRef] [Green Version]
- Prada, T.; Harnchana, V.; Lakhonchai, A.; Chingsungnoen, A.; Poolcharuansin, P.; Chanlek, N.; Klamchuen, A.; Thongbai, P.; Amornkitbamrung, V. Enhancement of output power density in a modified polytetrafluoroethylene surface using a sequential O2/Ar plasma etching for triboelectric nanogenerator applications. Nano Res. 2022, 15, 272–279. [Google Scholar] [CrossRef]
- Kleppmann, W. Versuchsplanung: Produkte und Prozesse Optimieren, 9th ed.; Hanser: München, Germany, 2016; ISBN 3446447164. [Google Scholar]
- Autodesk Inc. 3D Flow Derivation|Moldflow Insight|Autodesk Knowledge Network. Available online: https://knowledge.autodesk.com/support/moldflow-insight/learn-explore/caas/CloudHelp/cloudhelp/2018/ENU/MoldflowInsight/files/GUID-C94D0362-421F-4EC1-89A6-931BB8D6D365-htm.html (accessed on 13 May 2022).
- Polyfluor Plastics bv. THV (Terpolymer of Tetrafluoroethylene, Hexafluoropropylene and Vinylidene Fluoride). Available online: https://www.polyfluor.nl/assets/files/datasheet-thv-uk.pdf (accessed on 12 September 2022).
- Autodesk Inc. Temperature at Flow Front Result|Moldflow Insight 2019|Autodesk Knowledge Network. Available online: https://knowledge.autodesk.com/support/moldflow-insight/learn-explore/caas/CloudHelp/cloudhelp/2019/ENU/MoldflowInsight-Results/files/GUID-2BC51F30-583F-4E5C-8824-1BF7BAF0A144-htm.html (accessed on 11 September 2022).
- Autodesk Inc. Temperature Result|Moldflow Insight 2019|Autodesk Knowledge Network. Available online: https://knowledge.autodesk.com/support/moldflow-insight/learn-explore/caas/CloudHelp/cloudhelp/2019/ENU/MoldflowInsight-Results/files/GUID-FCDF1A71-D059-4DD3-9FB9-D7469053D2A6-htm.html (accessed on 11 September 2022).
- Autodesk Inc. Synergy Application Programming Interface (API). Available online: https://help.autodesk.com/view/MFIA/2021/ENU/?guid=GUID-853E86EF-7294-424D-81AE-E38130C237A4 (accessed on 21 March 2022).
- The SciPy Community. Scipy.optimize.root_scalar—SciPy v1.9.1 Manual. Available online: https://docs.scipy.org/doc/scipy/reference/generated/scipy.optimize.root_scalar.html (accessed on 13 September 2022).
- The SciPy Community. Scipy.integrate.quad—SciPy v1.8.0 Manual. Available online: https://docs.scipy.org/doc/scipy/reference/generated/scipy.integrate.quad.html (accessed on 13 May 2022).
- The SciPy Community. Scipy.optimize.curve_fit—SciPy v1.9.1 Manual. Available online: https://docs.scipy.org/doc/scipy/reference/generated/scipy.optimize.curve_fit.html (accessed on 11 September 2022).
- Khairallah, Y.; Arefi, F.; Amouroux, J. Surface fluorination of polyethylene films by different CF4 glow discharges: Effects of frequency and electrode configuration. Thin Solid Films 1994, 241, 295–300. [Google Scholar] [CrossRef]
- Roy, S.; Yue, C.Y.; Lam, Y.C.; Wang, Z.Y.; Hu, H. Surface analysis, hydrophilic enhancement, ageing behavior and flow in plasma modified cyclic olefin copolymer (COC)-based microfluidic devices. Sens. Actuators B Chem. 2010, 150, 537–549. [Google Scholar] [CrossRef]
- Roy, S.; Yue, C.Y. Surface Modification of COC Microfluidic Devices: A Comparative Study of Nitrogen Plasma Treatment and its Advantages Over Argon and Oxygen Plasma Treatments. Plasma Process. Polym. 2011, 8, 432–443. [Google Scholar] [CrossRef]
- Gwyddion. Statistical Analysis: Chapter 4. Data Processing and Analysis. Available online: http://gwyddion.net/documentation/user-guide-en/statistical-analysis.html (accessed on 19 January 2023).
- Minitab Inc. Understanding Test for Equal Variances—Minitab. Available online: https://support.minitab.com/en-us/minitab/21/help-and-how-to/statistical-modeling/anova/supporting-topics/basics/understanding-test-for-equal-variances/ (accessed on 28 September 2022).
- Box, G.E.P.; Cox, D.R. An Analysis of Transformations. J. R. Stat. Society. Ser. B (Methodol.) 1964, 26, 211–252. [Google Scholar] [CrossRef]
- Heinle, M.; Drummer, D. Heat Transfer Coefficient in Injection Molding of Polymers. Int. Polym. Process. 2015, 30, 434–441. [Google Scholar] [CrossRef]
- Austrian Research Promotion Agency. COMET Project: Smart@Surface—Advanced Sensors, Materials, Actuators, Reactive User Interfaces and Illumination Technologies for Smart Object Surfaces. COMET Factsheet. Available online: https://www.ffg.at/sites/default/files/allgemeine_downloads/strukturprogramme/COMET/Factsheets_Projekte_EN/Factsheet_SmartSurface_EN_bf_neu.pdf (accessed on 19 January 2023).


| Pressure (mTorr) | Forward Power (W) | Flow (sccm) |
|---|---|---|
| 40 | 100 | 50 |
| Setting | A: Packing Pressure (bar) | B: Injection Speed (cm³/s) | C: Melt Temperature (°C) | D: Mold Temperature (°C) |
|---|---|---|---|---|
| S01 | 300 | 30 | 340 | 60 |
| S02 | 150 | 70 | 340 | 60 |
| S03 | 150 | 30 | 310 | 60 |
| S04 | 300 | 70 | 310 | 60 |
| S06 | 300 | 30 | 310 | 120 |
| S07 | 150 | 70 | 310 | 120 |
| S08 | 300 | 70 | 340 | 120 |
| S09 | 150 | 30 | 340 | 120 |
| S10 | 150 | 30 | 310 | 120 |
| S11 | 300 | 70 | 310 | 120 |
| S12 | 300 | 30 | 340 | 120 |
| S13 | 150 | 70 | 340 | 120 |
| S14 | 300 | 30 | 310 | 60 |
| S15 | 150 | 70 | 310 | 60 |
| S16 | 150 | 30 | 340 | 60 |
| S17 | 300 | 70 | 340 | 60 |
| S05 (CtPt) | 225 | 50 | 325 | 90 |
| HTCFilling (W/(m2·K)) | HTCPacking (W/(m2·K)) | HTCDetached (W/(m2·K)) |
|---|---|---|
| 5000 | 2500 | 1250 |
| Element | Pristine THV | Plasma-Treated THV |
|---|---|---|
| F 1s | 61.8% | 55.3% |
| C 1s | 38.2% | 42.3% |
| O 1s | - | 2.5% |
| Factor | p-Value | Factor | p-Value |
|---|---|---|---|
| A | 0.003 | B | 0.000 |
| C | 0.000 | D | 0.000 |
| CtPt | 0.234 |
Disclaimer/Publisher’s Note: The statements, opinions and data contained in all publications are solely those of the individual author(s) and contributor(s) and not of MDPI and/or the editor(s). MDPI and/or the editor(s) disclaim responsibility for any injury to people or property resulting from any ideas, methods, instructions or products referred to in the content. |
© 2023 by the authors. Licensee MDPI, Basel, Switzerland. This article is an open access article distributed under the terms and conditions of the Creative Commons Attribution (CC BY) license (https://creativecommons.org/licenses/by/4.0/).
Share and Cite
Hubmann, M.; Groten, J.; Pletz, M.; Grießer, T.; Plevová, K.; Nemitz, W.; Stadlober, B. Influence of Injection Molding Parameters on the Peel Strength between Plasma-Treated Fluoropolymer Films and Polycarbonate. Polymers 2023, 15, 1568. https://doi.org/10.3390/polym15061568
Hubmann M, Groten J, Pletz M, Grießer T, Plevová K, Nemitz W, Stadlober B. Influence of Injection Molding Parameters on the Peel Strength between Plasma-Treated Fluoropolymer Films and Polycarbonate. Polymers. 2023; 15(6):1568. https://doi.org/10.3390/polym15061568
Chicago/Turabian StyleHubmann, Martin, Jonas Groten, Martin Pletz, Thomas Grießer, Kateřina Plevová, Wolfgang Nemitz, and Barbara Stadlober. 2023. "Influence of Injection Molding Parameters on the Peel Strength between Plasma-Treated Fluoropolymer Films and Polycarbonate" Polymers 15, no. 6: 1568. https://doi.org/10.3390/polym15061568