

Visco-Elastic and Thermal Properties of Microbiologically Synthesized Polyhydroxyalkanoate Plasticized with Triethyl Citrate

 , ,
, ,
Abstract
:1. Introduction
2. Materials and Methods
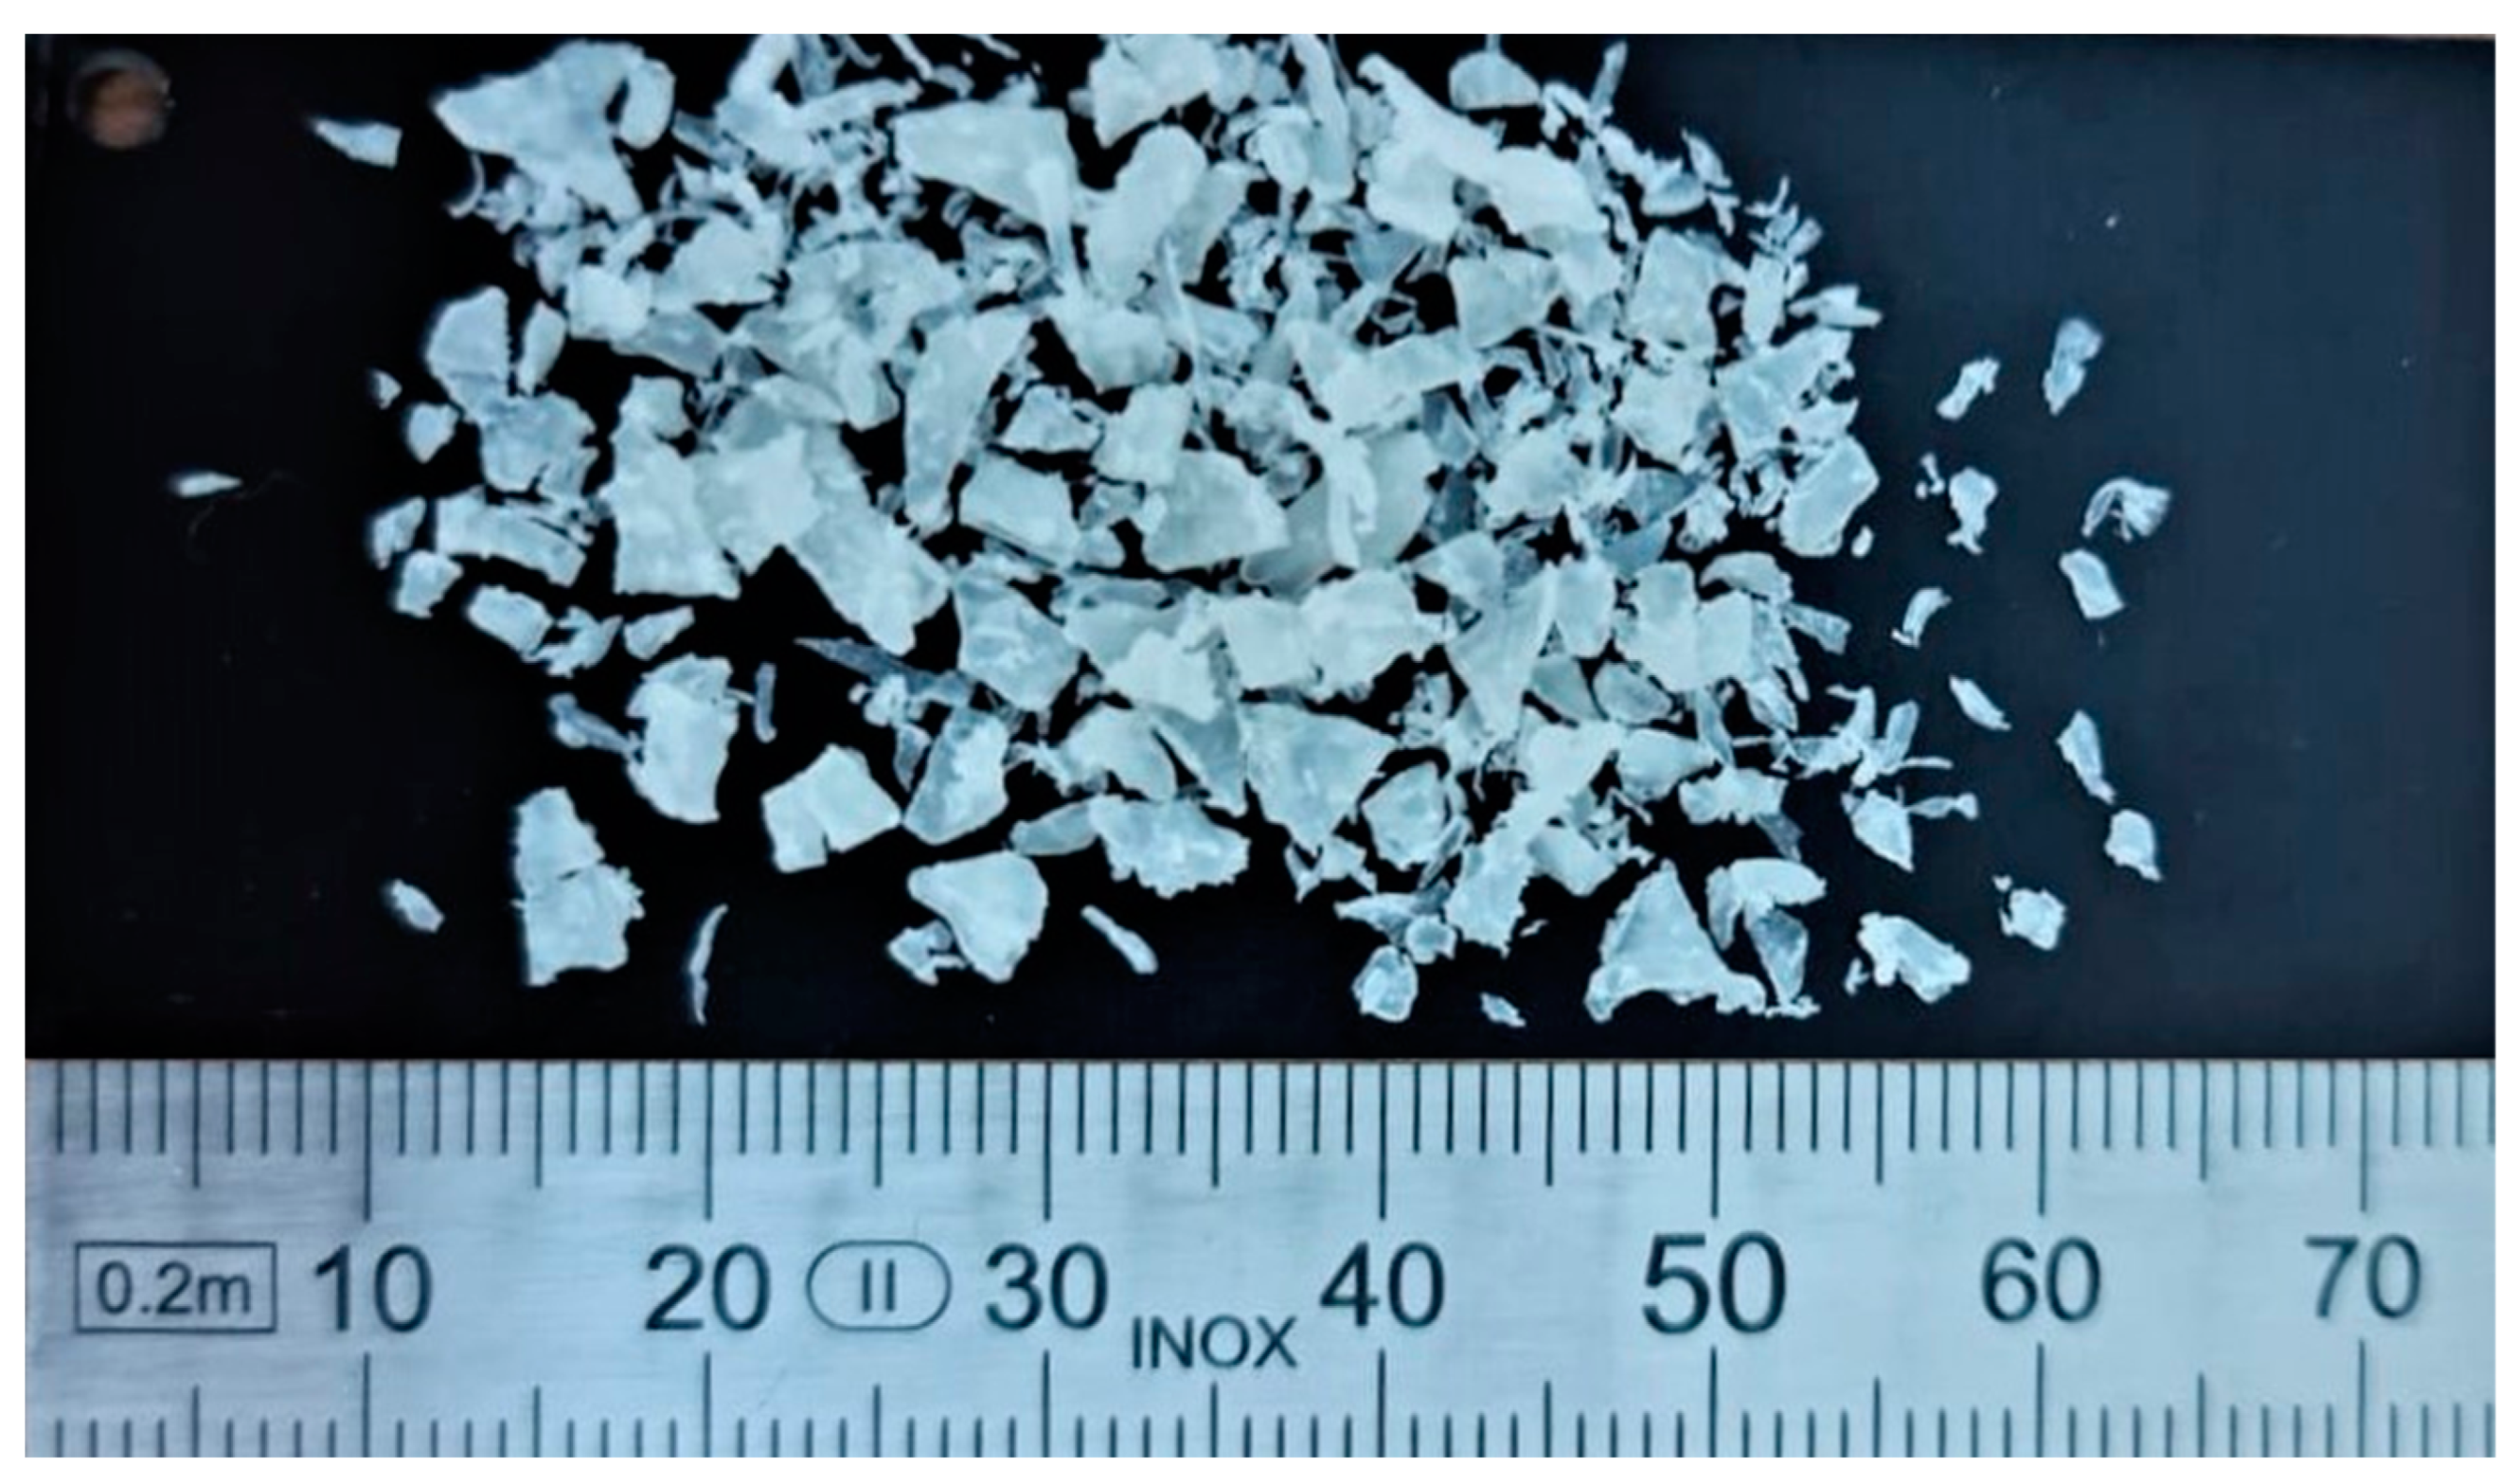
2.1. Materials
2.2. Preparation of Plasticized Systems
2.3. Characterization Methods
2.3.1. Molecular Weight (Mw)
2.3.2. Fourier Transform Infrared Spectroscopy (FT−IR)
2.3.3. Thermogravimetric Analysis (TGA)
2.3.4. Differential Scanning Calorimetry (DSC)
2.3.5. Oscillatory Shear Rheology
2.3.6. Tensile Properties
2.3.7. Dynamic Mechanical Thermal Analysis (DMTA)
3. Results
3.1. Molecular Weight
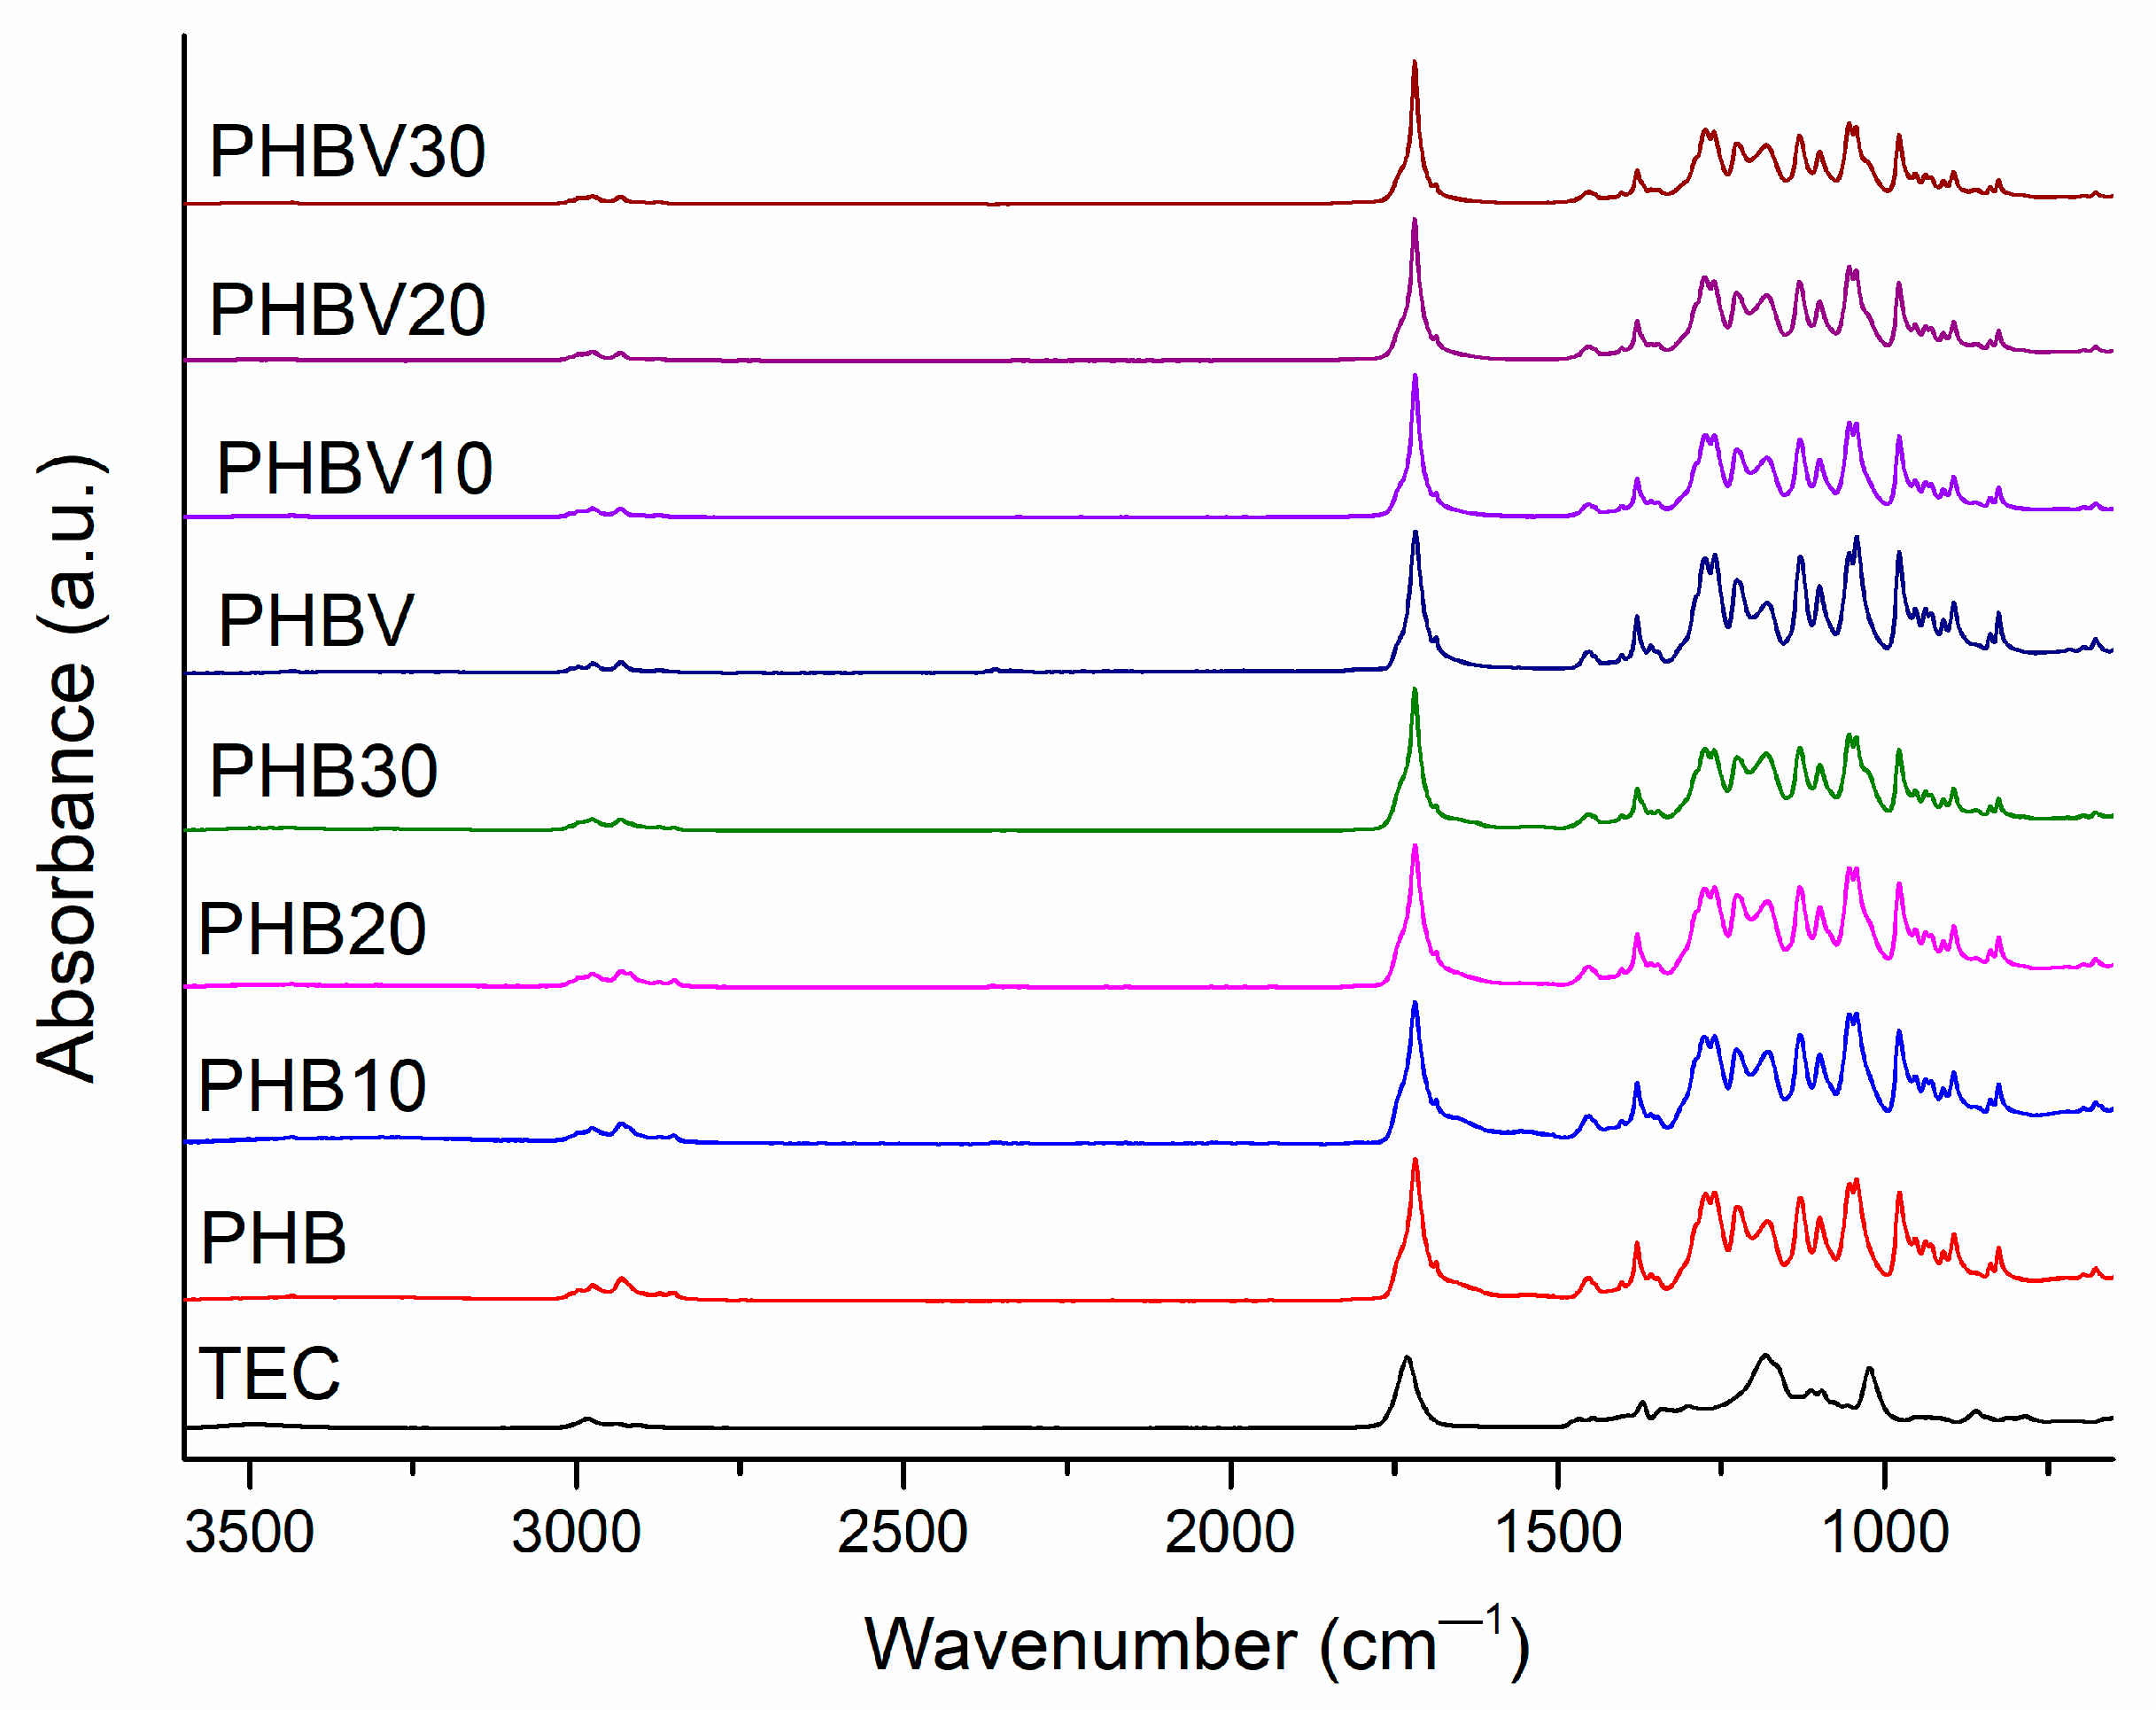
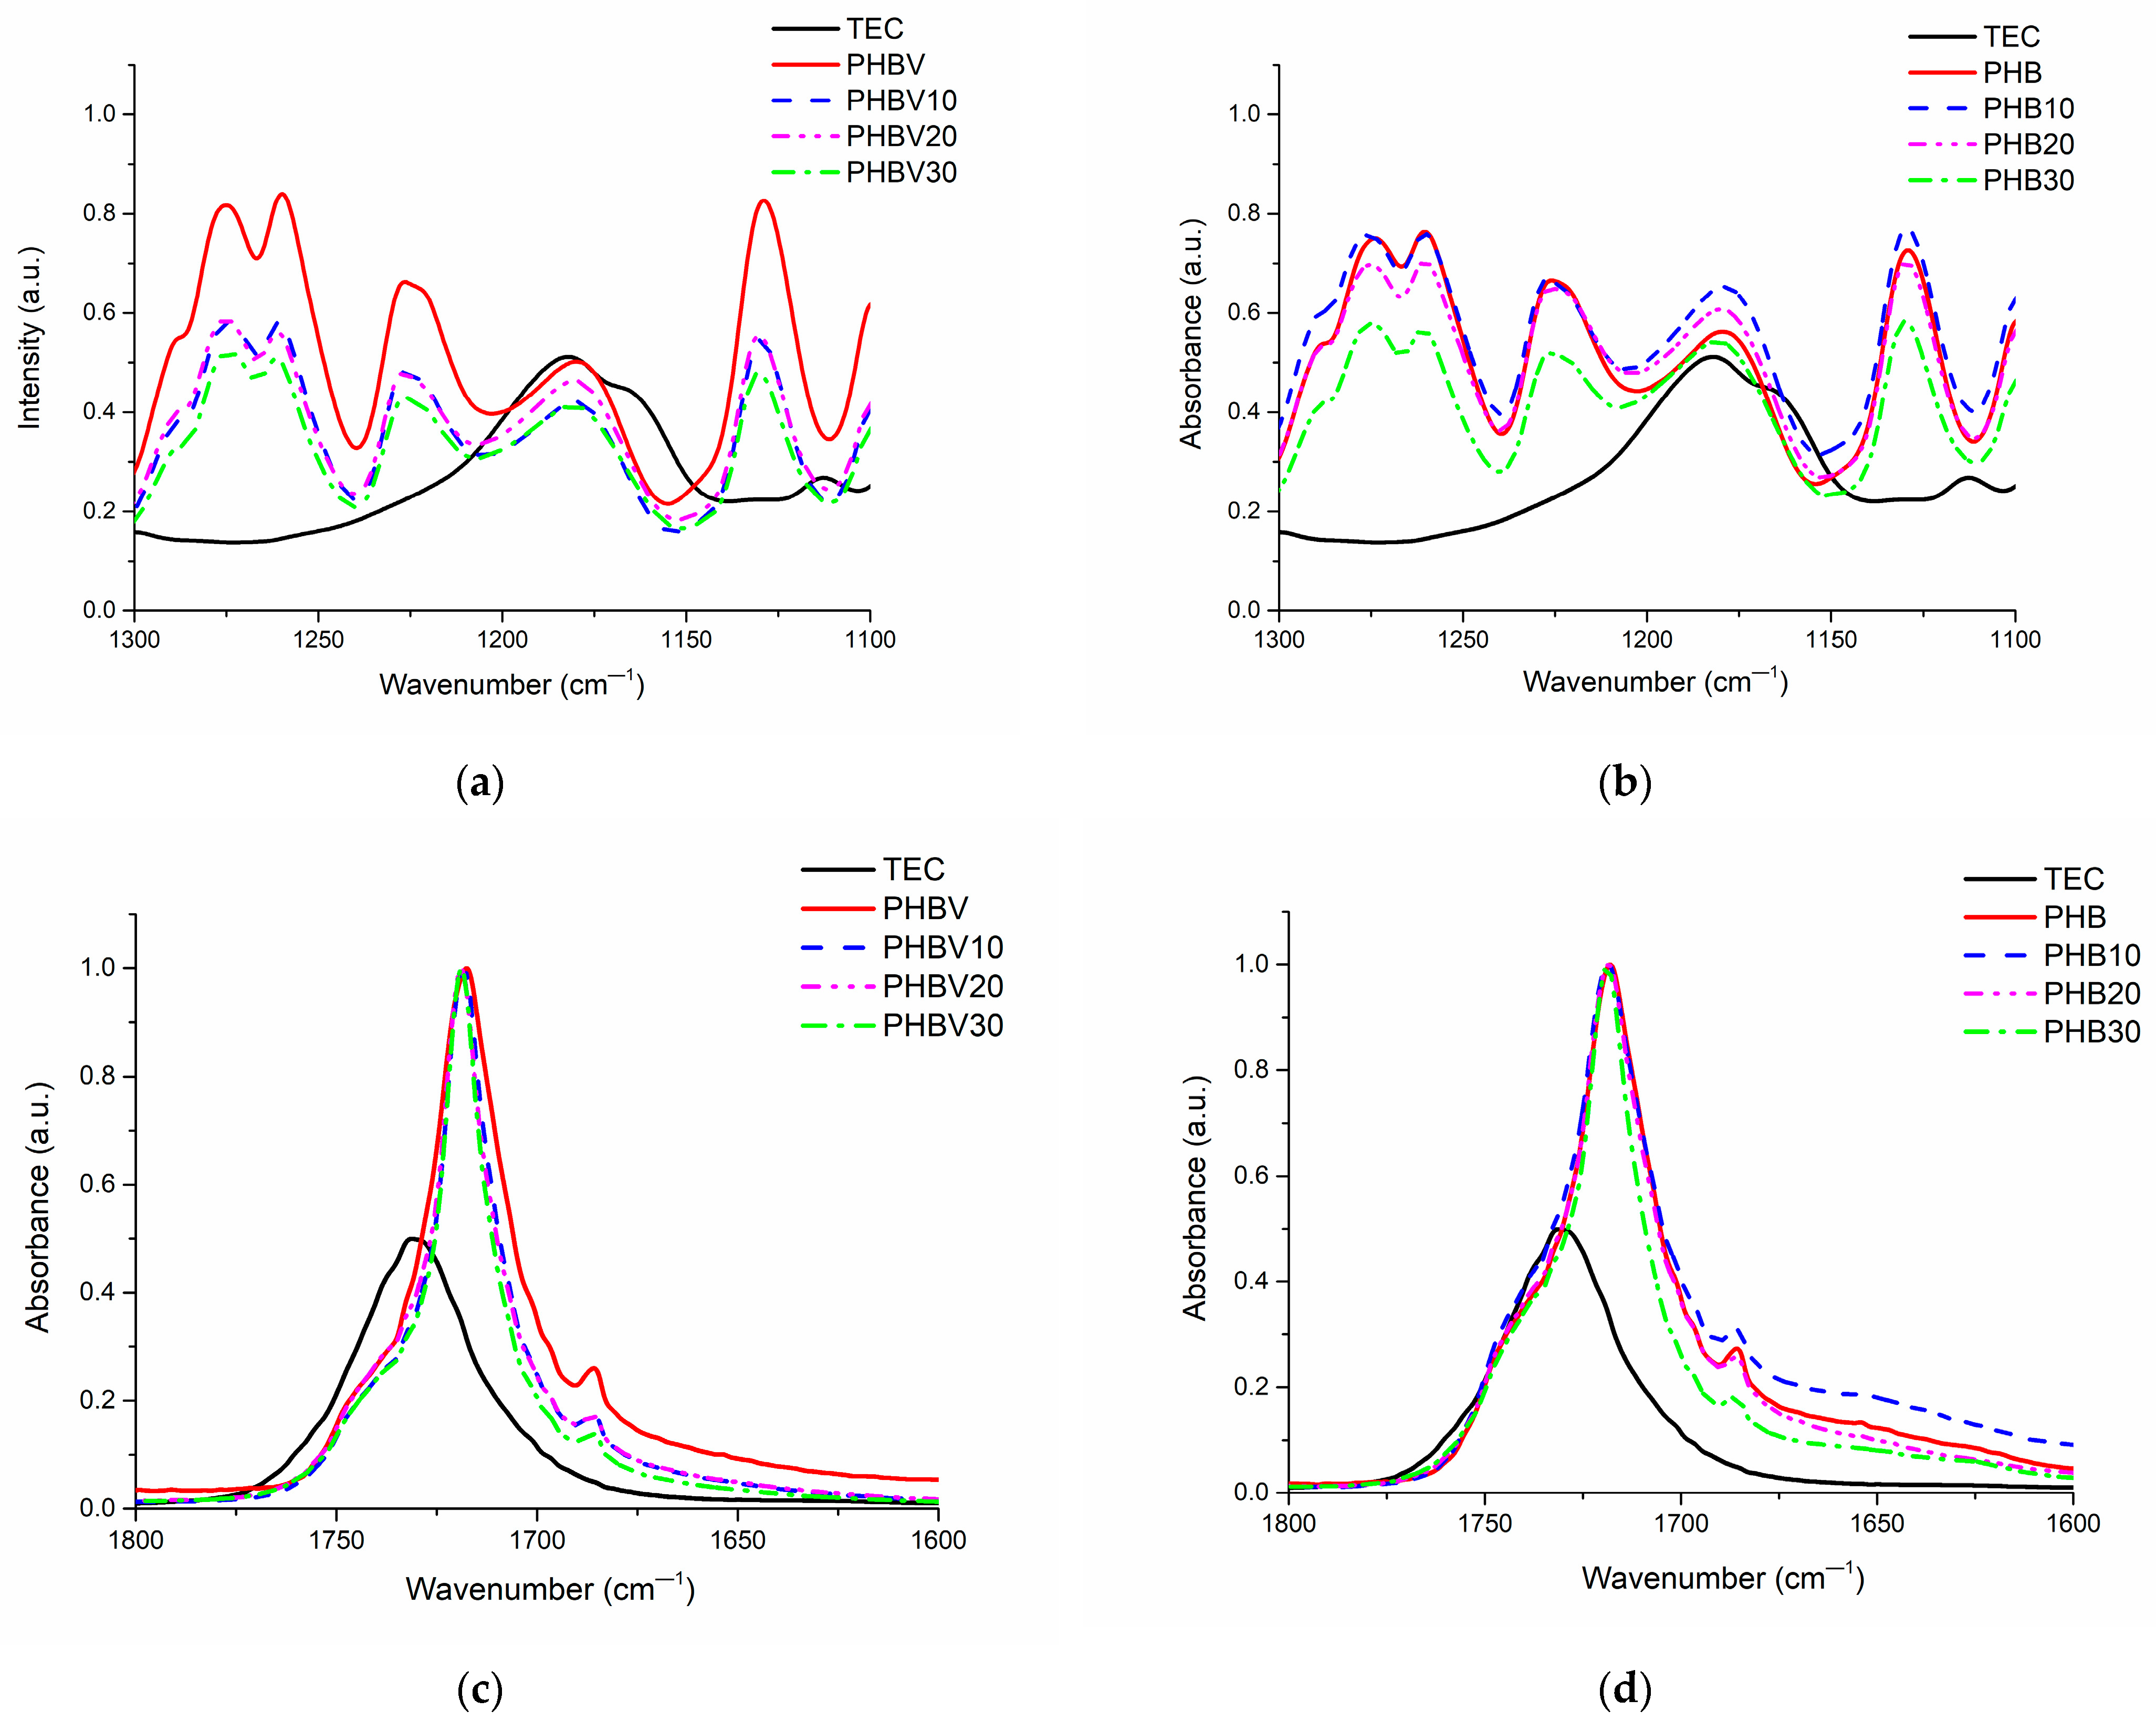
3.2. Fourier-Transform Infrared Spectroscopy (FT-IR)
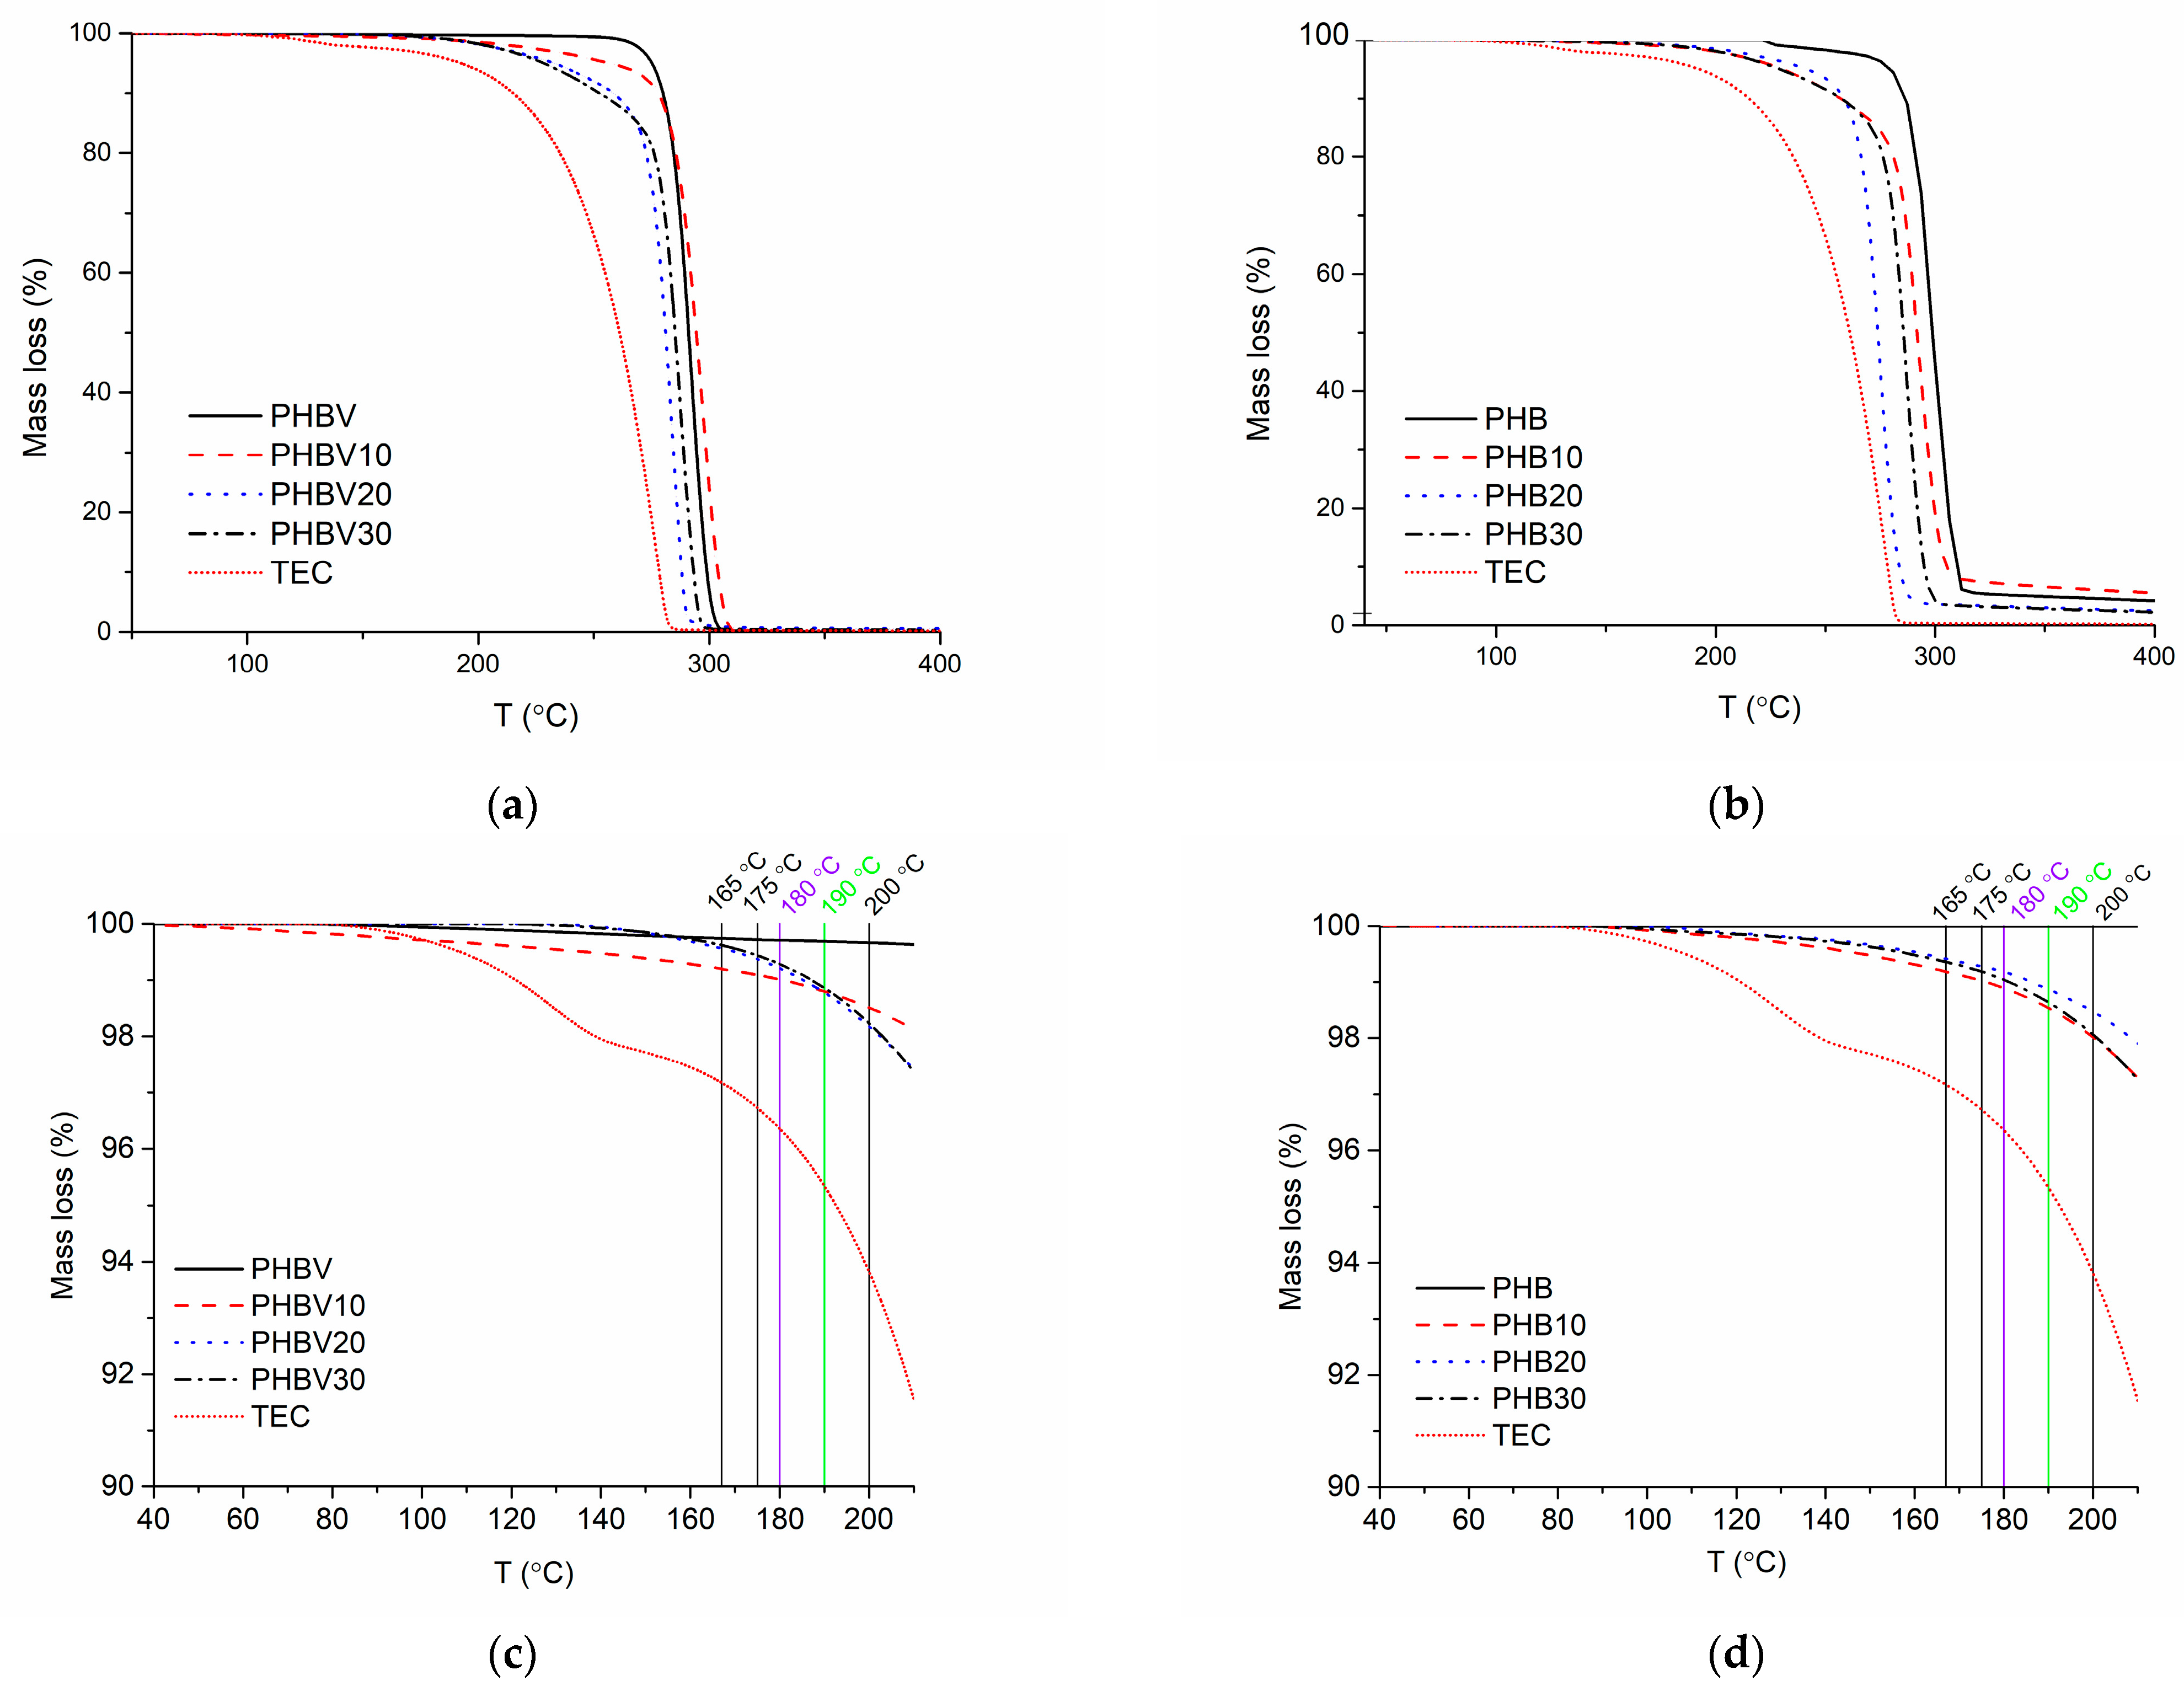
3.3. Thermal Gravimetric Analysis (TGA)
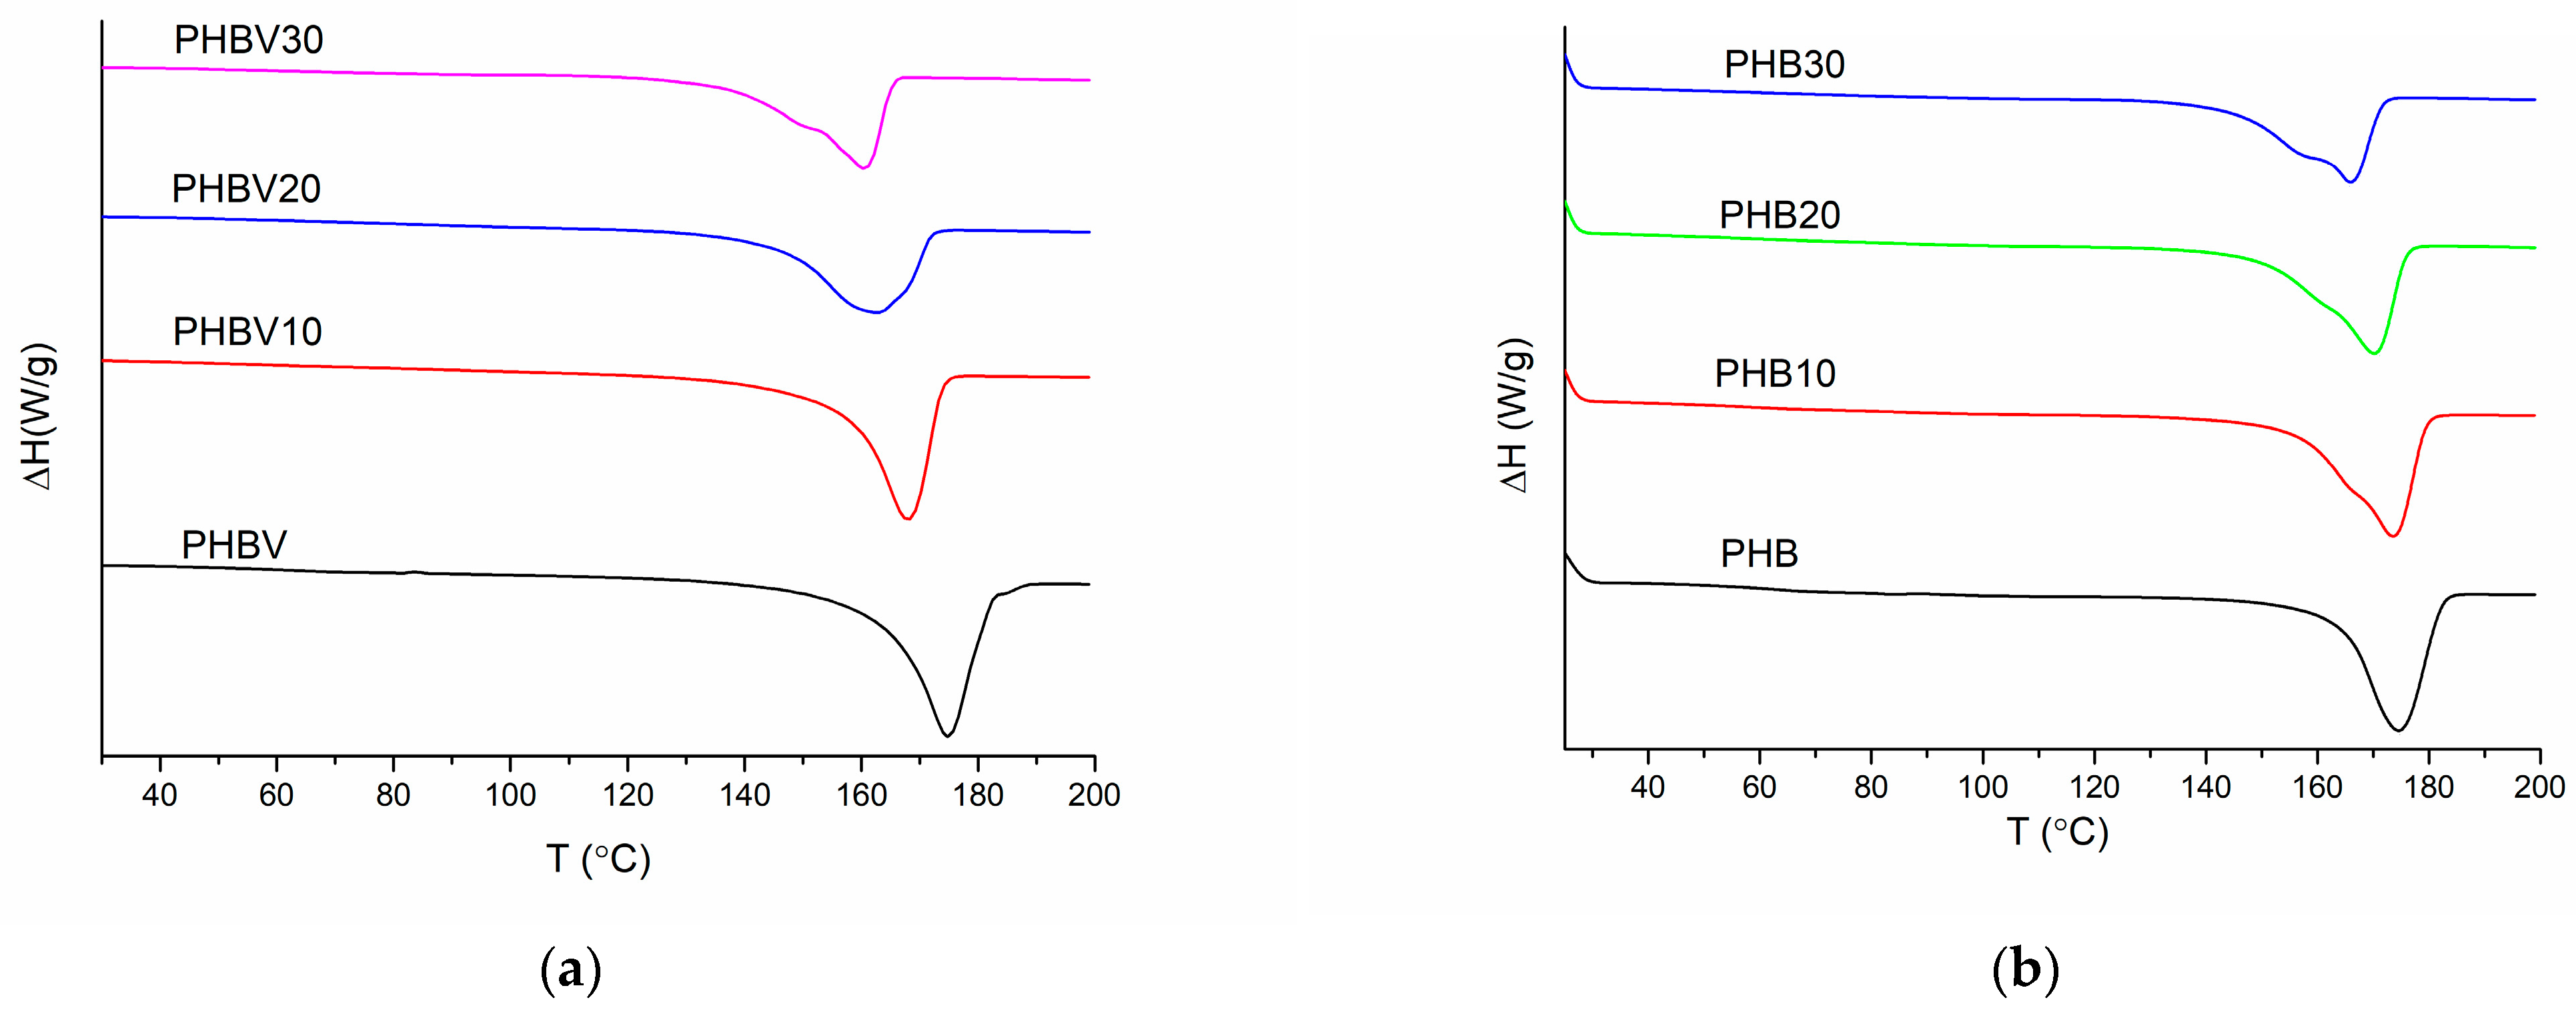
3.4. Differential Scanning Calorimetry (DSC)
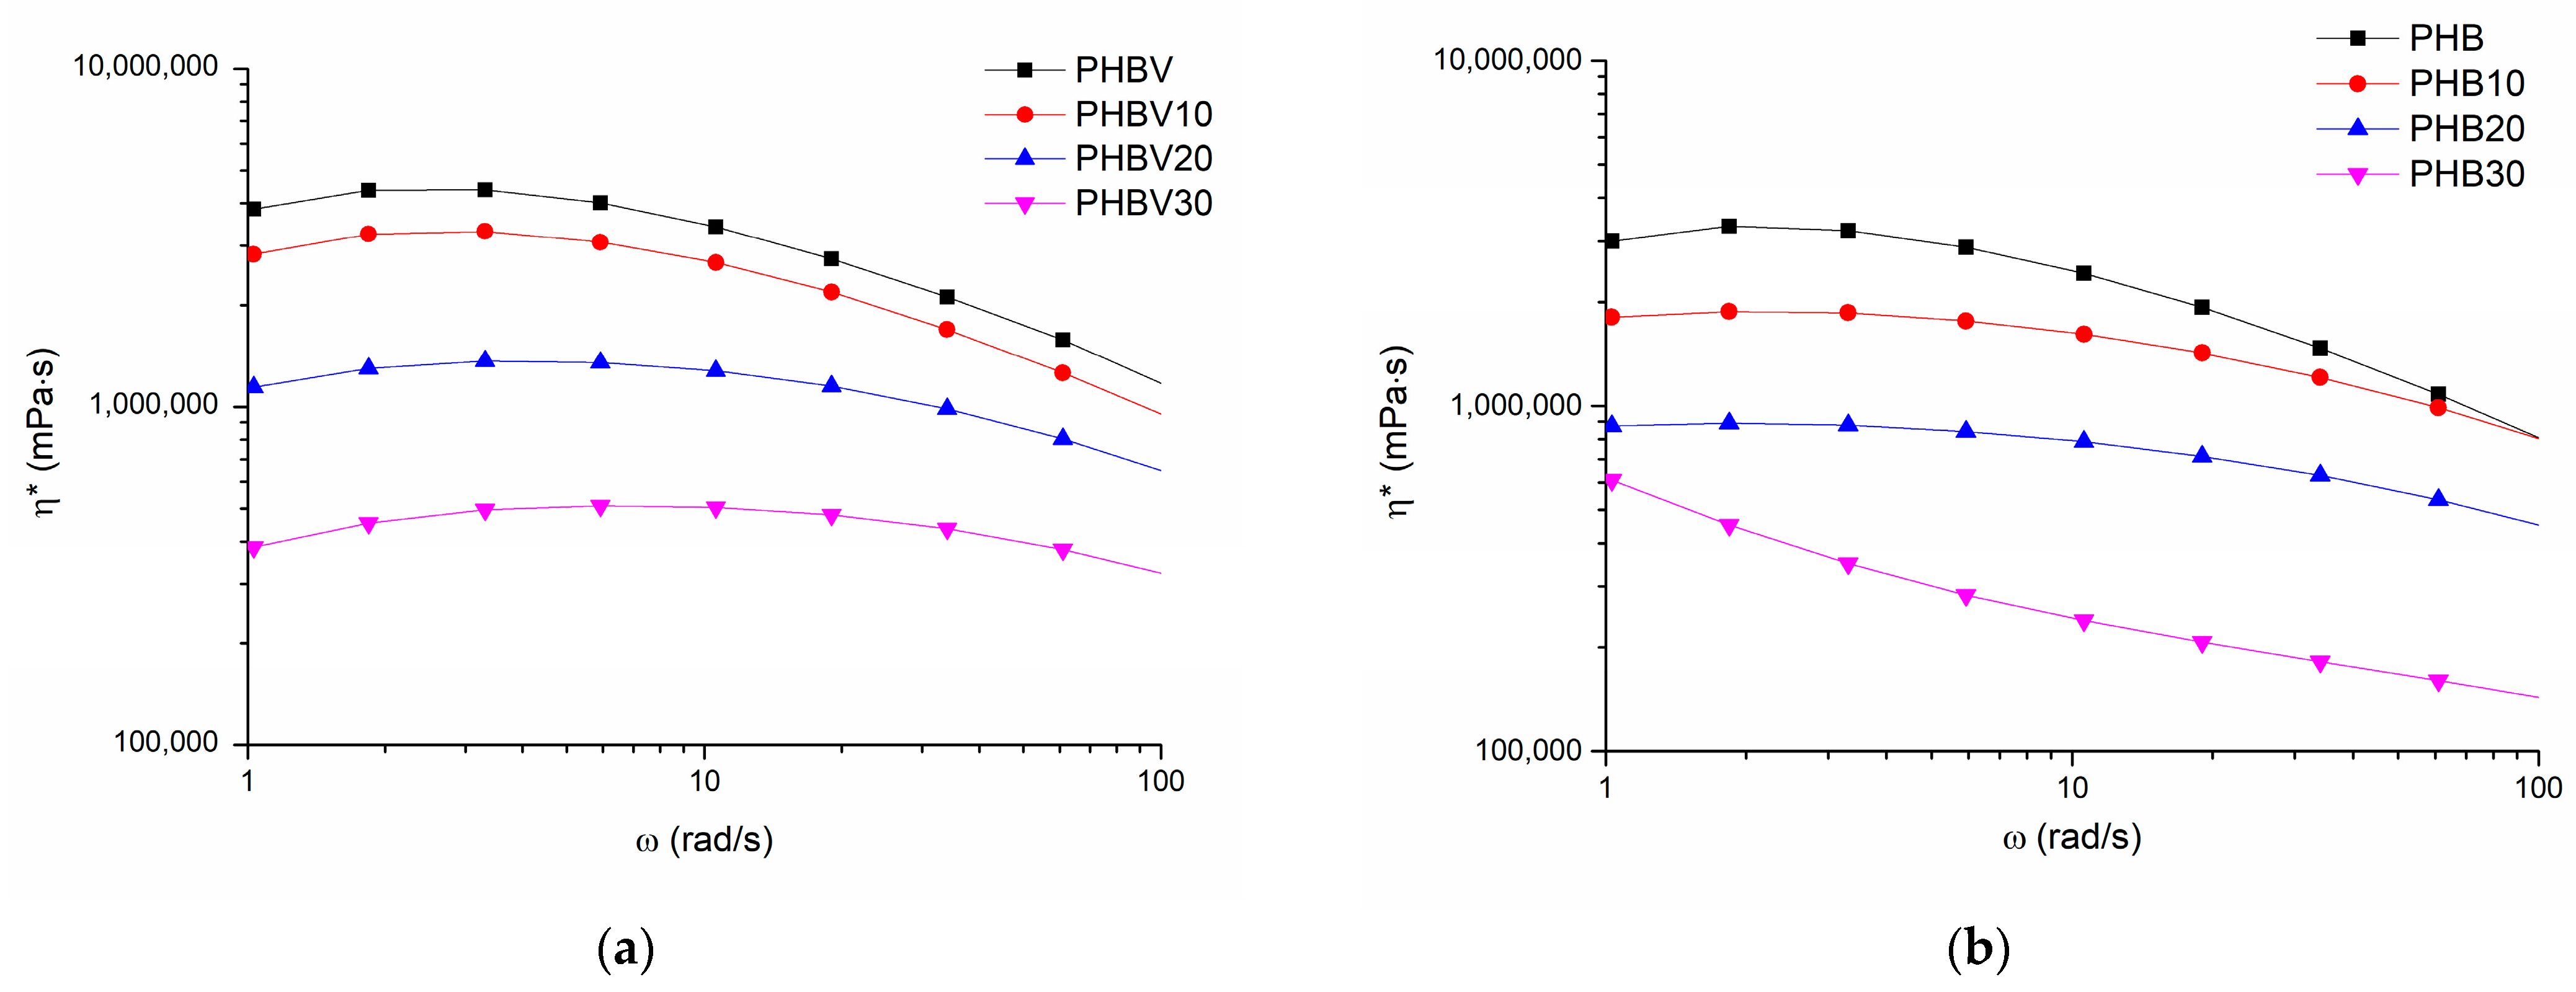
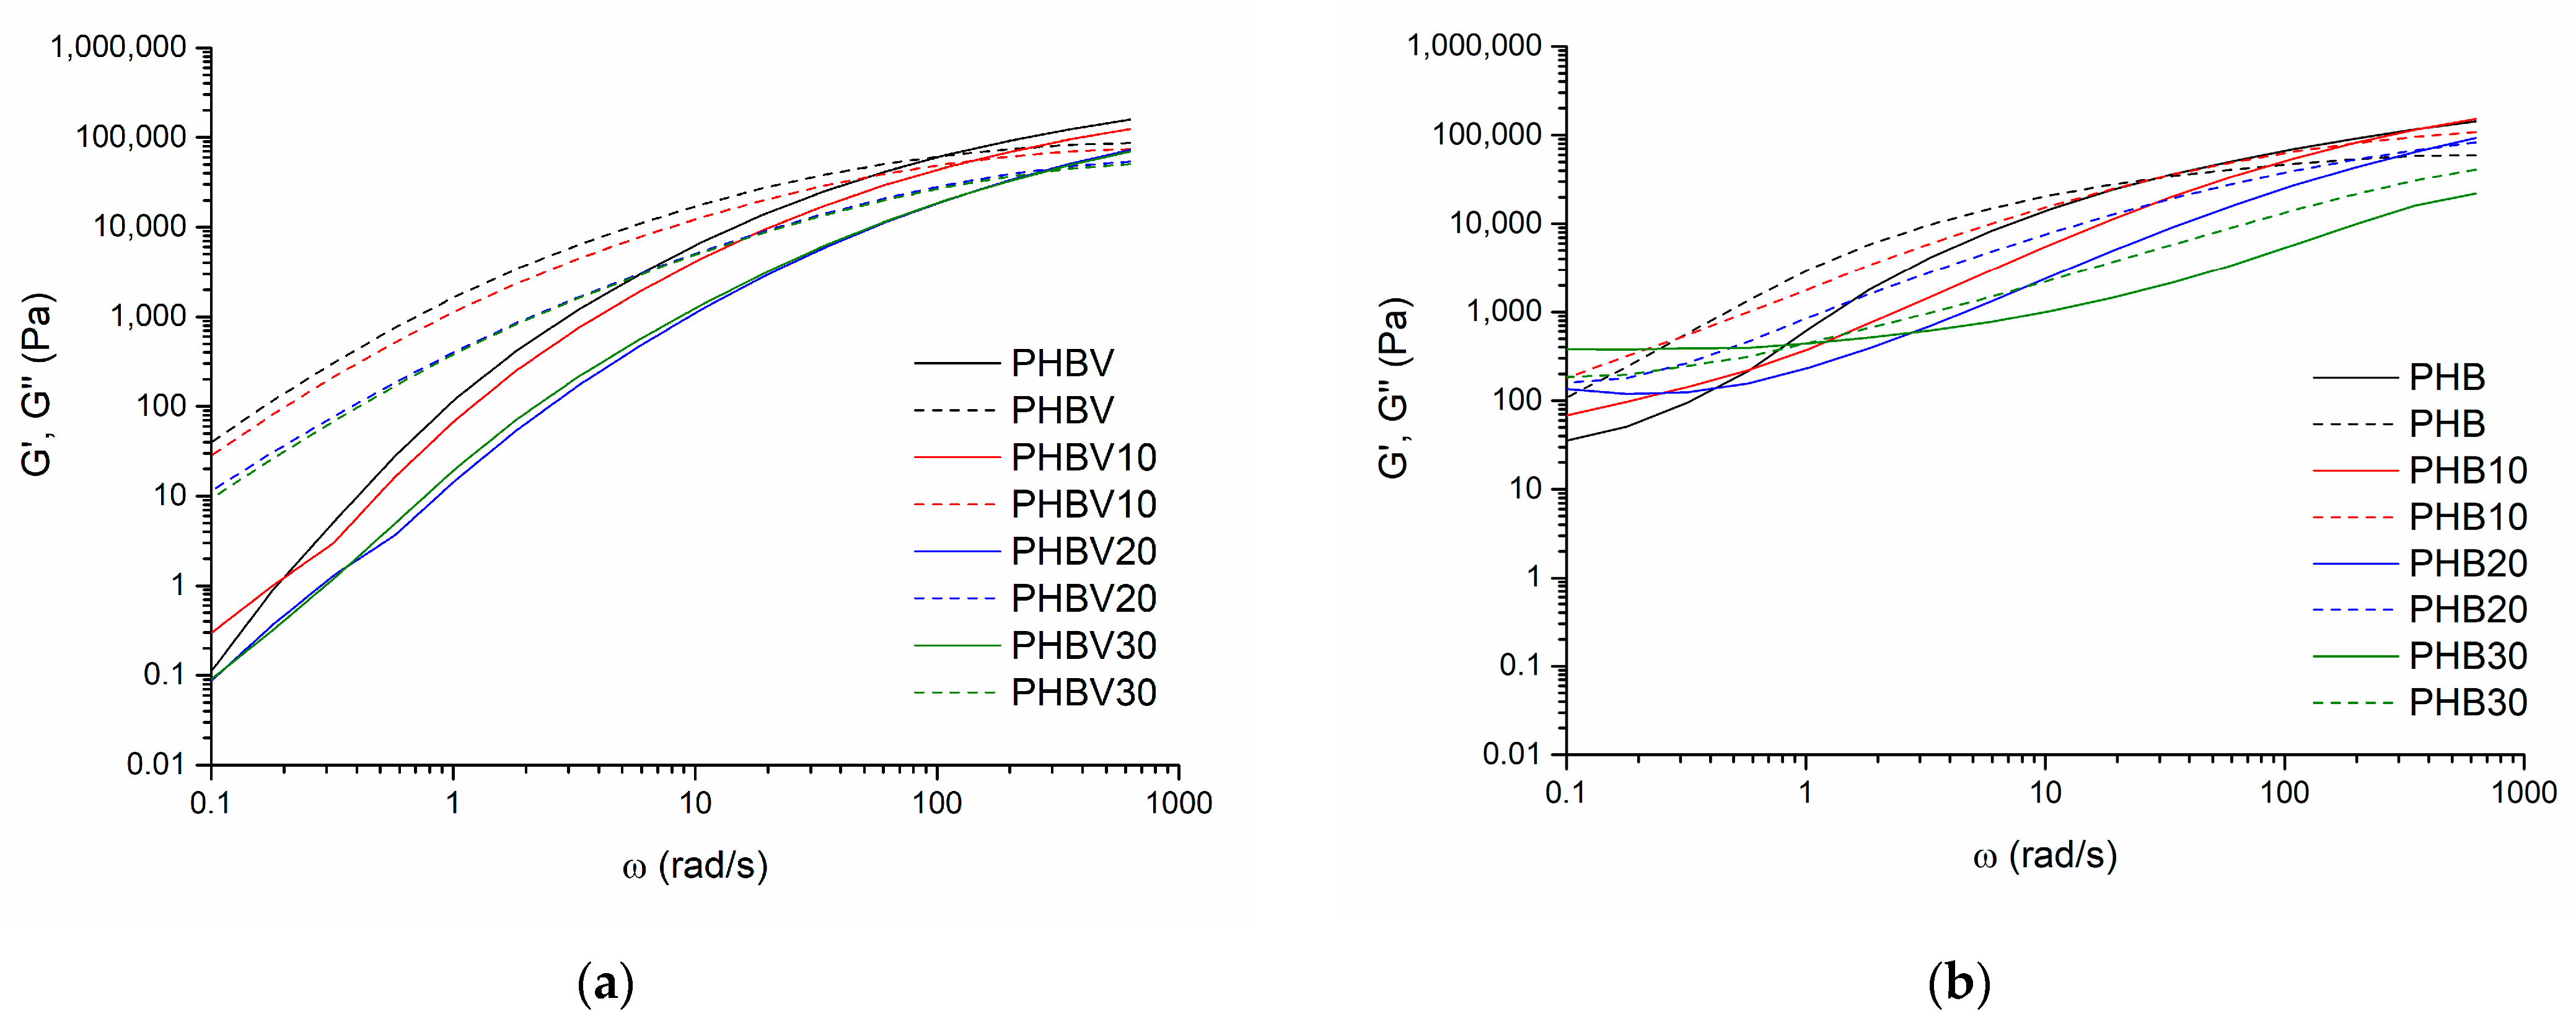
3.5. Oscillatory Shear Rheology
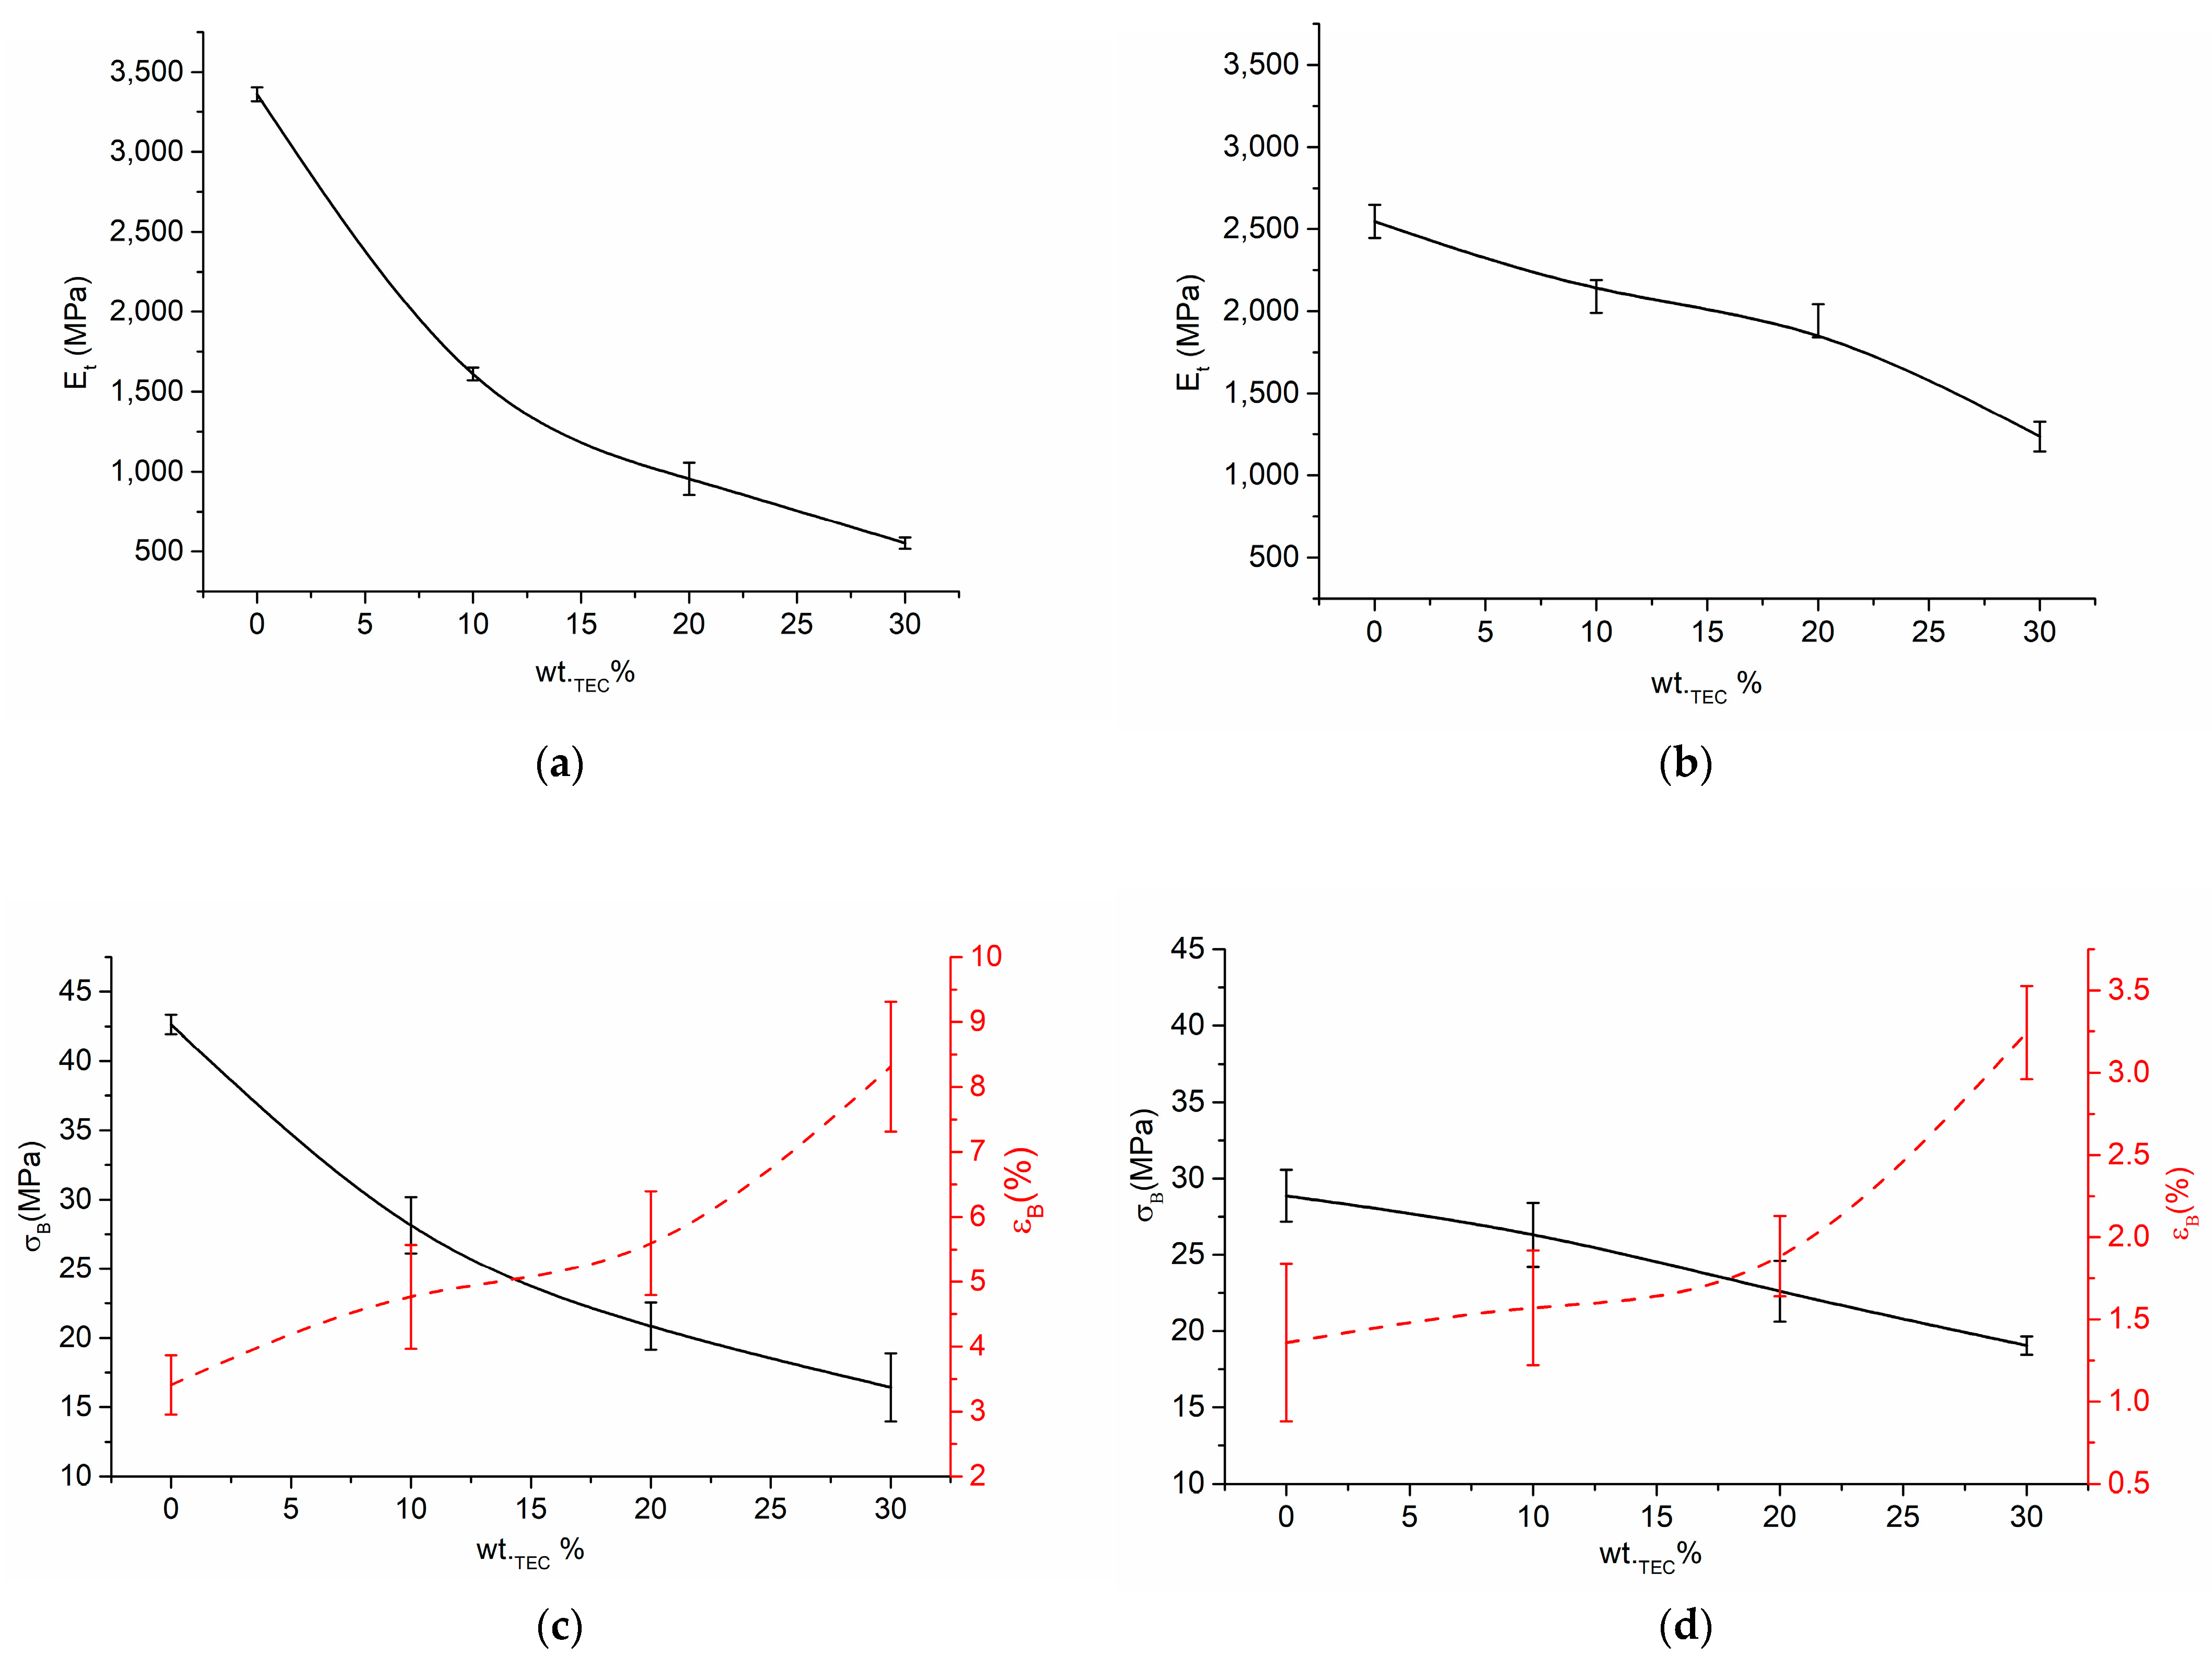
3.6. Tensile Properties
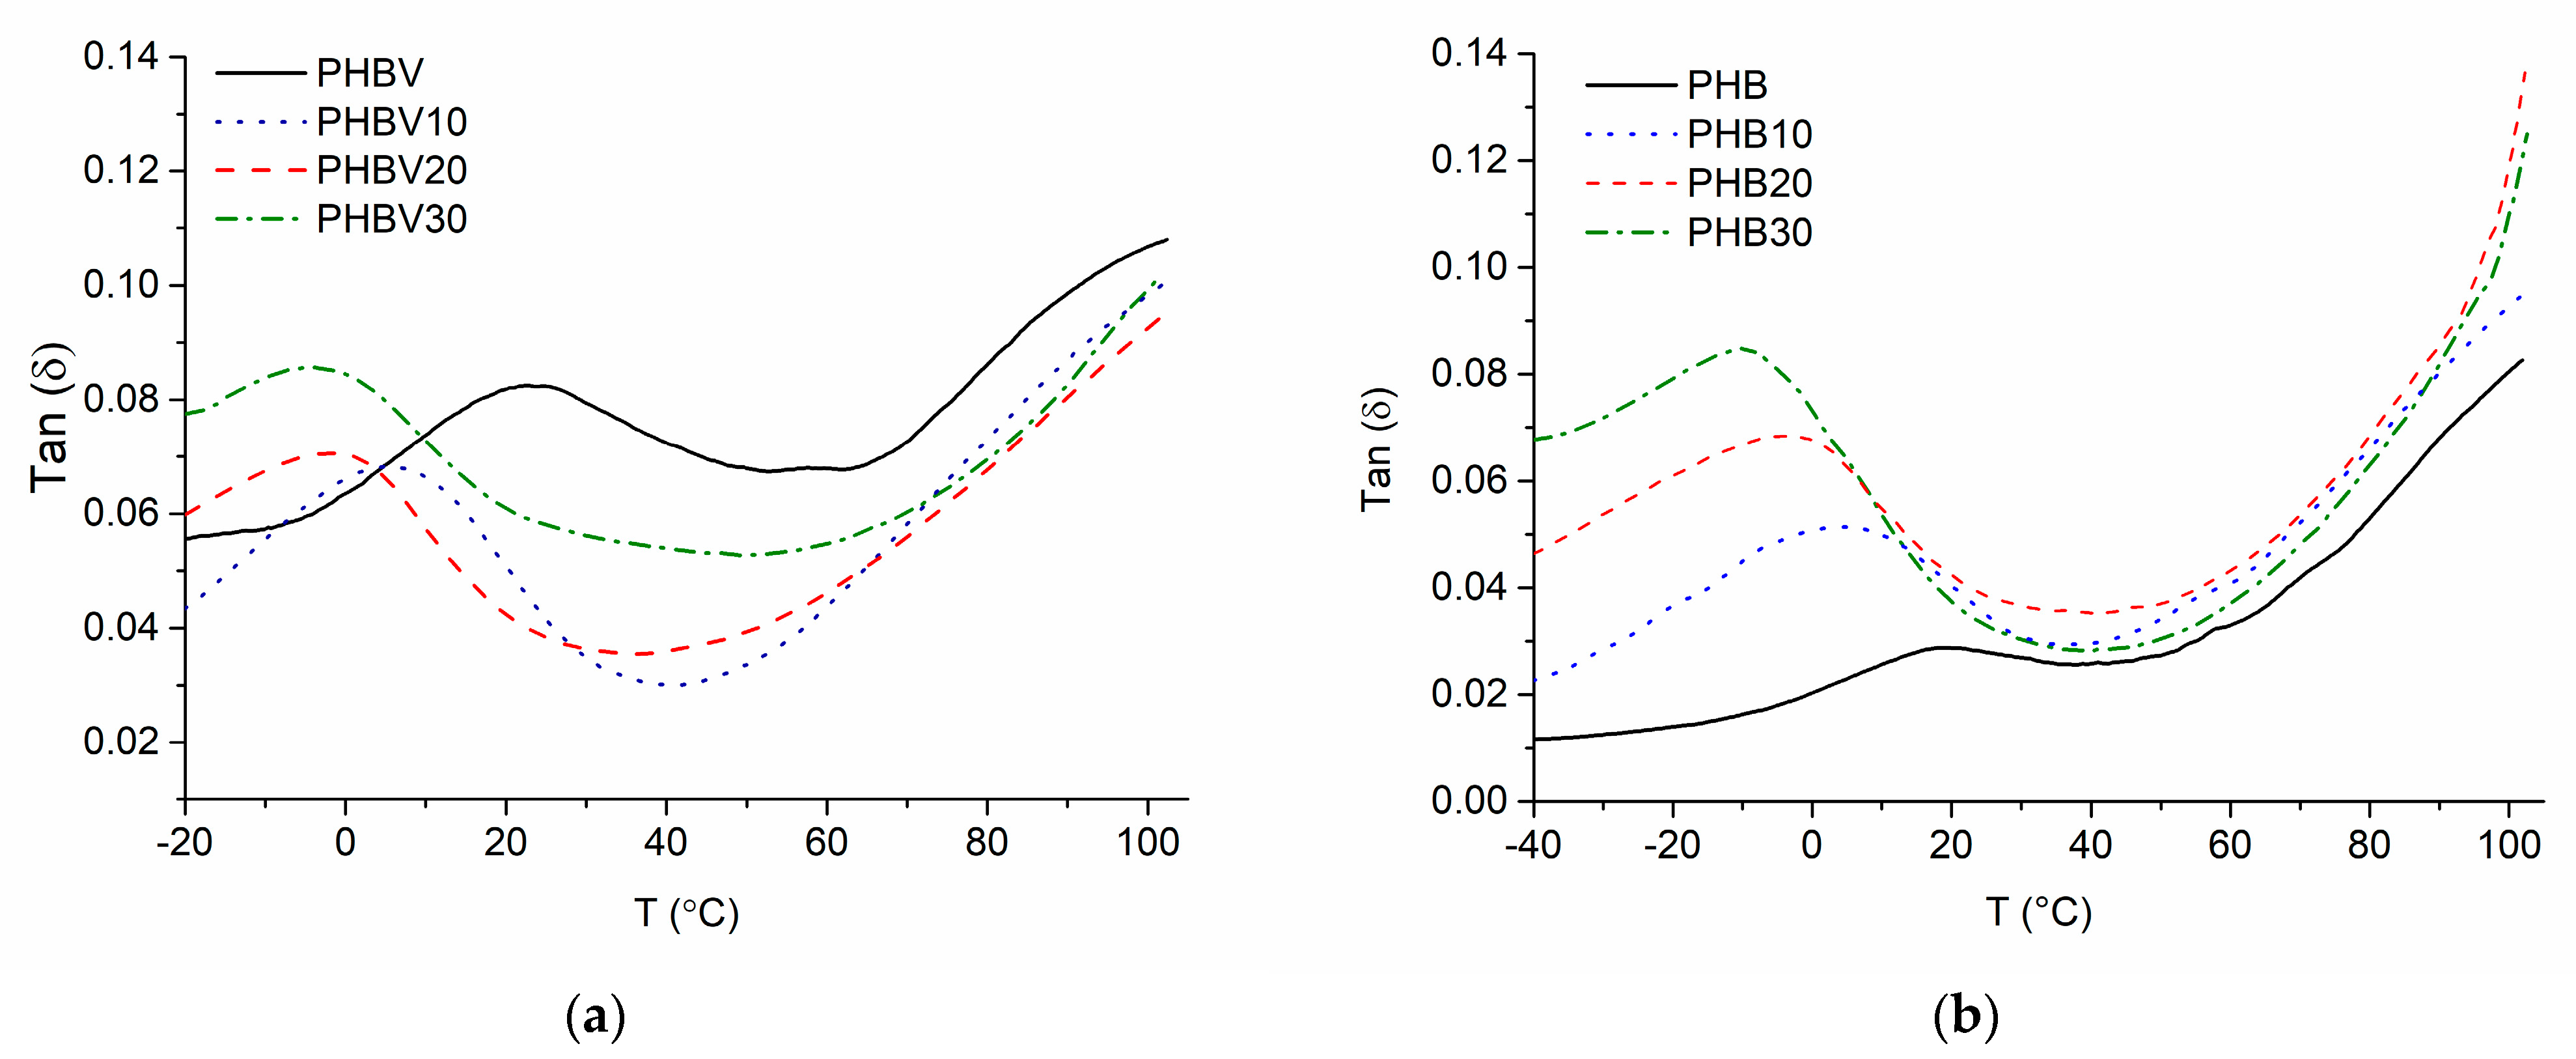
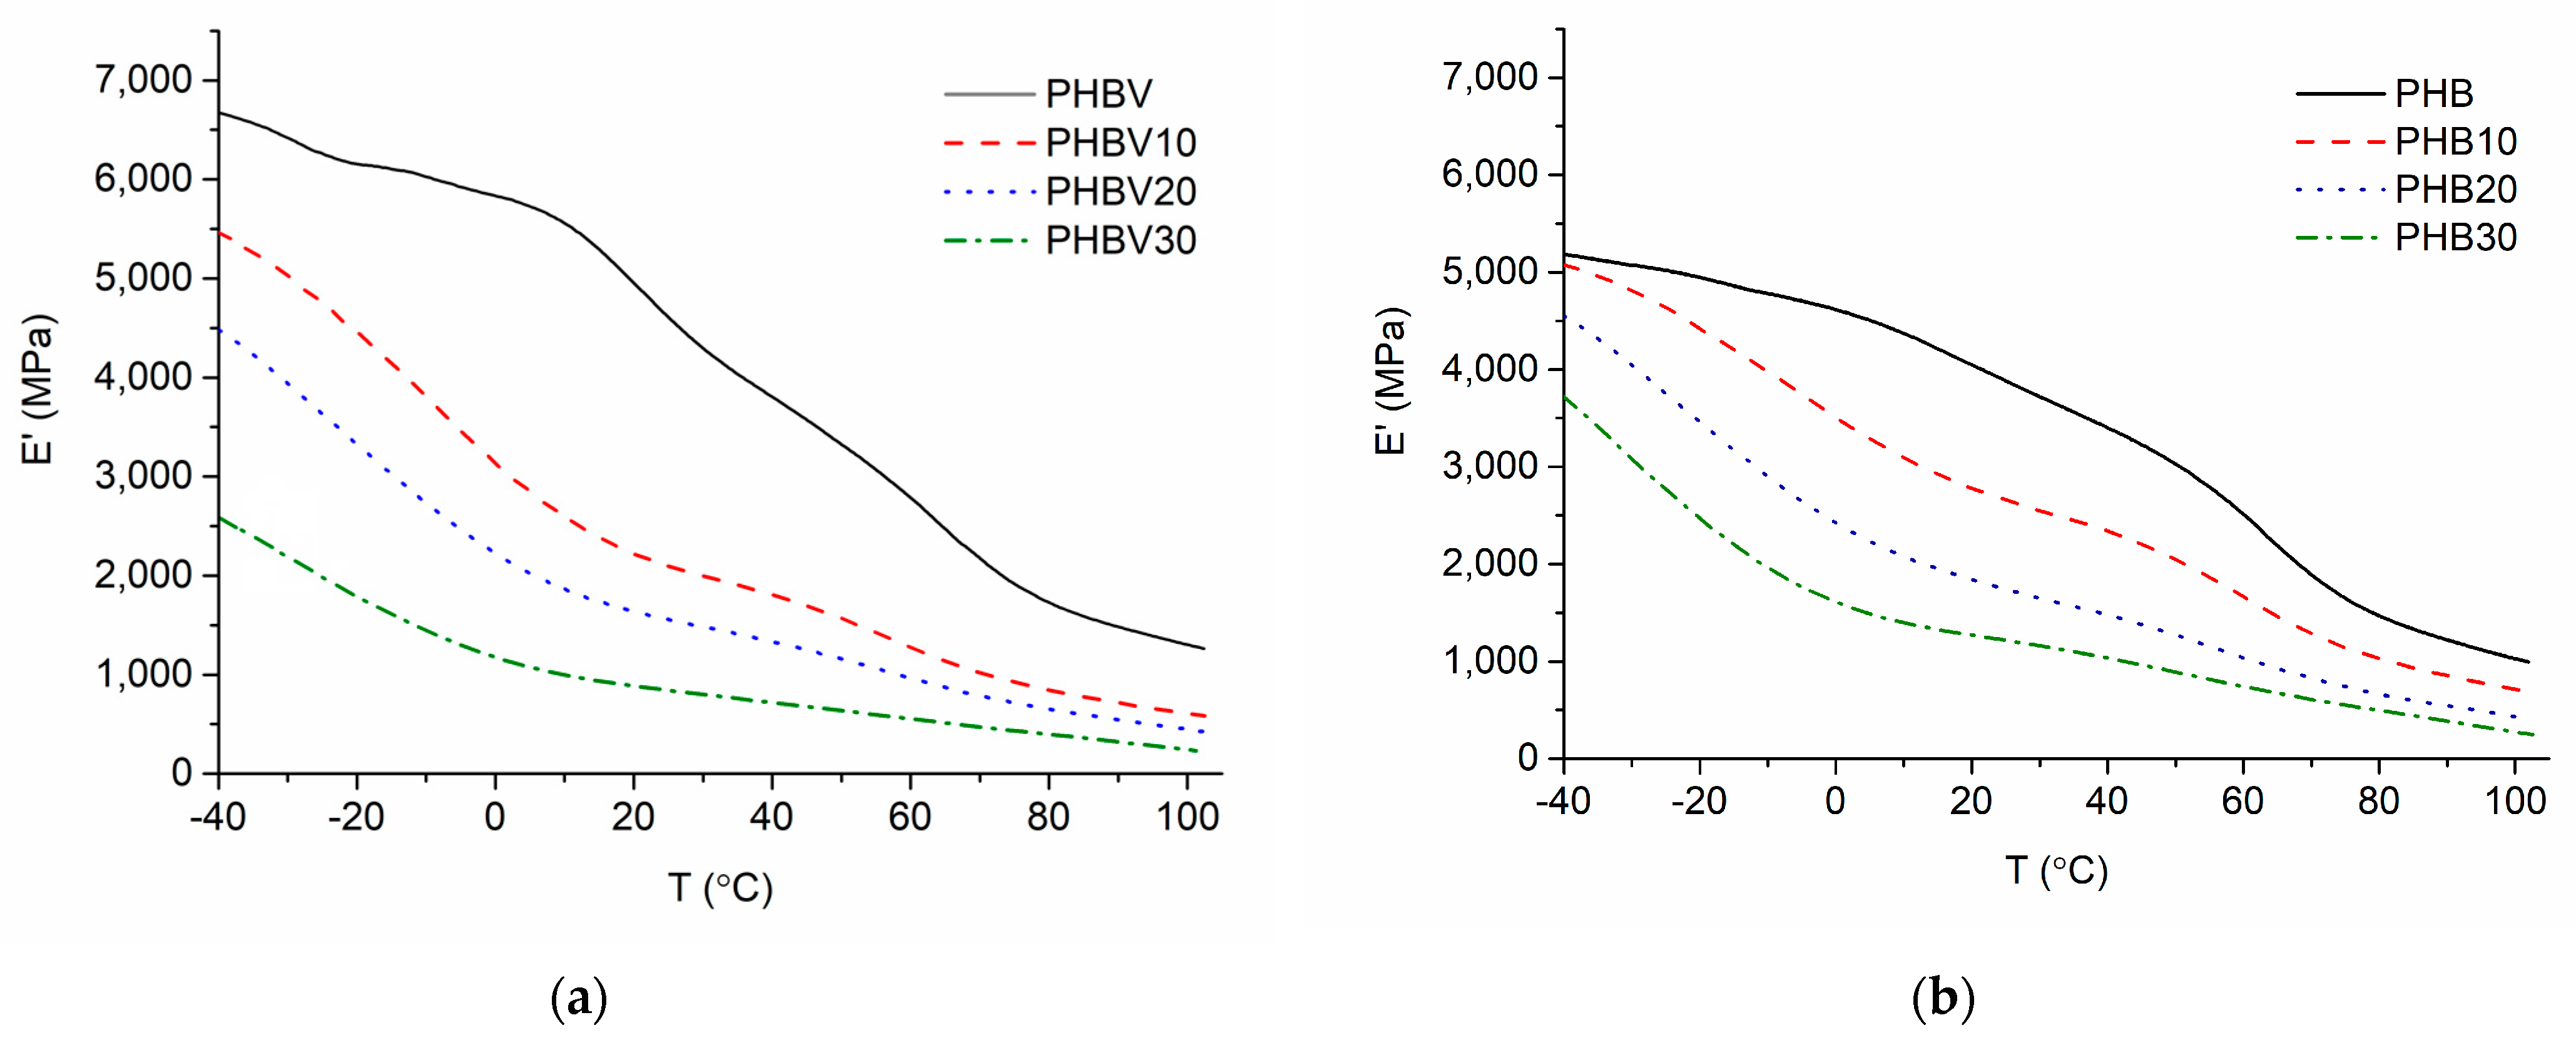
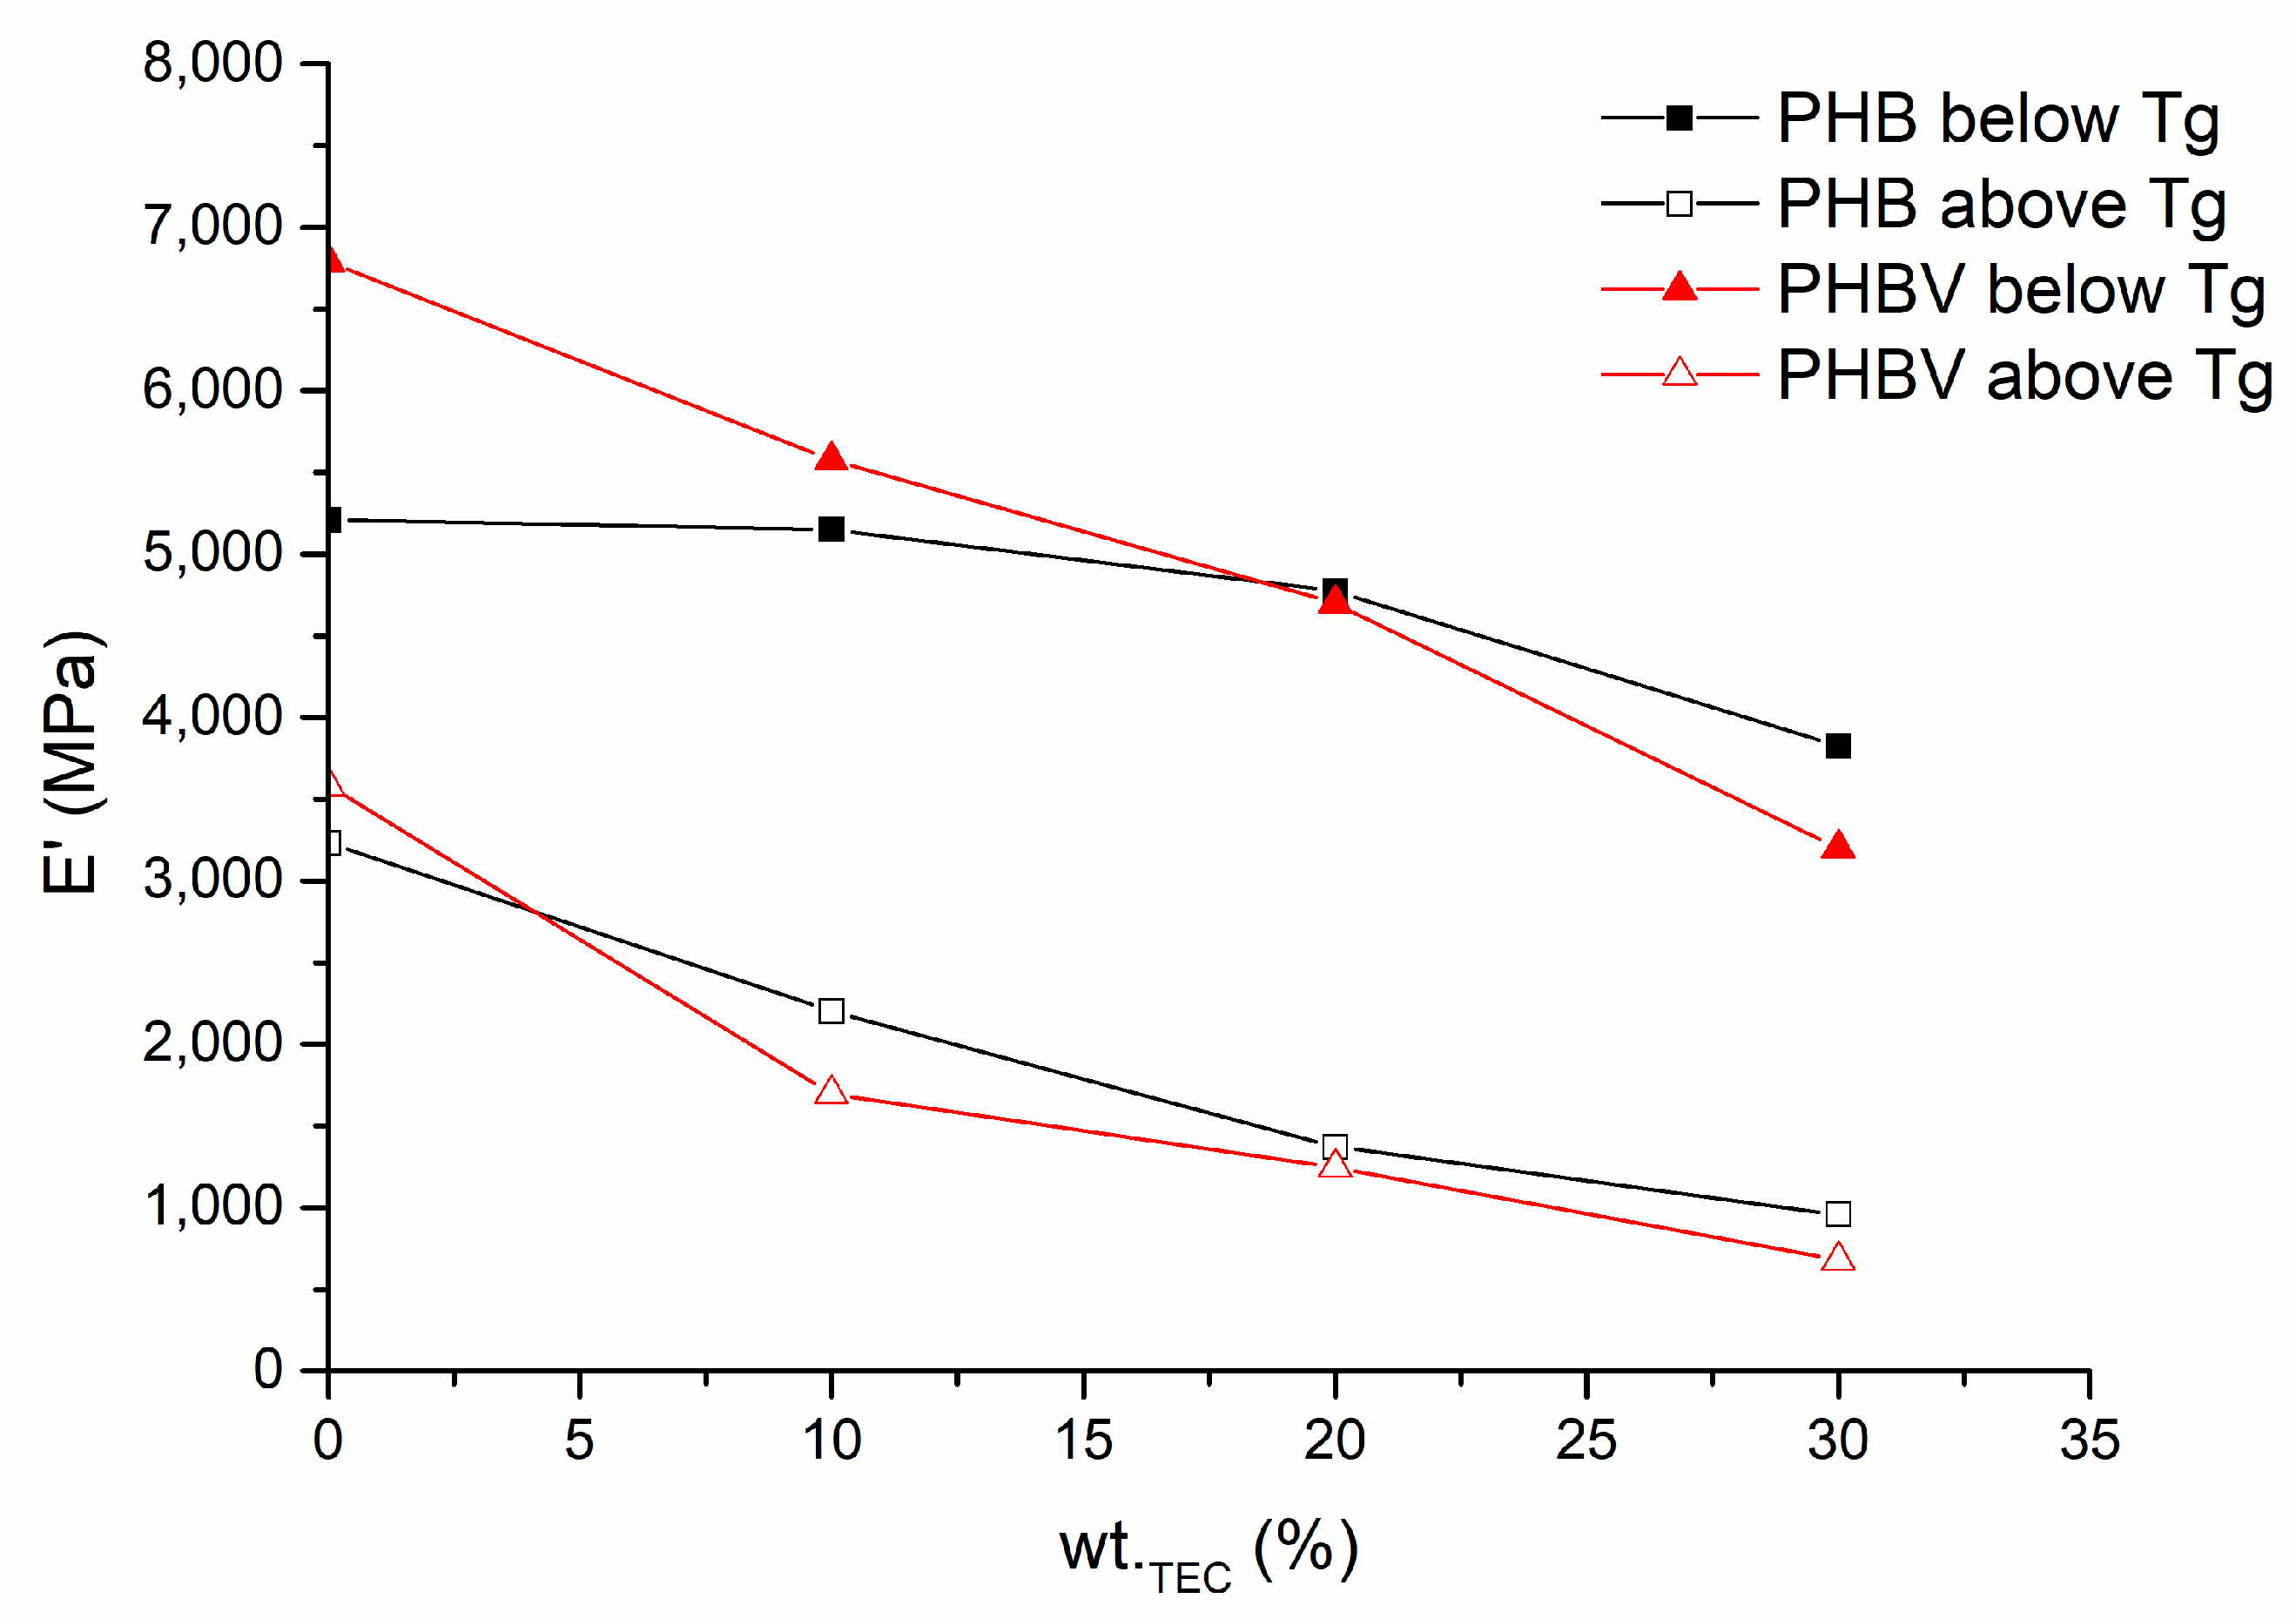
3.7. Dynamic Mechanical Analysis (DMA)
4. Conclusions
- (1)
- Considerable thermooxidative degradation in the air of the investigated plasticized systems does not occur until 240–260 °C, while the minimum onset thermal degradation temperature is 264 °C;
- (2)
- The rate of thermooxidative degradation of the plasticized systems is decreased to a certain extent due to the contribution of TEC in the building of the gas-impermeable char layer;
- (3)
- Increased shear forces cause decrement of melt viscosity as well as storage and loss modules of both PHB and especially PHB- based systems due to lower activation energy of the latter and weakened interaction between the polymer chains because of plasticization;
- (4)
- The melting range of the plasticized systems is considerably decreased (by ca 10 °C at the maximum peak value), thus relieving the processability of the investigated systems;
- (5)
- Ultimate elongation εB values of the investigated plasticized systems increase on average 2.5 times by increasing TEC content, reaching values as high as 9% (for PHBV-based systems);
- (6)
- Modulus of elasticity E as well as tensile strength σB values experience certain decrements, especially for PHBV-based systems above glass transition temperature Tg.
Supplementary Materials
Author Contributions
Funding
Data Availability Statement
Conflicts of Interest
References
- Eurostat. EU Recycled 41% of Plastic Packaging Waste in 2019. 2021. Available online: https://ec.europa.eu/eurostat/web/products-eurostat-news/-/ddn-20211027-2 (accessed on 15 May 2023).
- van der Harst, E.; Potting, J. A critical comparison of ten disposable cup LCAs. Environ. Impact Assess. Rev. 2013, 43, 86–96. [Google Scholar] [CrossRef]
- Utriainen, M.; Application, F.; Data, P.; Oy, E. (12) Patent Application Publication (10) Pub. No.: US 2009/0312954 A1. D Pat. Appl. Publ. 2009, 1, 1–6. Available online: https://patentimages.storage.googleapis.com/9d/30/f7/7b725f3f41be3c/US20090082491A1.pdf (accessed on 28 March 2023).
- Aramvash, A.; Moazzeni Zavareh, F.; Gholami Banadkuki, N. Comparison of different solvents for extraction of polyhydroxybutyrate from Cupriavidus necator. Eng. Life Sci. 2018, 18, 20–28. [Google Scholar] [CrossRef] [Green Version]
- Myshkina, V.L.; Nikolaeva, D.A.; Makhina, T.K.; Bonartsev, A.P.; Bonartseva, G.A. Effect of growth conditions on the molecular weight of poly-3- hydroxybutyrate produced by Azotobacter chroococcum 7B. Appl. Biochem. Microbiol. 2008, 44, 482–486. [Google Scholar] [CrossRef]
- McAdam, B.; Fournet, B.M.; McDonald, P.; Mojicevic, M. Production of polyhydroxybutyrate (PHB) and factors impacting its chemical and mechanical characteristics. Polymers 2020, 12, 2908. [Google Scholar] [CrossRef] [PubMed]
- Sirohi, R.; Prakash Pandey, J.; Kumar Gaur, V.; Gnansounou, E.; Sindhu, R. Critical overview of biomass feedstocks as sustainable substrates for the production of polyhydroxybutyrate (PHB). Bioresour. Technol. 2020, 311, 123536. [Google Scholar] [CrossRef]
- Aragosa, A.; Specchia, V.; Frigione, M. Isolation of two bacterial species from argan soil in morocco associated with polyhydroxybutyrate (Phb) accumulation: Current potential and future prospects for the bio-based polymer production. Polymers 2021, 13, 1870. [Google Scholar] [CrossRef]
- Nova and Institute. Global Production Capacities. 2021. Available online: https://primebiopol.com/aumenta-produccion-bioplasticos/?lang=en (accessed on 16 May 2023).
- Nova-Institute. For the First Time: Growth Rate for Bio-based Polymers with 8% CAGR Far above Overall Polymer Market Growth. 2021. Available online: https://renewable-carbon.eu/news/for-the-first-time-growth-rate-for-bio-based-polymers-with-8-cagr-far-above-overall-polymer-market-growth/ (accessed on 16 May 2023).
- Requena, R.; Jiménez, A.; Vargas, M.; Chiralt, A. Effect of plasticizers on thermal and physical properties of compression-moulded poly[(3-hydroxybutyrate)-co-(3-hydroxyvalerate)] films. Polym. Test. 2016, 56, 45–53. [Google Scholar] [CrossRef]
- Stanley, A.; Murthy, P.S.K.; Vijayendra, S.V.N. Characterization of Polyhydroxyalkanoate Produced by Halomonas venusta KT832796. J. Polym. Environ. 2020, 28, 973–983. [Google Scholar] [CrossRef]
- Quagliano, J.C.; Amarilla, F.; Fernandes, E.G.; Mata, D.; Miyazaki, S.S. “Effect of simple and complex carbon sources, low temperature culture and complex carbon feeding policies on poly-3-hydroxybutyric acid (PHB) content and molecular weight (Mw) from Azotobacter chroococcum 6B. World J. Microbiol. Biotechnol. 2001, 17, 9–14. [Google Scholar] [CrossRef]
- Umemura, R.T.; Felisberti, M.I. Plasticization of poly(3-hydroxybutyrate) with triethyl citrate: Thermal and mechanical properties, morphology, and kinetics of crystallization. J. Appl. Polym. Sci. 2021, 138, 49990. [Google Scholar] [CrossRef]
- Wang, L.; Zhu, W.; Wang, X.; Chen, X.; Chen, G.-Q. Processability Modifications of Poly(3-hydroxybutyrate) by Plasticizing, Blending, and Stabilizing. J. Appl. Polym. Sci. 2008, 107, 166–173. [Google Scholar] [CrossRef]
- Nosal, H.; Moser, K.; Warzała, M.; Holzer, A.; Stańczyk, D.; Sabura, E. Selected Fatty Acids Esters as Potential PHB-V Bioplasticizers: Effect on Mechanical Properties of the Polymer. J. Polym. Environ. 2020, 29, 38–53. [Google Scholar] [CrossRef]
- Mangeon, C.; Michely, L.; Rios De Anda, A.; Thevenieau, F.; Renard, E.; Langlois, V. Natural Terpenes Used as Plasticizers for Poly(3-hydroxybutyrate). ACS Sustain. Chem. Eng. 2018, 6, 16160–16168. [Google Scholar] [CrossRef]
- Scalioni, L.V.; Gutiérrez, M.C.; Felisberti, M.I. Green composites of poly(3-hydroxybutyrate) and curaua fibers: Morphology and physical, thermal, and mechanical properties. J. Appl. Polym. Sci. 2017, 134, 1–13. [Google Scholar] [CrossRef]
- Râpă, M.; Darie-Nita, R.; Grosu, E.; Popa, E.; Trifoi, A.; Pap, T.; Vasile, C. Effect of plasticizers on melt processability and properties of PHB. J. Optoelectron. Adv. Mater. 2015, 17, 1778–1784. [Google Scholar]
- Garcia-Garcia, D.; Ferri, J.M.; Montanes, N.; Lopez-Martinez, J.; Balart, R. Plasticization effects of epoxidized vegetable oils on mechanical properties of poly(3-hydroxybutyrate). Polym. Int. 2016, 65, 1157–1164. Available online: http://hdl.handle.net/10251/82871 (accessed on 17 May 2023). [CrossRef]
- Barbosa, J.L.; Perin, G.B.; Felisberti, M.I. Plasticization of Poly(3-hydroxybutyrate- co-3-hydroxyvalerate) with an Oligomeric Polyester: Miscibility and Effect of the Microstructure and Plasticizer Distribution on Thermal and Mechanical Properties. ACS Omega 2021, 6, 3278–3290. [Google Scholar] [CrossRef]
- Haas, R.; Jin, B.; Zepf, F.T. Production of Poly(3-hydroxybutyrate) from Waste Potato Starch. Biosci. Biotechnol. Biochem. 2008, 72, 253–256. [Google Scholar] [CrossRef]
- Yang, Y.H.; Brigham, C.; Willis, L.; Rha, C.K.; Sinskey, A. Improved detergent-based recovery of polyhydroxyalkanoates (PHAs). Biotechnol. Lett. 2011, 33, 937–942. [Google Scholar] [CrossRef] [Green Version]
- Vandi, L.J.; Chan, C.M.; Werker, A.; Richardson, D.; Laycock, B.; Pratt, S. Extrusion of wood fibre reinforced poly(hydroxybutyrate-co-hydroxyvalerate) (PHBV) biocomposites: Statistical analysis of the effect of processing conditions on mechanical performance. Polym. Degrad. Stab. 2018, 159, 1–14. [Google Scholar] [CrossRef]
- Turco, R.; Santagata, G.; Corrado, I.; Pezzella, C.; Di Serio, M. In vivo and Post-synthesis Strategies to Enhance the Properties of PHB-Based Materials: A Review. Front. Bioeng. Biotechnol. 2021, 8, 619266. [Google Scholar] [CrossRef] [PubMed]
- Ino, K.; Sato, S.; Ushimaru, K.; Saika, A.; Fukuoka, T.; Ohshiman, K.; Morita, T. Mechanical properties of cold-drawn films of ultrahigh-molecular-weight poly(3-hydroxybutyrate-co-3-hydroxyvalerate) produced by Haloferax mediterranei. Polym. J. 2020, 52, 1299–1306. [Google Scholar] [CrossRef]
- Chen, Y.; Chou, I.N.; Tsai, Y.H.; Wu, H.S. Thermal degradation of poly(3-hydroxybutyrate) and poly(3-hydroxybutyrate- co-3-hydroxyvalerate) in drying treatment. J. Appl. Polym. Sci. 2013, 130, 3659–3667. [Google Scholar] [CrossRef]
- Abbasi, M.; Pokhrel, D.; Coats, E.R.; Guho, N.M.; McDonald, A.G. Effect of 3-Hydroxyvalerate Content on Thermal, Mechanical, and Rheological Properties of Poly(3-hydroxybutyrate-co-3-hydroxyvalerate) Biopolymers Produced from Fermented Dairy Manure. Polymers 2022, 14, 4140. [Google Scholar] [CrossRef]
- Ramezani, M.; Amoozegar, M.A.; Ventosa, A. Screening and comparative assay of poly-hydroxyalkanoates produced by bacteria isolated from the Gavkhooni Wetland in Iran and evaluation of poly-β-hydroxybutyrate production by halotolerant bacterium Oceanimonas sp. GK1. Ann. Microbiol. 2015, 65, 517–526. [Google Scholar] [CrossRef]
- Chotchindakun, K.; Pathom-Aree, W.; Dumri, K.; Ruangsuriya, J.; Pumas, C.; Pekkoh, J. Low Crystallinity of Poly(3-Hydroxybutyrate-co-3-Hydroxyvalerate) Bioproduction by Hot Spring Cyanobacterium Cyanosarcina sp. AARL T020. Plants 2021, 10, 503. [Google Scholar] [CrossRef]
- Teixeira, S.C.; Silva, R.R.A.; de Oliveira, T.V.; Stringheta, P.C.; Pinto, M.R.M.R.; de Soares, F.F.N. Glycerol and triethyl citrate plasticizer effects on molecular, thermal, mechanical, and barrier properties of cellulose acetate films. Food Biosci. 2021, 42, 101202. [Google Scholar] [CrossRef]
- Sánchez, K.D.T.; Allen, N.S.; Liauw, C.M.; Johnson, B. Effects of type of polymerization catalyst system on the degradation of polyethylenes in the melt state. Part 1: Unstabilized polyethylenes (including metallocene types). J. Vinyl Addit. Technol. 2011, 17, 8–39. [Google Scholar] [CrossRef]
- Xiang, H.; Wen, X.; Miu, X.; Li, Y.; Zhou, Z.; Zhu, M. Thermal depolymerization mechanisms of poly(3-hydroxybutyrate-co-3-hydroxyvalerate). Prog. Nat. Sci. Mater. Int. 2016, 26, 58–64. [Google Scholar] [CrossRef] [Green Version]
- Di Lorenzo, M.L.; Sajkiewicz, P.; La Pietra, P.; Gradys, A. Irregularly shaped DSC exotherms in the analysis of polymer crystallization. Polym. Bull. 2006, 57, 713–721. [Google Scholar] [CrossRef]
- Briassoulis, D.; Tserotas, P.; Athanasoulia, I.G. Alternative optimization routes for improving the performance of poly(3-hydroxybutyrate) (PHB) based plastics. J. Clean. Prod. 2021, 318, 128555. [Google Scholar] [CrossRef]
- Hsiao, C.S.B.S.; Zuo, F.; Mao, Y. Handbook of Polymer Crystallization; John Wiley & Sons: Hoboken, NJ, USA, 2013; Volume 15. [Google Scholar]
- Sauer, B.B.; Kampert, W.G.; Blanchard, N.E.; Threefoot, S.A.; Hsiao, B.S. Temperature modulated DSC studies of melting and recrystallization in polymers exhibiting multiple endotherms. Polymer 2000, 41, 1099–1108. [Google Scholar] [CrossRef]
- Jost, V.; Langowski, H.C. Effect of different plasticisers on the mechanical and barrier properties of extruded cast PHBV films. Eur. Polym. J. 2015, 68, 302–312. [Google Scholar] [CrossRef]
- Scandola, M.; Ceccorulli, G.; Doi, Y. Viscoelastic relaxations and thermal properties of bacterial poly(3-hydroxybutyrate-co-3-hydroxyvalerate) and poly(3-hydroxybutyrate-co-4-hydroxybutyrate). Int. J. Biol. Macromol. 1990, 12, 112–117. [Google Scholar] [CrossRef]
- Madbouly, S.A.; Mansour, A.A.; Abdou, N.Y. Molecular dynamics of amorphous/crystalline polymer blends studied by broadband dielectric spectroscopy. Eur. Polym. J. 2007, 43, 1892–1904. [Google Scholar] [CrossRef]


| PHAs | TEC(wt. Parts) | Plasticizer | Tm (°C) | X (%) | εB (%) | Reference |
|---|---|---|---|---|---|---|
| PHB | 0 | Epoxidized linseed oil (ELO) | 175 | 52 | 9.7 | [20] |
| 0.05 | 173 | 47 | 12.7 | |||
| 0.1 | 171 | 46 | 13.6 | |||
| 0.05 | Epoxidized soybean oil (ESBO) | 173 | 47 | 9.2 | ||
| 0.1 | 172 | 48 | 8.9 | |||
| PHB | 0 | Triethyl citrate (TEC) | 180 | 81 | 5.8 ± 0.6 | [14] |
| 0.1 | 173 | 71 | 5.6 ± 0.4 | |||
| 0.2 | 171 | 62 | 7.4 ± 0.9 | |||
| 0.3 | 162 | 53 | 6.9 ± 1.6 | |||
| PHB | 0 | Dioctyl (o-)phthalate (DOS) | 169 | 56 * | 2.5 ± 0.5 | [15] |
| 0.25 | 164 | 54 * | 3.9 ± 0.3 | |||
| 0.3 | 163 | 57 * | 4.3 ± 0.6 | |||
| 0.35 | 165 | 50 * | 5.4 ± 0.9 | |||
| 0.4 | 165 | 57 * | 5.2 ± 0.6 | |||
| 0.5 | 165 | 51 * | - | |||
| 0 | Acetyl tributyl citrate (ATBC) | 169 | 56 * | 2.5 ± 0.5 | ||
| 0.1 | 163 | 61 * | 6.1 ± 0.8 | |||
| 0.2 | 160 | 58 * | 8.5 ± 0.9 | |||
| 0.25 | 158 | 60 * | 8.8 ± 0.9 | |||
| 0.3 | 157 | 59 * | 9.7 ± 0.7 | |||
| PHBV | 0 | Biodegradable oligomeric polyester based on lactic acid, adipic acid, and 1,2-propanediol at a molar ratio of 20:40:40 (PLAP) | 174 | 53 | 8 ± 0.4 | [21] |
| 0.1 | 173 | 55 | 8.2 ± 0.4 | |||
| 0.2 | 170 | 56 | 8.1 ± 0.4 | |||
| 0.3 | 174 | 61 | 6.6 ± 0.5 |
| Code | PHBV (wt.%) | PHB (wt.%) | TEC (wt.%) |
|---|---|---|---|
| PHBV | 100 | — | 0 |
| PHBV10 | 90 | — | 10 |
| PHBV20 | 80 | — | 20 |
| PHBV30 | 70 | — | 30 |
| PHB | — | 100 | 0 |
| PHB10 | — | 90 | 10 |
| PHB20 | — | 80 | 20 |
| PHB30 | — | 70 | 30 |
| Sample Code | Mw (kDa) | η (Pa·s) |
|---|---|---|
| PHBV | 540 | 0.69 |
| PHB | 66 | 3.86 |
| Mode of Molecular Vibration | PHB | PHBV | TEC | |||
|---|---|---|---|---|---|---|
| Current Research | Reference | Current Research | Reference | Current Research | Reference | |
| C–C backbone stretching | 978 | — | 977 | 977 [28] | — | — |
| O−C−C stretching | 1043/1054 | — | 1044/1054 | 1054 [28] | 1023 | — |
| O–C–C asymmetric stretching | 1100 | 1000–1300 [29] | 1099 | 1099 [28] | 1096 1113 | 1097 [31] 1114 [31] |
| C–O–C symmetric stretching | 1130 | 1129 | 1129 [28] | — | 1050-1300 [31] | |
| C–O–C asymmetric stretching | 1180 | 1181 | 1179 [28] | 1182 | ||
| C–O symmetric stretching | 1226 | 1226 | 1226 [28] | — | ||
| C–O symmetric stretching of aliphatic esters | 1260 | 1261 | 1261 [28] | — | ||
| C–O symmetric stretching | 1274 | 1274 | 1275 [28] | — | ||
| C–H symmetric bending of methyl (-CH3) groups | 1379 | 1377 [29] | 1379 | 1379 [28] | 1370 | 1373 [31] |
| C–H asymmetric stretching and bending vibrations of methyl (-CH3) and methylene (-CH2-) groups | 1453 | 1452 [29] | 1452 | 1452 [28] | — | — |
| C=O stretching of ester groups | 1718 | 1727 [29] | 1718 | 1720 [28] 1722 [30] | 1730 | 1735 [31] |
| —CH3 symmetric stretching | 2851/2873 | — | 2851/2873 | 2881 [30] | — | — |
| —CH2 symmetric stretching | 2390 | — | 2932 | 2933 [28] 2925/2945 [30] | — | — |
| C−H asymmetric vibration of methyl (-CH3) groups | 2975 | 2927/2969 [29] | 2976 | 2975 [28] | 2982 | 2983 [31] |
| Terminal –OH group | 3434 | 3434 [29] | 3435 | 3434 [28] | 3484 | 3502 [31] |
| Sample Code | Residual Mass at Fixed Temperature, wt.% | Ton, °C | Percent Mass Loss Temperatures, °C | ||||
|---|---|---|---|---|---|---|---|
| 180 °C | 190 °C | 200 °C | T1% | T5% | Tdeg | ||
| PHB | 100 | 100 | 100 | 288 | 227 | 279 | 298 |
| PHB10 | 100 | 99 | 99 | 280 | 202 | 246 | 258 |
| PHB20 | 100 | 99 | 98 | 264 | 185 | 241 | 274 |
| PHB30 | 100 | 99 | 98 | 275 | 181 | 229 | 286 |
| PHBV | 100 | 100 | 100 | 283 | 259 | 276 | 295 |
| PHBV10 | 99 | 99 | 99 | 285 | 208 | 257 | 299 |
| PHBV20 | 99 | 99 | 98 | 279 | 184 | 234 | 283 |
| PHBV30 | 99 | 99 | 98 | 275 | 187 | 228 | 287 |
| TEC | 96 | 95 | 94 | 276 | 120 | 190 | 276 |
| Sample Code | wt. % | 1st Heating Run | ||||||
|---|---|---|---|---|---|---|---|---|
| χ | ΔHm | Tm1 | Tm2 | Tonset | Toffset | ΔT | ||
| (%) | (J/g) | (°C) | (°C) | (°C) | (°C) | (°C) | ||
| PHB | 0 | 53 | 77 | - | 174 | 136 | 183 | 47 |
| PHB10TEC | 10 | 58 | 76 | 165 * | 172 | 133 | 181 | 48 |
| PHB20TEC | 20 | 59 | 69 | 160 * | 169 | 127 | 177 | 50 |
| PHB30TEC | 30 | 60 | 61 | 157 * | 166 | 122 | 173 | 51 |
| PHBV | 0 | 64 | 94 | - | 175/185 * | 135 | 192 | 57 |
| PHBV10%TEC | 10 | 59 | 78 | - | 168 | 118 | 177 | 59 |
| PHBV20%TEC | 20 | 57 | 66 | - | 163 | 114 | 174 | 60 |
| PHBV30%TEC | 30 | 59 | 60 | 151* | 161 | 106 | 168 | 62 |
| Sample Code | wt.% | Cooling Run | |||||
|---|---|---|---|---|---|---|---|
| χ (%) | ΔHm (J/g) | Tm1 (°C) | Tonset (°C) | Toffset (°C) | ΔT (°C) | ||
| PHB | 0 | 45 | 66 | 91 | 67 | 112 | 45 |
| PHB10TEC | 10 | 44 | 58 | 71 | 51 | 100 | 49 |
| PHB20TEC | 20 | 47 | 55 | 75 | 49 | 100 | 51 |
| PHB30TEC | 30 | 45 | 46 | 69 | 43 | 96 | 53 |
| PHBV | 0 | 46 | 68 | 83 | 55 | 108 | 53 |
| PHBV10%TEC | 10 | 47 | 61 | 81 | 52 | 106 | 54 |
| PHBV20%TEC | 20 | 44 | 51 | 75 | 44 | 99 | 55 |
| PHBV30%TEC | 30 | 45 | 46 | 71 | 31 | 98 | 67 |
| Sample Code | wt.% | 2nd Heating Run | |||||||||
|---|---|---|---|---|---|---|---|---|---|---|---|
| χcc (%) | ΔHcc (J/g) | Tcc (°C) | χ * (%) | ΔHm (J/g) | Tm1 (°C) | Tm2 (°C) | Tonset (°C) | Toffset (°C) | ΔT (°C) | ||
| PHB | 0 | 3 | 4 | 99 | 54 (51) | 78 | 169 | 173 | 139 | 183 | 44 |
| PHB10TEC | 10 | 2 | 2 | 89 | 59 (57) | 77 | 156 | 167 | 131 | 176 | 45 |
| PHB20TEC | 20 | 3 | 4 | 89 | 59 (56) | 69 | 154 | 166 | 129 | 175 | 46 |
| PHB30TEC | 30 | 4 | 4 | 83 | 62 (58) | 63 | 157 | 165 | 127 | 174 | 47 |
| PHBV | 0 | 5 | 8 | 95 | 61 (56) | 90 | 167 | 172 | 128 | 185 | 57 |
| PHBV10%TEC | 10 | 3 | 4 | 94 | 62 (58) | 81 | 162 | 170 | 118 | 176 | 58 |
| PHBV20%TEC | 20 | 5 | 6 | 91 | 63 (58) | 74 | 154 | 165 | 117 | 175 | 58 |
| PHBV30%TEC | 30 | 4 | 5 | 90 | 62 (58) | 64 | 148 | 162 | 112 | 172 | 60 |
| Sample | Tg, °C | Sample | Tg, °C |
|---|---|---|---|
| PHBV | 22 | PHB | 19 |
| PHBV10 | 5 | PHB10 | 12 |
| PHBV20 | −1 | PHB20 | −5 |
| PHBV30 | −4 | PHB30 | −7 |
Disclaimer/Publisher’s Note: The statements, opinions and data contained in all publications are solely those of the individual author(s) and contributor(s) and not of MDPI and/or the editor(s). MDPI and/or the editor(s) disclaim responsibility for any injury to people or property resulting from any ideas, methods, instructions or products referred to in the content. |
© 2023 by the authors. Licensee MDPI, Basel, Switzerland. This article is an open access article distributed under the terms and conditions of the Creative Commons Attribution (CC BY) license (https://creativecommons.org/licenses/by/4.0/).
Share and Cite
Žiganova, M.; Merijs-Meri, R.; Zicāns, J.; Bochkov, I.; Ivanova, T.; Vīgants, A.; Ence, E.; Štrausa, E. Visco-Elastic and Thermal Properties of Microbiologically Synthesized Polyhydroxyalkanoate Plasticized with Triethyl Citrate. Polymers 2023, 15, 2896. https://doi.org/10.3390/polym15132896
Žiganova M, Merijs-Meri R, Zicāns J, Bochkov I, Ivanova T, Vīgants A, Ence E, Štrausa E. Visco-Elastic and Thermal Properties of Microbiologically Synthesized Polyhydroxyalkanoate Plasticized with Triethyl Citrate. Polymers. 2023; 15(13):2896. https://doi.org/10.3390/polym15132896
Chicago/Turabian StyleŽiganova, Madara, Remo Merijs-Meri, Jānis Zicāns, Ivan Bochkov, Tatjana Ivanova, Armands Vīgants, Enno Ence, and Evita Štrausa. 2023. "Visco-Elastic and Thermal Properties of Microbiologically Synthesized Polyhydroxyalkanoate Plasticized with Triethyl Citrate" Polymers 15, no. 13: 2896. https://doi.org/10.3390/polym15132896