
Constraint Release for Reptating Filaments in Semiflexible Networks Depends on Background Fluctuations

 , , , and
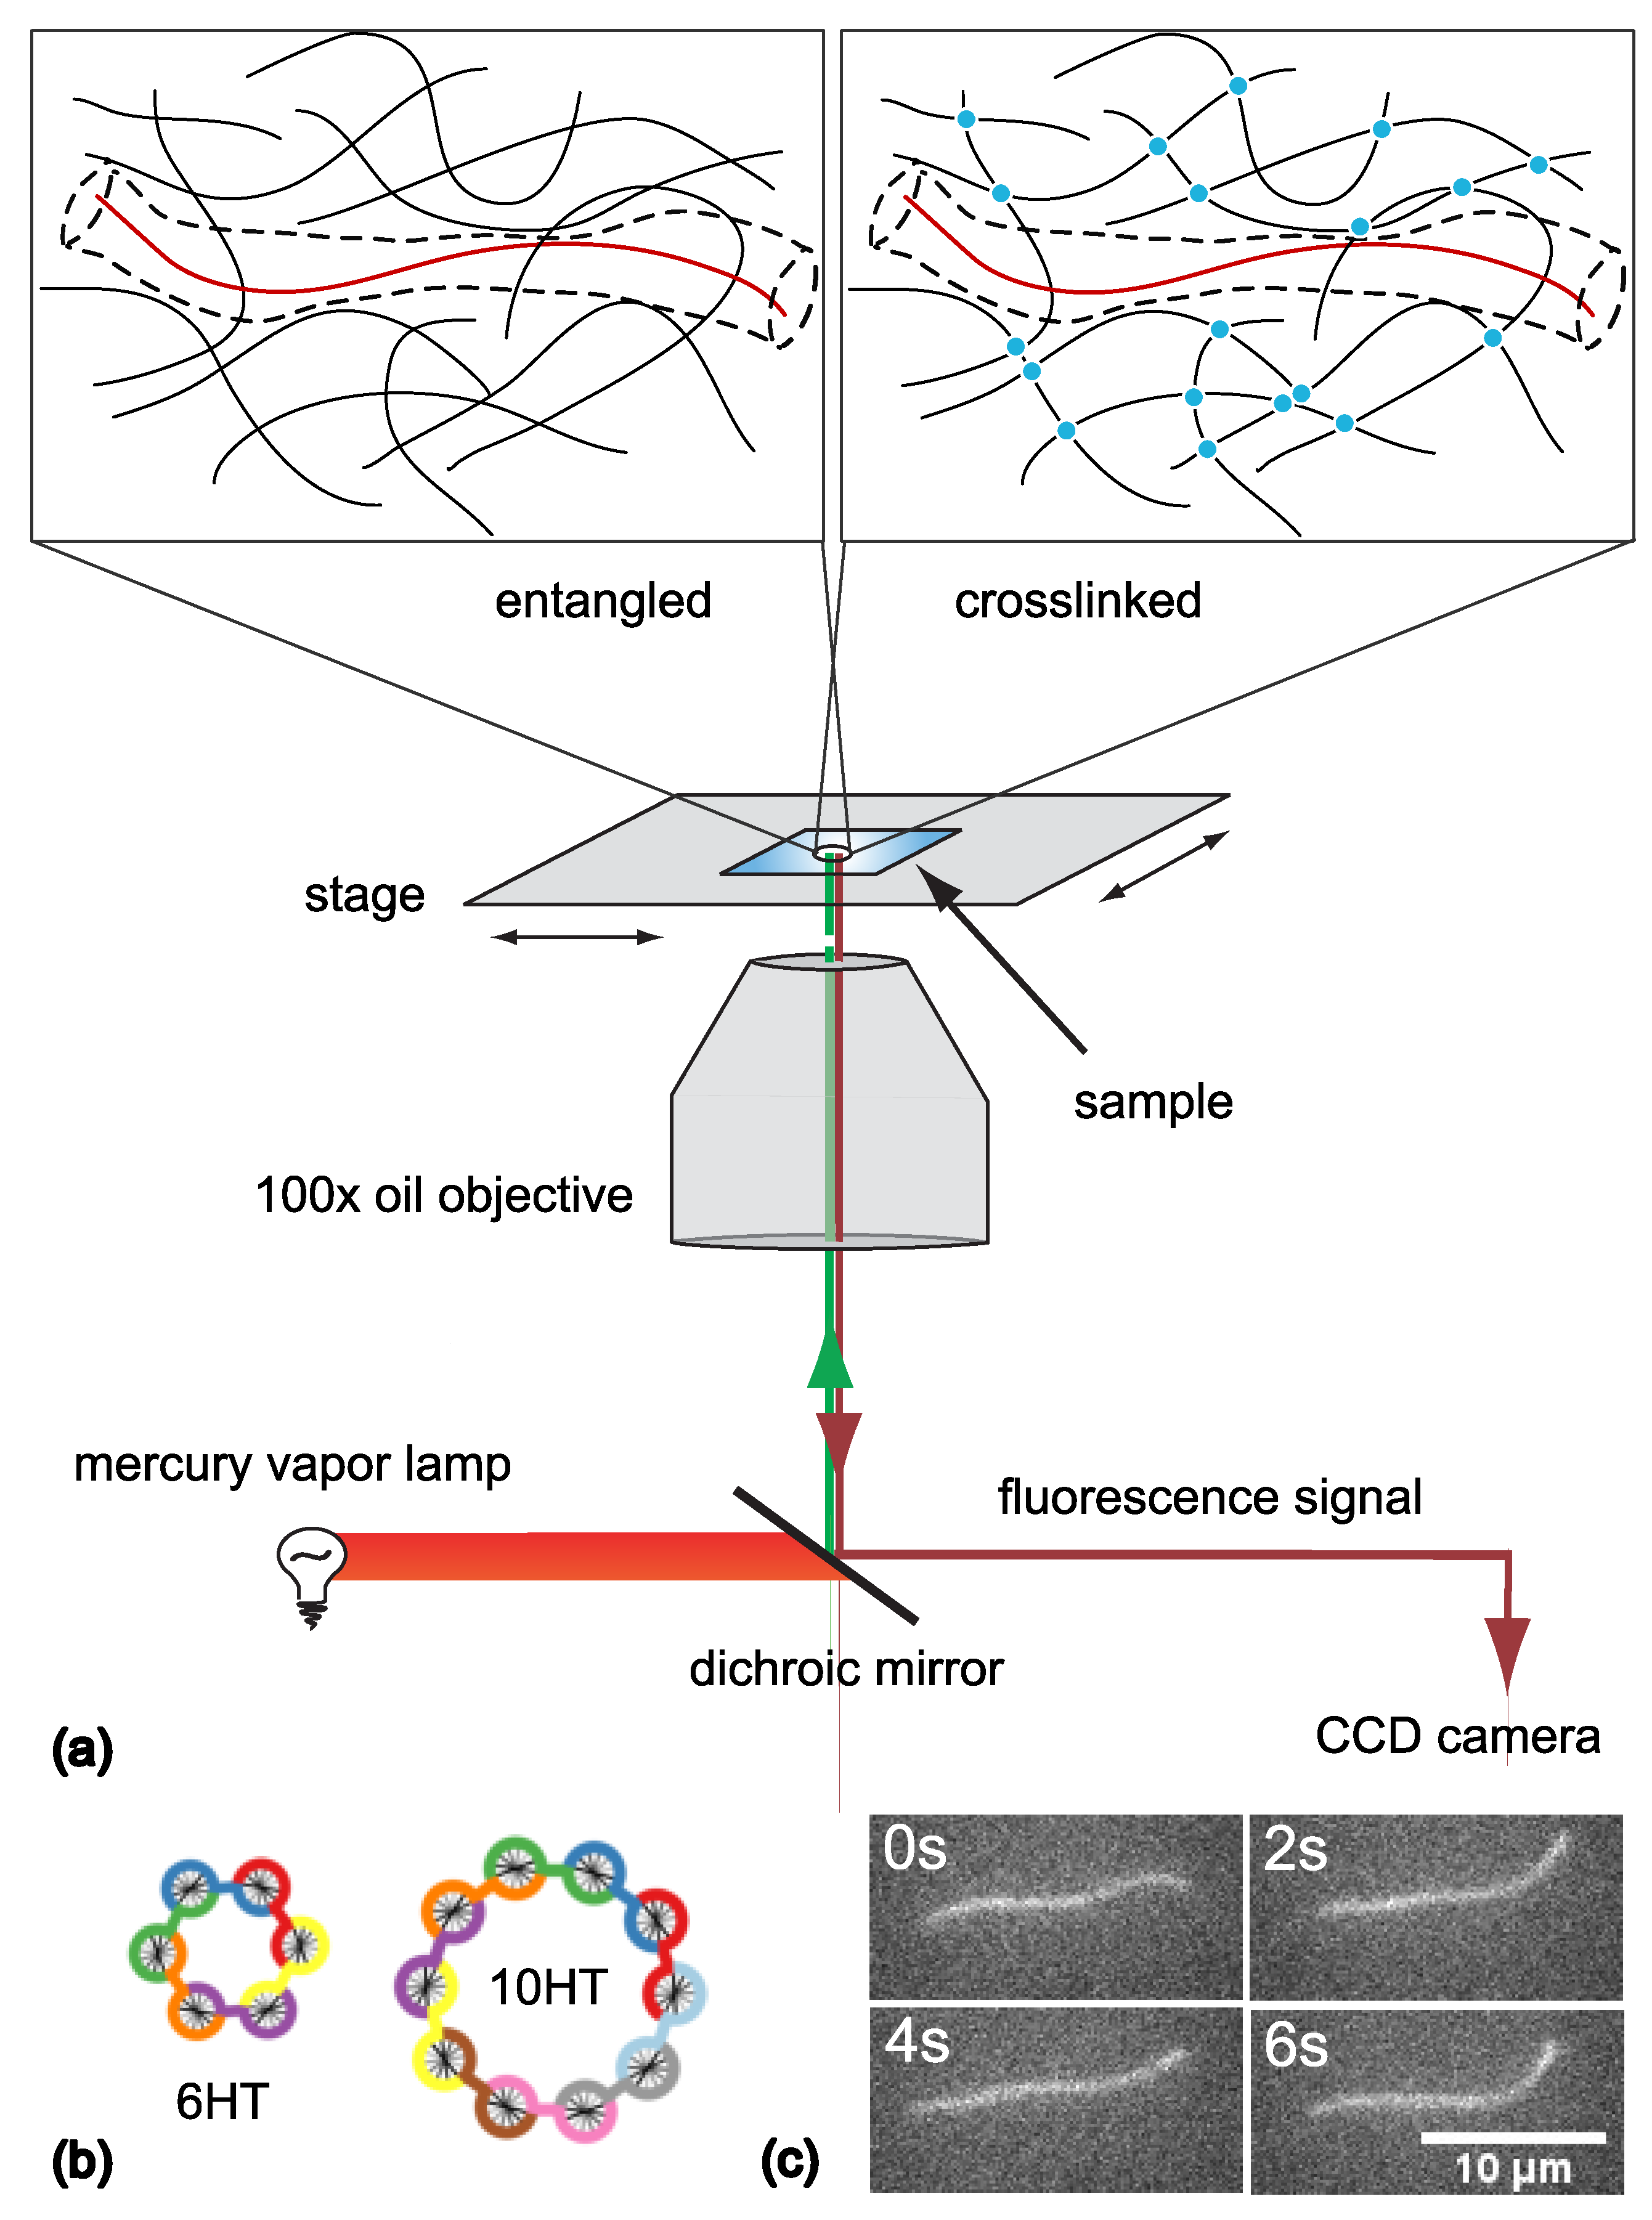
Abstract
:1. Introduction
2. Materials and Methods
2.1. F-Actin and Actin Crosslinker wLX
2.2. DNA Nanotubes as Tracers
2.3. Sample Preparation and Measurement
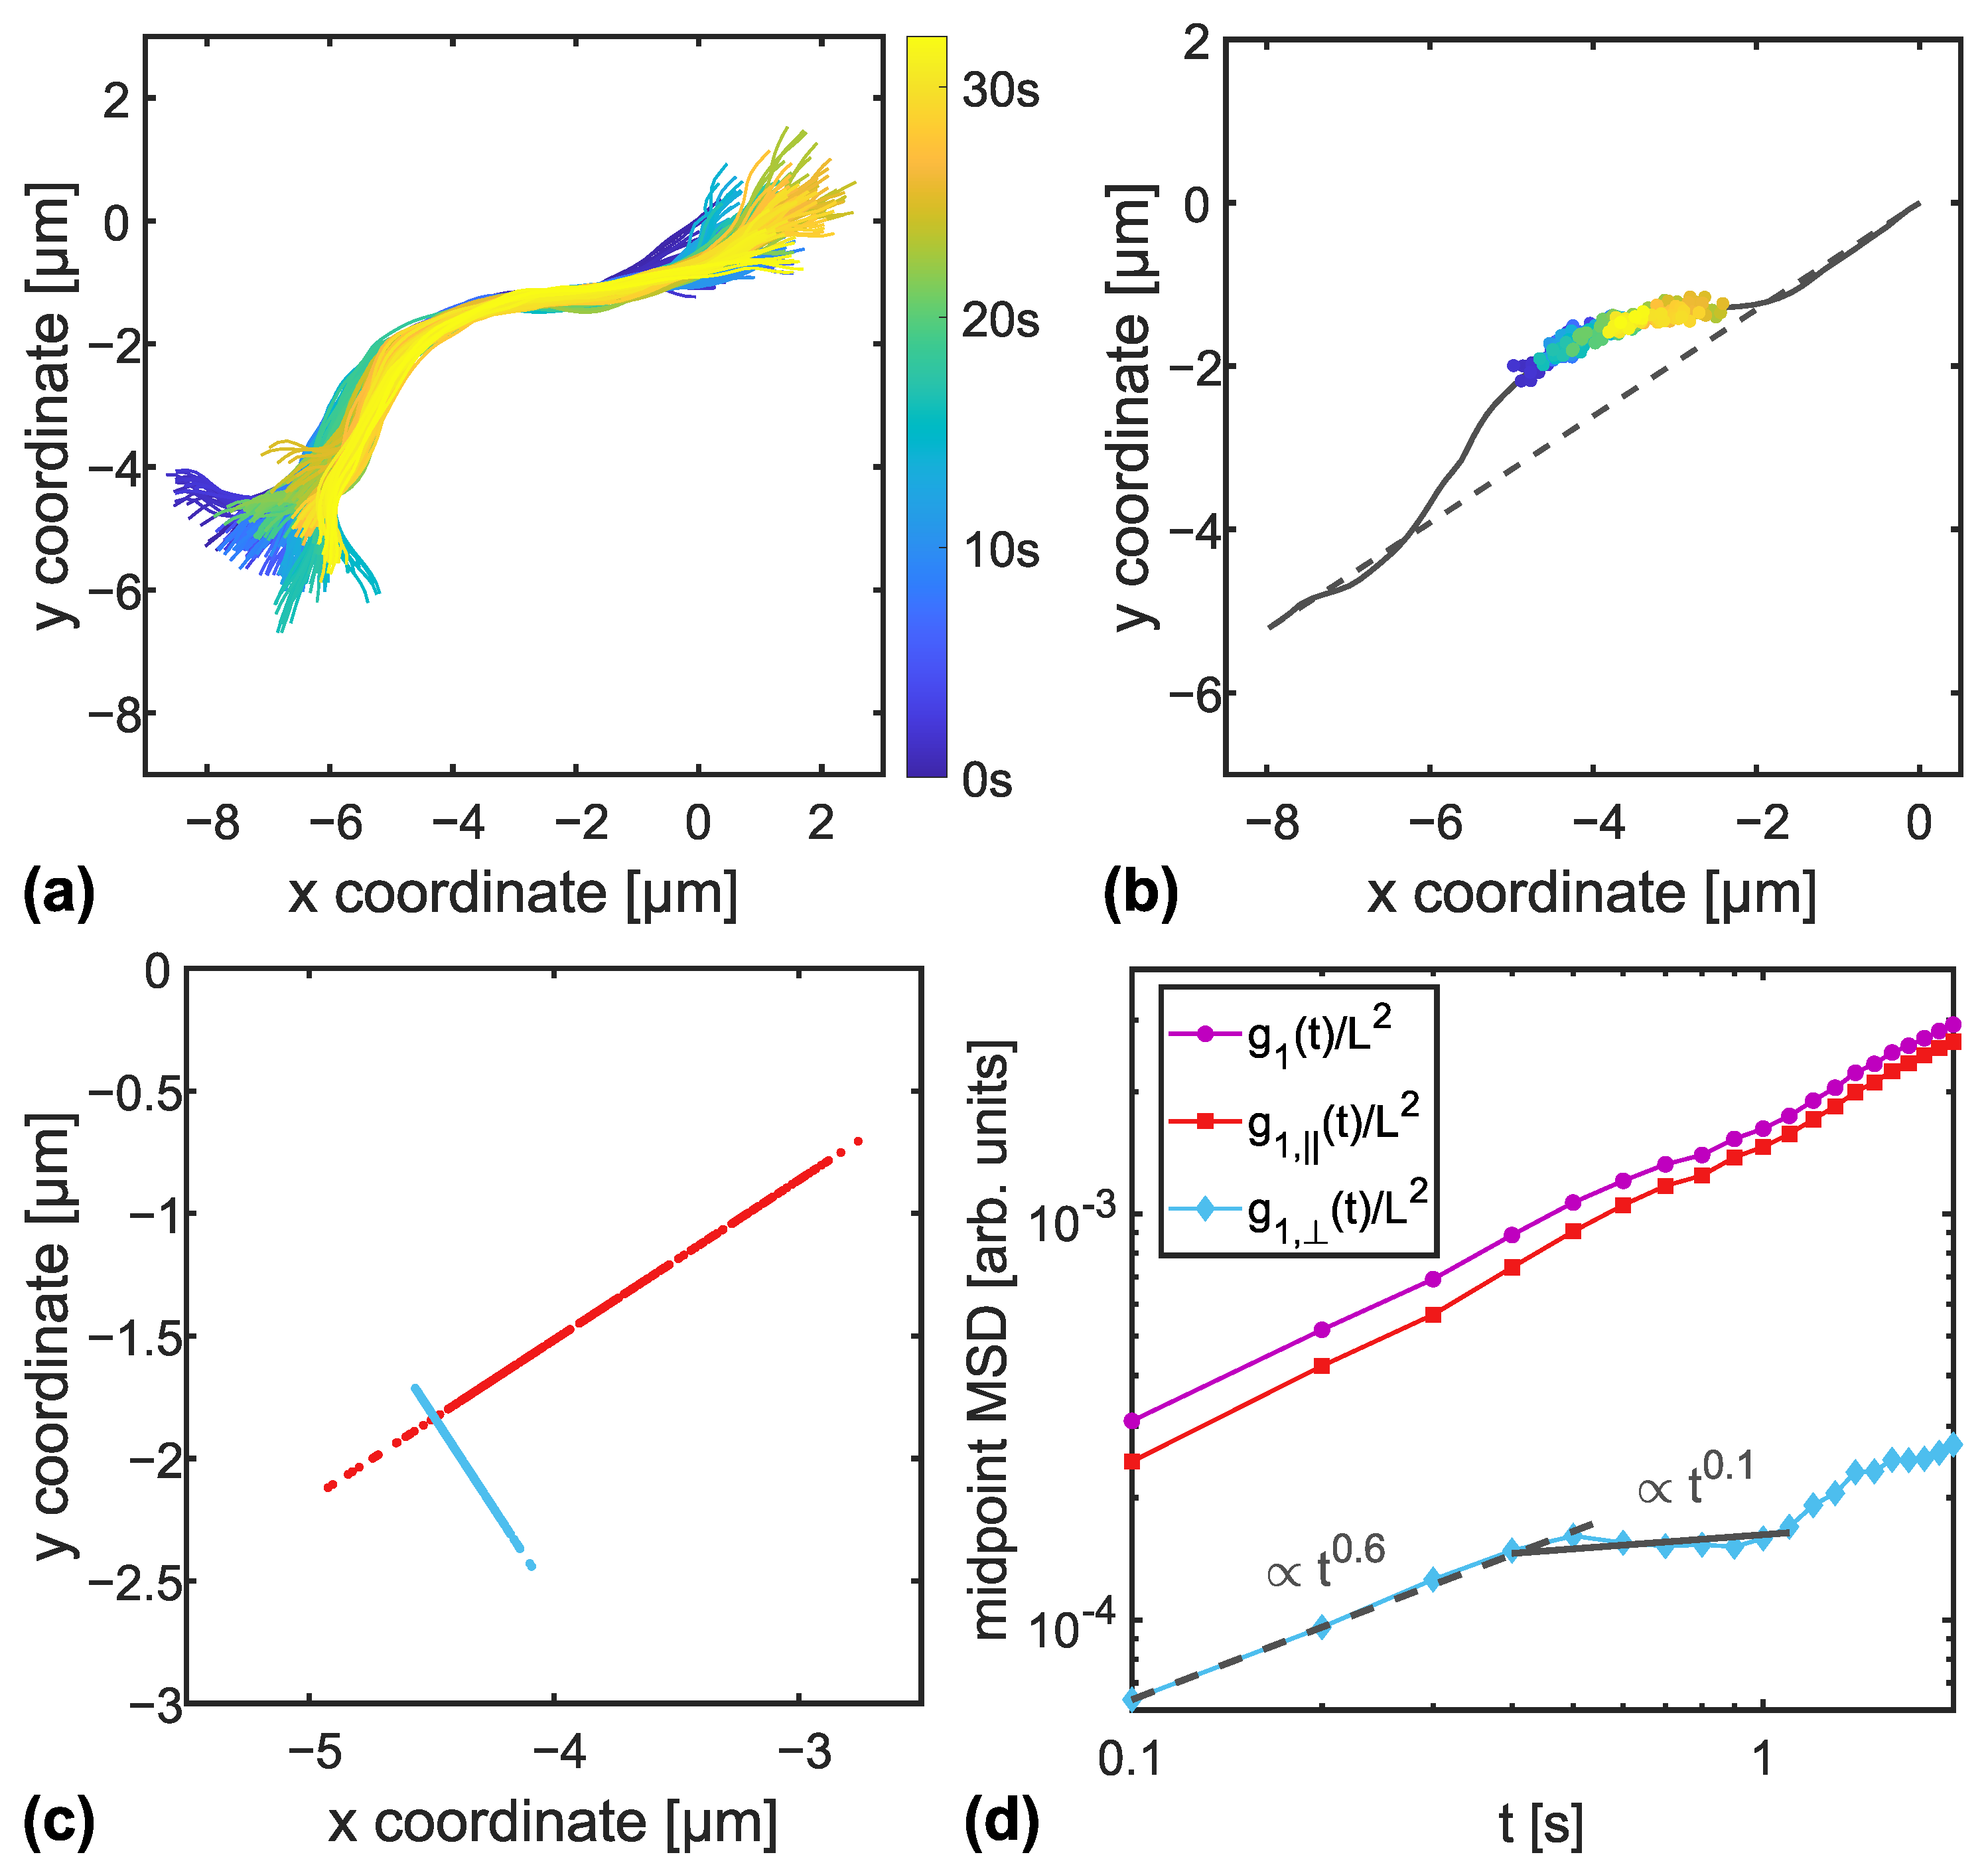
2.4. Data Analysis
2.5. Significance Test/Wilcoxon Rank-Sum Test
3. Results
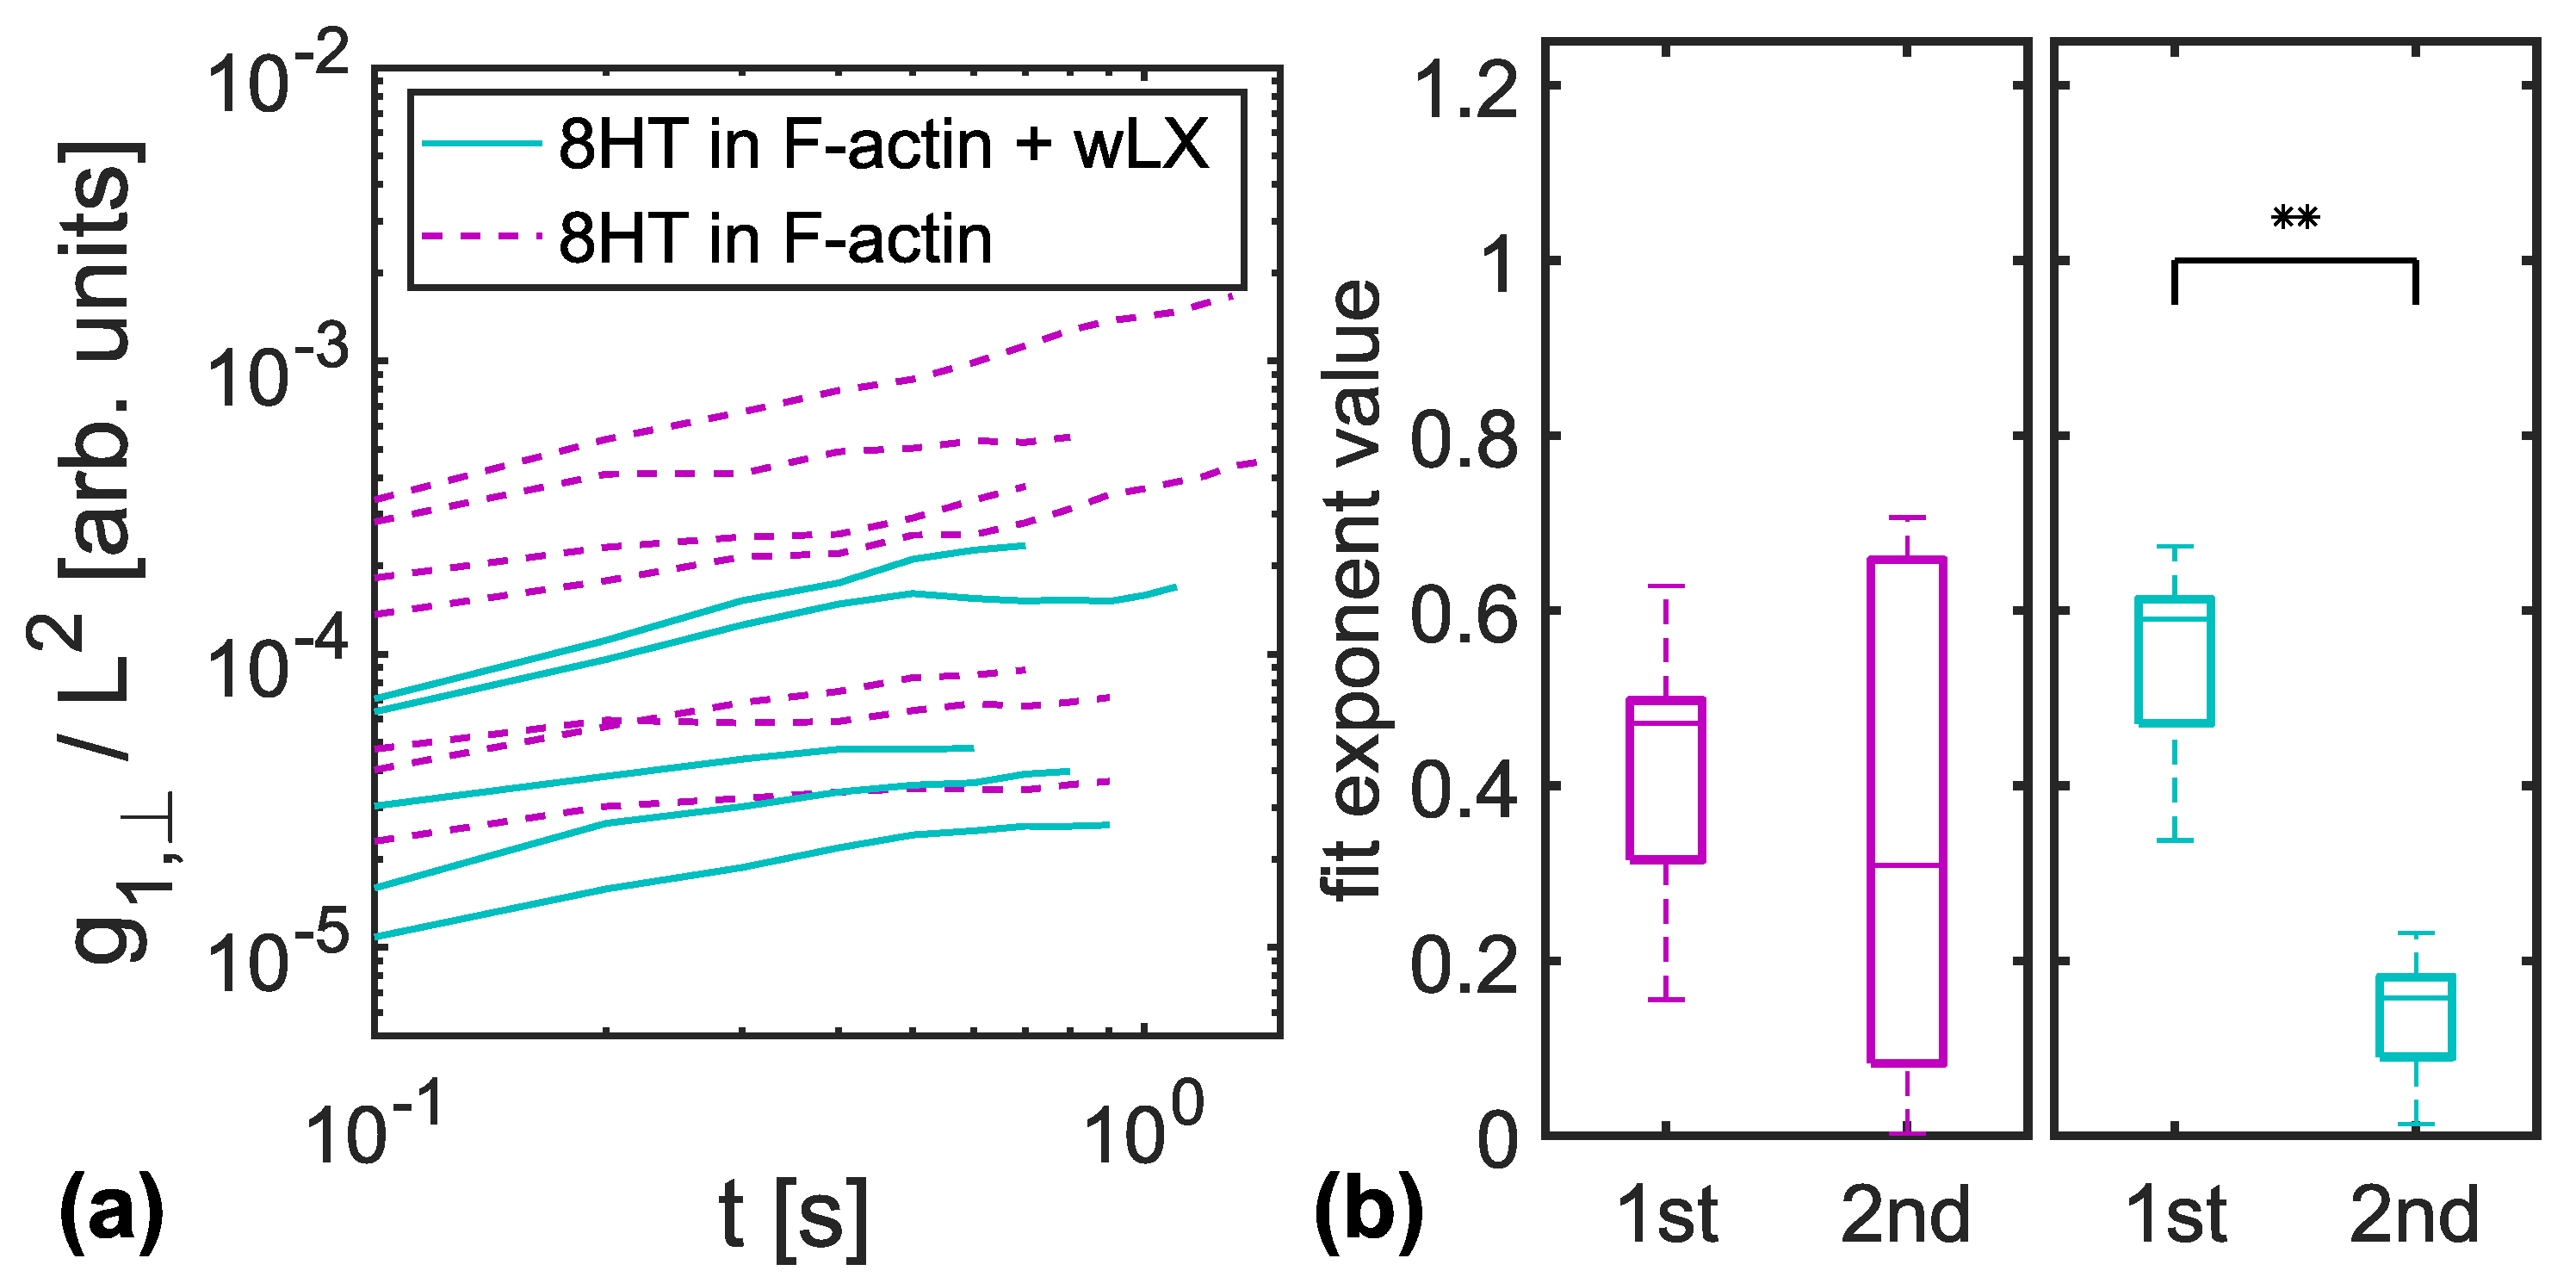
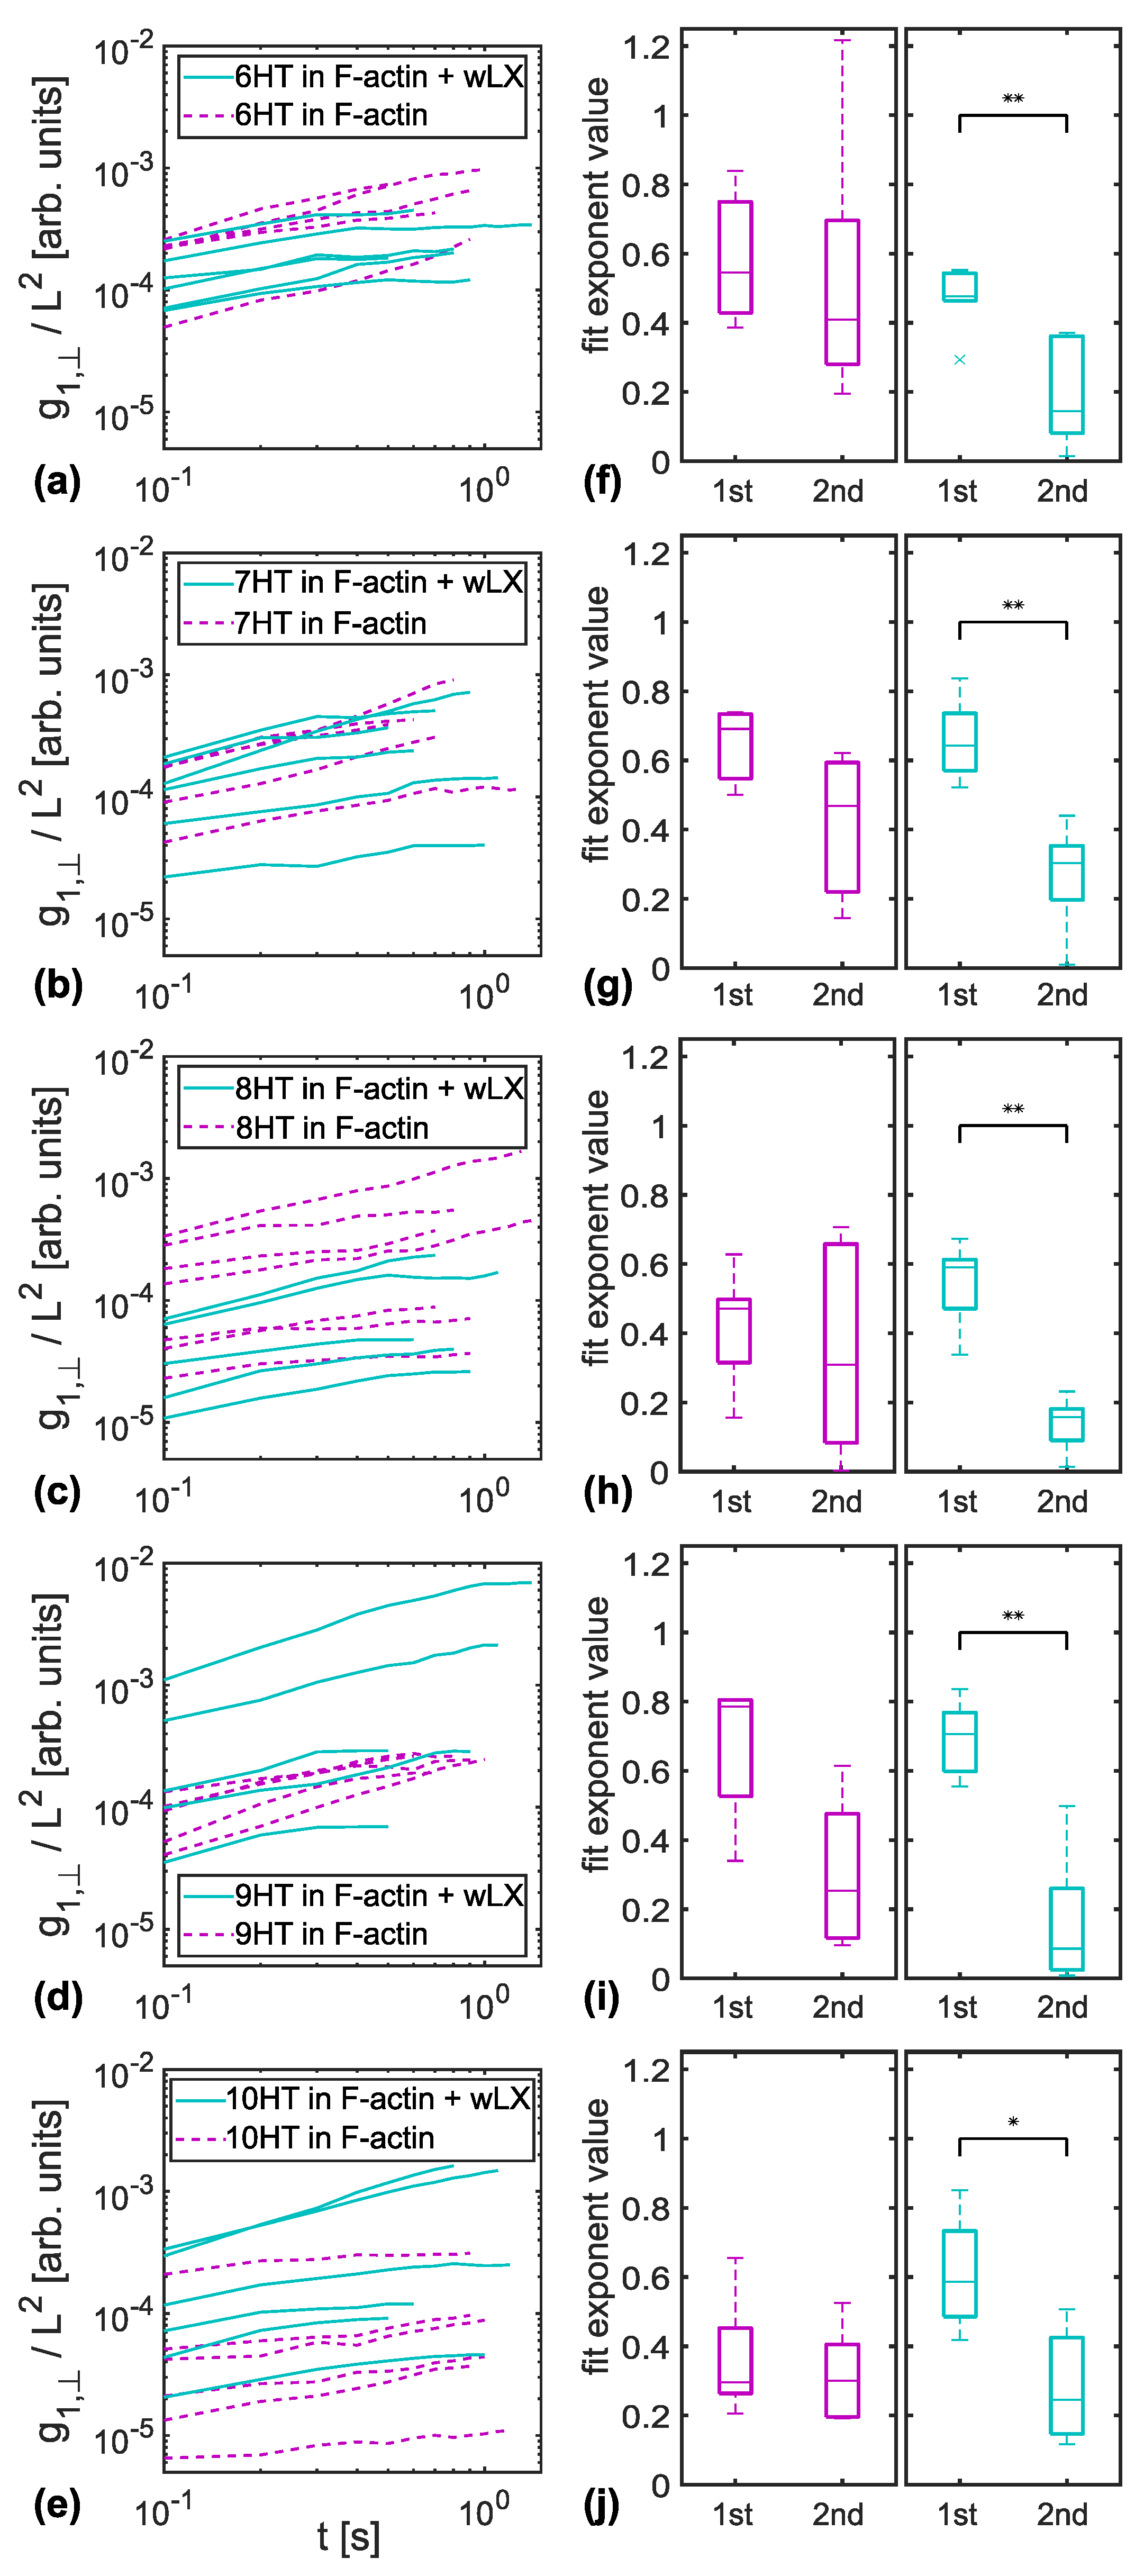
3.1. MSD of Transverse Fluctuations
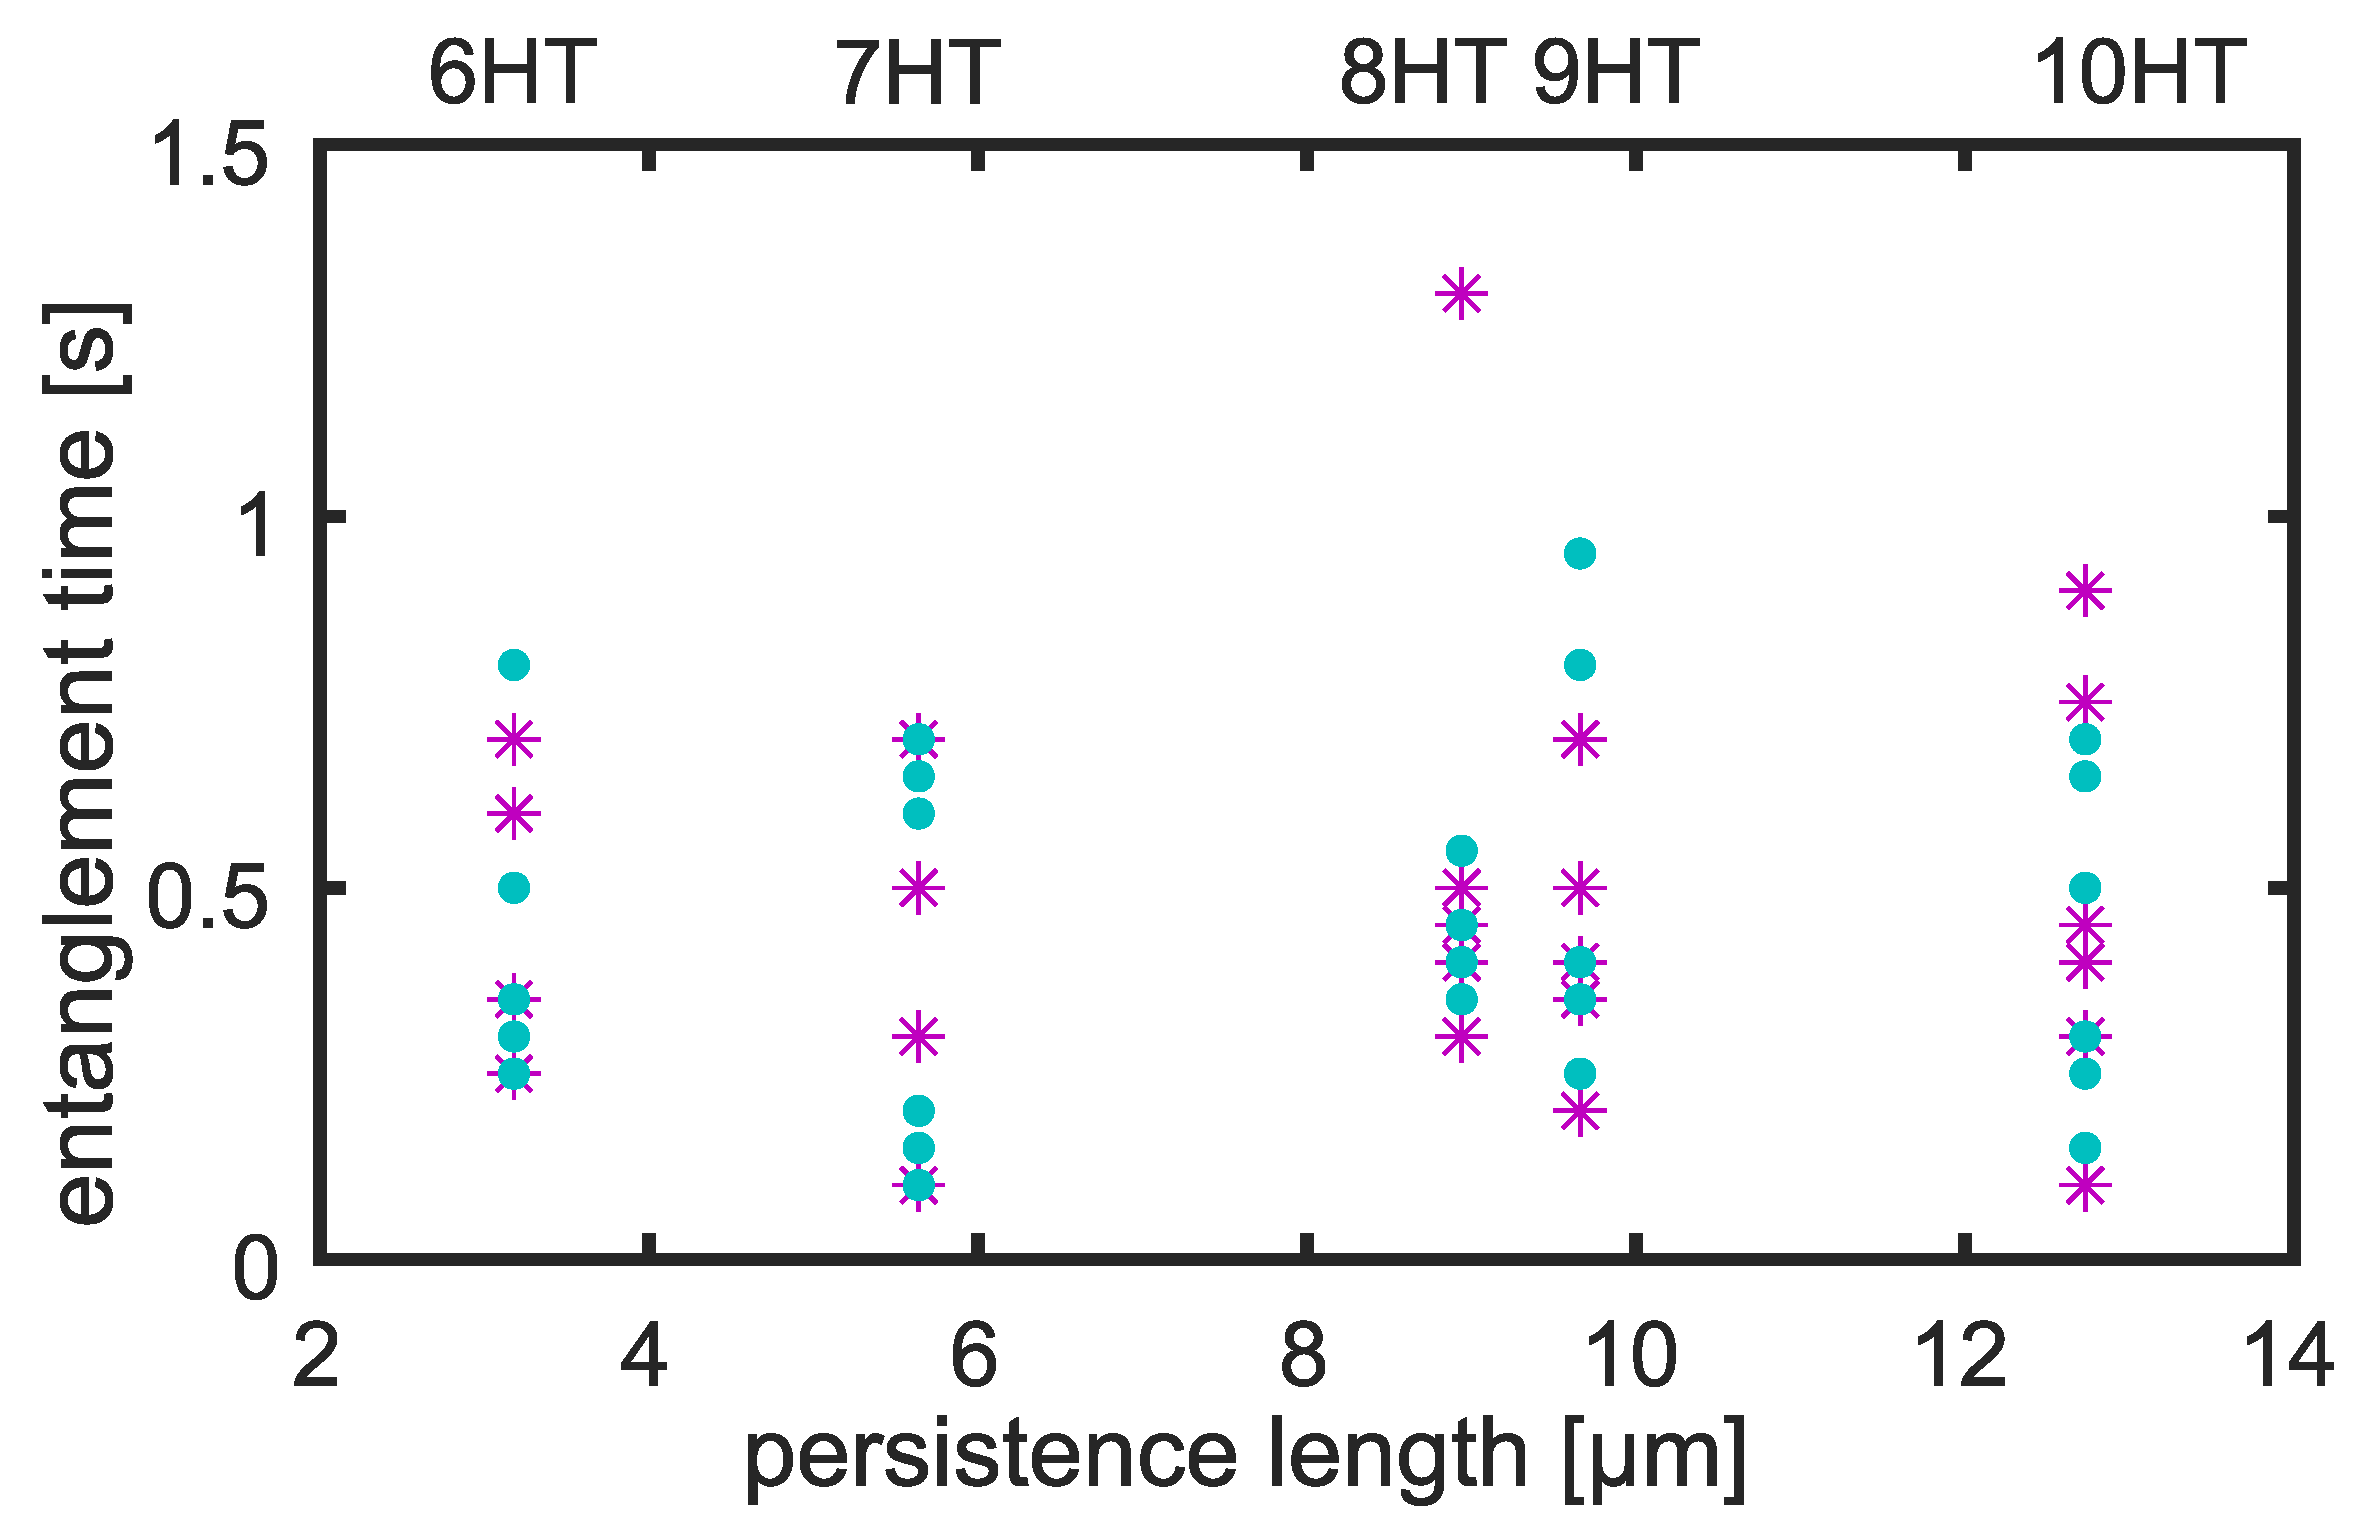
3.2. Entanglement Times
4. Discussion
4.1. Constraint Release in Entangled F-Actin Networks
4.2. Entanglement Time Dependency on Tracer Persistence Length
4.3. Conclusions
Author Contributions
Funding
Institutional Review Board Statement
Informed Consent Statement
Data Availability Statement
Acknowledgments
Conflicts of Interest
Abbreviations
| nHT | n-helix tube |
| wLX | weak LifeAct®-based crosslinker |
| MSD | mean squared displacement |
References
- Broedersz, C.; MacKintosh, F. Modeling semiflexible polymer networks. Rev. Mod. Phys. 2014, 86, 995–1036. [Google Scholar] [CrossRef] [Green Version]
- Tassieri, M. Dynamics of Semiflexible Polymer Solutions in the Tightly Entangled Concentration Regime. Macromolecules 2017, 50, 5611–5618. [Google Scholar] [CrossRef] [Green Version]
- Edwards, S.F. The statistical mechanics of polymerized material. Proc. Phys. Soc. 1967, 92, 9–16. [Google Scholar] [CrossRef]
- de Gennes, P.G. Reptation of a Polymer Chain in the Presence of Fixed Obstacles. J. Chem. Phys. 1971, 55, 572–579. [Google Scholar] [CrossRef]
- de Gennes, P.G.; Pincus, P.; Velasco, R.M.; Brochard, F. Remarks on polyelectrolyte conformation. J. Phys. 1976, 37, 13. [Google Scholar] [CrossRef]
- Odijk, T. The statistics and dynamics of confined or entangled stiff polymers. Macromolecules 1983, 16, 1340–1344. [Google Scholar] [CrossRef]
- Semenov, A.N. Dynamics of concentrated solutions of rigid-chain polymers. Part 1.—Brownian motion of persistent macromolecules in isotropic solution. J. Chem. Soc. Faraday Trans. 2 Mol. Chem. Phys. 1986, 82, 317–329. [Google Scholar] [CrossRef]
- Isambert, H.; Maggs, A.C. Dynamics and Rheology of Actin Solutions. Macromolecules 1996, 29, 1036–1040. [Google Scholar] [CrossRef] [Green Version]
- Morse, D.C. Tube diameter in tightly entangled solutions of semiflexible polymers. Phys. Rev. E 2001, 63, 031502. [Google Scholar] [CrossRef] [PubMed]
- Nam, G.; Johner, A.; Lee, N.K. Reptation of a semiflexible polymer through porous media. J. Chem. Phys. 2010, 133, 044908. [Google Scholar] [CrossRef] [PubMed]
- Käs, J.; Strey, H.; Sackmann, E. Direct imaging of reptation for semiflexible actin filaments. Nature 1994, 368, 226–229. [Google Scholar] [CrossRef] [PubMed]
- Dichtl, M.A.; Sackmann, E. Colloidal probe study of short time local and long time reptational motion of semiflexible macromolecules in entangled networks. New J. Phys. 1999, 1, 18.1–18.11. [Google Scholar] [CrossRef]
- Romanowska, M.; Hinsch, H.; Kirchgeßner, N.; Giesen, M.; Degawa, M.; Hoffmann, B.; Frey, E.; Merkel, R. Direct observation of the tube model in F-actin solutions: Tube dimensions and curvatures. EPL (Europhys. Lett.) 2009, 86, 26003. [Google Scholar] [CrossRef]
- Fakhri, N.; MacKintosh, F.C.; Lounis, B.; Cognet, L.; Pasquali, M. Brownian Motion of Stiff Filaments in a Crowded Environment. Science 2010, 330, 1804–1807. [Google Scholar] [CrossRef] [Green Version]
- Hinsch, H.; Wilhelm, J.; Frey, E. Quantitative tube model for semiflexible polymer solutions. Eur. Phys. J. E 2007, 24, 35–46. [Google Scholar] [CrossRef]
- Schuldt, C.; Schnauß, J.; Händler, T.; Glaser, M.; Lorenz, J.; Golde, T.; Käs, J.A.; Smith, D.M. Tuning Synthetic Semiflexible Networks by Bending Stiffness. Phys. Rev. Lett. 2016, 117, 197801. [Google Scholar] [CrossRef] [PubMed] [Green Version]
- Händler, T.; Tutmarc, C.; Glaser, M.; Freitag, J.S.; Smith, D.M.; Schnauß, J. Measuring structural parameters of crosslinked and entangled semiflexible polymer networks with single-filament tracing. Phys. Rev. E 2021, 103, 062501. [Google Scholar] [CrossRef]
- Schnauß, J.; Glaser, M.; Lorenz, J.S.; Schuldt, C.; Möser, C.; Sajfutdinow, M.; Händler, T.; Käs, J.A.; Smith, D.M. DNA Nanotubes as a Versatile Tool to Study Semiflexible Polymers. JoVE (J. Vis. Exp.) 2017, e56056. [Google Scholar] [CrossRef]
- Golde, T.; Glaser, M.; Tutmarc, C.; Elbalasy, I.; Huster, C.; Busteros, G.; Smith, D.M.; Herrmann, H.; Käs, J.A.; Schnauß, J. The role of stickiness in the rheology of semiflexible polymers. Soft Matter 2019, 15, 4865–4872. [Google Scholar] [CrossRef] [Green Version]
- Lang, P.; Frey, E. Disentangling entanglements in biopolymer solutions. Nat. Commun. 2018, 9, 494. [Google Scholar] [CrossRef]
- Yin, P.; Hariadi, R.F.; Sahu, S.; Choi, H.M.T.; Park, S.H.; LaBean, T.H.; Reif, J.H. Programming DNA Tube Circumferences. Science 2008, 321, 824–826. [Google Scholar] [CrossRef] [Green Version]
- Schiffels, D.; Liedl, T.; Fygenson, D.K. Nanoscale Structure and Microscale Stiffness of DNA Nanotubes. ACS Nano 2013, 7, 6700–6710. [Google Scholar] [CrossRef]
- Isambert, H.; Venier, P.; Maggs, A.C.; Fattoum, A.; Kassab, R.; Pantaloni, D.; Carlier, M.F. Flexibility of actin filaments derived from thermal fluctuations. Effect of bound nucleotide, phalloidin, and muscle regulatory proteins. J. Biol. Chem. 1995, 270, 11437–11444. [Google Scholar] [CrossRef] [PubMed] [Green Version]
- Lorenz, J.S.; Schnauß, J.; Glaser, M.; Sajfutdinow, M.; Schuldt, C.; Käs, J.A.; Smith, D.M. Synthetic Transient Crosslinks Program the Mechanics of Soft, Biopolymer-Based Materials. Adv. Mater. 2018, 30, 1706092. [Google Scholar] [CrossRef] [PubMed] [Green Version]
- Humphrey, D.; Duggan, C.; Saha, D.; Smith, D.; Käs, J. Active fluidization of polymer networks through molecular motors. Nature 2002, 416, 413–416. [Google Scholar] [CrossRef]
- Smith, D.; Ziebert, F.; Humphrey, D.; Duggan, C.; Steinbeck, M.; Zimmermann, W.; Käs, J. Molecular Motor-Induced Instabilities and Cross Linkers Determine Biopolymer Organization. Biophys. J. 2007, 93, 4445–4452. [Google Scholar] [CrossRef] [PubMed] [Green Version]
- Gentry, B.; Smith, D.; Käs, J. Buckling-induced zebra stripe patterns in nematic F-actin. Phys. Rev. E 2009, 79, 031916. [Google Scholar] [CrossRef]
- Čapek, M.; Janáček, J.; Kubínová, L. Methods for compensation of the light attenuation with depth of images captured by a confocal microscope. Microsc. Res. Tech. 2006, 69, 624–635. [Google Scholar] [CrossRef]
- Smith, M.B.; Li, H.; Shen, T.; Huang, X.; Yusuf, E.; Vavylonis, D. Segmentation and tracking of cytoskeletal filaments using open active contours. Cytoskeleton 2010, 67, 693–705. [Google Scholar] [CrossRef] [Green Version]
- Saxton, M.J. Single-particle tracking: The distribution of diffusion coefficients. Biophys. J. 1997, 72, 1744–1753. [Google Scholar] [CrossRef] [Green Version]
- Gardel, M.L.; Shin, J.H.; MacKintosh, F.C.; Mahadevan, L.; Matsudaira, P.; Weitz, D.A. Elastic Behavior of Cross-Linked and Bundled Actin Networks. Science 2004, 304, 1301–1305. [Google Scholar] [CrossRef] [PubMed] [Green Version]


Publisher’s Note: MDPI stays neutral with regard to jurisdictional claims in published maps and institutional affiliations. |
© 2022 by the authors. Licensee MDPI, Basel, Switzerland. This article is an open access article distributed under the terms and conditions of the Creative Commons Attribution (CC BY) license (https://creativecommons.org/licenses/by/4.0/).
Share and Cite
Händler, T.; Tutmarc, C.; Freitag, J.S.; Smith, D.M.; Schnauß, J. Constraint Release for Reptating Filaments in Semiflexible Networks Depends on Background Fluctuations. Polymers 2022, 14, 707. https://doi.org/10.3390/polym14040707
Händler T, Tutmarc C, Freitag JS, Smith DM, Schnauß J. Constraint Release for Reptating Filaments in Semiflexible Networks Depends on Background Fluctuations. Polymers. 2022; 14(4):707. https://doi.org/10.3390/polym14040707
Chicago/Turabian StyleHändler, Tina, Cary Tutmarc, Jessica S. Freitag, David M. Smith, and Jörg Schnauß. 2022. "Constraint Release for Reptating Filaments in Semiflexible Networks Depends on Background Fluctuations" Polymers 14, no. 4: 707. https://doi.org/10.3390/polym14040707