Article

A Surface Plasmon Resonance-Based Photonic Crystal Fiber Sensor for Simultaneously Measuring the Refractive Index and Temperature

1
The State Key Laboratory of Information Photonics and Optical Communications, Beijing University of Posts and Telecommunications, Beijing 100876, China
2
Research Center for Convergence Networks and Ubiquitous Services, University of Science Technology Beijing, Beijing 100083, China
3
Department of Physics and Electrical Engineering, Northumbria University, Newcastle upon Tyne NE1 8ST, UK
*
Authors to whom correspondence should be addressed.
Polymers 2022, 14(18), 3893; https://doi.org/10.3390/polym14183893
Submission received: 30 August 2022 / Revised: 8 September 2022 / Accepted: 9 September 2022 / Published: 17 September 2022

Abstract

:
In this paper, a surface plasmon resonance (SPR)-based photonic crystal fiber (PCF) sensor is proposed for simultaneously measuring the refractive index (RI) and temperature. In the design, the central air hole and external surface of the proposed PCF are coated with gold films, and an air hole is filled with the temperature-sensitive material (TSM). By introducing the inner and outer gold films and TSM, the RI and temperature can be measured simultaneously at different wavelength regions. The simulation results show that the average wavelength sensitivities of the proposed SPR-based PCF sensor can reach 4520 nm/RIU and 4.83 nm/°C in the RI range of 1.35~1.40 and a temperature range of 20~60 °C, respectively. Moreover, because of using the different wavelength regions for sensing, the RI and temperature detections of the proposed SPR-based PCF sensor can be achieved independently. It is believed that the proposed SPR-based PCF RI and temperature sensor has important applications in biomedicine and in environmental science.

1. Introduction

Surface plasmon resonance (SPR) is an optical phenomenon caused by collective electronic vibration at the metal–dielectric interface [1,2,3]. When the SPR effect occurs, the concentration of the electromagnetic fields in the medium increases greatly, so that it is highly sensitive to the change of the refractive index (RI) of the surrounding media. Owing to the potential for monitoring changes at the metal interfaces, the SPR effect is widely used in the field of sensing [4,5,6,7]. In recent years, with the emergence of photonic crystal fiber (PCF), it has been found that PCF can be well combined with the SPR effect due to its unique optical characteristics and controllable structures [8,9,10,11]. Many works have been concentrated on utilizing the SPR-based PCF sensor to measure the RI [12], temperature [13], magnetic field [14], strain [15], and biological samples [16].
As the design and fabrication technologies of the PCF develop, different kinds of SPR-based PCF sensors have been proposed. In 2020, Hossain et al. improved the RI sensing performance by introducing a hollow core to interact with the metallic surface coated at the external of the PCF. In this work, a sensitivity of 21,000 nm/RIU was achieved in the RI detection range from 1.33 to 1.42 [17]. In the same year, Qiu et al. proposed an all-solid cladding dual-core PCF filled with toluene and ethanol, whose temperature sensitivity reached −15 nm/°C [18]. In 2022, Zhang et al. proposed a novel SPR-PCF RI sensor that could realize an ultra-wide detection range for both the x-polarization and y-polarization core mode [19]. However, the single parameter measurement sensor cannot meet some complex scenarios in the practical applications. In addition, the simple cascaded single parameter sensor has serious crosstalk problem between different sensing parameters. Therefore, some researchers have proposed multi-parameter sensors to effectively solve the problem. In 2015, Yin et al. demonstrated a novel scheme for the simultaneous measurement of the temperature and RI by cascading a liquid-filled PCF and a long period fiber grating [20]. It is difficult for the proposed scheme to simplify the structure and improve the sensitivity. In 2019, Liu et al. proposed an RI and a temperature sensor based on the SPR effect in D-shaped PCF. It was demonstrated that the maximum RI and temperature sensitivities of the proposed sensor achieved 44,850 nm/RIU and −16.875 nm/°C, respectively [21]. It is impossible for the proposed sensor to simultaneously measure the RI and temperature because the analyte to be measured cannot be changed. In 2020, Guo et al. proposed a D-shaped SPR-based PCF filled with the liquid crystal for detecting the RI and temperature. The simulation results showed that the proposed sensor had RI and temperature sensitivities of 2275 nm/RIU and 9.09 nm/°C, respectively [22]. For the proposed sensor, the influences of the temperature and RI of the analyte to be measured on the core mode cannot be separated, and so it is difficult to realize the simultaneous measurement of the two parameters.
At present, some works have achieved the simultaneous measurement of different parameters by using the orthogonal polarization states of the core mode at the same wavelength region. In 2021, Danlard et al. designed a quasi D-shape temperature and RI SPR-based PCF sensor coated with gold material and filled with temperature-sensitive material (TSM), where the sensitivity reached 5000 nm/RIU in the RI range from 1.35 to 1.46 for the y-pol core mode, as well as 3.0 nm/°C in the temperature range from −50 to 50 °C for the x-pol core mode [23]. In 2021, Chen et al. reported highly sensitive detection of the RI and temperature based on the D-shaped SPR-based PCF sensor filled with the selective TSM ethanol. The simulation results showed a sensitivity of 3940 nm/RIU in the RI range of 1.35 to 1.40 for the y-pol core mode, and a sensitivity of 1.075 nm/°C in the temperature range of 20 to 60 °C for the x-pol core mode were achieved [24]. In previous works, although the RI and temperature can be measured simultaneously, the method of using the orthogonal polarization states cannot completely isolate the crosstalk between the two parameters. Therefore, there is an urgent need to design the multi-parameter sensor, which could realize the simultaneous sensing of different parameters, along with negligible crosstalk.
In this paper, a simple SPR-based PCF sensor that can simultaneously measure the RI and temperature is proposed. The RI and temperature sensing performances of the proposed SPR-based PCF sensor is investigated by using the finite element method (FEM). By introducing the inner and outer gold films and TSM, the RI and temperature can be measured simultaneously at different wavelength regions. Moreover, it can avoid crosstalk between the two parameters and realize independent sensing. The simulation result shows that the average wavelength sensitivity of the proposed sensor can reach 4520 nm/RIU in the RI range of 1.35~1.40 and 4.83 nm/°C in the temperature range of 20~60 °C, respectively. It is believed that the proposed SPR-based PCF RI and temperature sensor has important applications in biomedicine and environmental science.

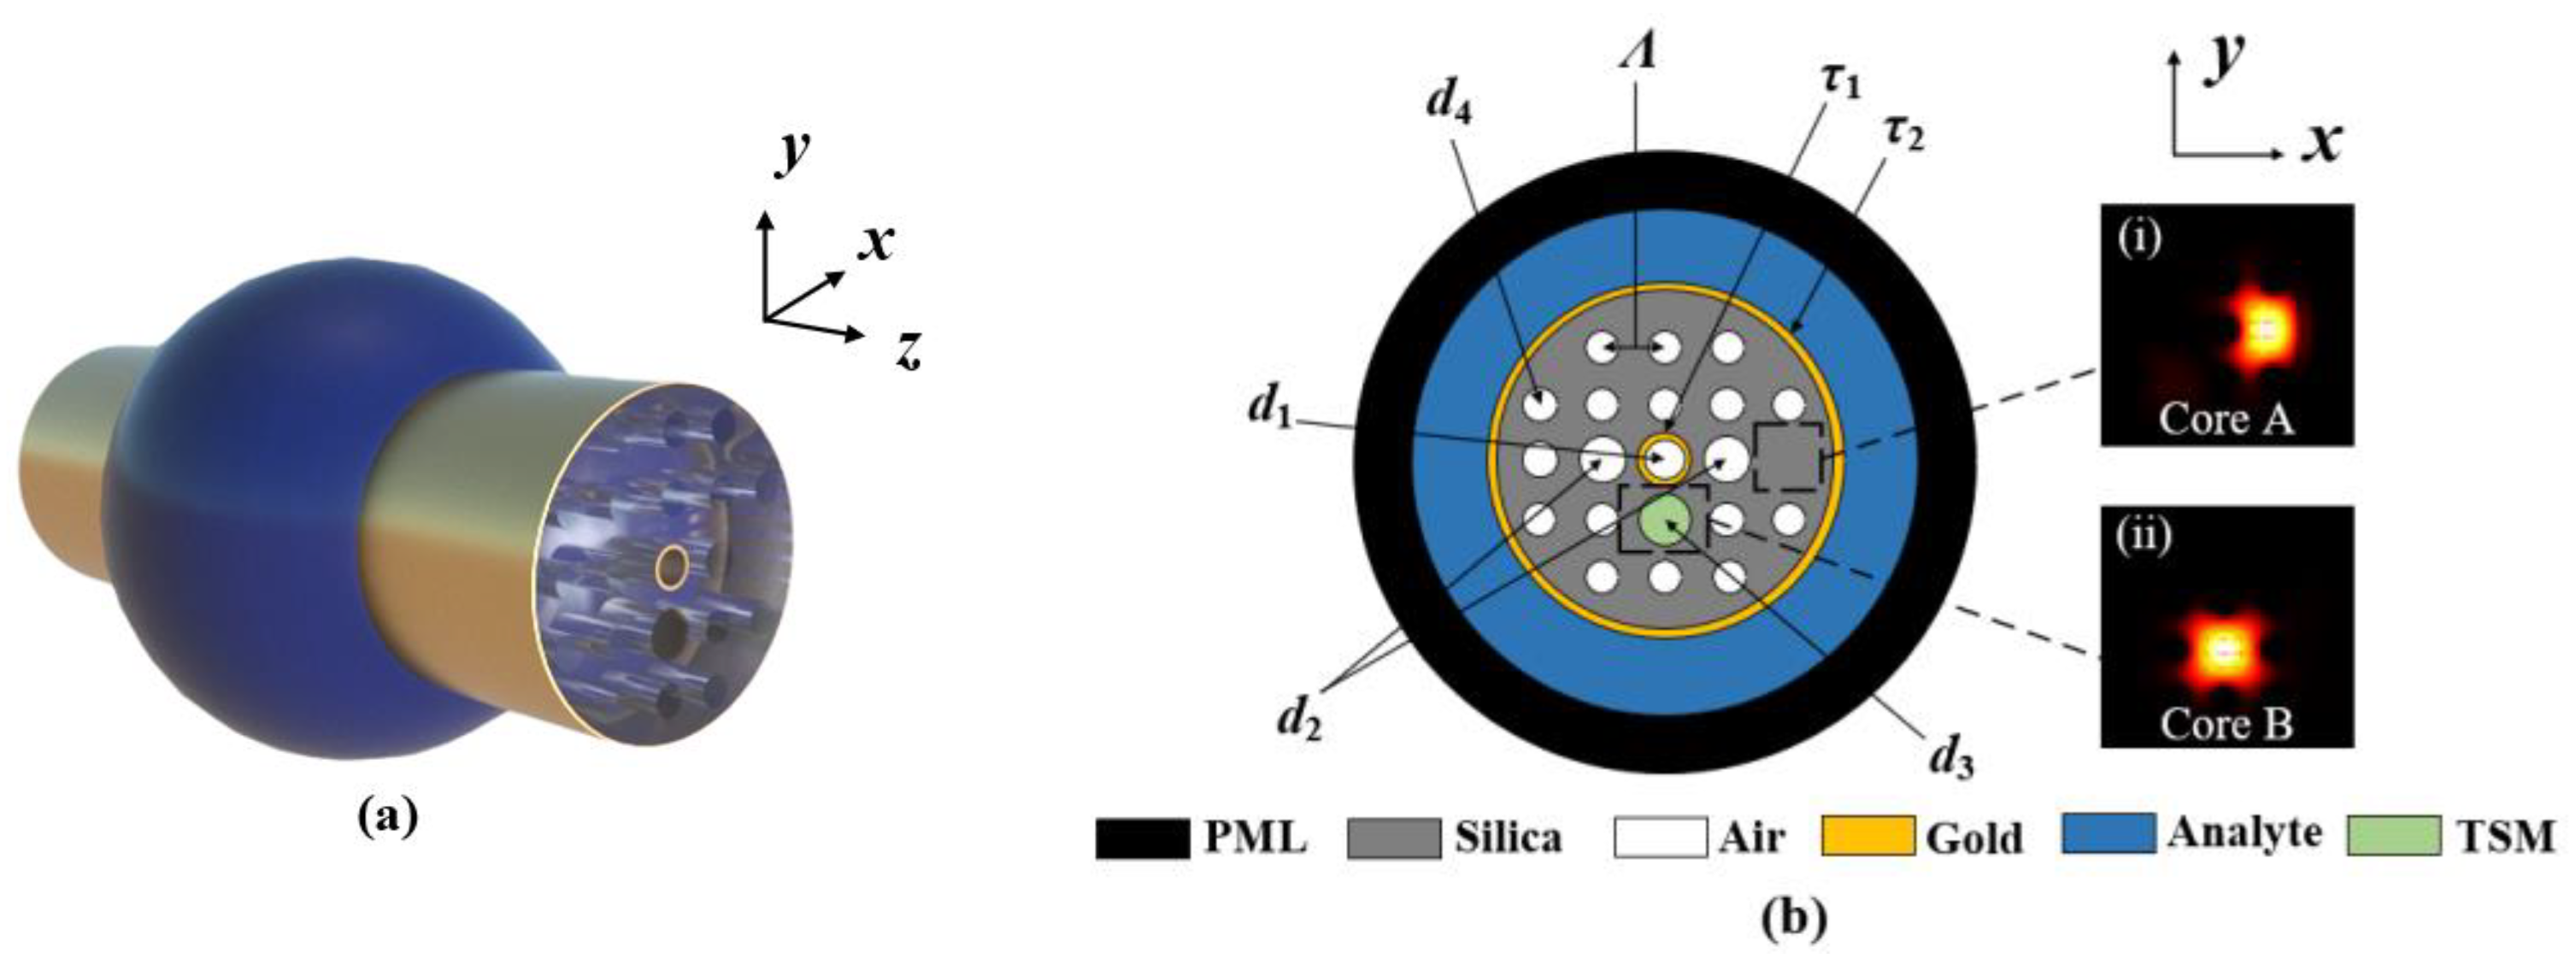
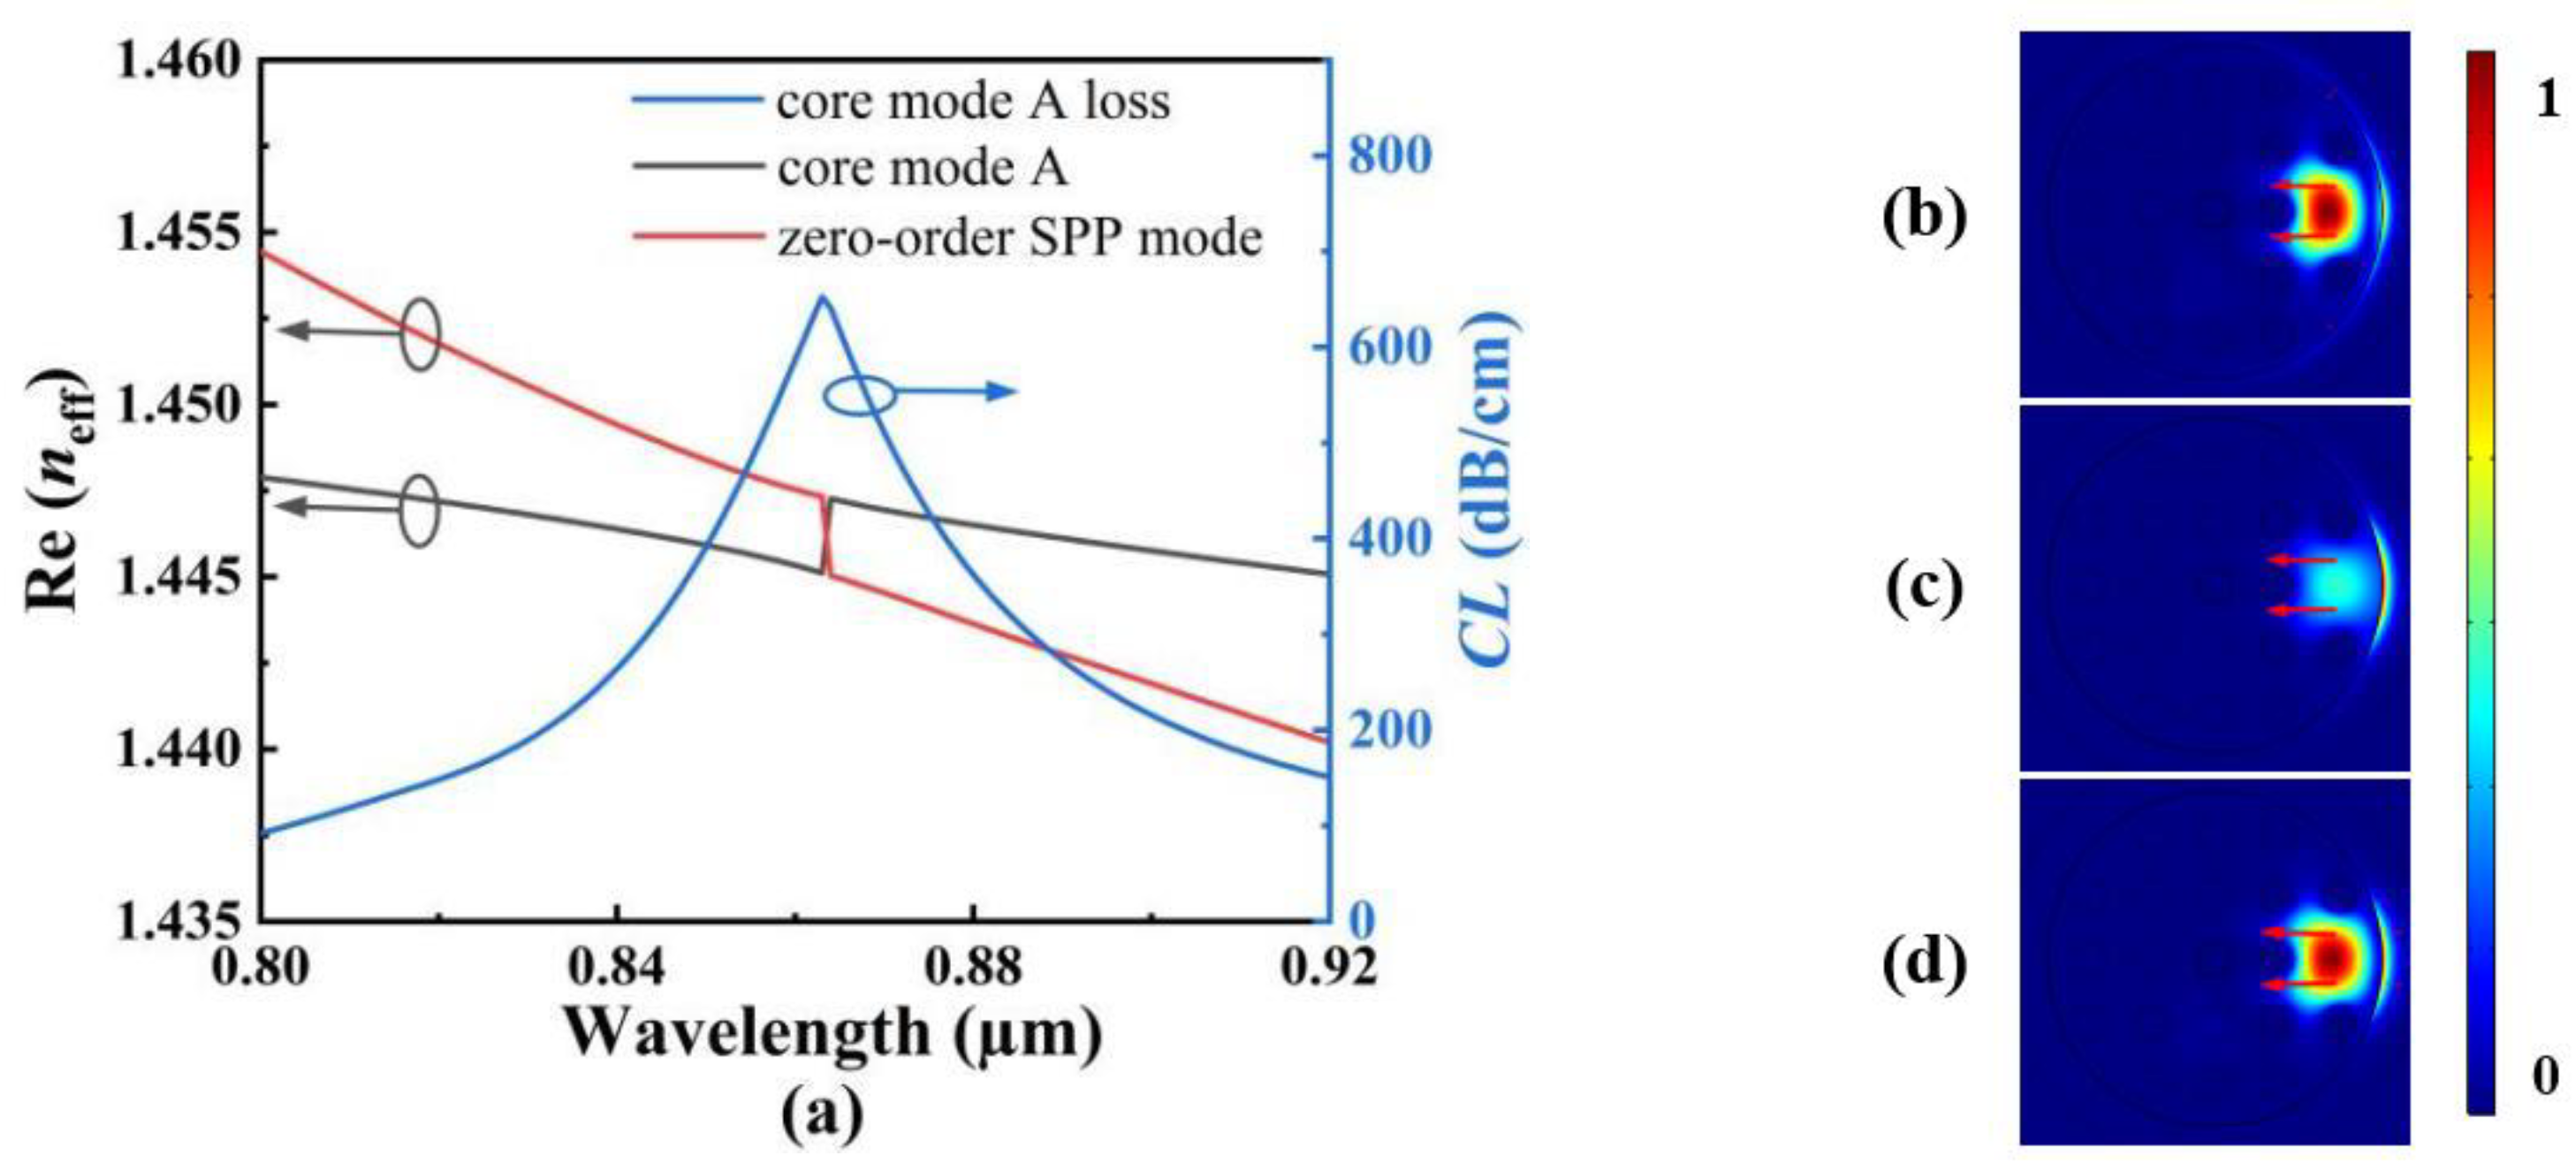
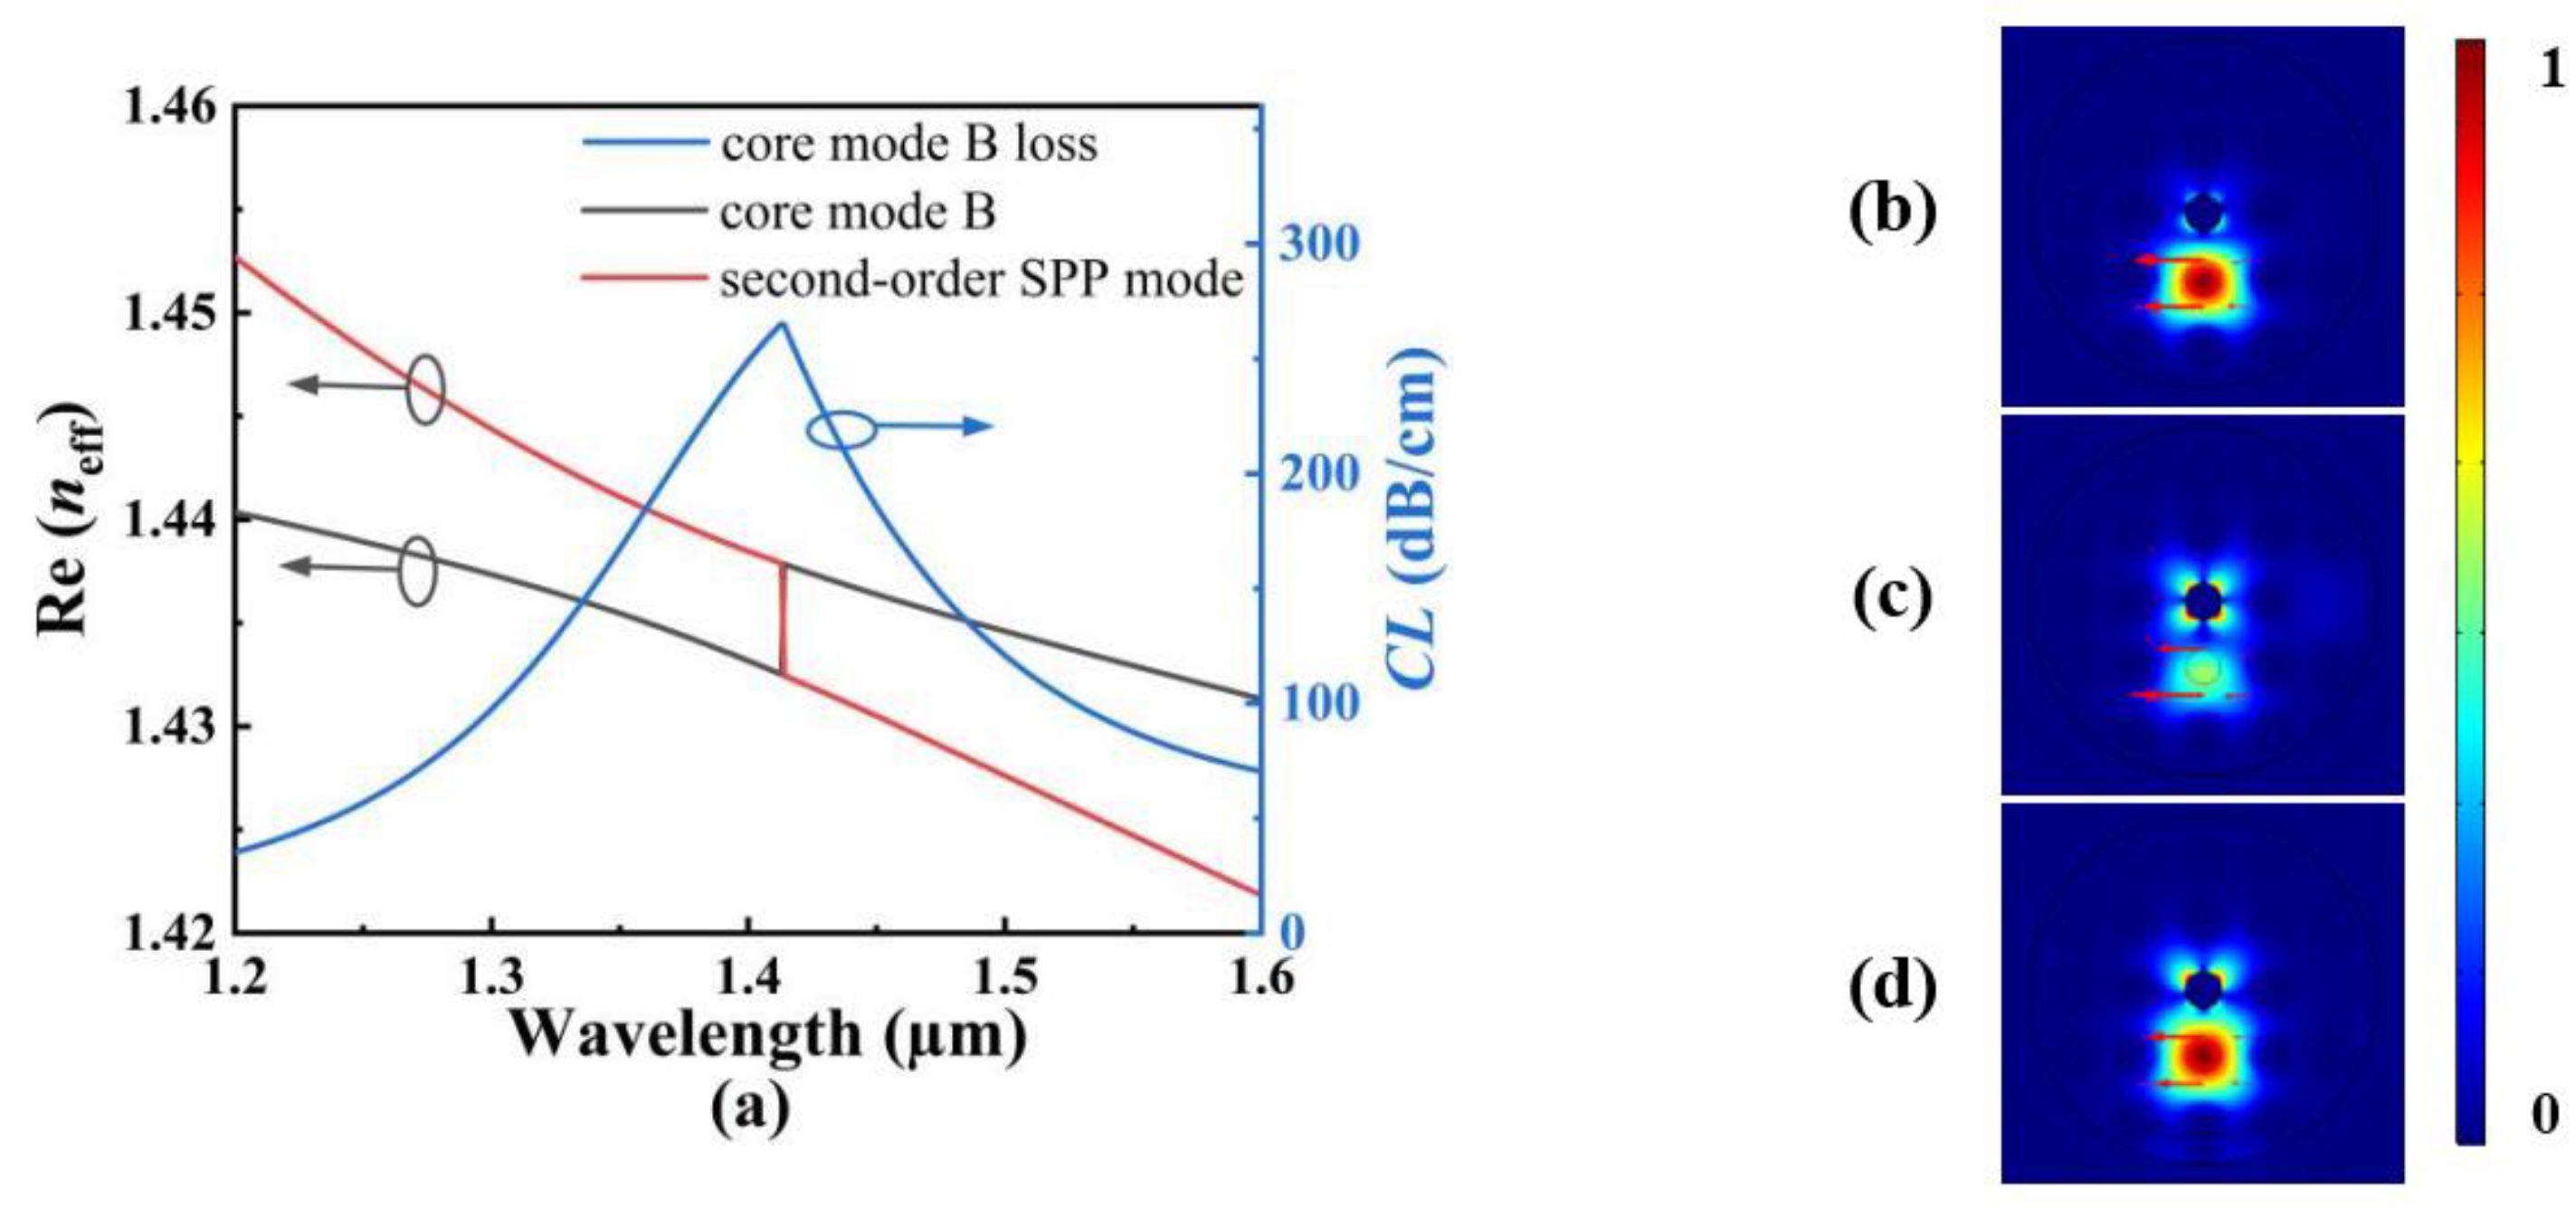
2. Design and Operating Principle of the SPR-Based PCF Sensor

Figure 1a shows the 3D view of the proposed SPR-based PCF sensor. Figure 1b shows the cross-sectional schematic of the SPR-based PCF sensor, and the inserts (i) and (ii) show the electric field distributions of the cores A and B, which can be used for achieving RI and temperature sensing, respectively. The fiber structure consists of two layers of air holes arranged in a rectangle lattice with a lattice spacing of Λ. To excite the SPR effect, the central air hole and the external surface of the proposed PCF are coated with gold films, which are referred to as the inner and outer gold films, respectively. On the x-axis side of the outer air holes, an air hole is omitted for forming the core A. Meanwhile, the four corners of the outer air holes are omitted for reducing the distance between the core A and the outer gold film, to enhance the intensity of the evanescent field. The diameter of the central air hole is d1, and the diameter of the air holes in the first layer along the x-axis direction is d2. On the y-axis side of the first layer of air holes, an air hole with the diameter d3 is filled with the TSM, forming the core B, and the diameter of the other air holes is d4. The thicknesses of the inner and gold films are τ1 and τ2, respectively. A liquid analyte with a thickness of 5 μm is introduced on the outside of the outer gold film. In the simulation, the eigenmode is solved using the FEM, and a perfectly matched layer (PML) is placed to truncate the computational region and to absorb the radiation energy [25,26]. Fused silica is used as the background material, whose material RI can be obtained using the following Sellmeier equation [27,28].
n SiO 2 2 = 1 + 0.6961663 λ 2 λ 3 0.0684043 + 0.4079426 λ 2 λ 2 0.1162414 2 + 0.897479 λ 2 λ 2 9.896161 2 ,
where λ is the free-space wavelength.
The gold is used as a metal material to excite the SPR effect, and the dispersion of the gold film can be obtained via the Lorentz–Drude model, expressed as [29,30]
ε m = ε ω D 2 ω ( ω j γ D ) Δ ε Ω L 2 ( ω 2 Ω L 2 ) j Γ L ω ,
where ε = 5.9673 represents the high-frequency dielectruc constant, ω = 2πc/λ is the angular frequency of the guiding light, ωD and γD are the plasma frequency and damping frequency, and Δε = 1.09 represents the weight factor. ΩL and ΓL represent the frequency and spectral width of the Lorentz oscillator, where ΩL/2π = 650.07 THz and ΓL/2π = 104.86 THz, respectively.
The TSM is a liquid, whose RI changes with the temperature, the thermal optical coefficient α of the TSM is chosen as 3.9 × 10⁻⁴/°C, and T is the temperature in Celsius. The RI of the TSM (nTSM) can be described as [31].
n TSM = 1.454 α ( T 25 ) .
It is well known that the SPR-based PCF sensor is dependent on the interaction of the evanescent field with the surface electrons of the plasmonic material [32,33]. The evanescent field originates from the light wave propagated inside the core region of the PCF. When the free electrons on the metal surface are stimulated by the evanescent field, the surface plasma waves (SPWs) are generated. When the phase-matching condition is satisfied, the evanescent wave resonates with the SPWs, and most of the energy of the evanescent wave is transferred to the surface plasmon polariton (SPP) [34,35,36,37,38]. At this time, the propagation loss will appear a sharp peak. When the surrounding medium RI has a slight change, the loss characteristics will be changed significantly. The confinement loss (CL) that represents the loss in propagation can be obtained as the following [39,40]
C L ( dB / cm ) = 20 ln 10 × k 0 × Im ( n eff ) × 10 4 ,
where k0 is the free space wave-number and neff is the effective RI of the core mode.
In this work, by using the inner and outer gold films to excite the SPR effect under different conditions, the proposed SPR-based PCF sensor can simultaneously measure the RI and temperature at different wavelength regions. In order to ensure the conditions of the simultaneous measurement and the flatness of the CL spectrum, we select the x-pol for sensing. Figure 2a shows the CL spectra of the core mode A and the effective RI real parts of the core mode A and zero-order SPP mode when the analyte RI is chosen as 1.40. Figure 2b–d show the mode field distributions of the core mode A and the zero-order SPP mode calculated at wavelengths 0.82, 0.863, and 0.9 μm, respectively. From Figure 2a, the core mode A is coupled with the zero-order SPP mode on the surface of the outer gold film when the wavelength is less than 1 μm, and the CL values of the core mode A are small at the non-resonant wavelength. This is because most of energy is confined within the core mode A, as shown in Figure 2b,d. At the resonant wavelength, the phase-matching condition is satisfied, and the corresponding CL value of the core mode A reaches the peak. At this time, most of the energy is transferred from the core mode A to the zero-order SPP mode, as shown in Figure 2c.
Figure 3a shows the CL spectra of the core mode B, and the effective RI real parts of the core mode B and second-order SPP mode when the temperature is chosen as 20 °C. Figure 3b–d show the mode field distributions of the core mode B and second-order SPP mode calculated at wavelengths 1.3, 1.414, and 1.5 μm, respectively. From Figure 3a, the core mode B is coupled with the second-order SPP mode on the surface of the inter-gold film when the wavelength is larger than 1 μm. Similar to the core mode A, at the non-resonant wavelength, the CL values of the core mode B are small. This is because most of energy is confined within the core mode B, as shown in Figure 3b,d. At the resonant wavelength, the phase-matching condition is satisfied, and the corresponding CL value of the core mode B reaches the peak. At this time, most of energy is transferred from the core mode B to the second-order SPP mode, as shown in Figure 3c. Because the core mode A is coupled with the zero-order SPP mode at the shorter wavelength side and the core mode B is coupled with the second-order SPP mode at the longer wavelength side, the CL spectra used for measuring the RI and temperature could be obtained at the same time using a broadband light source. Meanwhile, by comparing the mode field distributions of the core modes A and B at different wavelengths, it is found that there is no cross-coupling when the core modes A and B are coupled with the SPP modes on different gold films. Therefore, the proposed SPR-based PCF sensor can achieve an independent measurement of the RI and temperature.
The change of the analyte RI or temperature will cause the change of the effective RI around the outer or inner gold films, respectively. Thus, the phase-matching condition will change, and the resonant wavelength will occur to shift. At this time the change of the different parameters can be measured by detecting the change of the resonant wavelength. As an important parameter to evaluate the sensing performance, the wavelength sensitivities of the RI and temperature are expressed as [41,42,43].
S n ( nm / RIU ) = Δ λ peak Δ n a ,
S T ( nm / ° C ) = Δ λ peak Δ T ,
where Δλpeak, Δna, and ΔT denote the variations of the resonant wavelength, analyte RI, and temperature, respectively.

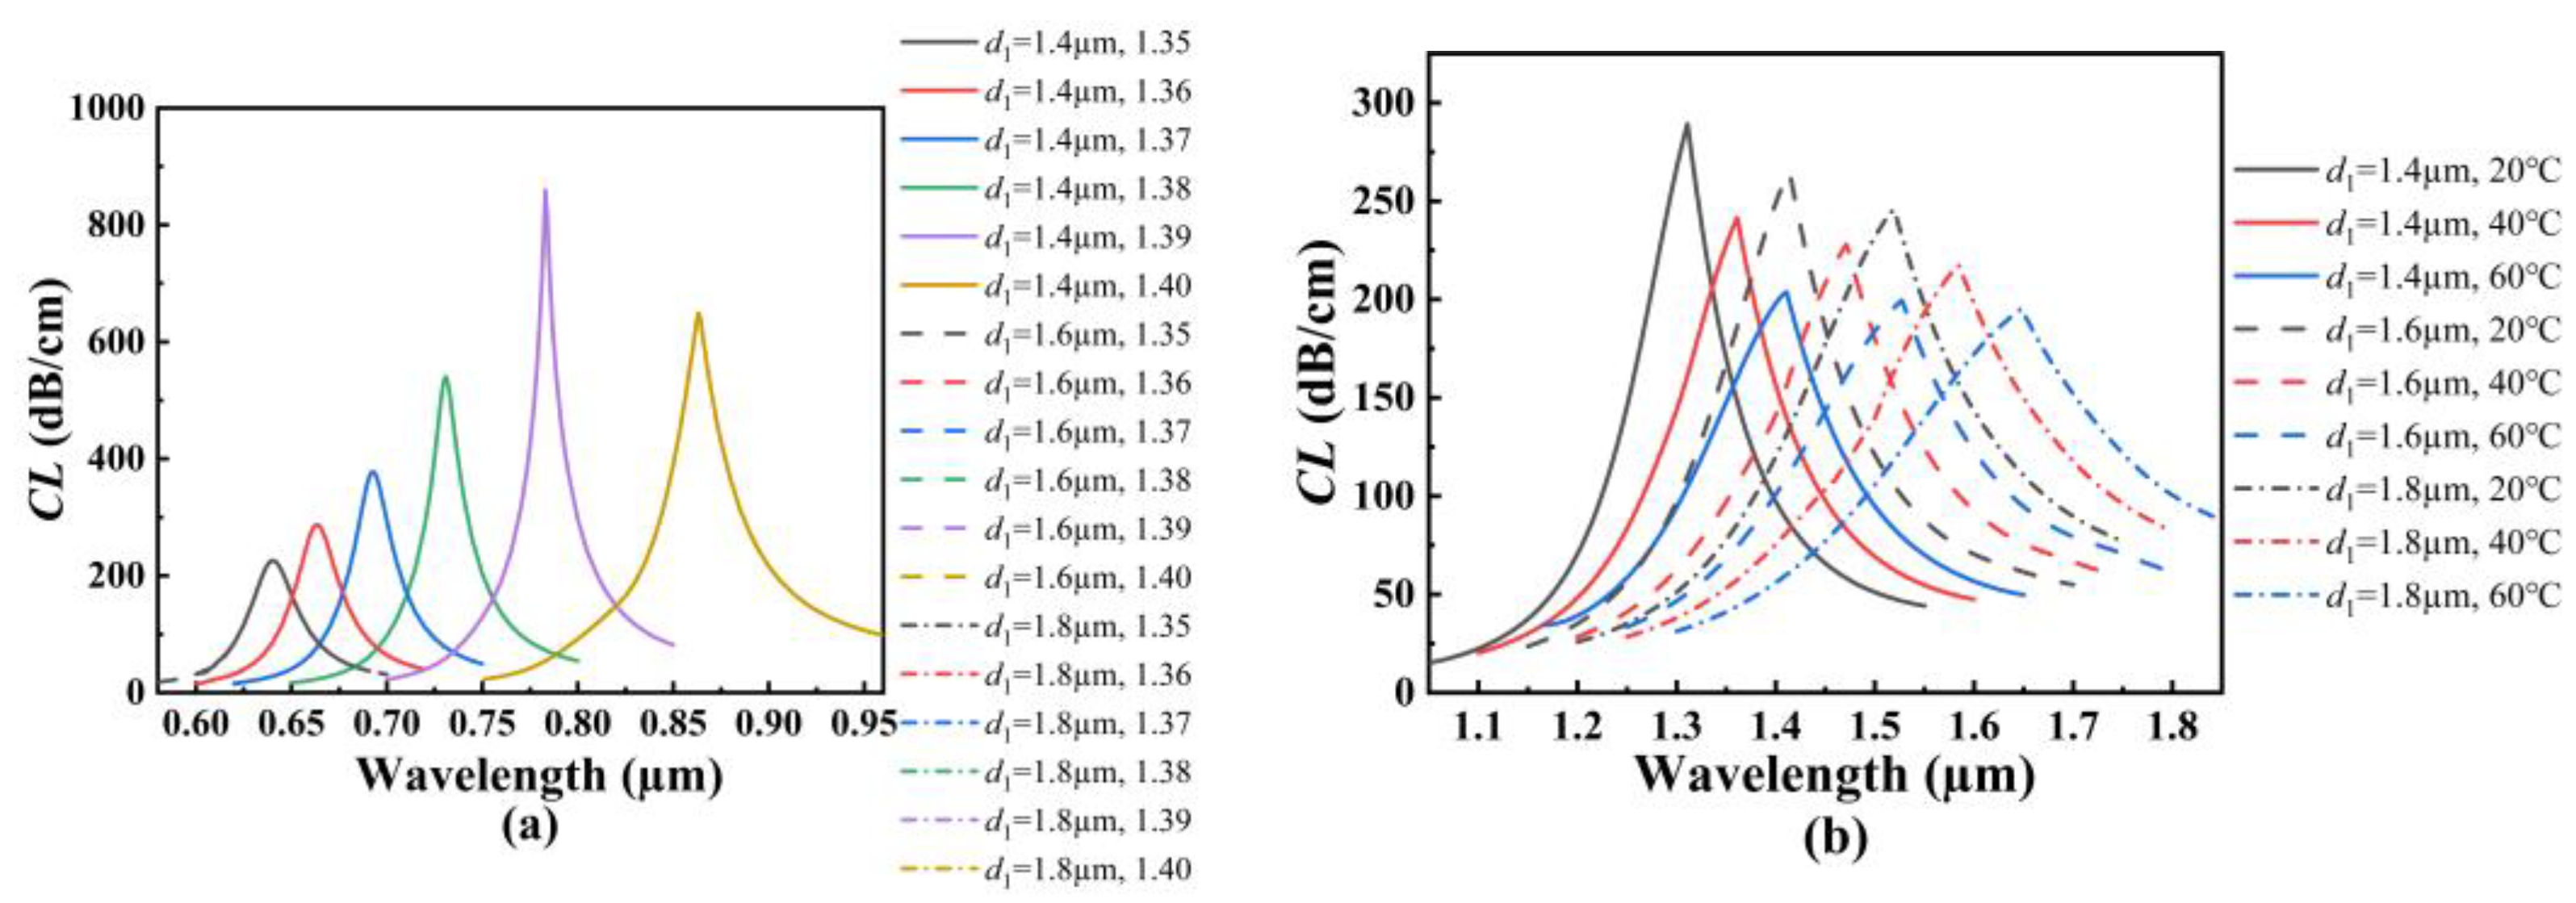
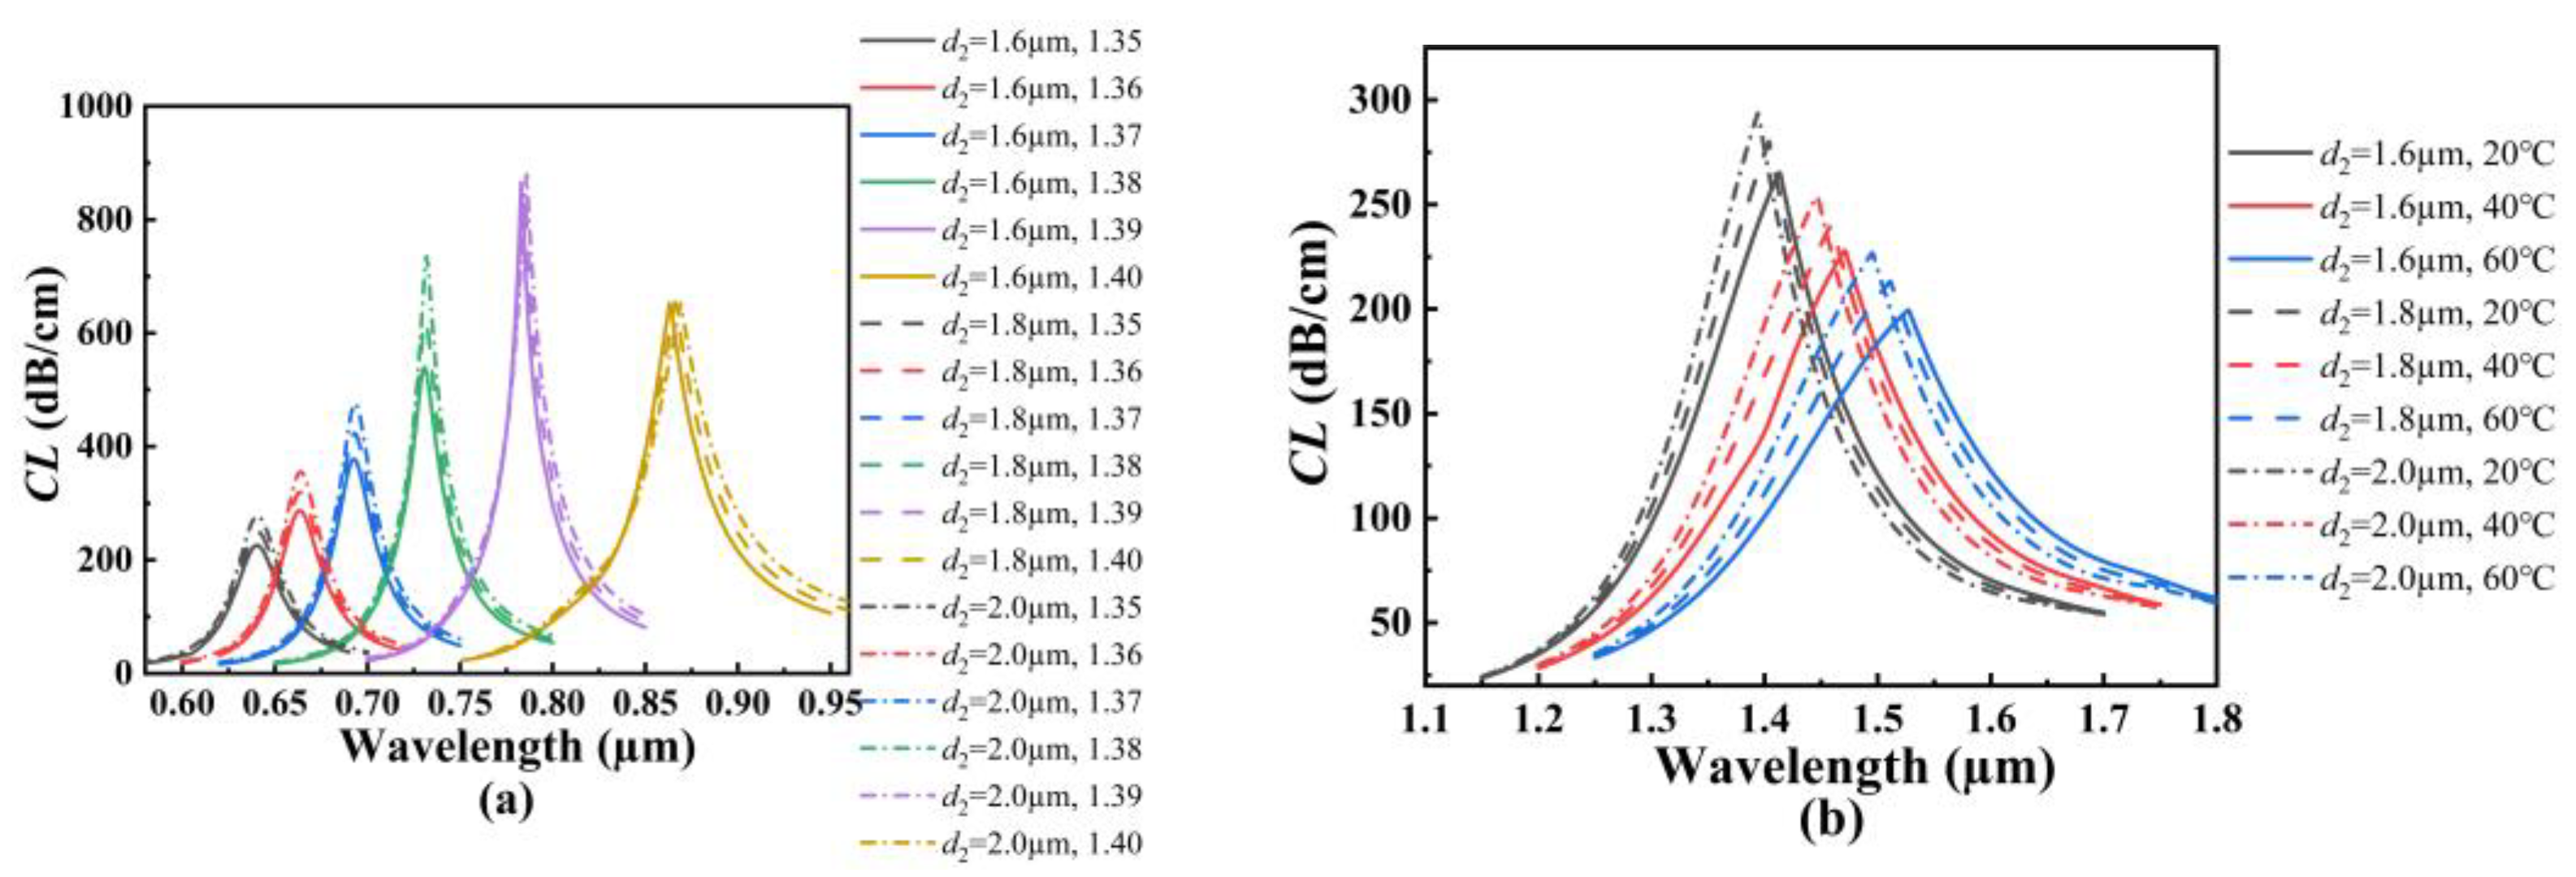
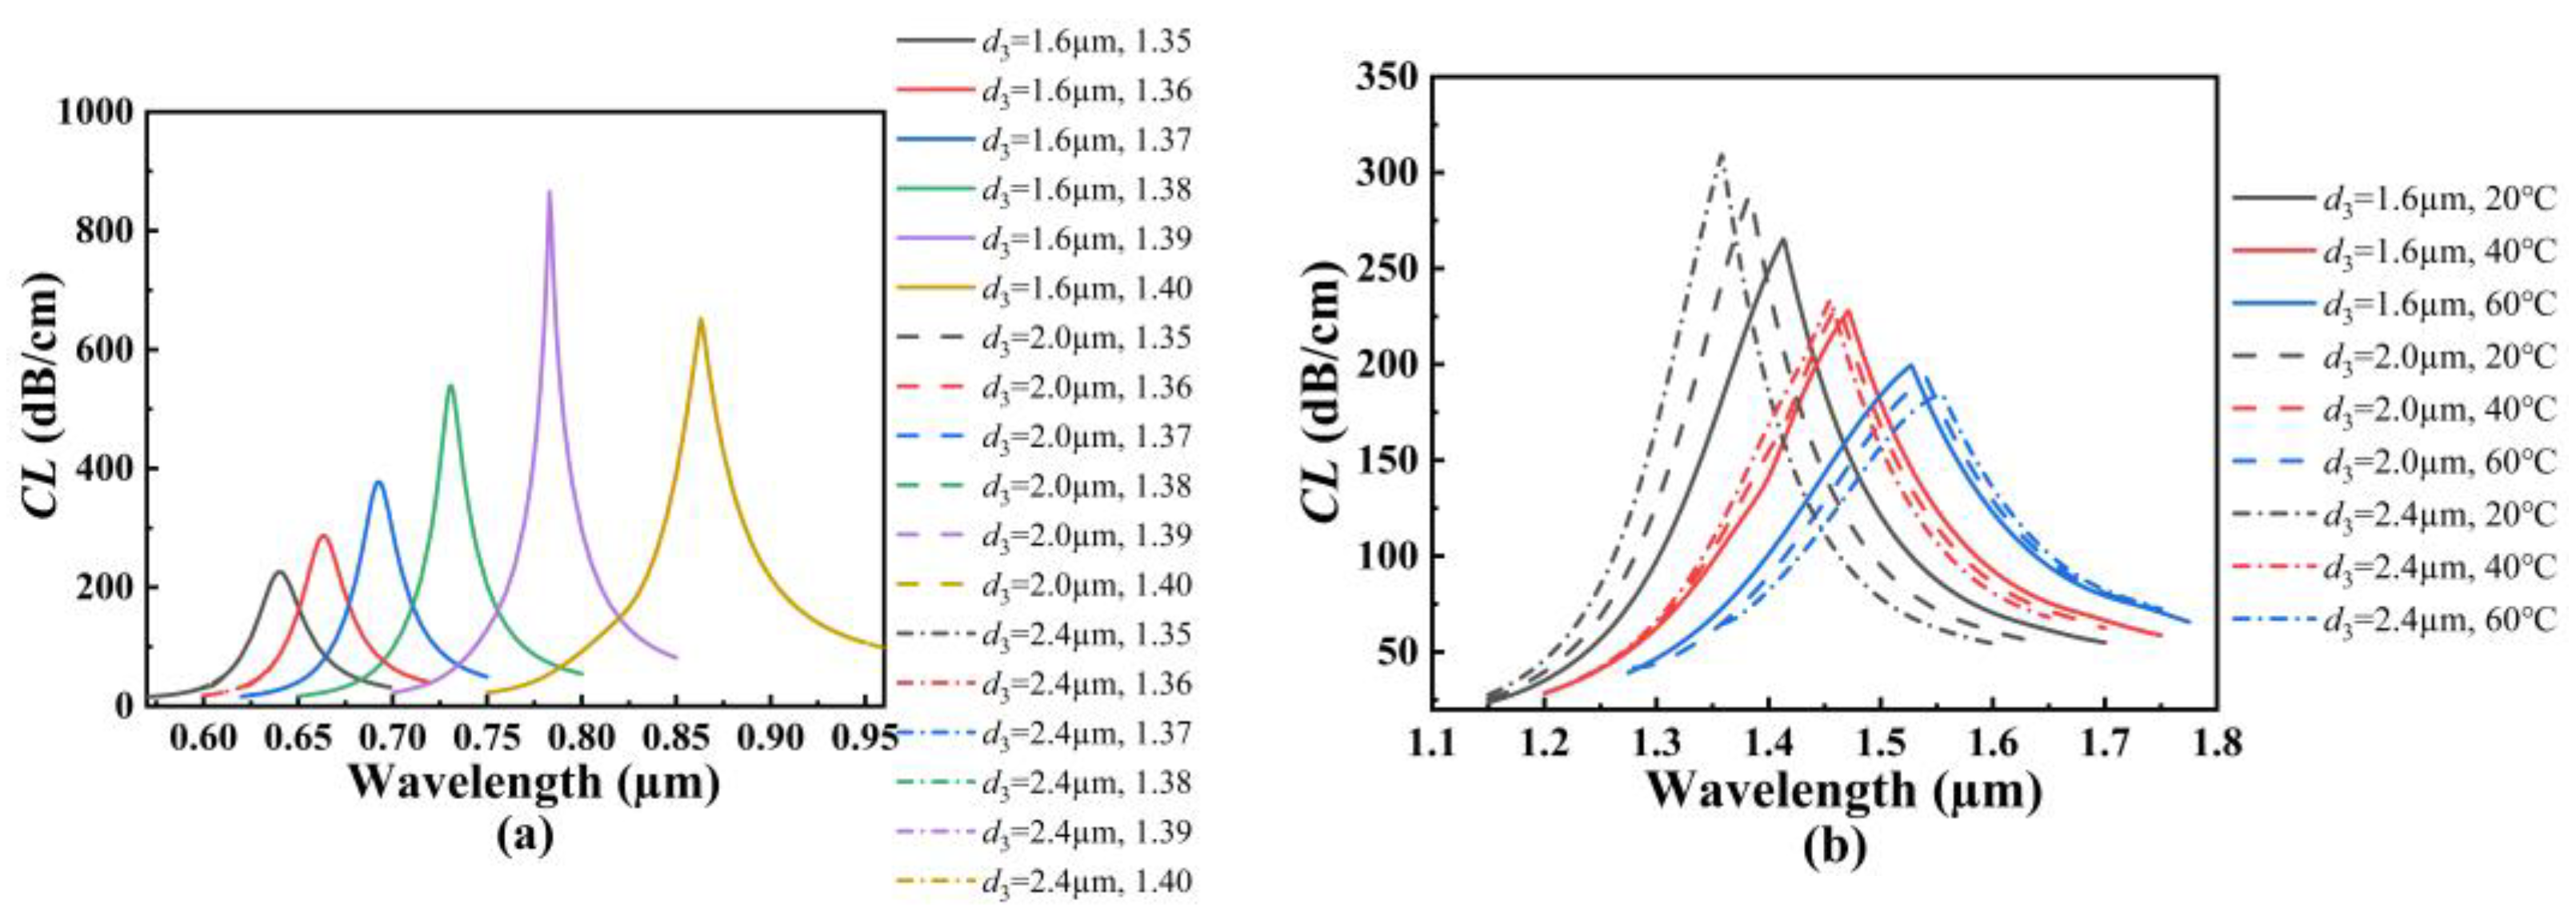
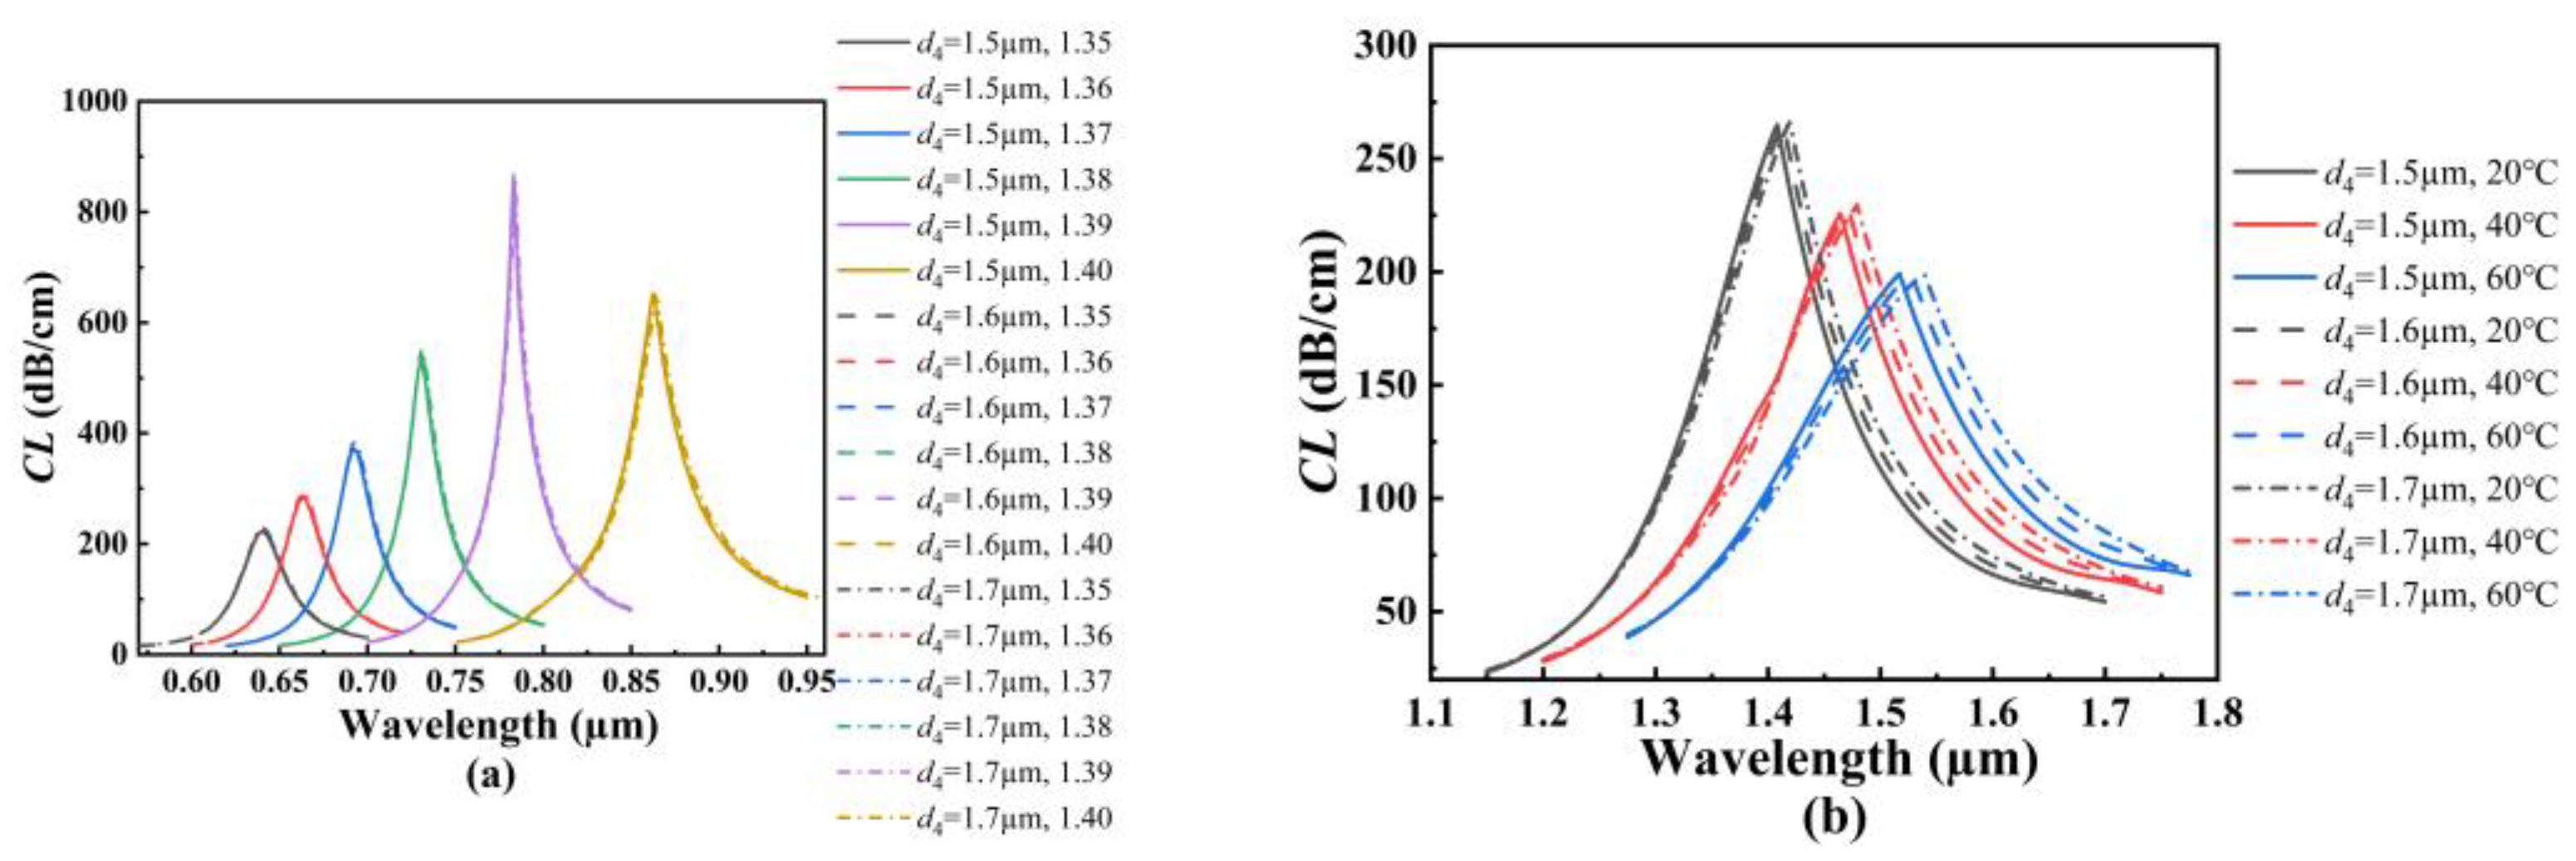
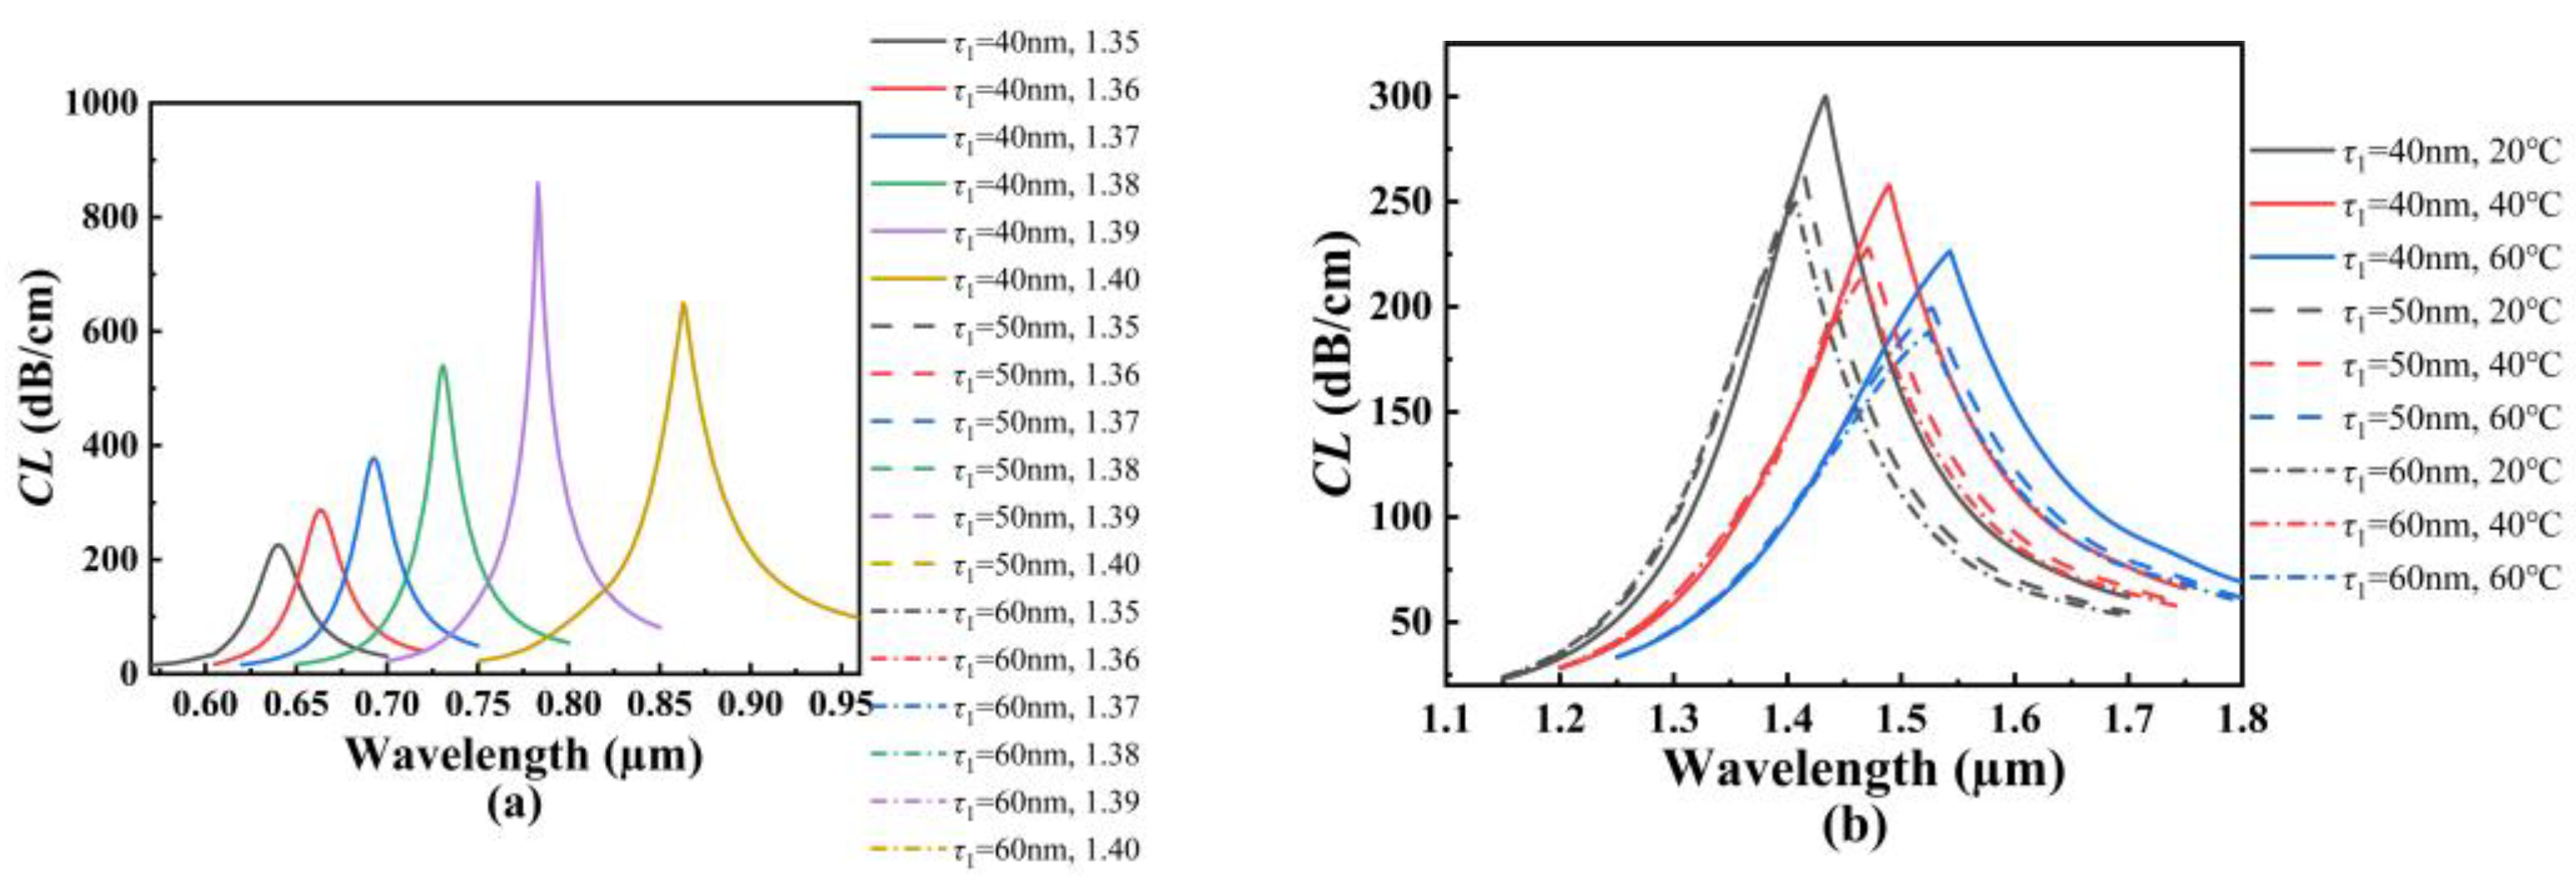
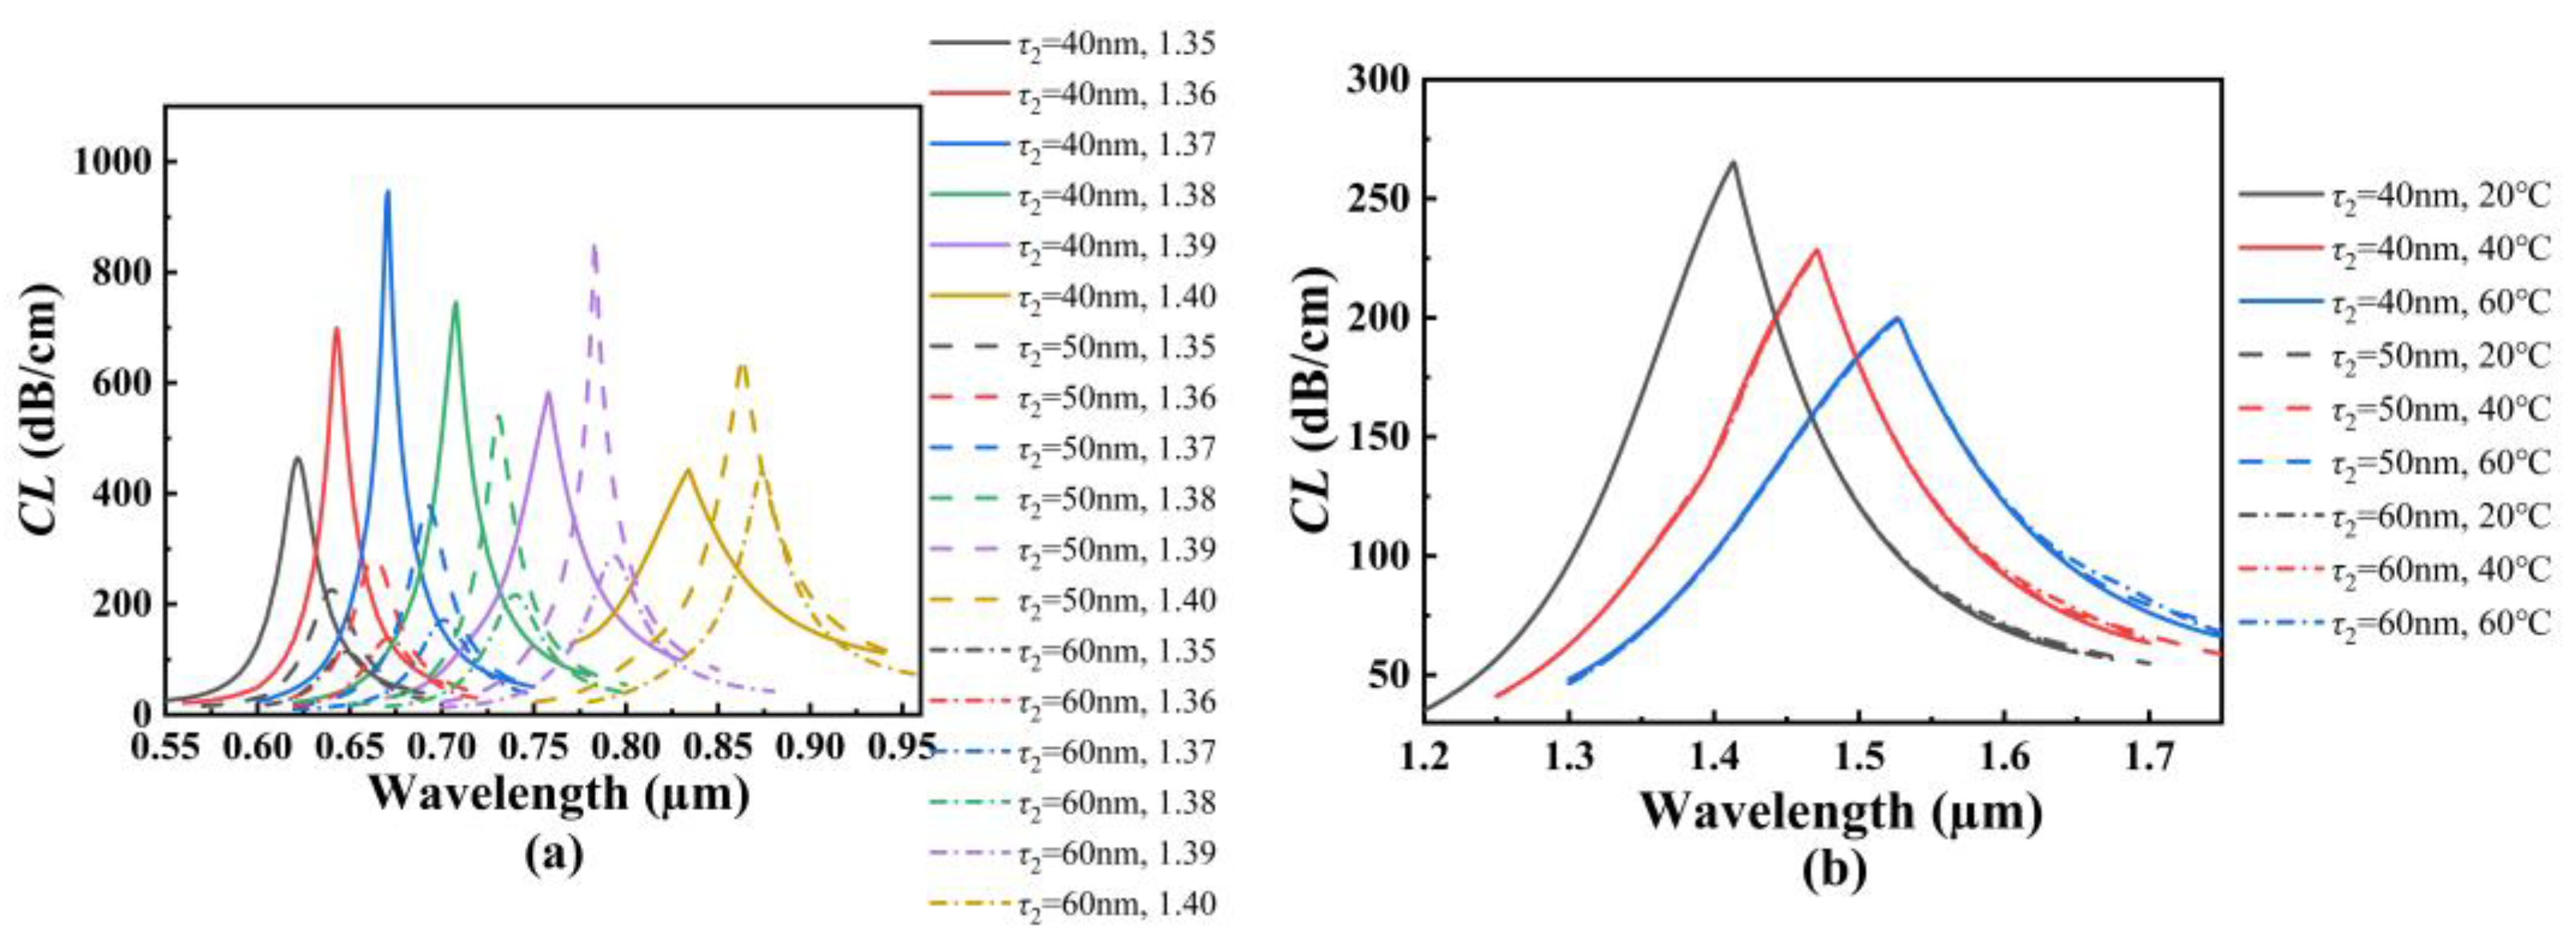
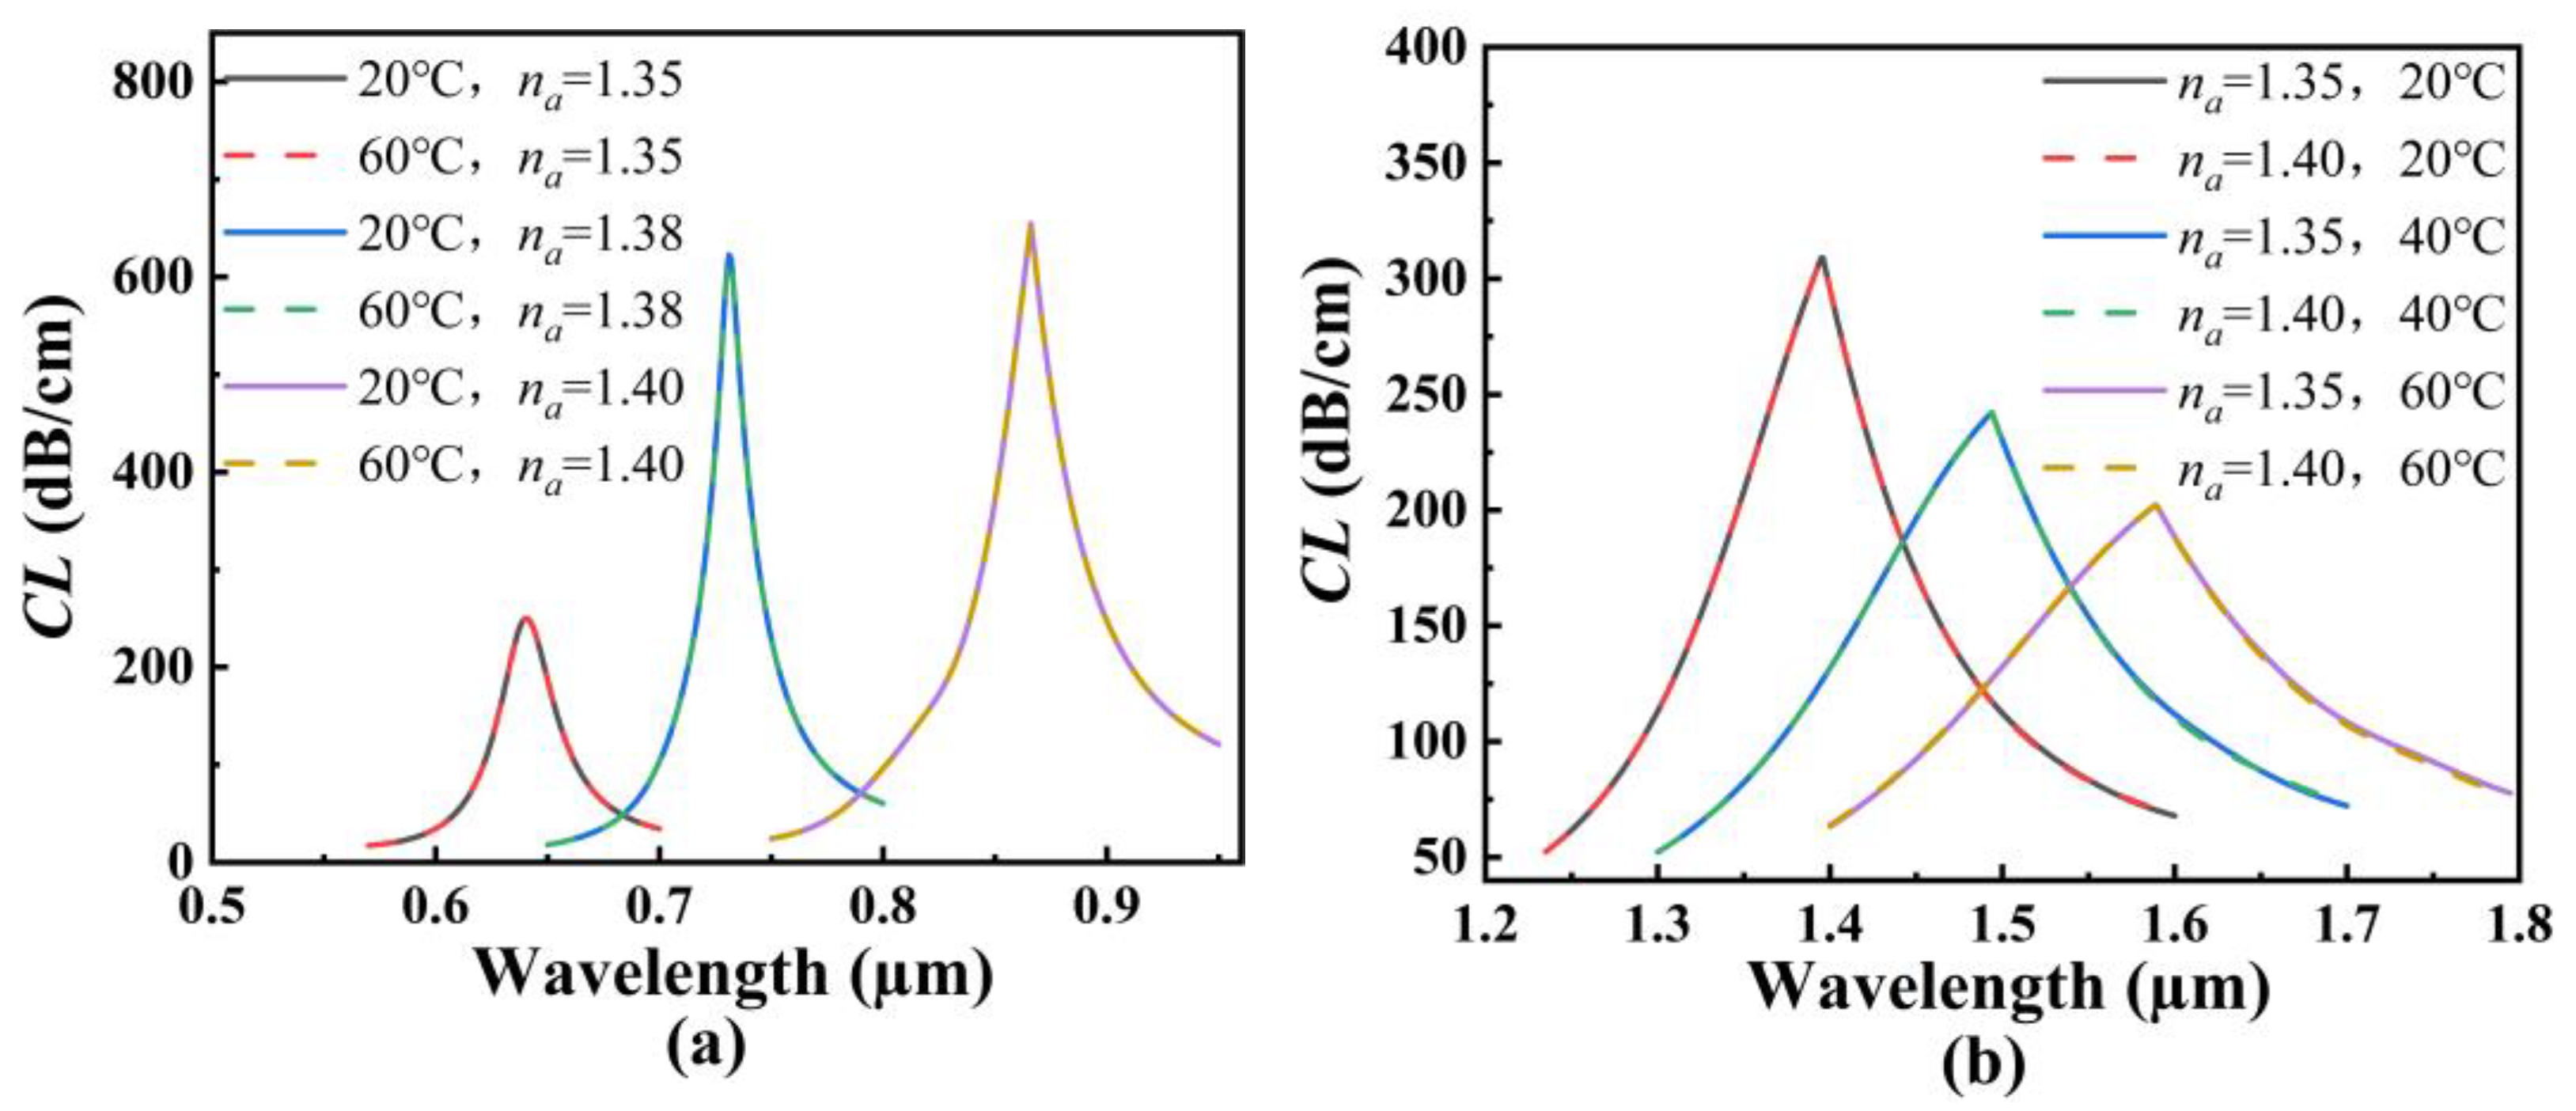
3. Effects of Structural Parameters on RI and Temperature Sensing

In order to investigate the effects of the structure parameters on the RI and temperature sensing, the initial structure parameters of the proposed SPR-based PCF sensor are set as follows: d1 = d2 = d3 = d4 = 1.6 μm, τ1 = τ2 = 50 nm, and Λ = 3 μm. Figure 4a shows the CL spectra of the core mode A for different d1 when the analyte RI increases from 1.35 to 1.40. From Figure 4a, with the increase of the analyte RI, the resonant wavelength of the core mode A occurs to red-shift when d1 is set as 1.4, 1.6, and 1.8 μm, respectively. It can also be seen from Figure 4a that for the same analyte RI, the resonant wavelength and CL peak value do not change, and the average RI sensitivity is also unchanged as d1 increases. The main reason considered is that the air holes existing around the core A block the interaction between the core A and the fiber core, making the energy well confined within the core mode A. Figure 4b shows the CL spectra of the core mode B for different d1 when the temperature is chosen as 20, 40, and 60 °C, respectively. From Figure 4b, with the increase in the temperature, the resonant wavelength of the core mode B occurs to red-shift when d1 is set as 1.4, 1.6, and 1.8 μm, respectively. It can also be seen from Figure 4b that for the same temperature, the resonant wavelength occurs to red-shift, and the CL peak value slightly decreases with d1 increases. This may be because the coupling strength between the core mode B and SPP mode becomes gradually weaker as d1 increases. According to Equation (6), the average temperature sensitivity can reach 2.5, 2.85, and 3.225 nm/°C when d1 is set as 1.4, 1.6, and 1.8 μm, respectively, which means that the temperature sensitivity of the SPR-based PCF sensor increases with the increase in d1.
Figure 5a shows the CL spectra of the core mode A for different d2 when the analyte RI increases from 1.35 to 1.40. From Figure 5a, with the increase in the analyte RI, the resonant wavelength of the core mode A occurs to red-shift when d2 is set as 1.6, 1.8, and 2.0 μm, respectively. It can also be seen from Figure 5a that for the same analyte RI, the resonant wavelength occurs to red-shift slightly, and the CL peak value increases as d2 increases. The main reason considered is that the increase in d2 compresses the core A and enhances the coupling between the core mode A and SPP mode on the outer gold film. According to Equation (5), the average RI sensitivity can reach 4460, 4520, and 4560 nm/RIU when d2 is set as 1.6, 1.8, and 2.0 μm, respectively, which means that the RI sensitivity of the SPR-based PCF sensor increases with the increase in d2. Figure 5b shows the CL spectra of the core mode B for different d2 when the temperature is chosen as 20, 40, and 60 °C, respectively. From Figure 5b, with the increase in the temperature, the resonant wavelength of the core mode B occurs to red-shift when d2 is set as 1.6, 1.8, and 2.0 μm, respectively. It can also be seen from Figure 5b that for the same temperature, the resonant wavelength occurs to blue-shift, and the CL peak value increases as d2 increases. The main reason may be that the increase in d2 reduces the energy leakage of the fiber core in the x-axis direction and enhances the coupling between the inner core mode and SPP mode on the inter-gold film. The calculated average temperature sensitivity can reach 2.85, 2.675, and 2.525 nm/°C when d2 is set as 1.6, 1.8, and 2.0 μm, respectively, which means that the temperature sensitivity of the SPR-based PCF sensor decreases with the increase in d2.
Figure 6a shows the CL spectra of the core mode A for different d3 when the analyte RI increases from 1.35 to 1.40. From Figure 6a, with the increase in the analyte RI, the resonant wavelength of the core mode A occurs to red-shift when d3 is set as 1.6, 2.0, and 2.4 μm, respectively. It can also be seen from Figure 6a that for the same analyte RI, the resonant wavelength and CL peak value do not change, and thus, the average RI sensitivity is also unchanged as d3 increases. The main reason considered is that the air holes that exist around the core A block the effect of the RI change near the fiber core on the outer gold film. Figure 6b shows the CL spectra of the core mode B for different d3 when the temperature is chosen as 20, 40, and 60 °C, respectively. From Figure 6b, with an increase in temperature, the resonant wavelength of the core mode B occurs to red-shift when d3 is set as 1.6, 2.0, and 2.4 μm, respectively. It can also be seen from Figure 6b that for the same temperature, the resonant wavelength occurs to blue-shift when the temperature is chosen as 20 °C and 40 °C, and the resonant wavelength occurs to red-shift when the temperature is fixed at 60 °C. The main reason is considered as the following: according to Equation (3), the RI of the TSM will decrease as the temperature increases. This means that when the temperature is fixed at 50 °C, the RI of the TSM is equal to that of SiO2 at the considered wavelength. Both the RIs of the TSM and SiO2 affect the effective RI of the core mode B and the phase-matching conditions. Therefore, the shifts of the CL spectra are different when the temperature is greater than 50 °C and less than 50 °C. At this time, the increase in d3 will enhance the effect of the RI of the TSM on the core mode B. The calculated average temperature sensitivity can reach 2.85, 3.925, and 4.925 nm/°C when d3 is set as 1.6, 2.0, and 2.4 μm, respectively, which means that the temperature sensitivity of the SPR-based PCF sensor increases with the increase in d3.
Figure 7a shows the CL spectra of the core mode A for different d4 when the analyte RI increases from 1.35 to 1.40. From Figure 7a, with the increase in the analyte RI, the resonant wavelength of the core mode A occurs to red-shift when d4 is set as 1.5, 1.6, and 1.7 μm, respectively. It can also be seen from Figure 7a that for the same analyte RI, the resonant wavelength and CL peak value changes little, and the average RI sensitivity has almost no change as d4 increases. The main reason considered is that the increase in d4 will limit the energy leakage from the core mode A. Thus, the coupling between the core mode A and SPP mode on the outer gold film is not affected. Figure 7b shows the CL spectra of the core mode B for different d4 when the temperature is chosen as 20, 40, and 60 °C, respectively. From Figure 7b, with the increase in the temperature, the resonant wavelength of the core mode B occurs to red-shift when d4 is set as 1.5, 1.6, and 1.7 μm, respectively. It can also be seen from Figure 7b that for the same temperature, the resonant wavelength occurs to red-shift, and the CL peak value is unchanged as d4 increases. This may be because the increase in d4 changes the effective RI around the fiber core, thus causing the changes of the phase-matching conditions and resonant wavelength. The calculated average temperature sensitivity can reach 2.725, 2.85, and 2.975 nm/°C when d4 is set as 1.6, 1.8, and 2.0 μm, respectively, which means that the temperature sensitivity of the SPR-based PCF sensor slightly increases with the increase in d4.
Figure 8a shows the CL spectra of the core mode A for different τ1 when the analyte RI increases from 1.35 to 1.40. From Figure 8a, with the increase in the analyte RI, the resonant wavelength of the core mode A occurs to red-shift when τ1 is set as 40, 50, and 60 nm, respectively. It can also be seen from Figure 8a that for the same analyte RI, the resonant wavelength, CL peak value, and average RI sensitivity do not change with the increase in τ1. The main reason considered is that the air holes existing around the fiber core limit the energy leakage, so that the coupling of the core mode A is not affected by the thickness change of the inner gold film. Figure 8b shows the CL spectra of the core mode B for different τ1 when the temperature is chosen as 20, 40, and 60 °C, respectively. From Figure 8b, with the increase in the temperature, the resonant wavelength of the core mode B occurs to red-shift when τ1 is set as 40, 50, and 60 nm, respectively. It can also be seen from Figure 8b that for the same temperature, the resonant wavelength occurs to blue-shift, and the CL peak value decreases as τ1 increases. This may be because the increase in τ1 inhibits the generation of the SPP mode, and the coupling strength between the core mode B and SPP mode on the inner gold film becomes weaker. The calculated average temperature sensitivity can reach 2.725, 2.85, and 2.925 nm/°C when τ1 is set as 40, 50, and 60 nm, respectively, which means that the temperature sensitivity of the SPR-based PCF sensor slightly increases with the increase in τ1.
Figure 9a shows the CL spectra of the core mode A for different τ2 when the analyte RI increases from 1.35 to 1.40. From Figure 9a, with the increase in the analyte RI, the resonant wavelength of the core mode A occurs to red-shift when τ2 is set as 40, 50, and 60 nm, respectively. It can also be seen from Figure 9a that for the same analyte RI, the resonant wavelength occurs to red-shift with the increase in τ2. The CL peak value will decrease when the RI is below 1.39, and firstly increase and then decrease when the RI is above 1.39. The main reason considered is that the analyte RI outside and the effective RI inside the fiber affect the coupling between the core mode A and SPP mode on the outer gold film. The calculated average RI sensitivity can reach 4240, 4460, and 4520 nm/RIU when τ2 is set as 40, 50, and 60 nm, respectively, which means that the RI sensitivity of the SPR-based PCF sensor slightly increases with the increase in τ2. Figure 9b shows the CL spectra of the core mode B for different τ2 when the temperature is chosen as 20, 40, and 60 °C, respectively. From Figure 9b, with the increase in the temperature, the resonant wavelength of the core mode B occurs to red-shift when τ2 is set as 40, 50, and 60 nm, respectively. It can also be seen from Figure 9b that for the same temperature, the resonant wavelength, CL peak value, and the average temperature sensitivity are unchanged as τ2 increases. However, the CL value slightly increases with the increase in τ2 when the wavelength is greater than 1.6 μm. This may be because the arrangement of the air holes binds the light inside the fiber core, and because the change of the outer gold film does not affect the coupling between the core mode B and SPP mode on the inner gold film. However, with the increase in wavelength, the limitation of the cladding holes on the energy of fiber core is weakened, resulting in the increase in the CL value. The effects of the structural parameters of the proposed SPR-based PCF sensor on the sensing are summarized in Table 1.

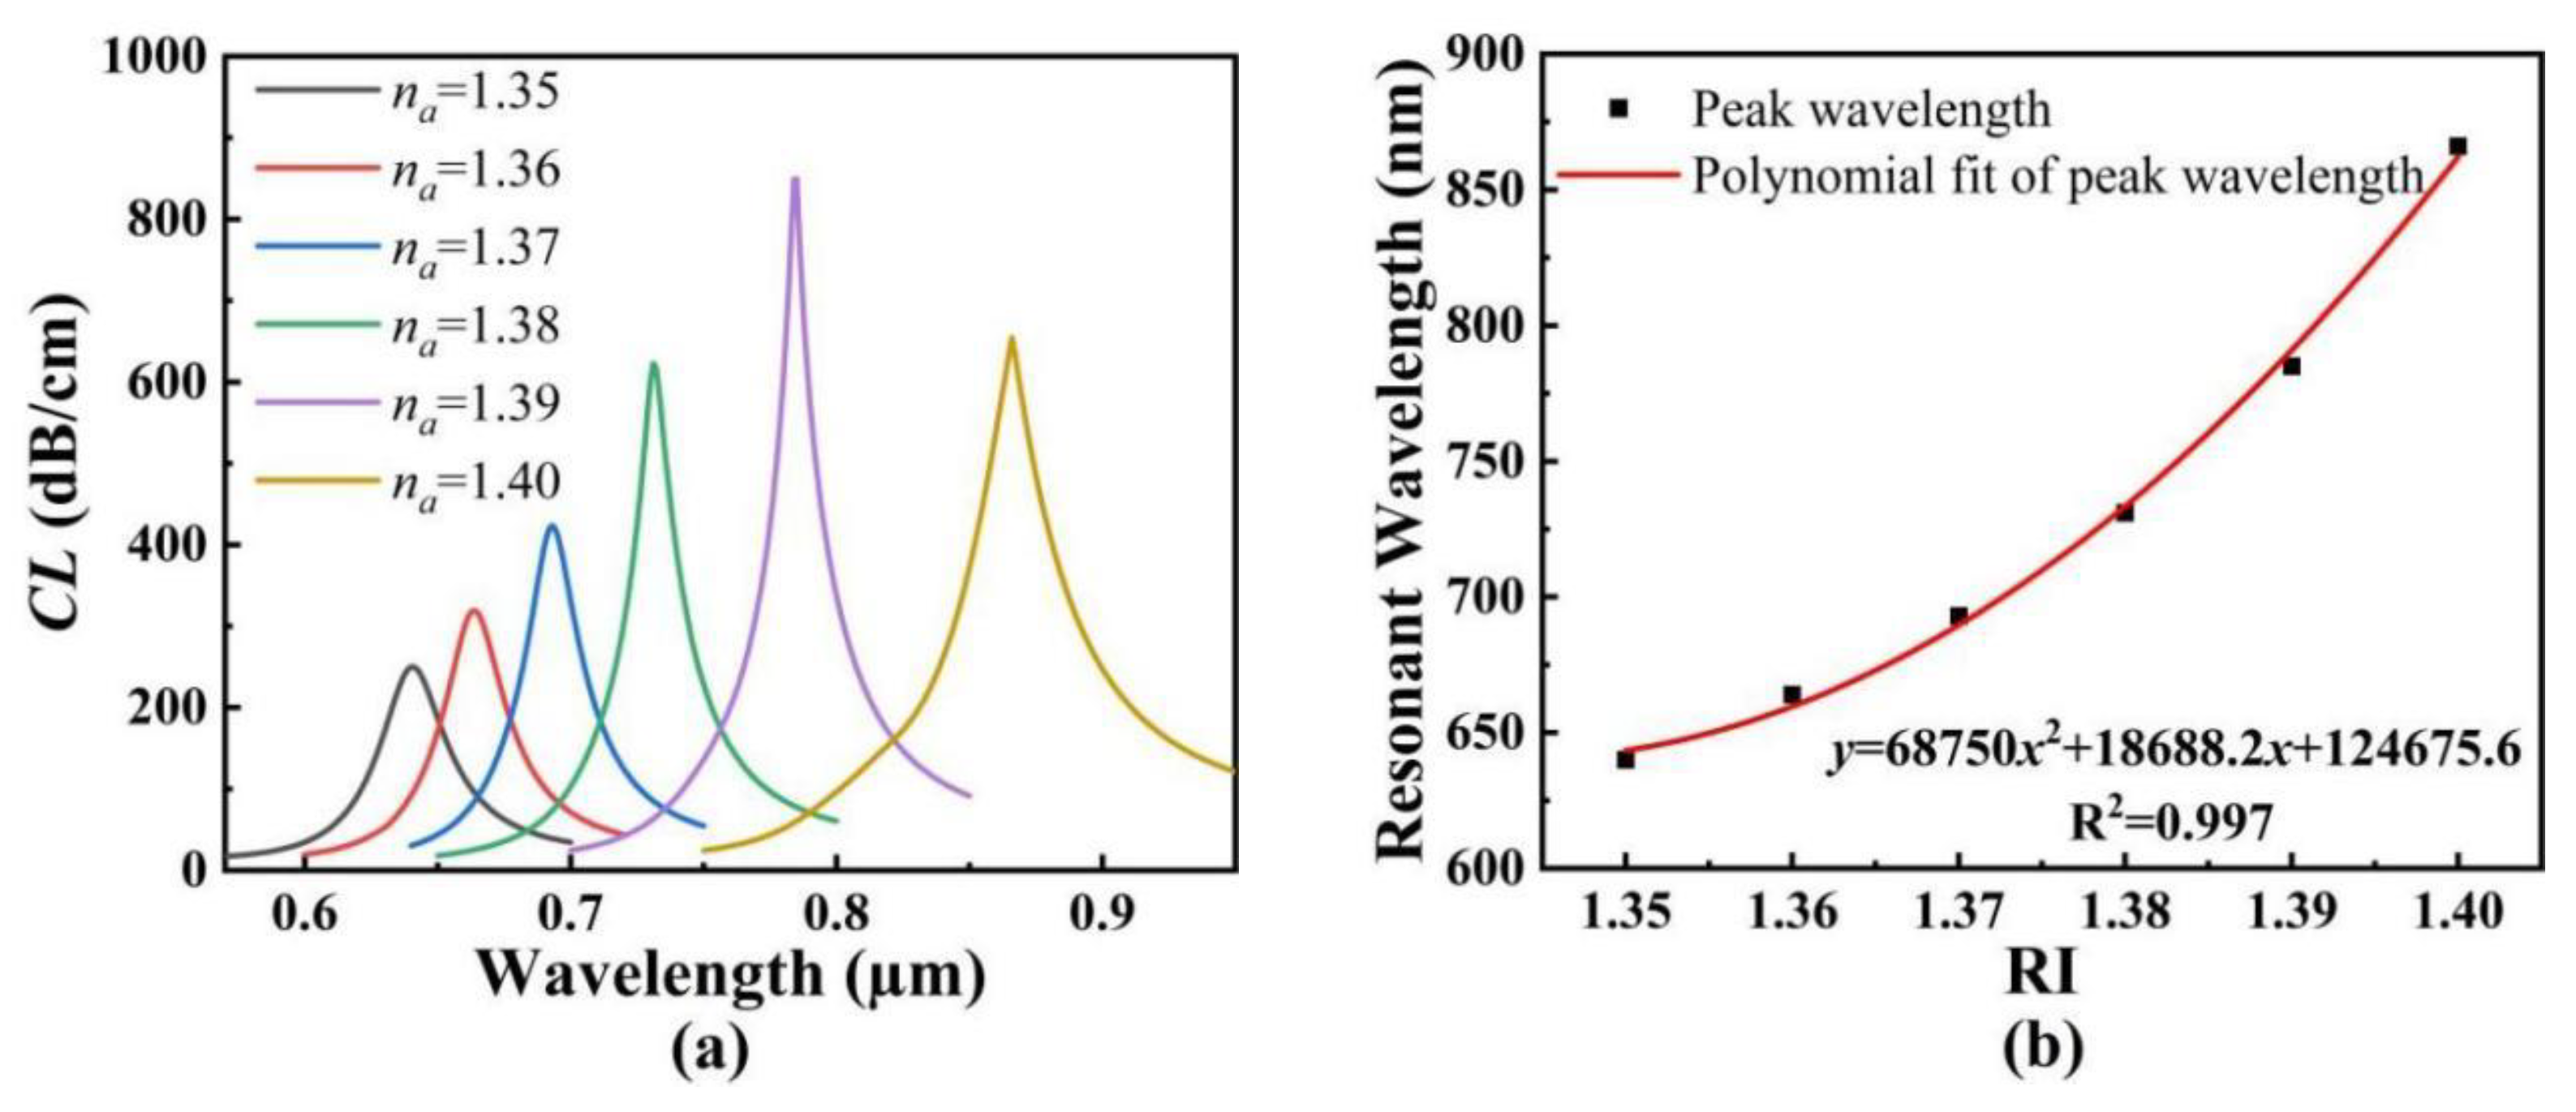
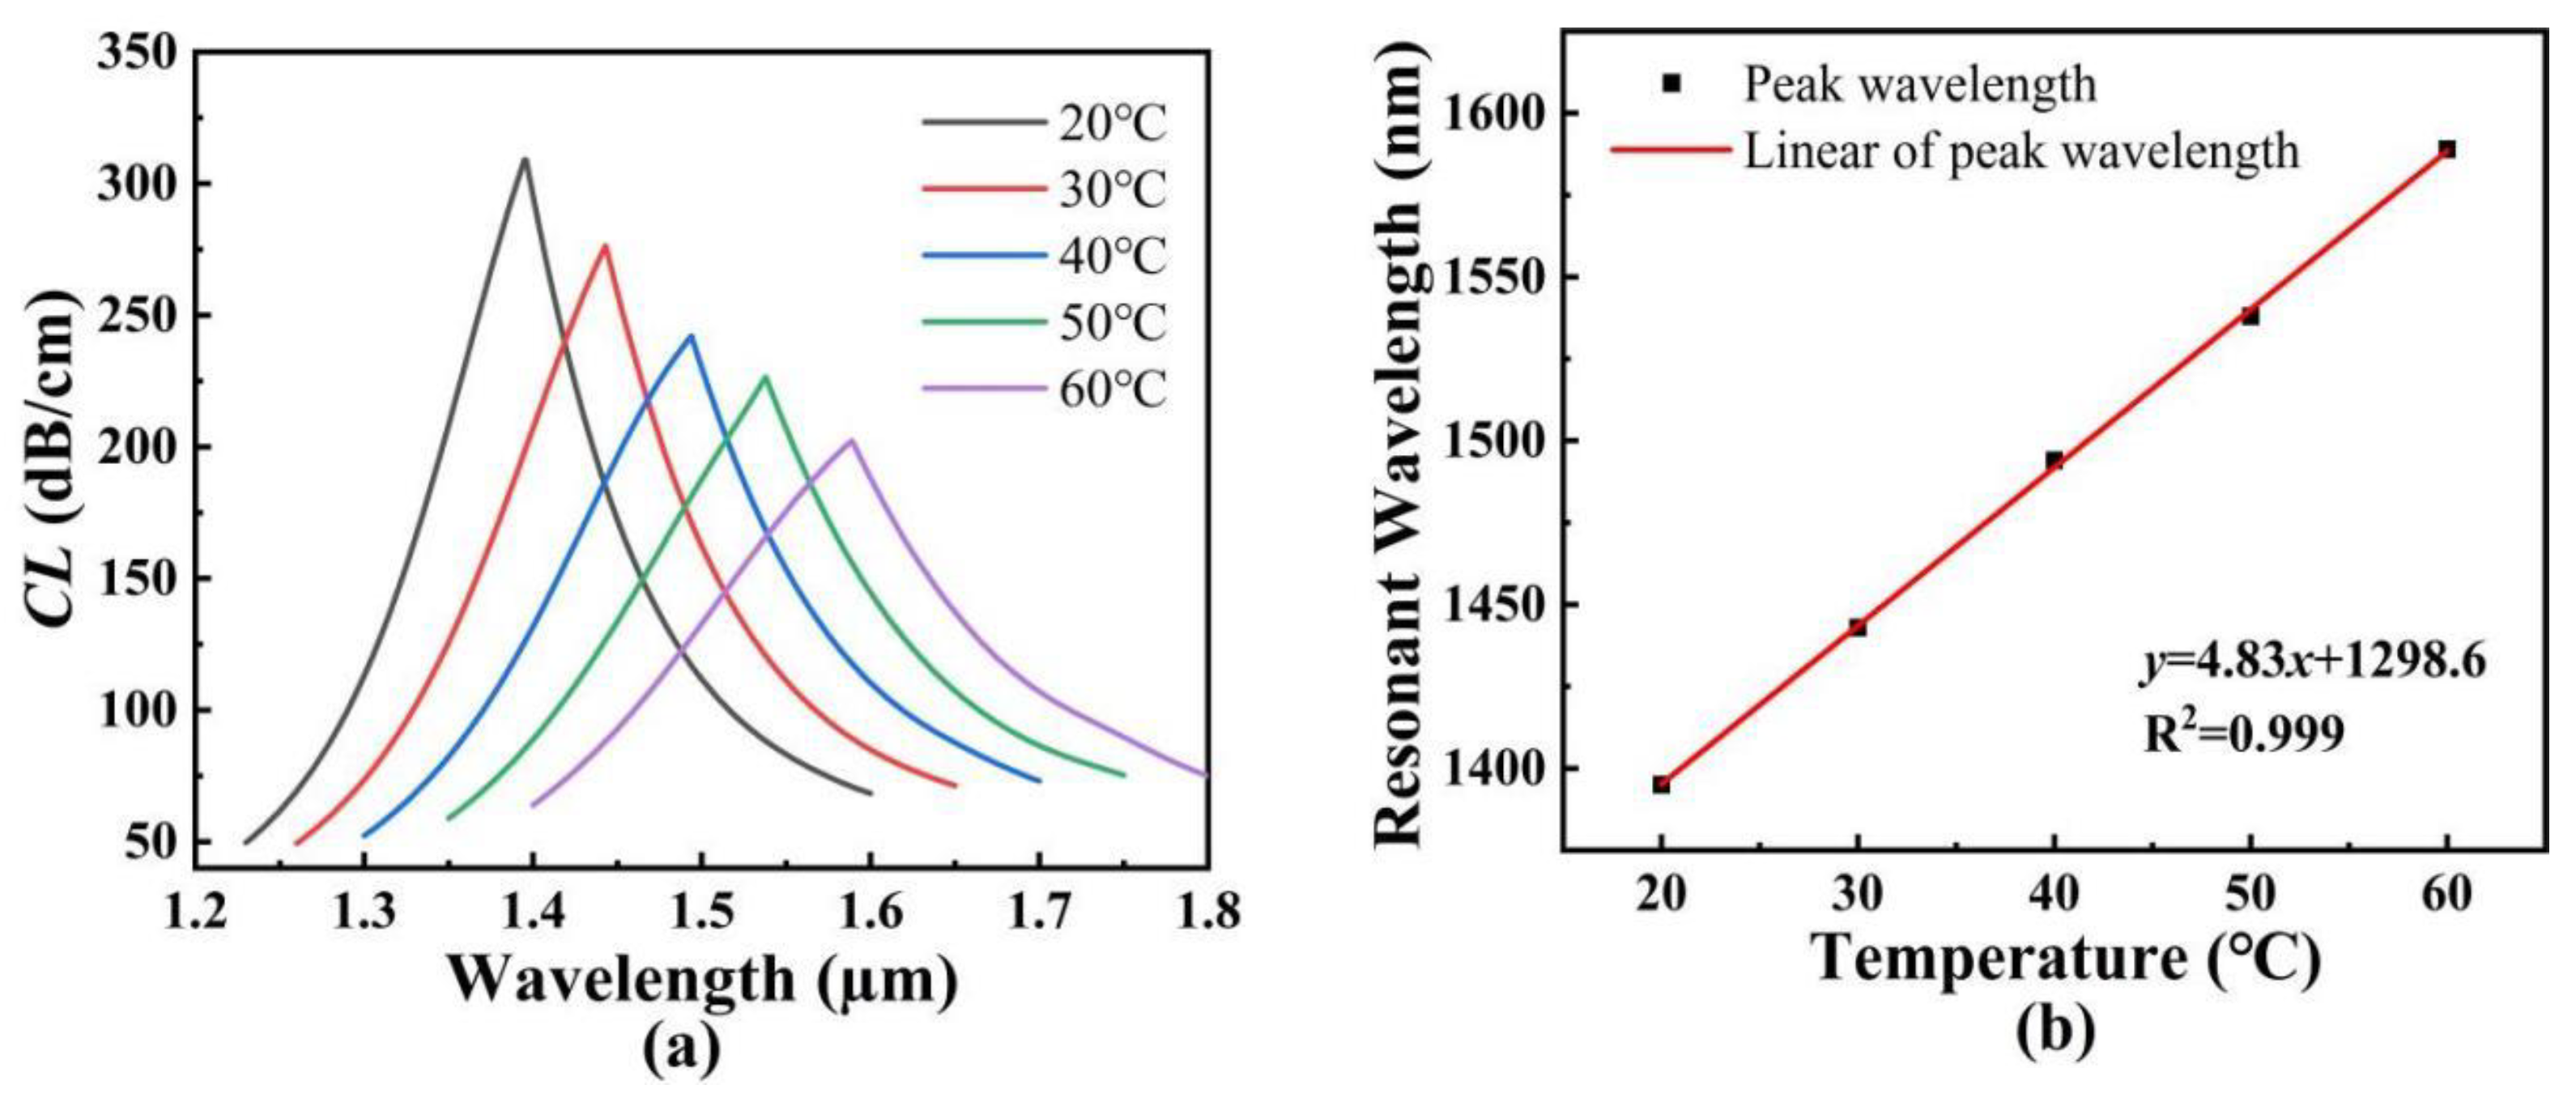
4. Sensing Performances

By analyzing the variation of the resonance wavelength and mode field, we can draw relevant conclusions, as shown in the table above. However, the above conclusions are obtained when the initial structure parameters are considered as the invariants, and the influences of several structural parameters may make the conclusions localized. Therefore, under comprehensive consideration and calculation, we optimize the structural parameters of the proposed SPR-based PCF sensor as follows: d1 = 1.7 μm, d2 = 1.8 μm, d3 = 2.4 μm, d4 = 1.6 μm, τ1 = τ2 = 50 nm, and Λ = 3 μm. In the following, we will discuss the sensing performances of the proposed SPR-based PCF sensor.

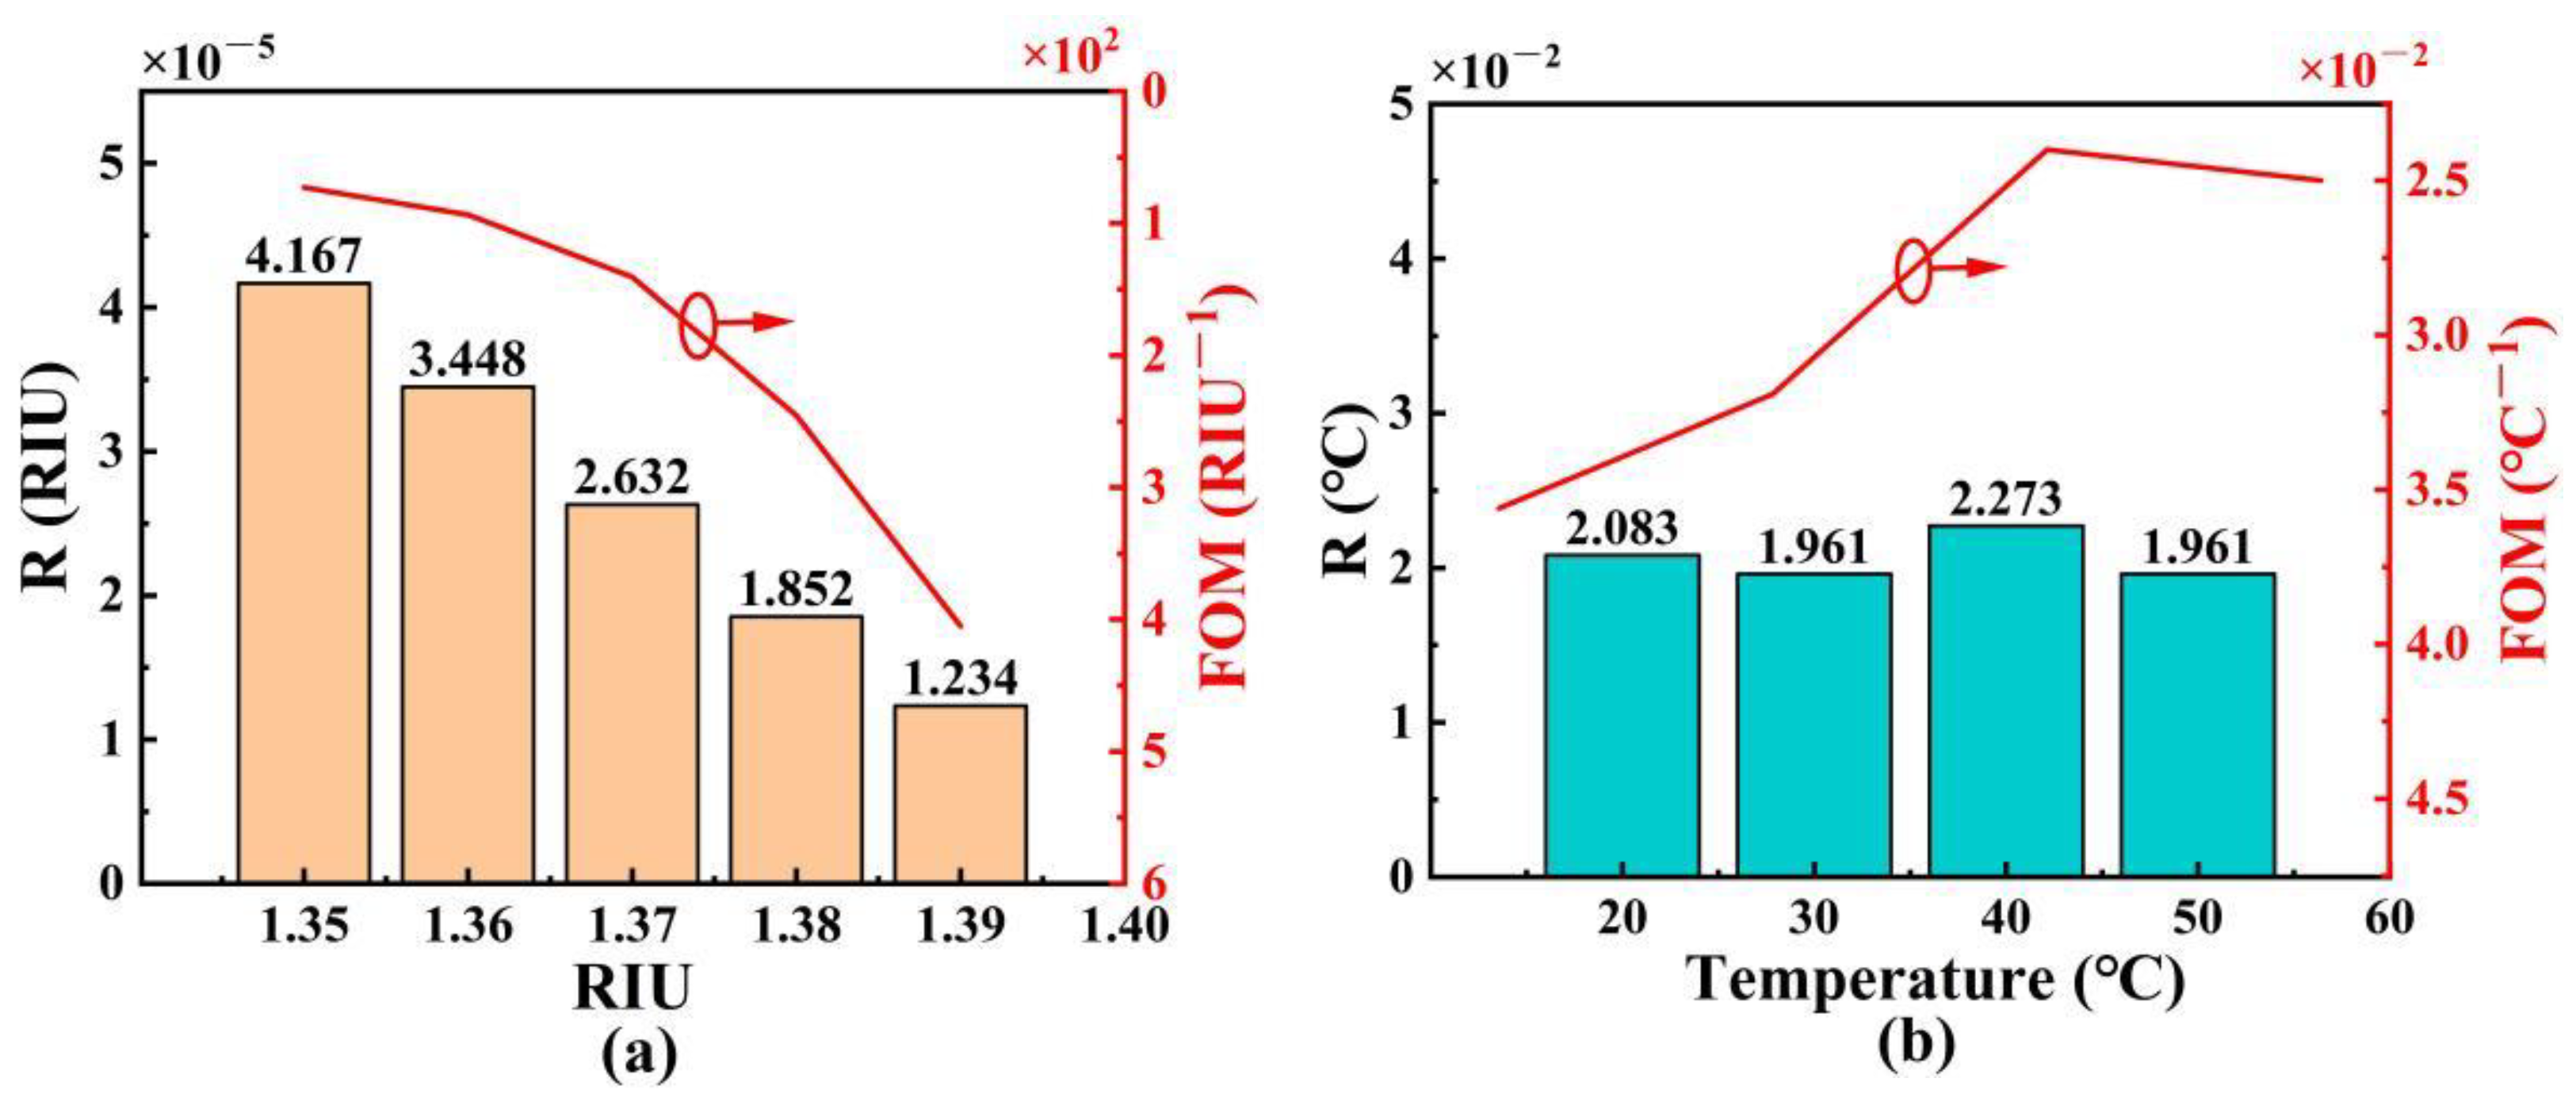
4.1. Sensitivity, Resolution, and Figure of Merit of the Proposed SPR-Based PCF Sensor

Figure 10a shows the CL spectra of the core mode A when the analyte RI changes from 1.35 to 1.40. From Figure 10a, with the increase in the analyte RI, the CL spectra of the core mode A occurs to red-shift, and the corresponding CL peak values increase first and then decrease with the increasing wavelength. Figure 10b shows the variation of the resonant wavelength of the core mode A with the analyte RI and its fitting result. As seen from Figure 10b, the relationship equation between the resonant wavelength and analyte RI is y = 668,750x2 + 18,688.2x + 124,675.6. The resonant wavelengths change from 640 to 664, to 693, to 731, to 785, and to 866 μm when the analyte RI increases from 1.35 to 1.36, to 1.37, to 1.38, to 1.39, and to 1.40, respectively. The corresponding RI sensitivities are calculated as 2400, 2900, 3800, 5400, and 8100 nm/RIU, respectively, in the RI ranges of 1.35~1.36, 1.36~1.37, 1.37~1.38, 1.38~1.39, and 1.39~1.40. Additionally, the average RI sensitivity is calculated as 4520 nm/RIU.
Figure 11a shows the CL spectra of the core mode B when the temperature changes from 20 to 60 °C. It can be seen from Figure 11a that with an increase in the temperature, the CL spectra of the core mode B occurs to red-shift, and the corresponding CL peak values decrease with the increasing wavelength. Figure 11b shows the variation of the resonant wavelength of the core mode B with the temperature and its fitting result. As seen from Figure 11b, the linear fitting result between the resonant wavelength and analyte RI is y = 4.83x + 1298.6, which has good linearity. The resonant wavelengths vary from 1395 to 1443, to 1494, to 1538, and to 1589 nm when the temperatures increases from 20 to 30, to 40, to 50, and to 60 °C, respectively. The corresponding temperature sensitivities are calculated as 4.8, 5.1, 4.4, and 5.1 nm/°C, respectively, in the temperature ranges of 20~30, 30~40, 40~50, and 50~60 °C. Additionally, the average temperature sensitivity is calculated as 4.83 nm/°C.
In other works, different orthogonal polarization states of the core mode are used to measure the temperature and RI simultaneously. The proposed SPR-based PCF sensor can measure the RI and temperature separately at different wavelength regions, so that it realizes the simultaneous measurement of the two parameters, alone with the negligible crosstalk. Table 2 shows the comparison results of the wavelength sensitivities of the proposed SPR-based PCF sensor with other works.
Except for the sensitivity, we use the resolution (R) and figure of merit (FOM) to evaluate the sensing performance of the proposed SPR-based PCF sensor [45]. Figure 12a,b show the R and FOM of the proposed SPR-based PCF sensor with the changes of RI and temperature. From Figure 12a, the R shows the decreasing trend as the analyte RI increases, and it is larger than 10−5 in the RI range of 1.35~1.40. Additionally, the FOM shows an increasing trend as the analyte RI increases, and the maximum R and FOM of the proposed SPR-based PCF sensor are 1.234 × 10⁻⁵ RIU and 405 RIU−1, respectively. From Figure 12b, as the temperature increases, the R is almost unchanged, and FOM shows the decreasing trend. The maximum R and FOM of the proposed SPR-based PCF sensor are 1.961 × 10⁻² °C and 3.56 × 10⁻² °C−1, respectively. In summary, the proposed SPR-based PCF sensor can achieve high sensitivity, good linearity, high R, and large FOM for both the RI and temperature sensing at the same time.

4.2. Independent Sensing of the Proposed SPR-Based PCF Sensor

Figure 13a shows the CL spectra of the core mode A when the analyte RI is chosen as 1.35, 1.38, and 1.40, and the temperature is changed from 20 to 60 °C. It can be seen from Figure 13a that for the same analyte RI, the change of the temperature has no effect on the resonant wavelength and the CL peak value, and the CL spectrum is almost overlapped. This means that the change of the temperature has no effect on RI sensing. Figure 13b shows the CL spectra of the core mode B when the temperature is chosen as 20, 40, and 60 °C, and when the analyte RI is changed from 1.35 to 1.40. It can be seen from Figure 13b that for the same temperature, the change of the analyte RI has no effect on the resonant wavelength and the CL peak value, and the CL spectrum is almost overlapped. It means that the change of the analyte RI has no effect on temperature sensing. The main reason considered is that the two core modes A and B have different phase-matching conditions due to the introduction of the inner and outer gold films, which makes the CL spectrum used for RI and temperature sensing well separated at different wavelengths. At the same time, by adjusting the structural parameters, the energy coupling between the two core modes A and B is completely avoided. Therefore, the independent sensing of the RI and temperature can be realized.

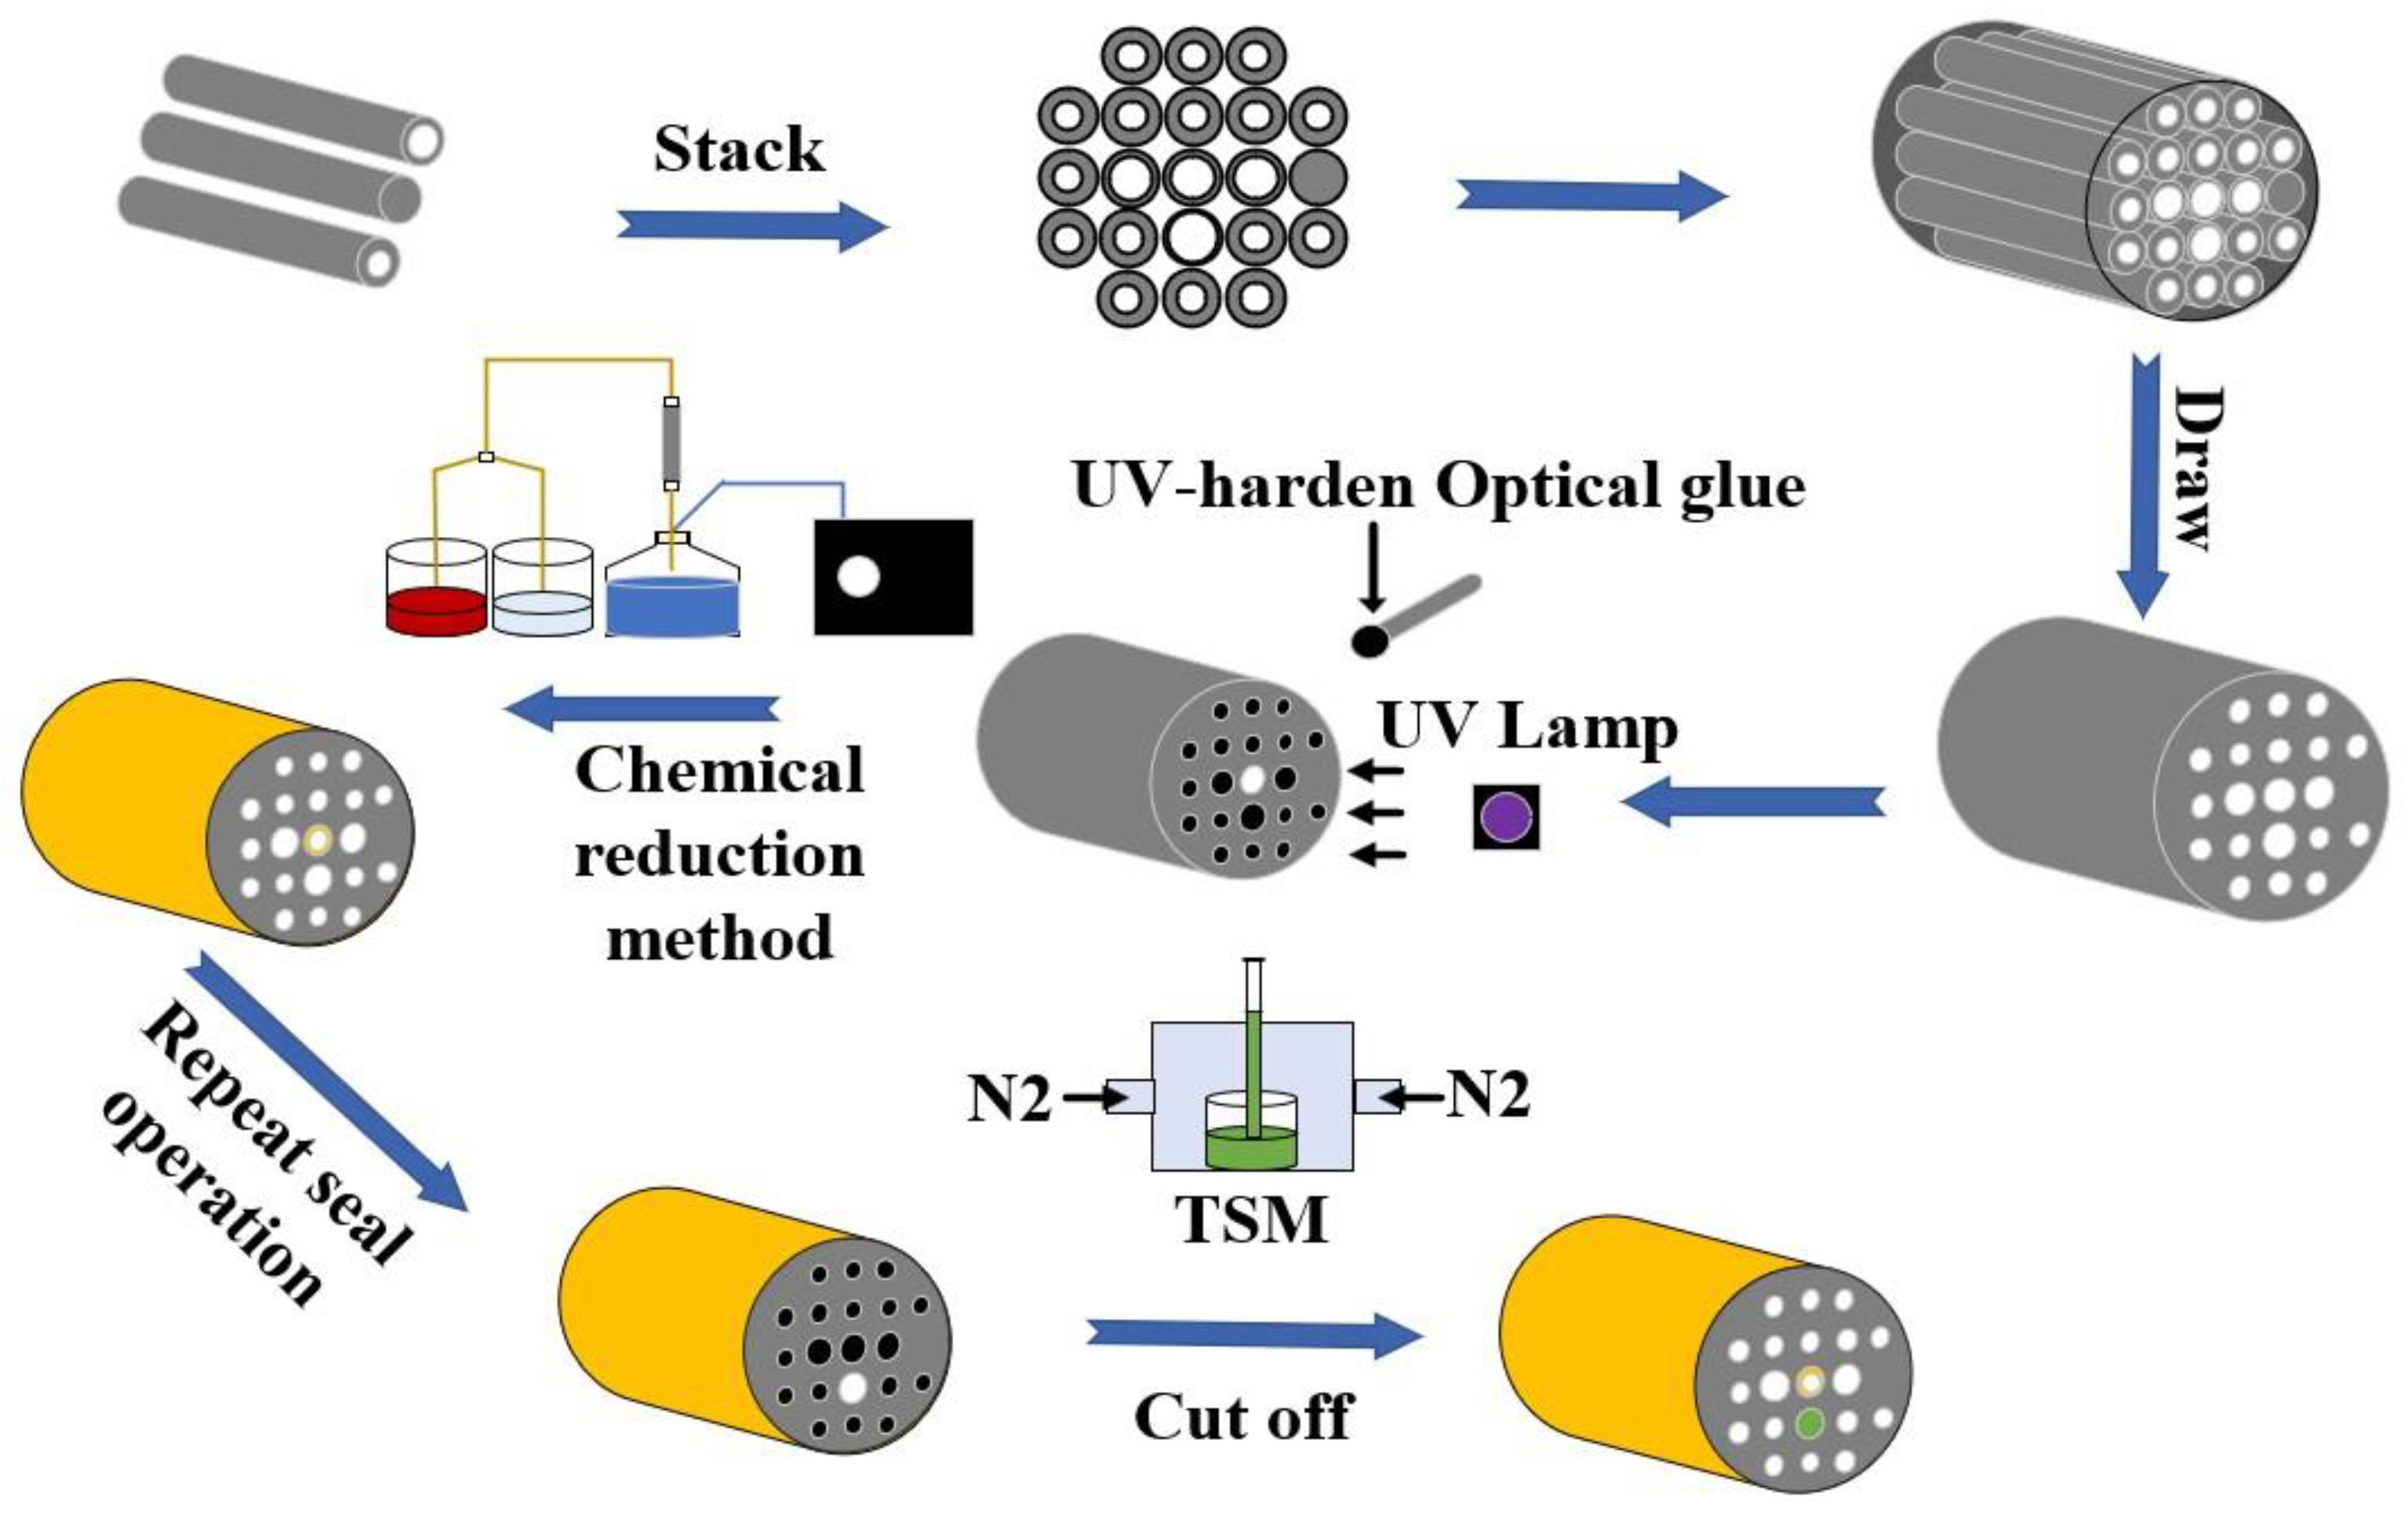
5. Fabrication Processes of the SPR-Based PCF Sensor

Figure 14 shows the schematic diagram of the proposed SPR-based PCF sensor fabrication. The prefabricated rods with different diameters can be easily drawn into the desired structure via the stacking and drawing method [46]. The inner and outer gold films coating inside the central air hole and surface of the PCF can be obtained via the chemical reduction method [47,48]. First, we use the UV glue to block the air holes that do not need to be coated, and we use the UV lamp to irradiate the UV glue. Second, we connect the PCF with the solution containing the metal ions and the reducing agent. Third, through connecting the vacuum pump and adjusting the extraction rate of the vacuum chestnut, the reduced gold can be uniformly attached to the inter-wall of the PCF. Additionally, the outer gold film can be coated in the same way. The TSM can be selectively filled into the air holes using the filling technology [49]. Similarly, the unfilled air holes are sealed with the UV glue, and the TSM is pumped into the air holes of the PCF using a vacuum pump. Finally, the desired fiber length can be obtained by cutting off the fabricated PCF.
This work mainly focuses on the comprehensive structure design and theoretical analysis of the SPR-based PCF sensor, which can be considered as being a valuable guidance for future experimental work. In the next step, we plan to actually fabricate the proposed SPR-based PCF sensor, and experimentally investigate its sensing performances. Moreover, the experimental results will be compared with the theoretical ones to optimize the design and theoretical model.

6. Conclusions

In summary, a simple SPR-based PCF sensor that can realize the independent sensing of the RI and temperature is proposed. By introducing the inner and outer gold films and TSM, the RI and temperature can be measured simultaneously at different wavelength regions. The simulation results show that the average wavelength sensitivity of the proposed SPR-based PCF sensor can reach 4520 nm/RIU in the RI range of 1.35~1.40 and 4.83 nm/°C in temperature range of 20~60 °C, respectively, along with negligible crosstalk. The proposed SPR-based PCF sensor is expected to have important applications in biomedicine and in environmental science.

Author Contributions

J.Z., J.Y. and K.W. conceived and designed the proposed fiber sensor; J.Z., Y.Q. and S.Q. performed the simulations; X.Z., C.M. and Q.W. performed the formal analysis; K.W., X.S., B.Y. and C.Y. supervised the research and the manuscript. All authors have read and agreed to the published version of the manuscript.

Funding

This research was funded by the National Natural Science Foundation of China (Grant No. 62275015).

Institutional Review Board Statement

Not applicable.

Informed Consent Statement

Not applicable.

Data Availability Statement

Not applicable.

Acknowledgments

We thank the State Key Laboratory of Information Photonics and Optical Communications (Beijing University of Posts and Telecommunications of China) for scientific help and support throughout this research.

Conflicts of Interest

The authors declare no conflict of interest.

References

  1. Brolo, A.G. Plasmonics for future biosensors. Nat. Photonics 2012, 6, 709–713. [Google Scholar] [CrossRef]
  2. Homola, J.; Koudela, I.; Yee, S.S. Surface plasmon resonance sensors based on diffraction gratings and prism couplers: Sensitivity comparison. Sens. Actuat. B Chem. 1999, 54, 16–24. [Google Scholar] [CrossRef]
  3. Wu, L.; Chu, H.S.; Koh, W.S.; Li, E.P. Highly sensitive graphene biosensors based on surface plasmon resonance. Opt. Express 2010, 18, 14395–14400. [Google Scholar] [CrossRef] [PubMed]
  4. Onodera, H.; Awai, I.; Ikenoue, J. Refractive-index measurement of bulk materials: Prism coupling method. Appl. Opt. 1983, 22, 1194–1197. [Google Scholar] [CrossRef]
  5. Liu, C.; Yang, L.; Lu, X.L.; Liu, Q.; Wang, F.M.; Lv, J.W.; Sun, T.; Mu, H.W.; Chu, P.K. Mid-infrared surface plasmon resonance sensor based on photonic crystal fibers. Opt. Express 2017, 25, 14227–14237. [Google Scholar] [CrossRef] [PubMed]
  6. Liu, Y.; Peng, W. Fiber-Optic Surface Plasmon Resonance Sensors and Biochemical Applications: A Review. J. Light. Technol. 2021, 39, 3781–3791. [Google Scholar] [CrossRef]
  7. Sharma, A.K.; Marques, C. Design and Performance Perspectives on Fiber Optic Sensors with Plasmonic Nanostructures and Gratings: A Review. IEEE Sens. J. 2019, 19, 7168–7178. [Google Scholar] [CrossRef]
  8. Hassani, A.; Skorobogatiy, M. Design of the microstructured optical fiber-based surface plasmon resonance sensors with enhanced microfluidics. Opt. Express 2006, 14, 11616–11621. [Google Scholar] [CrossRef]
  9. Luan, N.N.; Ding, C.F.; Yao, J.Q. A Refractive Index and Temperature Sensor Based on Surface Plasmon Resonance in an Exposed-Core Microstructured Optical Fiber. IEEE Photon. J. 2016, 8, 1–8. [Google Scholar] [CrossRef]
  10. Peng, L.; Shi, F.K.; Zhou, G.Y.; Ge, S.; Hou, Z.Y.; Xia, C.M. A Surface Plasmon Biosensor Based on a D-Shaped Microstructured Optical Fiber With Rectangular Lattice. IEEE Photon. J. 2015, 7, 1–9. [Google Scholar] [CrossRef]
  11. Tan, Z.X.; Li, X.J.; Chen, Y.Z.; Fan, P. Improving the Sensitivity of Fiber Surface Plasmon Resonance Sensor by Filling Liquid in a Hollow Core Photonic Crystal Fiber. Plasmonics 2014, 9, 167–173. [Google Scholar] [CrossRef]
  12. Rifat, A.A.; Mahdiraji, G.A.; Chow, D.M.; Shee, Y.G.; Ahmed, R.; Adikan, F.R.M. Photonic Crystal Fiber-Based Surface Plasmon Resonance Sensor with Selective Analyte Channels and Graphene-Silver Deposited Core. Sensors 2015, 15, 11499–11510. [Google Scholar] [CrossRef]
  13. Chen, H.L.; Li, S.G.; Li, J.S.; Han, Y.; Wu, Y.D. High Sensitivity of Temperature Sensor Based on Ultracompact Photonics Crystal Fibers. IEEE Photon. J. 2014, 6, 1–6. [Google Scholar] [CrossRef]
  14. Liu, Q.; Xing, L.; Wu, Z.X. The highly sensitive magnetic field sensor based on photonic crystal fiber filled with nano-magnetic fluid. Opt. Commun. 2019, 452, 238–246. [Google Scholar] [CrossRef]
  15. Tang, Z.J.; Lou, S.Q.; Wang, X.; Zhang, W.; Yan, S.B. Using mode coupling mechanism in symmetrical triple-core photonic crystal fiber for high performance strain sensing. IEEE J. Sel. Top. Quantum Electron. 2020, 26, 1–7. [Google Scholar] [CrossRef]
  16. Akowuah, E.K.; Gorman, T.; Ademgil, H.; Haxha, S.; Robinson, G.K.; Oliver, J.V. Numerical Analysis of a Photonic Crystal Fiber for Biosensing Applications. IEEE J. Quantum Electron. 2012, 48, 1403–1410. [Google Scholar] [CrossRef]
  17. Hossain, M.B.; Islam, S.M.R.; Hossain, K.M.T.; Abdulrazak, L.F.; Sakib, M.N.; Amiri, I.S. High sensitivity hollow core circular shaped PCF surface plasmonic biosensor employing silver coat: A numerical design and analysis with external sensing approach. Results Phys. 2020, 16, 102909. [Google Scholar] [CrossRef]
  18. Qiu, S.; Yuan, J.H.; Zhou, X.; Qu, Y.W.; Yan, B.B.; Wu, Q.; Wang, K.R.; Sang, X.Z.; Long, K.P.; Yu, C.X. Highly sensitive temperature sensing based on all-solid cladding dual-core photonic crystal fiber filled with the toluene and ethanol. Opt. Commun. 2020, 477, 126357. [Google Scholar] [CrossRef]
  19. Zhang, J.G.; Yuan, J.H.; Qu, Y.W.; Qiu, S.; Mei, C.; Zhou, X.; Yan, B.B.; Wu, Q.; Wang, K.R.; Sang, X.Z.; et al. A novel surface plasmon resonance-based photonic crystal fiber refractive index sensor with an ultra-wide detection range. Optik 2022, 259, 168977. [Google Scholar] [CrossRef]
  20. Yin, G.L.; Wang, Y.P.; Liao, C.R.; Sun, B.; Liu, Y.J.; Liu, S.; Wang, Q.; Yang, K.M.; Tang, J.; Zhong, X.Y. Simultaneous Refractive Index and Temperature Measurement With LPFG and Liquid-Filled PCF. IEEE Photon. Technol. Lett. 2015, 27, 375–378. [Google Scholar] [CrossRef]
  21. Liu, Y.C.; Li, S.G.; Chen, H.L.; Li, J.S.; Zhang, W.X.; Wang, M.Y. Surface Plasmon Resonance Induced High Sensitivity Temperature and Refractive Index Sensor Based on Evanescent Field Enhanced Photonic Crystal Fiber. J. Light. Technol. 2020, 38, 919–928. [Google Scholar] [CrossRef]
  22. Guo, Y.; Li, J.S.; Li, S.G.; Liu, Y.C.; Meng, X.J.; Bi, W.H.; Lu, H.B.; Cheng, T.L.; Hao, R. Amphibious sensor of temperature and refractive index based on D-shaped photonic crystal fibre filled with liquid crystal. Liq. Cryst. 2020, 47, 882–894. [Google Scholar] [CrossRef]
  23. Danlard, I.; Akowuah, E.K. Design and Theoretical Analysis of a Dual-Polarized Quasi D-Shaped Plasmonic PCF Microsensor for Back-to-Back Measurement of Refractive Index and Temperature. IEEE Sens. J. 2021, 21, 9860–9868. [Google Scholar] [CrossRef]
  24. Chen, A.; Yu, Z.H.; Dai, B.; Li, Y.T. Highly Sensitive Detection of Refractive Index and Temperature Based on Liquid-Filled D-Shape PCF. IEEE Photon. Technol. Lett. 2021, 33, 529–532. [Google Scholar] [CrossRef]
  25. Mollah, M.A.; Islam, S.R.; Yousufali, M.; Abdulrazak, L.F.; Hossain, M.B.; Amiri, I. Plasmonic temperature sensor using D-shaped photonic crystal fiber. Results Phys. 2020, 16, 102966. [Google Scholar] [CrossRef]
  26. Al Mahfuz, M.; Mollah, M.A.; Momota, M.R.; Paul, A.K.; Masud, A.; Akter, S.; Hasan, M.R. Highly sensitive photonic crystal fiber plasmonic biosensor: Design and analysis. Opt. Mater. Express 2019, 90, 315–321. [Google Scholar] [CrossRef]
  27. Liu, C.; Su, W.Q.; Liu, Q.; Lu, X.L.; Wang, F.M.; Sun, T.; Chu, P.K. Symmetrical dual D-shape photonic crystal fibers for surface plasmon resonance sensing. Opt. Express 2018, 26, 9039–9049. [Google Scholar] [CrossRef] [PubMed]
  28. Liu, Q.; Li, S.G.; Chen, H.L.; Li, J.S.; Fan, Z.K. High-sensitivity plasmonic temperature sensor based On photonic crystal fiber coated with nanoscale gold film. Appl. Phys. Express 2015, 8, 4. [Google Scholar] [CrossRef]
  29. Bing, P.B.; Wu, G.F.; Sui, J.L.; Zhang, H.T.; Tan, L.; Li, Z.Y.; Yao, J.Q. Double Samples Synchronous Detection Sensor based on Up-Core Photonic Crystal Fiber. Optik 2020, 224, 165522. [Google Scholar] [CrossRef]
  30. Danlard, I.; Akowuah, E.K. Assaying with PCF-based SPR refractive index biosensors: From recent configurations to outstanding detection limits. Opt. Fiber Technol. 2020, 54, 102083. [Google Scholar] [CrossRef]
  31. Liang, H.; Zhang, W.G.; Wang, H.Y.; Geng, P.C.; Zhang, S.S.; Gao, S.C.; Yang, C.X.; Li, J.L. Fiber in-line Mach-Zehnder interferometer based on near-elliptical core photonic crystal fiber for temperature and strain sensing. Opt. Lett. 2013, 38, 4019–4022. [Google Scholar] [CrossRef] [PubMed]
  32. Islam, M.S.; Cordeiro, C.M.B.; Sultana, J.; Aoni, R.A.; Feng, S.L.; Ahmed, R.; Dorraki, M.; Dinovitser, A.; Ng, B.W.H.; Abbott, D. A Hi-Bi Ultra-Sensitive Surface Plasmon Resonance Fiber Sensor. IEEE Access 2019, 7, 79085–79094. [Google Scholar] [CrossRef]
  33. Xiao, F.; Michel, D.; Li, G.Y.; Xu, A.S.; Alameh, K. Simultaneous Measurement of Refractive Index and Temperature Based on Surface Plasmon Resonance Sensors. J. Light. Technol. 2014, 32, 4169–4173. [Google Scholar] [CrossRef]
  34. Rahman, K.M.M.; Alam, M.S.; Ahmed, R.; Islam, M.A. Irregular hexagonal core based surface plasmon resonance sensor in near-infrared region. Results Phys. 2021, 23, 103983. [Google Scholar] [CrossRef]
  35. Yang, X.C.; Lu, Y.; Liu, B.L.; Yao, J.Q. Simultaneous measurement of refractive index and temperature based on SPR in D-shaped MOF. Appl. Opt. 2017, 56, 4369–4374. [Google Scholar] [CrossRef]
  36. Qu, Y.; Yuan, J.H.; Zhou, X.; Li, F.; Mei, C.; Yan, B.B.; Wu, Q.; Wang, K.R.; Sang, X.Z.; Long, K.P.; et al. A V-shape photonic crystal fiber polarization filter based on surface plasmon resonance effect. Opt. Commun. 2019, 452, 1–6. [Google Scholar] [CrossRef]
  37. Islam, M.S.; Sultana, J.; Rifat, A.A.; Ahmed, R.; Dinovitser, A.; Ng, B.W.H.; Ebendorff-Heidepriem, H.; Abbott, D. Dual-polarized highly sensitive plasmonic sensor in the visible to near-IR spectrum. Opt. Express 2018, 26, 30347–30361. [Google Scholar] [CrossRef]
  38. Yu, X.; Zhang, Y.; Pan, S.S.; Shum, P.; Yan, M.; Leviatan, Y.; Li, C.M. A selectively coated photonic crystal fiber based surface plasmon resonance sensor. J. Opt. 2010, 12, 015005. [Google Scholar] [CrossRef]
  39. Luan, N.N.; Wang, R.; Lv, W.H.; Yao, J.Q. Surface plasmon resonance sensor based on D-shaped microstructured optical fiber with hollow core. Opt. Express 2015, 23, 8576–8582. [Google Scholar] [CrossRef]
  40. Xiao, G.L.; Ou, Z.T.; Yang, H.Y.; Xu, Y.P.; Chen, J.Y.; Li, H.O.; Li, Q.; Zeng, L.Z.; Den, Y.R.; Li, J.Q. An Integrated Detection Based on a Multi-Parameter Plasmonic Optical Fiber Sensor. Sensors 2021, 21, 803. [Google Scholar] [CrossRef]
  41. Hu, Y.C.; Lin, Q.Y.; Yan, F.; Xiao, L.; Ni, L.Q.; Liang, W.; Chen, L.; Liu, G.S.; Chen, Y.F.; Luo, Y.H.; et al. Simultaneous Measurement of the Refractive Index and Temperature Based on a Hybrid Fiber Interferometer. IEEE Sens. J. 2020, 20, 13411–13417. [Google Scholar] [CrossRef]
  42. Wang, Y.J.; Li, S.G.; Wang, M.Y.; Yu, P.T. Refractive index sensing and filtering characteristics of side-polished and gold-coated photonic crystal fiber with a offset core. Opt. Laser Technol. 2021, 136, 106759. [Google Scholar] [CrossRef]
  43. Wang, M.Y.; Chen, H.L.; Jing, X.L.; Li, S.G.; Ma, M.J.; Zhang, W.X.; Zhang, Y.Y. Temperature sensor based on modes coupling effect in a liquid crystal-filled microstructured optical fiber. Optik 2020, 219, 165044. [Google Scholar] [CrossRef]
  44. Zhang, Y.Y.; Chen, H.L.; Wang, M.Y.; Liu, Y.D.; Fan, X.Y.; Chen, Q.; Wu, B.A. Simultaneous measurement of refractive index and temperature of seawater based on surface plasmon resonance in a dual D-type photonic crystal fiber. Mater. Res. Express. 2021, 8, 8. [Google Scholar] [CrossRef]
  45. Liu, C.; Su, W.; Wang, F.; Li, X.; Liu, Q.; Mu, H.; Sun, T.; Chu, P.K.; Liu, B. Birefringent PCF-Based SPR Sensor for a Broad Range of Low Refractive Index Detection. IEEE Photon. Technol. Lett. 2018, 30, 1471–1474. [Google Scholar] [CrossRef]
  46. Lee, H.W.; Schmidt, M.A.; Russell, R.F.; Joly, N.Y.; Tyagi, H.K.; Uebel, P.; Russell, P.S.J. Pressure-assisted melt-filling and optical characterization of Au nano-wires in microstructured fibers. Opt. Express 2011, 19, 12180–12189. [Google Scholar] [CrossRef]
  47. Lu, M.D.; Peng, W.; Liu, Q.; Liu, Y.; Li, L.X.; Liang, Y.Z.; Masson, J.F. Dual channel multilayer-coated surface plasmon resonance sensor for dual refractive index range measurements. Opt. Express 2017, 25, 8563–8570. [Google Scholar] [CrossRef]
  48. Shi, Y.W.; Ito, K.; Ma, L.; Yoshida, T.; Matsuura, Y.; Miyagi, M. Fabrication of a polymer-coated silver hollow optical fiber with high performance. Appl. Opt. 2006, 26, 6736–6740. [Google Scholar] [CrossRef]
  49. Liu, Q.; Li, S.; Gao, X. Highly sensitive plasmonics temperature sensor based on photonic crystal fiber with a liquid core. Opt. Commun. 2018, 427, 622–627. [Google Scholar]
Figure 1. (a) The 3D view of the proposed SPR-based PCF sensor. (b) Cross-sectional schematic of the SPR-based PCF sensor. The inserts (i) and (ii) show the electric field distributions of the core A and B, respectively.
Polymers 14 03893 g001
Figure 2. (a) The CL spectra of the core mode A, and the effective RI real parts of the core mode A and zero-order SPP mode when the analyte RI is chosen as 1.40. (bd) The mode field distributions of the core mode A and zero-order SPP mode calculated at wavelengths 0.82, 0.863, and 0.9 μm, respectively.
Polymers 14 03893 g002
Figure 3. (a) The CL spectra of the core mode B, and the effective RI real parts of the core mode B and second-order SPP mode when the temperature is chosen as 20 °C. (bd) show the mode field distributions of the core mode B and the second-order SPP mode calculated at wavelengths 1.3, 1.414, and 1.5 μm, respectively.
Polymers 14 03893 g003
Figure 4. (a) The CL spectra of the core mode A when d1 is set as 1.4, 1.6, and 1.8 μm, and when the analyte RI increases from 1.35 to 1.40, respectively. (b) The CL spectra of the core mode B when d1 is set as 1.4, 1.6, and 1.8 μm, and when the temperature is chosen as 20, 40, and 60 °C, respectively.
Polymers 14 03893 g004
Figure 5. (a) The CL spectra of the core mode A when d2 is set as 1.6, 1.8, and 2.0 μm, and when the analyte RI increases from 1.35 to 1.40, respectively. (b) The CL spectra of the core mode B when d2 is set as 1.6, 1.8, and 2.0 μm, and the temperature is chosen as 20, 40, and 60 °C, respectively.
Polymers 14 03893 g005
Figure 6. (a) The CL spectra of the core mode A when d3 is set as 1.6, 2.0, and 2.4 μm, and the analyte RI increases from 1.35 to 1.40, respectively. (b) The CL spectra of the core mode B when d3 is set as 1.6, 2.0, and 2.4 μm, and when the temperature is chosen as 20, 40, and 60 °C, respectively.
Polymers 14 03893 g006
Figure 7. (a) The CL spectra of the core mode A when d4 is set as 1.5, 1.6, and 1.7 μm, and when the analyte RI increases from 1.35 to 1.40, respectively. (b) The CL spectra of the core mode B when d4 is set as 1.5, 1.6, and 1.7 μm, and when the temperature is chosen as 20, 40, and 60 °C, respectively.
Polymers 14 03893 g007
Figure 8. (a) The CL spectra of the core mode A when τ1 is set as 40, 50, and 60 nm, and when the analyte RI increases from 1.35 to 1.40, respectively. (b) The CL spectra of the core mode B when τ1 is set as 40, 50, and 60 nm, and when the temperature is chosen as 20, 40, and 60 °C, respectively.
Polymers 14 03893 g008
Figure 9. (a) The CL spectra of the core mode A when τ1 is set as 40, 50, and 60 nm, and when the analyte RI increases from 1.35 to 1.40, respectively. (b) The CL spectra of the core mode B when τ1 is set as 40, 50, and 60 nm, and when the temperature is chosen as 20, 40, and 60 °C, respectively.
Polymers 14 03893 g009
Figure 10. (a) The CL spectra of the core mode A. (b) The variation of the resonant wavelength of the core mode A with the analyte RI and its fitting result.
Polymers 14 03893 g010
Figure 11. (a) The CL spectra of the core mode B. (b) The variation of the resonant wavelength of the core mode B with the temperature, and its fitting result.
Polymers 14 03893 g011
Figure 12. The R and FOM of the proposed SPR-based PCF sensor with the changes of RI (a) and temperature (b).
Polymers 14 03893 g012
Figure 13. (a) The CL spectra of the core mode A when the analyte RI is chosen as 1.35, 1.38, and 1.40, and when the temperature is changed from 20 to 60 °C. (b) The CL spectra of the core mode B when the temperature is chosen as 20, 40, and 60 °C, and when the analyte RI is changed from 1.35 to 1.40.
Polymers 14 03893 g013
Figure 14. The schematic diagram of the proposed SPR-based PCF sensor fabrication.
Polymers 14 03893 g014
Table 1. Effects of the structural parameters of the proposed SPR-based PCF sensor on sensing.
Increase in Structure ParametersRITemperature
Resonant WavelengthWavelength SensitivityResonant WavelengthWavelength
Sensitivity
d1UnchangedUnchangedRed-shift
d2Red-shiftBlue-shift
d3UnchangedUnchangedRed/Blue-shift
d4UnchangedUnchangedRed-shift
τ1UnchangedUnchangedBlue-shift
τ2Red-shiftUnchangedUnchanged
Note: ↑: increased, ↓: decreased.
Table 2. Comparison results of the sensitivities of the proposed SPR-based PCF sensor with other works.
Operating Wavelength nmRI RangeSensitivity nm/RIUTemperature Range °CSensitivity nm/°C Refs.
1000–16001.0–1.62275 (Max)15–509.09 (Max)[21]
1250–16501.35–1.465000 (Max)−50–503 (Max)[22]
550–8501.35–1.403940 (Avg)20–601.075 (Avg)[23]
600–7501.33–1.341371 (Avg)0–401.06 (Avg)[44]
600–950, 1200–18001.35–1.404520 (Avg) 8100 (Max)20–604.83 (Avg); 5.1 (Max)This work
Publisher’s Note: MDPI stays neutral with regard to jurisdictional claims in published maps and institutional affiliations.

