

Polymer Conductive Membrane-Based Circular Capacitive Pressure Sensors from Non-Touch Mode of Operation to Touch Mode of Operation: An Analytical Solution-Based Method for Design and Numerical Calibration

Abstract
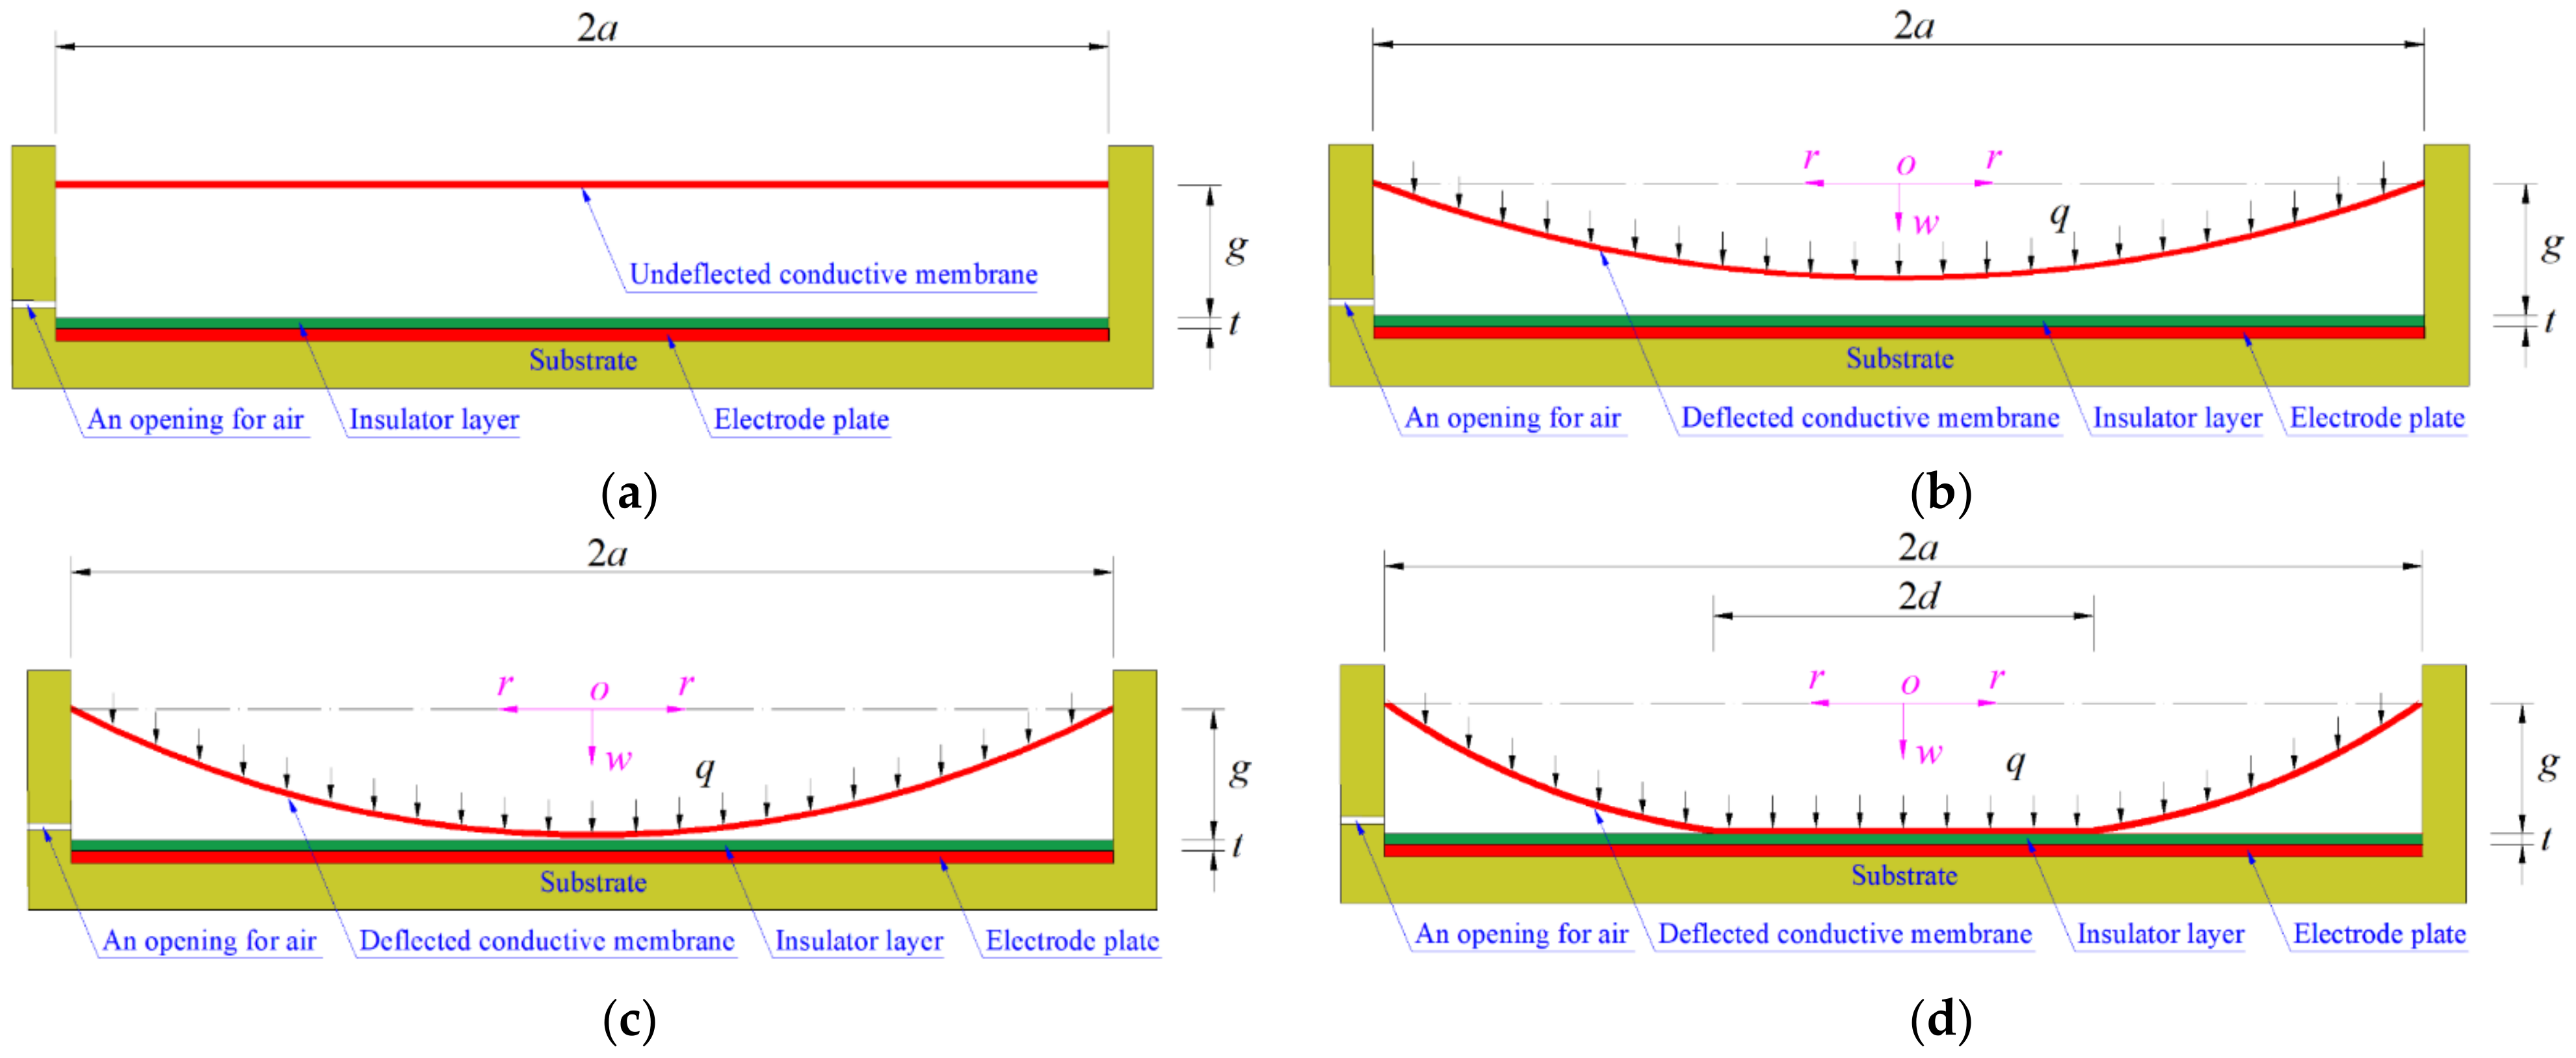
:1. Introduction
2. Materials and Methods
3. Results and Discussion
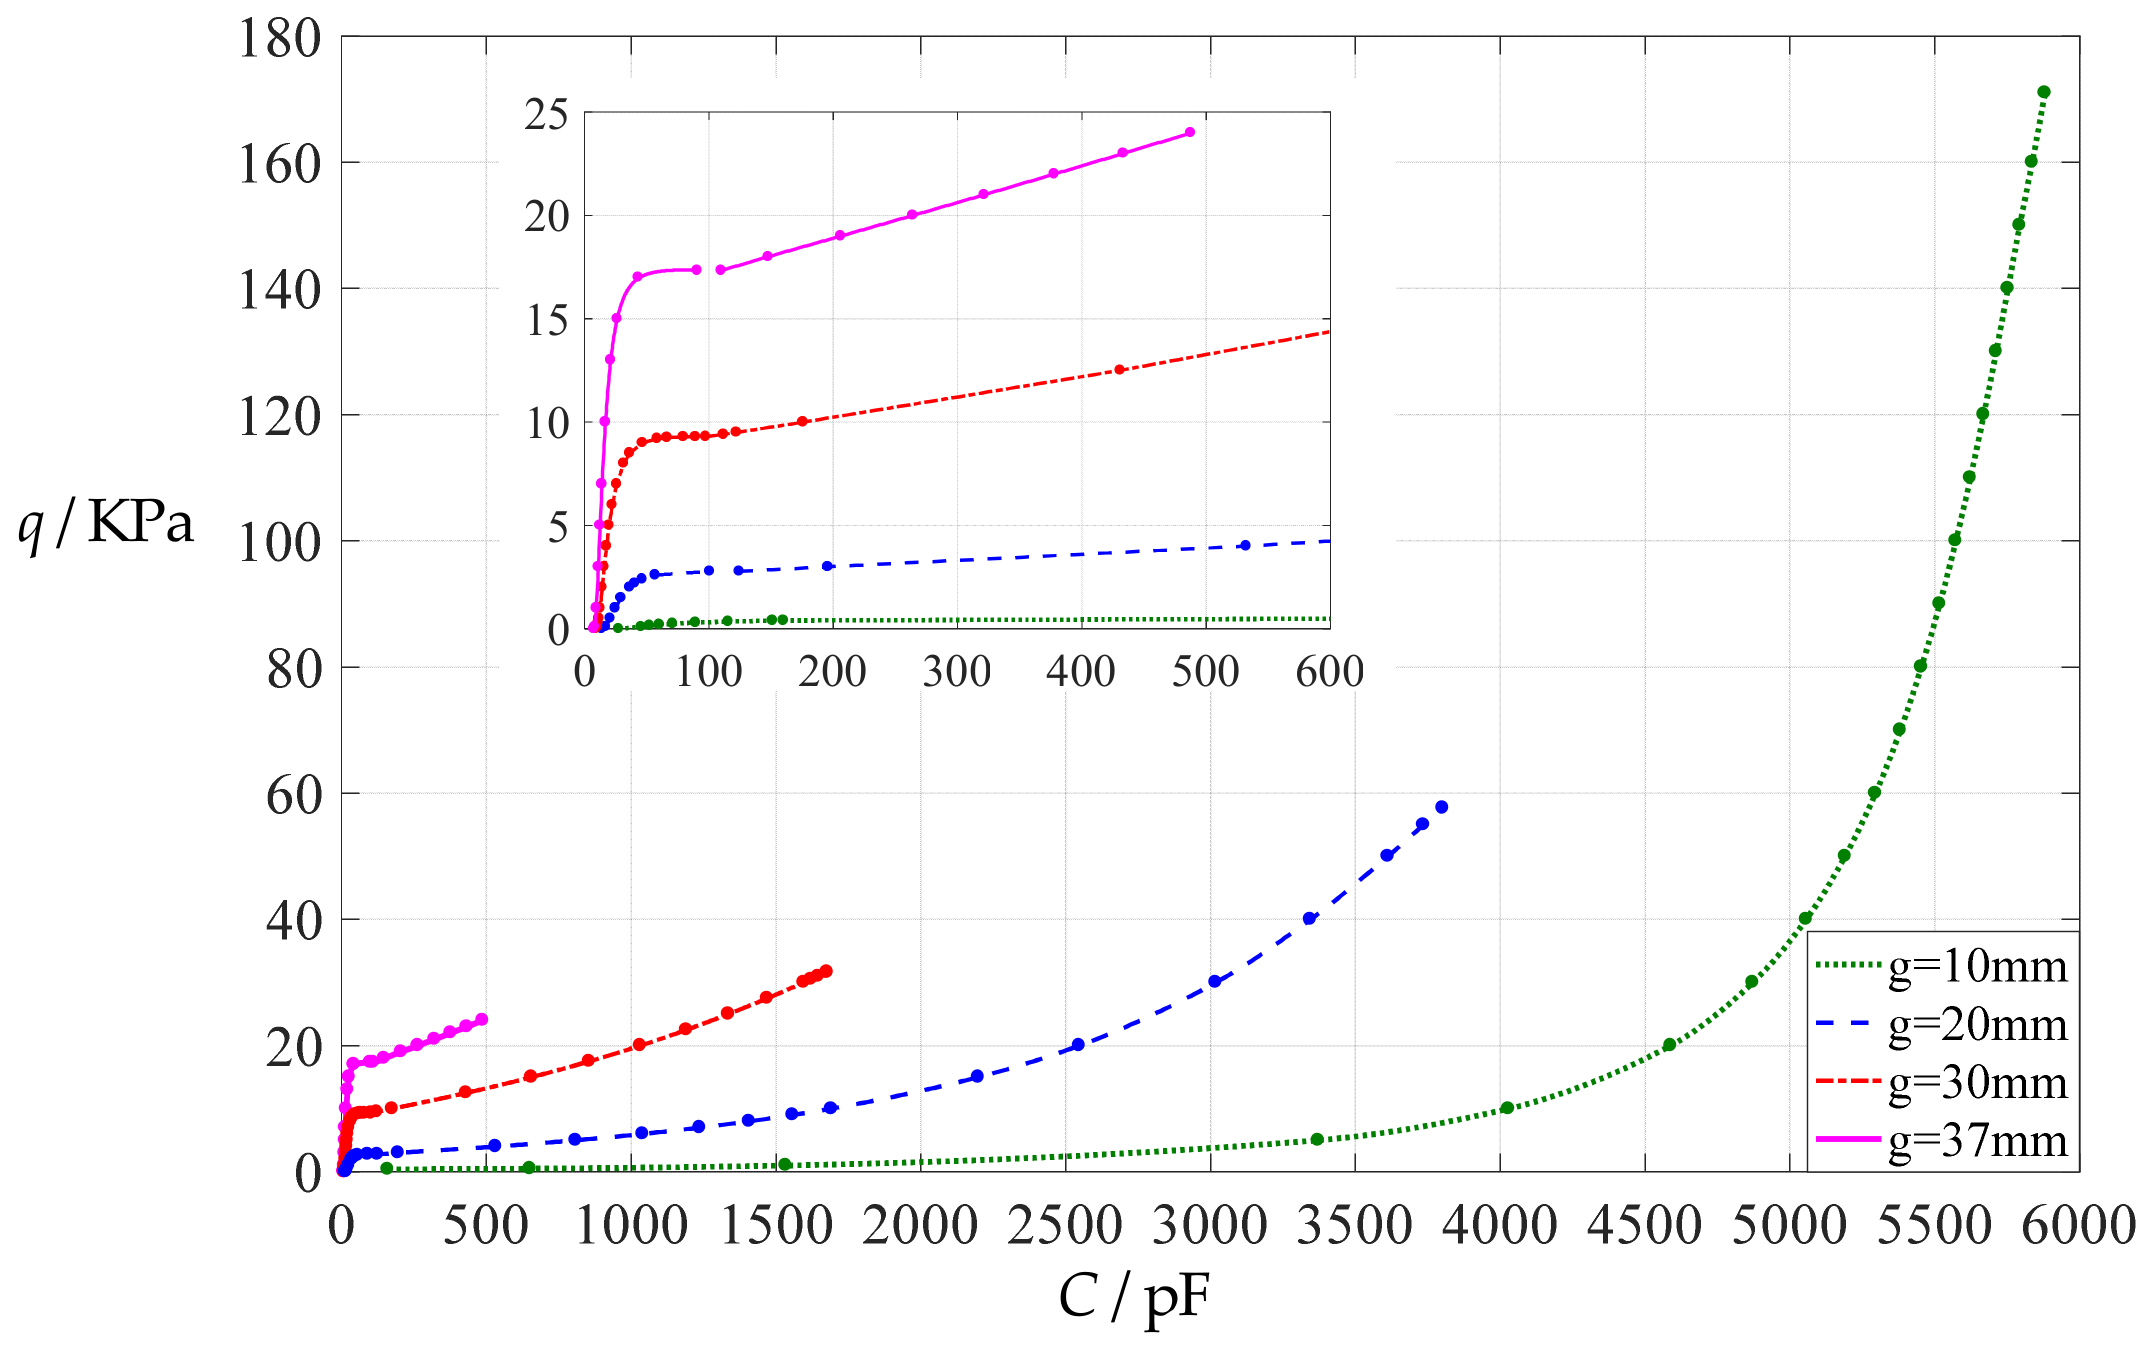
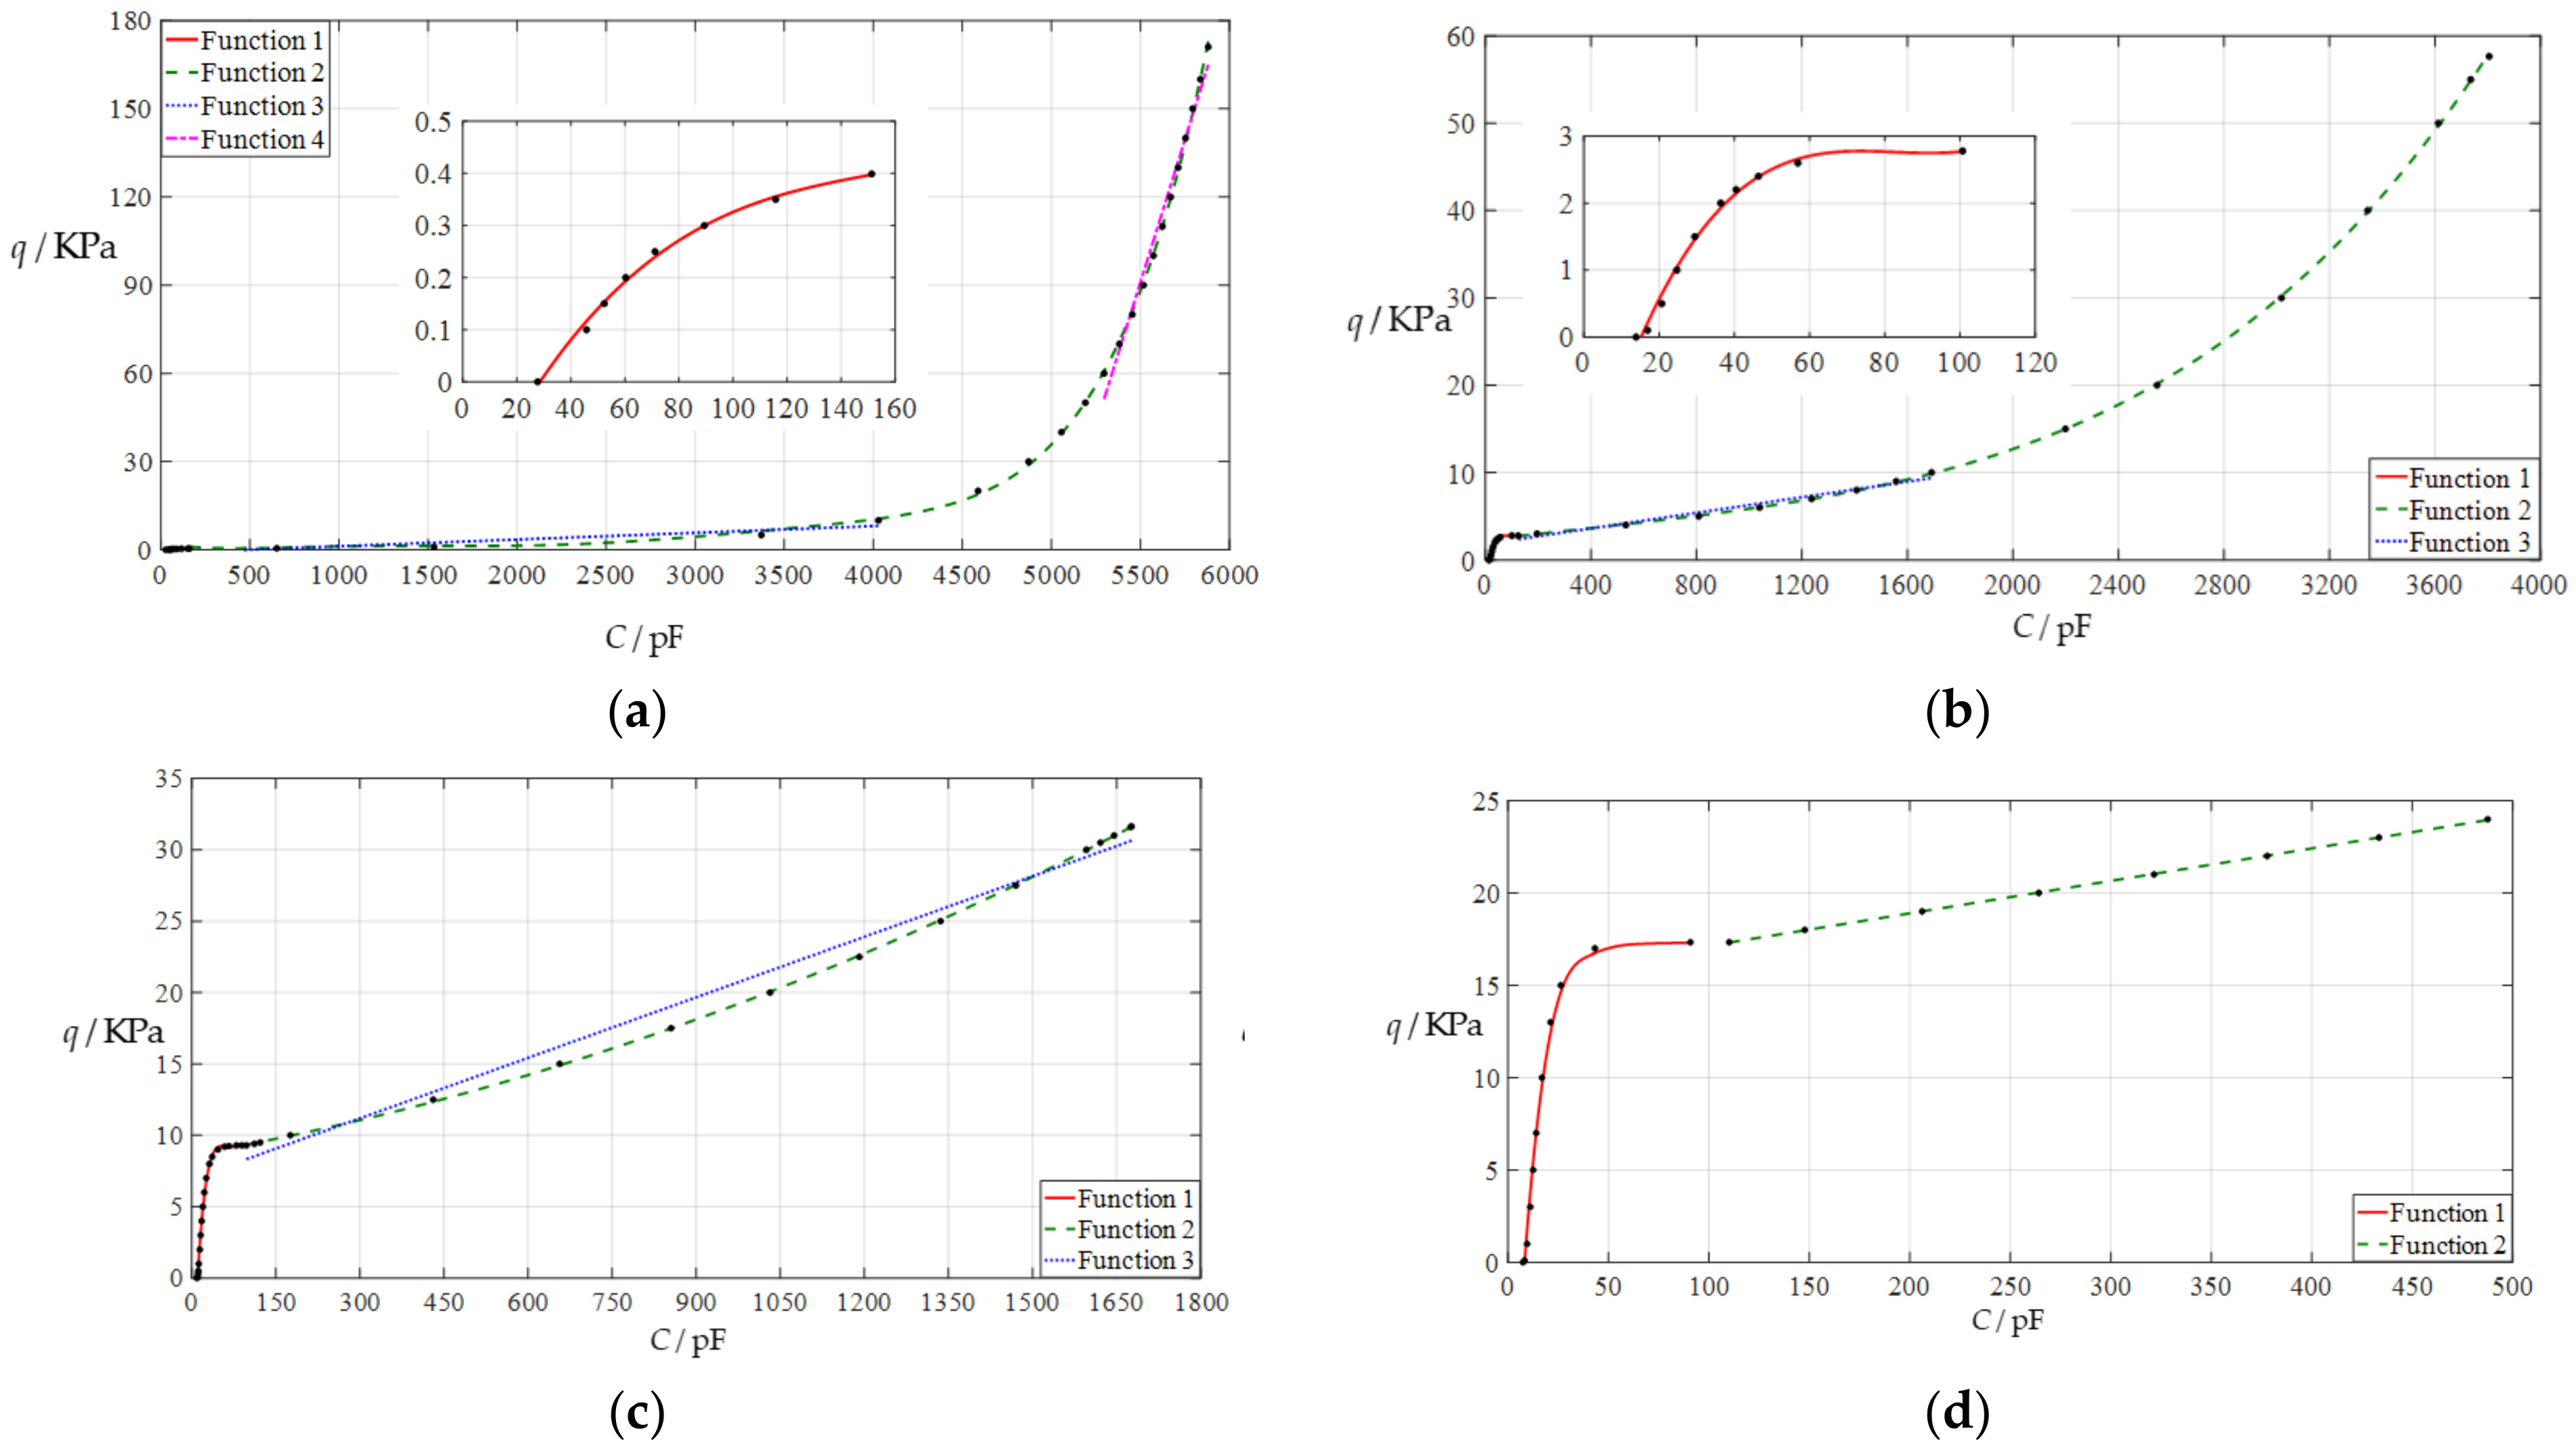
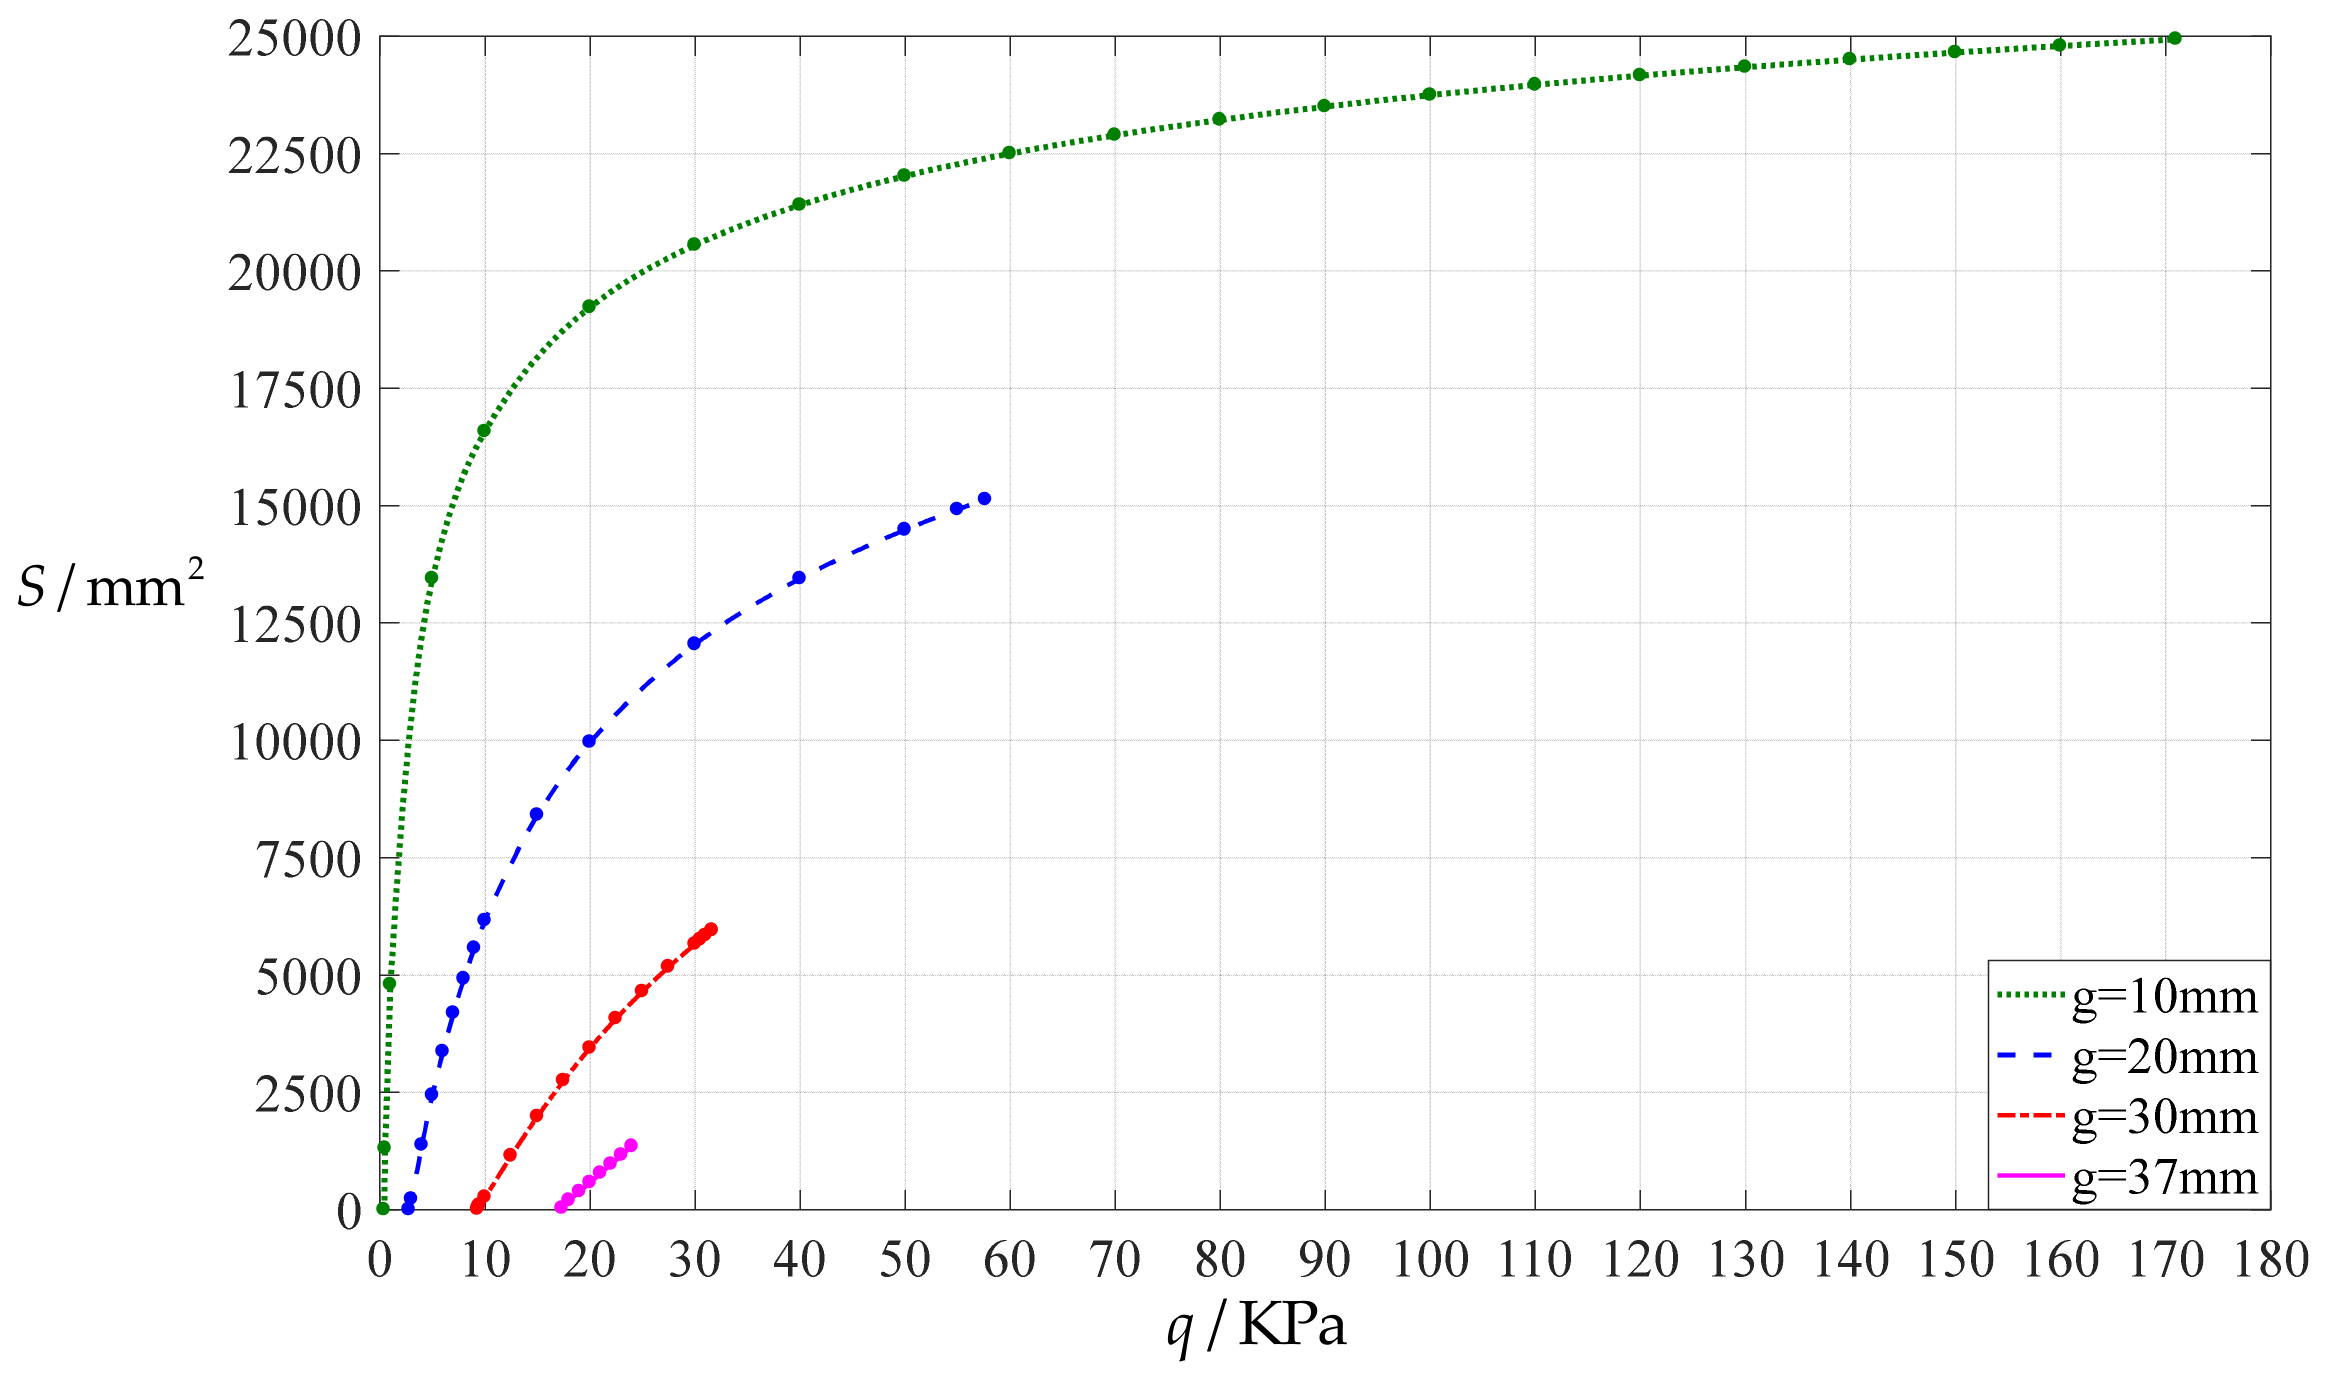
3.1. An Example of Design and Numerical Calibration Based on Analytical Solutions

| g | Functions | Range of C (pF) | Range of q (KPa) | Analytical Expressions | Average Fitting Error Squares |
|---|---|---|---|---|---|
| 10 mm | Function 1 | 27.692~151.298 | 0~0.399 | q = 1.398221 × 10⁻⁷C3 − 6.490307 × 10⁻⁵C2 + 1.099330 × 10⁻²C − 2.642701 × 10⁻¹ | 0.0000642 |
| Function 2 | 160.066~5880.785 | 0.4~171 | q = 1.098169 × 10⁻¹⁹C6 − 1.495897 × 10⁻¹⁵C5 + 7.763423 × 10⁻¹²C4 − 1.883144 × 10⁻⁸C3 + 2.186898 × 10⁻⁵C2 − 1.051067 × 10⁻²C + 2.232839 | 0.9234196 | |
| Function 3 | 160.066~4028.67 | 0.4~10 | q = 2.290661 × 10⁻³C − 1.084606 | 1.8866 | |
| Function 4 | 5295.641~5880.785 | 60~171 | q = 1.943135 × 10⁻¹C − 977.7616 | 1.8975 | |
| 20 mm | Function 1 | 13.874~100.702 | 0~2.779 | q = 9.497546 × 10⁻⁶C3 − 2.357107 × 10⁻³C2 + 1.926258 × 10⁻¹C − 2.418598 | 0.007901 |
| Function 2 | 124.485~3805.312 | 2.78~57.65 | q = 1.492638 × 10⁻¹³C4 + 2.648123 × 10⁻¹⁰C3 − 1.962660 × 10⁻⁷C2 + 3.323254 × 10⁻³C + 2.325193 | 0.0258063 | |
| Function 3 | 124.485~1691.536 | 2.78~10 | q = 4.462928 × 10⁻³C + 1.824869 | 0.1407778 | |
| 30 mm | Function 1 | 9.255~89.325 | 0~9.293 | q = −7.477549 × 10⁻⁷C4 + 2.178148 × 10⁻⁴C3 − 2.319943 × 10⁻²C2 + 1.071135C − 8.876659 | 0.0703889 |
| Function 2 | 97.515~1676.712 | 9.294~31.64 | q = 4.077032 × 10⁻⁶C2 + 6.863856 × 10⁻³C + 8.637091 | 0.0041431 | |
| Function 3 | 97.515~1676.712 | 9.294~31.64 | q = 1.412844 × 10⁻²C + 6.950865 | 0.9247063 | |
| 37 mm | Function 1 | 7.504~43.287 | 0~17 | q = 4.488971 × 10⁻⁴C3 − 5.453453 × 10⁻²C2 + 2.257596C − 15.20127 | 0.3464759 |
| Function 2 | 110.091~487.552 | 17.333~23.99 | q = 1.757338 × 10⁻²C + 15.38161 | 0.0005588 |
3.2. Parametric Analysis
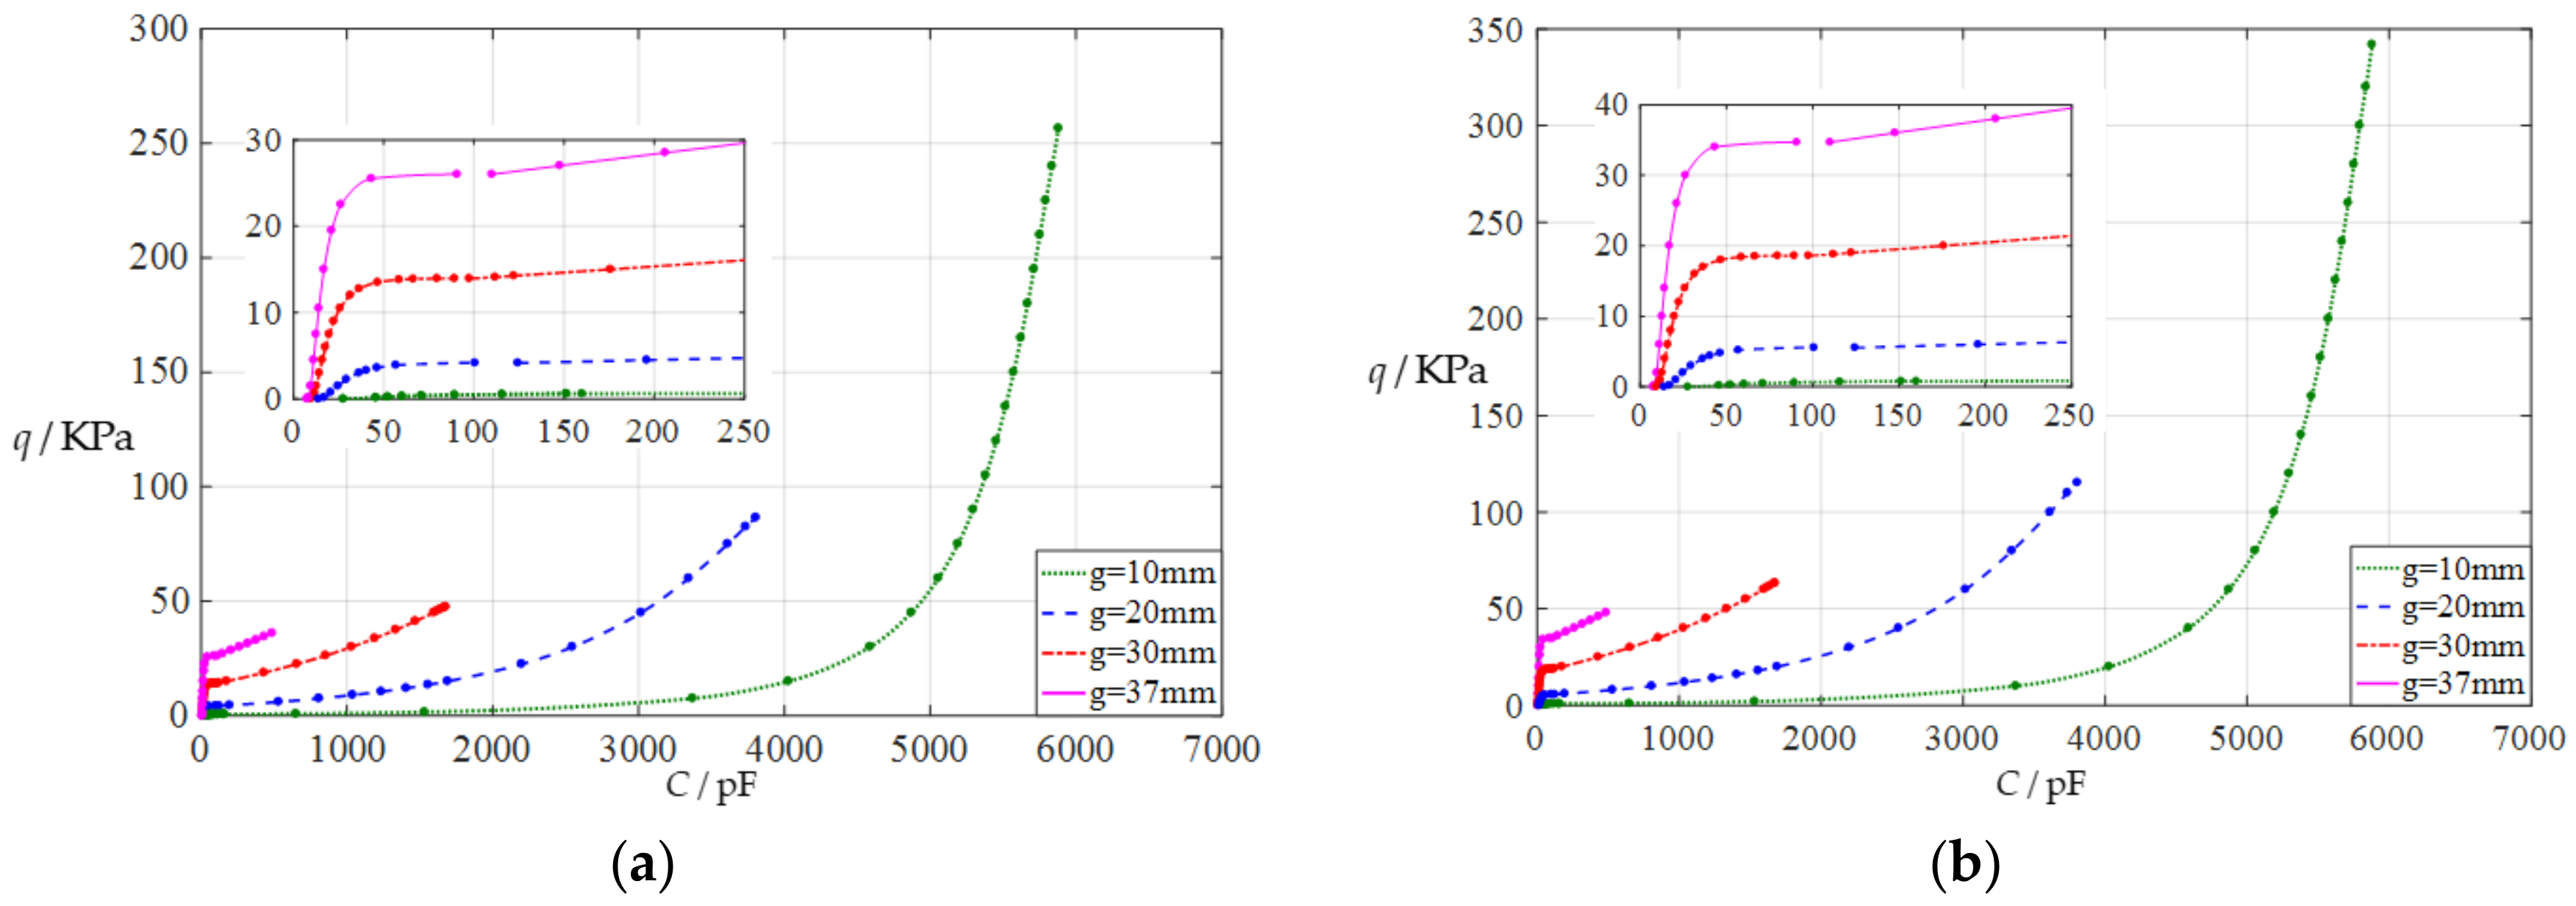
3.2.1. Effect of Membrane Thickness on Capacitance–Pressure Relationships
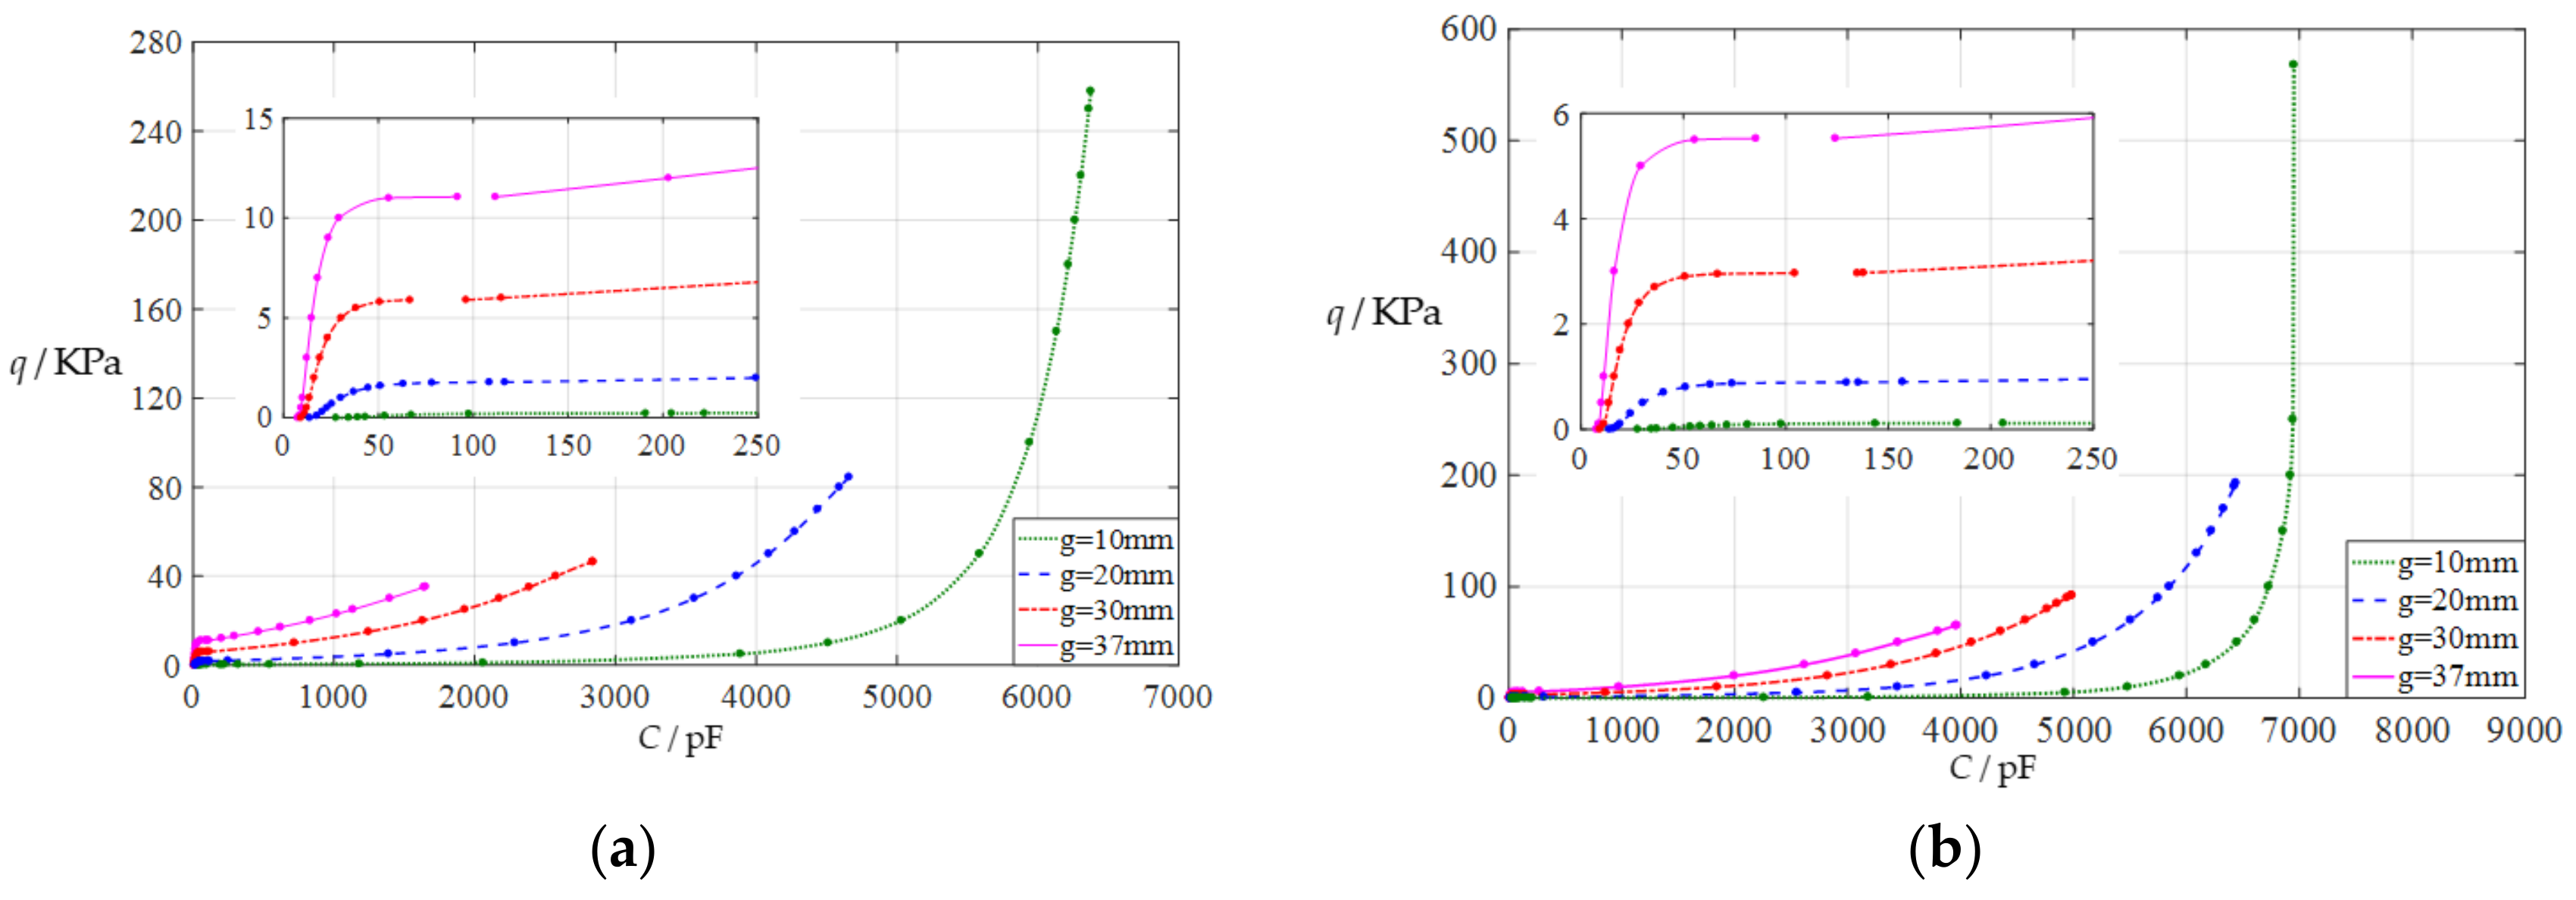
3.2.2. Effect of Young’s Modulus of Elasticity on Capacitance-Pressure Relationships
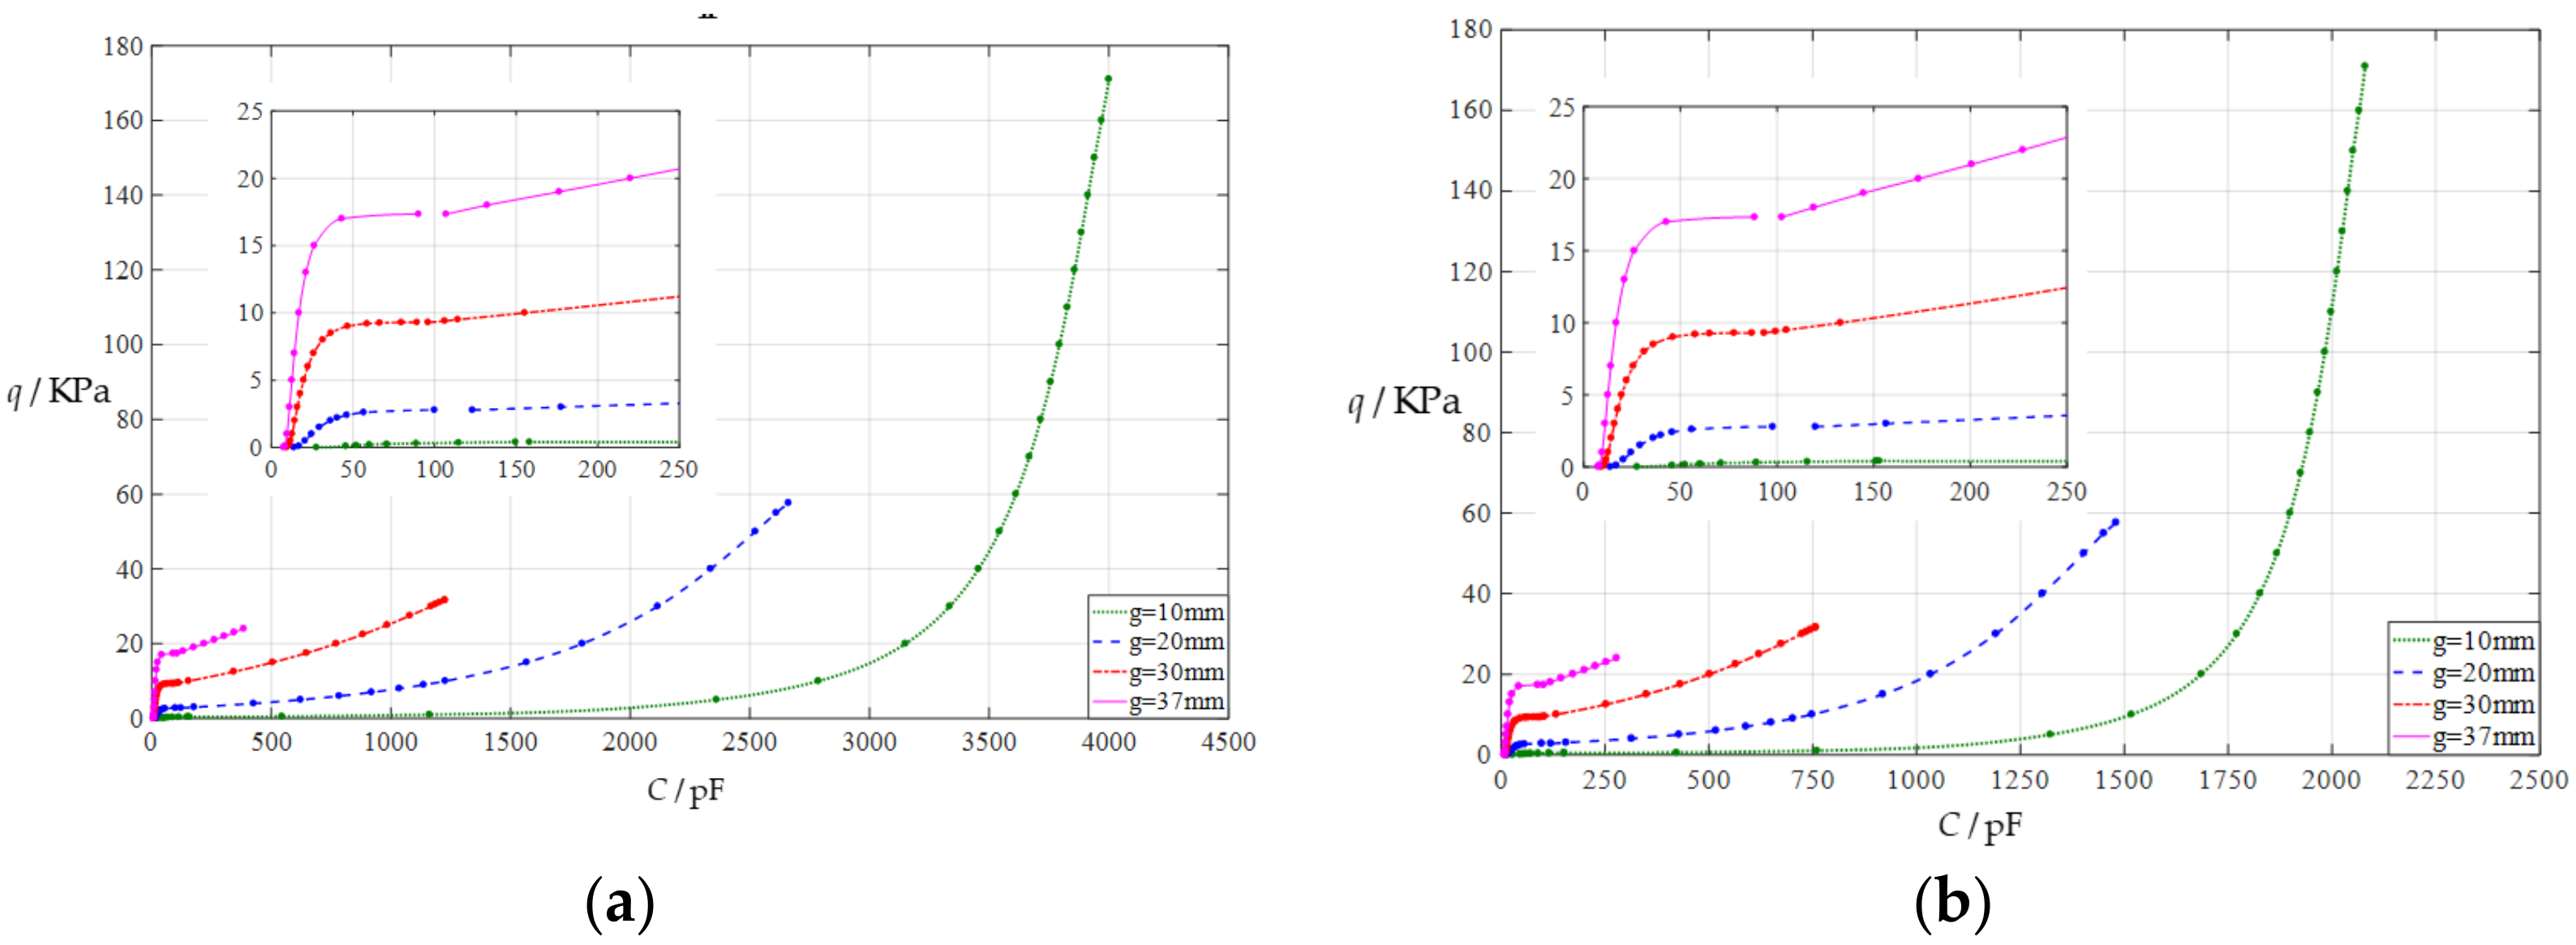
3.2.3. Effect of Thickness of Insulator Layer on Capacitance–Pressure Relationships
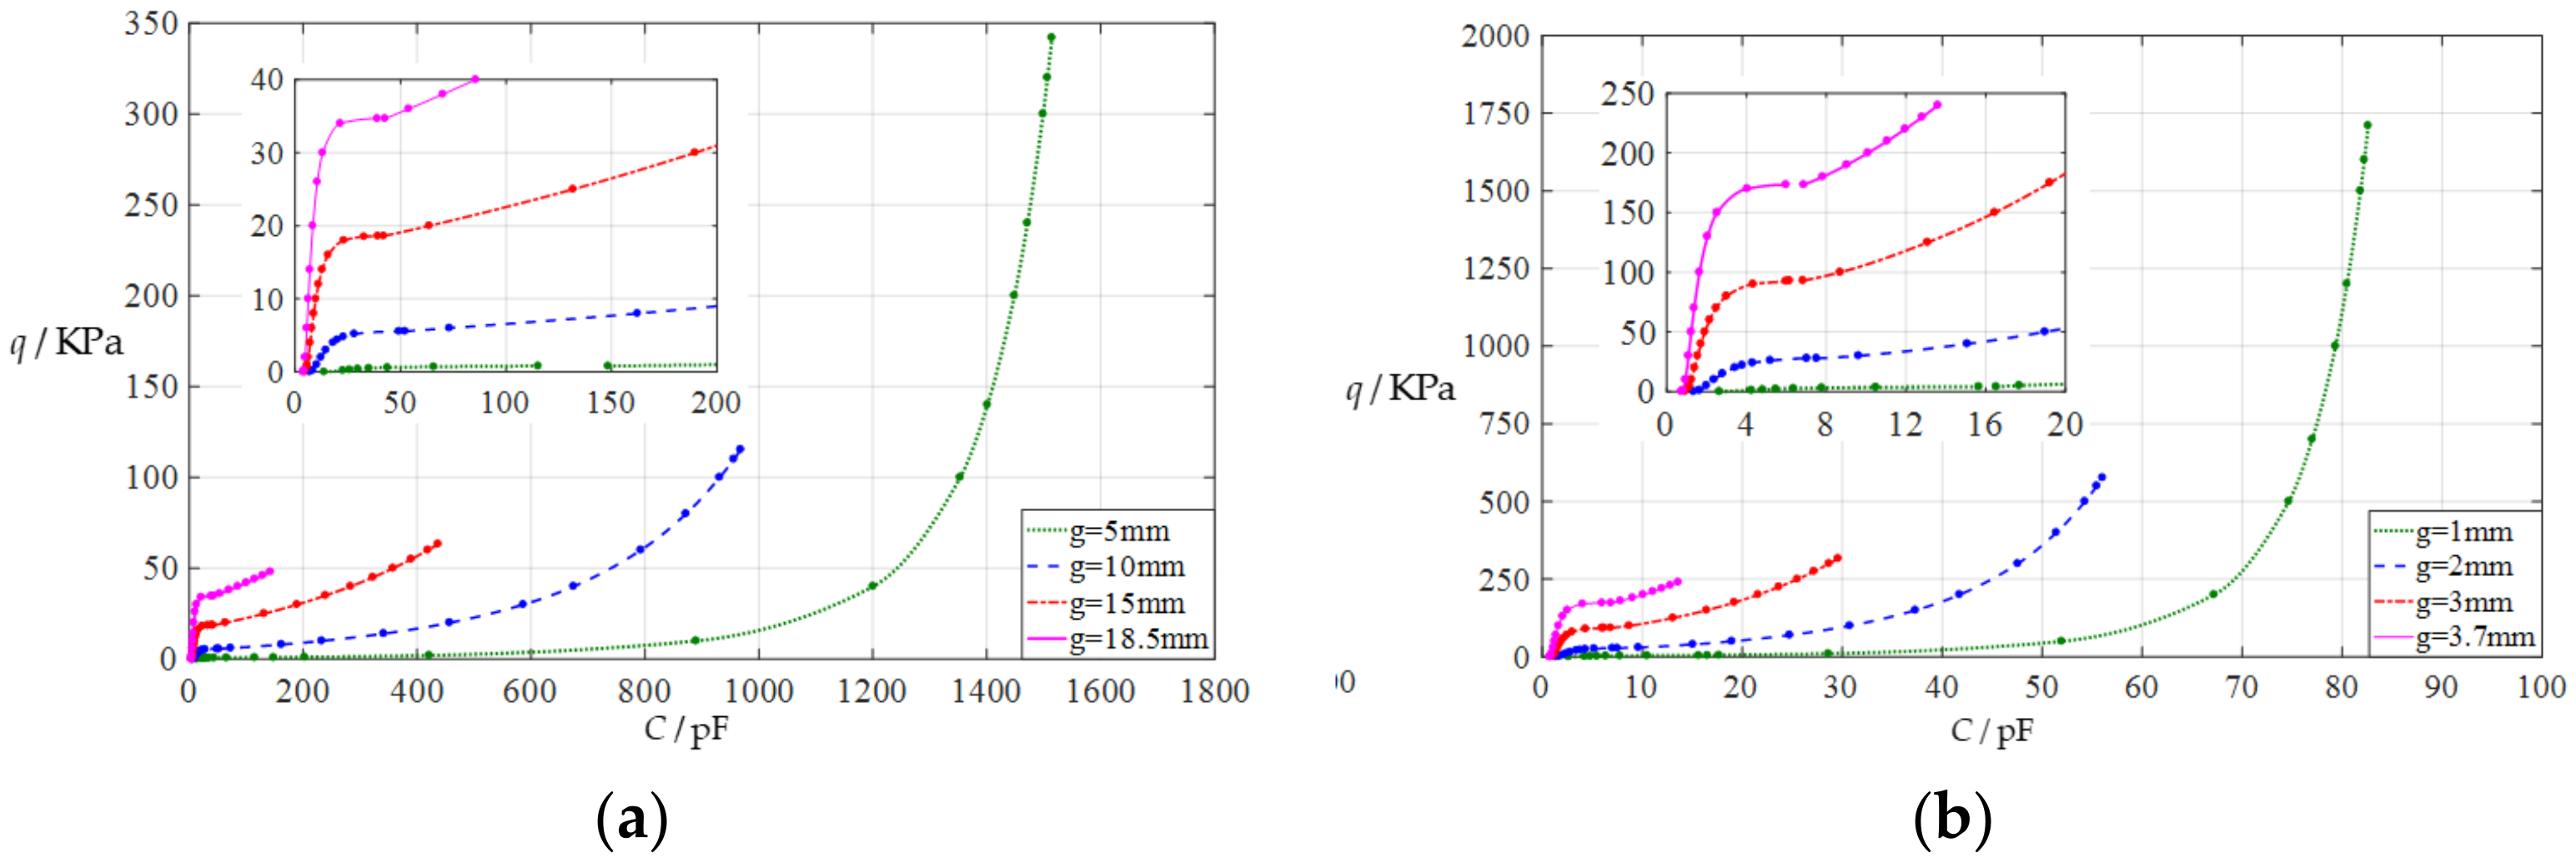
3.2.4. Effect of Membrane Radius on Capacitance-Pressure Relationships
4. Concluding Remarks
Supplementary Materials
Author Contributions
Funding
Institutional Review Board Statement
Informed Consent Statement
Data Availability Statement
Acknowledgments
Conflicts of Interest
References
- Plaut, R.H. Effect of pressure on pull-off of flat cylindrical punch adhered to circular membrane. J. Adhesion 2022, 98, 1438–1460. [Google Scholar] [CrossRef]
- Plaut, R.H. Effect of pressure on pull-off of flat 1-D rectangular punch adhered to membrane. J. Adhesion 2022, 98, 1480–1500. [Google Scholar] [CrossRef]
- Sun, J.Y.; Qian, S.H.; Li, Y.M.; He, X.T.; Zheng, Z.L. Theoretical study of adhesion energy measurement for film/substrate interface using pressurized blister test: Energy release rate. Measurement 2013, 46, 2278–2287. [Google Scholar] [CrossRef]
- Lian, Y.S.; Sun, J.Y.; Yang, Z.X. Closed-form solution of well-known Hencky problem without small-rotation-angle assumption. ZAMM Z. Angew. Math. Mech. 2016, 96, 1434–1441. [Google Scholar] [CrossRef]
- Lian, Y.S.; Sun, J.Y.; Dong, J.; Zheng, Z.L.; Yang, Z.X. Closed-form solution of axisymmetric deformation of prestressed Föppl-Hencky membrane under constrained deflecting. Stuct. Eng. Mech. 2019, 69, 693–698. [Google Scholar]
- Lian, Y.S.; Sun, J.Y.; Zhao, Z.H.; He, X.T.; Zheng, Z.L. A revisit of the boundary value problem for Föppl–Hencky membranes: Improvement of geometric equations. Mathematics 2020, 8, 631. [Google Scholar] [CrossRef]
- Bernardo, P.; Iulianelli, A.; Macedonio, F.; Drioli, E. Membrane technologies for space engineering. J. Membr. Sci. 2021, 626, 119177. [Google Scholar] [CrossRef]
- Suresh, K.; Katara, N. Design and development of circular ceramic membrane for wastewater treatment. Mater. Today Proc. 2021, 43, 2176–2181. [Google Scholar] [CrossRef]
- Tai, Y.; Zhou, K.; Chen, N. Dynamic Properties of Microresonators with the Bionic Structure of Tympanic Membrane. Sensors 2020, 20, 6958. [Google Scholar] [CrossRef]
- Lian, Y.S.; Sun, J.Y.; Ge, X.M.; Yang, Z.X.; He, X.T.; Zheng, Z.L. A theoretical study of an improved capacitive pressure sensor: Closed-form solution of uniformly loaded annular membranes. Measurement 2017, 111, 84–92. [Google Scholar] [CrossRef]
- Lian, Y.S.; Sun, J.Y.; Zhao, Z.H.; Li, S.Z.; Zheng, Z.L. A refined theory for characterizing adhesion of elastic coatings on rigid substrates based on pressurized blister test methods: Closed-form solution and energy release rate. Polymers 2020, 12, 1788. [Google Scholar] [CrossRef] [PubMed]
- Li, X.; Sun, J.Y.; Shi, B.B.; Zhao, Z.H.; He, X.T. A theoretical study on an elastic polymer thin film-based capacitive wind-pressure sensor. Polymers 2020, 12, 2133. [Google Scholar] [CrossRef] [PubMed]
- Jindal, S.K.; Varma, M.A.; Thukral, D. Comprehensive assessment of MEMS double touch mode capacitive pressure sensor on utilization of SiC film as primary sensing element: Mathematical modelling and numerical simulation. Microelectron. J. 2018, 73, 30–36. [Google Scholar] [CrossRef]
- Lee, H.Y.; Choi, B. Theoretical and experimental investigation of the trapped air effect on air-sealed capacitive pressure sensor. Sens. Actuator A-Phys. 2015, 221, 104–114. [Google Scholar] [CrossRef]
- Shu, J.F.; Yang, R.R.; Chang, Y.Q.; Guo, X.Q.; Yang, X. A flexible metal thin film strain sensor with micro/nano structure for large deformation and high sensitivity strain measurement. J. Alloys Compd. 2021, 879, 160466. [Google Scholar] [CrossRef]
- Zhang, D.Z.; Jiang, C.X.; Tong, J.; Zong, X.Q.; Hu, W. Flexible Strain Sensor Based on Layer-by-Layer Self-Assembled Graphene/Polymer Nanocomposite Membrane and Its Sensing Properties. J. Electron. Mater. 2018, 47, 2263–2270. [Google Scholar] [CrossRef]
- Han, X.D.; Li, G.; Xu, M.H.; Ke, X.; Chen, H.Y.; Feng, Y.J.; Yan, H.P.; Li, D.T. Differential MEMS capacitance diaphragm vacuum gauge with high sensitivity and wide range. Vacuum 2021, 191, 110367. [Google Scholar] [CrossRef]
- Li, S.; Li, R.; Chen, T.; Xiao, X. Highly Sensitive and Flexible Capacitive Pressure Sensor Enhanced by Weaving of Pyramidal Concavities Staggered in Honeycomb Matrix. IEEE Sens. J. 2020, 20, 14436–14443. [Google Scholar] [CrossRef]
- Zhao, S.F.; Ran, W.H.; Wang, D.; Yin, R.Y.; Yan, Y.X.; Jiang, K.; Lou, Z.; Shen, G.Z. 3D dielectric layer enabled highly sensitive capacitive pressure sensors for wearable electronics. ACS Appl. Mater. Interfaces 2020, 12, 32023–32030. [Google Scholar] [CrossRef]
- Chhetry, A.; Yoon, H.; Park, J.Y. A flexible and highly sensitive capacitive pressure sensor based on conductive fibers with a microporous dielectric for wearable electronics. J. Mater. Chem. C 2017, 5, 10068–10076. [Google Scholar] [CrossRef]
- Chau, K.H.L.; Fung, C.D.; Harris, P.R.; Dahrooge, G.A. A versatile polysilicon diaphragm pressure sensor chip. In Proceedings of the International Electron Devices Meeting 1991 [Technical Digest], Washington, DC, USA, 8–11 December 1991; pp. 761–764. [Google Scholar]
- Marsi, N.; Majlis, B.Y.; Hamzah, A.A.; Mohd-Yasin, F. Development of high temperature resistant of 500 °C employing silicon carbide (3C-SiC) based MEMS pressure sensor. Microsyst. Technol. 2015, 21, 319–330. [Google Scholar] [CrossRef]
- Tang, W.; Zheng, B.X.; Liu, L.; Chen, Z.; Zhang, H.X. Complementary metal-oxide semiconductor-compatible silicon carbide pressure sensors based on bulk micromachining. Micro Nano Lett. 2011, 6, 265–268. [Google Scholar] [CrossRef]
- Fonseca, M.; Allen, G.; Kroh, J.; White, J. Flexible wireless passive pressure sensors for biomedical applications. In Proceedings of the 2006 Solid-State, Actuators, and Microsystems Workshop, Hilton Head Island, SC, USA, 4–8 June 2006; pp. 37–42. [Google Scholar]
- Berger, C.N.; Dirschka, M.; Vijayaraghavan, A. Ultra-thin graphene-polymer heterostructure membranes. Nanoscale 2016, 8, 17928–17939. [Google Scholar] [CrossRef]
- Lee, G.H.; Cooper, R.C.; An, S.J.; Lee, S.; van der Zande, A.; Petrone, N.; Hammerherg, A.G.; Lee, C.; Crawford, B.; Oliver, W.; et al. High-strength chemical-vapor-deposited graphene and grain boundaries. Science 2013, 340, 1073–1076. [Google Scholar] [CrossRef]
- Akinwande, D.; Brennan, C.J.; Bunch, J.S.; Egberts, P.; Felts, J.R.; Gao, H.J.; Huang, R.; Kim, J.S.; Li, T.; Li, Y.; et al. A review on mechanics and mechanical properties of 2D materials—Graphene and beyond. Extreme Mech. Lett. 2017, 13, 42–77. [Google Scholar] [CrossRef]
- Berger, C.; Phillips, R.; Pasternak, I.; Sobieski, J.; Strupinski, W.; Vijayaraghavan, A. Touch-mode capacitive pressure sensor with graphene-polymer heterostructure membrane. 2D Mater. 2018, 5, 015025. [Google Scholar] [CrossRef]
- Xiong, J.J.; Li, Y.; Hong, Y.P.; Zhang, B.Z.; Cui, T.H.; Tan, Q.L.; Zheng, S.J.; Liang, T. Wireless LTCC-based capacitive pressure sensor for harsh environment. Sens. Actuator A-Phys. 2013, 197, 30–37. [Google Scholar] [CrossRef]
- Puers, R. Capacitive sensors: When and how to use them. Sens. Actuator A-Phys. 1993, 37–38, 93–105. [Google Scholar] [CrossRef]
- Rosengren, L.; Siiderkvist, J.; Smith, L. Micromachined sensor structures with linear capacitive response. Sens. Actuator A-Phys. 1992, 31, 200–205. [Google Scholar] [CrossRef]
- Sandmaier, H. Non-linear analytical modelling of bossed diaphragms for pressure sensors. Sens. Actuator A-Phys. 1991, 25–27, 815–819. [Google Scholar] [CrossRef]
- Jerman, J.H. The fabrication and use of micromachined corrugated silicon diaphragms. Sens. Actuator A-Phys. 1990, 23, 988–992. [Google Scholar] [CrossRef]
- Prudenziati, M. Thick-film technology. Sens. Actuator A-Phys. 1991, 25, 227–234. [Google Scholar] [CrossRef]
- Crescini, D.; Ferrari, V.; Marioli, D.; Taroni, A. A thick-film capacitive pressure sensor with improved linearity due to electrode-shaping and frequency conversion. Meas. Sci. Technol. 1997, 8, 71–77. [Google Scholar] [CrossRef]
- Ko, W.H.; Wang, Q. Touch mode capacitive pressure sensors. Sens. Actuator A-Phys. 1999, 75, 242–251. [Google Scholar] [CrossRef]
- Wang, Q.; Ko, W.H. Modeling of touch mode capacitive sensors and diaphragms. Sens. Actuator A-Phys. 1999, 75, 230–241. [Google Scholar] [CrossRef]
- Jindal, S.K.; Varma, M.A.; Thukral, D. Study of MEMS touch-mode capacitive pressure sensor utilizing flexible sic circular diaphragm: Robust design, theoretical modeling, numerical simulation and performance comparison. J. Circuits Syst. Comput. 2019, 28, 1950206. [Google Scholar] [CrossRef]
- Daigle, M.; Corcos, J.; Wu, K. An analytical solution to circular touch mode capacitor. IEEE Sens. J. 2007, 7, 502–505. [Google Scholar] [CrossRef]
- Omi, T.; Horibata, K.; Sato, F.; Takeuchi, M. Capacitive pressure sensor with center clamped diaphragm. IEICE Trans. Electron. 1997, E80C, 263–268. [Google Scholar]
- Kumar, G.A.A.U.; Jindal, S.K.; Sreekanth, P.K. Capacitance response of concave well substrate MEMS double touch mode capacitive pressure sensor: Robust design, theoretical modeling, numerical simulation and performance comparison. Silicon 2022, 1–9. [Google Scholar] [CrossRef]
- Kang, M.C.; Chan, R.; Choe, J.H. Capacitance response of concave well substrate touch-mode capacitive pressure sensor: Mathematical analysis and simulation. Microelectron. J. 2021, 114, 105118. [Google Scholar] [CrossRef]
- Mishra, R.B.; El-Atab, N.; Hussain, A.M.; Hussain, M.M. Recent progress on flexible capacitive pressure sensors: From design and materials to applications. Adv. Mater. Technol. 2021, 6, 2001023. [Google Scholar] [CrossRef]
- Mishra, R.B.; Babatain, W.; El-Atab, N.; Hussain, M.M. Polymer/paper-based double touch mode capacitive pressure sensing element for wireless control of robotic arm. In Proceedings of the 2020 IEEE 15th International Conference on Nano/Micro Engineered and Molecular System (NEMS), San Diego, CA, USA, 27–30 September 2020. [Google Scholar]
- Li, K. Investigation of ring touch mode capacitive pressure sensor with an electrothermomechanical coupling contact model. IEEE Sens. J. 2019, 19, 9641–9652. [Google Scholar] [CrossRef]
- Varma, M.A.; Jindal, S.K. Novel design for performance enhancement of a touch-mode capacitive pressure sensor: Theoretical modeling and numerical simulation. J. Comput. Electron. 2018, 17, 1324–1333. [Google Scholar] [CrossRef]
- Li, F.Y.; Zhang, Q.; Li, X.; He, X.T.; Sun, J.Y. Polymer conductive membrane-based non-touch mode circular capacitive pressure sensors: An analytical solution-based method for design and numerical calibration. Polymers 2022, 14, 3087. [Google Scholar] [CrossRef]


Publisher’s Note: MDPI stays neutral with regard to jurisdictional claims in published maps and institutional affiliations. |
© 2022 by the authors. Licensee MDPI, Basel, Switzerland. This article is an open access article distributed under the terms and conditions of the Creative Commons Attribution (CC BY) license (https://creativecommons.org/licenses/by/4.0/).
Share and Cite
Zhang, Q.; Li, F.-Y.; Li, X.; He, X.-T.; Sun, J.-Y. Polymer Conductive Membrane-Based Circular Capacitive Pressure Sensors from Non-Touch Mode of Operation to Touch Mode of Operation: An Analytical Solution-Based Method for Design and Numerical Calibration. Polymers 2022, 14, 3850. https://doi.org/10.3390/polym14183850
Zhang Q, Li F-Y, Li X, He X-T, Sun J-Y. Polymer Conductive Membrane-Based Circular Capacitive Pressure Sensors from Non-Touch Mode of Operation to Touch Mode of Operation: An Analytical Solution-Based Method for Design and Numerical Calibration. Polymers. 2022; 14(18):3850. https://doi.org/10.3390/polym14183850
Chicago/Turabian StyleZhang, Qi, Fei-Yan Li, Xue Li, Xiao-Ting He, and Jun-Yi Sun. 2022. "Polymer Conductive Membrane-Based Circular Capacitive Pressure Sensors from Non-Touch Mode of Operation to Touch Mode of Operation: An Analytical Solution-Based Method for Design and Numerical Calibration" Polymers 14, no. 18: 3850. https://doi.org/10.3390/polym14183850