
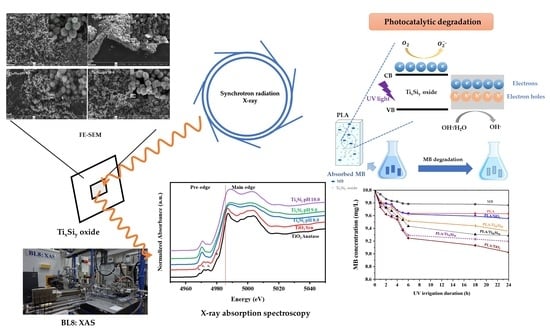
Structural Characterization of Titanium–Silica Oxide Using Synchrotron Radiation X-ray Absorption Spectroscopy

 ,
, 
Abstract
:
1. Introduction
2. Materials and Methods
2.1. Materials
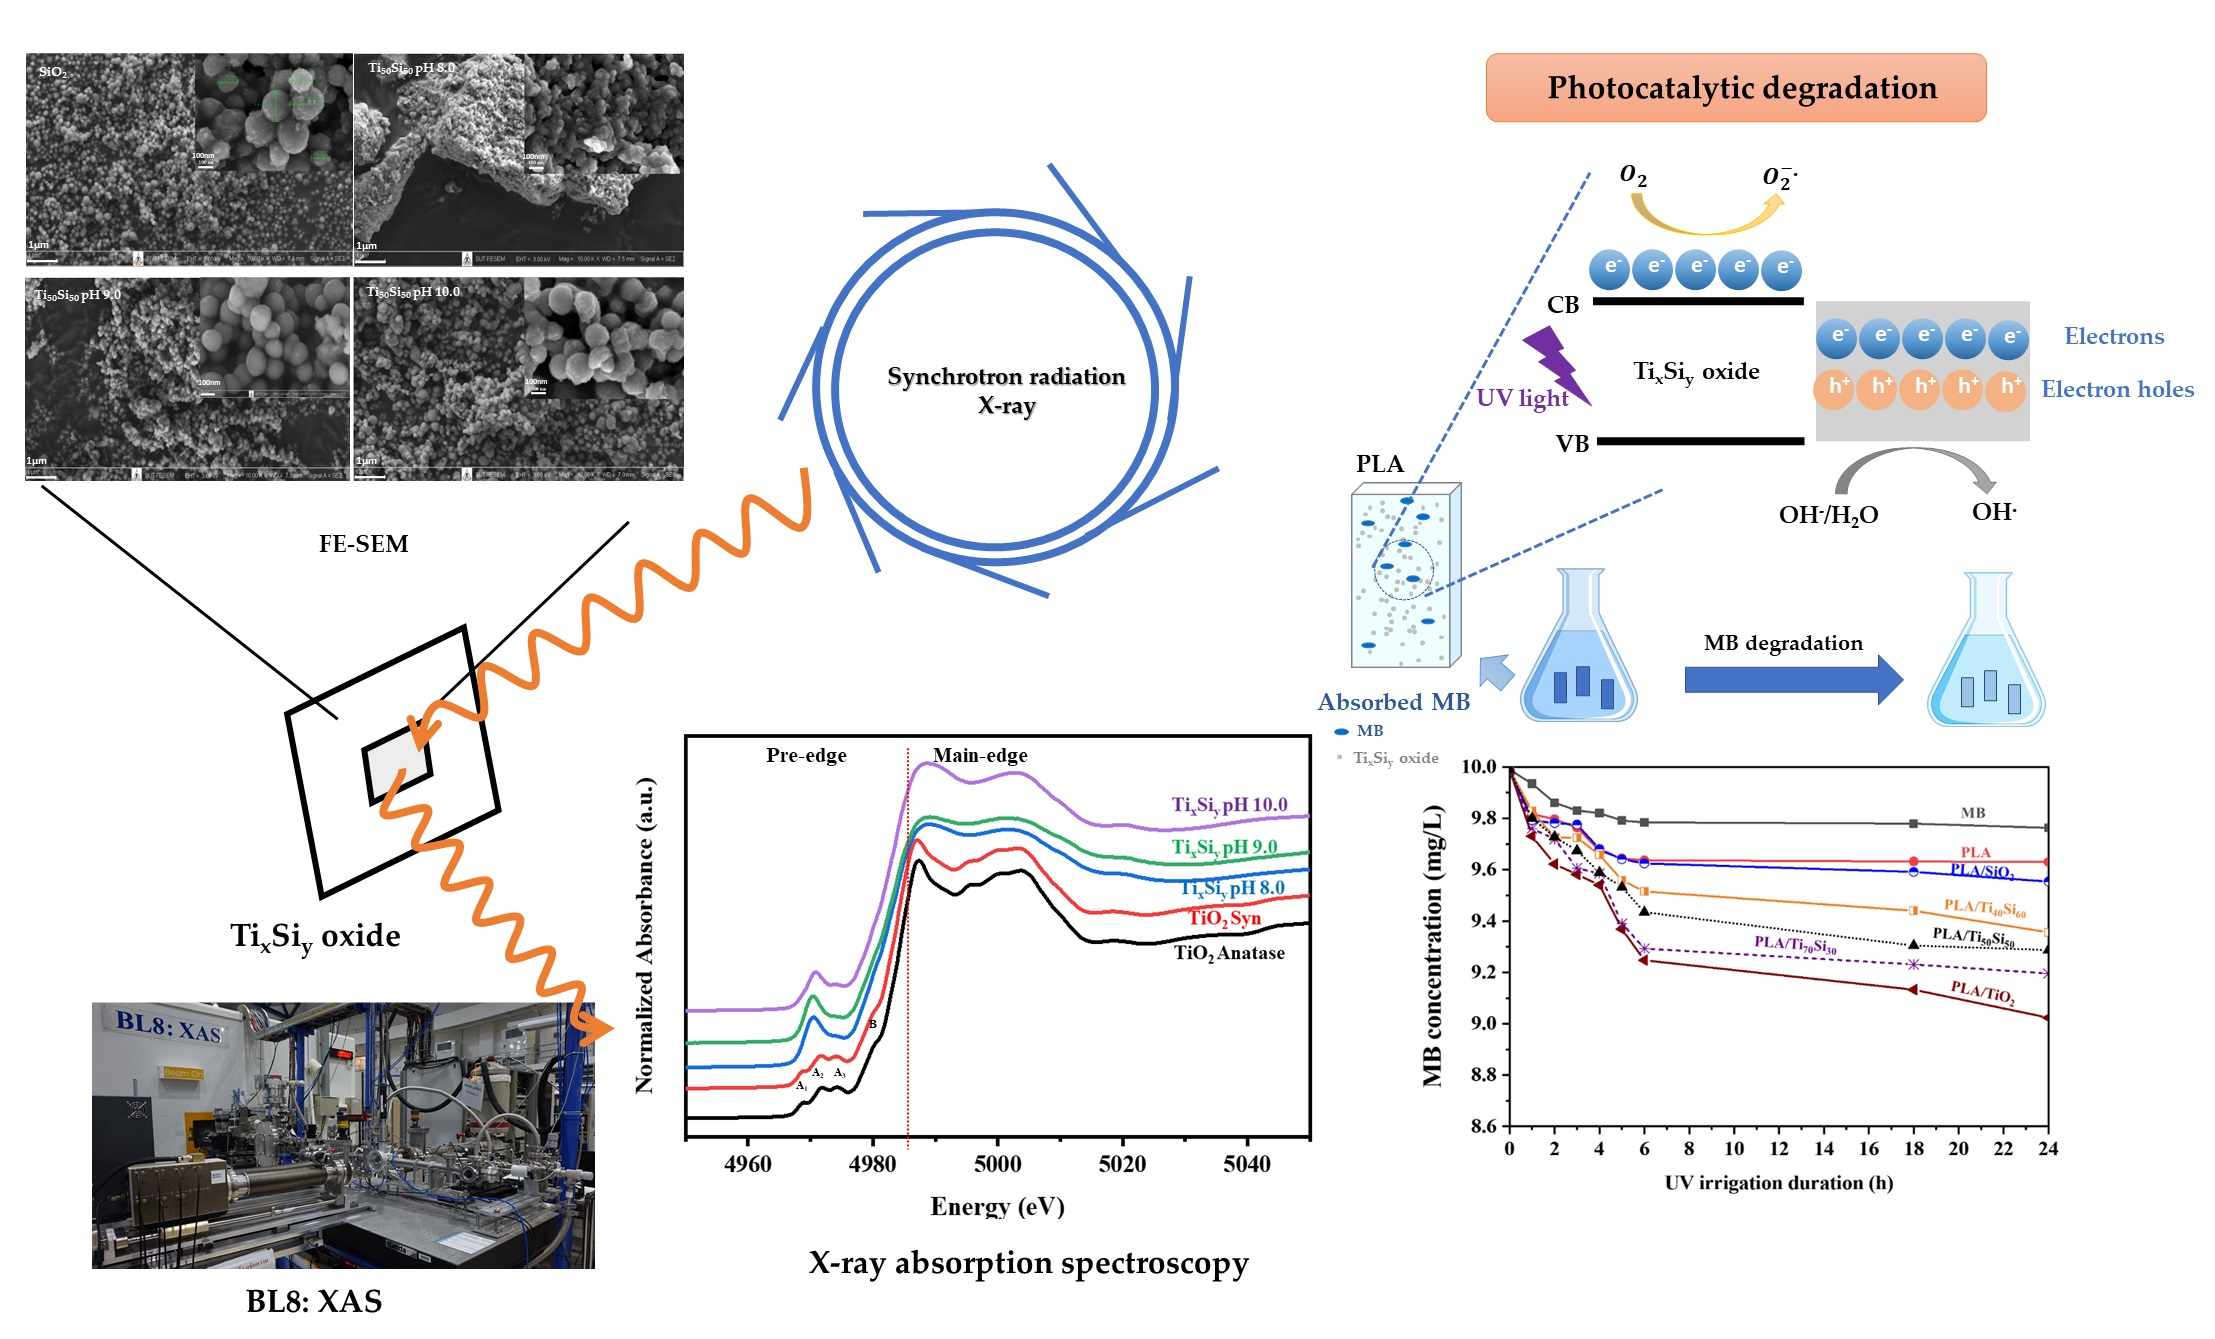
2.2. Synthesis of Titania–Silica Binary Oxide (TixSiy Oxide), Silica, and Titanium Dioxide
2.3. Characterization of Titanium–Silicon Oxide
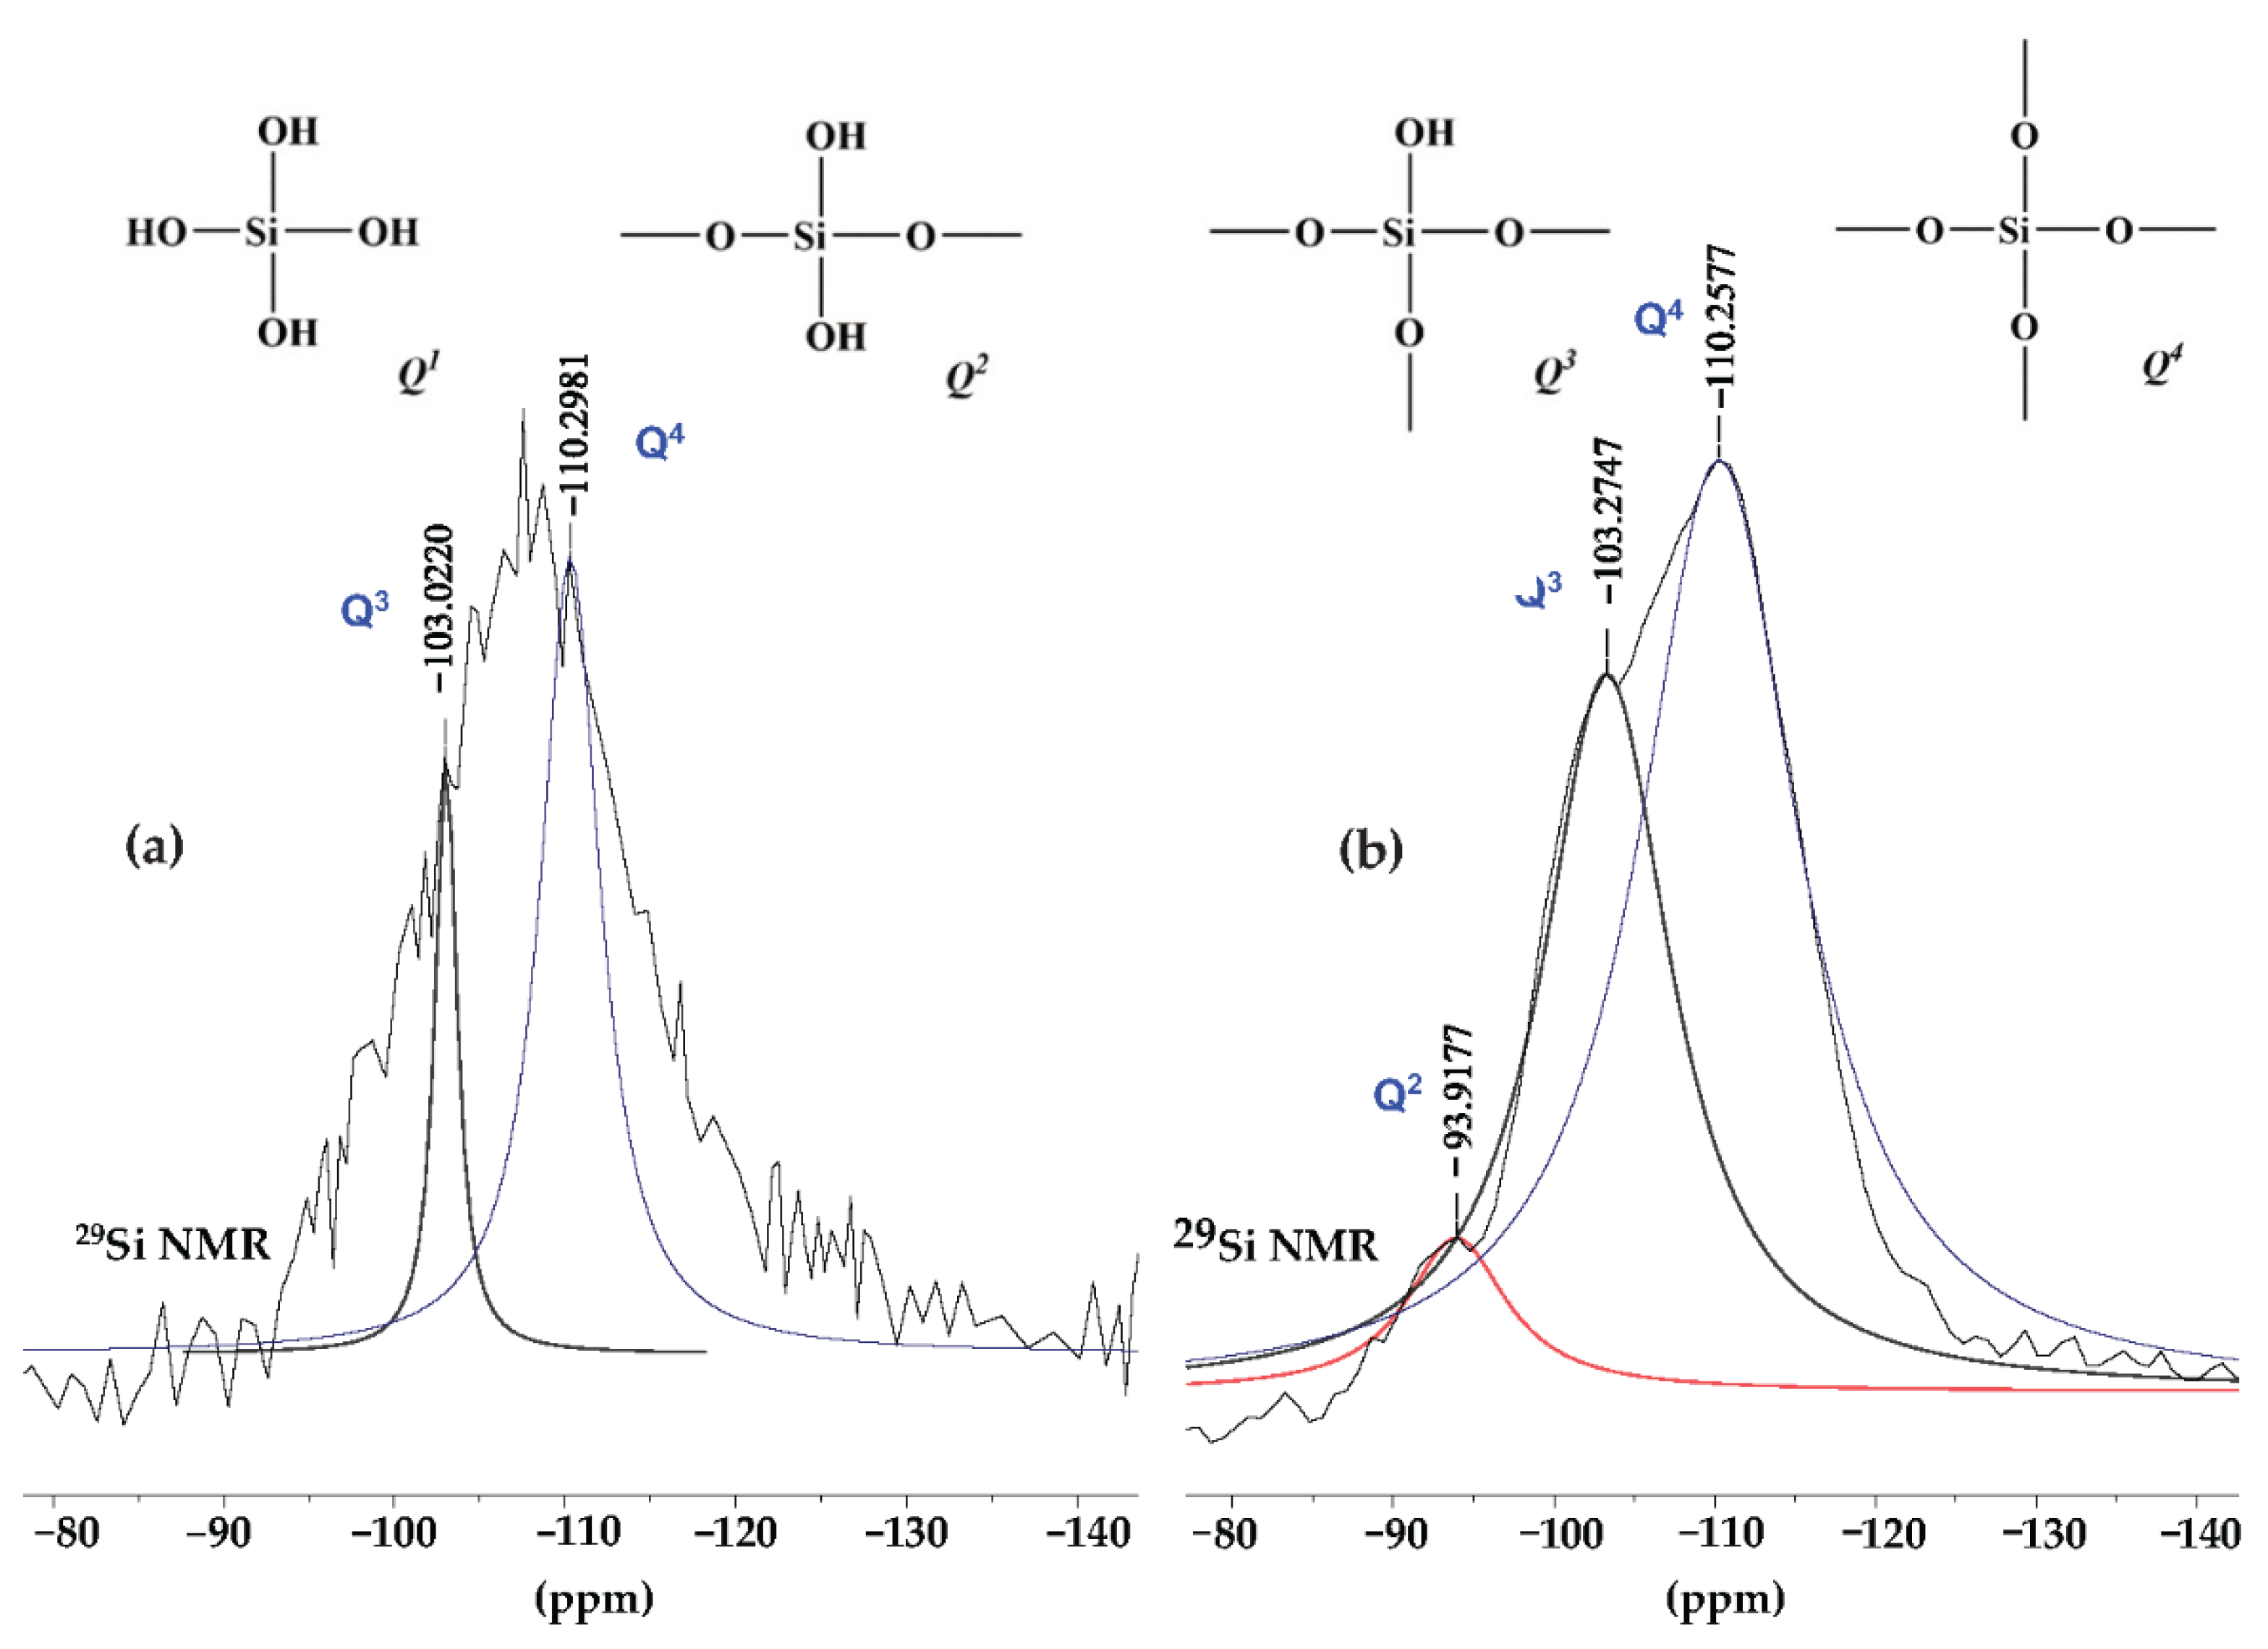
2.3.1. 29Si Solid-State Nuclear Magnetic Resonance Spectroscopy (29Si Solid-State NMR)
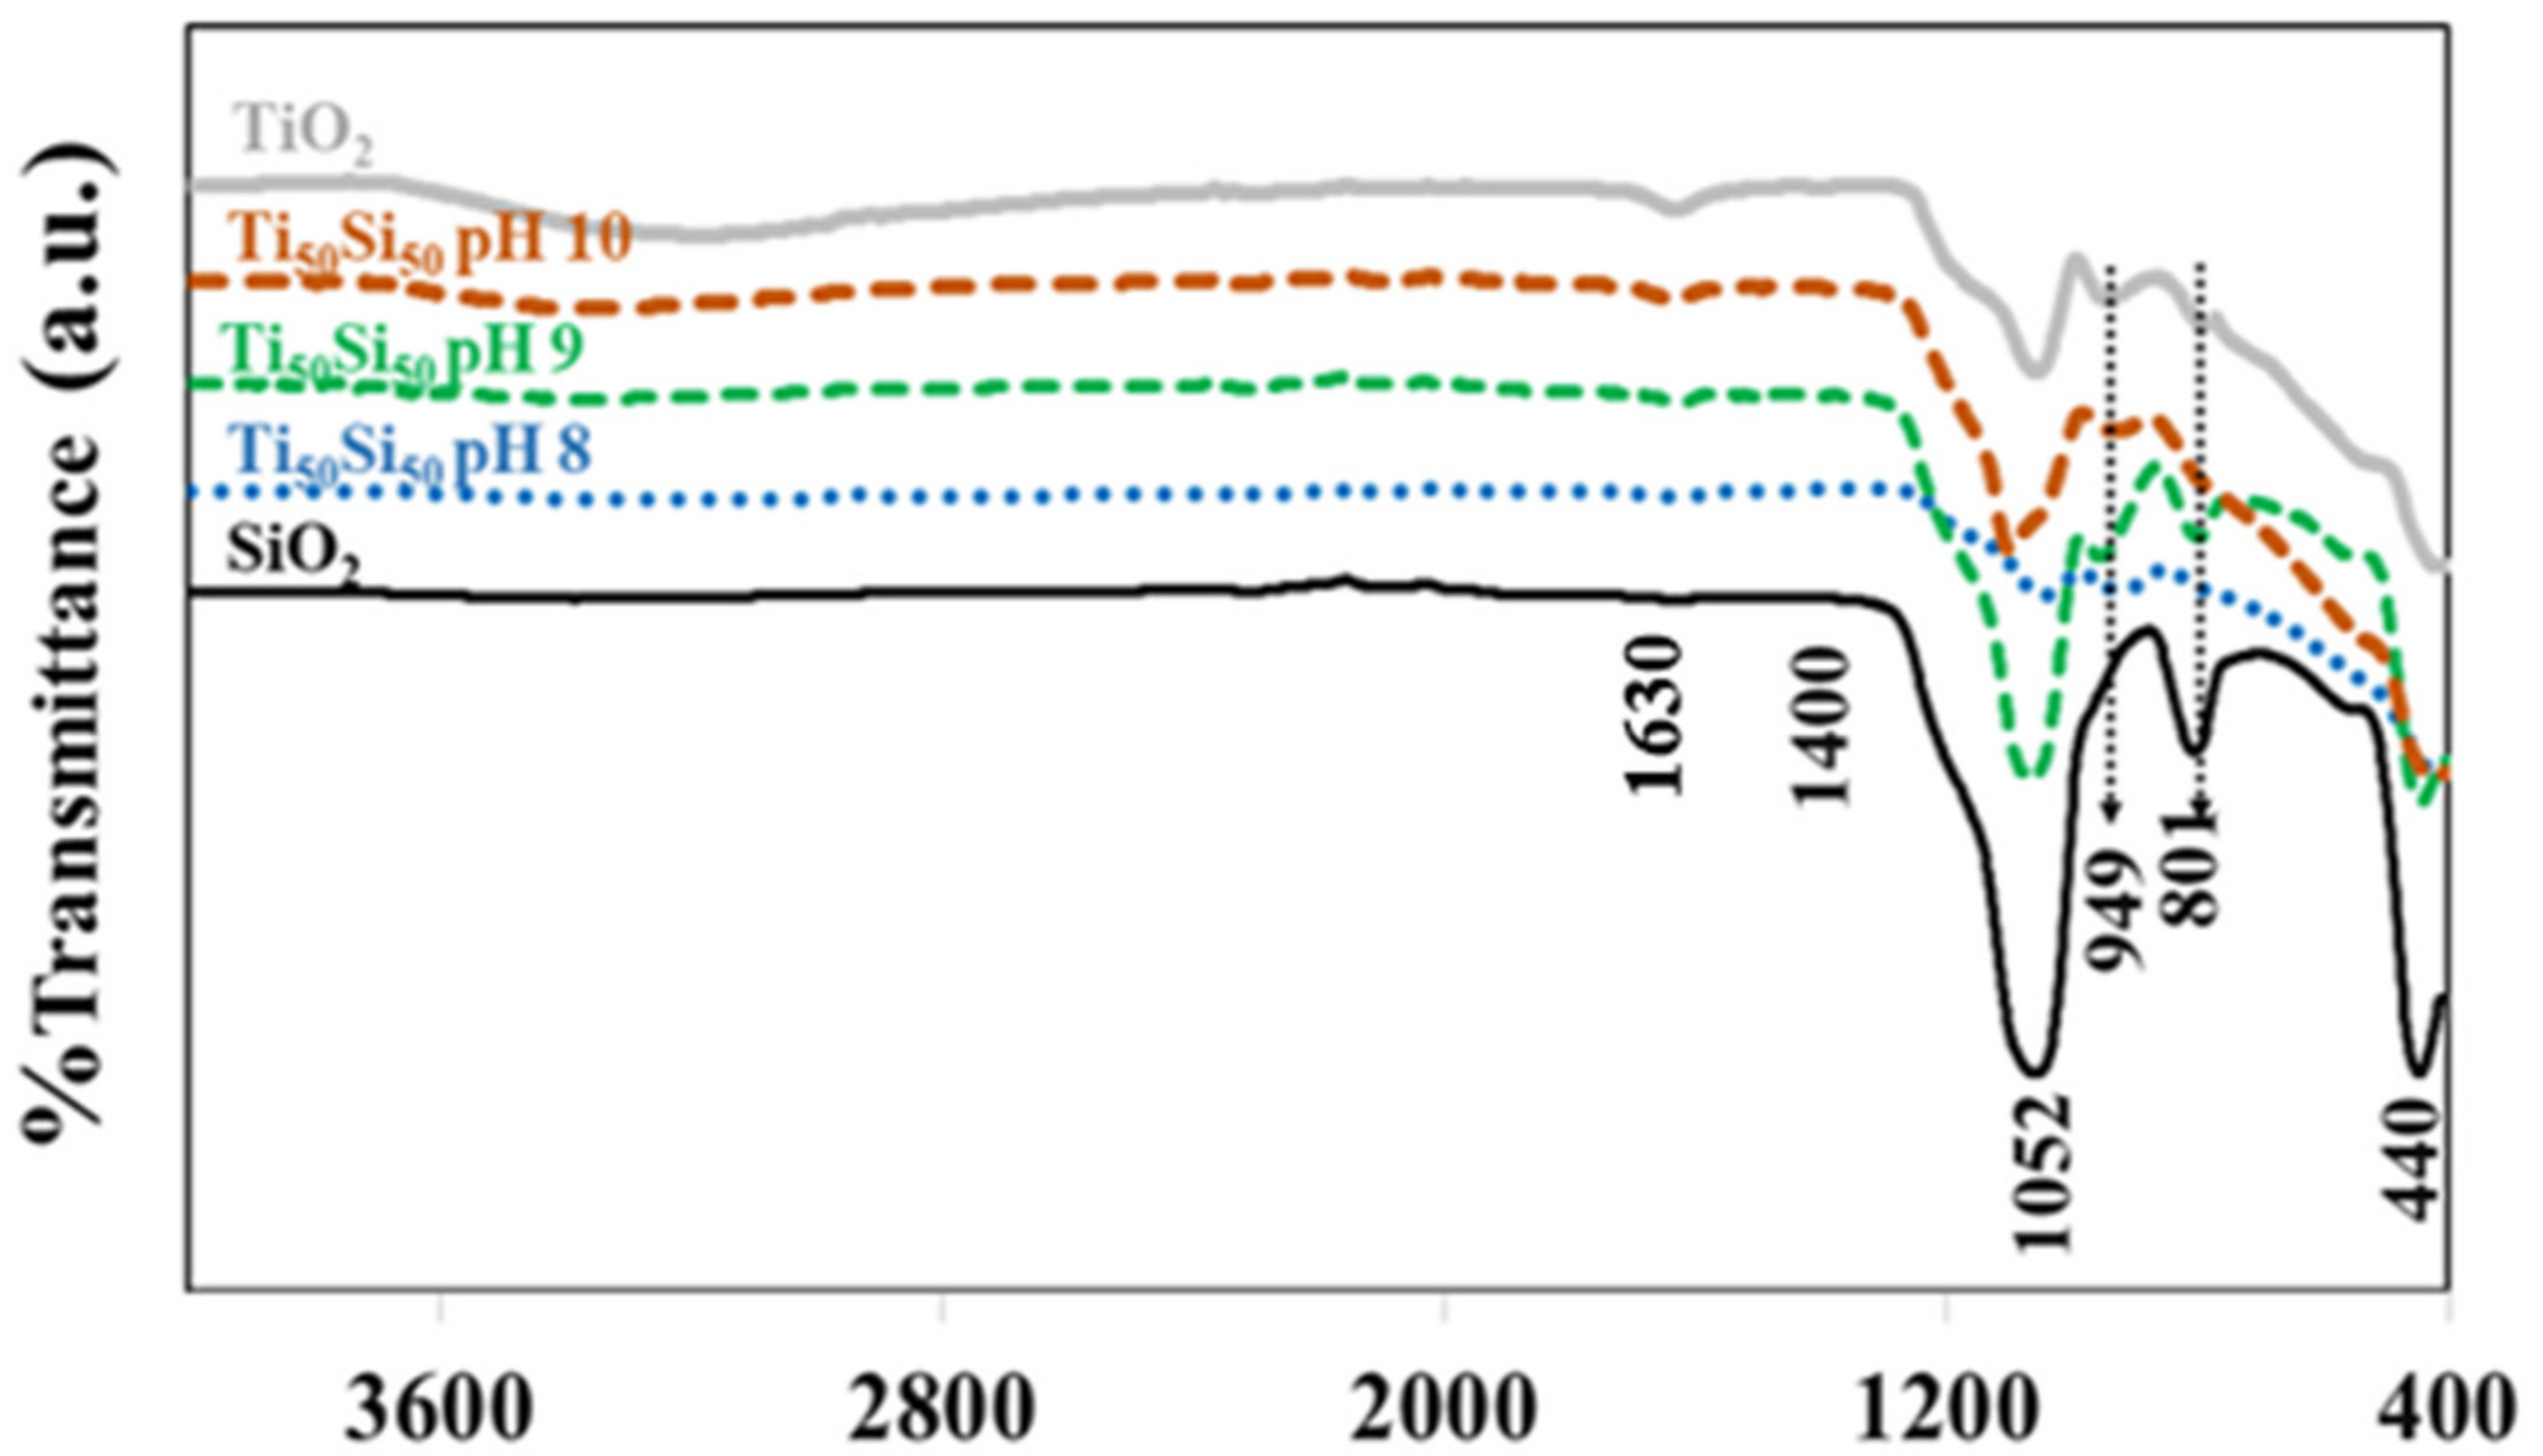
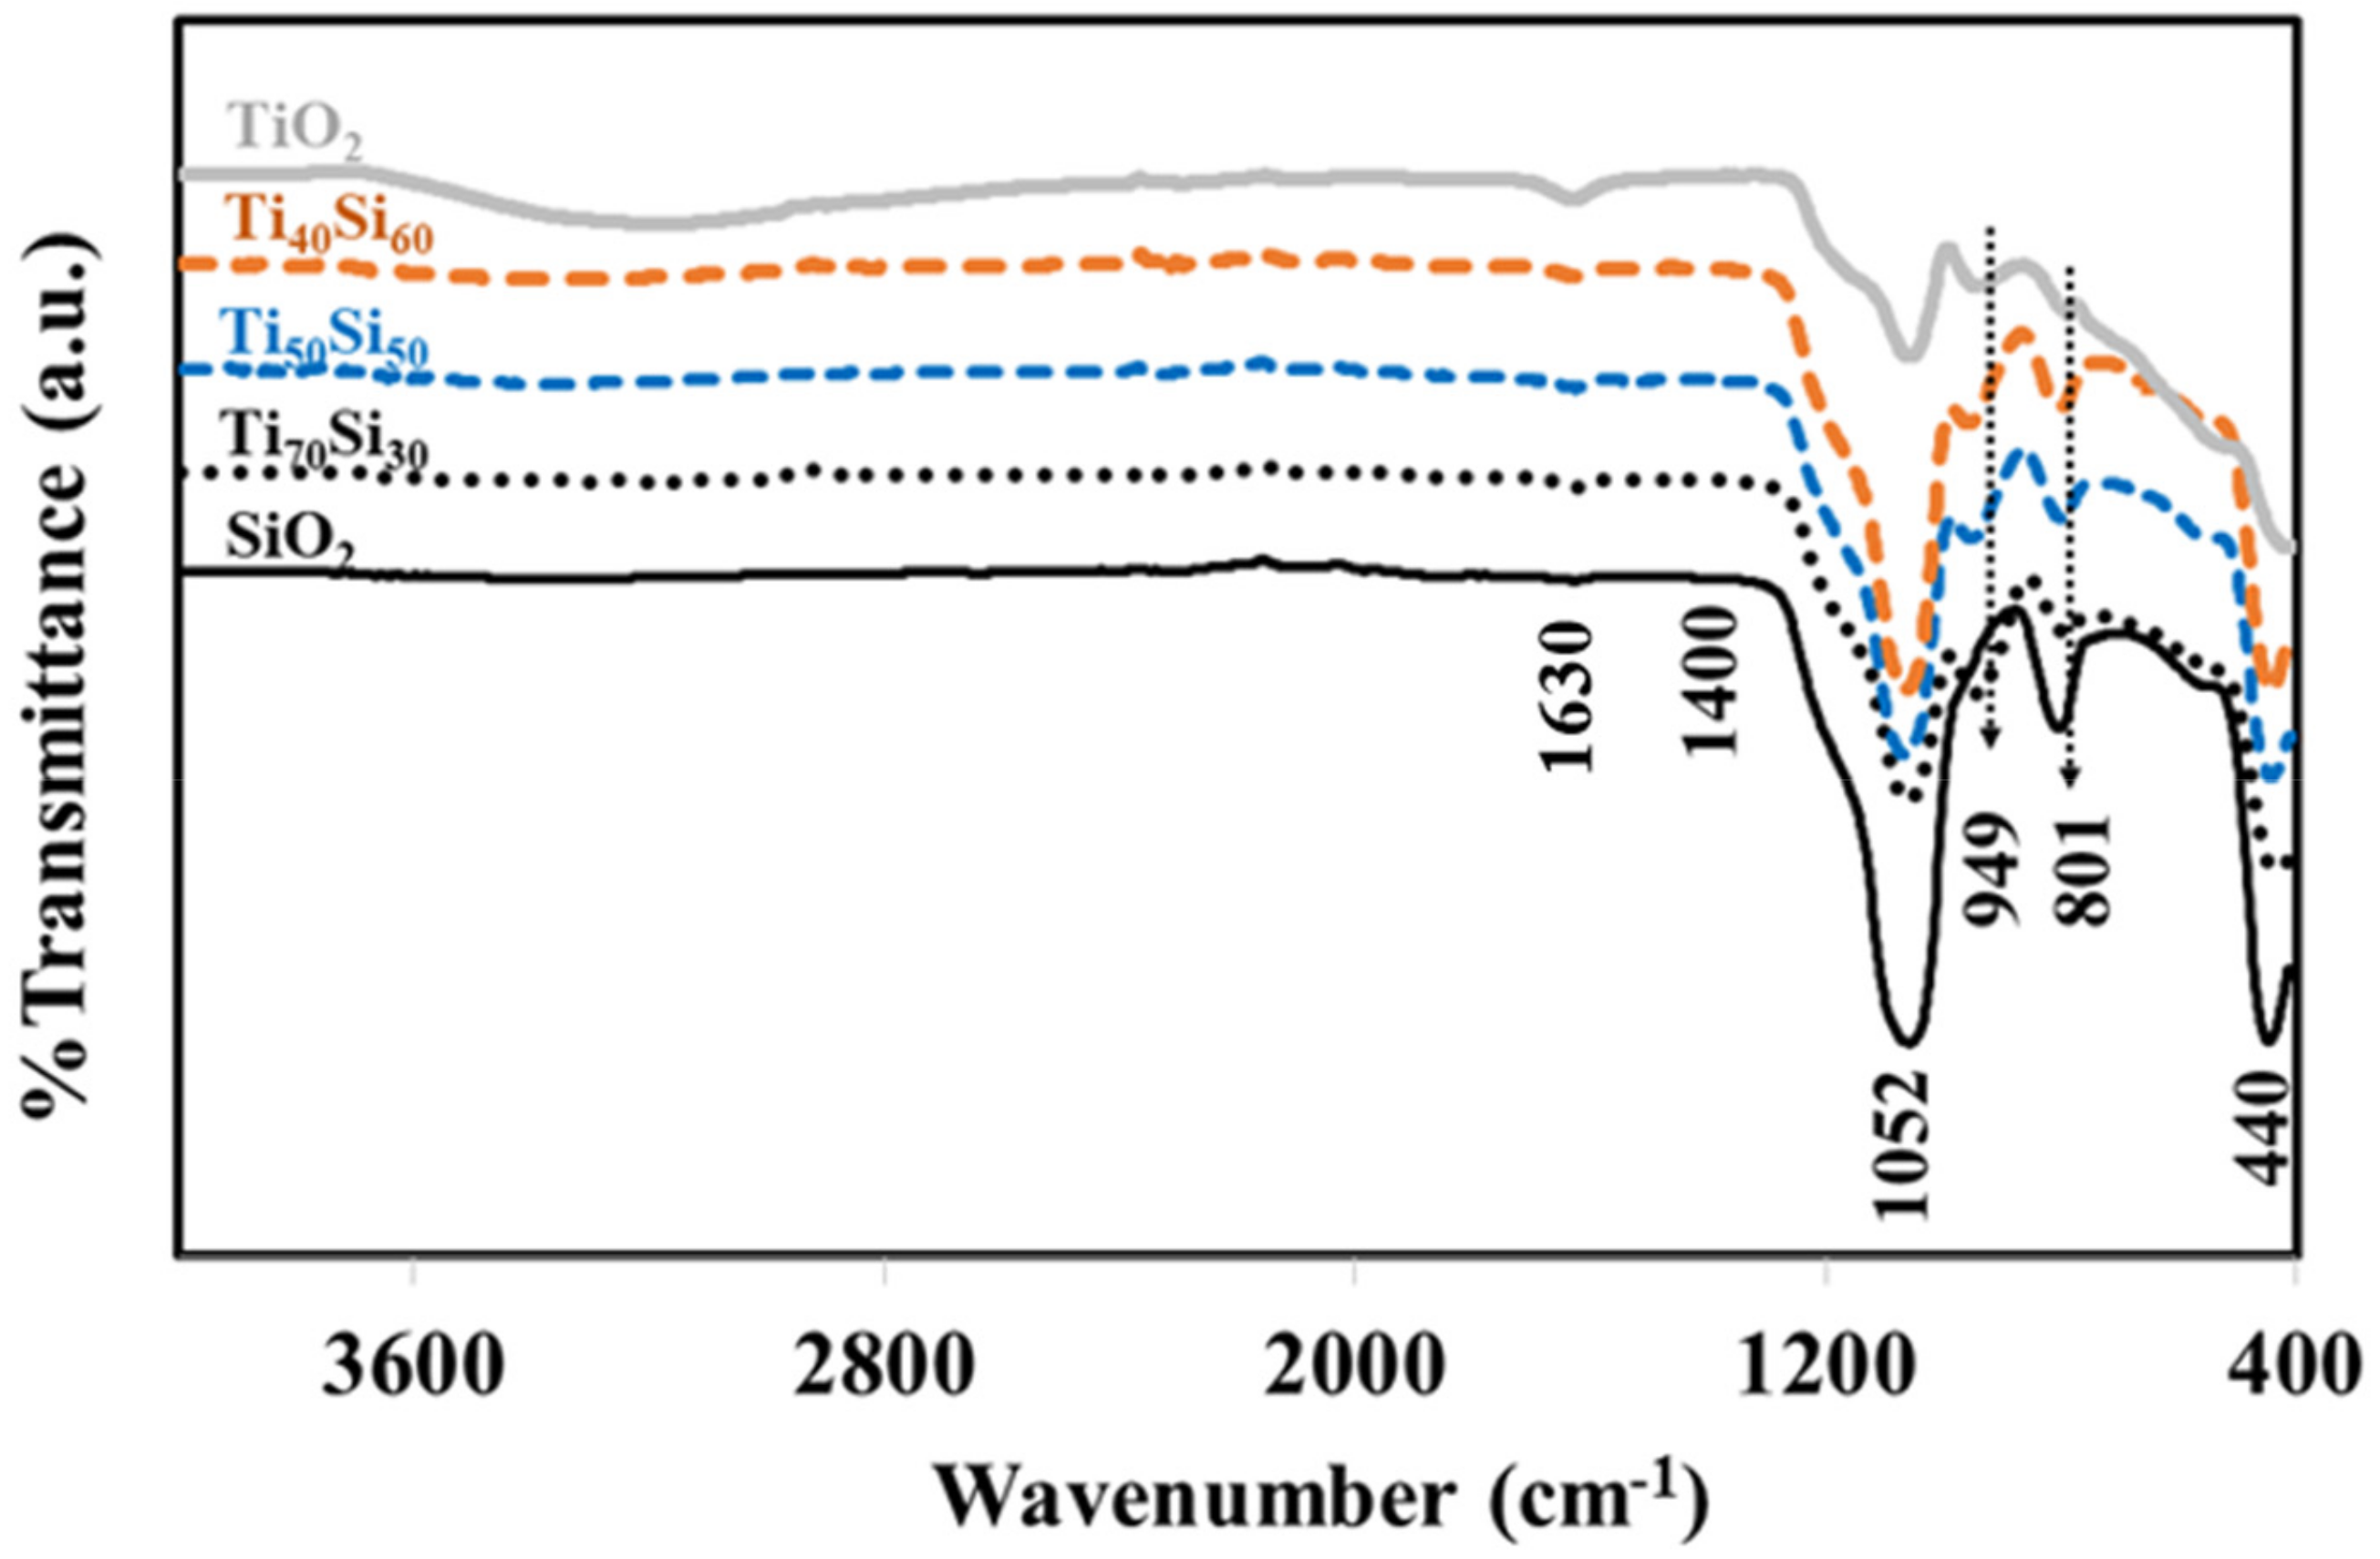
2.3.2. Fourier Transform Infrared Spectroscopy (FT-IR)
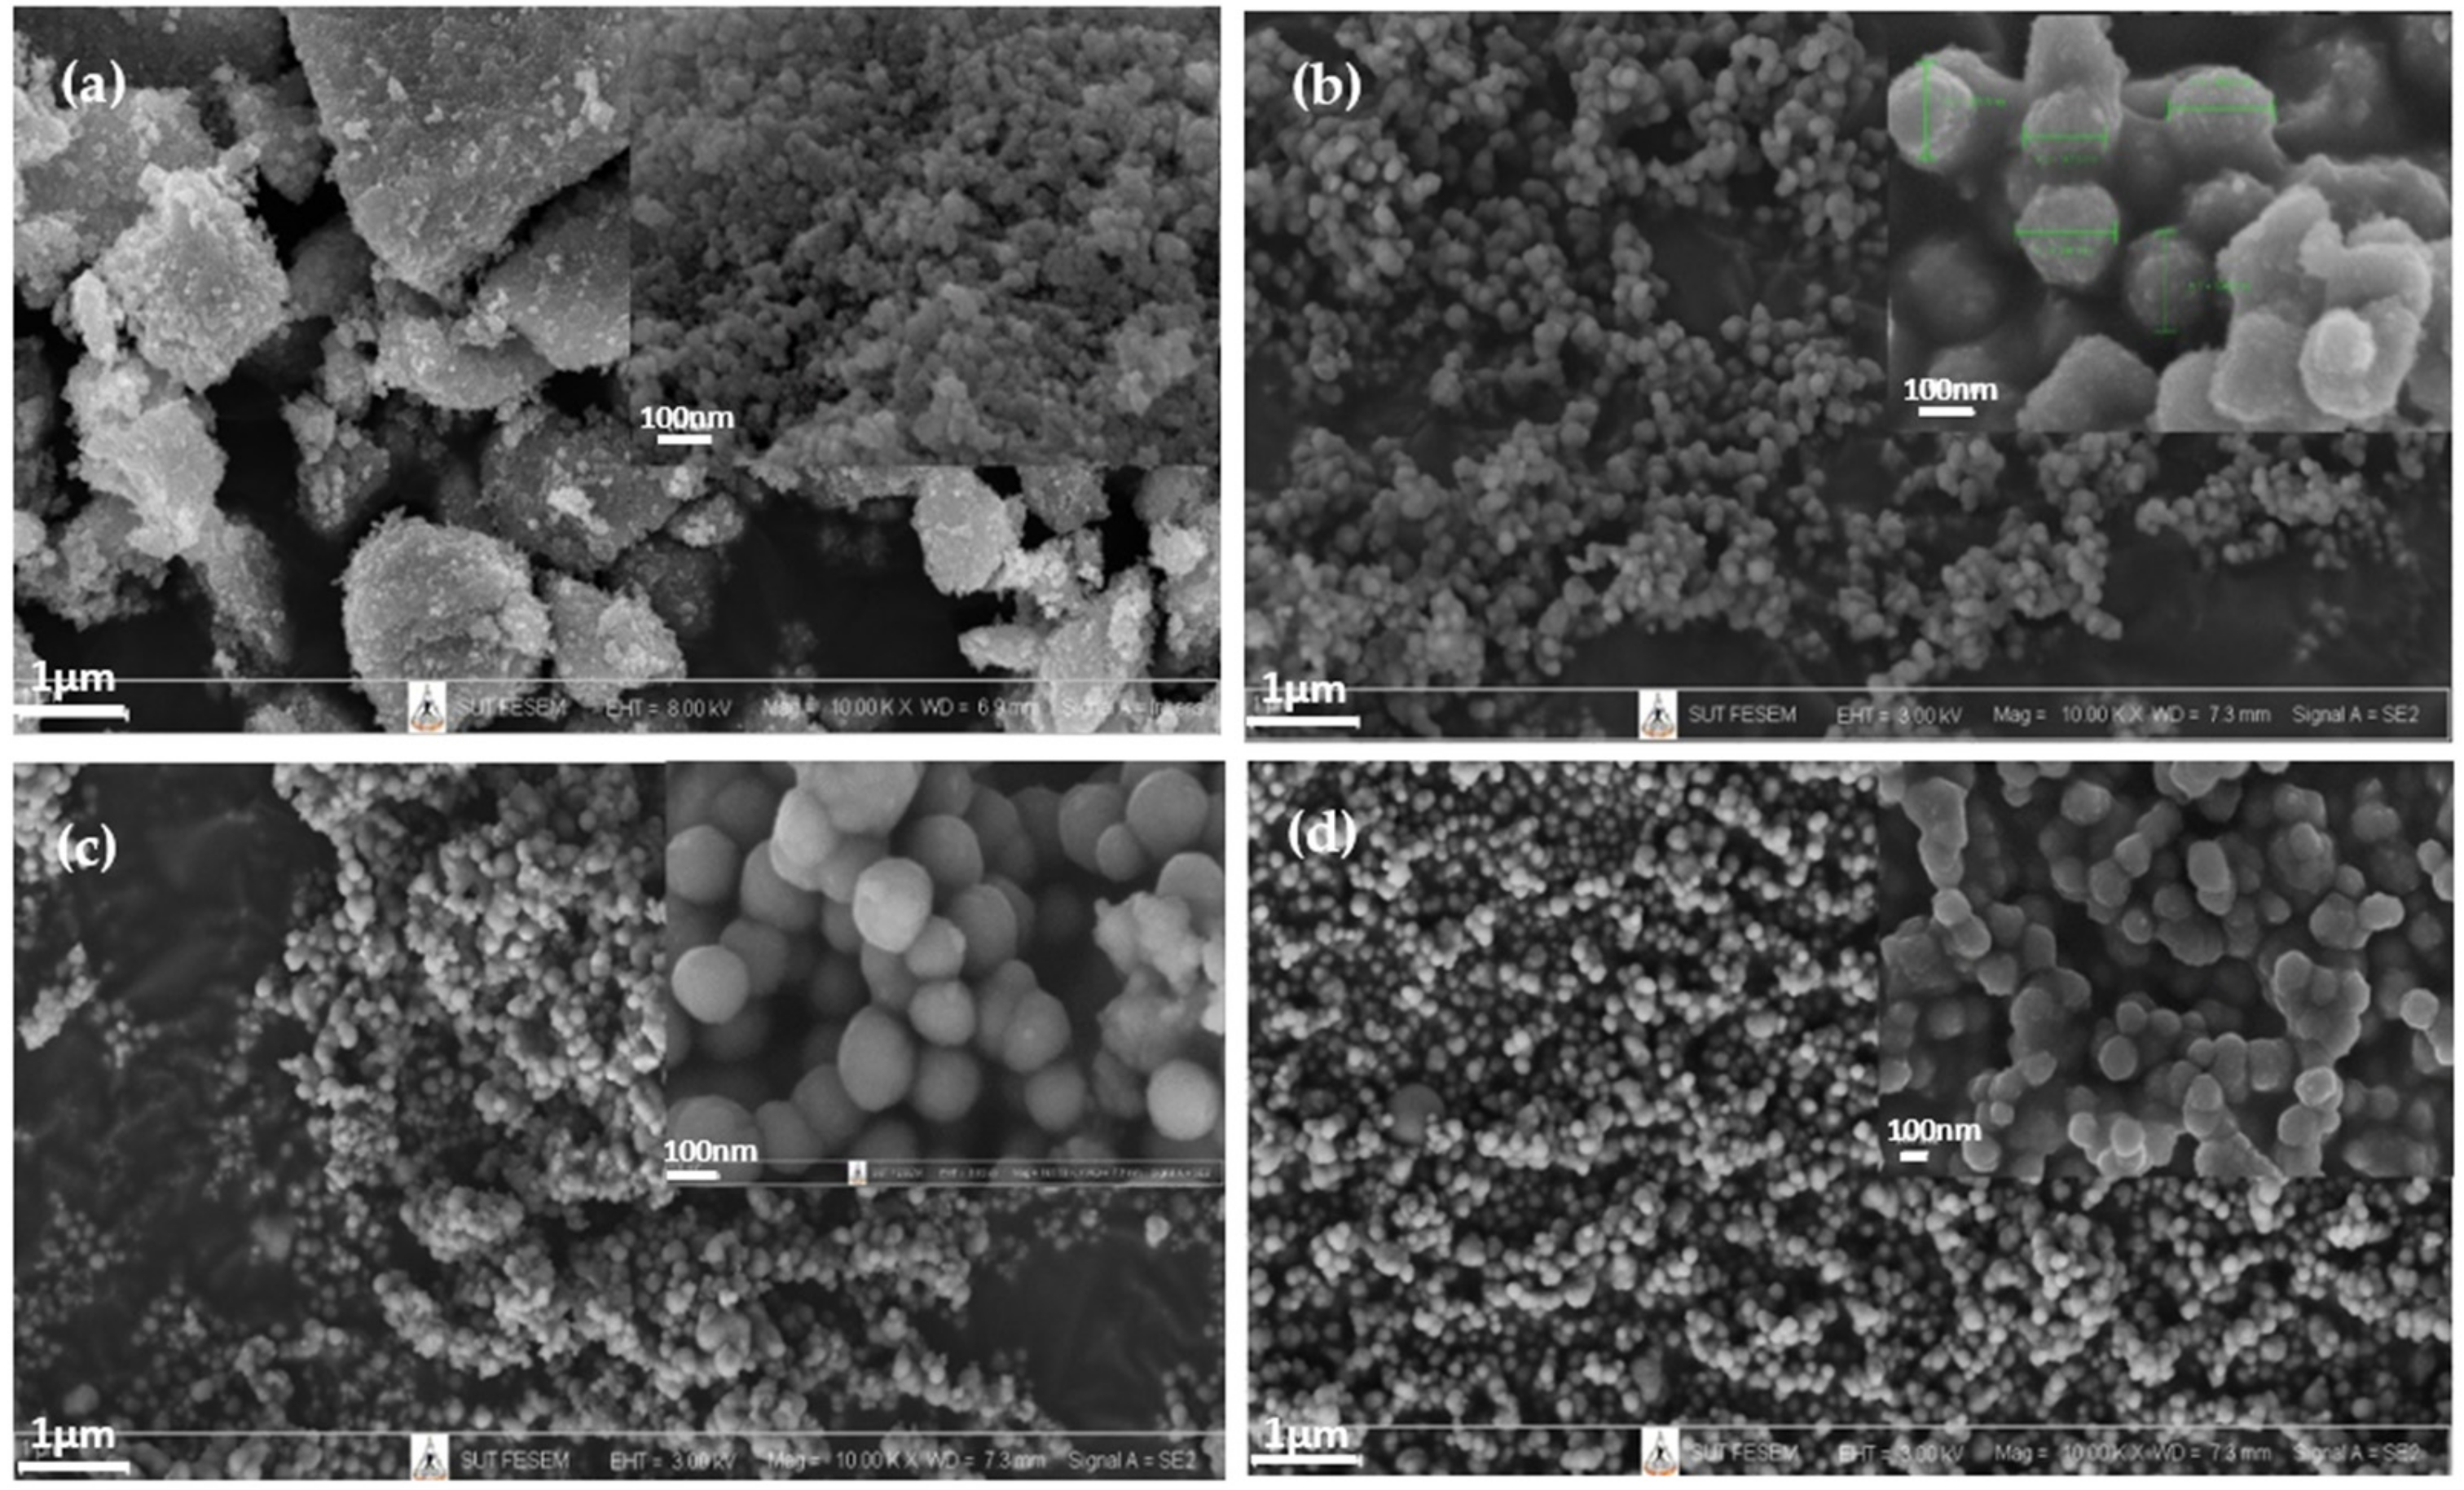
2.3.3. Field Emission Scanning Electron Microscopy (FE-SEM)
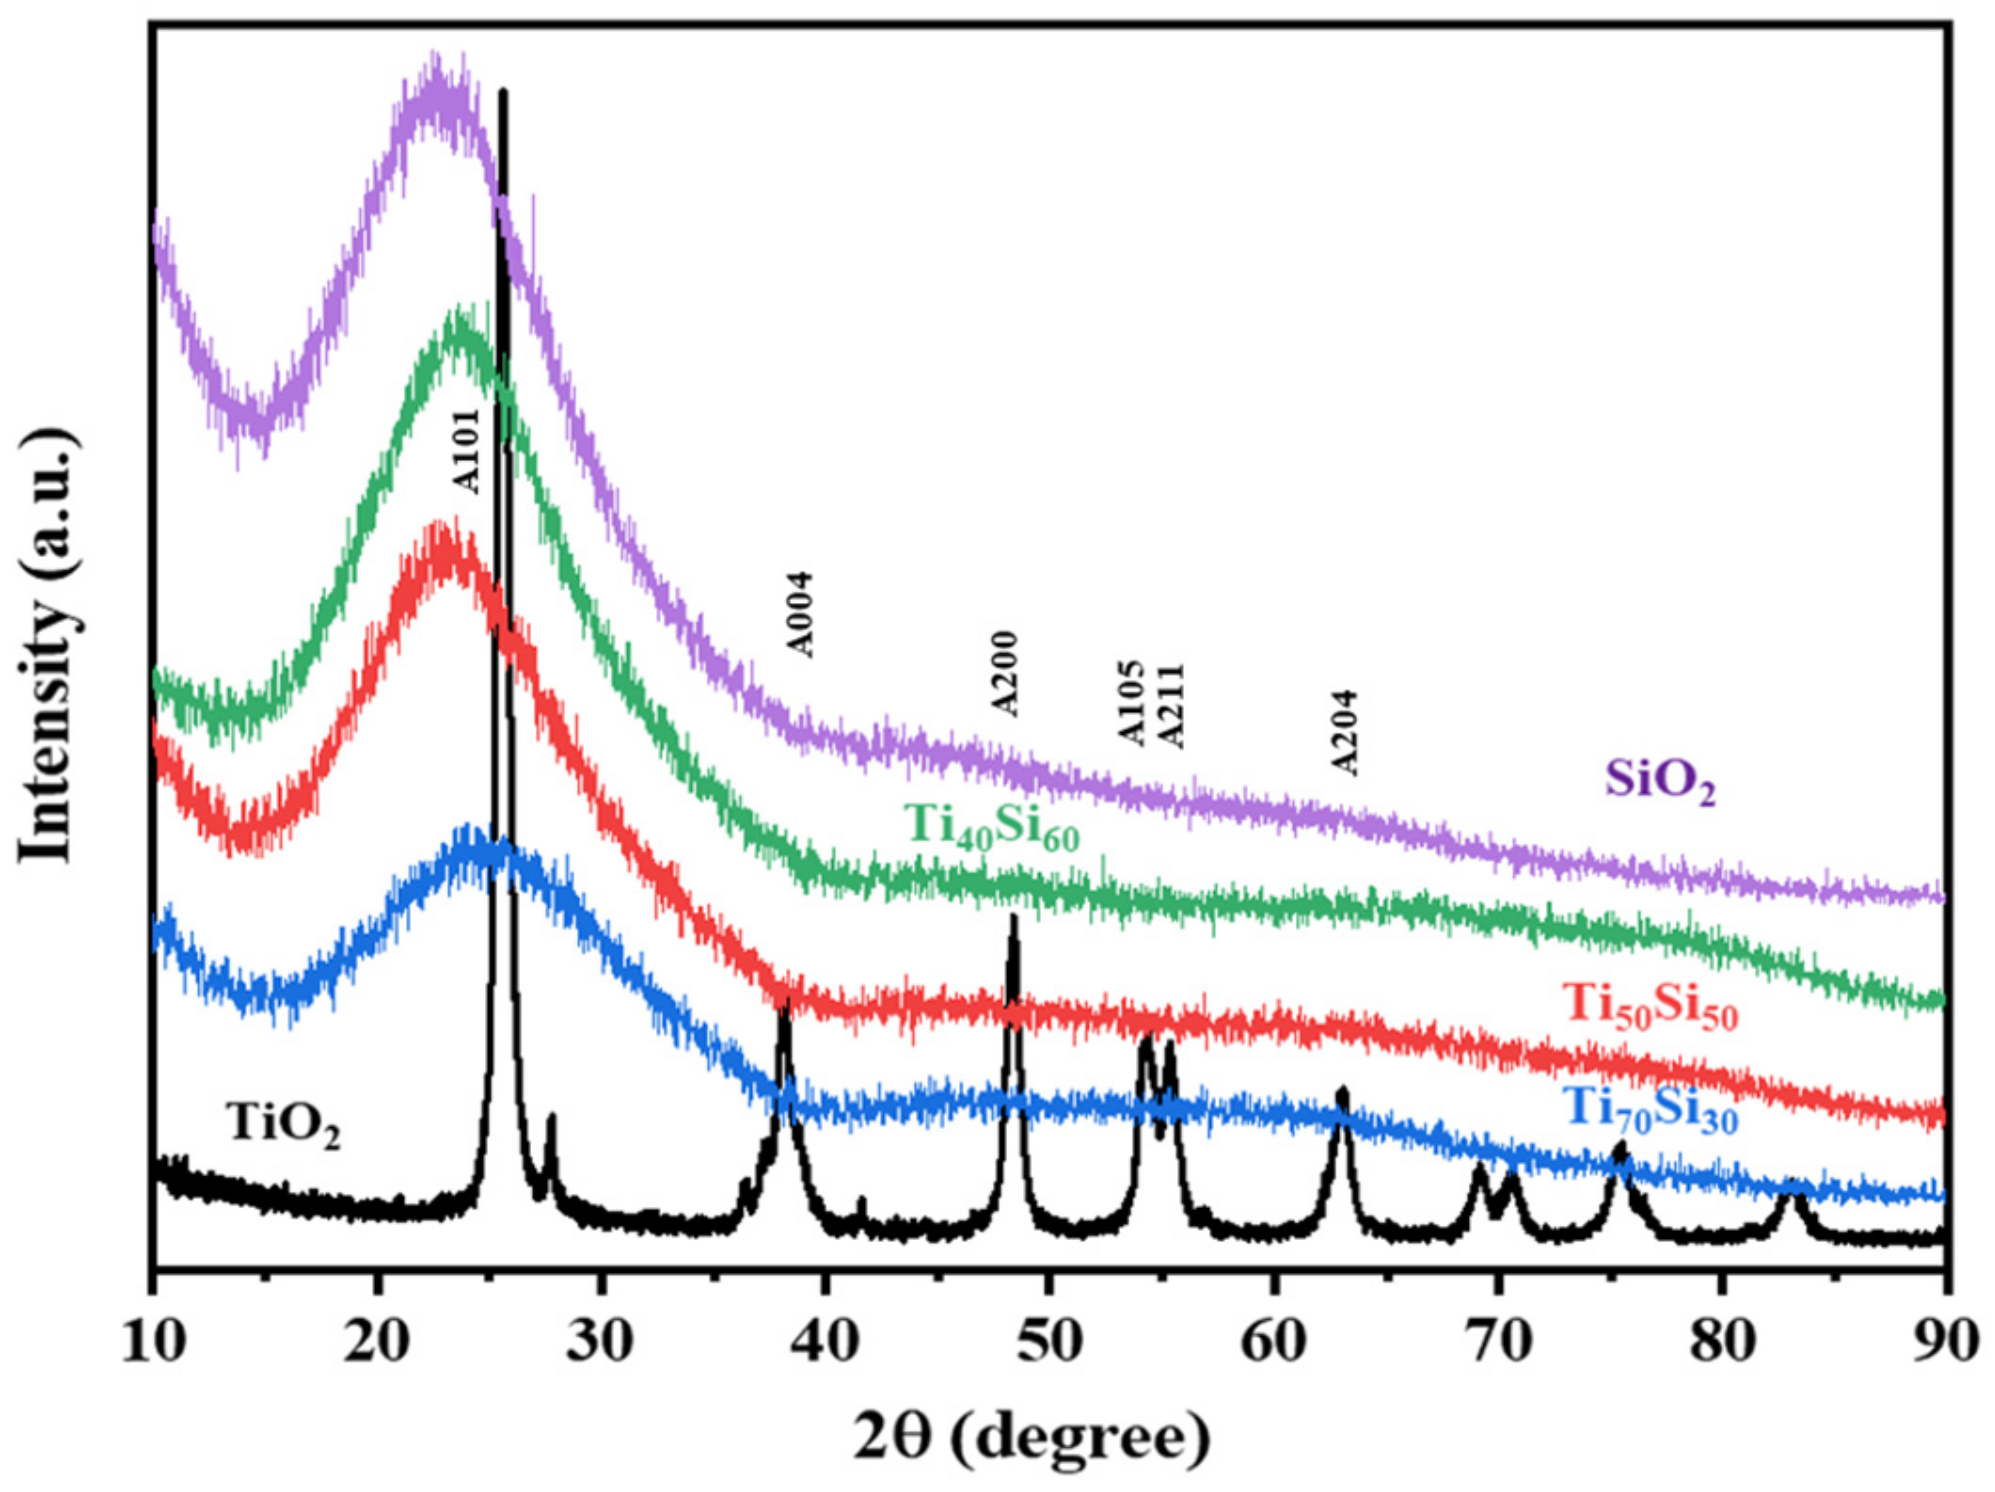
2.3.4. X-ray Diffraction (XRD)
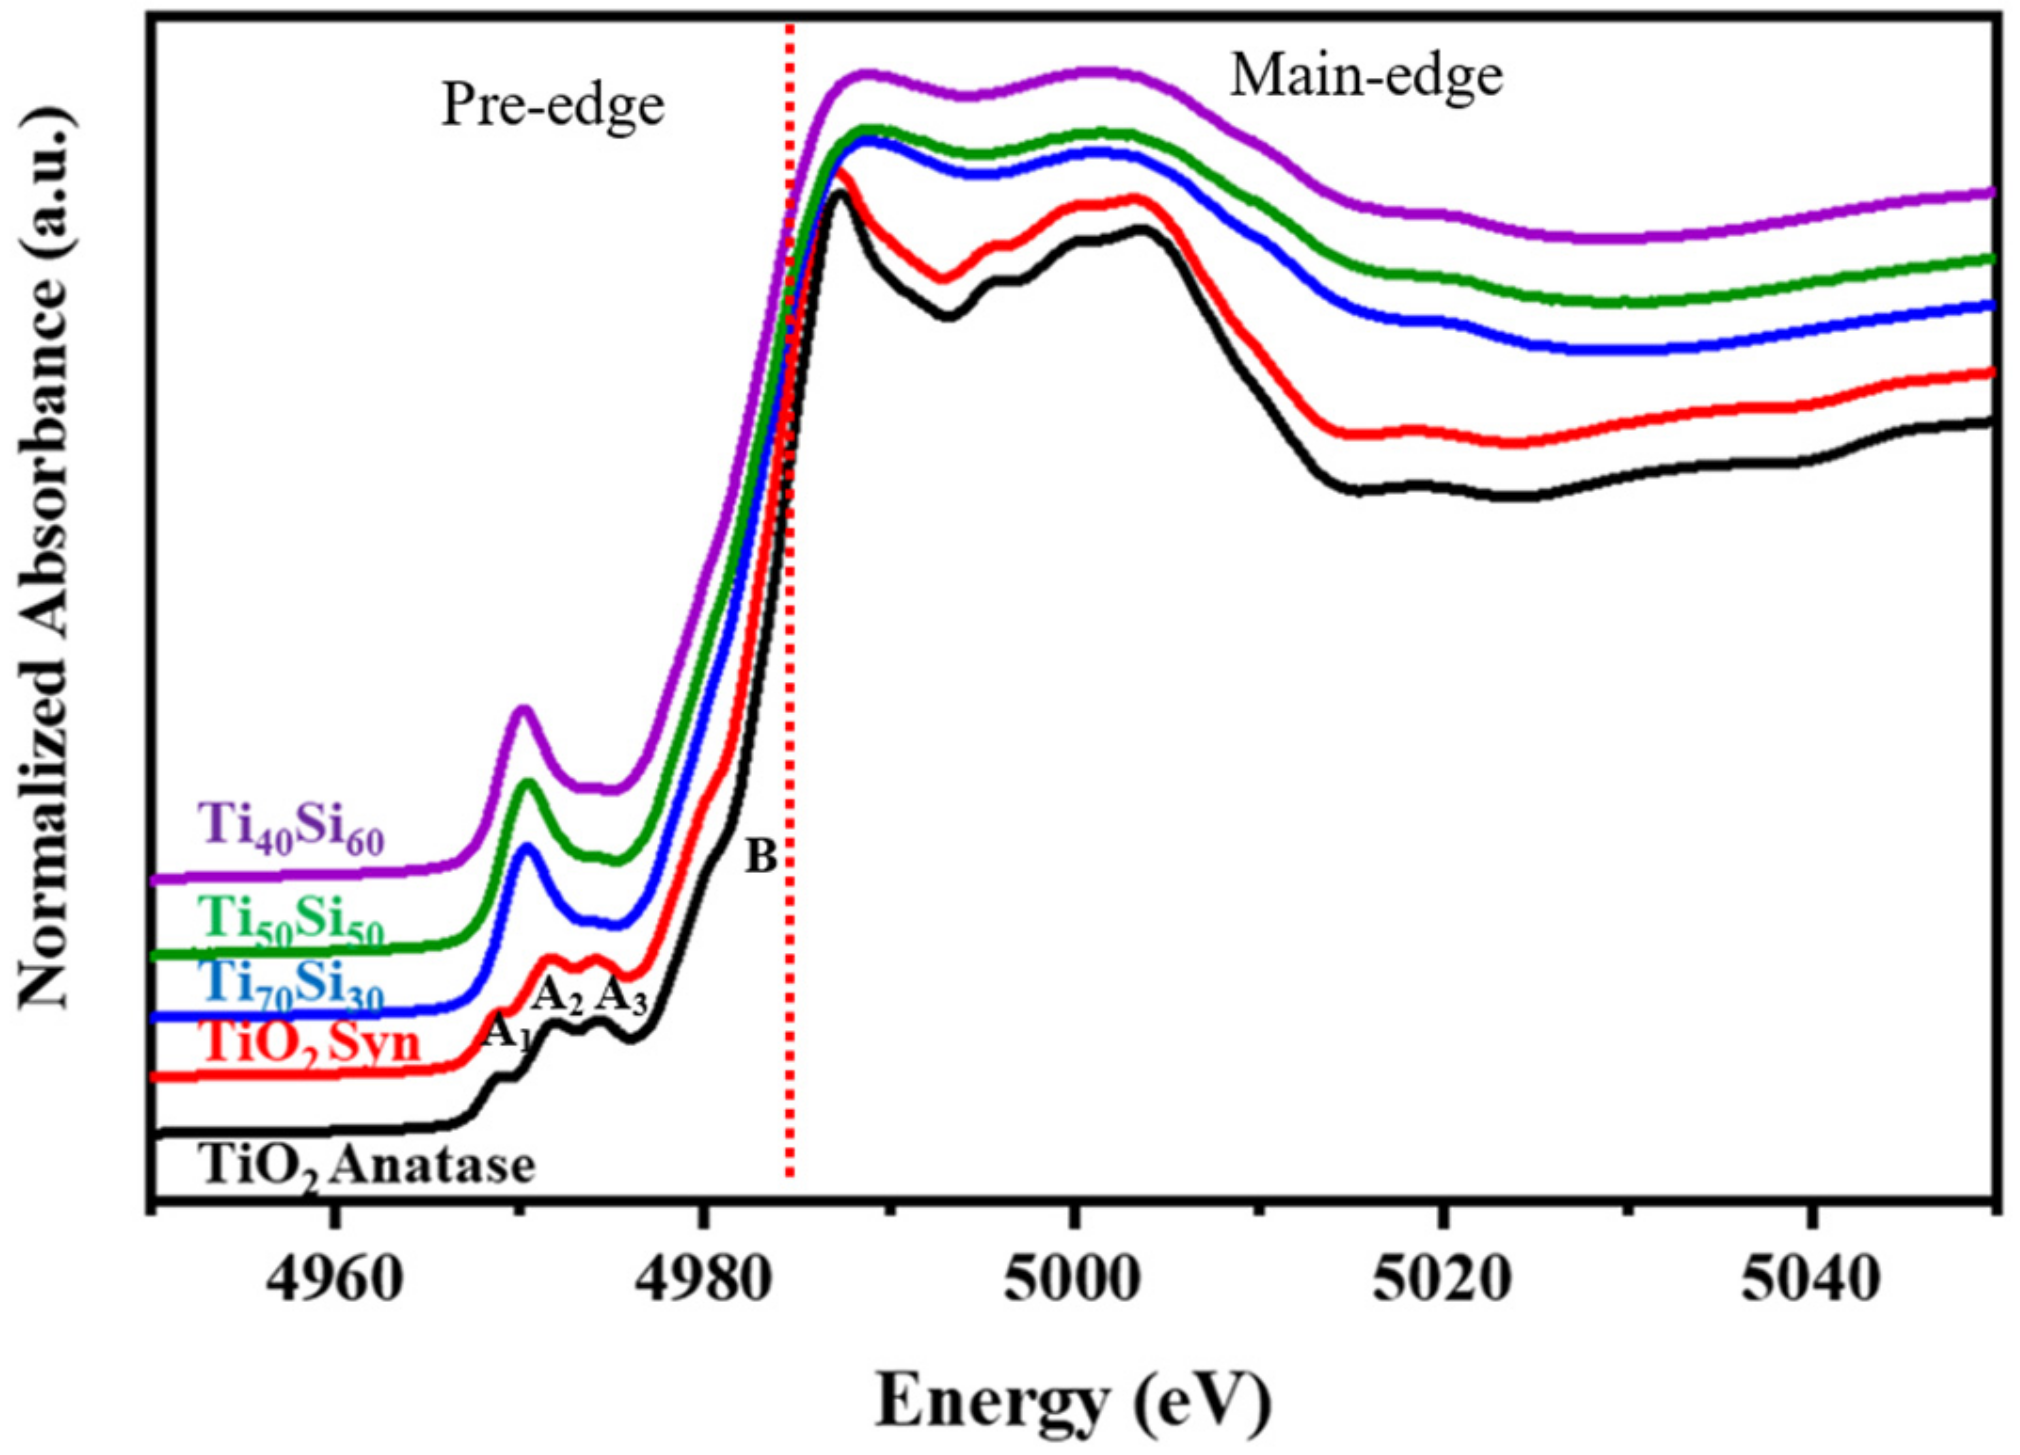
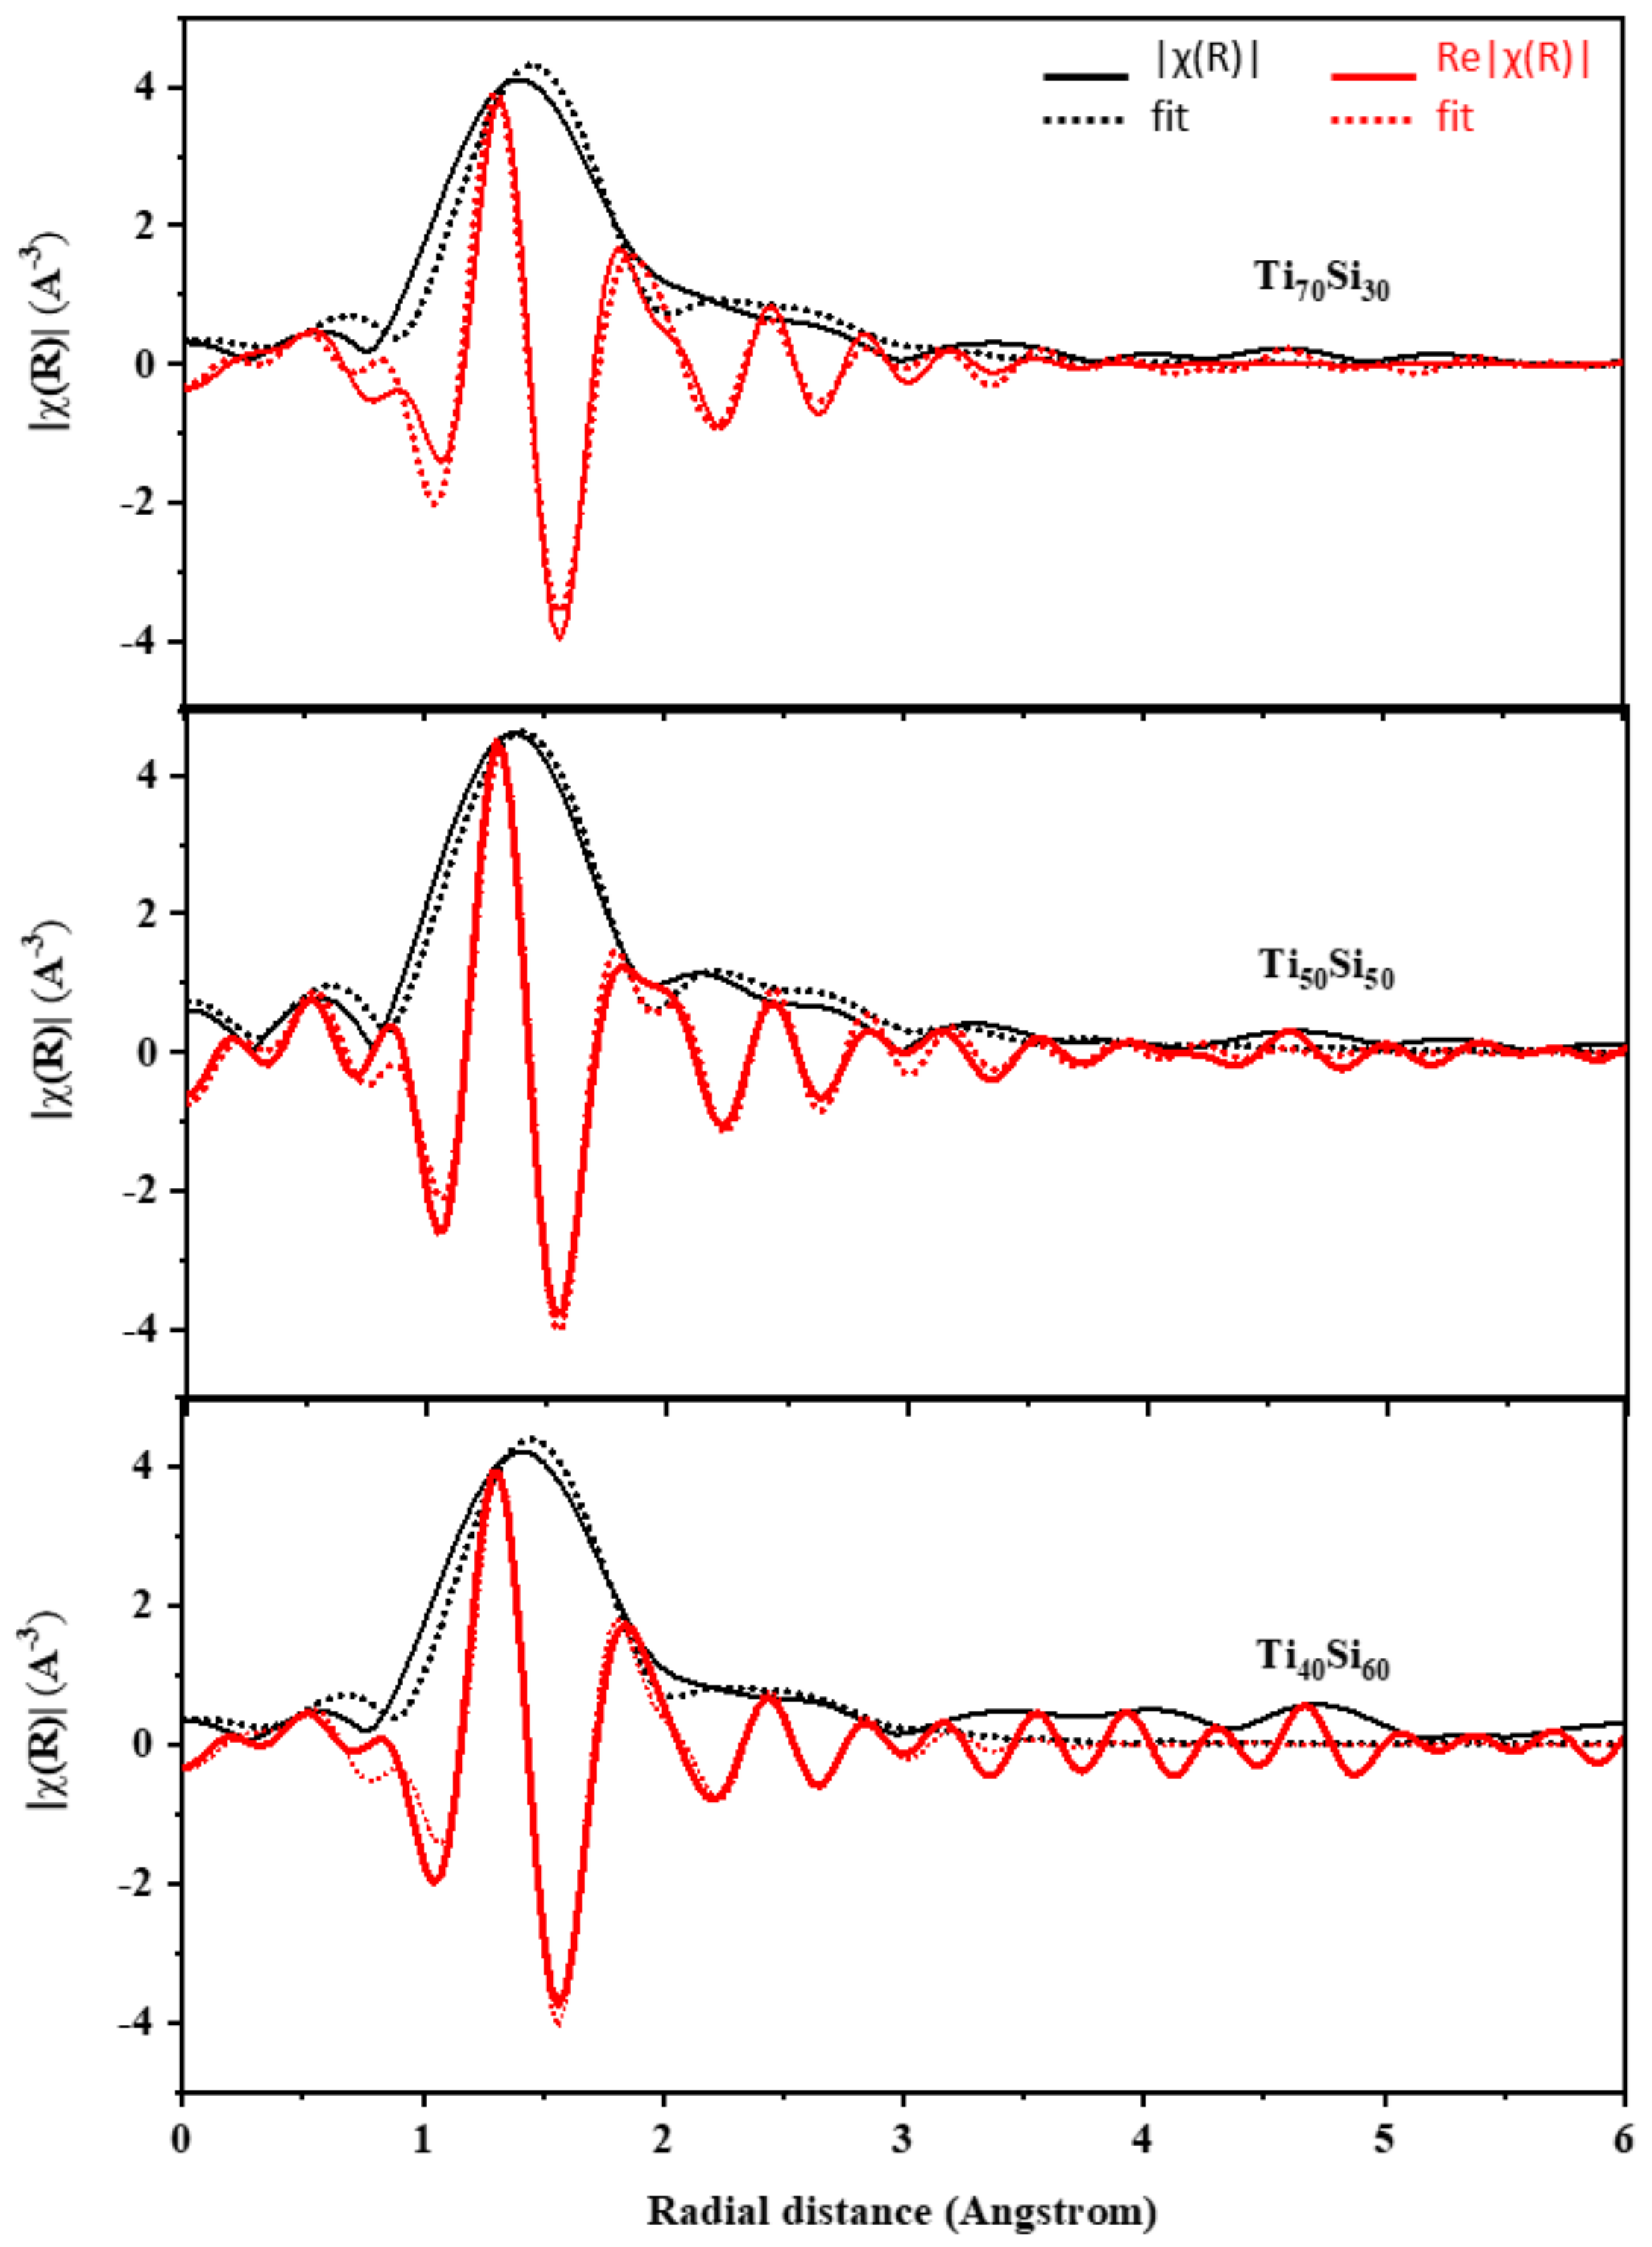
2.3.5. X-ray Absorption Near-Edge Structure Spectroscopy (XANES) and Extended X-ray Absorption Fine Structure Spectroscopy (EXAFS)
2.3.6. X-ray Fluorescence (XRF)
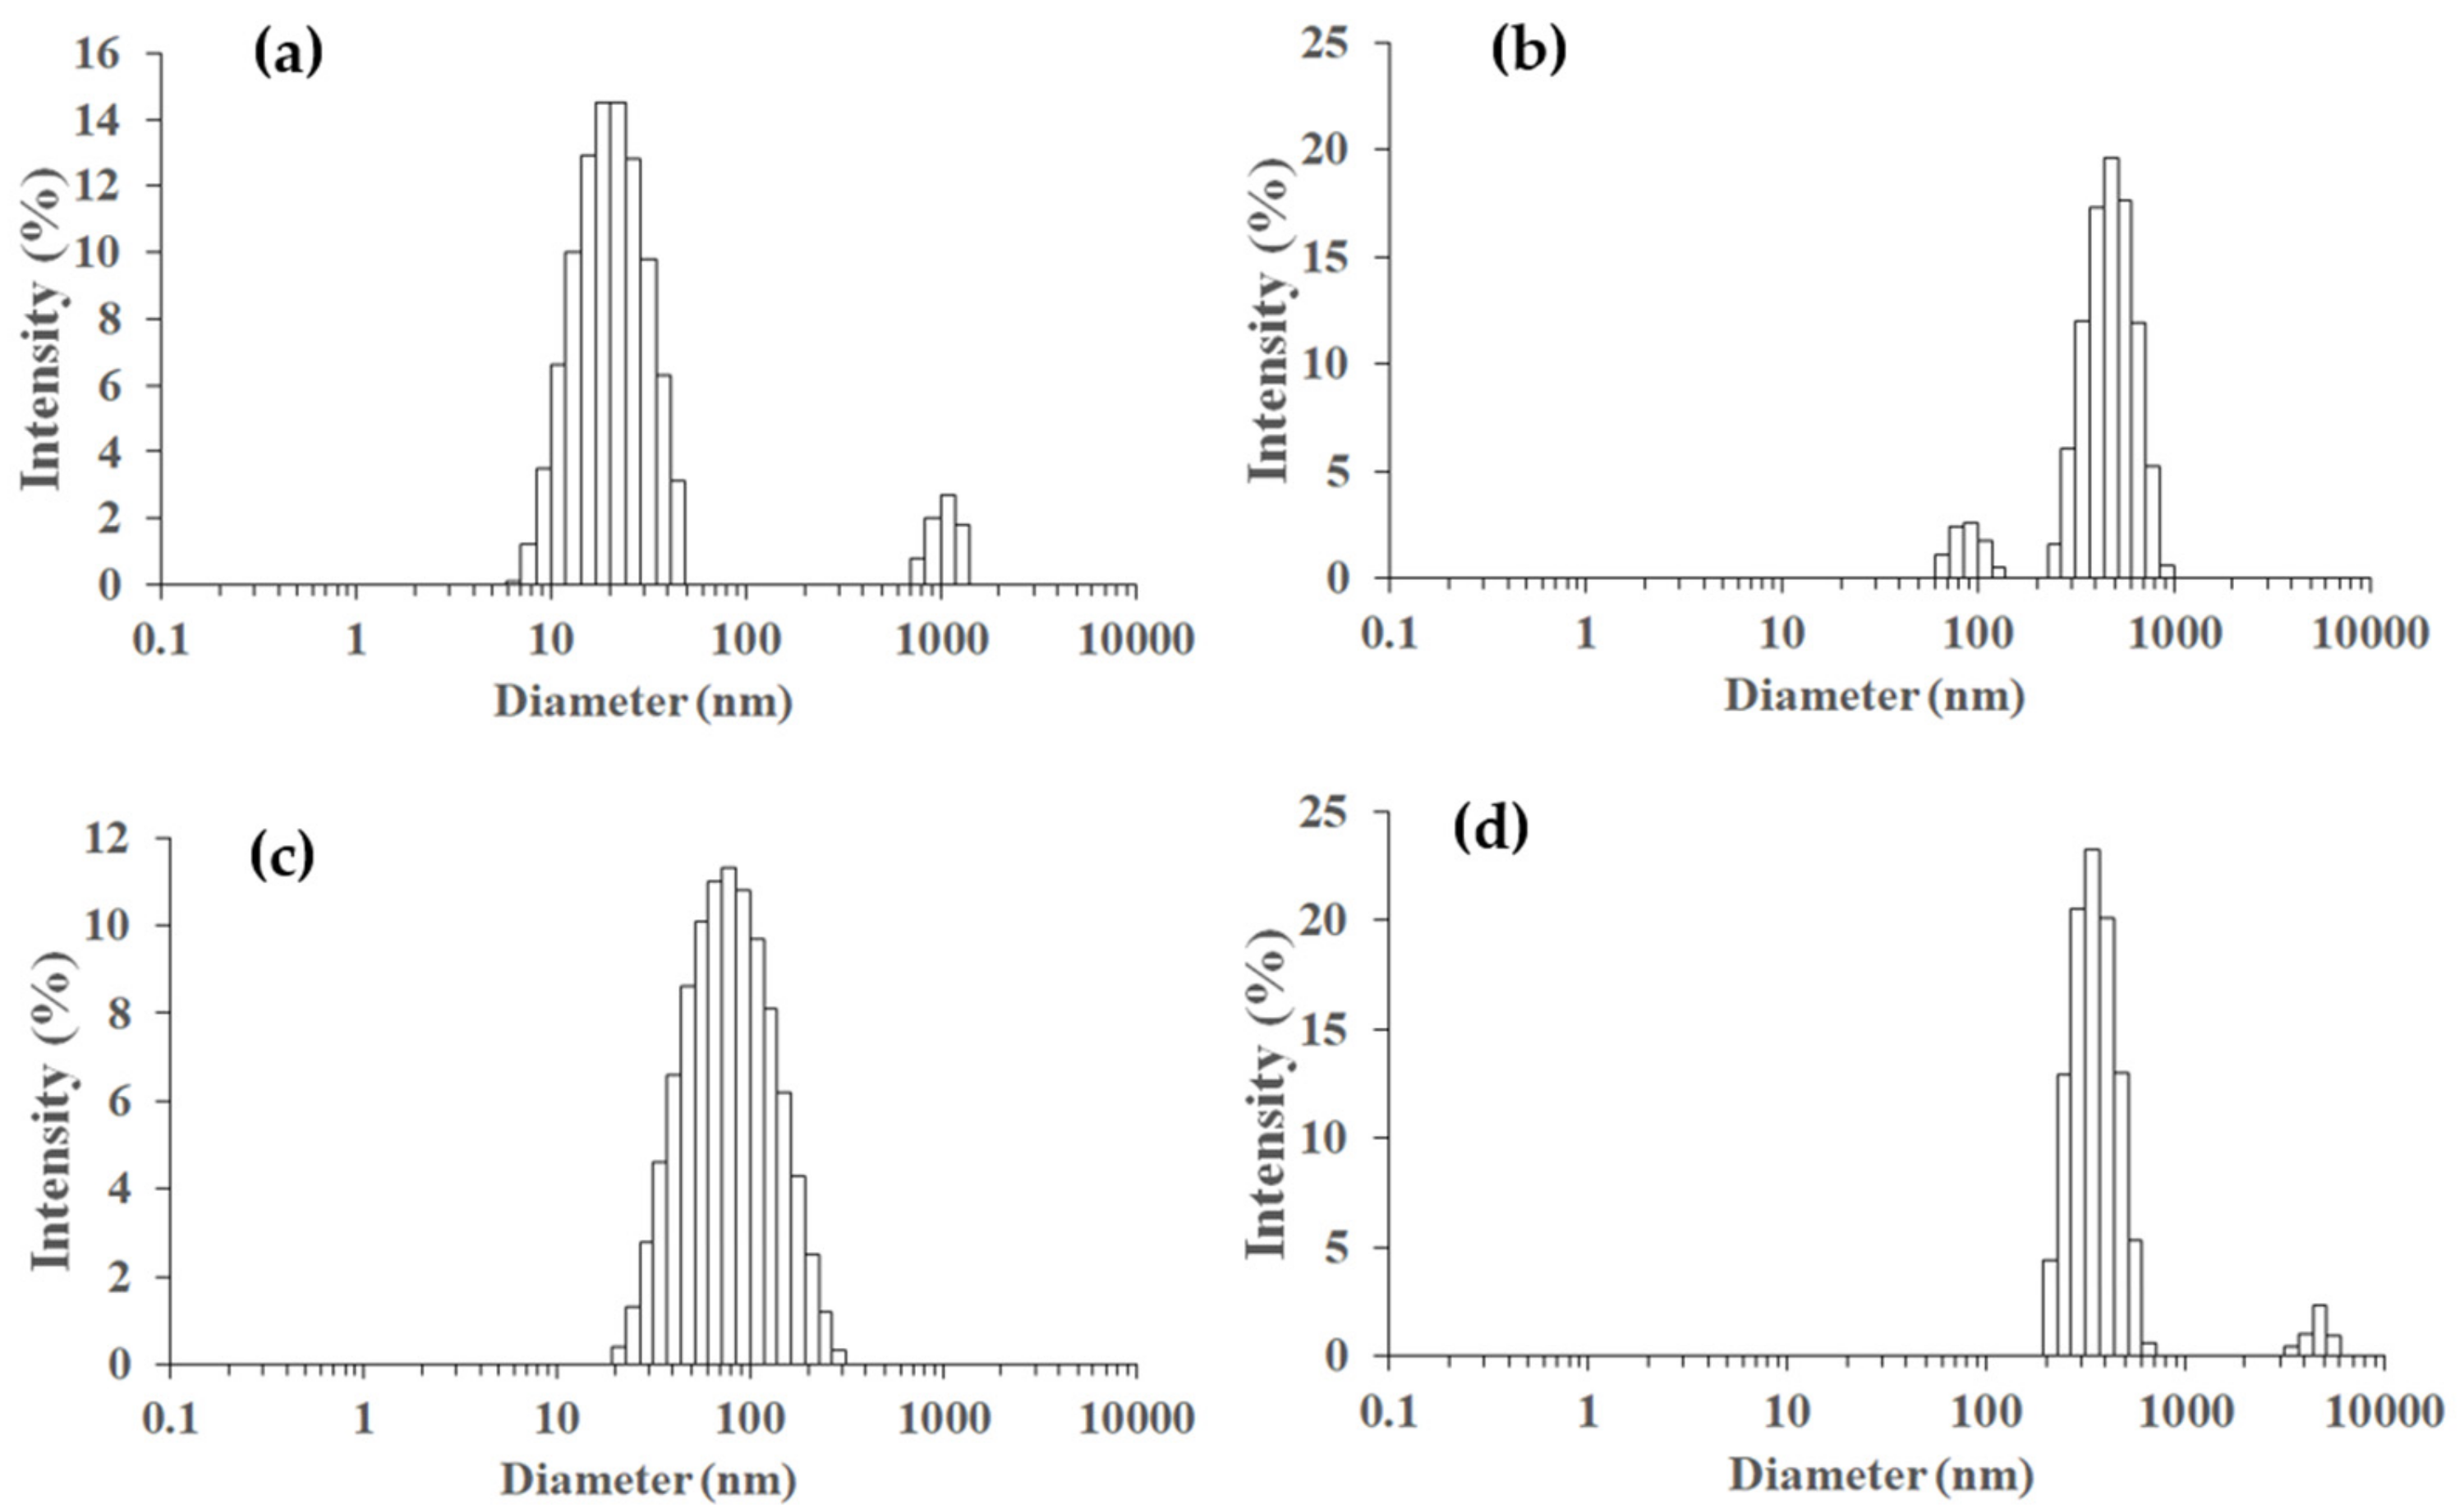
2.3.7. Particle Size Distribution
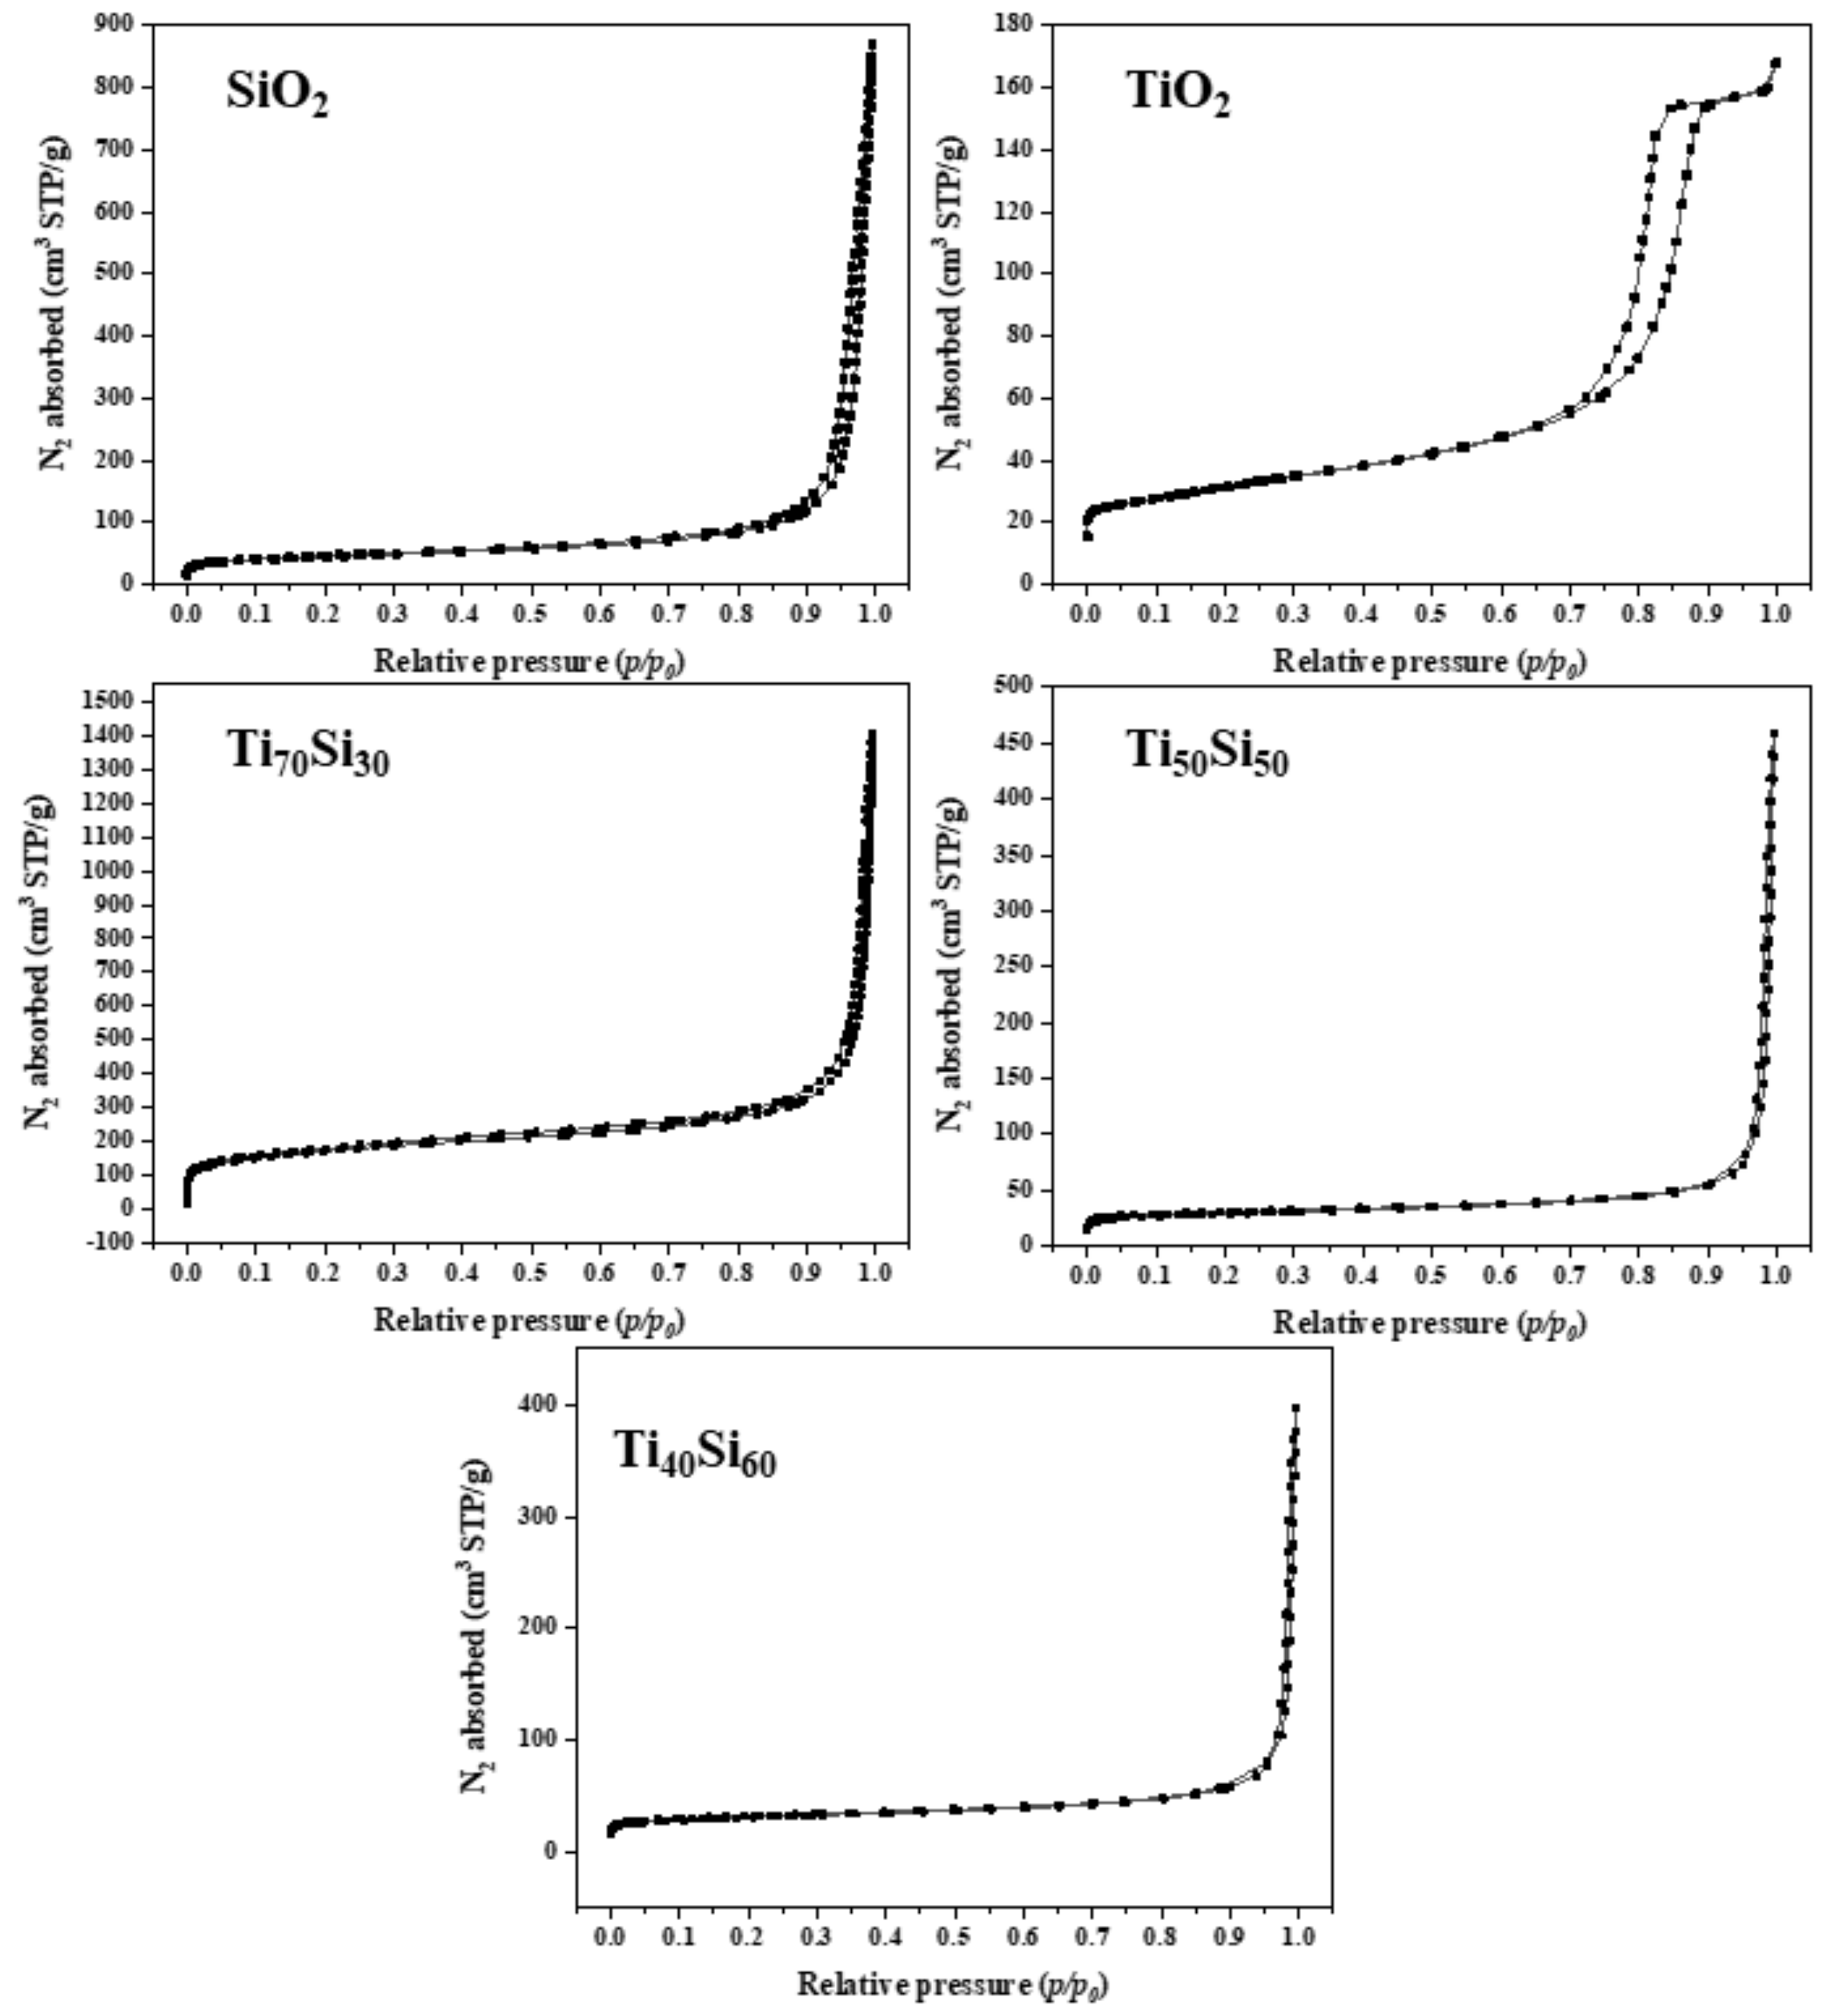
2.3.8. Specific Surface Area (BET)
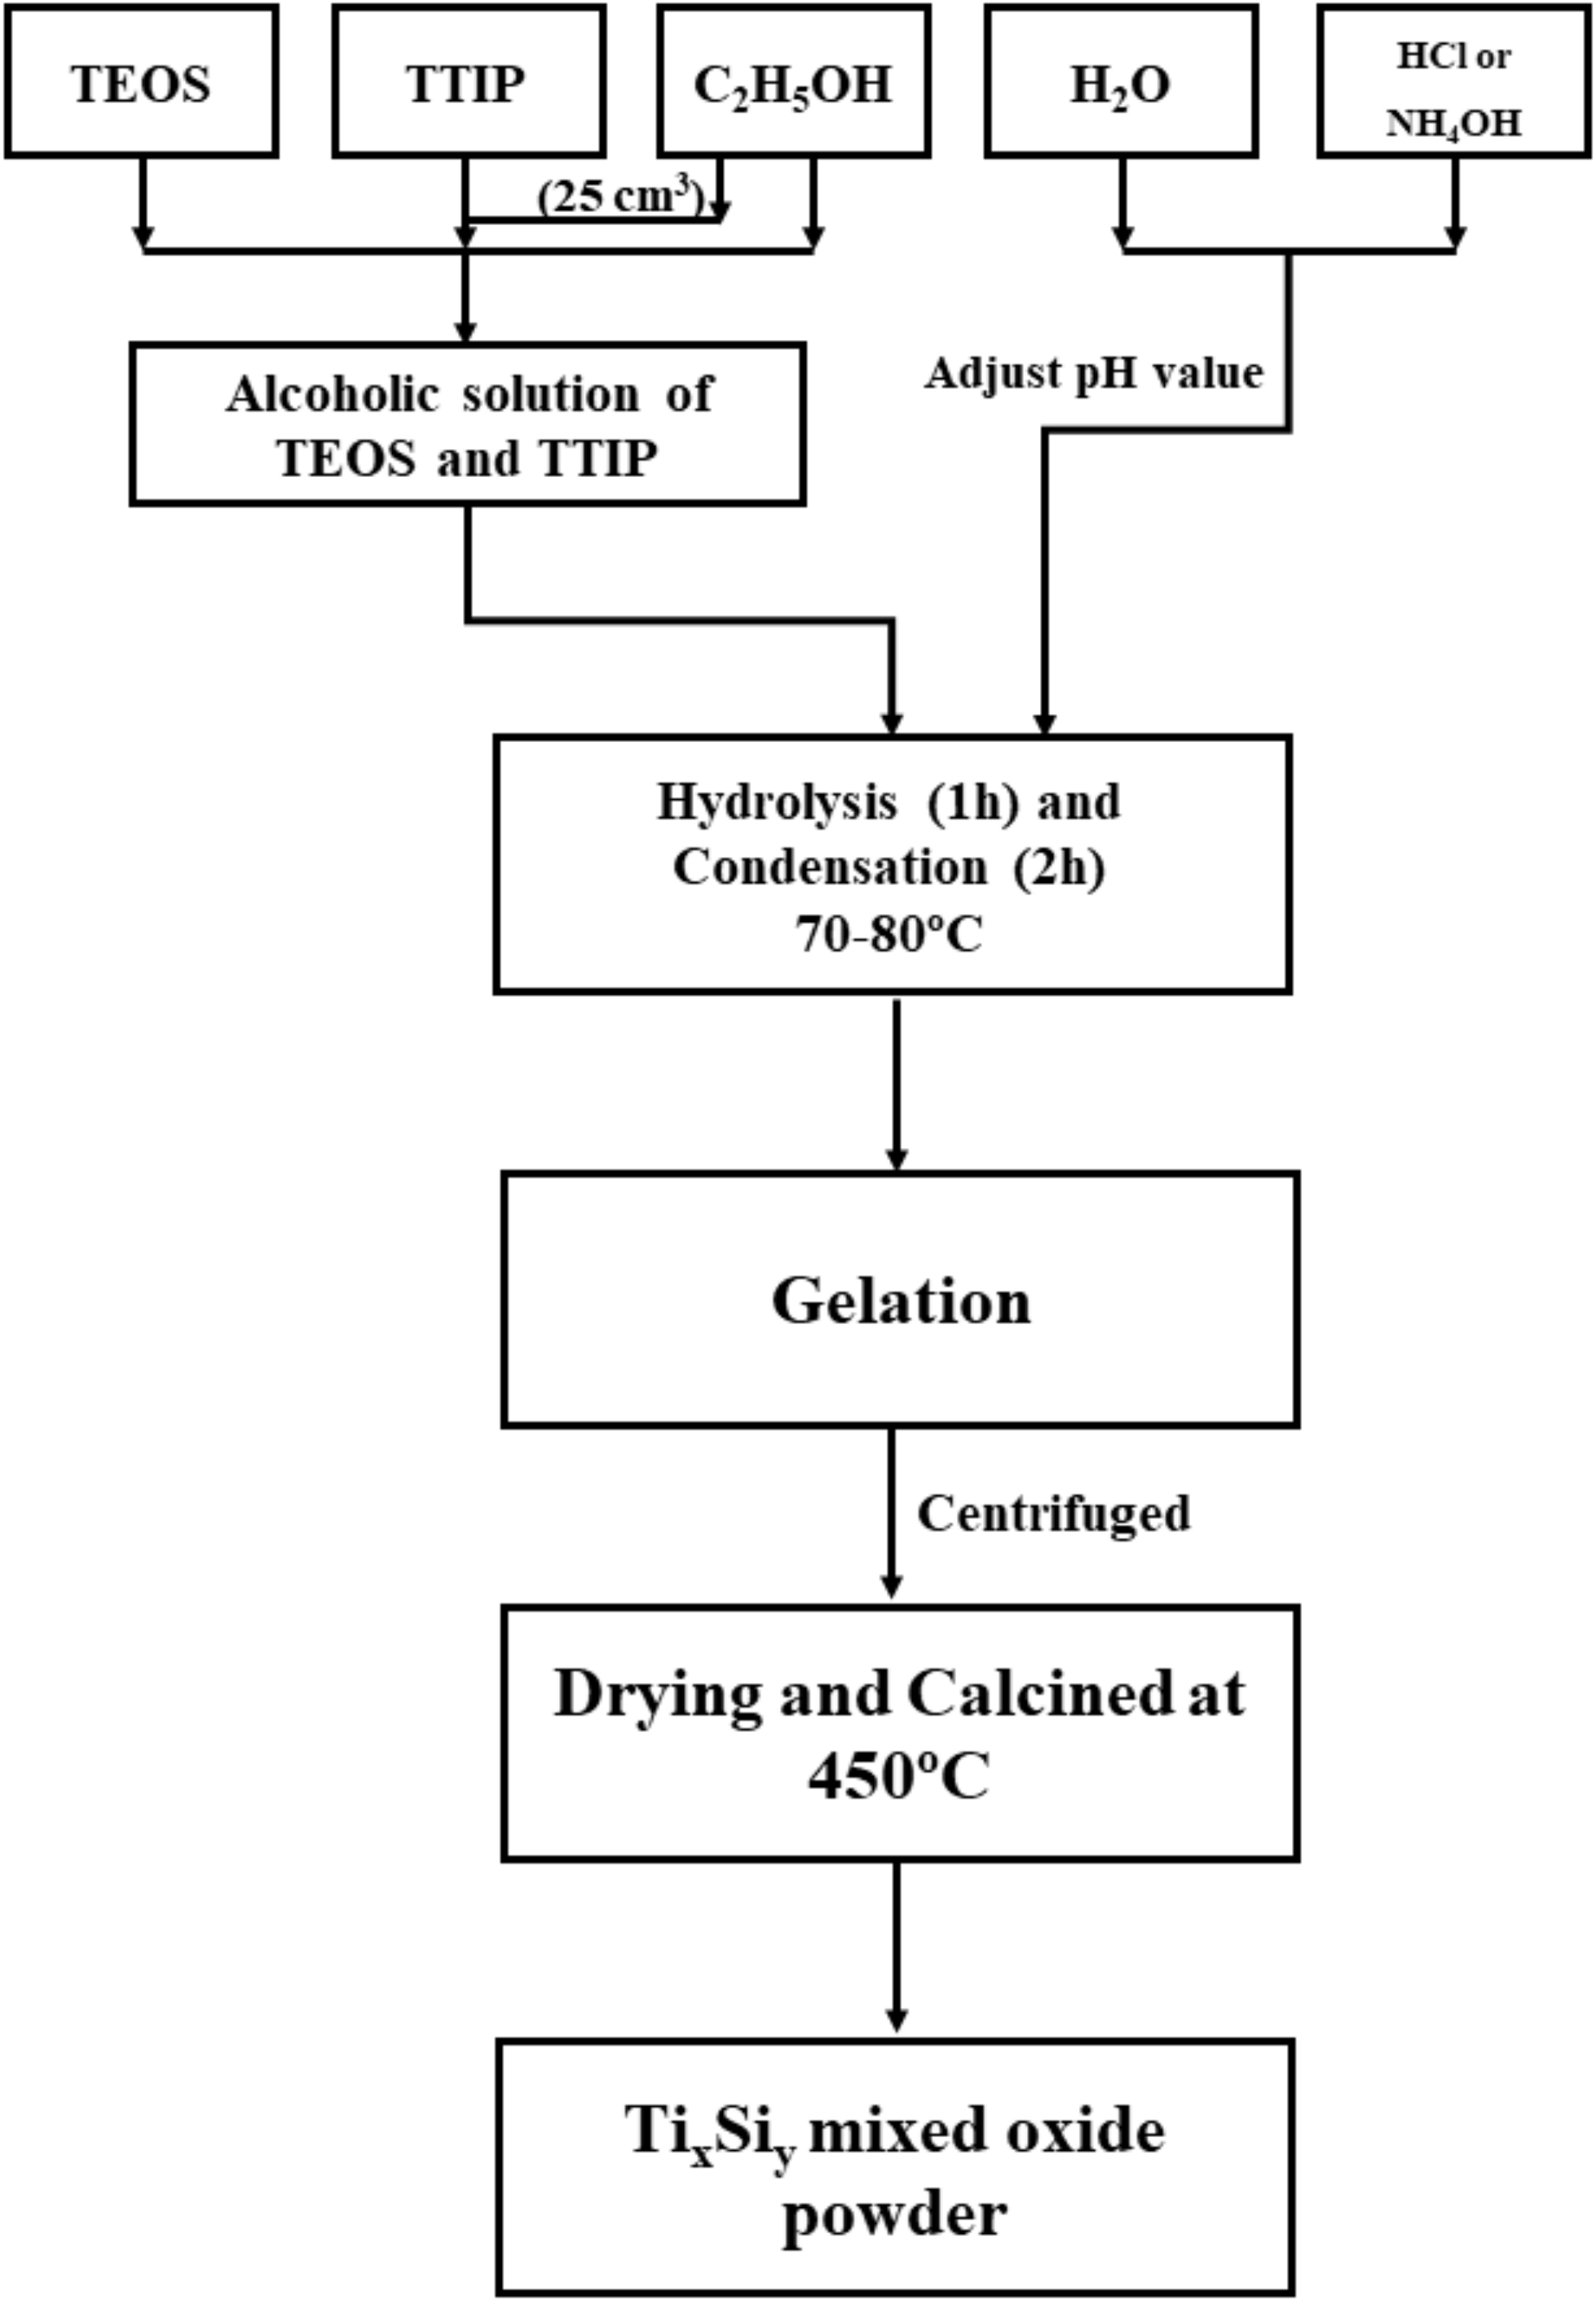
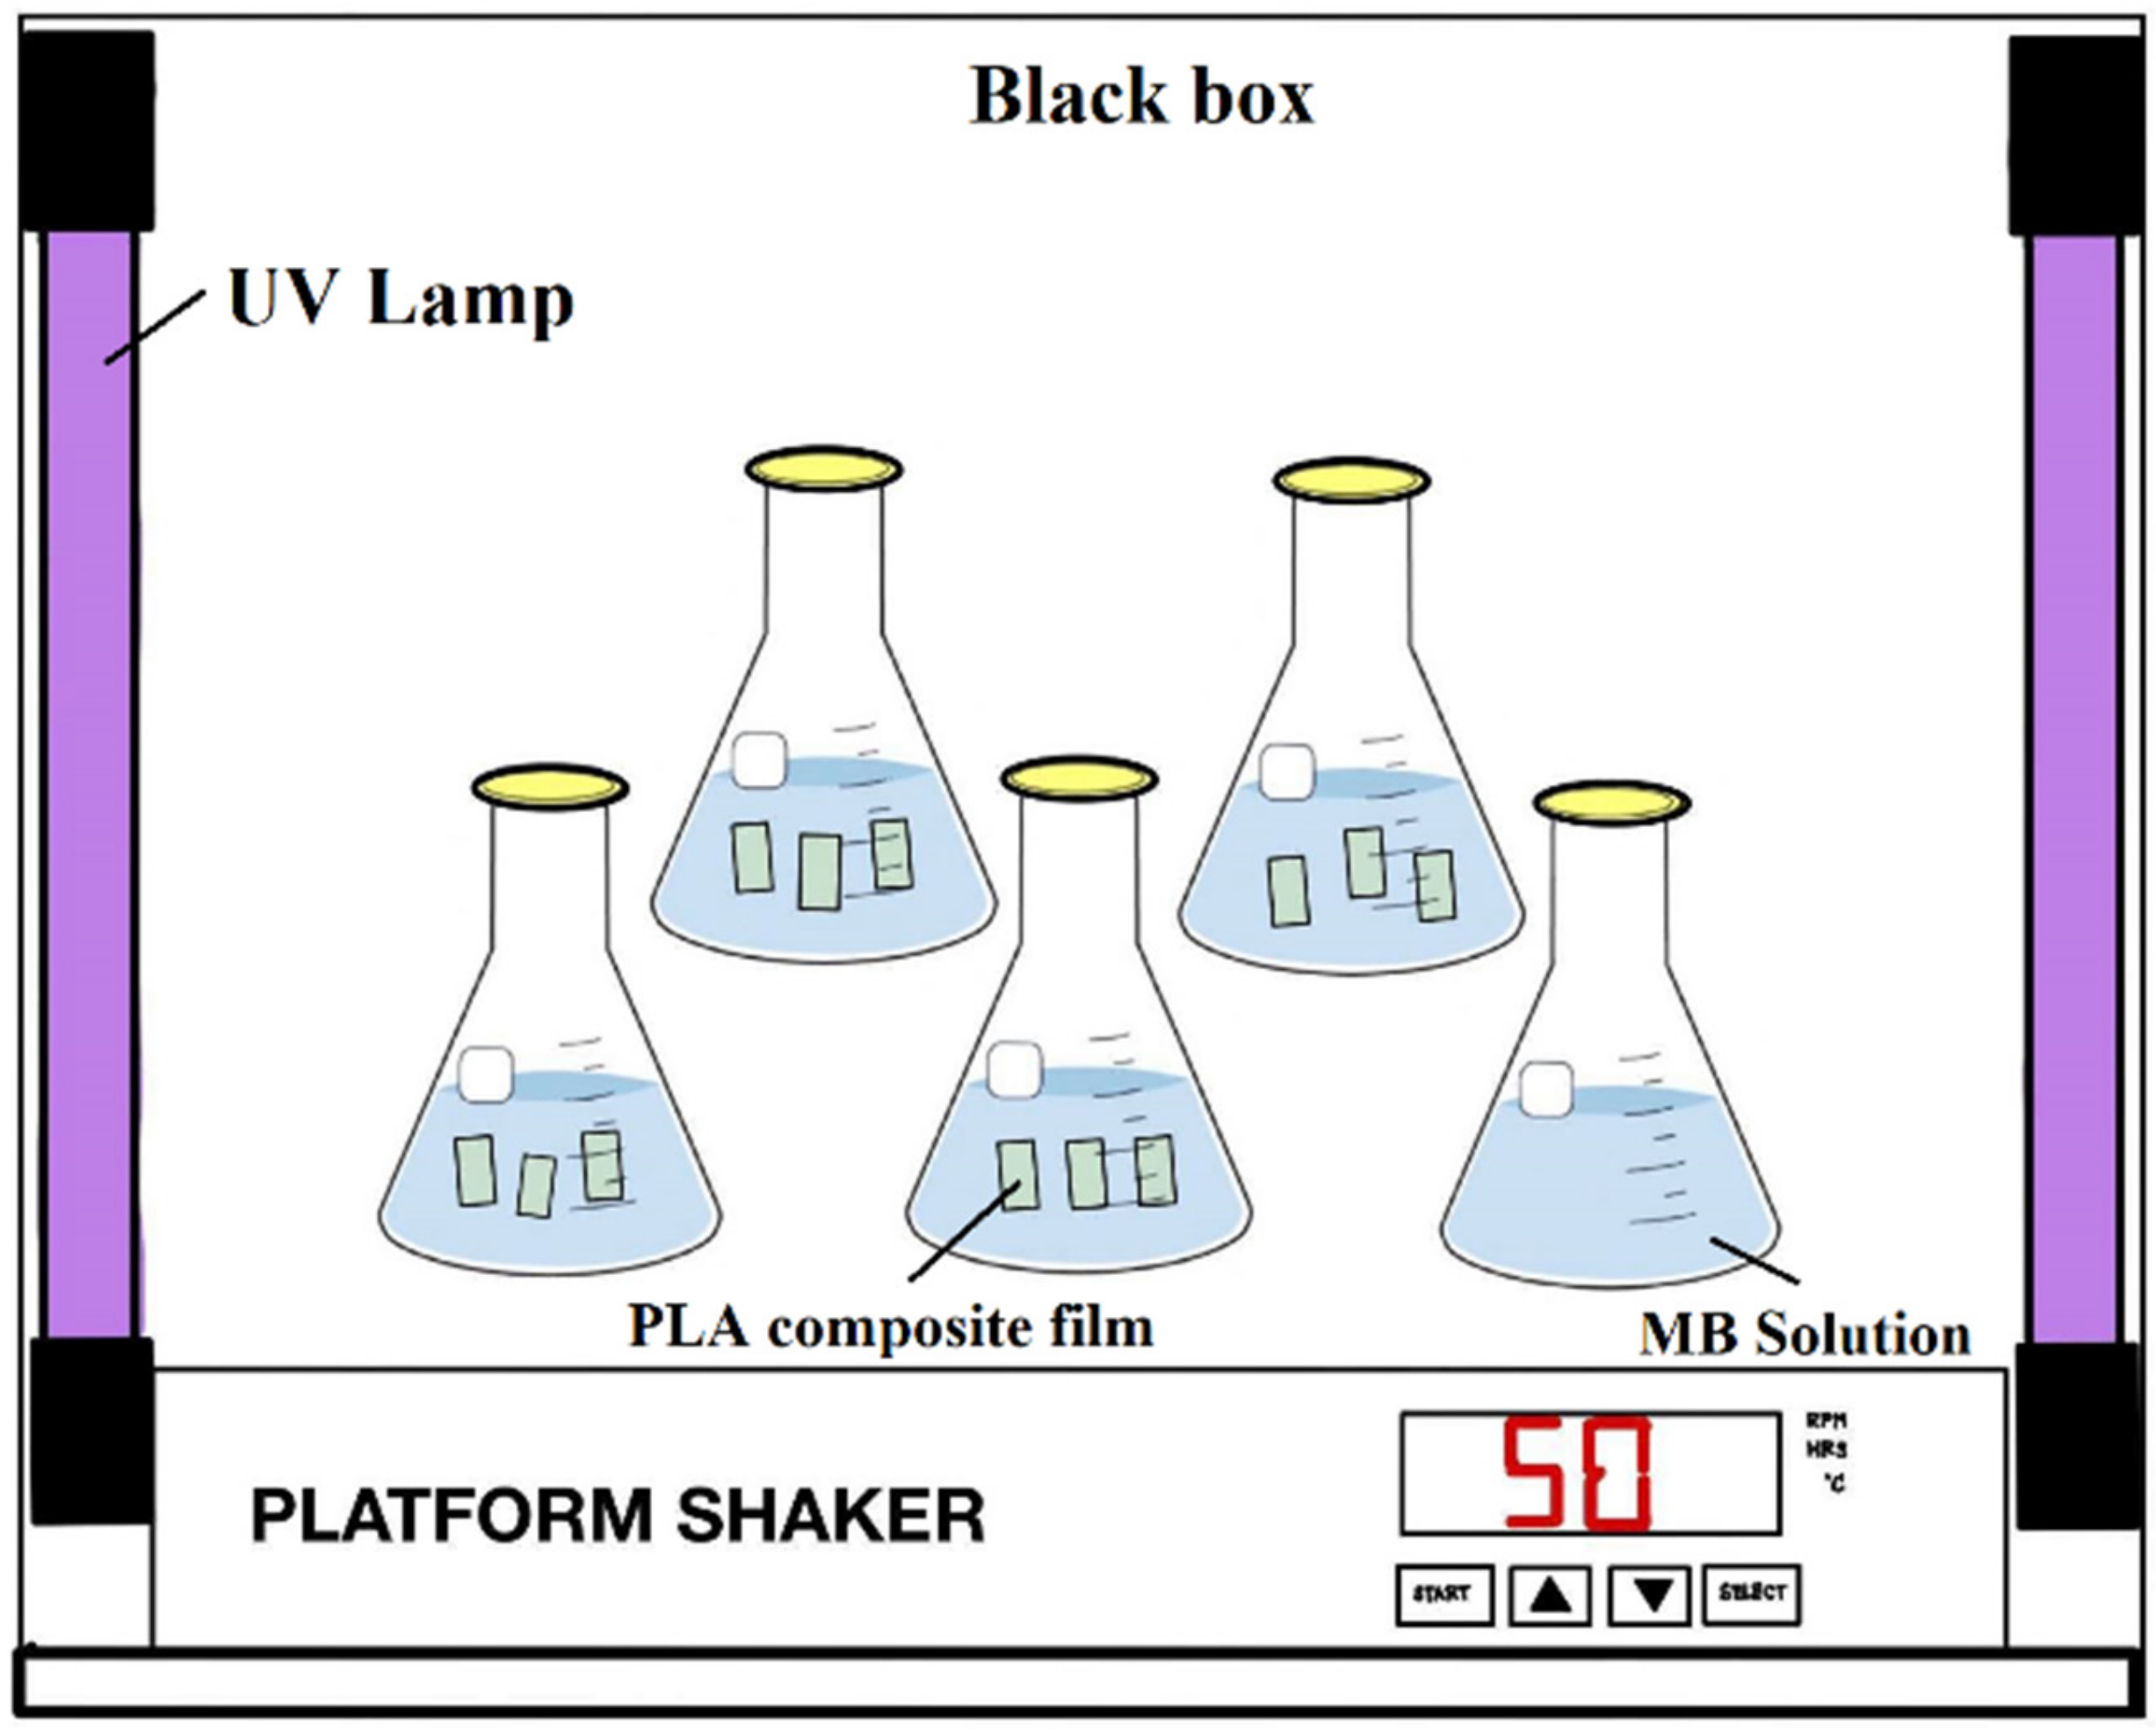
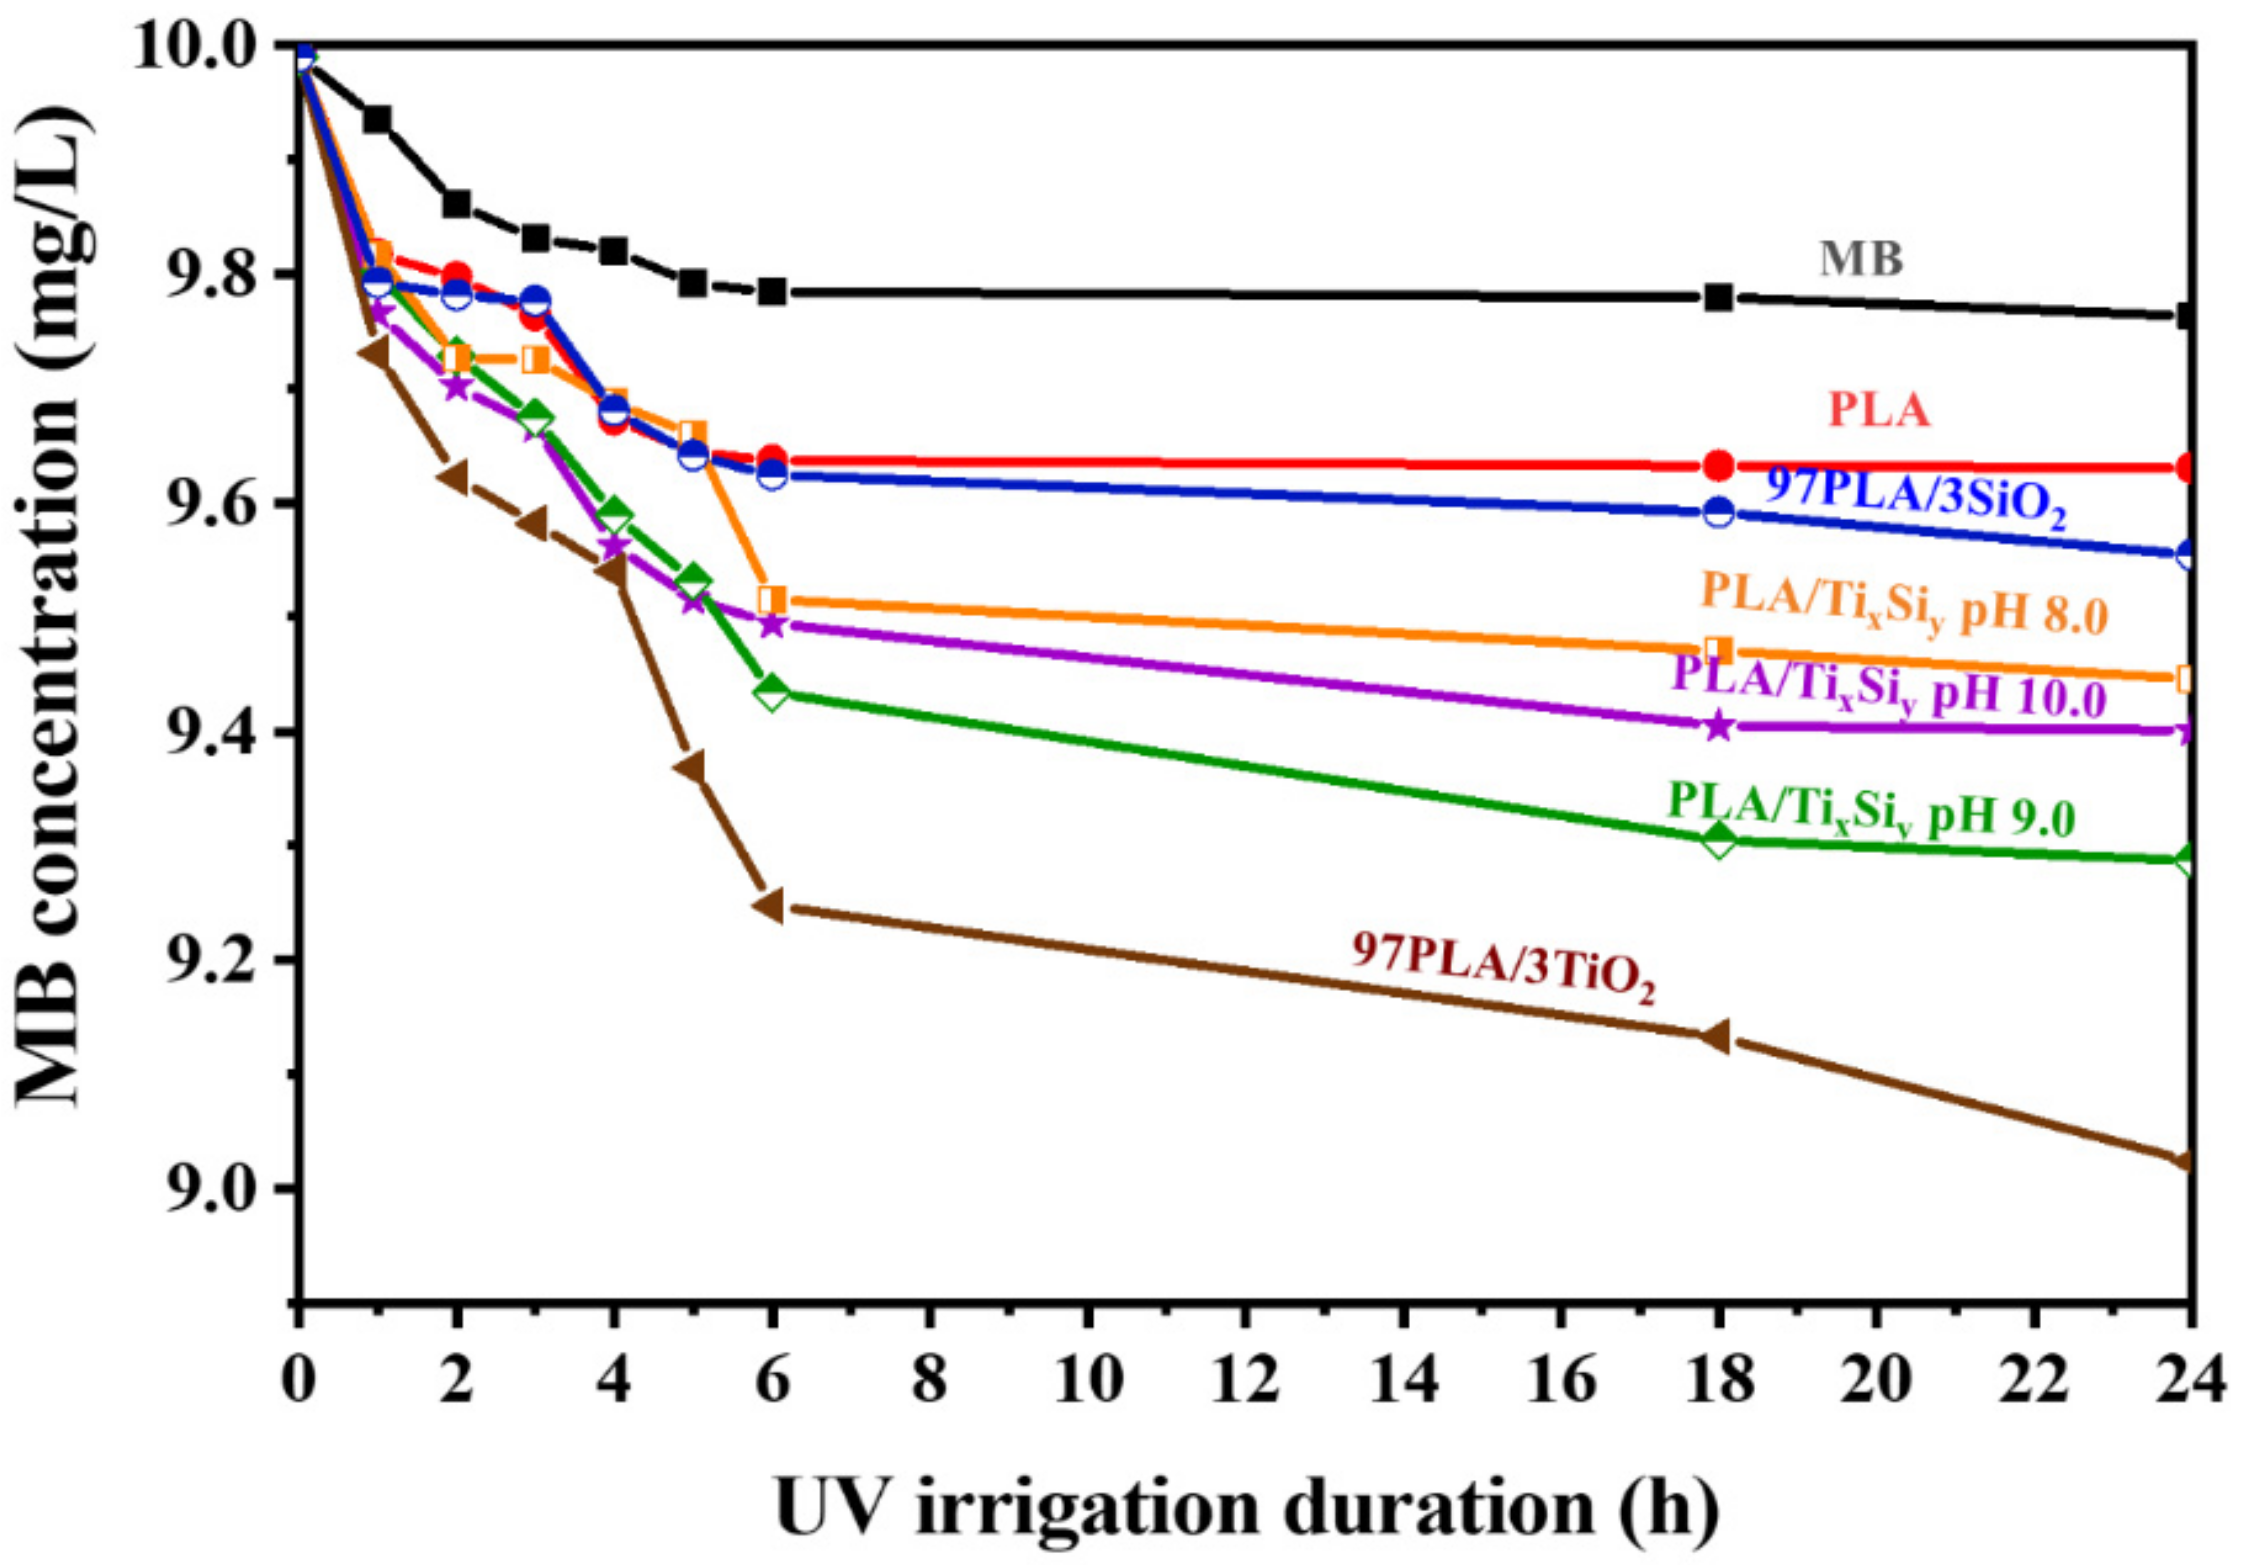
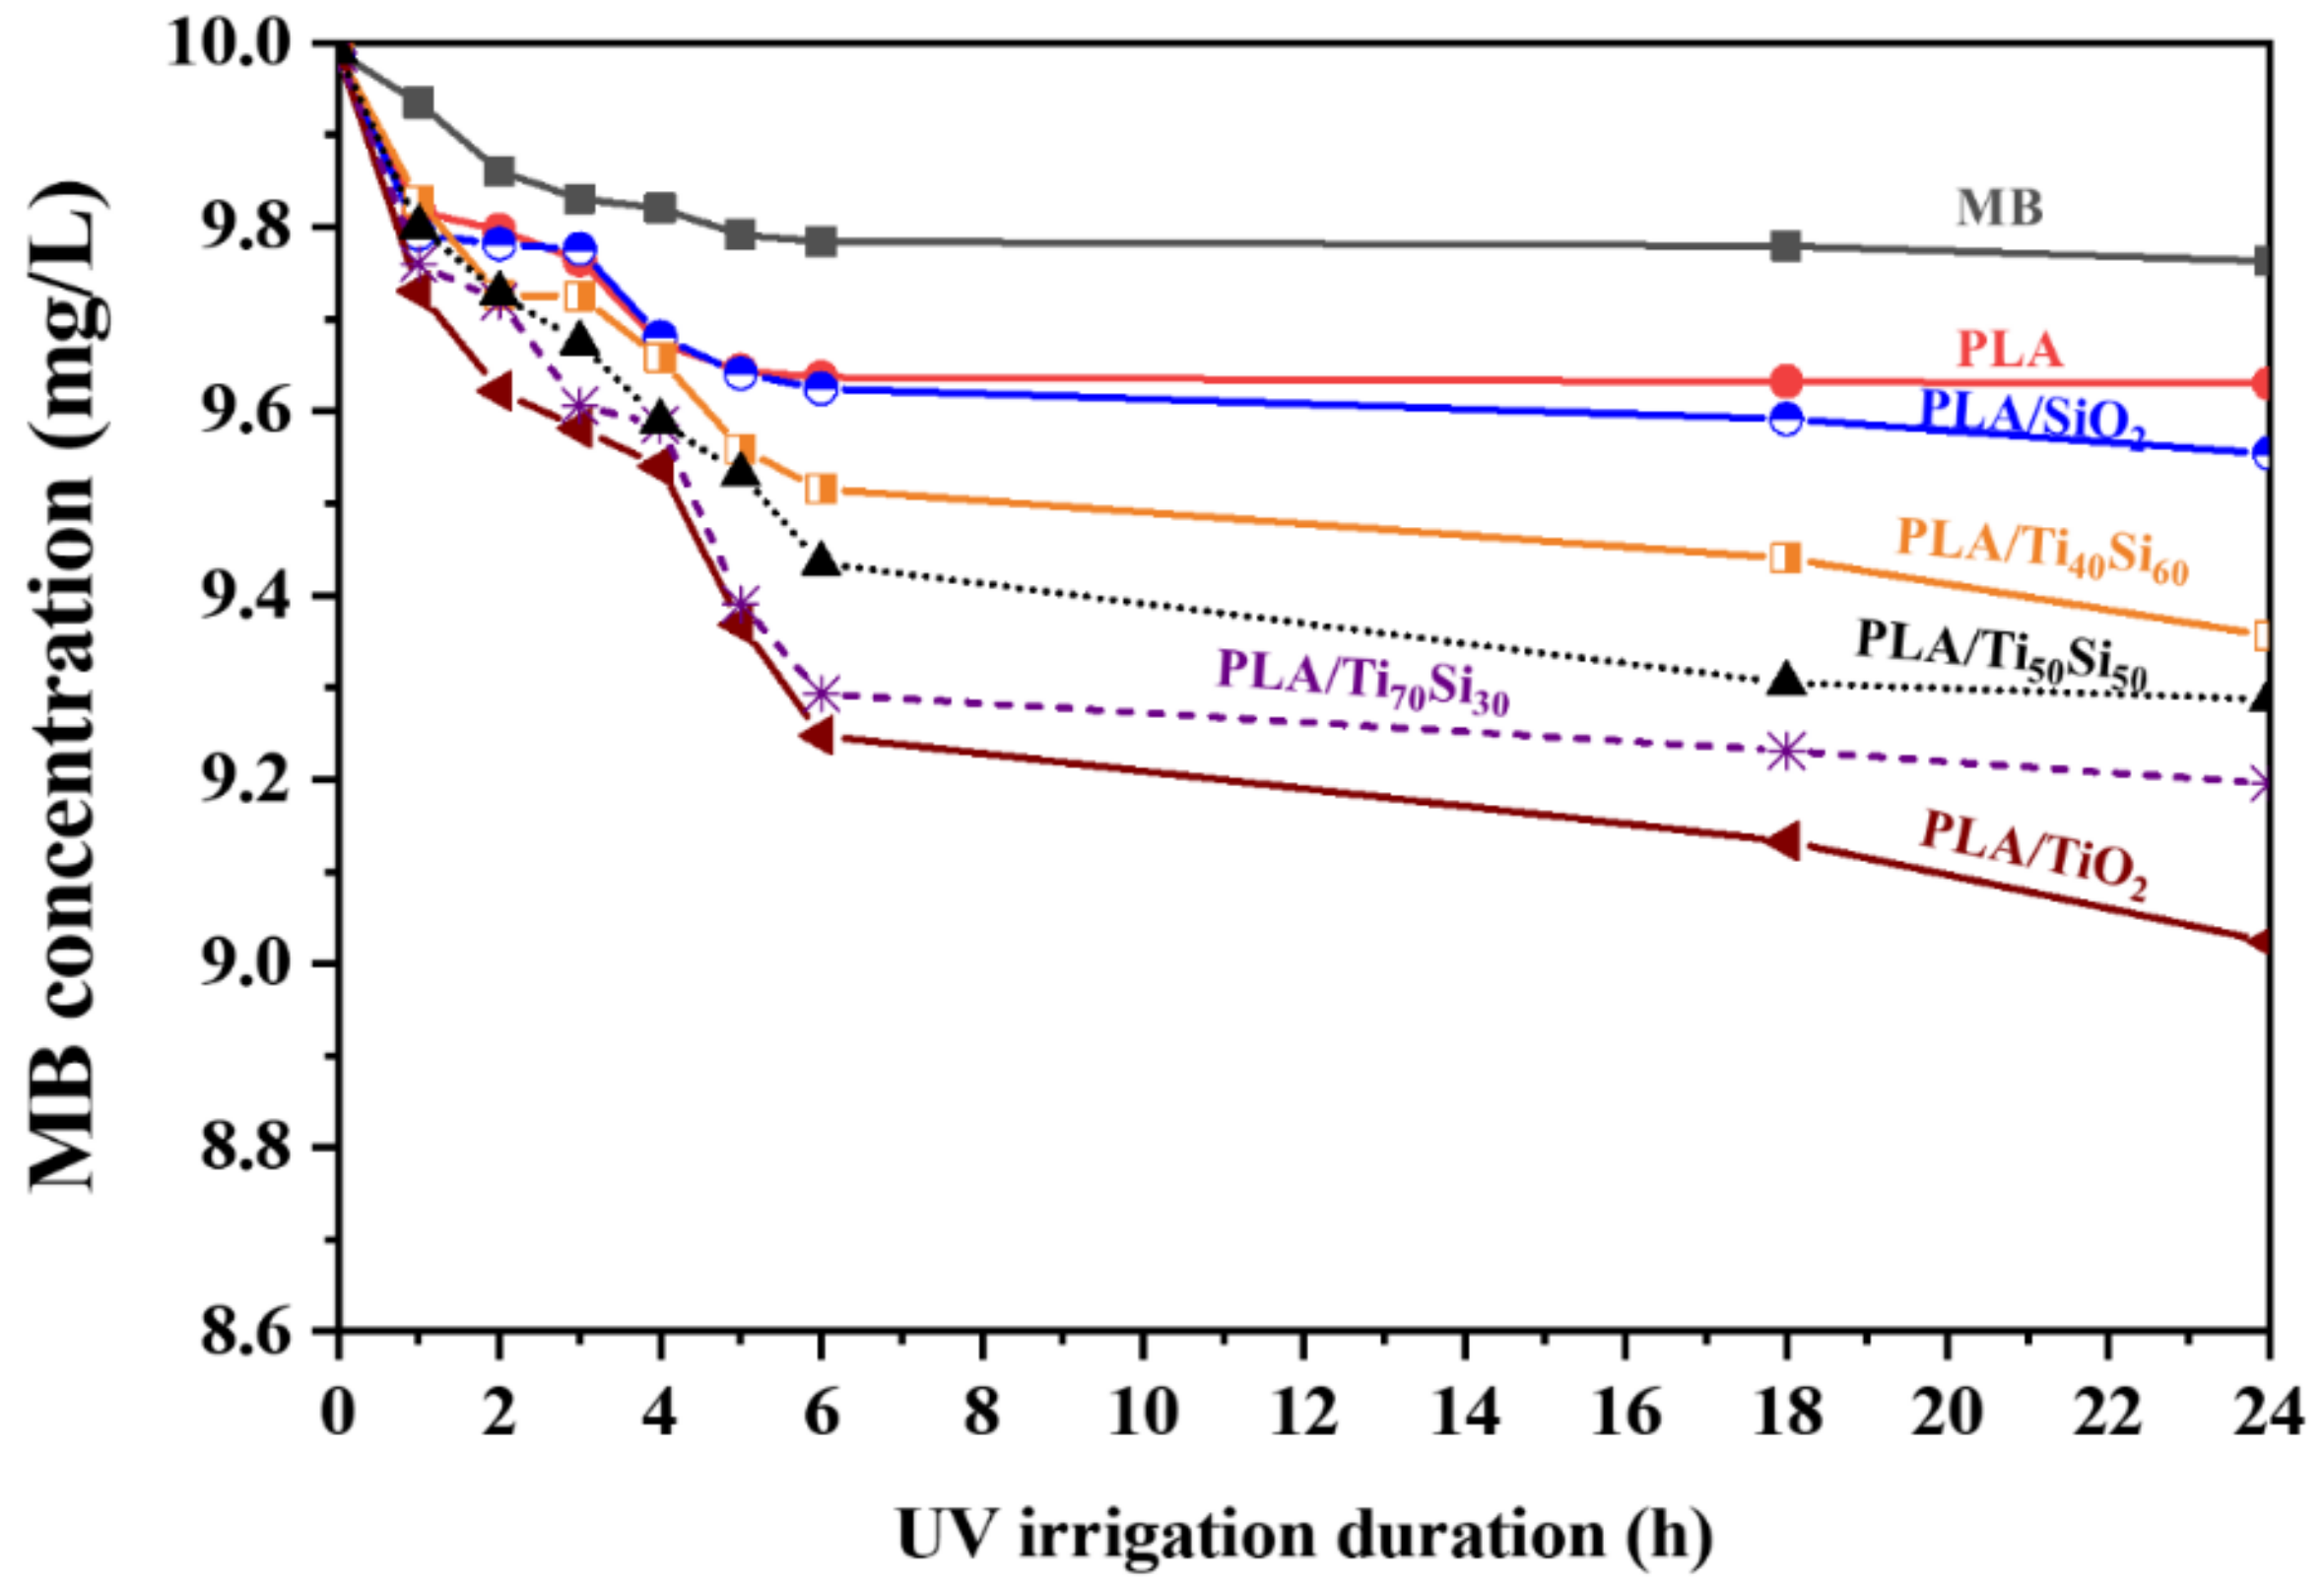
2.3.9. Photocatalytic Activity Characterization
3. Results
3.1. Effect of pH
3.2. Effect of Ti/Si Ratio
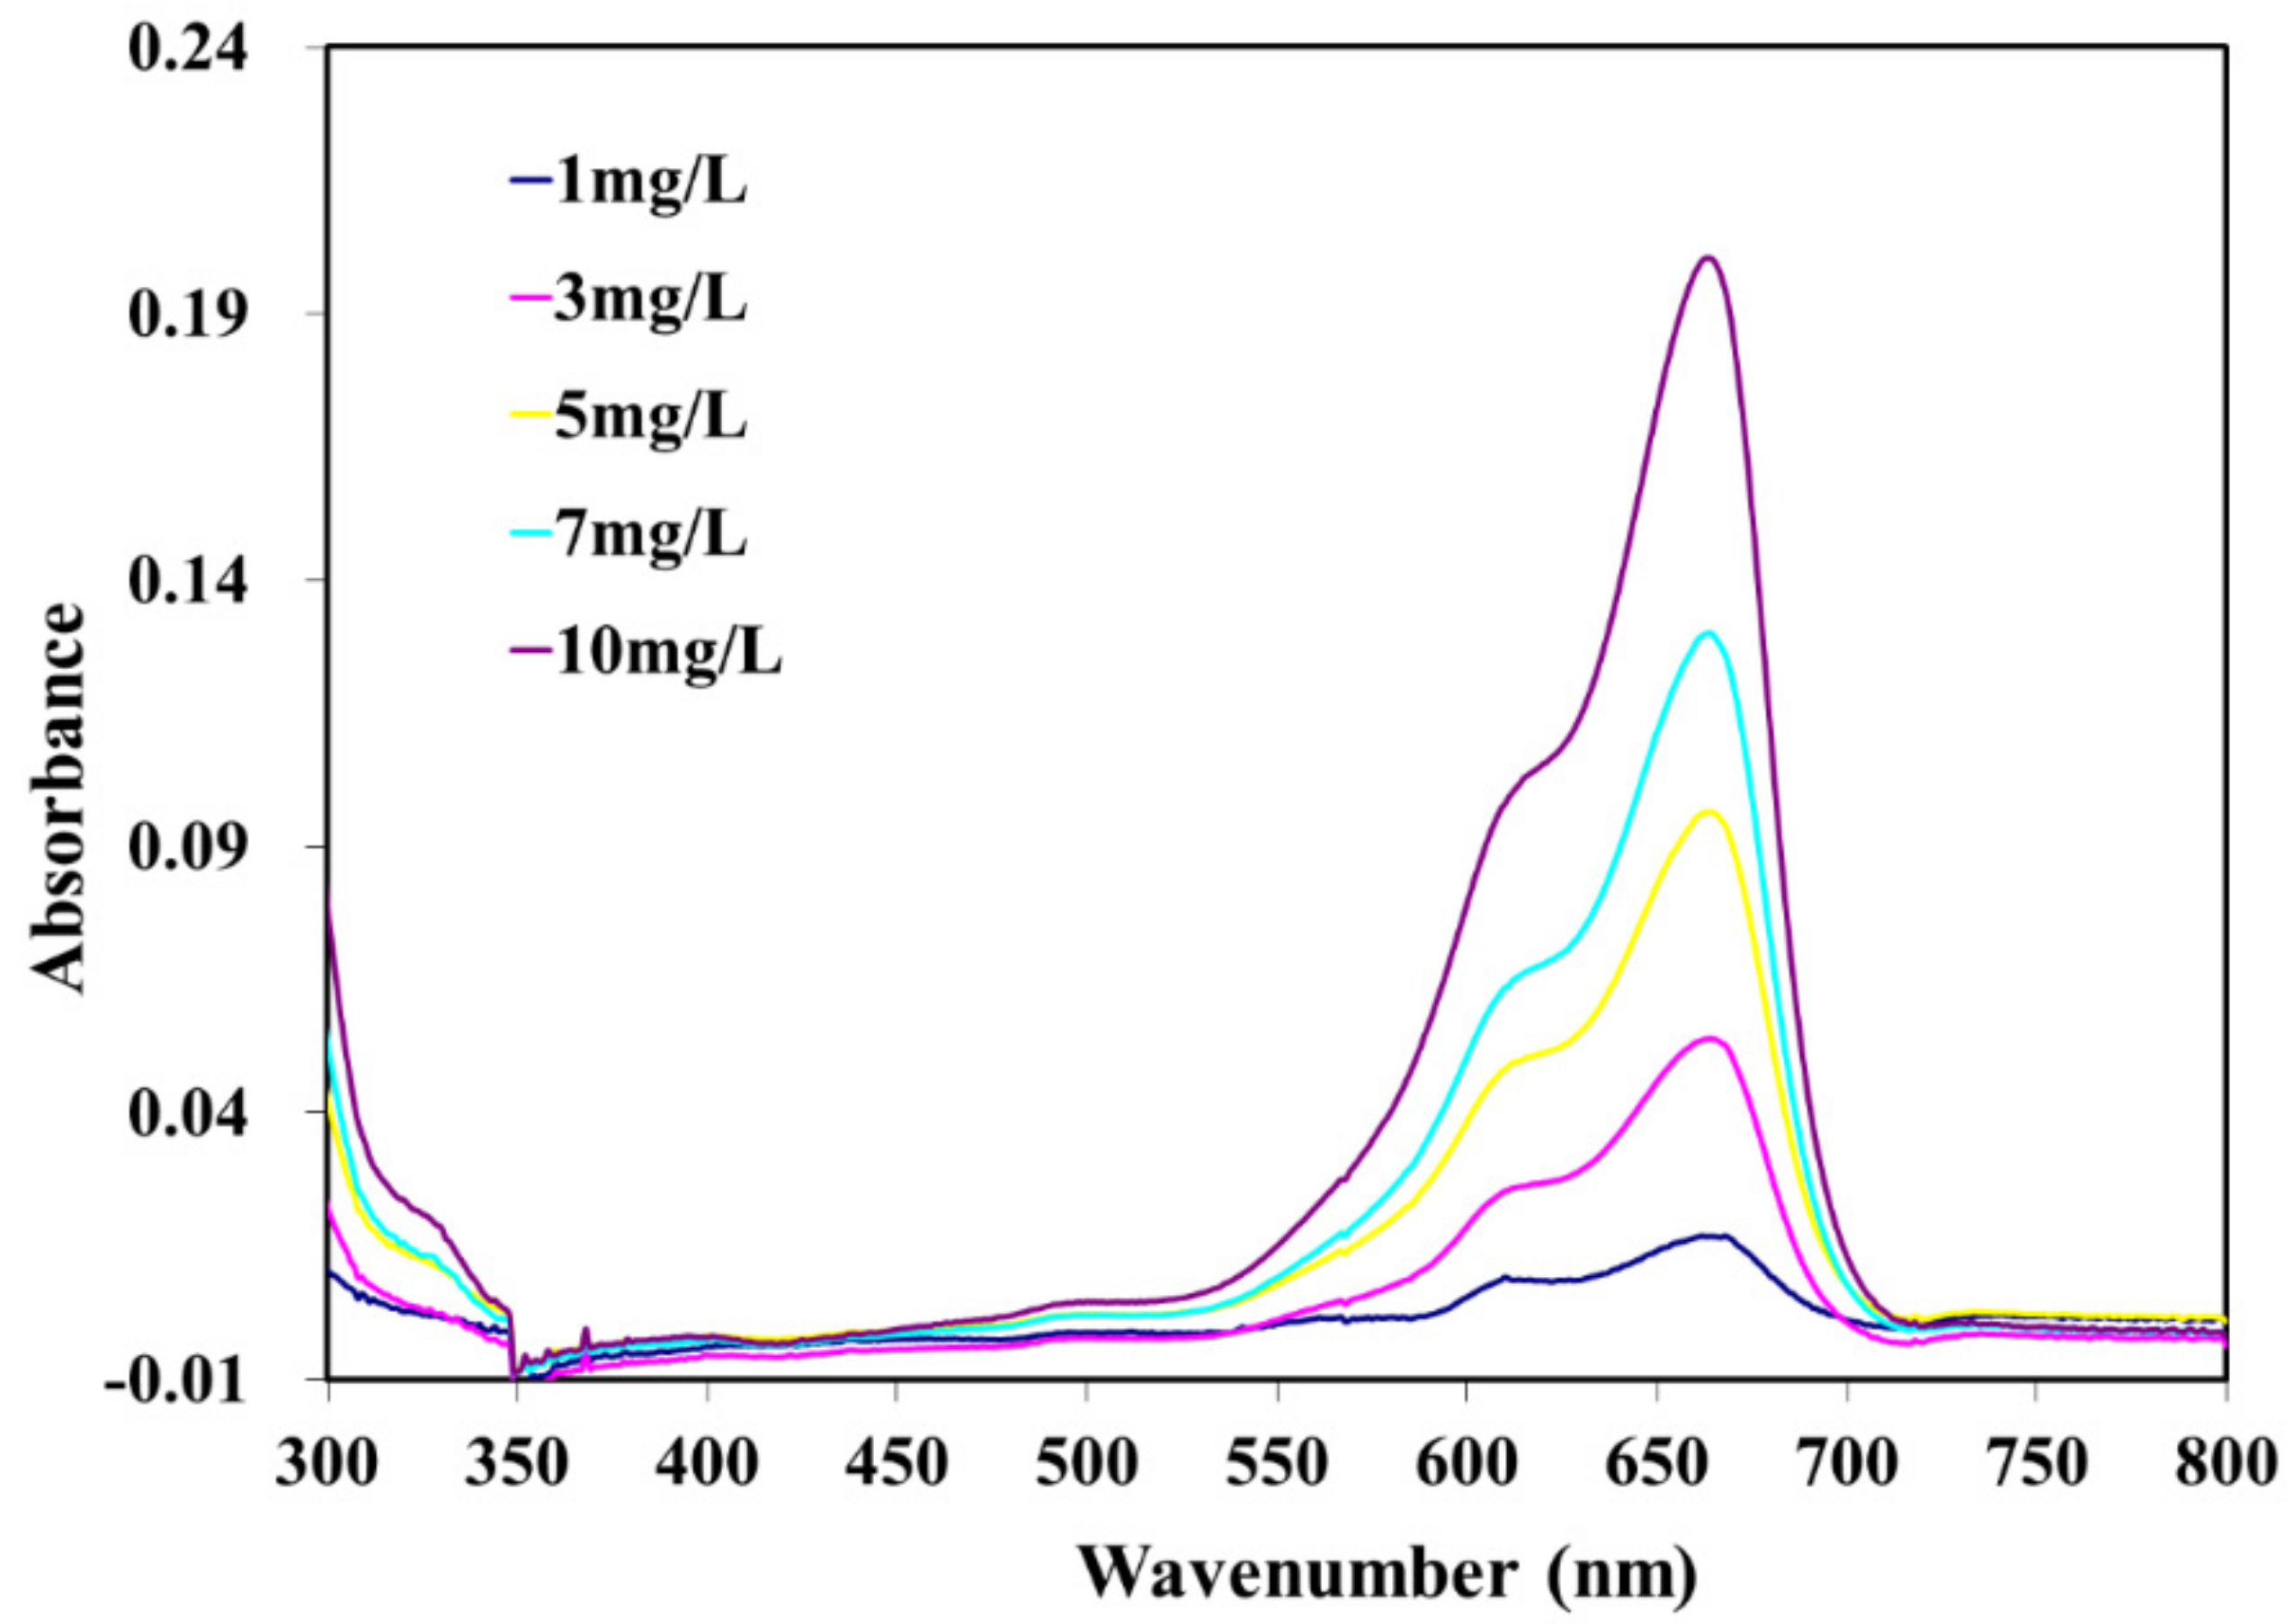
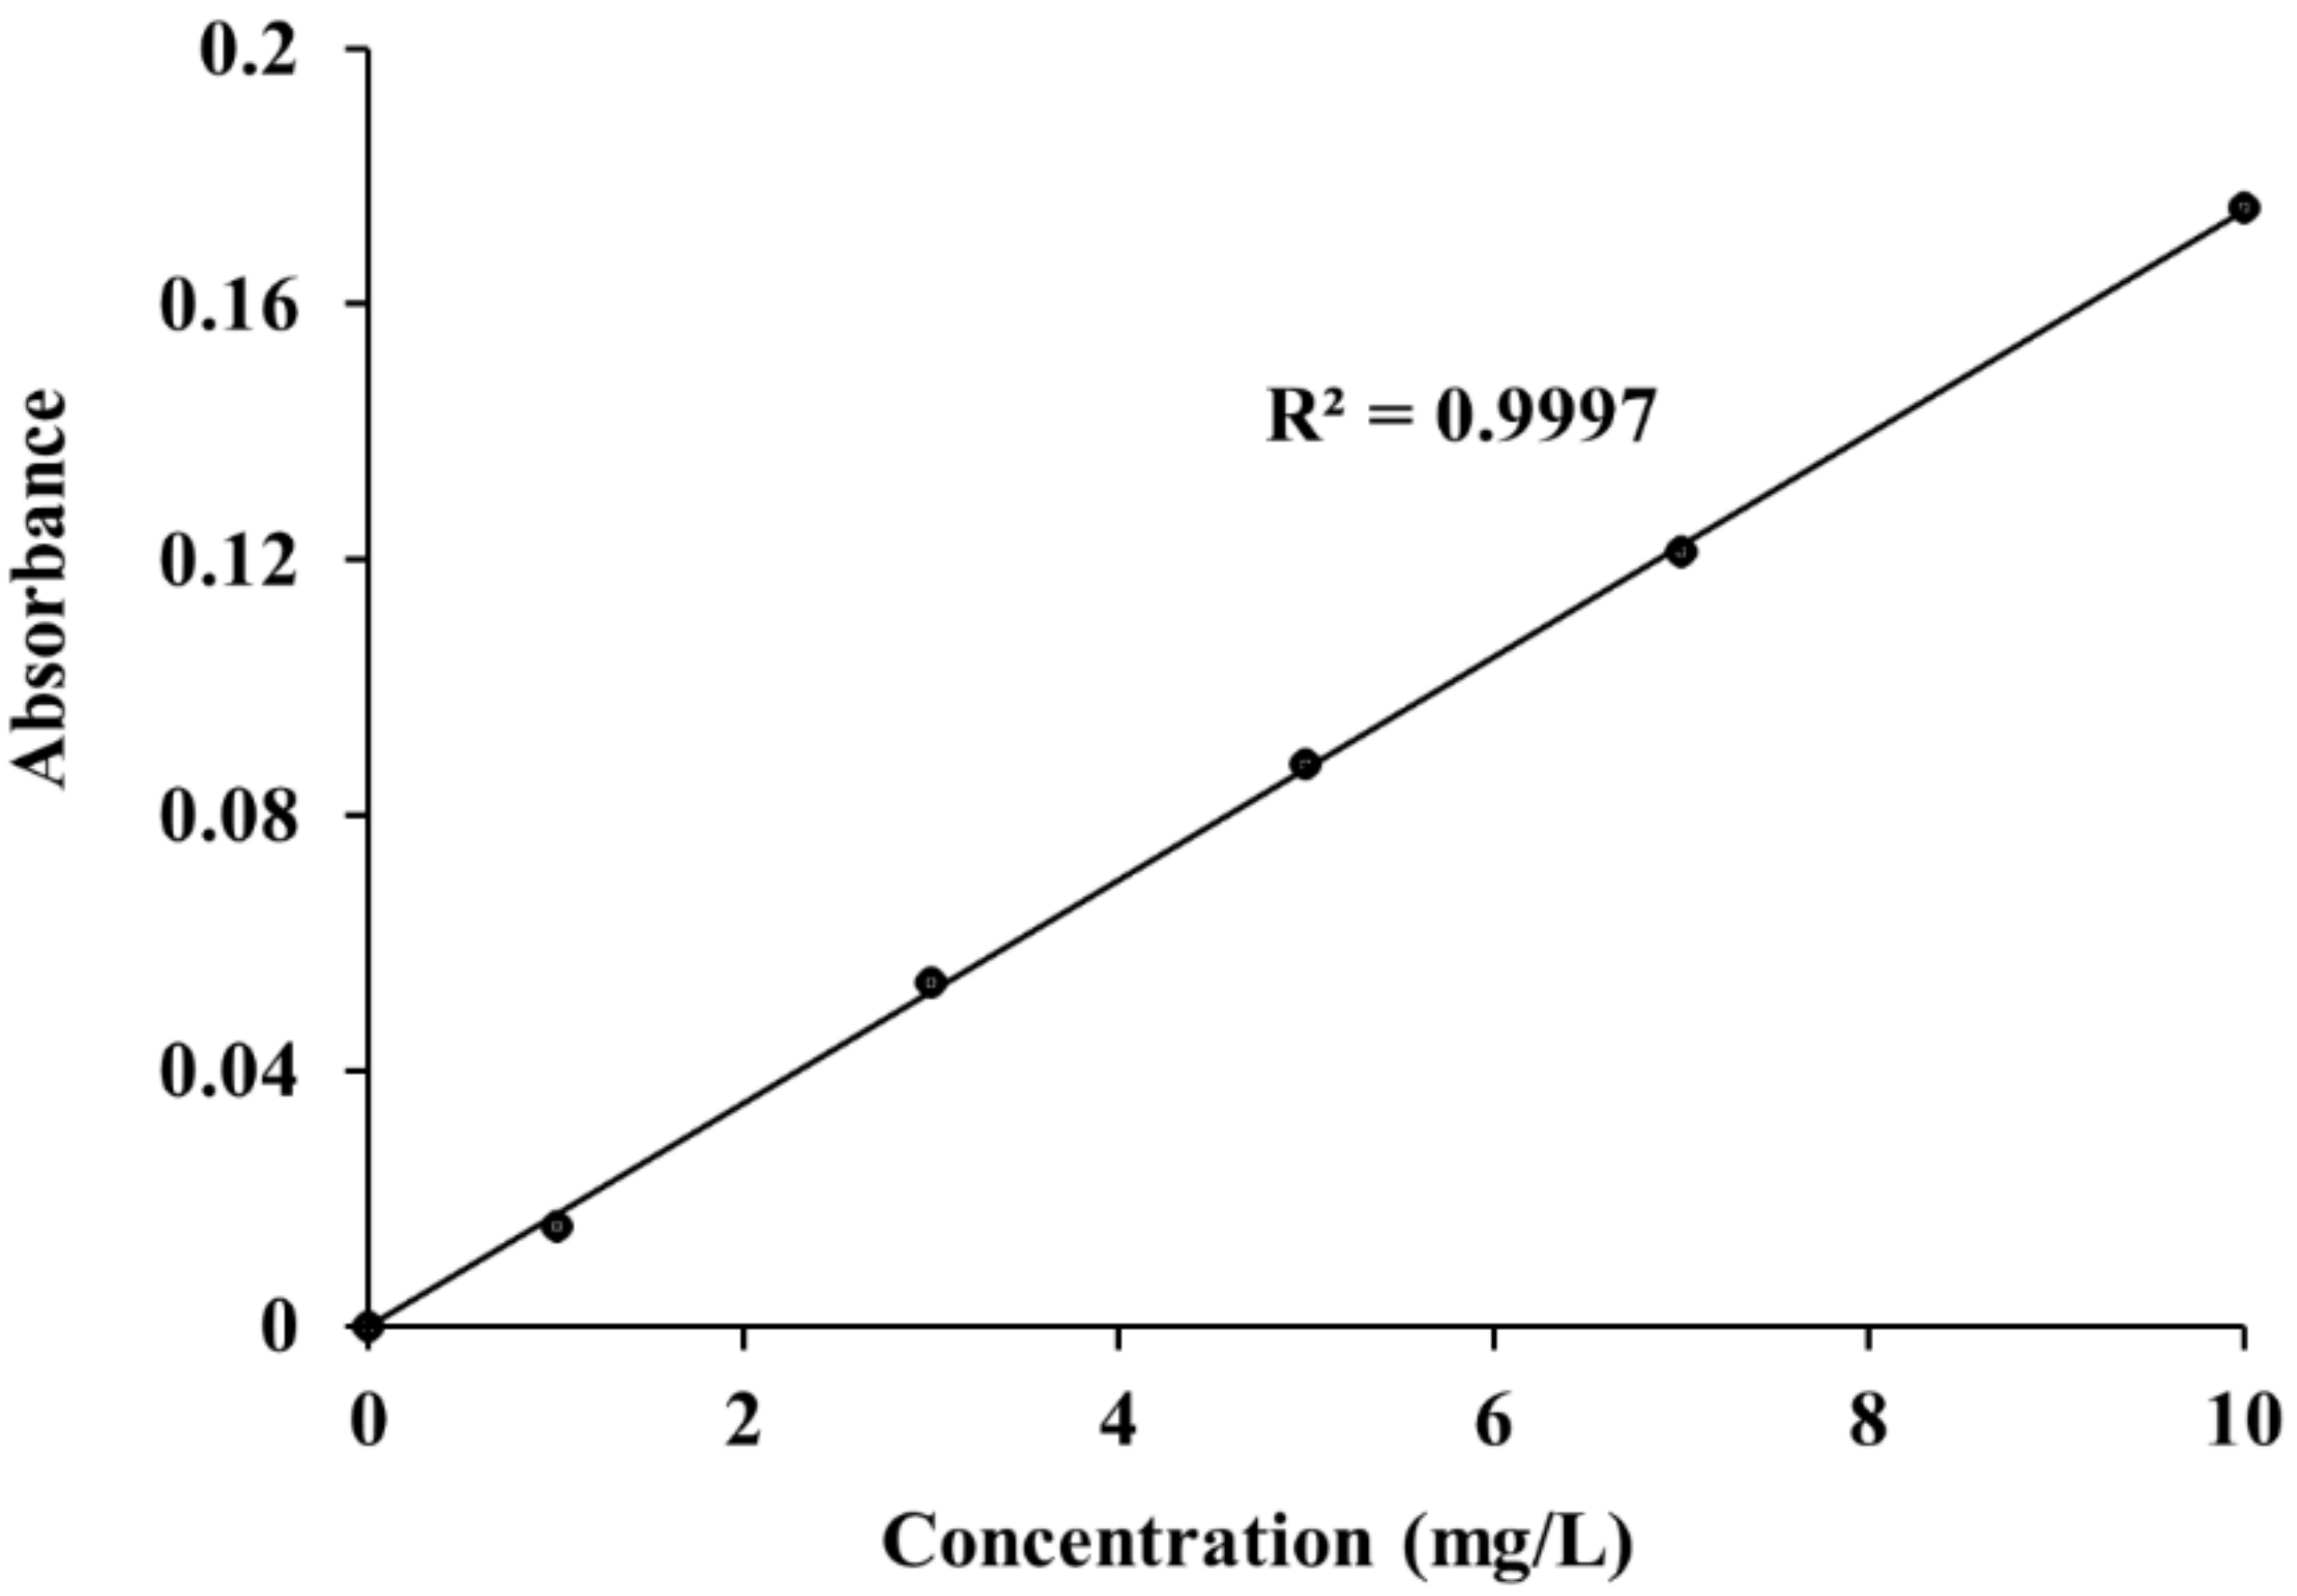
3.3. Photocatalytic Degradation of Methylene Blue (MB)
4. Conclusions
Author Contributions
Funding
Institutional Review Board Statement
Informed Consent Statement
Data Availability Statement
Acknowledgments
Conflicts of Interest
References
- Rasalingam, S.; Peng, R.; Koodali, R.T. Review Article: Removal of Hazardous Pollutants from Wastewaters: Applications of TiO2-SiO2 Mixed Oxide Materials. J. Nanomater. 2014, 2014, 1–42. [Google Scholar] [CrossRef] [Green Version]
- Wang, X.; Xue, J.; Wang, X.; Liu, X. Heterogeneous Ag-TiO2-SiO2 composite materials as novel catalytic systems for selective epoxidation of cyclohexene byH2O2. PLoS ONE 2017, 12, e0176332. [Google Scholar] [CrossRef]
- Sahu, D.R.; Hong, L.Y.; Wang, S.-C.; Huang, J.-L. Synthesis, analysis and characterization of ordered mesoporous TiO2/SBA-15 matrix: Effect of calcination temperature. Microporous Mesoporous Mater. 2009, 117, 640–649. [Google Scholar] [CrossRef]
- Petronella, F.; Pagliarulo, A.; Truppi, A.; Lettieri, M.; Masieri, M.; Calia, A.; Curri, M.L.; Comparelli, R. TiO2 Nanocrystal Based Coatings for the Protection of Architectural Stone: The Effect of Solvents in the Spray-Coating Application for a Self-Cleaning Surfaces. Coatings 2018, 8, 356. [Google Scholar] [CrossRef] [Green Version]
- Zhu, Y.; Buonocore, G.G.; Lavorgna, M. Photocatalytic activity of PLA/TIO2 nanocomposites and TIO2-active multilayered hybrid coatings. Ital. J. Food Sci. 2012, 24, 102–106. [Google Scholar]
- Tiainen, H.D.; Wiedmer, H.; Haugen, J. Processing of highly porous TiO2 bone scaffolds with improved compressive strength. J. Eur. Ceram. Soc. 2013, 33, 15–24. [Google Scholar] [CrossRef]
- Chen, L.; Zheng, K.; Liu, Y. Geopolymer-supported photocatalytic TiO2 film: Preparation and characterization. Constr. Build. Mater. 2017, 151, 63–70. [Google Scholar] [CrossRef]
- Allodi, V.; Brutti, S.; Giarola, M.; Sgambetterra, M.; Navarra, M.A.; Panero, S.; Mariotto, G. Structural and Spectroscopic Characterization of a Nanosized Sulfated TiO2 Filler and of Nanocomposite Nafion Membranes. Polymers 2016, 8, 68. [Google Scholar] [CrossRef] [Green Version]
- Bertuna, A.; Comini, E.; Poli, N.; Zappa, D.; Sberveglieri, G. Titanium Dioxide Nanostructures Chemical Sensor. Procedia Eng. 2016, 168, 313–316. [Google Scholar] [CrossRef] [Green Version]
- Zapata, P.A.; Palza, H.; Cruz, L.S.; Lieberwirth, I.; Catalina, F.; Corrales, T.; Rabagliati, F.M. Polyethylene and poly(ethylene-co-1-octadecene) composites with TiO2 based nanoparticles by metallocenic “in situ” polymerization. Polymer 2013, 54, 2690–2698. [Google Scholar] [CrossRef]
- Fonseca, C.; Ochoa, A.; Ulloa, M.T.; Alvarez, E.; Canales, D.; Zapata, P.A. Poly(lactic acid)/TiO2 nanocomposites as alternative biocidal and antifungal materials. Mater. Sci. Eng. C 2015, 57, 314–320. [Google Scholar] [CrossRef]
- Wu, F.; Lan, X.; Ji, D.; Liu, Z.; Yang, W.; Yang, M. Grafting polymerization of polylactic acid on the surface of nano-SiO2 and properties of PLA/PLA-grafted-SiO2 nanocomposites. J. Appl. Polym. Sci. 2013, 129, 3019–3027. [Google Scholar] [CrossRef]
- Serenko, O.A.; Muzafarov, A.M. Polymer composites with surface modified SiO2 nanoparticles: Structures, properties, and promising applications. Polym. Sci. Ser. C 2016, 58, 93–101. [Google Scholar] [CrossRef]
- Ha, S.-W.; Weitzmann, M.N.; Beck, G.R., Jr. Chapter 4—Dental and Skeletal Applications of Silica-Based Nanomaterials A2—Subramani, Karthikeyan. In Nanobiomaterials in Clinical Dentistry; Ahmed, W., Hartsfield, J.K., Eds.; William Andrew Publishing: Norwich, NY, USA, 2013; pp. 69–91. [Google Scholar]
- Gao, X.; Wachs, I.E. Titania–silica as catalysts: Molecular structural characteristics and physico-chemical properties. Catal. Today 1999, 51, 233–254. [Google Scholar] [CrossRef]
- Pabón, E.; Retuert, J.; Quijada, R.; Zarate, A. TiO2–SiO2 mixed oxides prepared by a combined sol–gel and polymer inclusion method. Microporous Mesoporous Mater. 2004, 67, 195–203. [Google Scholar] [CrossRef]
- Pabón, E.; Retuert, J.; Quijada, R. Synthesis of mixed silica–titania by the sol–gel method using polyethylenimine: Porosity and catalytic properties. J. Porous Mater. 2007, 14, 151–158. [Google Scholar]
- Milne, C.J.; Penfold, T.J.; Chergui, M. Recent experimental and theoretical developments in time-resolved X-ray spectroscopies. Coord. Chem. Rev. 2014, 277–278, 44–68. [Google Scholar]
- Niltharach, A.; Kityakarn, S.; Worayingyong, A.; Thienprasert, J.T.; Klysubun, W.; Songsiriritthigul, P.; Limpijumnong, S. Structural characterizations of sol–gel synthesized TiO2 and Ce/TiO2 nanostructures. Phys. B Condens. Matter 2012, 407, 2915–2918. [Google Scholar] [CrossRef]
- Kim, W.B.; Choi, S.H.; Lee, J.S. Quantitative Analysis of Ti−O−Si and Ti−O−Ti Bonds in Ti−Si Binary Oxides by the Linear Combination of XANES. J. Phys. Chem. B 2000, 104, 8670–8678. [Google Scholar] [CrossRef]
- Matsuo, S.; Sakaguchi, N.; Wakita, H. Pre-edge features of Ti K-edge X-ray absorption near-edge structure for the local structure of sol-gel titanium oxides. Anal. Sci. 2005, 21, 805–809. [Google Scholar] [CrossRef] [Green Version]
- Alias, S.S.; Mohamad, A.A. ZnO: Effect of pH on the Sol–Gel Process. In Synthesis of Zinc Oxide by Sol–Gel Method for Photoelectrochemical Cells; SpringerBriefs in Materials; Springer: Singapore, 2014; pp. 9–25. [Google Scholar]
- Kim, T.G.; An, G.S.; Han, J.S.; Hur, J.U.; Park, B.G.; Choi, S.-C. Synthesis of Size Controlled Spherical Silica Nanoparticles via Sol-Gel Process within Hydrophilic Solvent. J. Korean Ceram. Soc. 2017, 54, 49–54. [Google Scholar] [CrossRef] [Green Version]
- Karkare, M.M. Choice of precursor not affecting the size of anatase TiO2 nanoparticles but affecting morphology under broader view. Int. Nano Lett. 2014, 4, 111. [Google Scholar] [CrossRef] [Green Version]
- Klysubun, W.; Tarawarakarn, P.; Thamsanong, N.; Amonpattaratkit, P.; Cholsuk, C.; Lapboonrueng, S.; Chaichuay, S.; Wongtepa, W. Upgrade of SLRI BL8 beamline for XAFS spectroscopy in a photon energy range of 1–13 keV. Radiat. Phys. Chem. 2020, 175, 108145. [Google Scholar] [CrossRef]
- Ravel, B.; Newville, M. THENA, ARTEMIS, HEPHAESTUS: Data analysis for X-ray absorption spectroscopy using IFEFFIT. J. Synchrotron Radiat. 2005, 12, 537–541. [Google Scholar] [CrossRef] [Green Version]
- Schraml-Marth, M.; Walther, K.L.; Wokaun, A.; Handy, B.E.; Baiker, A. Porous silica gels and TiO2/SiO2 mixed oxides prepared via the sol-gel process: Characterization by spectroscopic techniques. J. Non-Cryst. Solids 1992, 143, 93–111. [Google Scholar] [CrossRef]
- Degirmenci, V.; Erdem, Ö.F.; Ergun, O.; Yilmaz, A.; Michel, D.; Uner, D. Synthesis and NMR Characterization of Titanium and Zirconium Oxides Incorporated in SBA-15. Top. Catal. 2008, 49, 204–208. [Google Scholar] [CrossRef]
- Dirken, P.J.; Smith, M.E.; Whitfield, H.J. 17O and 29Si Solid State NMR Study of Atomic Scale Structure in Sol-Gel-Prepared TiO2-SiO2 Materials. J. Phys. Chem. 1995, 99, 395–401. [Google Scholar] [CrossRef]
- Zeitler, V.A.; Brown, C.A. The Infrared Spectra of Some Ti–O–Si, Ti–O–Ti and Si–O–Si Compounds. J. Phys. Chem. 1957, 61, 1174–1177. [Google Scholar] [CrossRef]
- Praveen, P. Structural, Functional and Optical Characters of TiO2 Nanocrystallites: Anatase and Rutile Phases. St.Joseph’s J. Humanit. Sci. 2019, 6, 43–53. [Google Scholar]
- Chen, Y.-F.; Lee, C.-Y.; Yeng, M.-Y.; Chiu, H.-T. The effect of calcination temperature on the crystallinity of TiO2 nanopowders. J. Cryst. Growth 2003, 247, 363–370. [Google Scholar] [CrossRef]
- Vasquez, J.; Lozano, H.; Lavayen, V.; Lira-Cantú, M.; Gómez-Romero, P.; Santa Ana, M.A.; Benavente, E.; Gonzalez, G. High-yield preparation of titanium dioxide nanostructures by hydrothermal conditions. J. Nanosci. Nanotechnol. 2009, 9, 1103–1107. [Google Scholar] [CrossRef] [Green Version]
- Yamashita, H.; Kawasaki, S.; Ichihashi, Y.; Harada, M.; Takeuchi, M.; Anpo, M.; Stewart, G.; Fox, M.A.; Louis, C.; Che, M. Characterization of Titanium−Silicon Binary Oxide Catalysts Prepared by the Sol−Gel Method and Their Photocatalytic Reactivity for the Liquid-Phase Oxidation of 1-Octanol. J. Phys. Chem. B 1998, 102, 5870–5875. [Google Scholar] [CrossRef]
- Vives, S.; Meunier, C. Influence of the synthesis route on sol–gel SiO2–TiO2 (1:1) xerogels and powders. Ceram. Int. 2008, 34, 37–44. [Google Scholar] [CrossRef]
- Yu, H.-F.; Wang, S.-M. Effects of water content and pH on gel-derived TiO2–SiO2. J. Non-Cryst. Solids 2000, 261, 260–267. [Google Scholar] [CrossRef]
- Yoldas, B.E. Formation of titania-silica glasses by low temperature chemical polymerization. J. Non-Cryst. Solids 1980, 38, 81–86. [Google Scholar] [CrossRef]
- Alias, S.S.; Ismail, A.B.; Mohamad, A.A. Effect of pH on ZnO nanoparticle properties synthesized by sol–gel centrifugation. J. Alloys Compd. 2010, 499, 231–237. [Google Scholar] [CrossRef]
- Wu, L.; Wu, Y.; Lü, Y. Self-assembly of small ZnO nanoparticles toward flake-like single crystals. Mater. Res. Bull. 2006, 41, 128–133. [Google Scholar] [CrossRef]
- Etacheri, V.; Di Valentin, C.; Schneider, J.; Bahnemann, D.; Pillai, S.C. Visible-light activation of TiO2 photocatalysts: Advances in theory and experiments. J. Photochem. Photobiol. C Photochem. Rev. 2015, 25, 1–29. [Google Scholar] [CrossRef] [Green Version]
- Li Hsiung, T.; Paul Wang, H.; Wang, H.C. XANES studies of photocatalytic active species in nano TiO2–SiO2. Radiat. Phys. Chem. 2006, 75, 2042–2045. [Google Scholar] [CrossRef]
- Rossi, T.C.; Grolimund, D.; Nachtegaal, M.; Cannelli, O.; Mancini, G.F.; Bacellar, C.; Kinschel, D.; Rouxel, J.R.; Ohannessian, N.; Pergolesi, D.; et al. X-ray absorption linear dichroism at the Ti K-edge of anatase TiO2 single crystals. Phys. Rev. B 2019, 100, 245207. [Google Scholar] [CrossRef] [Green Version]
- Farges, F.; Brown, G.E.; Rehr, J.J. Ti K-edge XANES studies of Ti coordination and disorder in oxide compounds: Comparison between theory and experiment. Phys. Rev. B 1997, 56, 1809–1819. [Google Scholar] [CrossRef]
- Davis, R.J.; Liu, Z. Titania−Silica: A Model Binary Oxide Catalyst System. Chem. Mater. 1987, 9, 2311–2324. [Google Scholar] [CrossRef]
- Sharma, A.; Varshney, M.; Park, J.; Ha, T.-K.; Chae, K.-H.; Shin, H.-J. XANES, EXAFS and photocatalytic investigations on copper oxide nanoparticles and nanocomposites. RSC Adv. 2015, 5, 21762–21771. [Google Scholar] [CrossRef]
- Khemthong, P.; Photai, P.; Grisdanurak, N. Structural properties of CuO/TiO2 nanorod in relation to their catalytic activity for simultaneous hydrogen production under solar light. Int. J. Hydrogen Energy 2013, 38, 15992–16001. [Google Scholar] [CrossRef]
- Loshmanov, A.A.; Sigaev, V.N.; Khodakovskaya, R.Y.; Pavlushkin, N.M.; Yamzin, I.I. Small-angle neutron scattering on silica glasses containing titania. J. Appl. Crystallogr. 1974, 7, 207–210. [Google Scholar] [CrossRef]
- Sandstrom, D.R.; Lytle, F.W.; Wei, P.S.P.; Greegor, R.B.; Wong, J.; Schultz, P. Coordination of Ti in TiO2–SiO2 glass by X-ray absorption spectroscopy. J. Non-Cryst. Solids 1980, 41, 201–207. [Google Scholar] [CrossRef]
- Neurock, M.; Manzer, L.E. Theoretical insights on the mechanism of alkene epoxidation by H2O2 with titanium silicalite. Chem. Commun. 1996, 10, 1133–1134. [Google Scholar] [CrossRef]
- Scherk, C.G.; Ostermann, A.; Achterhold, K.; Iakovleva, O.; Nazikkol, C.; Krebs, B.; Knapp, E.W.; Meyer-Klaucke, W.; Parak, F.G. The X-ray absorption spectroscopy Debye-Waller factors of an iron compound and of met-myoglobin as a function of temperature. Eur. Biophys. J. 2001, 30, 393–403. [Google Scholar]
- Wellenreuther, G.; Parthasarathy, V.; Meyer-Klaucke, W. Towards a black-box for biological EXAFS data analysis. II. Automatic BioXAS Refinement and Analysis (ABRA). J. Synchrotron Radiat. 2010, 17, 25–35. [Google Scholar] [CrossRef] [Green Version]
- Wu, D.; Zhang, Y.; Yuan, L.; Zhang, M.; Zhou, W. Viscoelastic interfacial properties of compatibilized poly(ε-caprolactone)/polylactide blend. J. Polym. Sci. Part B Polym. Phys. 2010, 48, 756–765. [Google Scholar] [CrossRef]
- Gregg, S.J.; Sing, K.S.W. Adsorption, Surface Area and Porosity Auflage, 2nd ed.; John Wiley & Sons, Ltd: Hoboken, NJ, USA; Academic Press: London, UK, 1982. [Google Scholar]
- Zhang, X.; Zhang, F.; Chan, K.-Y. Synthesis of titania–silica mixed oxide mesoporous materials, characterization and photocatalytic properties. Appl. Catal. A Gen. 2005, 284, 193–198. [Google Scholar] [CrossRef]
- Van Grieken, R.; Aguado, J.; López-Muñoz, M.J.; Marugán, J. Sol-Gel Titania and Titania-Silica Mixed Oxides Photocatalysts. Solid State Phenom. 2010, 162, 221–238. [Google Scholar] [CrossRef]
- Kosuge, K. Titanium-Containing Porous Silica Prepared by a Modified Sol−Gel Method. J. Phys. Chem. B 1999, 103, 3563–3569. [Google Scholar] [CrossRef]


| Samples | TTIP (mol) | TEOS (mol) | C2H5OH (mol) | HCl/NH4OH (mol) | H2O (mol) |
|---|---|---|---|---|---|
| SiO2 | - | 0.120 | 1.889 | 0.060 b | 0.440 |
| Ti50Si50 pH 8.0 | 0.011 | 0.109 | 1.889 | 0.025 b | 0.440 |
| Ti50Si50pH 9.0 | 0.011 | 0.109 | 1.889 | 0.060 b | 0.440 |
| Ti50Si50 pH 10.0 | 0.011 | 0.109 | 1.889 | 0.075 b | 0.440 |
| TiO2 | 0.120 | - | 4.293 | 0.081 a | 0.702 |
| Samples | TTIP (mol) | TEOS (mol) | C2H5OH (mol) | NH4OH/HCl (mol) | H2O (mol) |
|---|---|---|---|---|---|
| SiO2 | - | 0.120 | 1.889 | 0.060 b | 0.440 |
| Ti70Si30 | 0.020 | 0.100 | 1.889 | 0.060 b | 0.440 |
| Ti50Si50 | 0.011 | 0.109 | 1.889 | 0.060 b | 0.440 |
| Ti40Si60 | 0.008 | 0.112 | 1.889 | 0.060 b | 0.440 |
| TiO2 | 0.120 | - | 4.293 | 0.081 a | 0.702 |
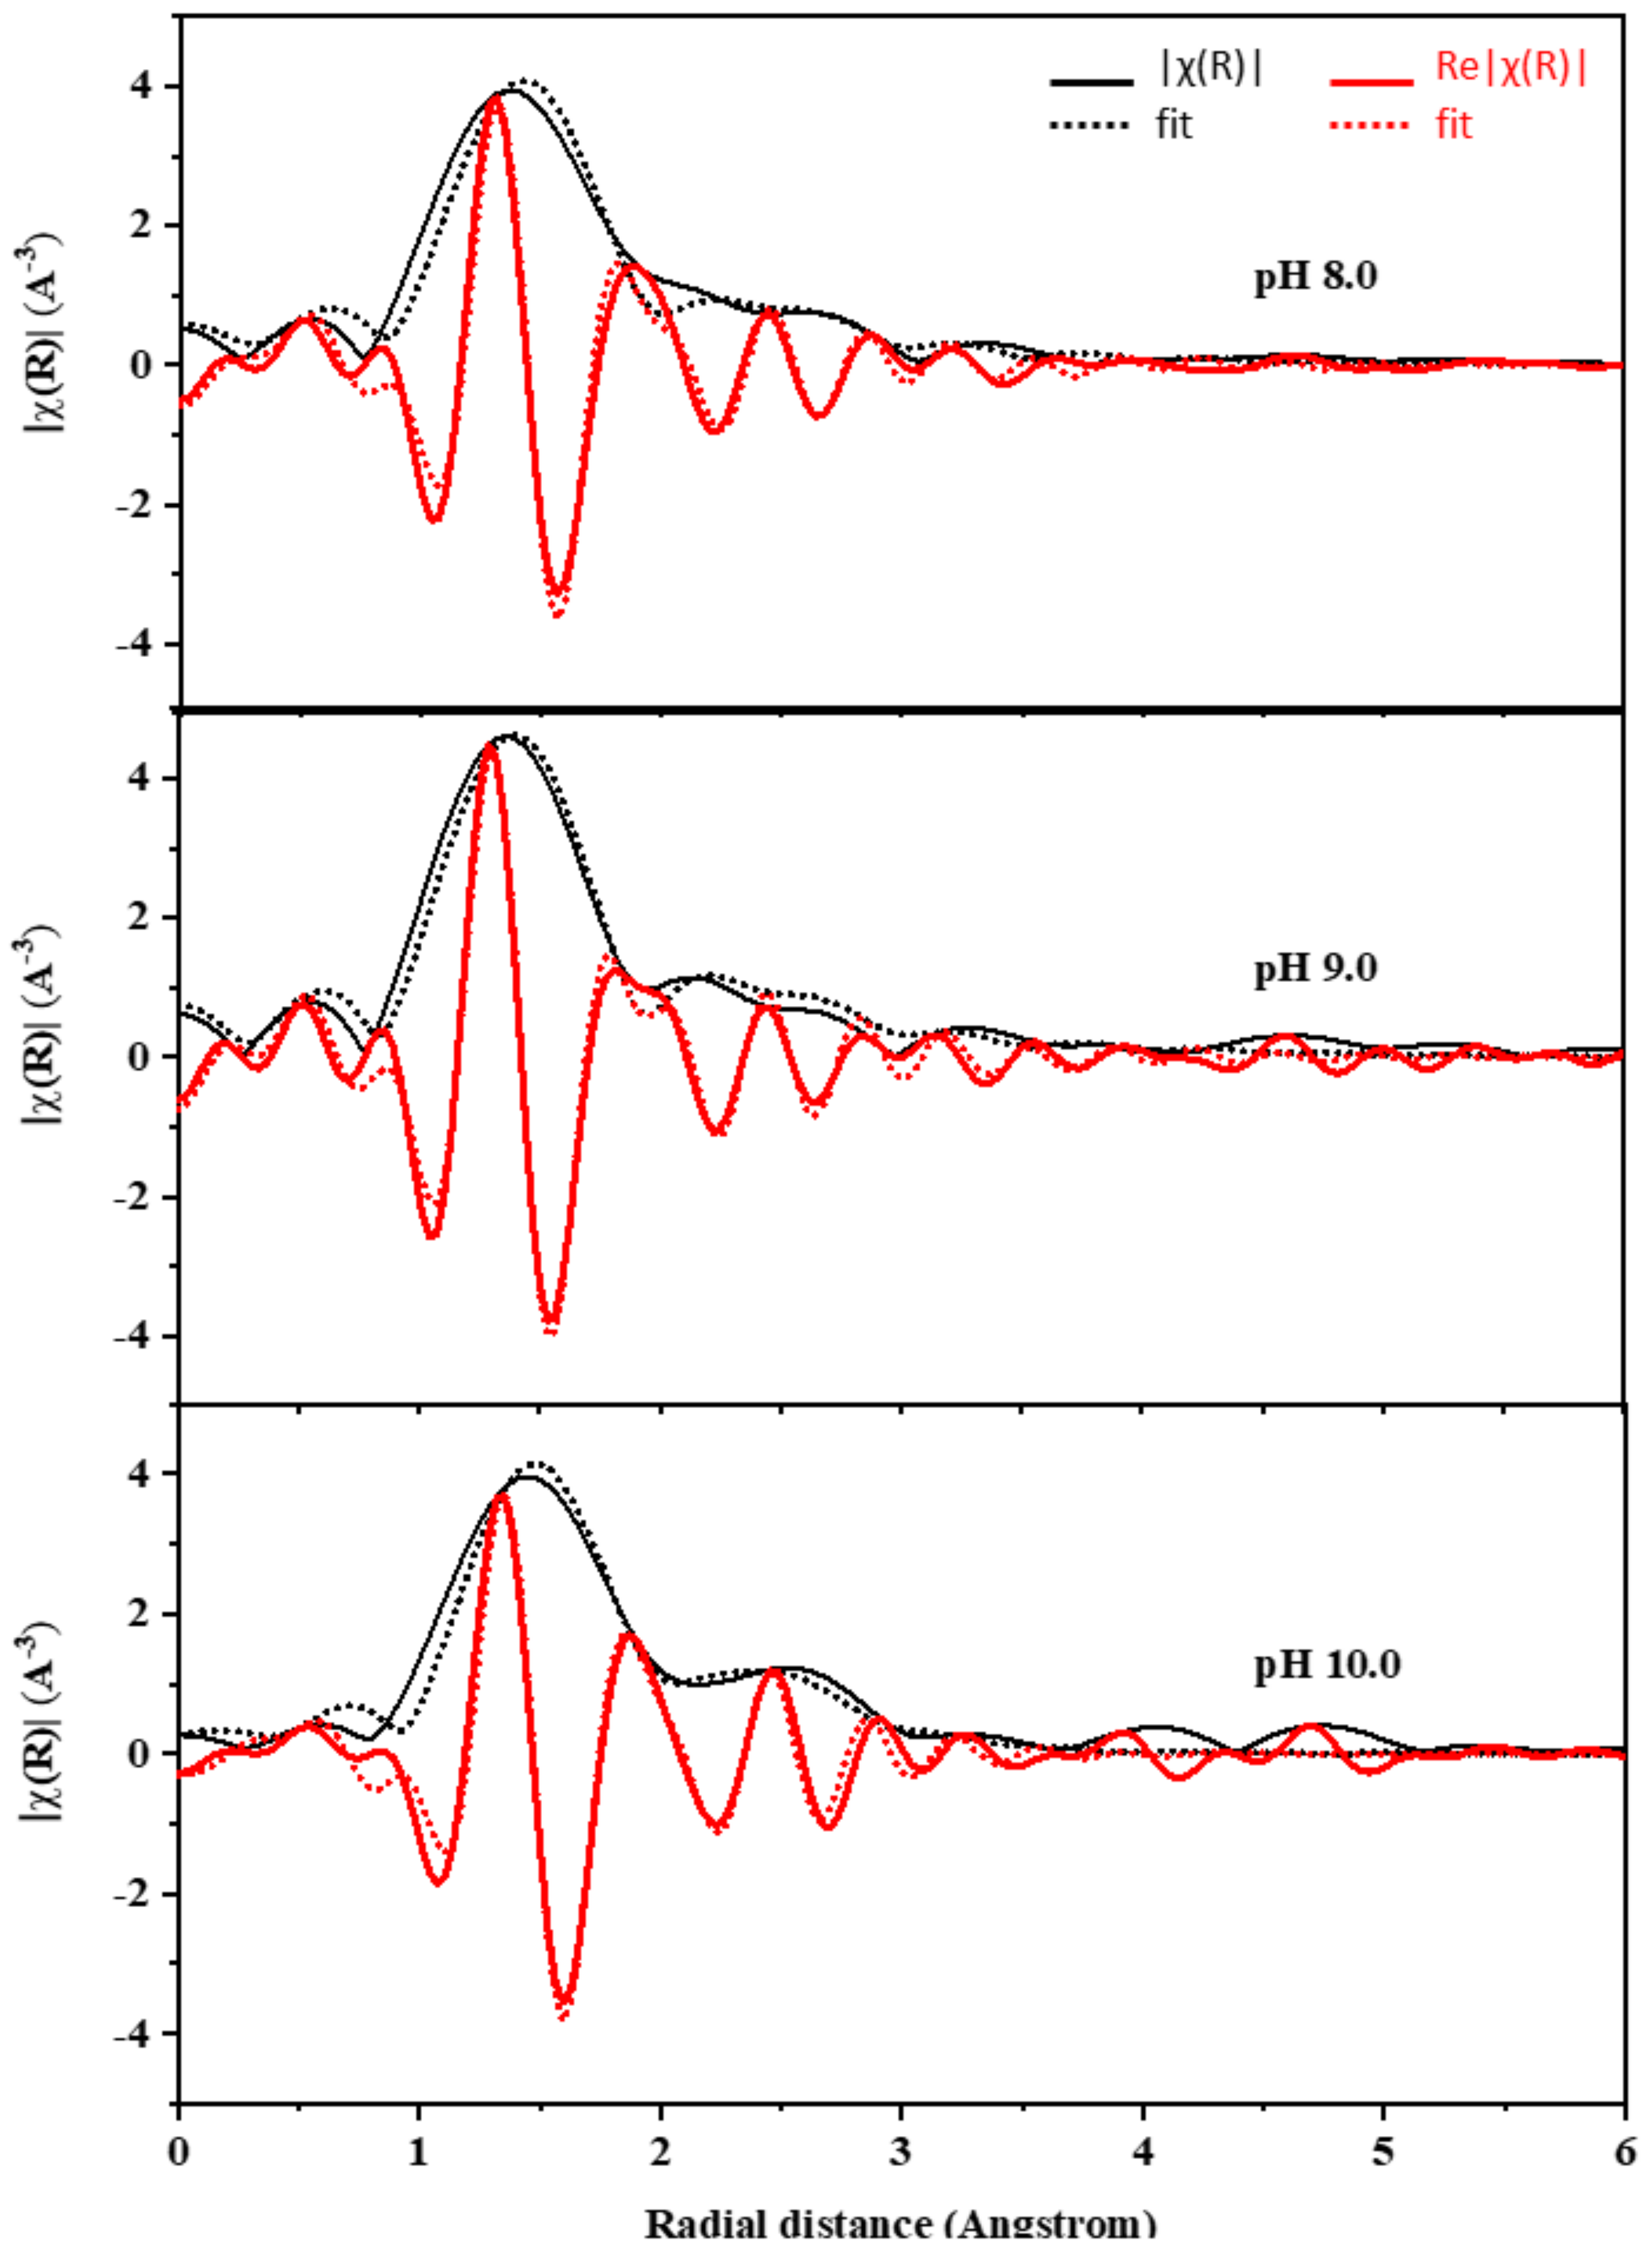
| Sample | Shell | Bond | ΔE (eV) | CN | R(Å) | σ2 | R-Factor |
|---|---|---|---|---|---|---|---|
| Ti50Si50 pH 8.0 | 1 | Ti-O | 4.11 ± 3.34 | 4.14 ± 0.18 | 1.99 ± 0.02 | 0.0053 ± 0.0013 | 0.0176 |
| 2 | Ti-Si | 1.27 ± 0.44 | 2.79 ± 0.03 | 0.0018 ± 0.0019 | |||
| Ti50Si50 pH 9.0 | 1 | Ti-O | 2.72 ± 2.03 | 4.07 ± 0.12 | 1.83 ± 0.01 | 0.0042 ± 0.0008 | 0.0082 |
| 2 | Ti-Si | 1.00 ± 0.13 | 2.77 ± 0.02 | 0.0020 ± 0.0020 | |||
| Ti50Si50 pH 10.0 | 1 | Ti-O | 6.70 ± 3.29 | 4.08 ± 0.19 | 1.94 ± 0.02 | 0.0049 ± 0.0024 | 0.0158 |
| 2 | Ti-Si | 1.52 ± 0.22 | 2.81 ± 0.03 | 0.0013 ± 0.0031 | |||
| Ti70Si30 | 1 | Ti-O | 6.68 ± 3.23 | 4.15 ± 0.19 | 1.90 ± 0.02 | 0.0051 ± 0.0014 | 0.0198 |
| 2 | Ti-Si | 0.97 ± 0.21 | 2.800 ± 0.04 | 0.0006 ± 0.0050 | |||
| Ti50Si50 | 1 | Ti-O | 2.72 ± 2.03 | 4.07 ± 0.12 | 1.83 ± 0.01 | 0.0042 ± 0.0008 | 0.0082 |
| 2 | Ti-Si | 1.00 ± 0.13 | 2.77 ± 0.02 | 0.0020 ± 0.0020 | |||
| Ti40Si60 | 1 | Ti-O | 6.54 ± 2.27 | 4.09 ± 0.13 | 1.82 ± 0.01 | 0.0048 ± 0.0010 | 0.0103 |
| 2 | Ti-Si | 1.19 ± 0.03 | 2.79 ± 0.03 | 0.0023 ± 0.0017 |
| Sample | Atomic (%) | Atomic Ratio of Ti/Si | |
|---|---|---|---|
| Si | Ti | ||
| SiO2 | 100 | 0 | - |
| Ti50Si50 pH 8.0 | 54.39 | 45.61 | 0.84 |
| Ti50Si50 pH 9.0 | 47.87 | 52.13 | 1.09 |
| Ti50Si50 pH 10.0 | 9.82 | 93.18 | 9.49 |
| Ti70Si30 | 29.79 | 70.21 | 2.36 |
| Ti50Si50 | 47.87 | 52.13 | 1.09 |
| Ti40Si60 | 60.19 | 39.81 | 0.66 |
| TiO2 | 0 | 100 | - |
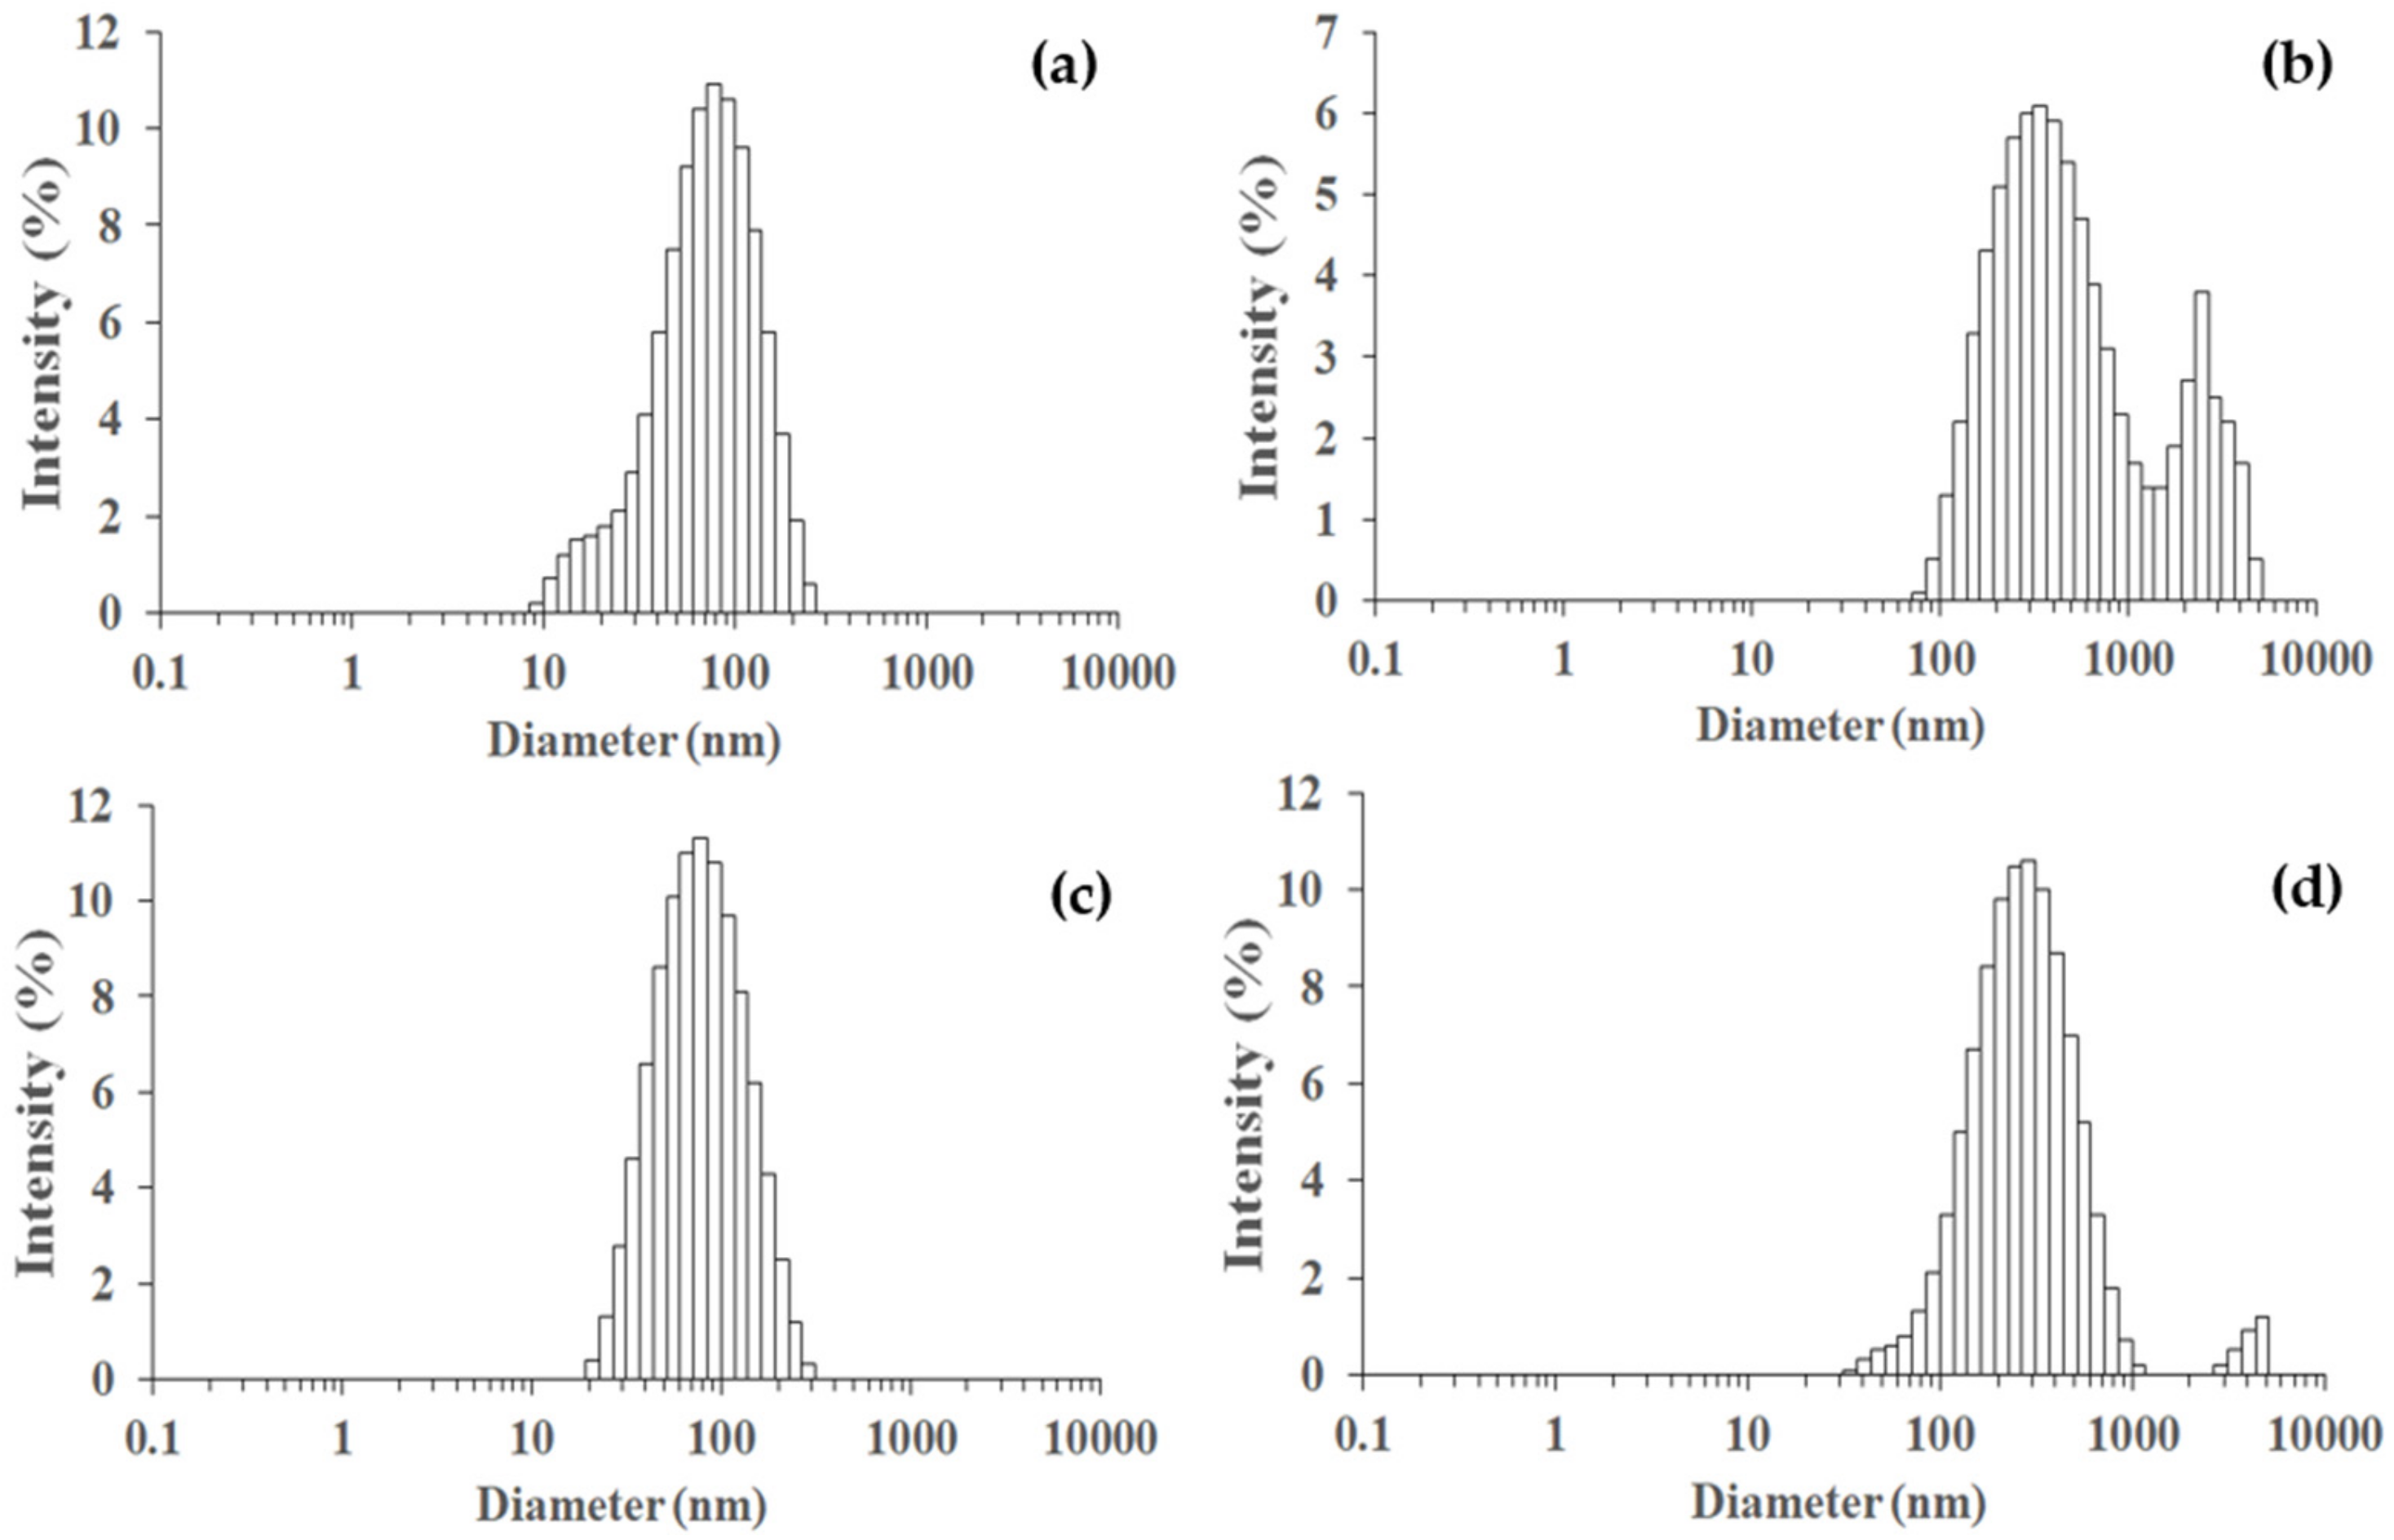
| Sample | Zetasizer Nano ZS | SEM | |
|---|---|---|---|
| Particle Size, d (nm) | Polydispesity Index, PDI | Value of Average Diameter, dn (nm) | |
| SiO2 | 147.8 | 0.248 | 144.2 ± 11.3 |
| Ti50Si50 pH 8.0 | 639.3 | 0.627 | 41.5 ± 16.7 |
| Ti50Si50 pH 9.0 | 136.2 | 0.239 | 135.4 ± 12.3 |
| Ti50Si50 pH 10.0 | 397.0 | 0.322 | 114.2 ± 24.2 |
| Ti70Si30 | 573.1 | 0.630 | 149.3 ± 15.5 |
| Ti50Si50 | 136.2 | 0.239 | 135.4 ± 12.3 |
| Ti40Si60 | 825.5 | 0.907 | 131.8 ± 13.3 |
| TiO2 | 40.3 | 0.490 | 27.8 ± 6.3 |
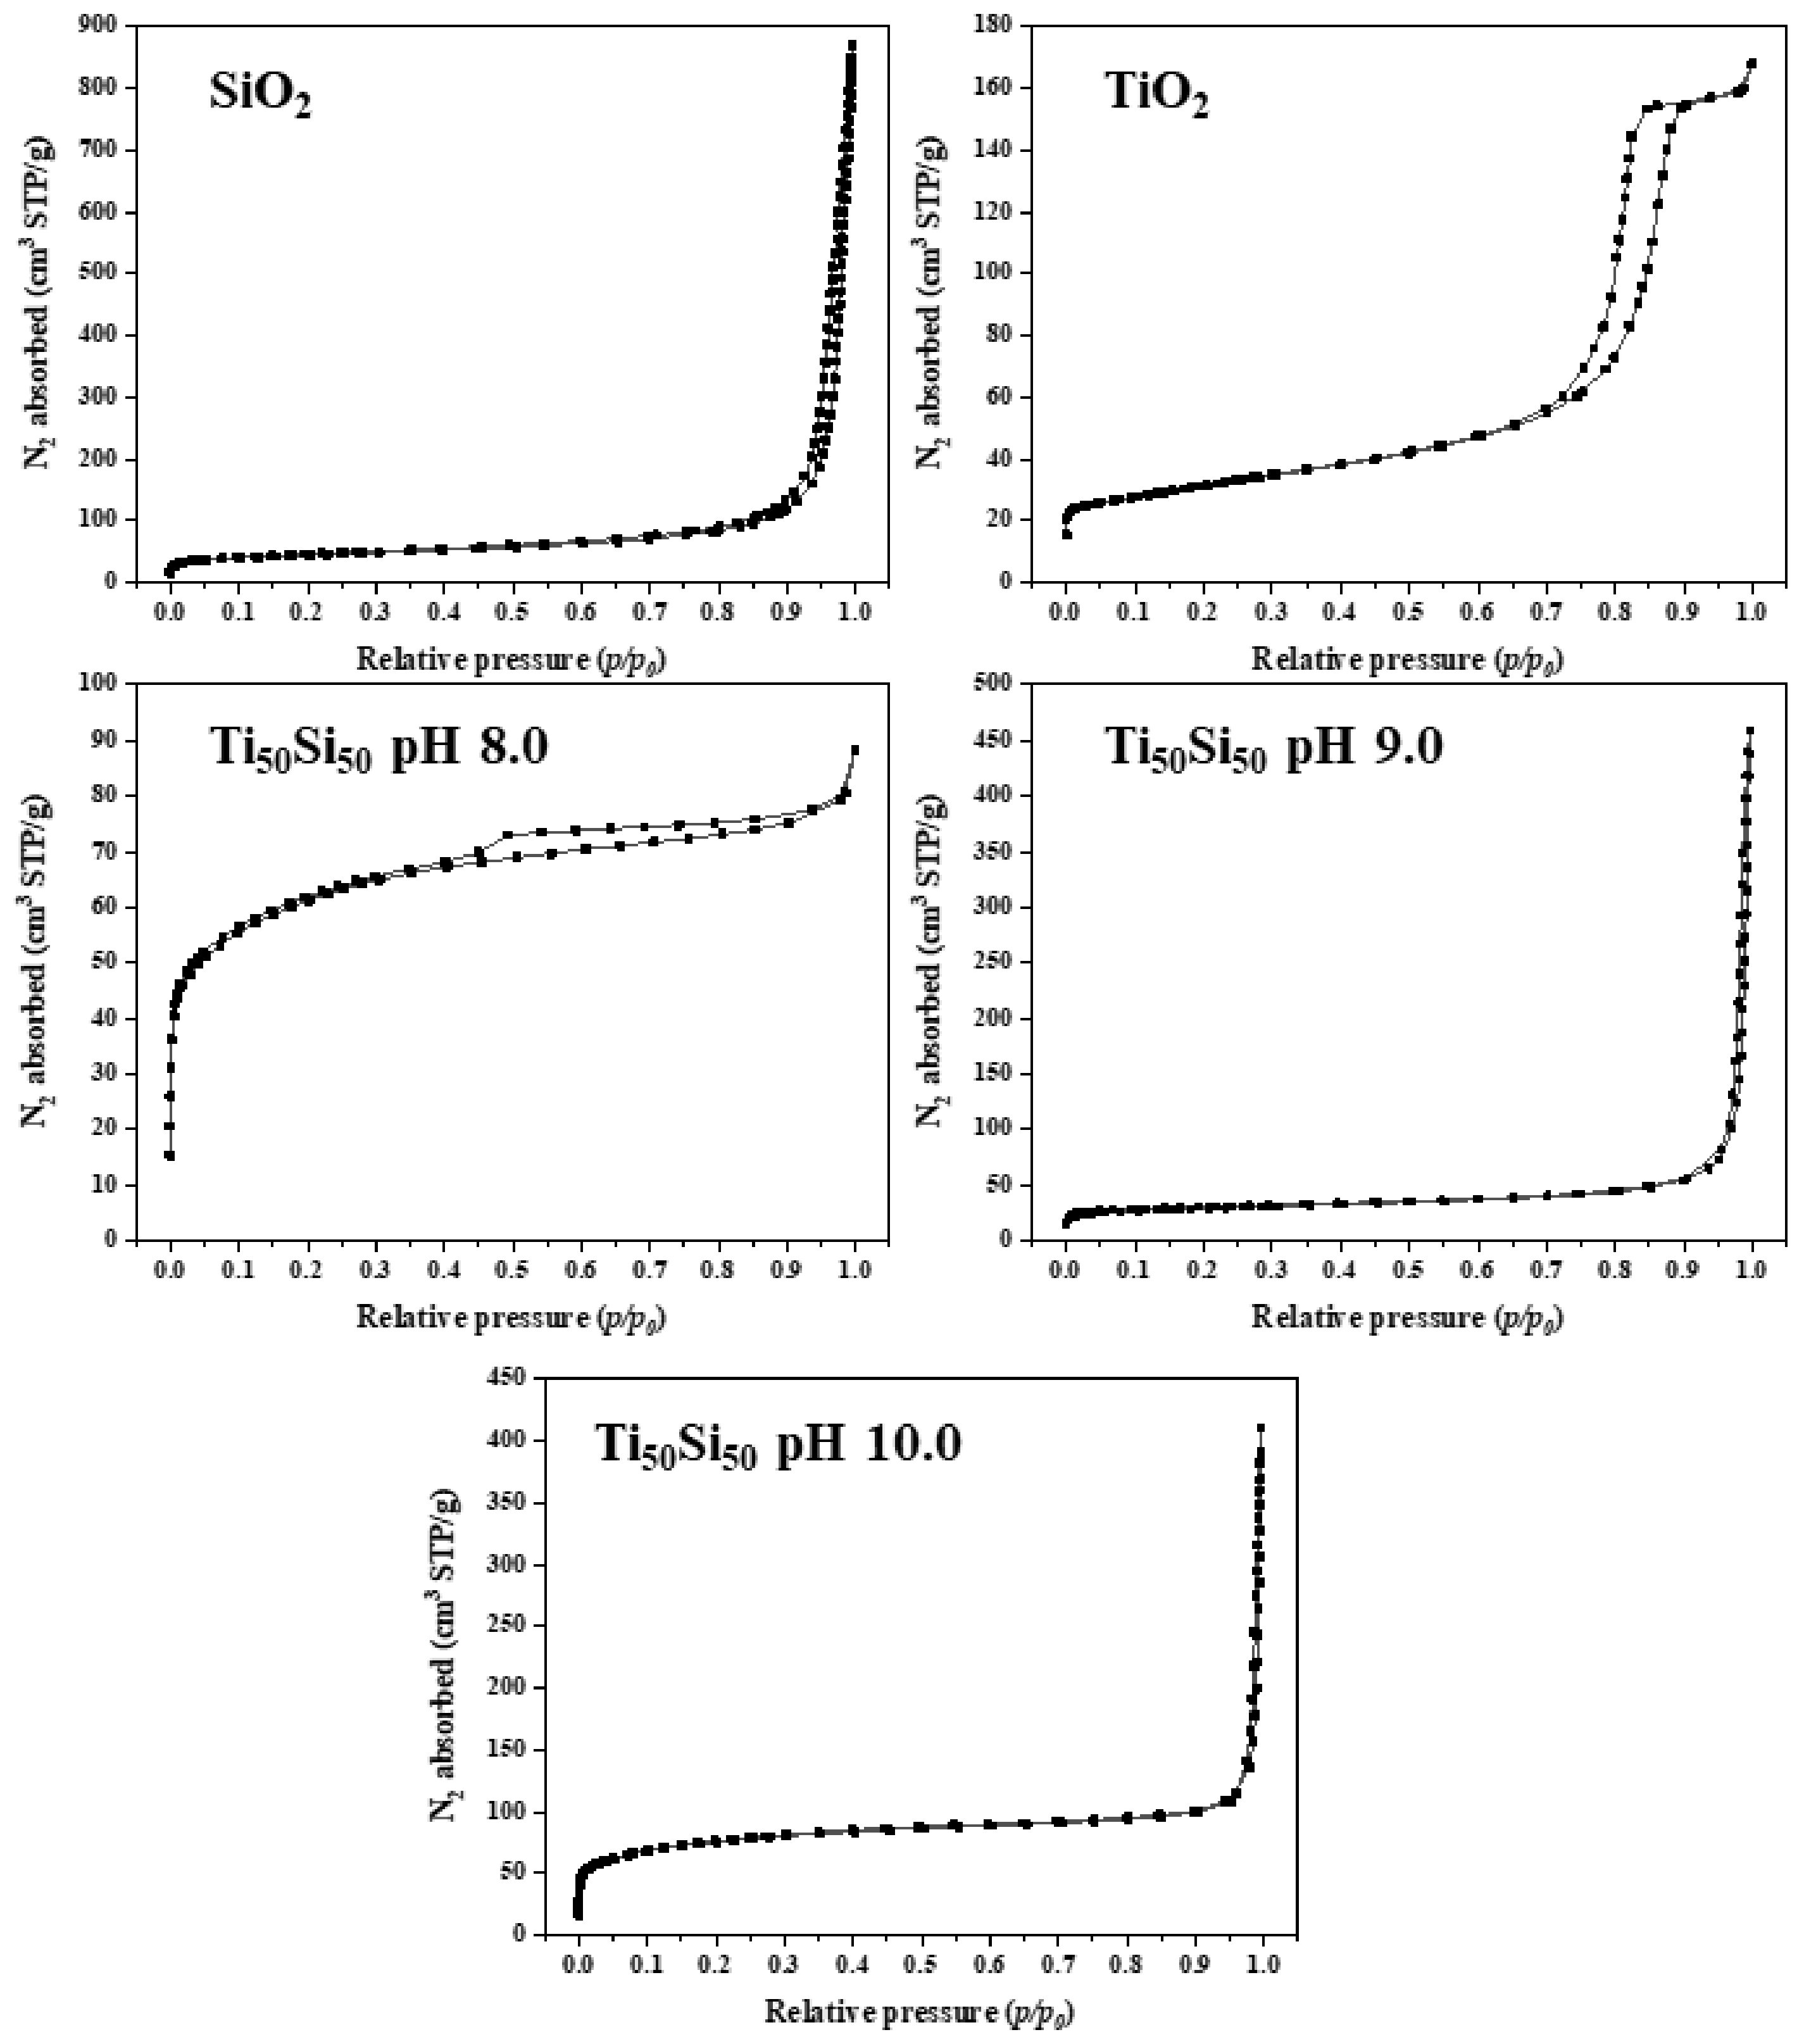
| Sample | Specific Surface Area, SBET (m2g−1) | Pore Volume, Vp (cm3g−1) | Mean Pore Diameter, dp (nm) |
|---|---|---|---|
| SiO2 | 116.90 | 1.06 | 51.08 |
| TixSiy pH 8.0 | 177.02 | 0.11 | 2.56 |
| TixSiy pH 9.0 | 225.68 | 0.33 | 5.85 |
| TixSiy pH 10.0 | 62.75 | 0.42 | 27.31 |
| Ti70Si30 | 569.07 | 1.42 | 10.96 |
| Ti50Si50 | 225.68 | 0.33 | 5.85 |
| Ti40Si60 | 68.34 | 0.36 | 21.97 |
| TiO2 | 74.07 | 0.23 | 12.75 |
Publisher’s Note: MDPI stays neutral with regard to jurisdictional claims in published maps and institutional affiliations. |
© 2022 by the authors. Licensee MDPI, Basel, Switzerland. This article is an open access article distributed under the terms and conditions of the Creative Commons Attribution (CC BY) license (https://creativecommons.org/licenses/by/4.0/).
Share and Cite
Teamsinsungvon, A.; Ruksakulpiwat, C.; Amonpattaratkit, P.; Ruksakulpiwat, Y. Structural Characterization of Titanium–Silica Oxide Using Synchrotron Radiation X-ray Absorption Spectroscopy. Polymers 2022, 14, 2729. https://doi.org/10.3390/polym14132729
Teamsinsungvon A, Ruksakulpiwat C, Amonpattaratkit P, Ruksakulpiwat Y. Structural Characterization of Titanium–Silica Oxide Using Synchrotron Radiation X-ray Absorption Spectroscopy. Polymers. 2022; 14(13):2729. https://doi.org/10.3390/polym14132729
Chicago/Turabian StyleTeamsinsungvon, Arpaporn, Chaiwat Ruksakulpiwat, Penphitcha Amonpattaratkit, and Yupaporn Ruksakulpiwat. 2022. "Structural Characterization of Titanium–Silica Oxide Using Synchrotron Radiation X-ray Absorption Spectroscopy" Polymers 14, no. 13: 2729. https://doi.org/10.3390/polym14132729