PEEK Composites as Self-Lubricating Bush Materials for Articulating Revolute Pin Joints


Abstract
:1. Introduction
2. Experimental Methods
2.1. Specimen
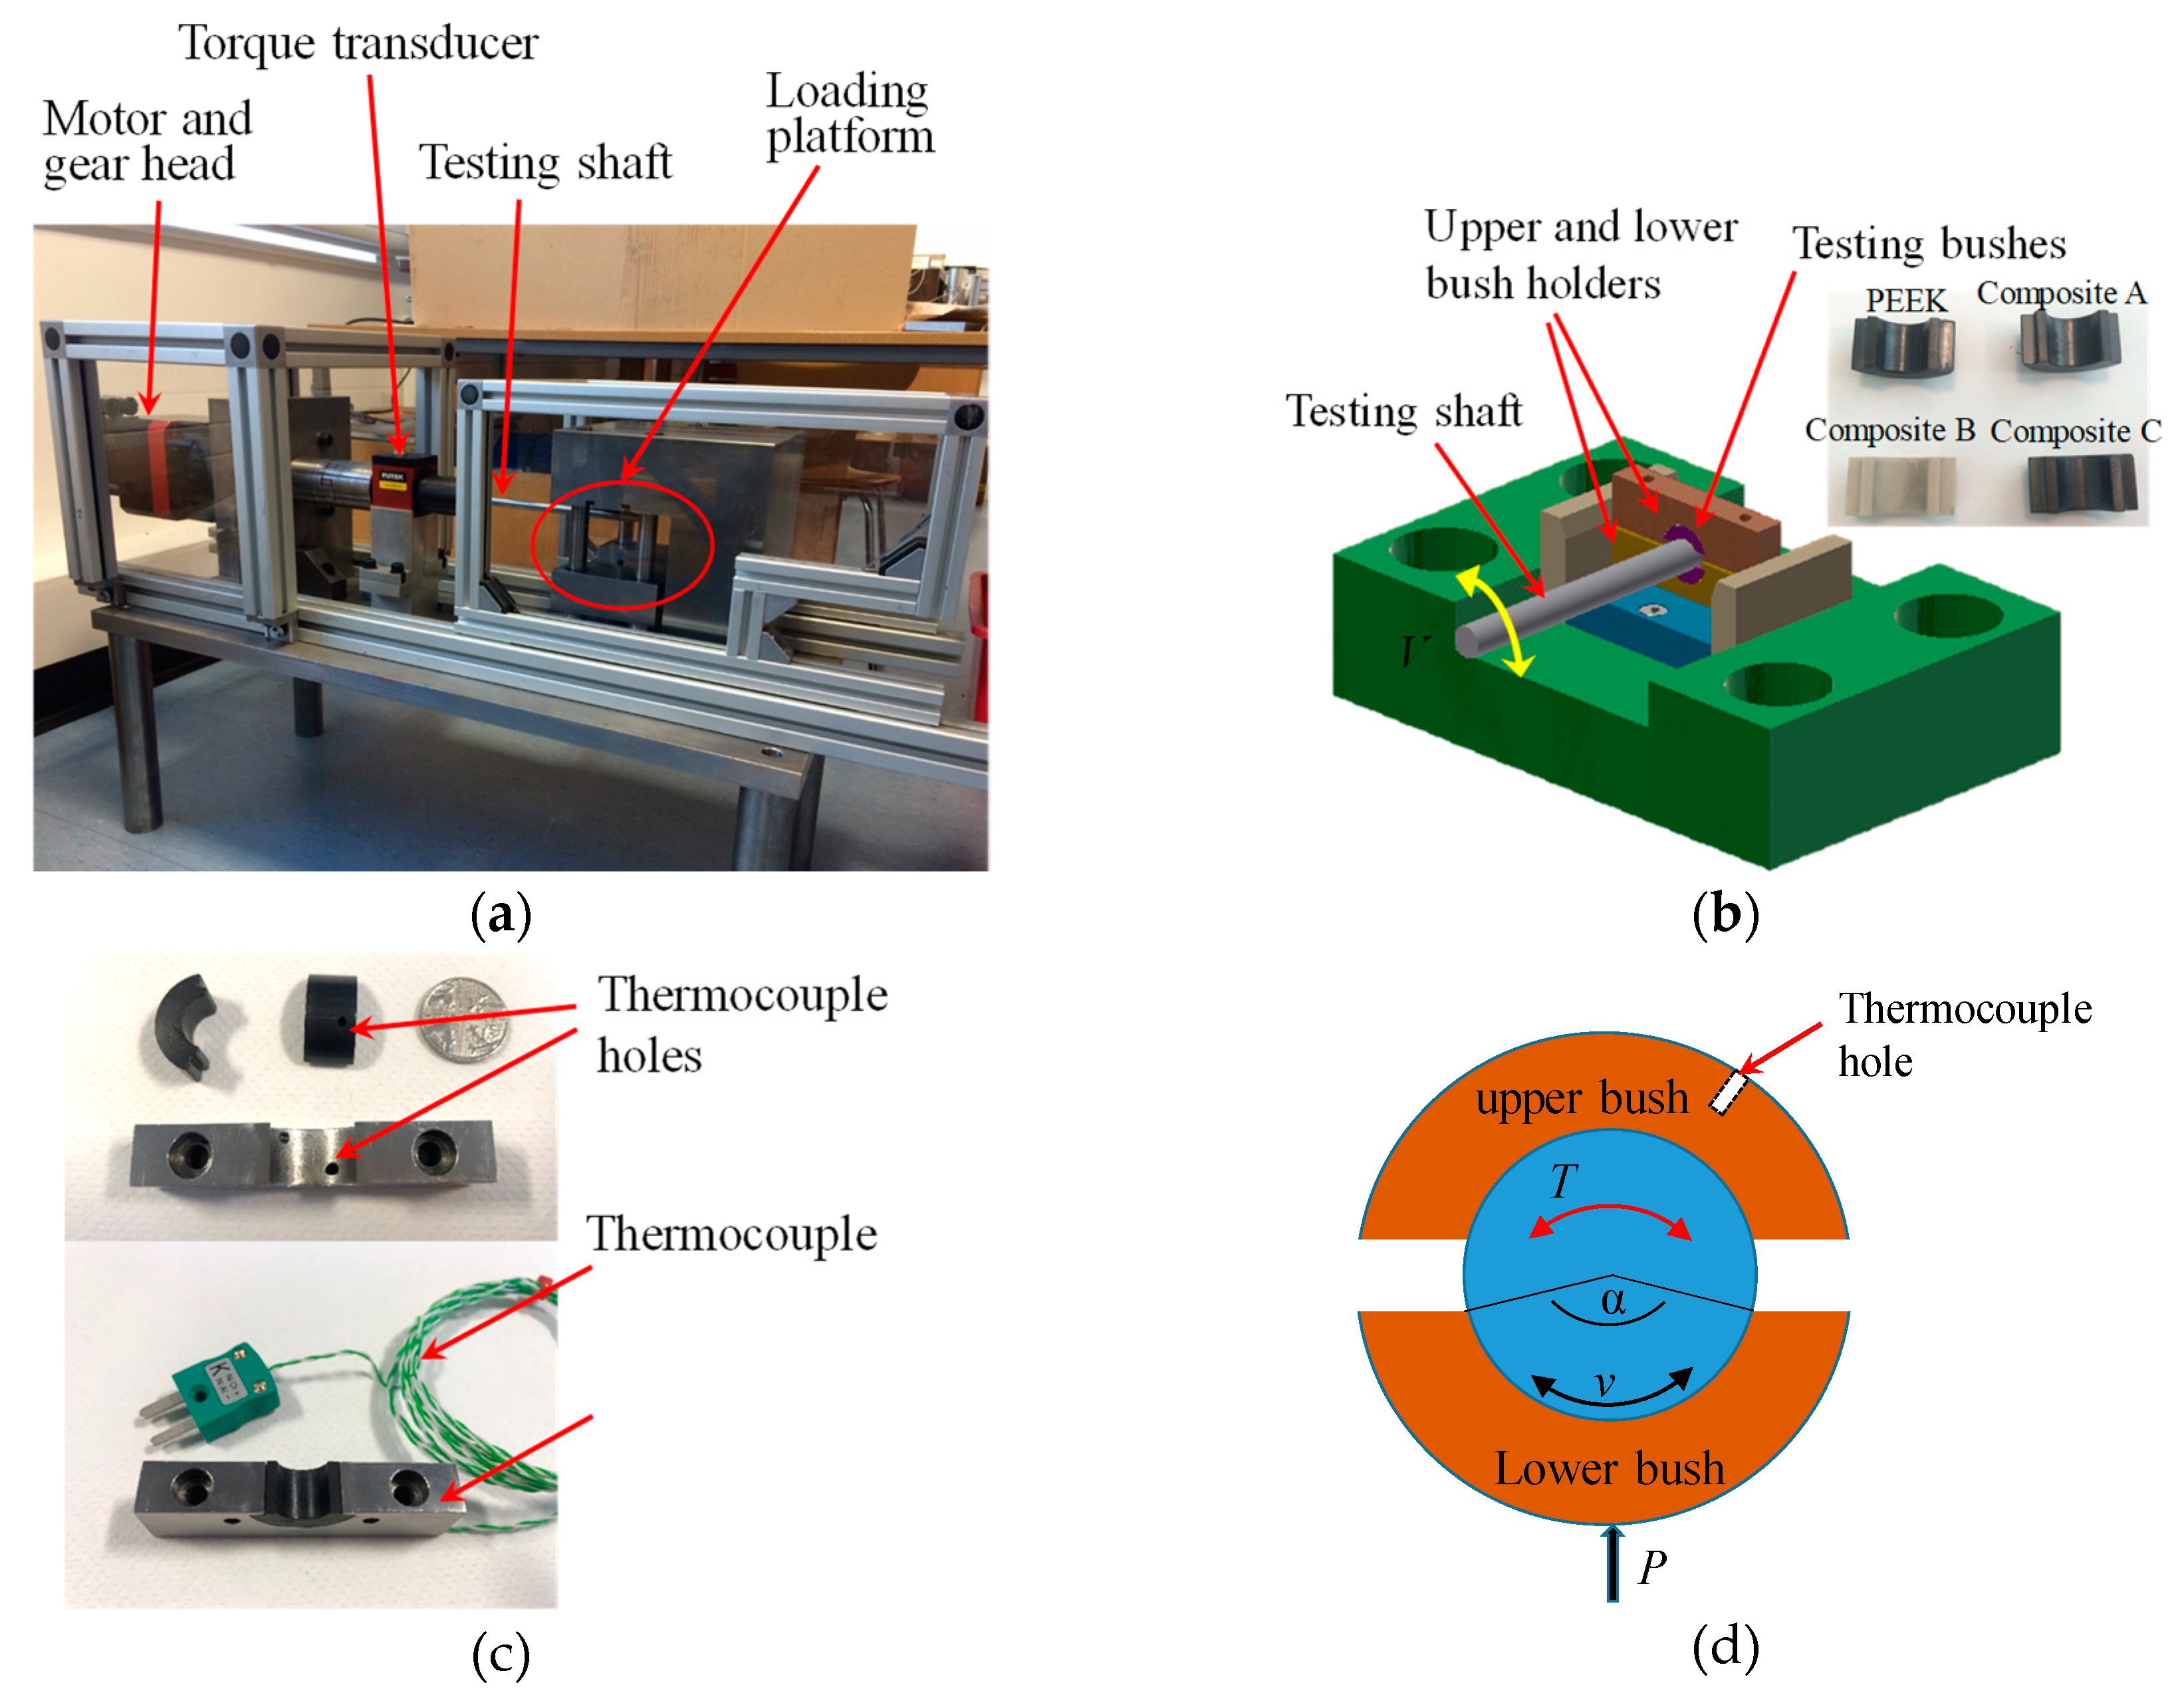
2.2. Wear Test
2.3. Characterization
3. Results and Discussions
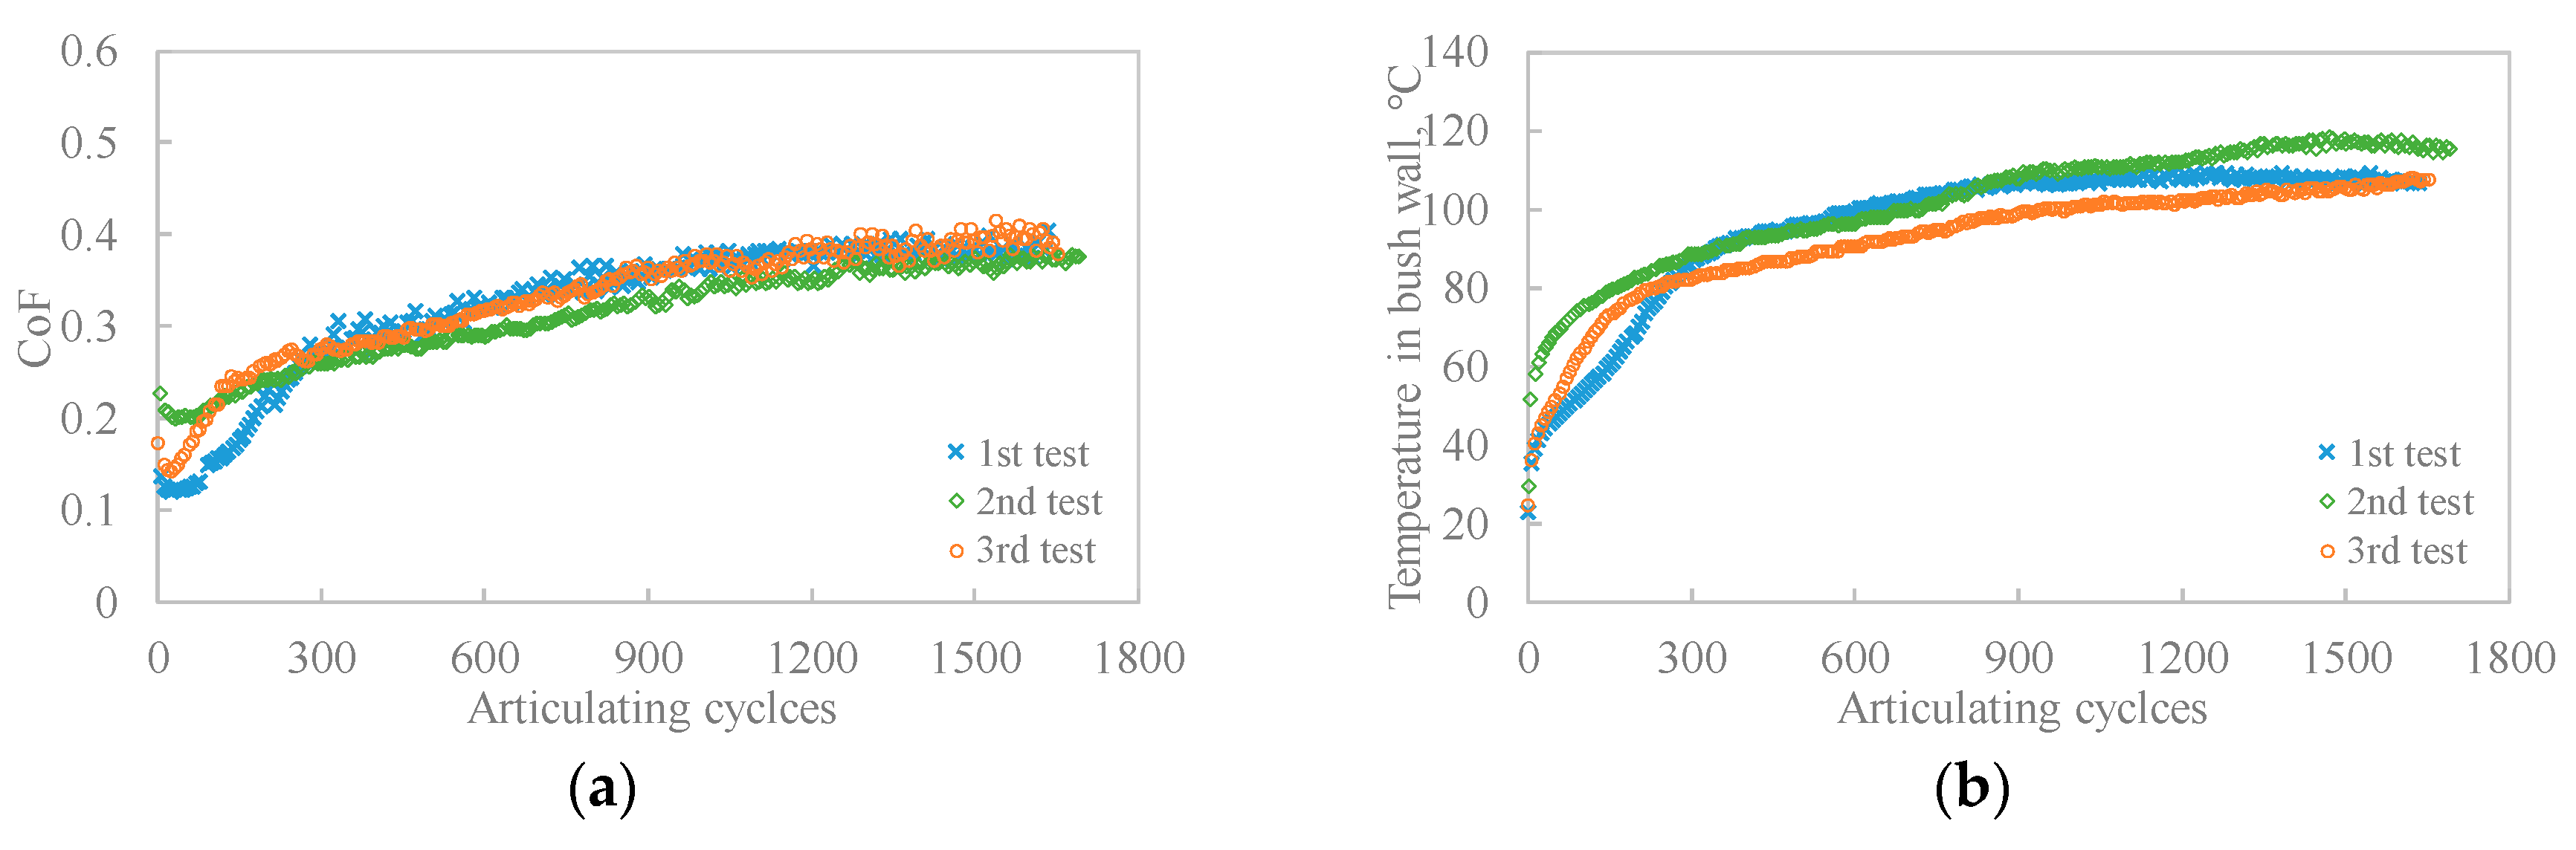
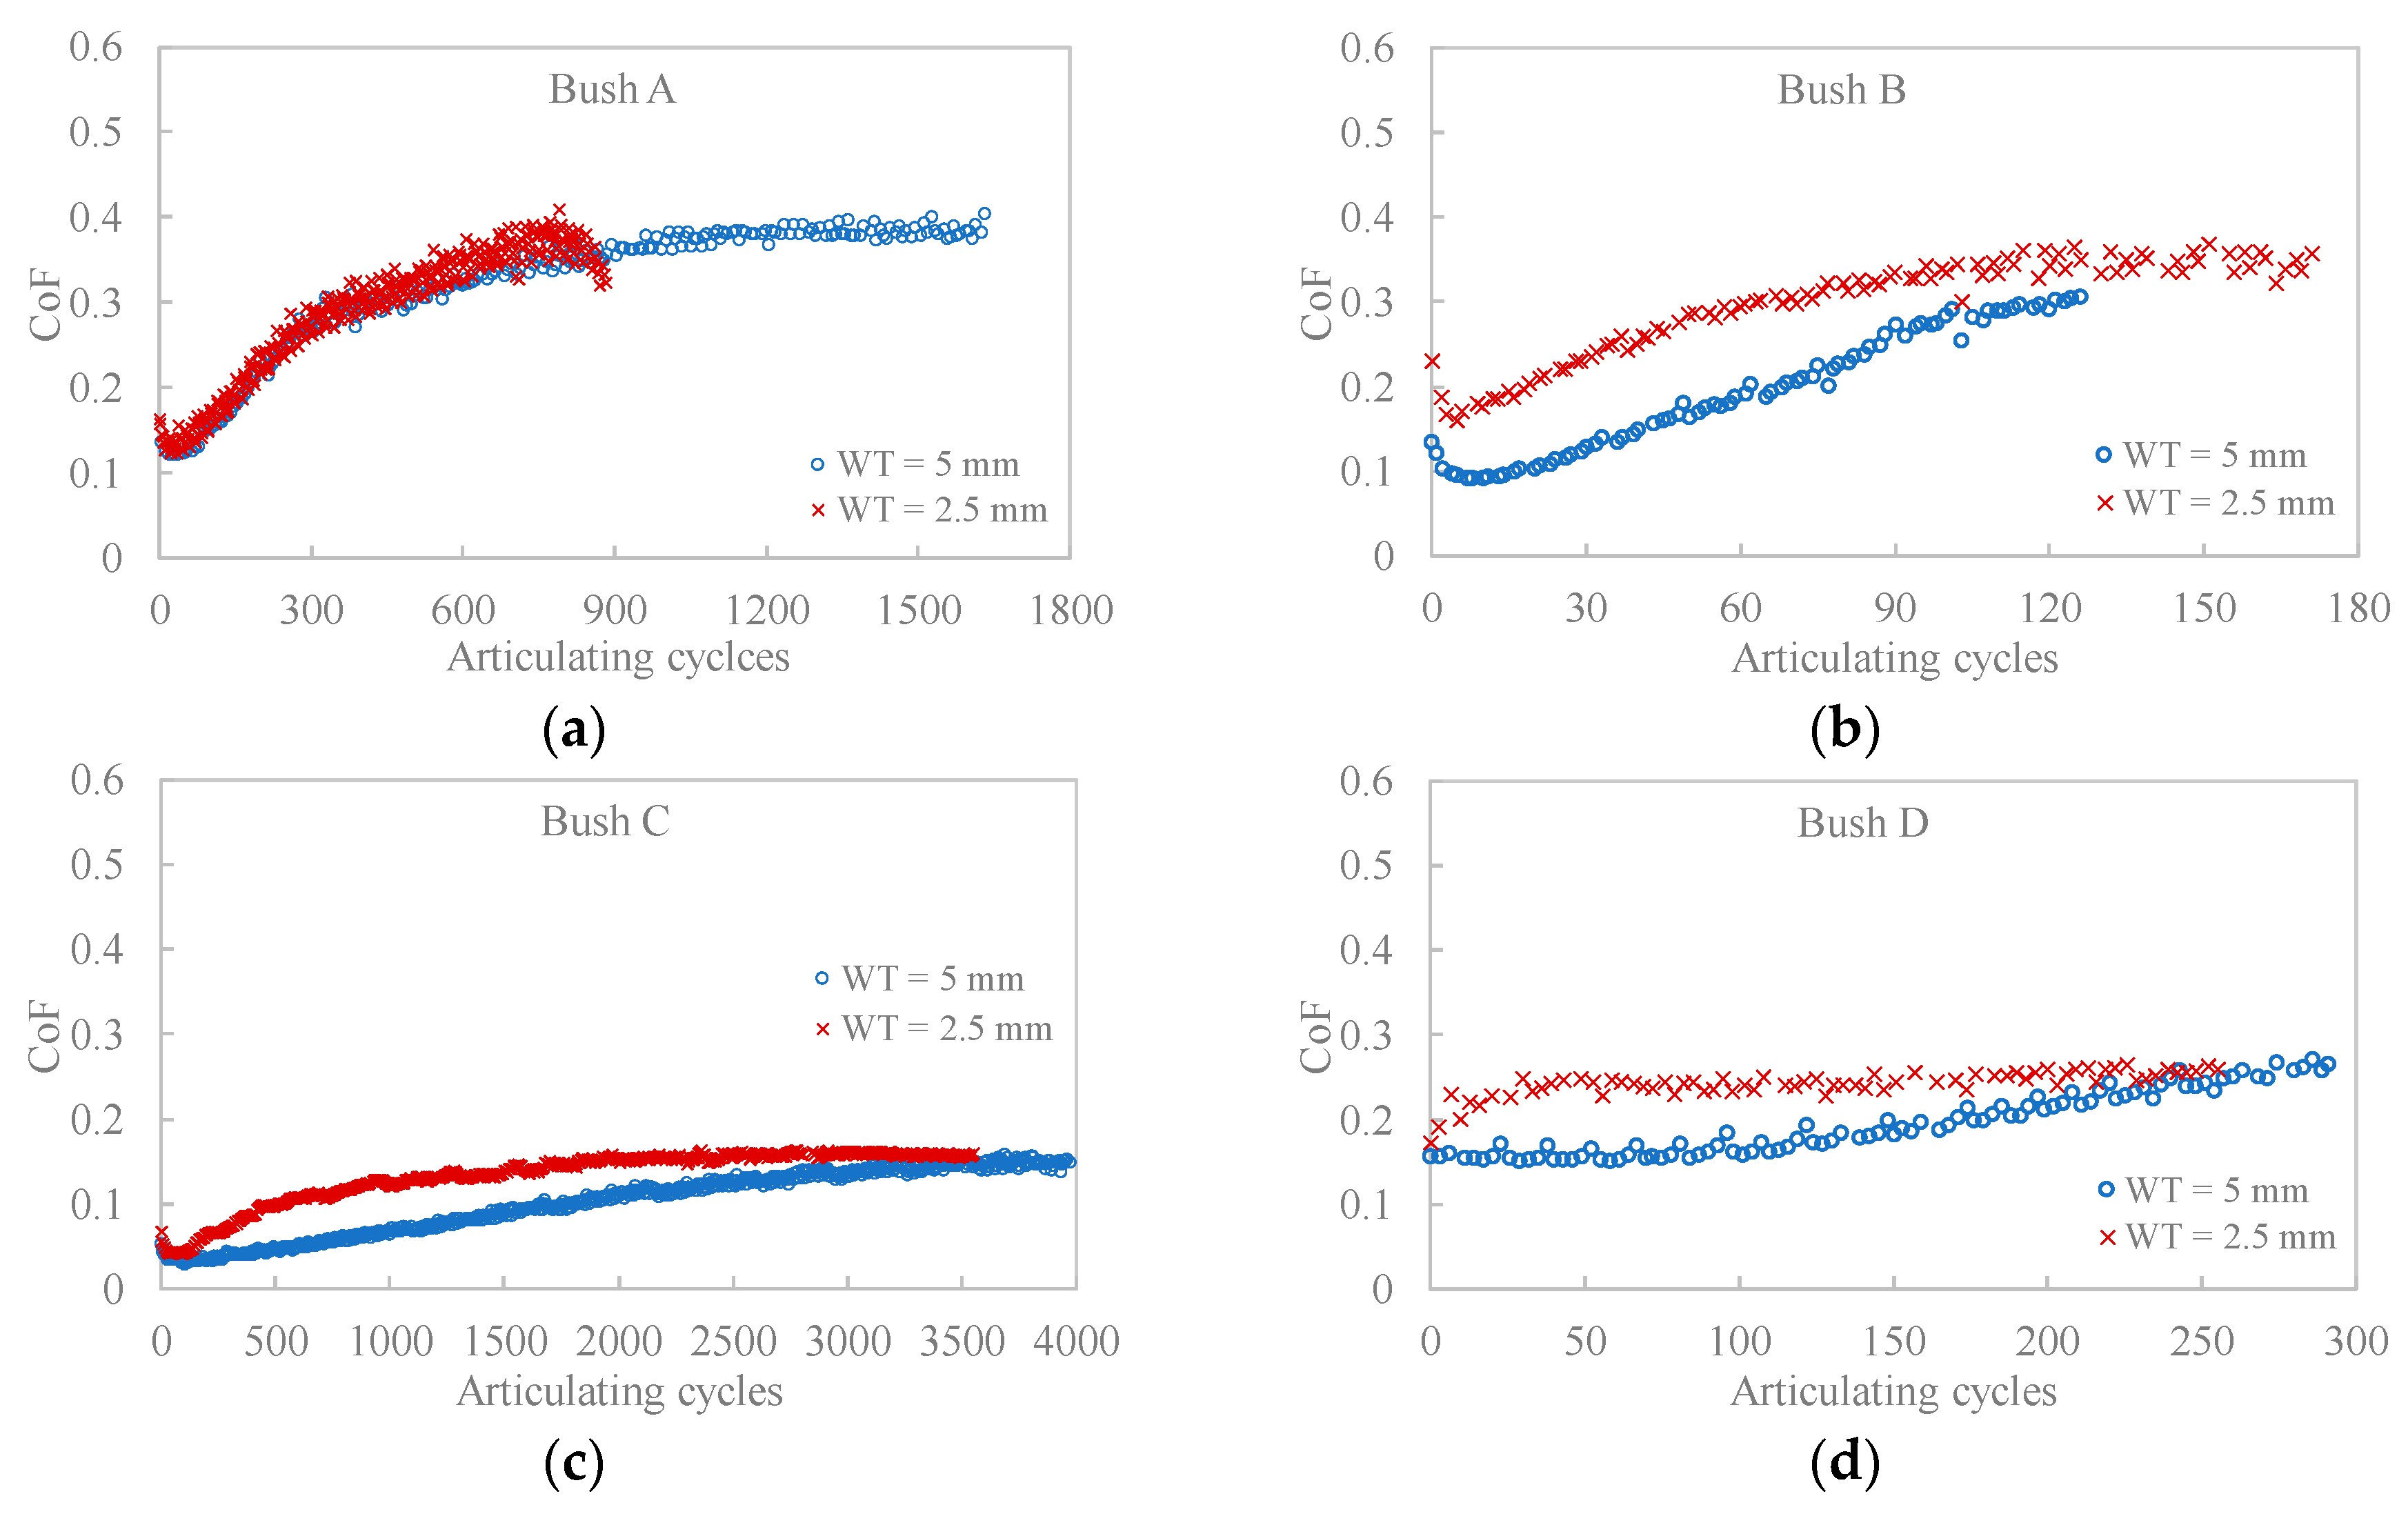
3.1. Friction and Wear
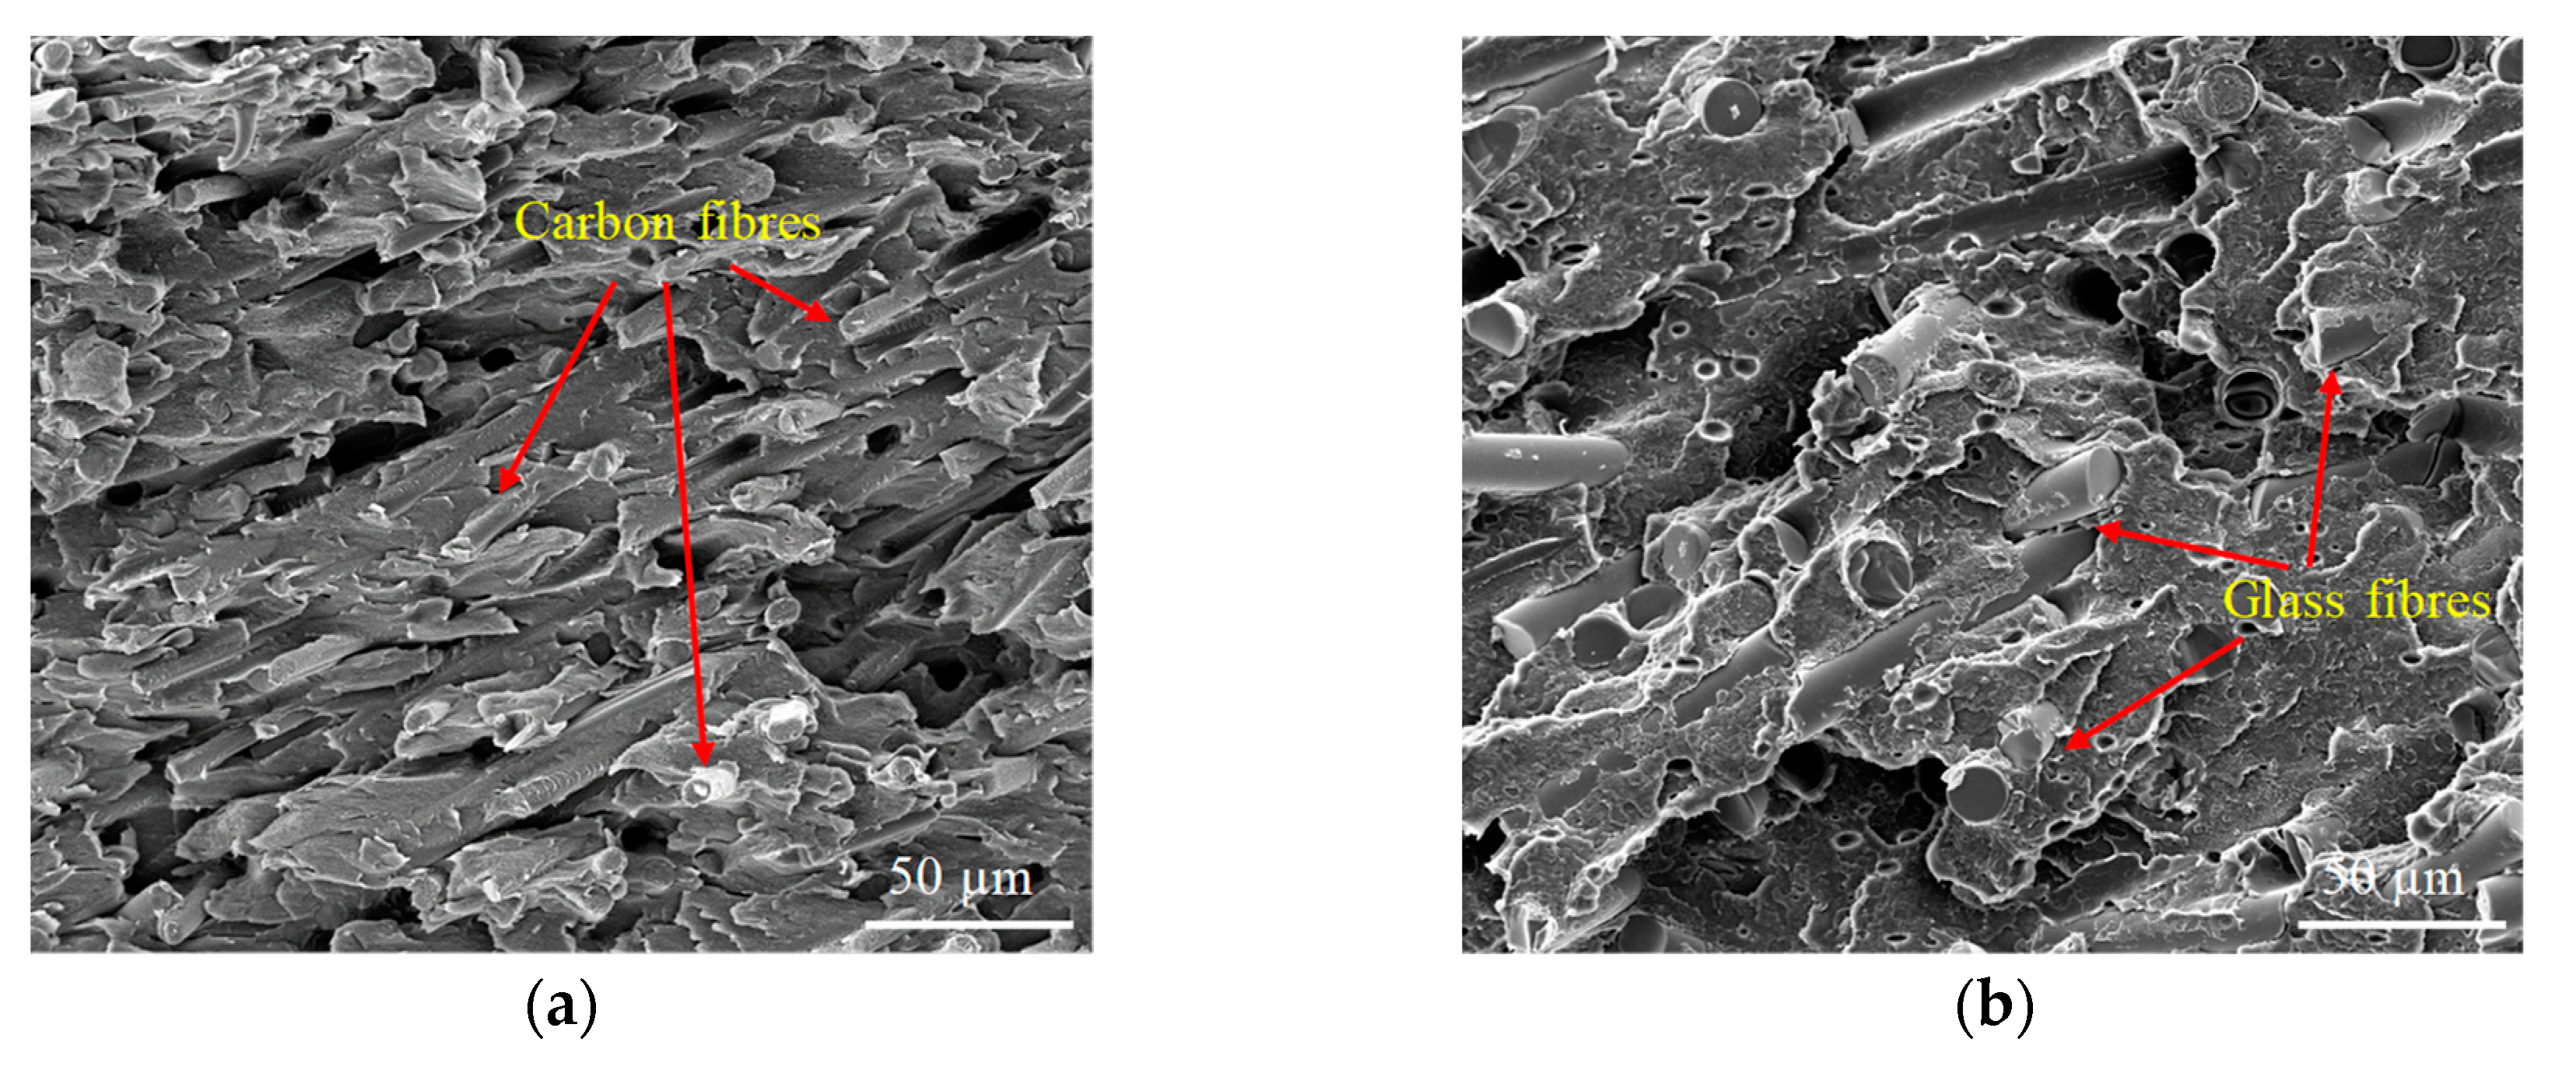
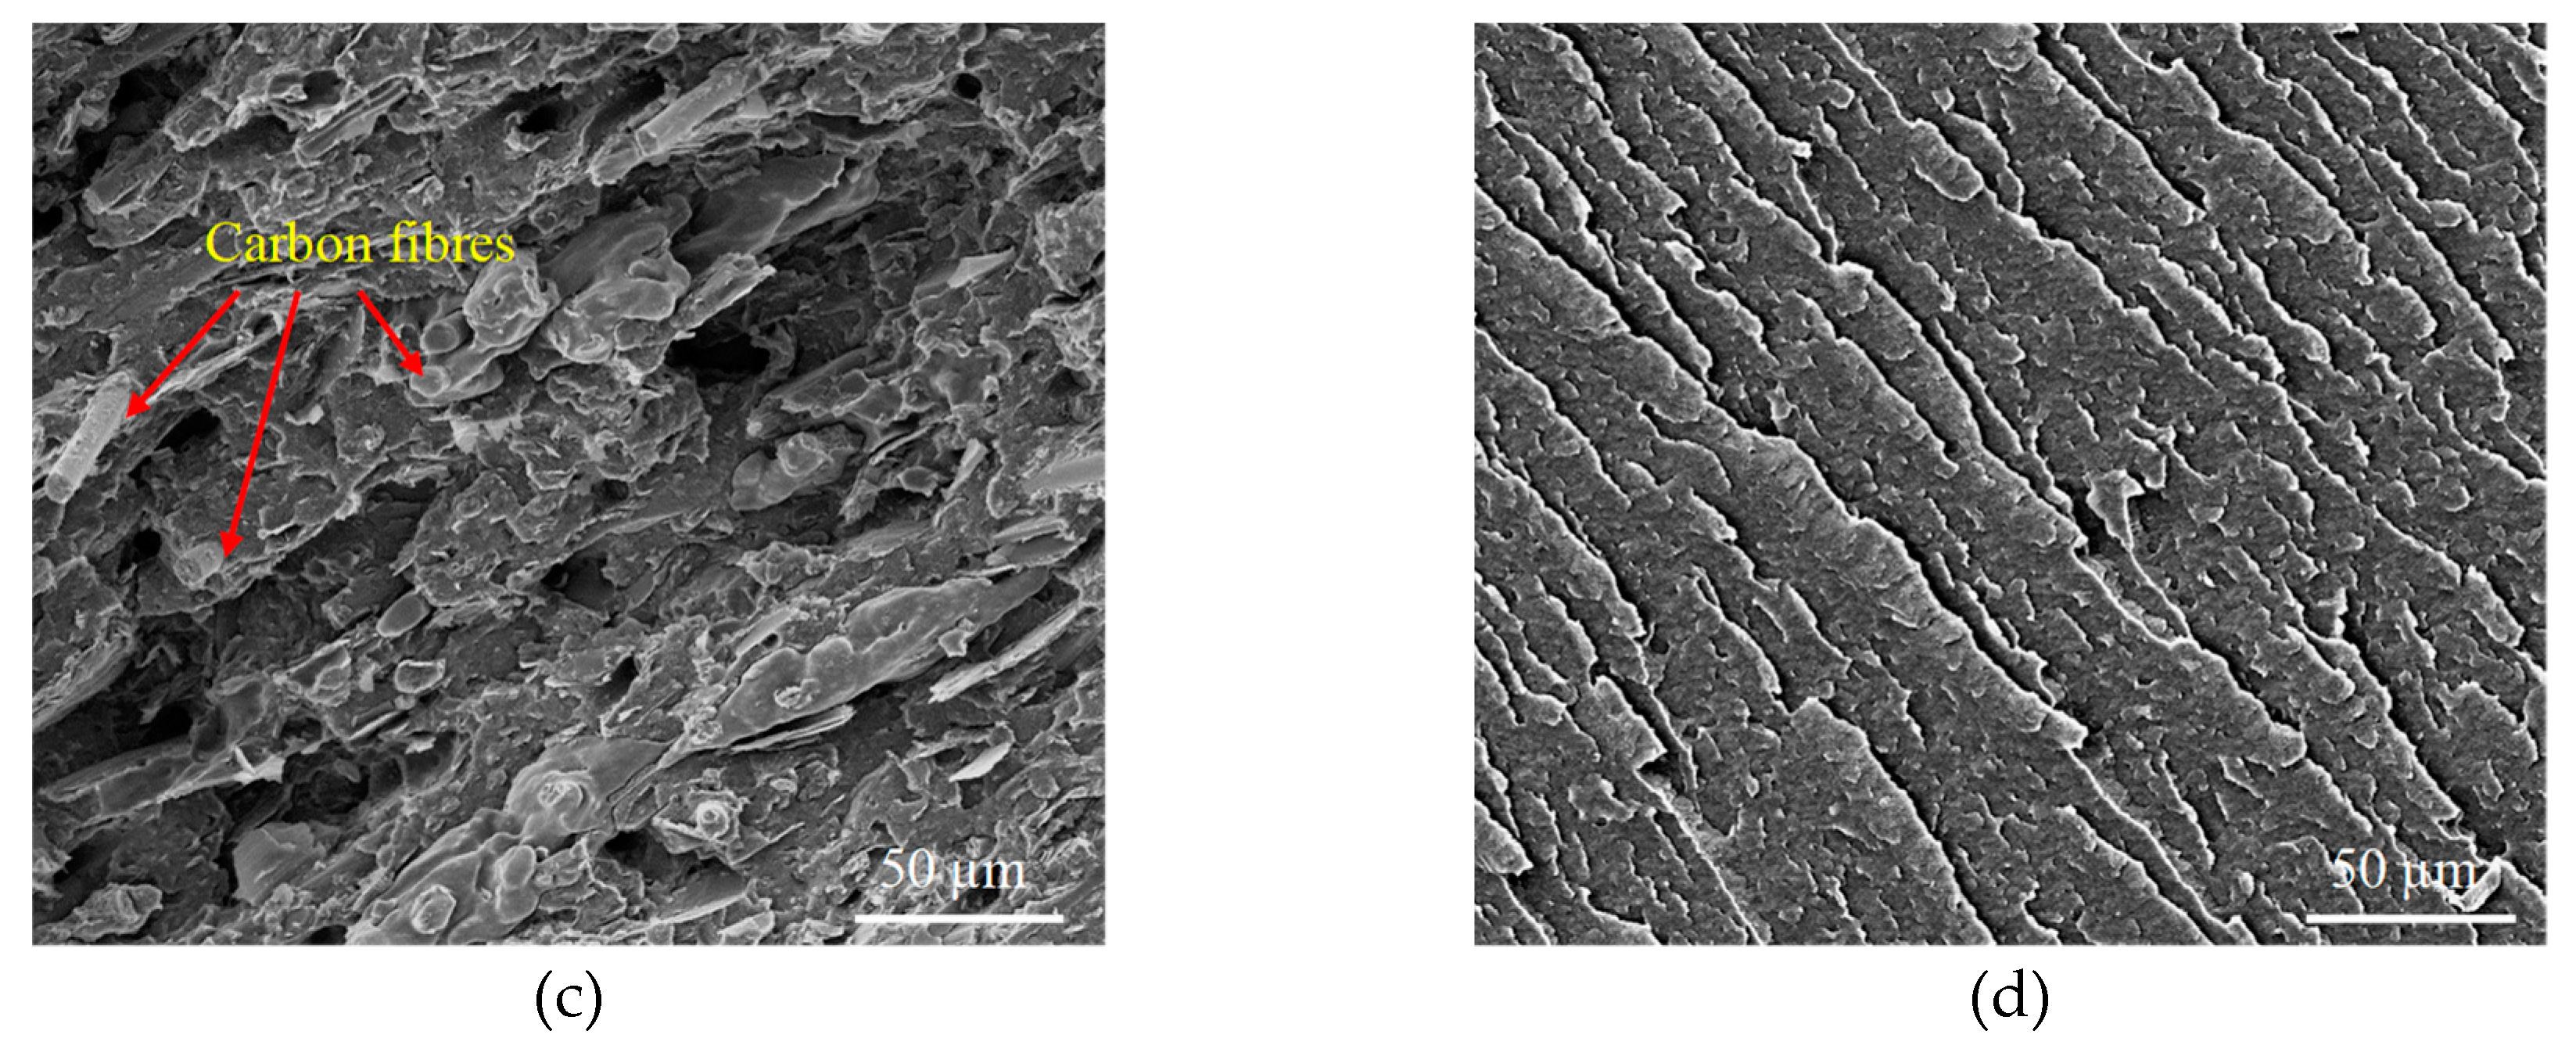
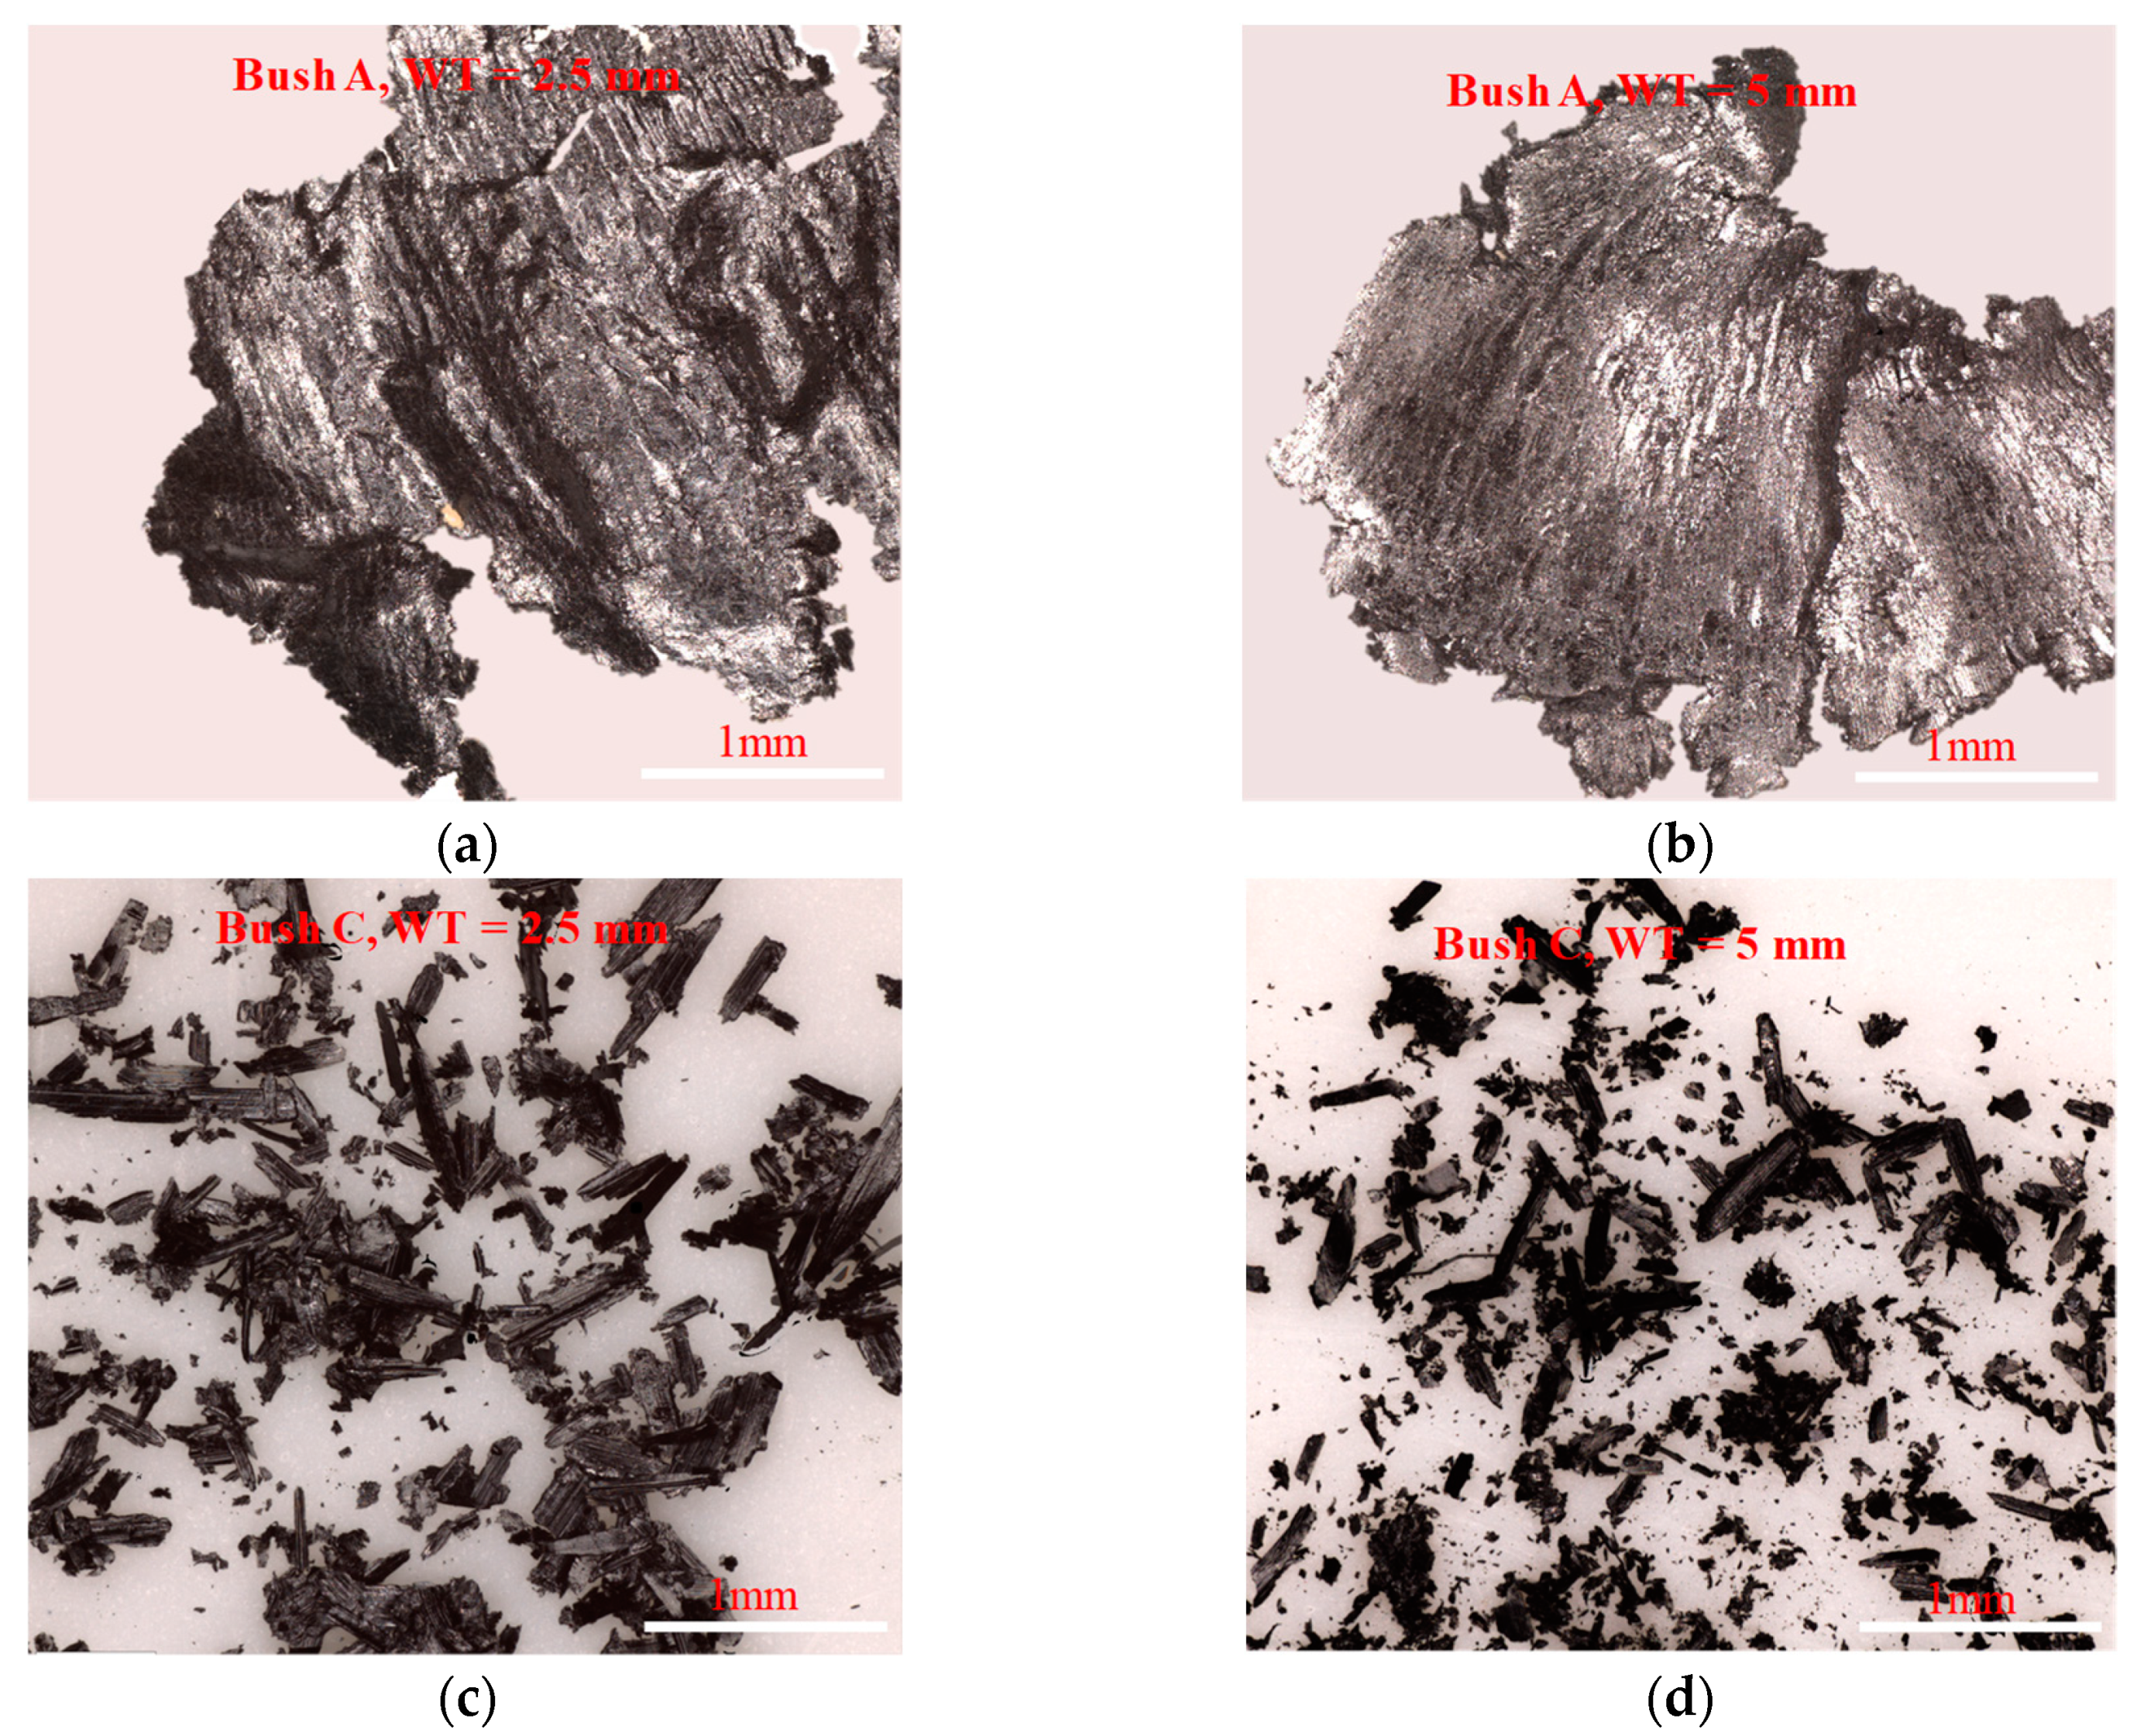
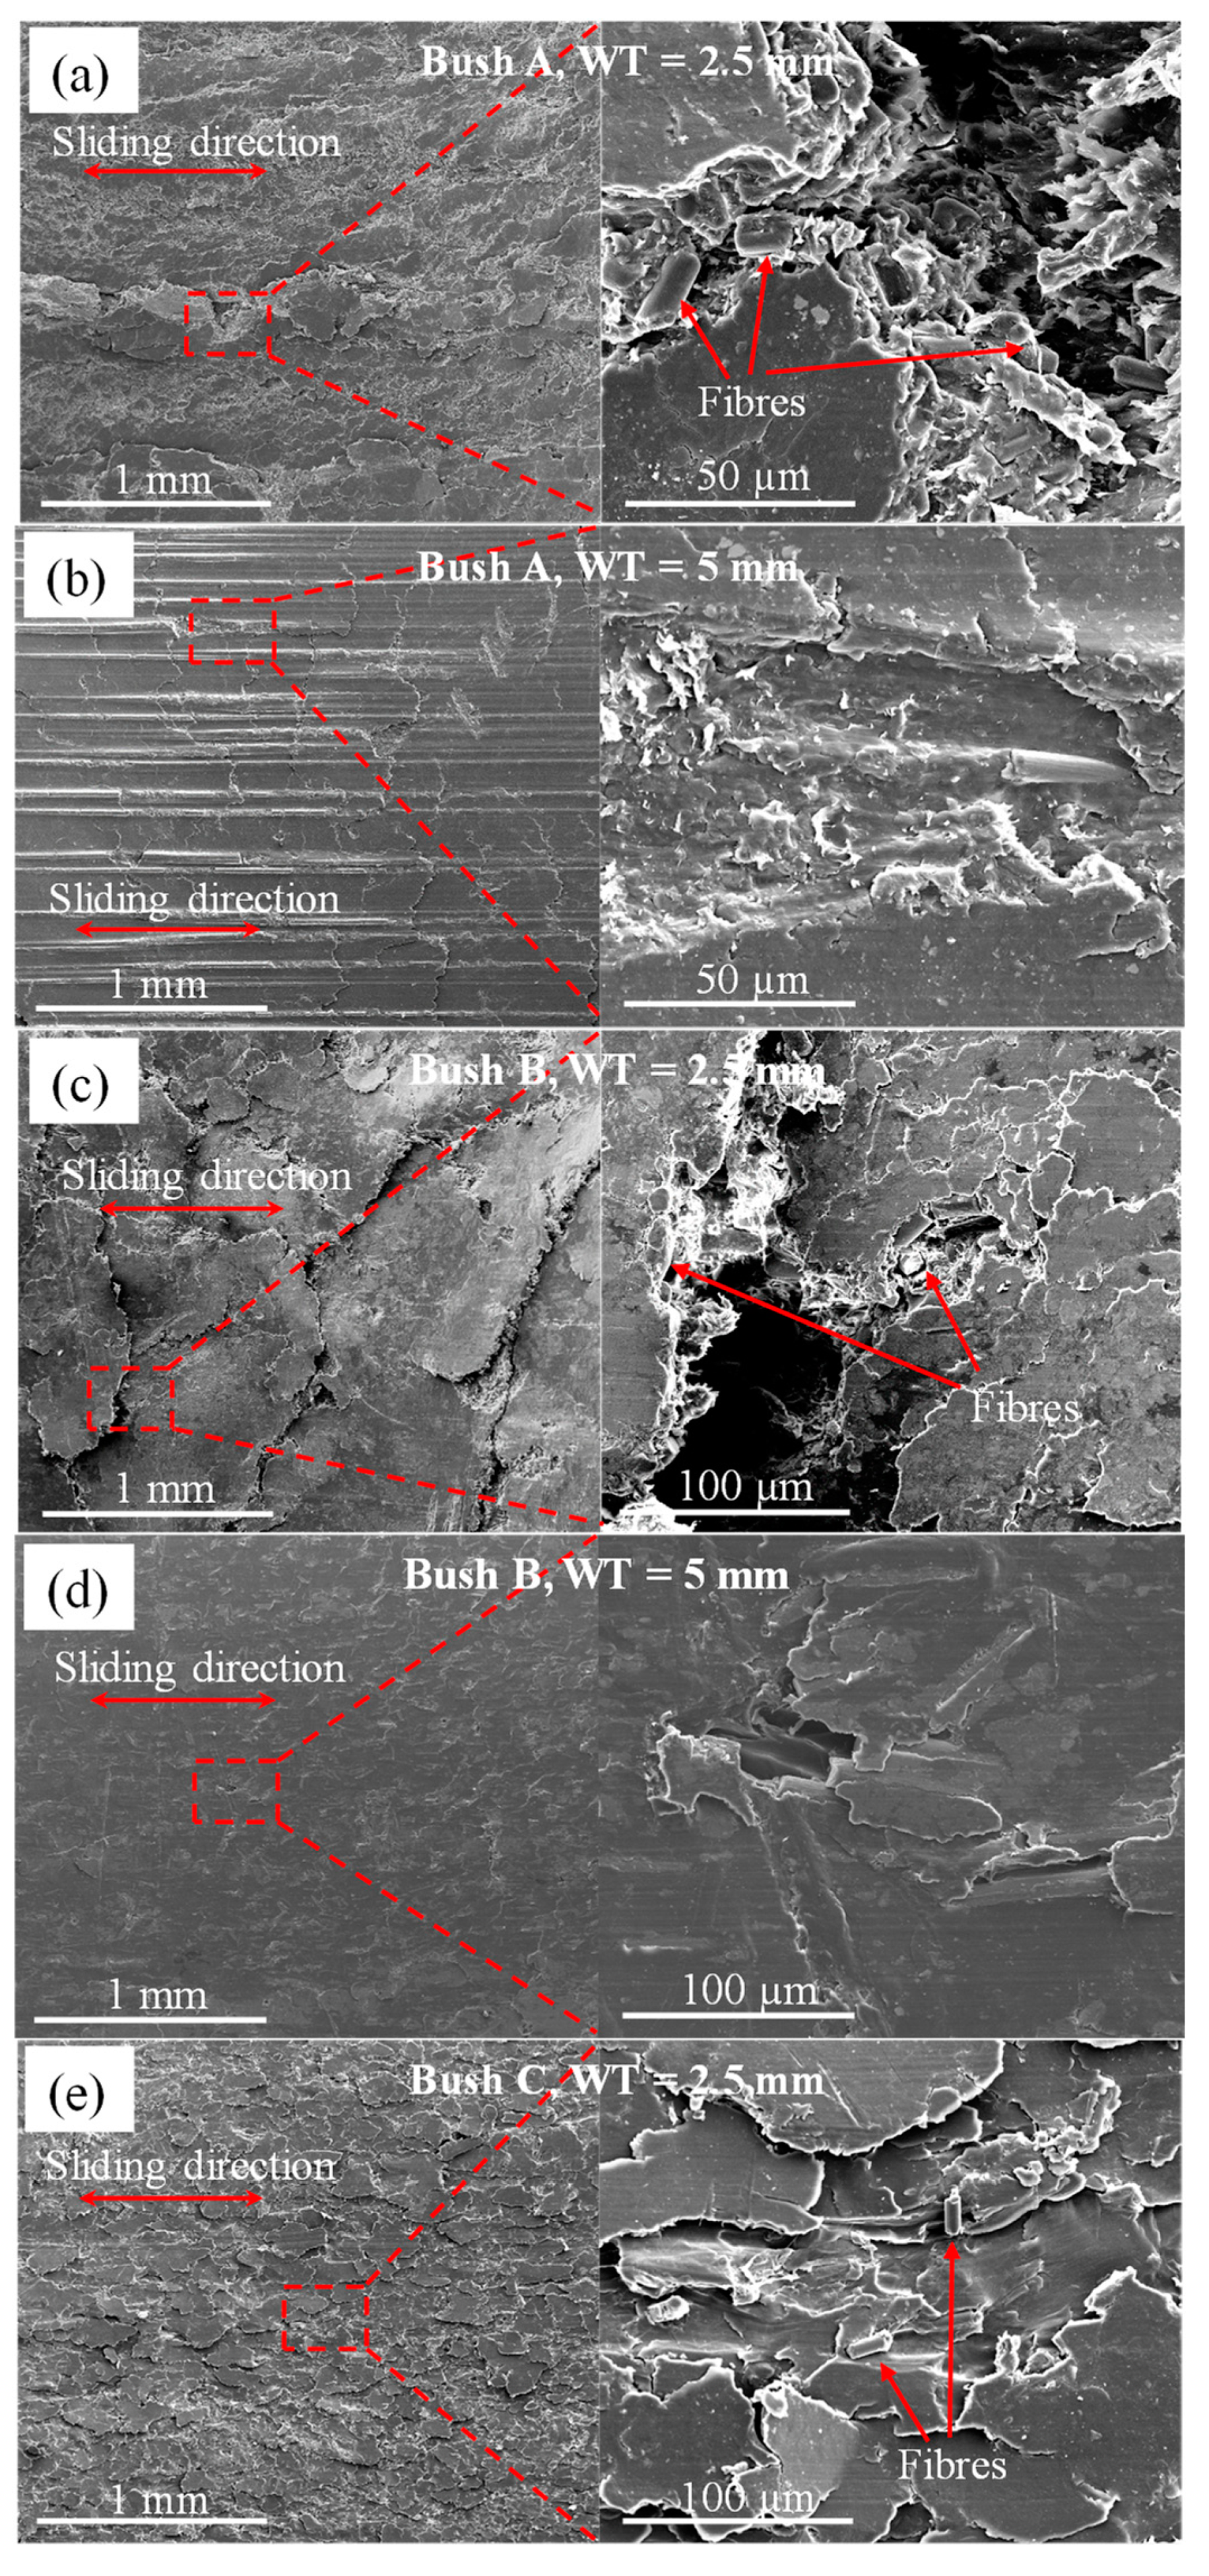
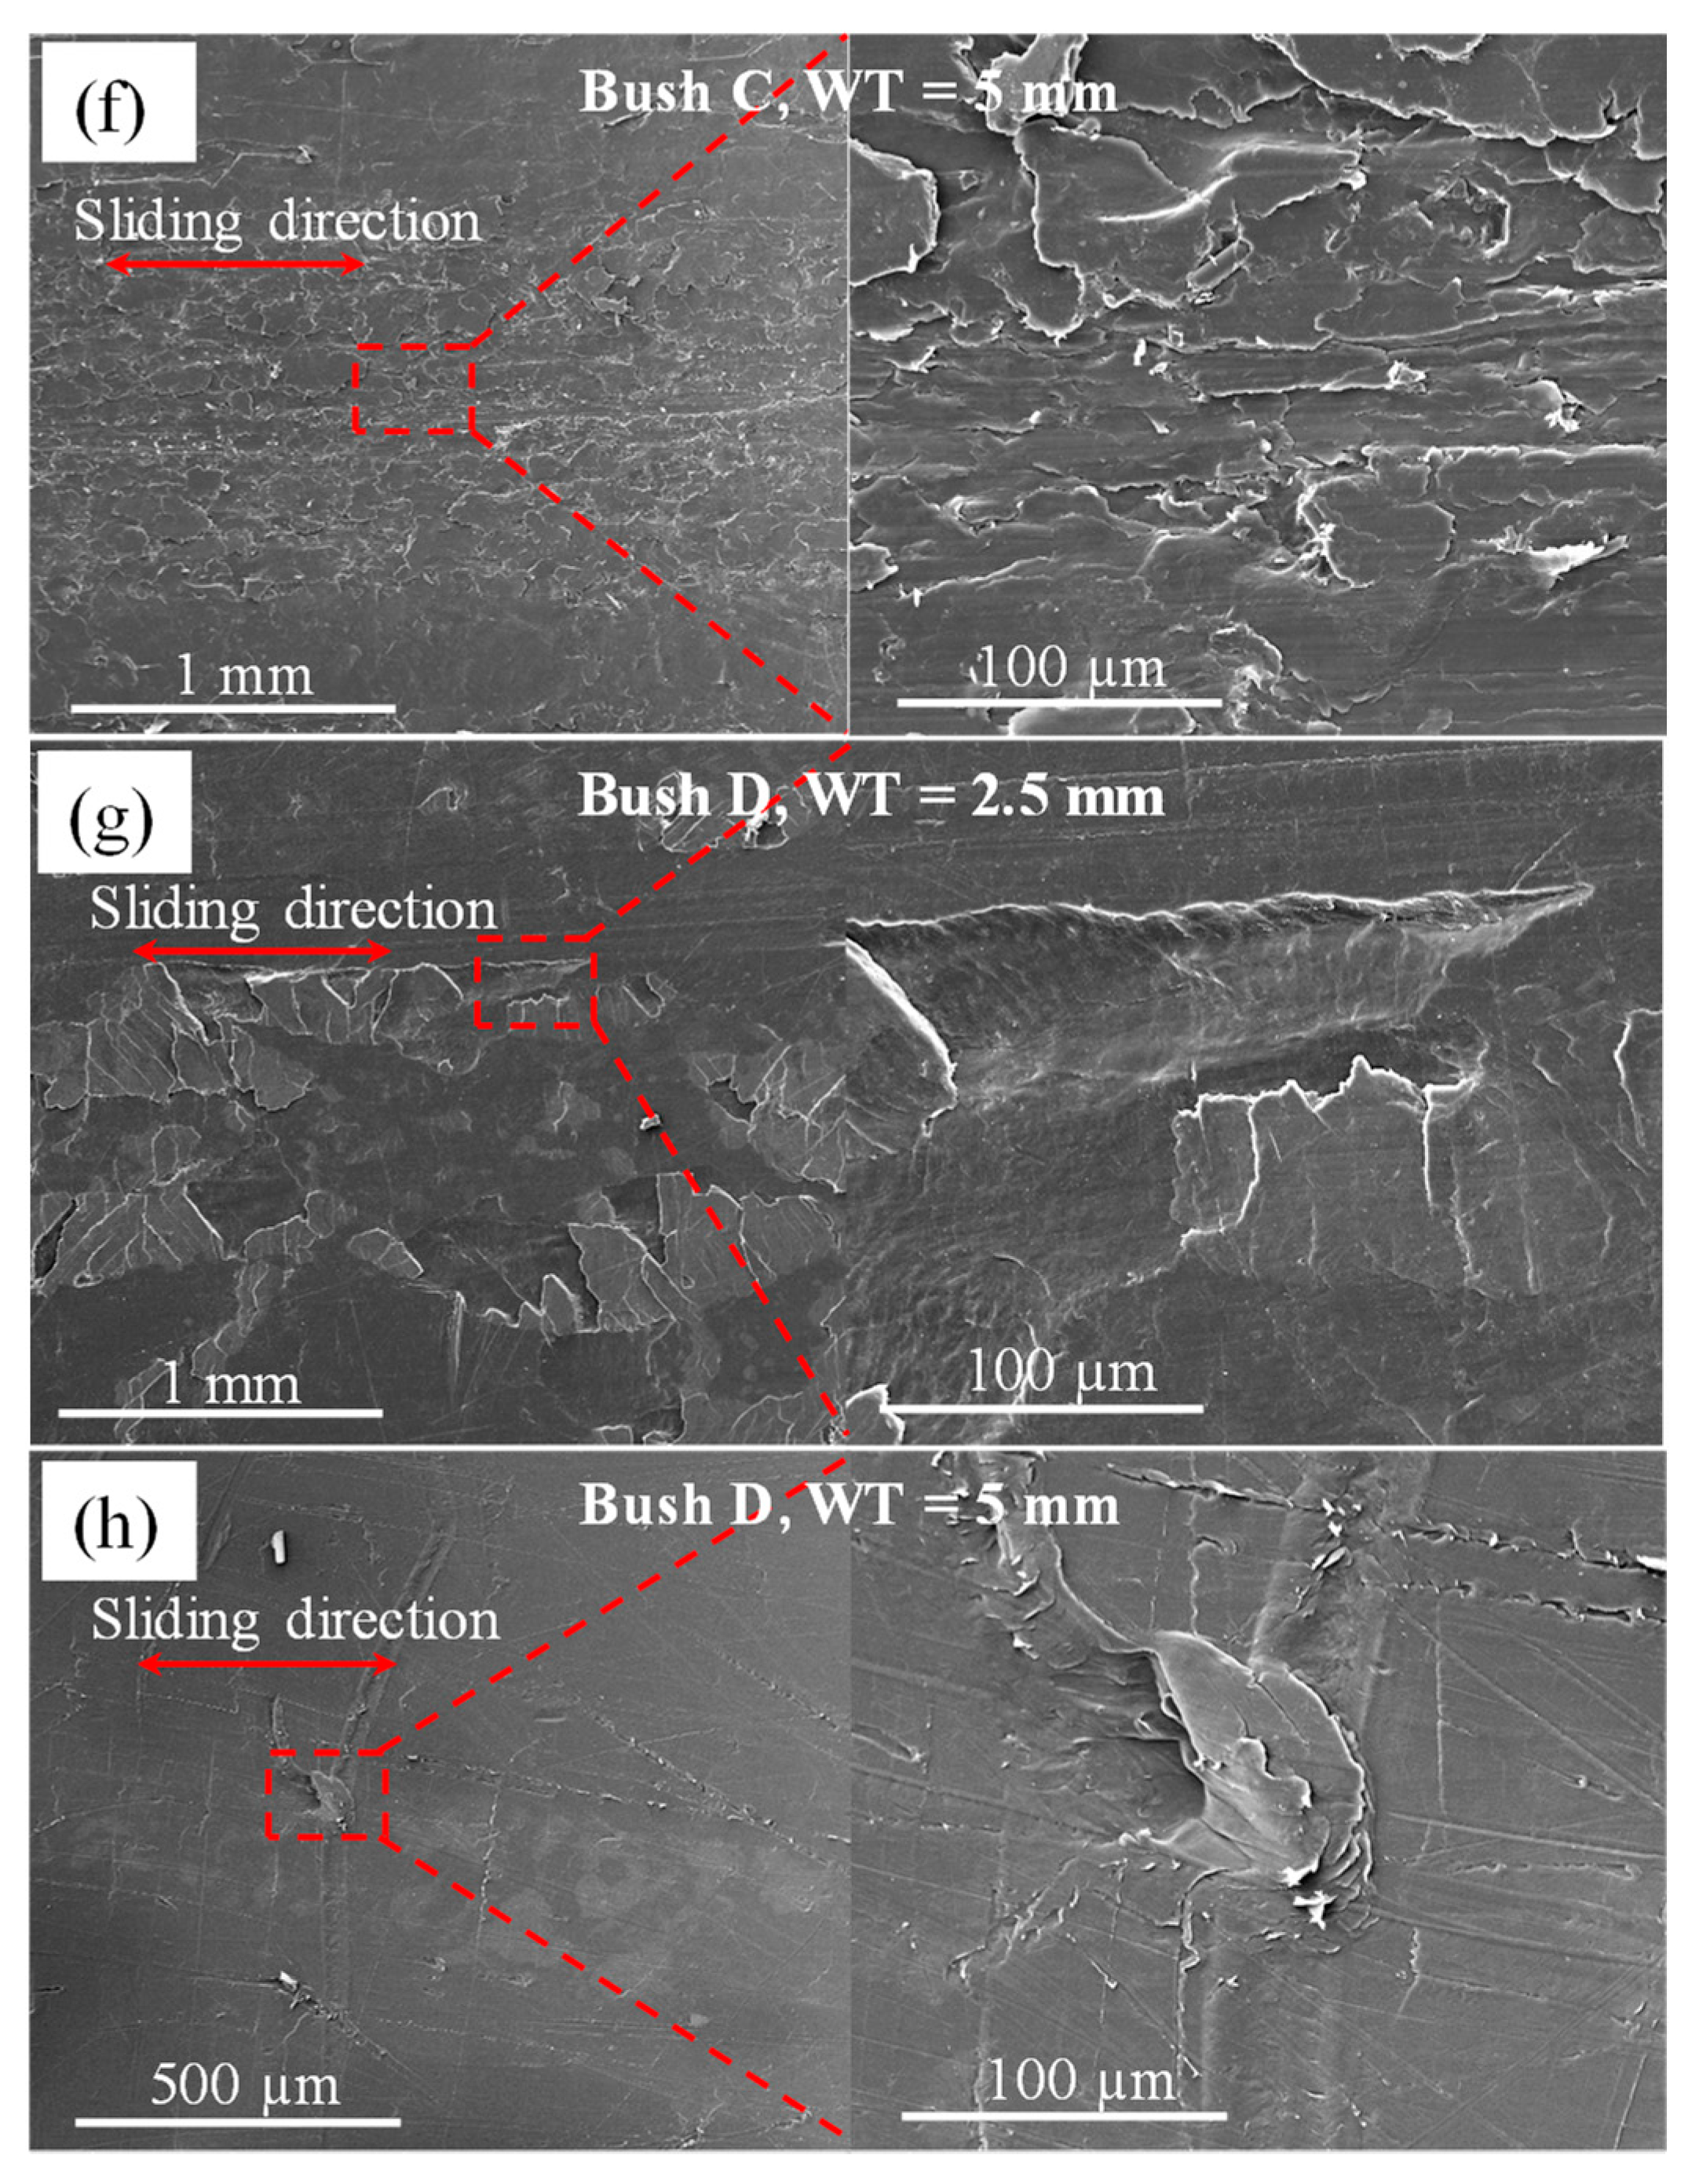
3.2. Wear Debris and Worn Surfaces
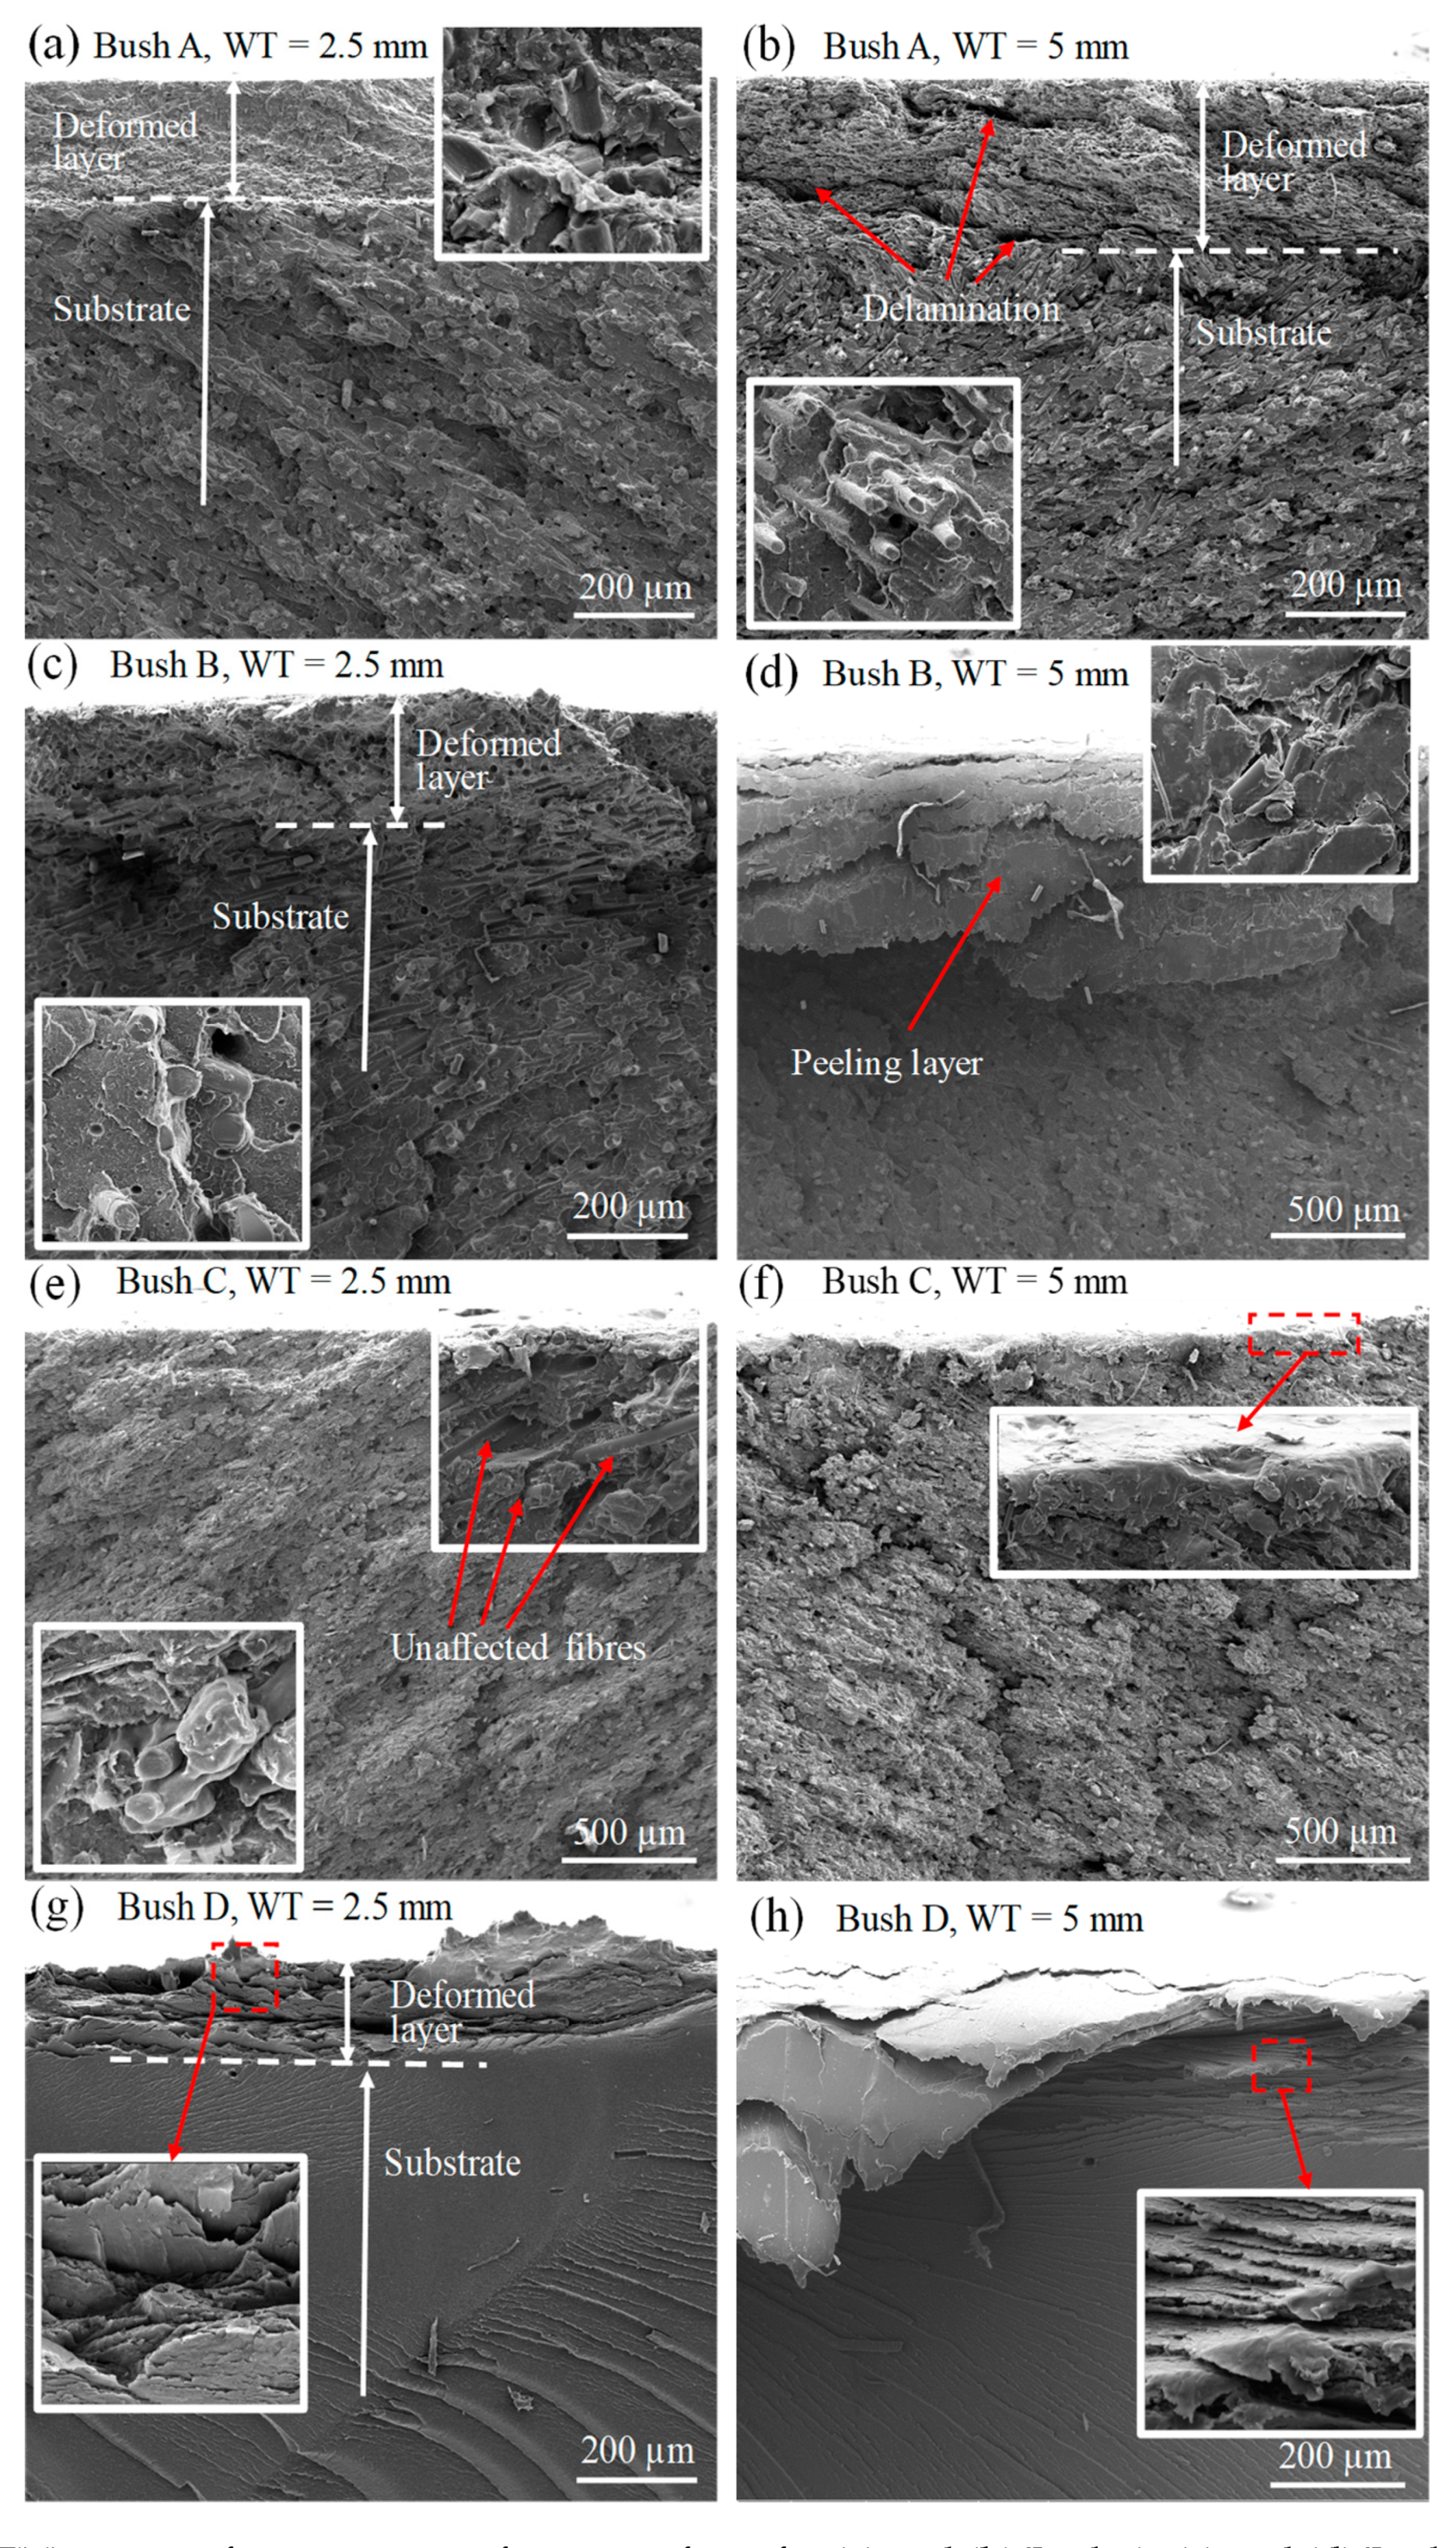
3.3. Cross Section of Worn Surfaces
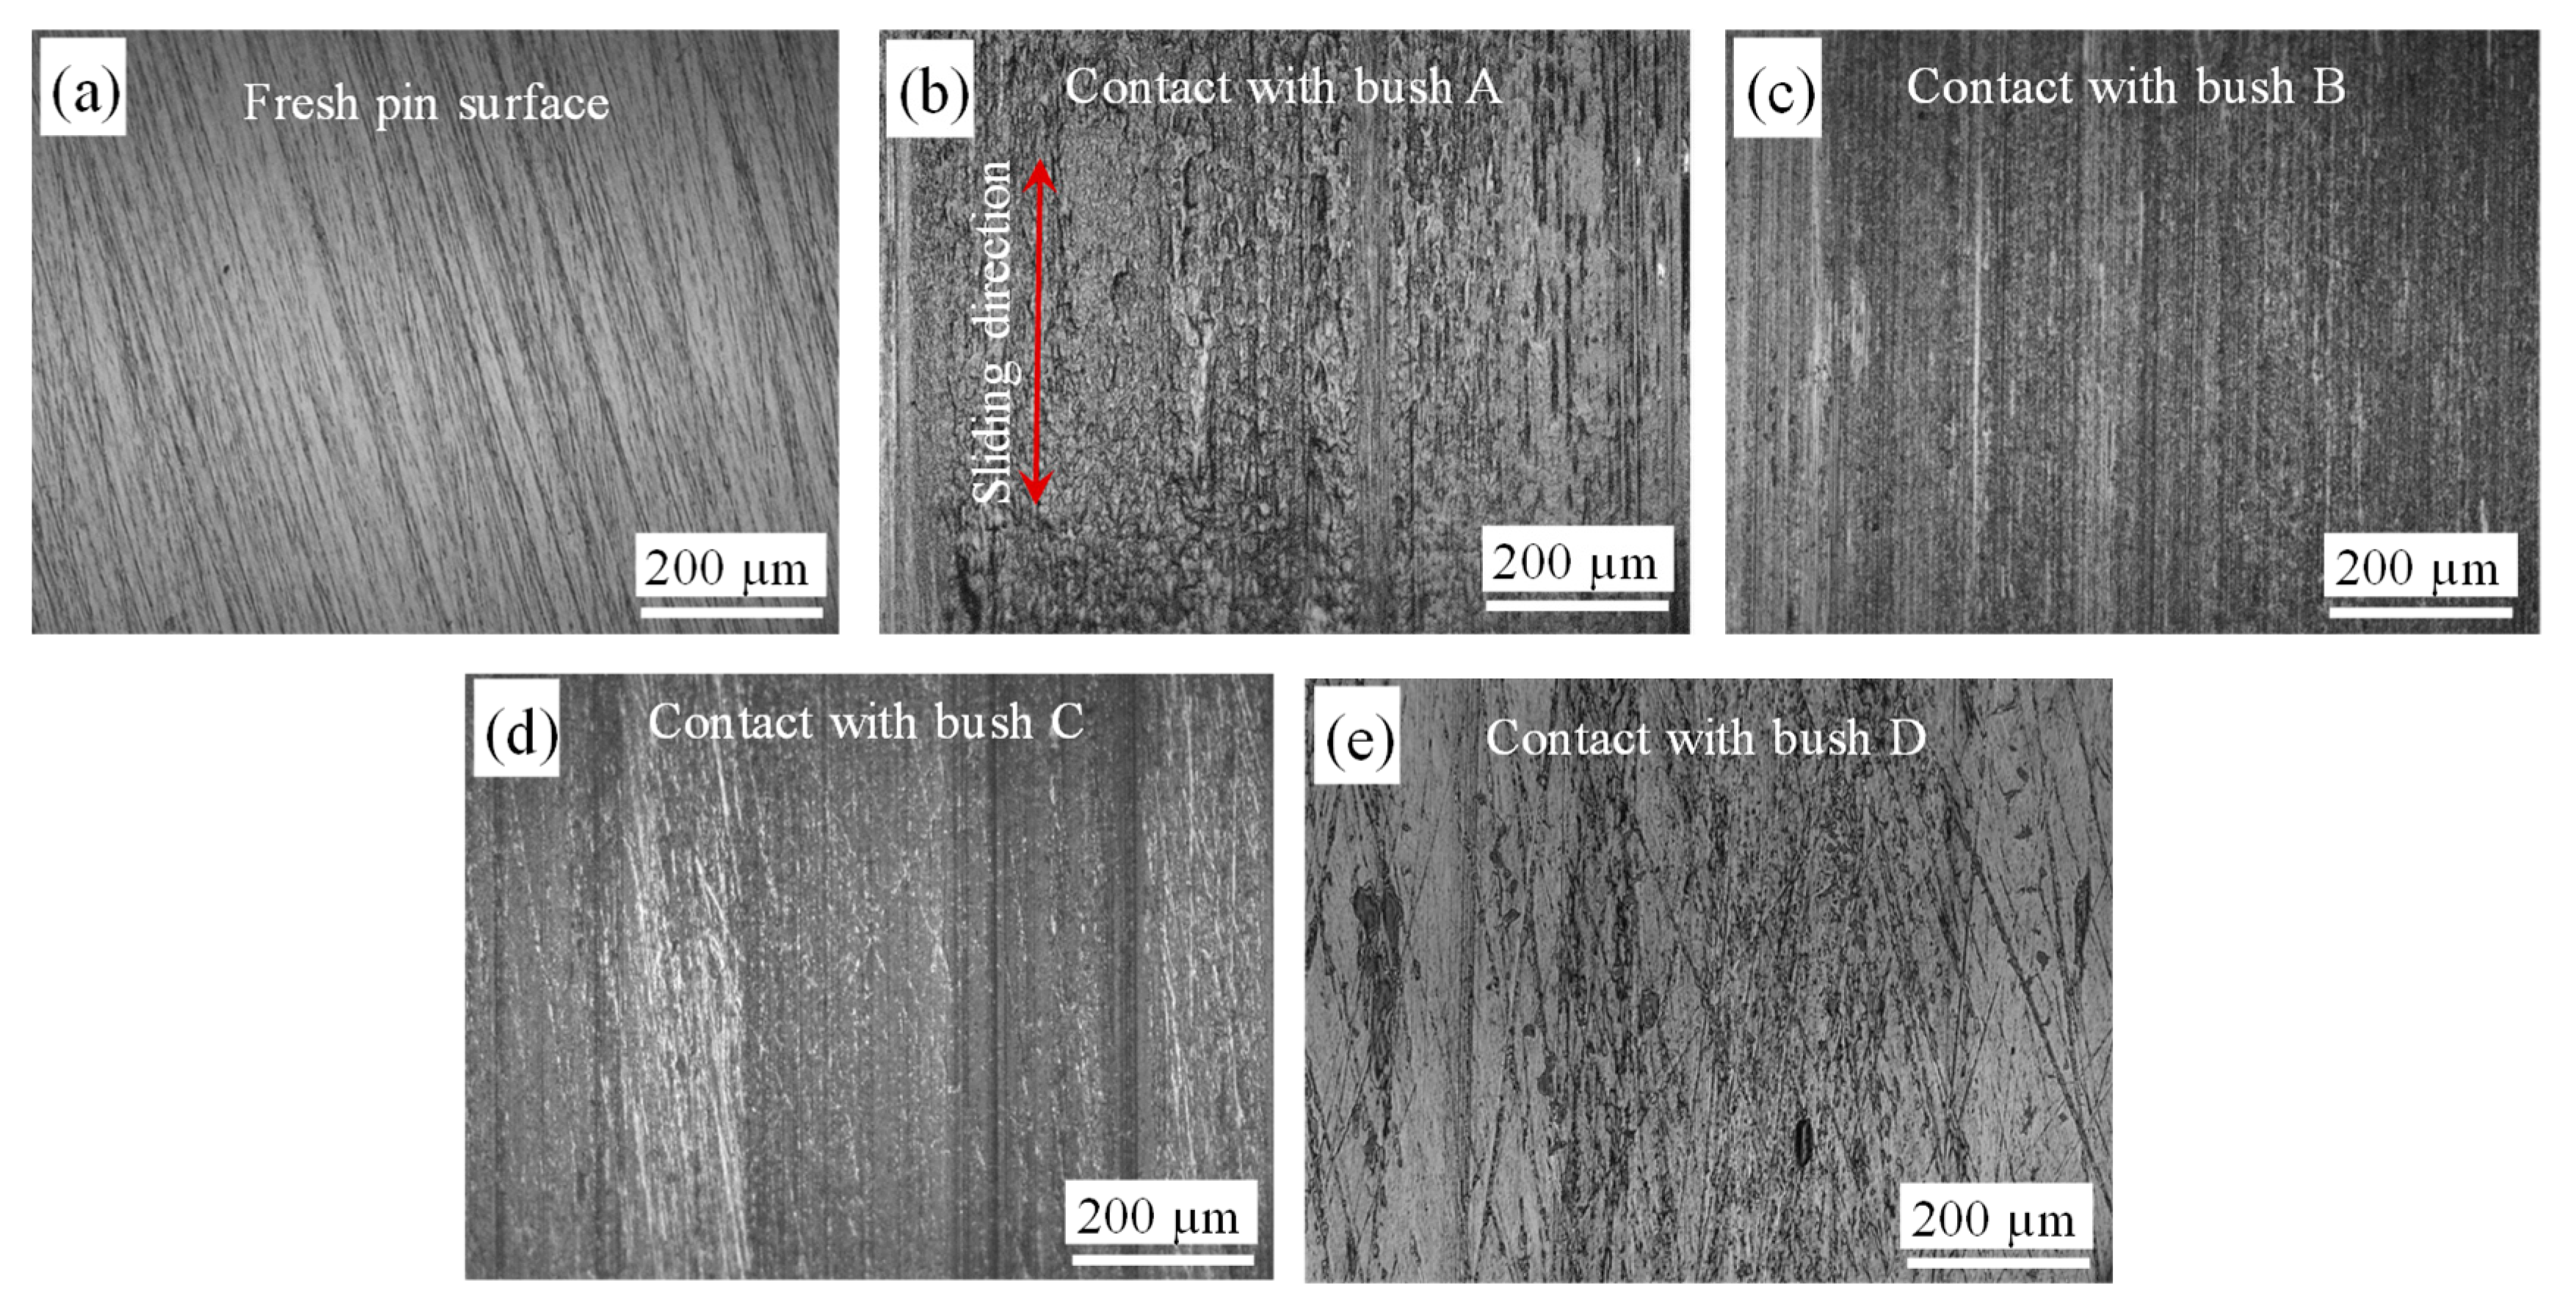
3.4. Worn Surface on Shafts
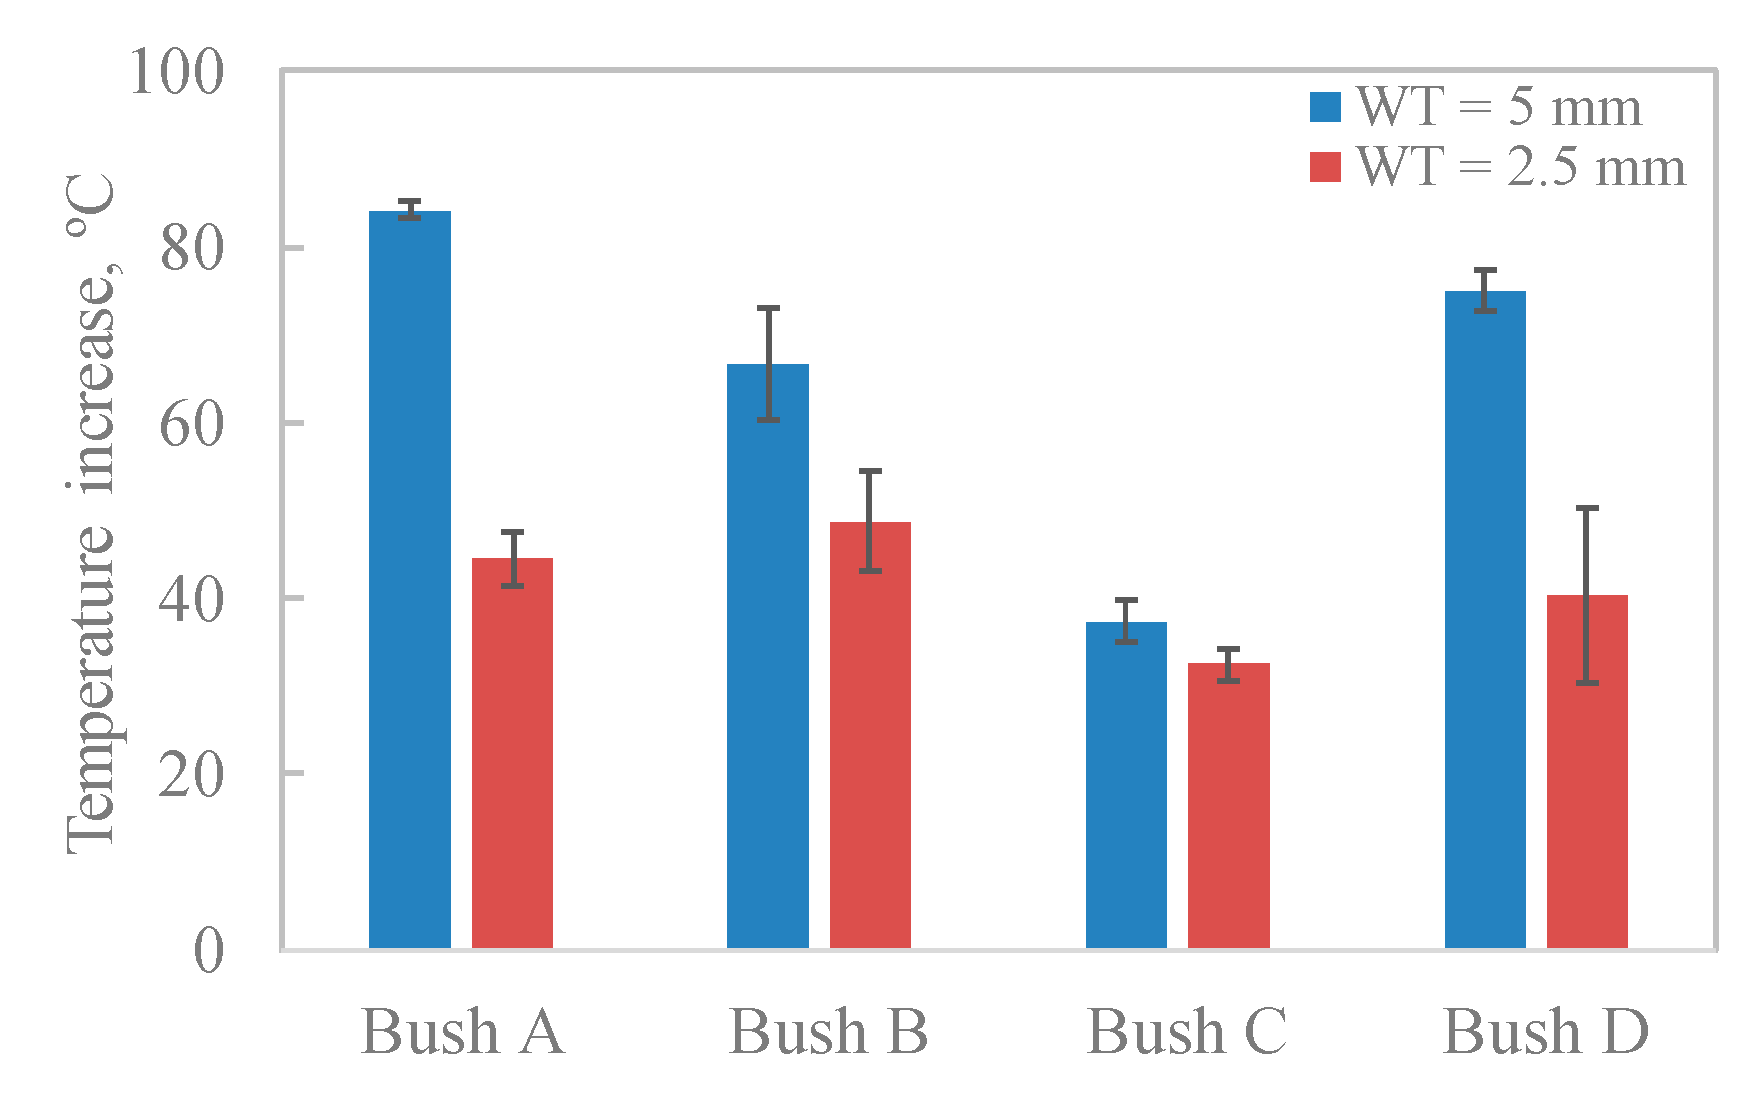
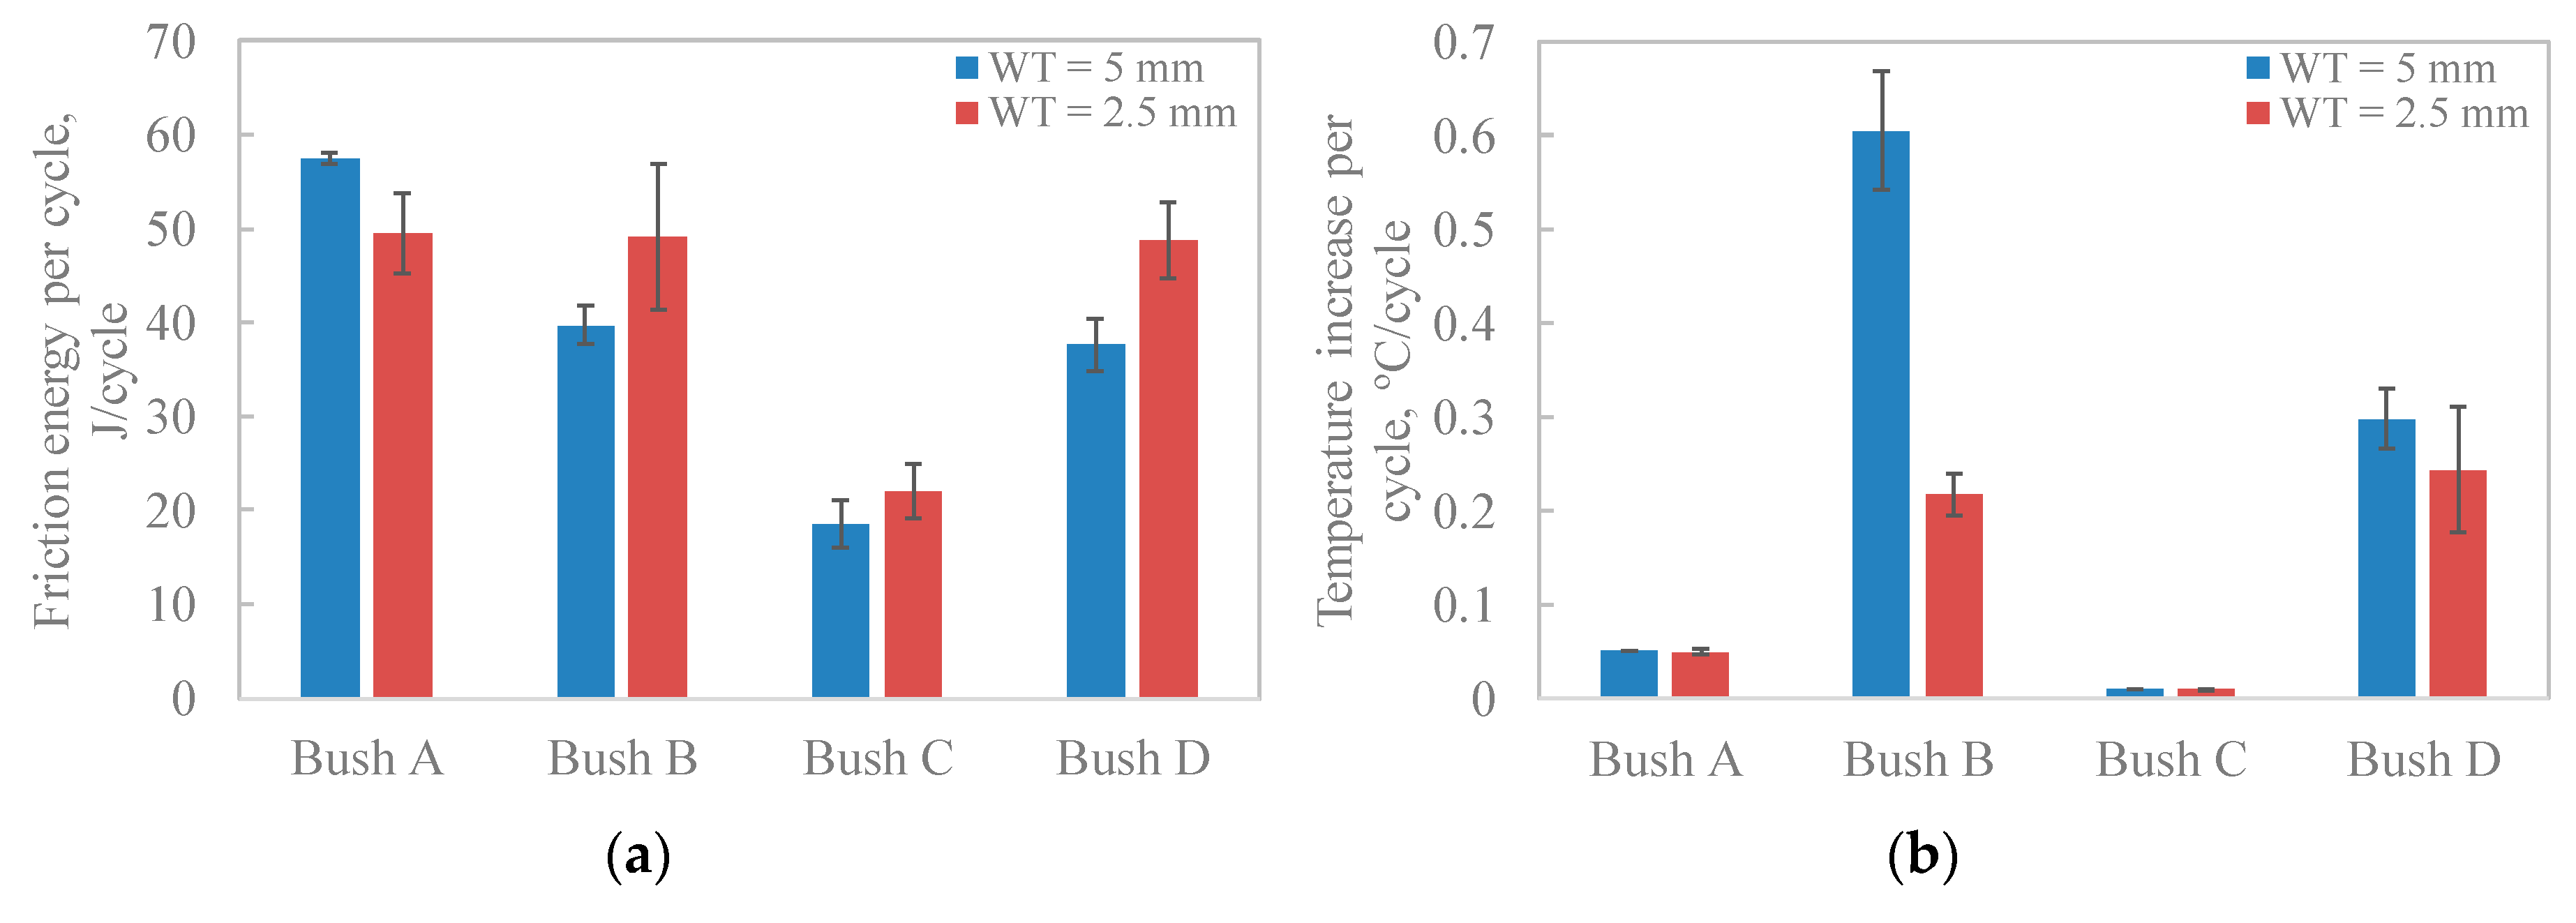
3.5. Friction Energy
4. Conclusions
Author Contributions
Funding
Acknowledgments
Conflicts of Interest
References
- Chen, B.; Wang, J.; Yan, F. Comparative investigation on the tribological behaviors of CF/PEEK composites under sea water lubrication. Tribol. Int. 2012, 52, 170–177. [Google Scholar] [CrossRef]
- Aldousiri, B.; Shalwan, A.; Chin, C.W. A review on tribological behaviour of polymeric composites and future reinforcements. Adv. Mater. Sci. Eng. 2013, 2013, 1–8. [Google Scholar] [CrossRef] [Green Version]
- Qi, Y.; Gong, J.; Cao, W.; Wang, H.; Ren, J.; Gao, G. Tribological behavior of PTFE composites filled with peek and nano-Al2O3. Tribol. Trans. 2018, 61, 694–704. [Google Scholar] [CrossRef]
- Hufenbach, W.A.; Stelmakh, A.; Kunze, K.; Böhm, R.; Kupfer, R. Tribo-Mechanical properties of glass fibre reinforced polypropylene composites. Tribol. Int. 2012, 49, 8–16. [Google Scholar] [CrossRef]
- Zhang, L.; Li, G.; Guo, Y.; Qi, H.; Che, Q.; Zhang, G. PEEK reinforced with low-loading 2D graphitic carbon nitride nanosheets: High wear resistance under harsh lubrication conditions. Compos. Part A Appl. Sci. Manuf. 2018, 109, 507–516. [Google Scholar] [CrossRef]
- Tang, Q.; Chen, J.; Liu, L. Tribological behaviours of carbon fibre reinforced PEEK sliding on silicon nitride lubricated with water. Wear 2010, 269, 541–546. [Google Scholar] [CrossRef]
- Friedrich, K. Polymer composites for tribological applications. Adv. Ind. Eng. Polym. Res. 2018, 1, 3–39. [Google Scholar] [CrossRef]
- Lewis, S.D.; Rowntree, R.A. Hybrid polymeric bearings for space applications. In Proceedings of the 7th European Space Mechanisms and Tribology Symposium, ESTEC, Noordwijk, The Netherlands, 1–3 October 1997; Kaldeich-Schürmann, B.H., Ed.; ESA SP-140. [Google Scholar]
- Laux, K.A.; Jean-Fulcrand, A.; Sue, H.J.; Bremner, T.; Wong, J.S.S. The influence of surface properties on sliding contact temperature and friction for polyetheretherketone (PEEK). Polymer 2016, 103, 397–404. [Google Scholar] [CrossRef] [Green Version]
- Laux, K.A.; Schwartz, C.J. Influence of linear reciprocating and multi-Directional sliding on PEEK wear performance and transfer film formation. Wear 2013, 301, 727–734. [Google Scholar] [CrossRef] [Green Version]
- Omrani, E.; Menezes, P.L.; Rohatgi, P.K. State of the art on tribological behavior of polymer matrix composites reinforced with natural fibers in the green materials world. Eng. Sci. Technol. Int. J. 2016, 19, 717–736. [Google Scholar] [CrossRef] [Green Version]
- Molazemhosseini, A.; Tourani, H.; Khavandi, A.; Yekta, B.E. Tribological performance of PEEK based hybrid composites reinforced with short carbon fibers and nano-Silica. Wear 2013, 303, 397–404. [Google Scholar] [CrossRef]
- Regis, M.; Lanzutti, A.; Bracco, P.; Fedrizzi, L. Wear behavior of medical grade PEEK and CFR PEEK under dry and bovine serum conditions. Wear 2018, 408–409, 86–95. [Google Scholar] [CrossRef]
- Sumer, M.; Unal, H.; Mimaroglu, A. Evaluation of tribological behaviour of PEEK and glass fibre reinforced PEEK composite under dry sliding and water lubricated conditions. Wear 2008, 265, 1061–1065. [Google Scholar] [CrossRef]
- Wang, Q.; Xue, Q.; Liu, H.; Shen, W.; Xu, J. The effect of particle size of nanometer ZrO2 on the tribological behaviour of PEEK. Wear 1996, 198, 216–219. [Google Scholar] [CrossRef]
- Zhang, Z.; Breidt, C.; Chang, L.; Friedrich, K. Wear of PEEK composites related to their mechanical performances. Tribol. Int. 2004, 37, 271–277. [Google Scholar] [CrossRef]
- Bijwe, J.; Sen, S.; Ghosh, A. Influence of PTFE content in PEEK-PTFE blends on mechanical properties and tribo-performance in various wear modes. Wear 2005, 258, 1536–1542. [Google Scholar] [CrossRef]
- Theiler, G.; Gradt, T. Environmental effects on the sliding behaviour of PEEK composites. Wear 2016, 368–369, 278–286. [Google Scholar] [CrossRef]
- Oyamada, T.; Ono, M.; Miura, H.; Kuwano, T. Effect of gas environment on friction behaviour and tribofilm formation of PEEK/Carbon fiber composite. Tribol. Trans. 2013, 56, 607–614. [Google Scholar] [CrossRef]
- Wang, Q.; Zheng, F.; Wang, T. Tribological properties of polymers PI, PTFE and PEEK atcryogenic temperature in vacuum. Cryogenics 2016, 75, 19–25. [Google Scholar] [CrossRef]
- Zhang, G.; Burkhart, T.; Wetzel, B. Tribological behavior of epoxy composites under diesel-Lubricated conditions. Wear 2013, 307, 174–181. [Google Scholar] [CrossRef]
- McCarthy, D.M.C.; Glavatskih, S.B. Assessment of polymer composites for hydrodynamic journal-Bearing applications. Lubr. Sci. 2009, 21, 331–341. [Google Scholar] [CrossRef]
- Conte, M.; Pinedo, B.; Igartua, A. Frictional heating calculation based on tailored experimental measurements. Tribol. Int. 2014, 74, 1–6. [Google Scholar] [CrossRef]
- Mizobe, K.; Honda, T.; Koike, H.; Santos, E.C.; Kida, K.; Kashima, Y. Relationship between load, rotation speed and, strength in all-PEEK and PEEK Race–PTFE retainer hybrid polymer bearings under dry rolling contact fatigue. Adv. Mater. Res. 2012, 567, 66–70. [Google Scholar] [CrossRef]
- Shi, X.C.; Orito, M.; Kashima, Y.; Mizobe, K.; Kida, K. Observation of cracks of PEEK polymer thrust bearings under rolling contact fatigue in water. Key Eng. Mater. 2016, 703, 172–177. [Google Scholar] [CrossRef]
- Brockett, C.L.; Carbone, S.; Abdelgaied, A.; Fisher, J.; Jennings, L.M. Influence of contact pressure, cross-shear and counterface material on the wear of PEEK and CFR-PEEK for orthopaedic applications. J. Mech. Behav. Biomed. Mater. 2016, 63, 10–16. [Google Scholar] [CrossRef] [PubMed] [Green Version]
- Koike, H.; Kanemasu, K.; Itakura, K.; Okazaki, S.; Takamiya, M.; Santos, E.C.; Kida, K. Measurement of fatigue and wear of PEEK bush and A7075 cam plate in humanoid robot joints. Mater. Res. Innov. 2014, 18, S38–S43. [Google Scholar] [CrossRef]
- Ensinger Ltd., UK. Available online: https://www.ensingerplastics.com/en-gb (accessed on 1 February 2020).
- Zhu, J.; Ma, L.; Dwyer-Joyce, R. Friction and wear behaviours of self-Lubricating peek composites for articulating pin joints. Tribol. Int. 2019. [Google Scholar] [CrossRef]
- Hoskins, T.J.; Dearn, K.D.; Chen, Y.K.; Kukureka, S.N. The wear of PEEK in rolling-sliding contact-Simulation of polymer gear applications. Wear 2014, 309, 35–42. [Google Scholar] [CrossRef] [Green Version]
- Myshkin, N.K.; Petrokovets, M.I.; Kovalev, A.V. Tribology of polymers: Adhesion, friction, wear, and mass-Transfer. Tribol. Int. 2005, 38, 910–921. [Google Scholar] [CrossRef]
- Zhang, G.; Liao, H.; Li, H.; Mateus, C.; Bordes, J.M.; Coddet, C. On dry sliding friction and wear behaviour of PEEK and PEEK/SiC-Composite coatings. Wear 2006, 260, 594–600. [Google Scholar] [CrossRef]
- Zhang, G.; Rasheva, Z.; Schlarb, A.K. Friction and wear variations of short carbon fiber (SCF)/PTFE/graphite (10 vol.%) filled PEEK: Effects of fiber orientation and nominal contact pressure. Wear 2010, 268, 893–899. [Google Scholar] [CrossRef]
- Zhang, G.; Zhang, C.; Nardin, P.; Li, W.Y.; Liao, H.; Coddet, C. Effects of sliding velocity and applied load on the tribological mechanism of amorphous polyether-Ether-Ketone (PEEK). Tribol. Int. 2008, 41, 79–86. [Google Scholar] [CrossRef]
- Myshkin, N.; Kovalev, A. Adhesion and surface forces in polymer tribology—A review. Friction 2018, 6, 143–155. [Google Scholar] [CrossRef]
- Bely, V.A.; Sviridenok, A.I.; Petrokovets, M.I.; Savkin, V.G. Friction and Wear in Polymer-Based Materials; Pergamon Press: Oxford, UK, 1982; pp. 109–125. [Google Scholar]
- Bijwe, J.; Kumar, M.; Gurunath, P.V.; Desplanques, Y.; Degallaix, G. Optimization of brass contents for best combination of tribo-Performance and thermal conductivity of non-Asbestos organic (NAO) friction composites. Wear 2008, 265, 699–712. [Google Scholar] [CrossRef]
- Mu, L.; Shi, Y.; Feng, X.; Zhu, J.; Lu, X. The effect of thermal conductivity and friction coefficient on the contact temperature of polyimide composites: Experimental and finite element simulation. Tribol. Int. 2012, 53, 45–52. [Google Scholar] [CrossRef]
- Rae, P.J.; Dattelbaum, D.M. The properties of poly (tetrafluoroethylene) (PTFE) in compression. Polymer 2004, 45, 7615–7625. [Google Scholar] [CrossRef]


| Specimen | PEEK Composite Reinforcements | Density, g/cm3 | Elastic Modulus, GPa | Compression Strength @ 10% Strain, MPa | Rockwell Hardness, M Scale | Elongation at Break @22.8 °C, % | Thermal Conductivity, Wm−1°C−1 |
|---|---|---|---|---|---|---|---|
| Bush A | 30 wt % carbon fibre | 1.41 | 6.34 | 165 | 107 | 7 | 0.92 |
| Bush B | 30 wt % glass fibre | 1.53 | 6.89 | 172 | 103 | 2.2 | 0.3 |
| Bush C | 10 wt % each, carbon fibre, graphite, PTFE | 1.46 | 5.52 | 114 | 95 | 2.5 | 0.82 |
| Bush D | None | 1.31 | 4.48 | 121 | 99 | 40 | 0.29 |
| Nominal Contact Pressure | Articulating Displacement | Articulating Speed | Pin Radius | Bush Arc Angle | Bush Width | Bush Wall Thickness | Oscillating Cycles |
|---|---|---|---|---|---|---|---|
| p = 93 MPa | −60° to +60° | 45 °/s (3.9 mm/s) | R = 5 mm | 120° | L = 10 mm | WT = 2.5/5 mm | Vary |
| Bush A | Bush C | |||
|---|---|---|---|---|
| WT, mm | 2.5 | 5 | 2.5 | 5 |
| Wear coefficient, ×10−6 mm3/Nm | 4.33 ± 0.78 | 3.76 ± 0.65 | 0.73 ± 0.04 | 0.13 ± 0.04 |
| Bush A | Bush B | Bush C | Bush D | |||||
|---|---|---|---|---|---|---|---|---|
| WT, mm | 2.5 | 5 | 2.5 | 5 | 2.5 | 5 | 2.5 | 5 |
| Friction energy, ×104 J | 4.46 ± 0.48 | 9.53 ± 0.01 | 1.08 ± 0.11 | 0.44 ± 0.01 | 7.52 ± 1.59 | 7.15 ± 1.12 | 0.84 ± 0.16 | 0.97 ± 0.13 |
| Specific wear energy, ×104 J/mg | 0.29 ± 0.06 | 0.46 ± 0.09 | - | - | 0.79 ± 0.07 | 4.36 ± 0.64 | - | - |
| Temperature rise, °C | 44.5 ± 3.06 | 84.16 ± 0.9 | 48.74 ± 5.58 | 66.54 ± 6.37 | 32.47 ± 1.8 | 37.4 ± 2.31 | 40.33 ± 10.03 | 75.02 ± 2.4 |
© 2020 by the authors. Licensee MDPI, Basel, Switzerland. This article is an open access article distributed under the terms and conditions of the Creative Commons Attribution (CC BY) license (http://creativecommons.org/licenses/by/4.0/).
Share and Cite
Zhu, J.; Xie, F.; Dwyer-Joyce, R.S. PEEK Composites as Self-Lubricating Bush Materials for Articulating Revolute Pin Joints. Polymers 2020, 12, 665. https://doi.org/10.3390/polym12030665
Zhu J, Xie F, Dwyer-Joyce RS. PEEK Composites as Self-Lubricating Bush Materials for Articulating Revolute Pin Joints. Polymers. 2020; 12(3):665. https://doi.org/10.3390/polym12030665
Chicago/Turabian StyleZhu, Juanjuan, Fang Xie, and R S Dwyer-Joyce. 2020. "PEEK Composites as Self-Lubricating Bush Materials for Articulating Revolute Pin Joints" Polymers 12, no. 3: 665. https://doi.org/10.3390/polym12030665