


The Reliability of SAC305 Individual Solder Joints during Creep–Fatigue Conditions at Room Temperature

Abstract
:1. Introduction
2. Materials and Methods
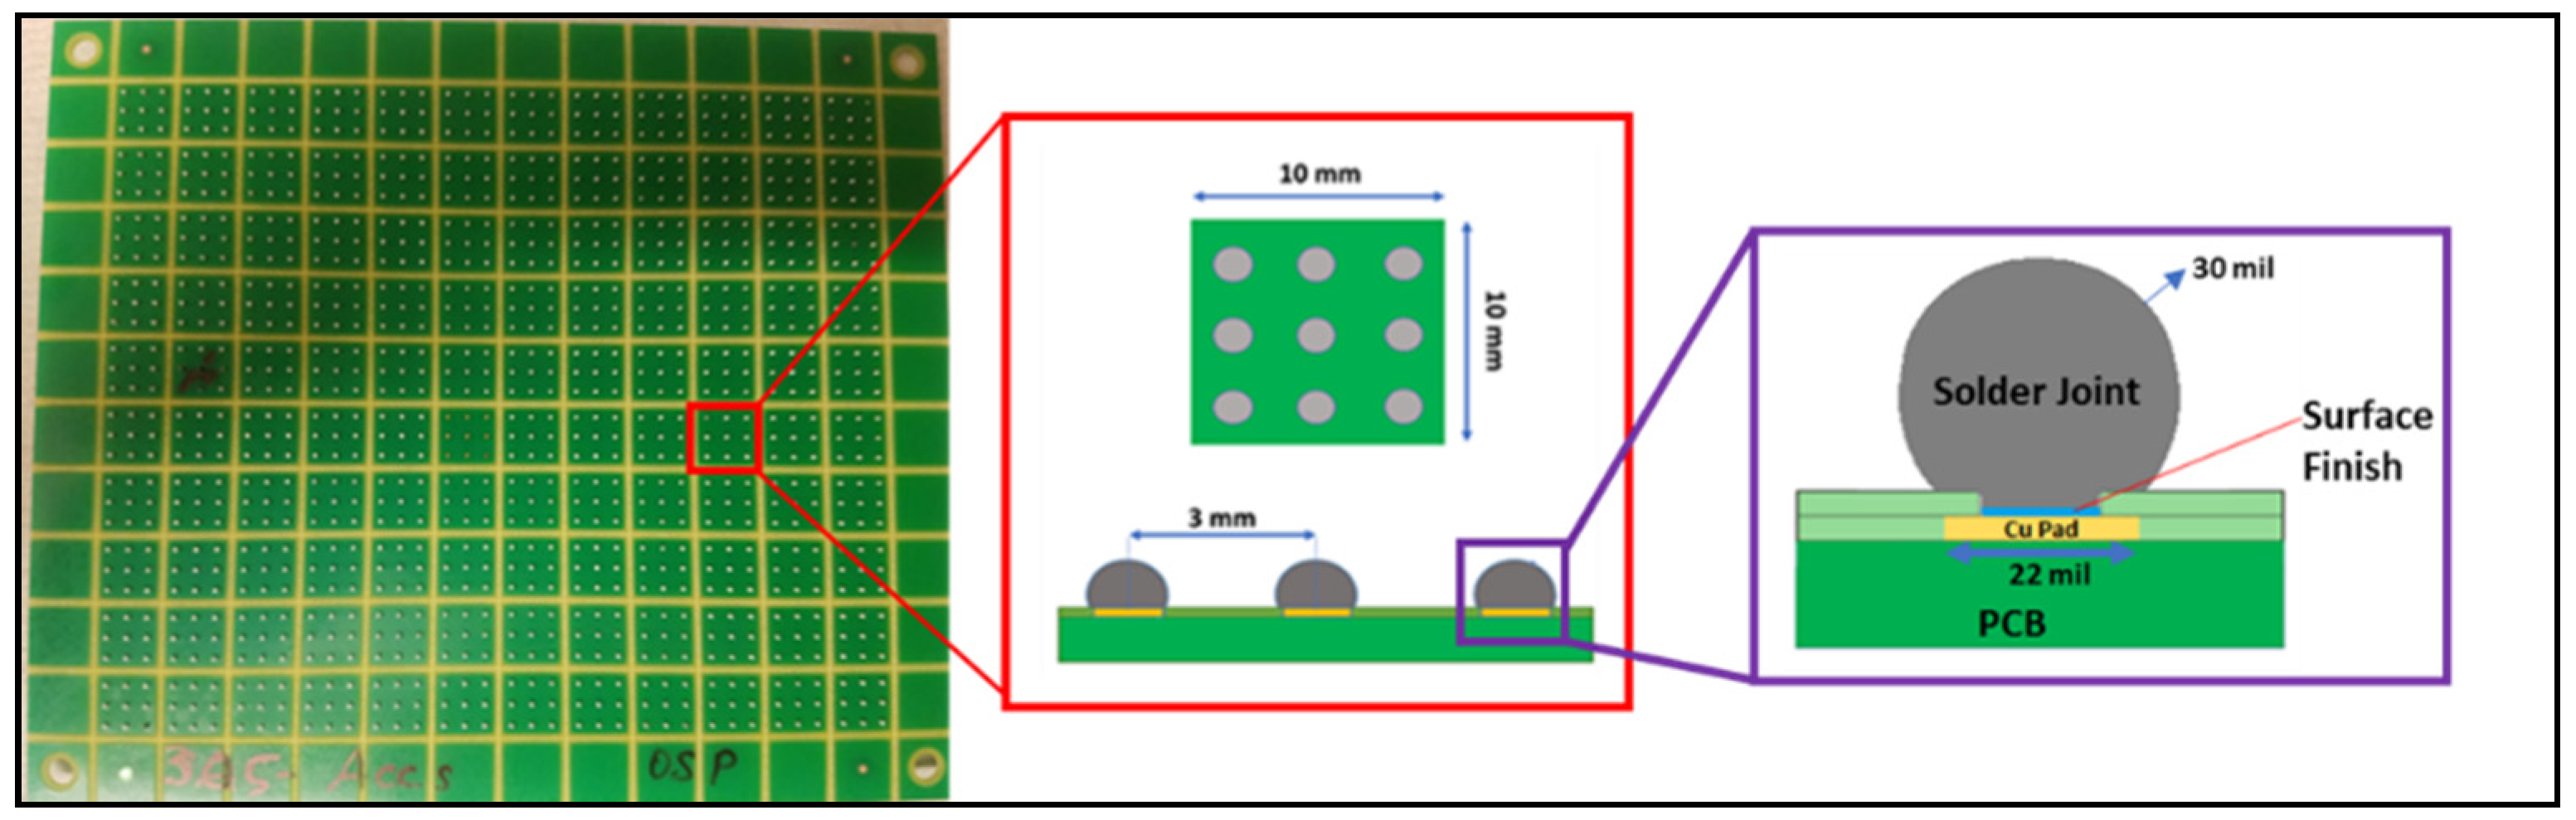
2.1. Test Vehicle
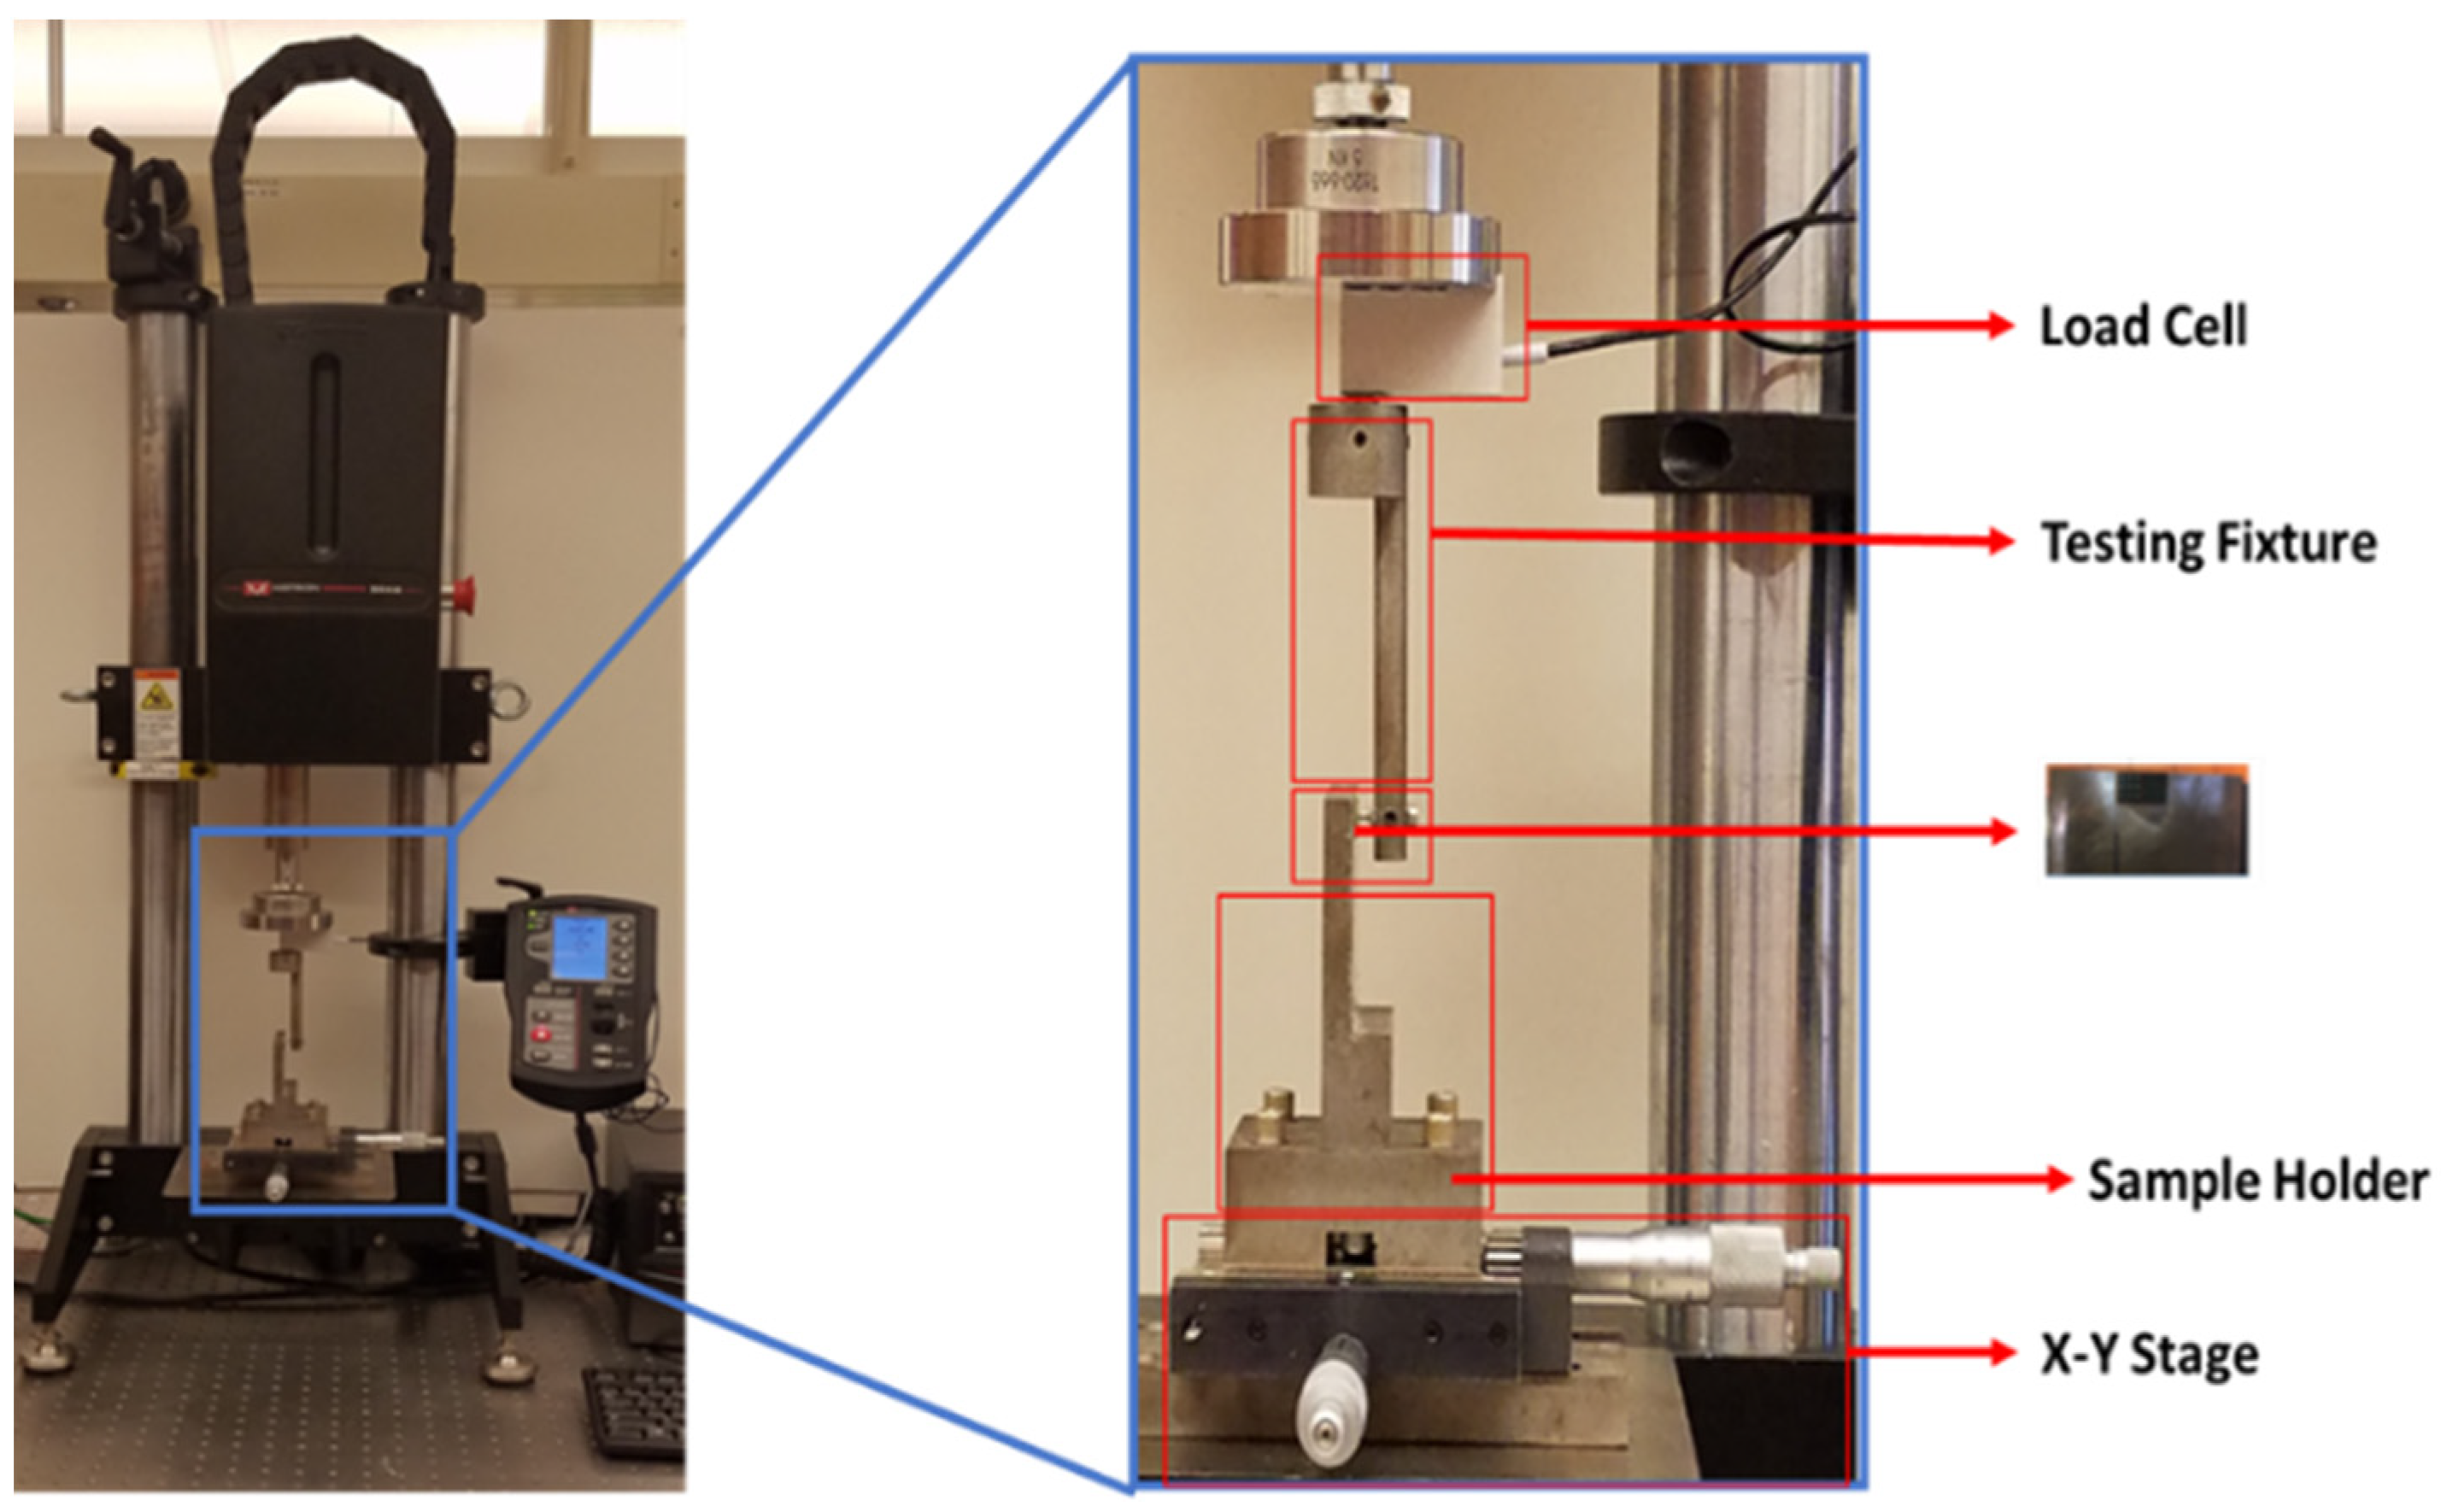
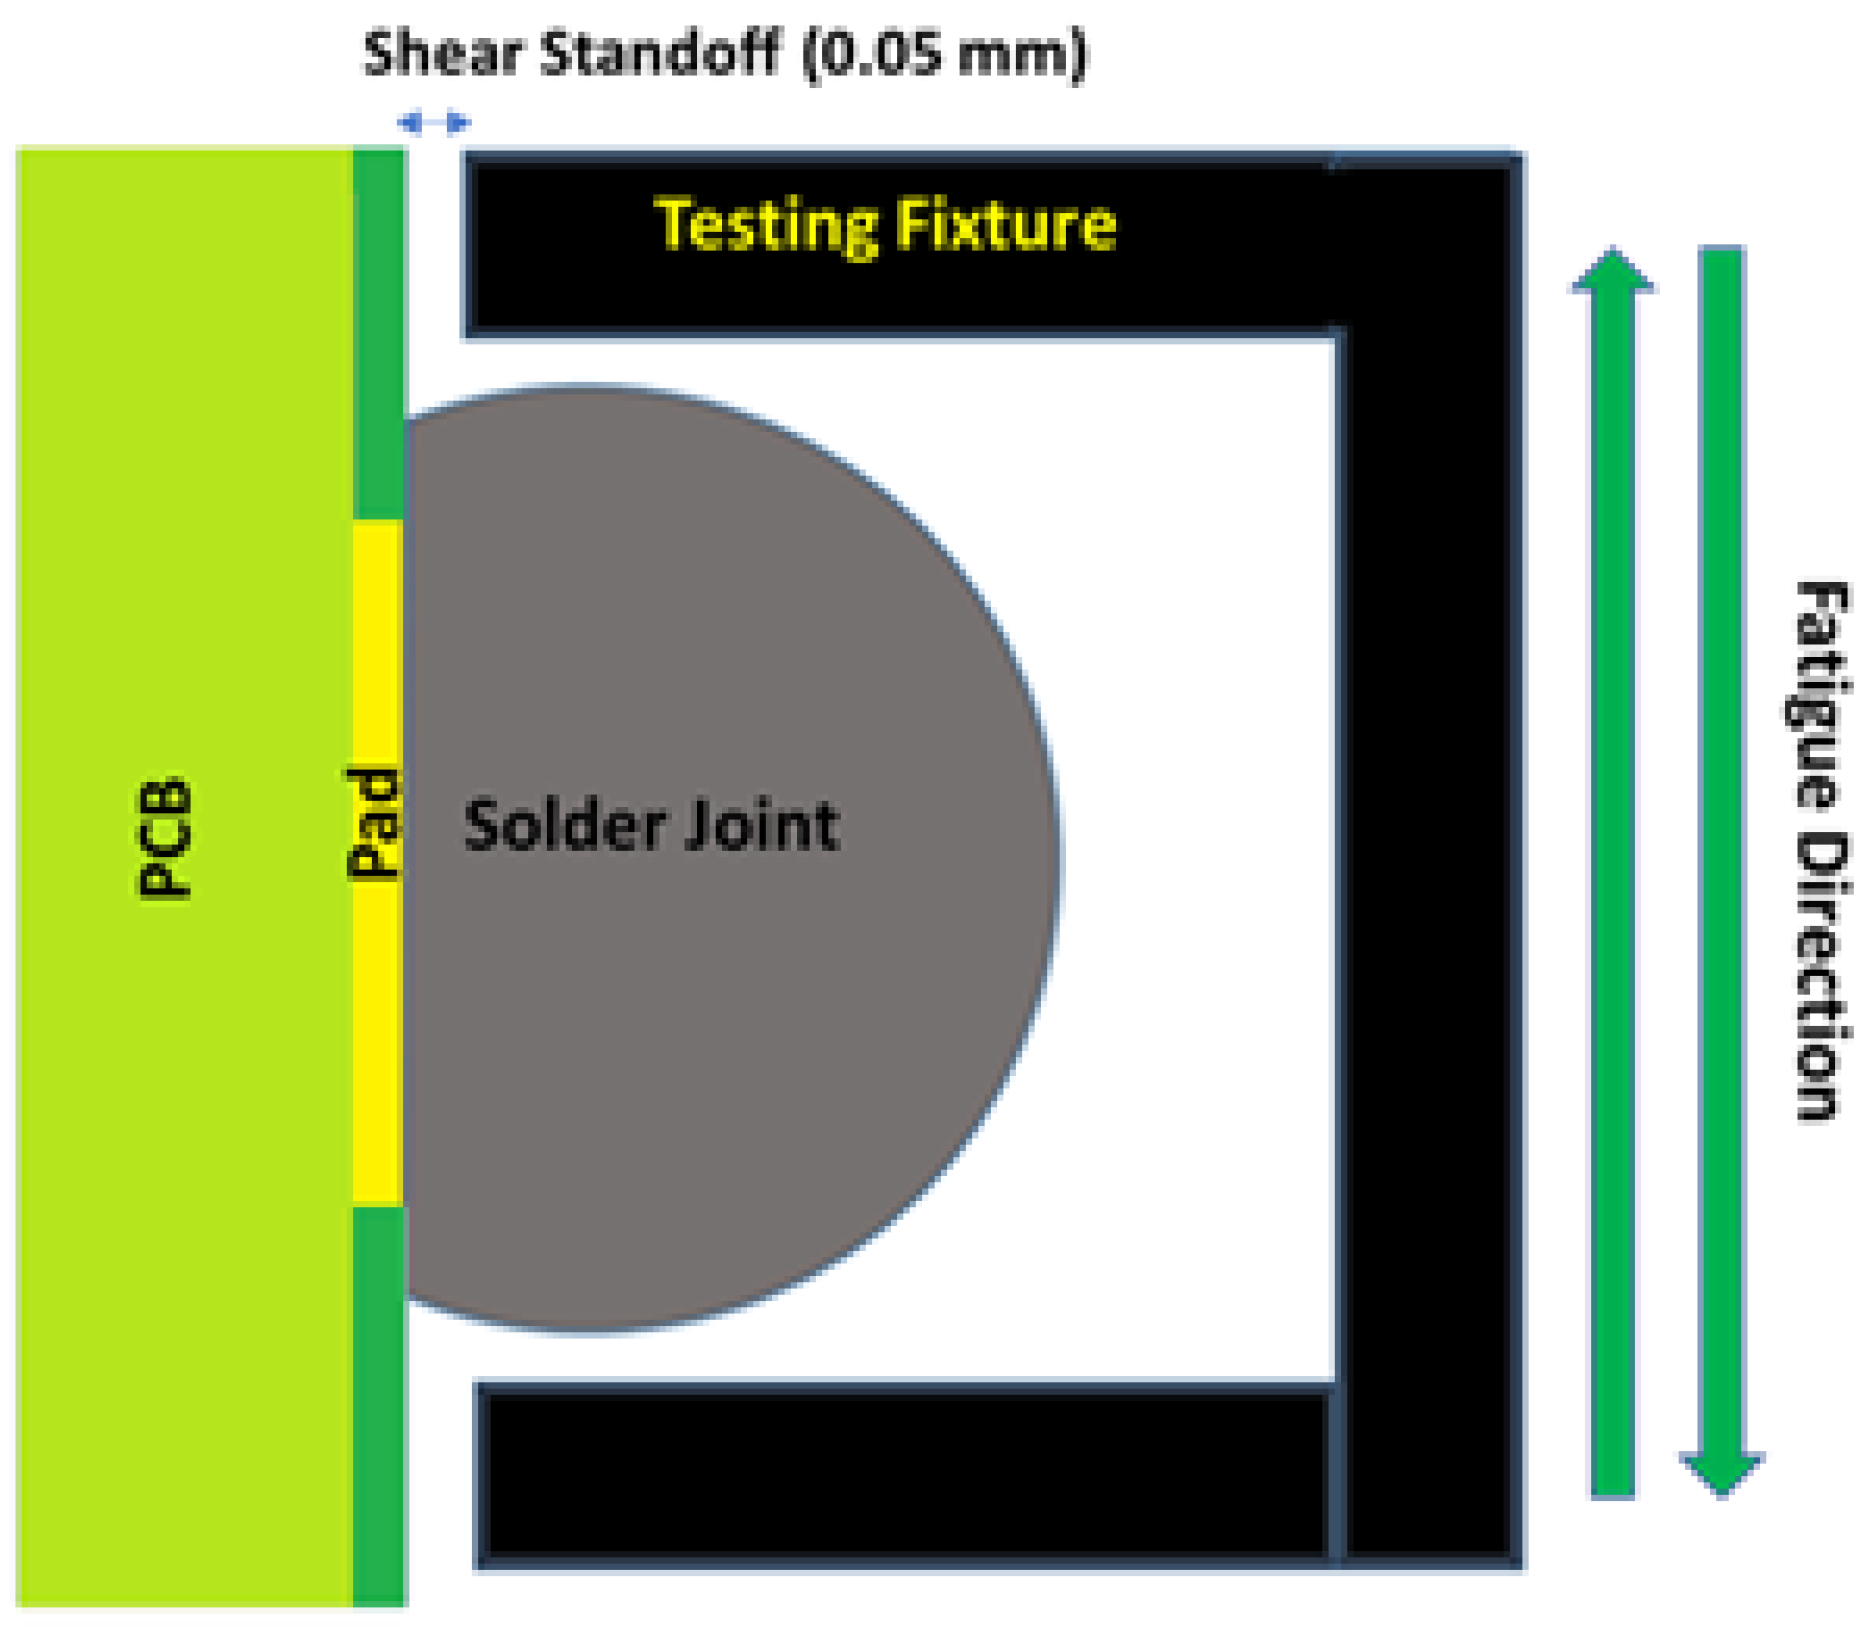
2.2. Experimental Set-Up
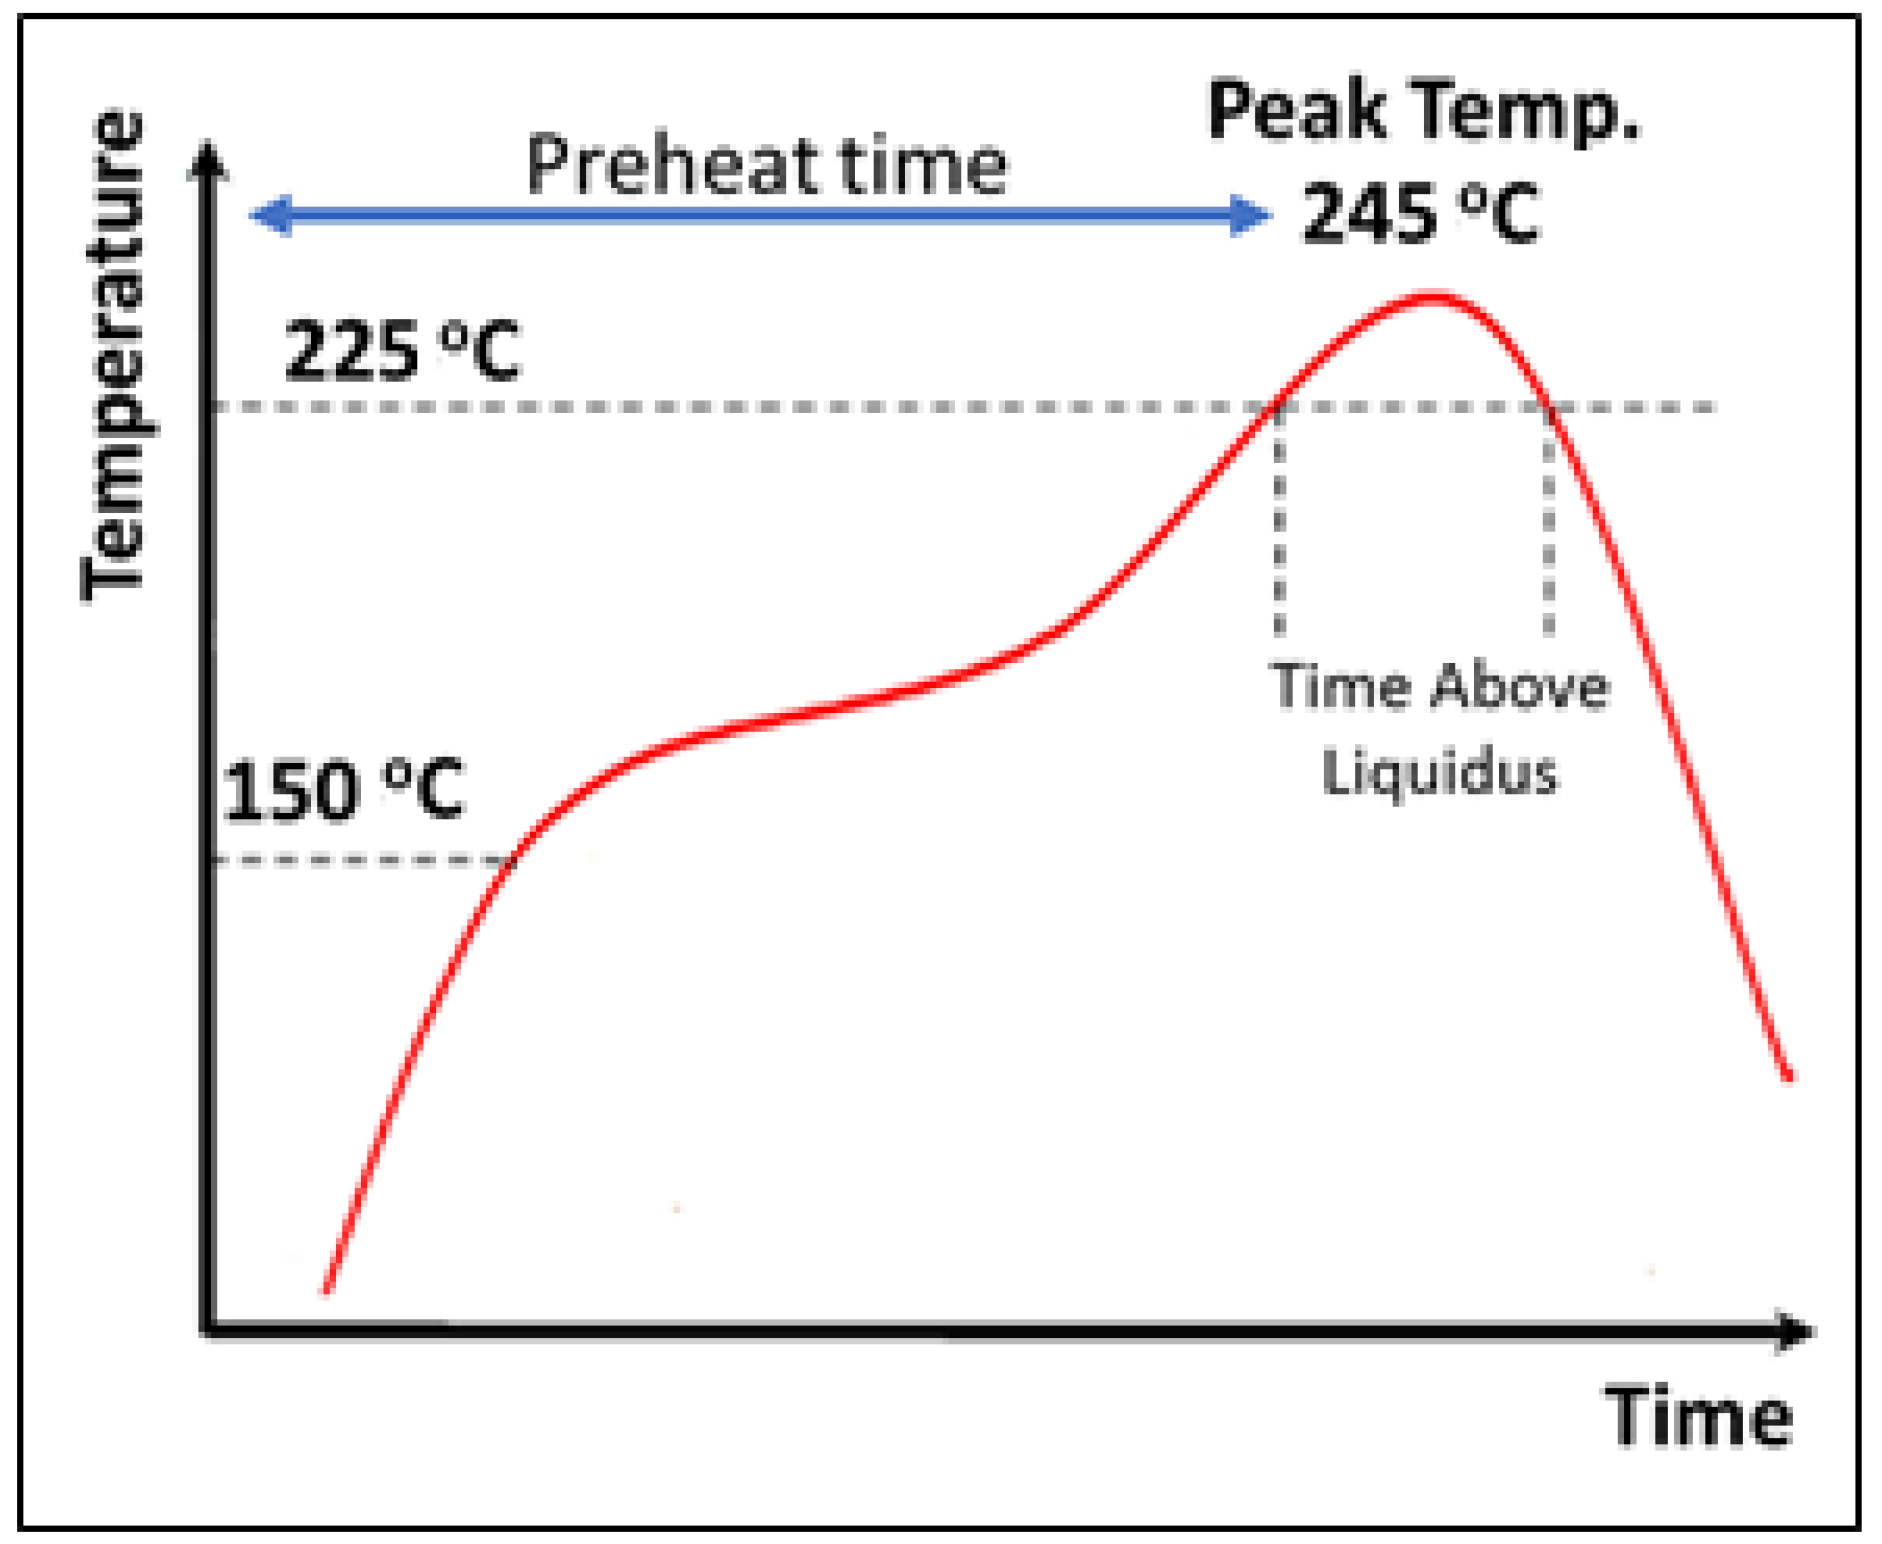
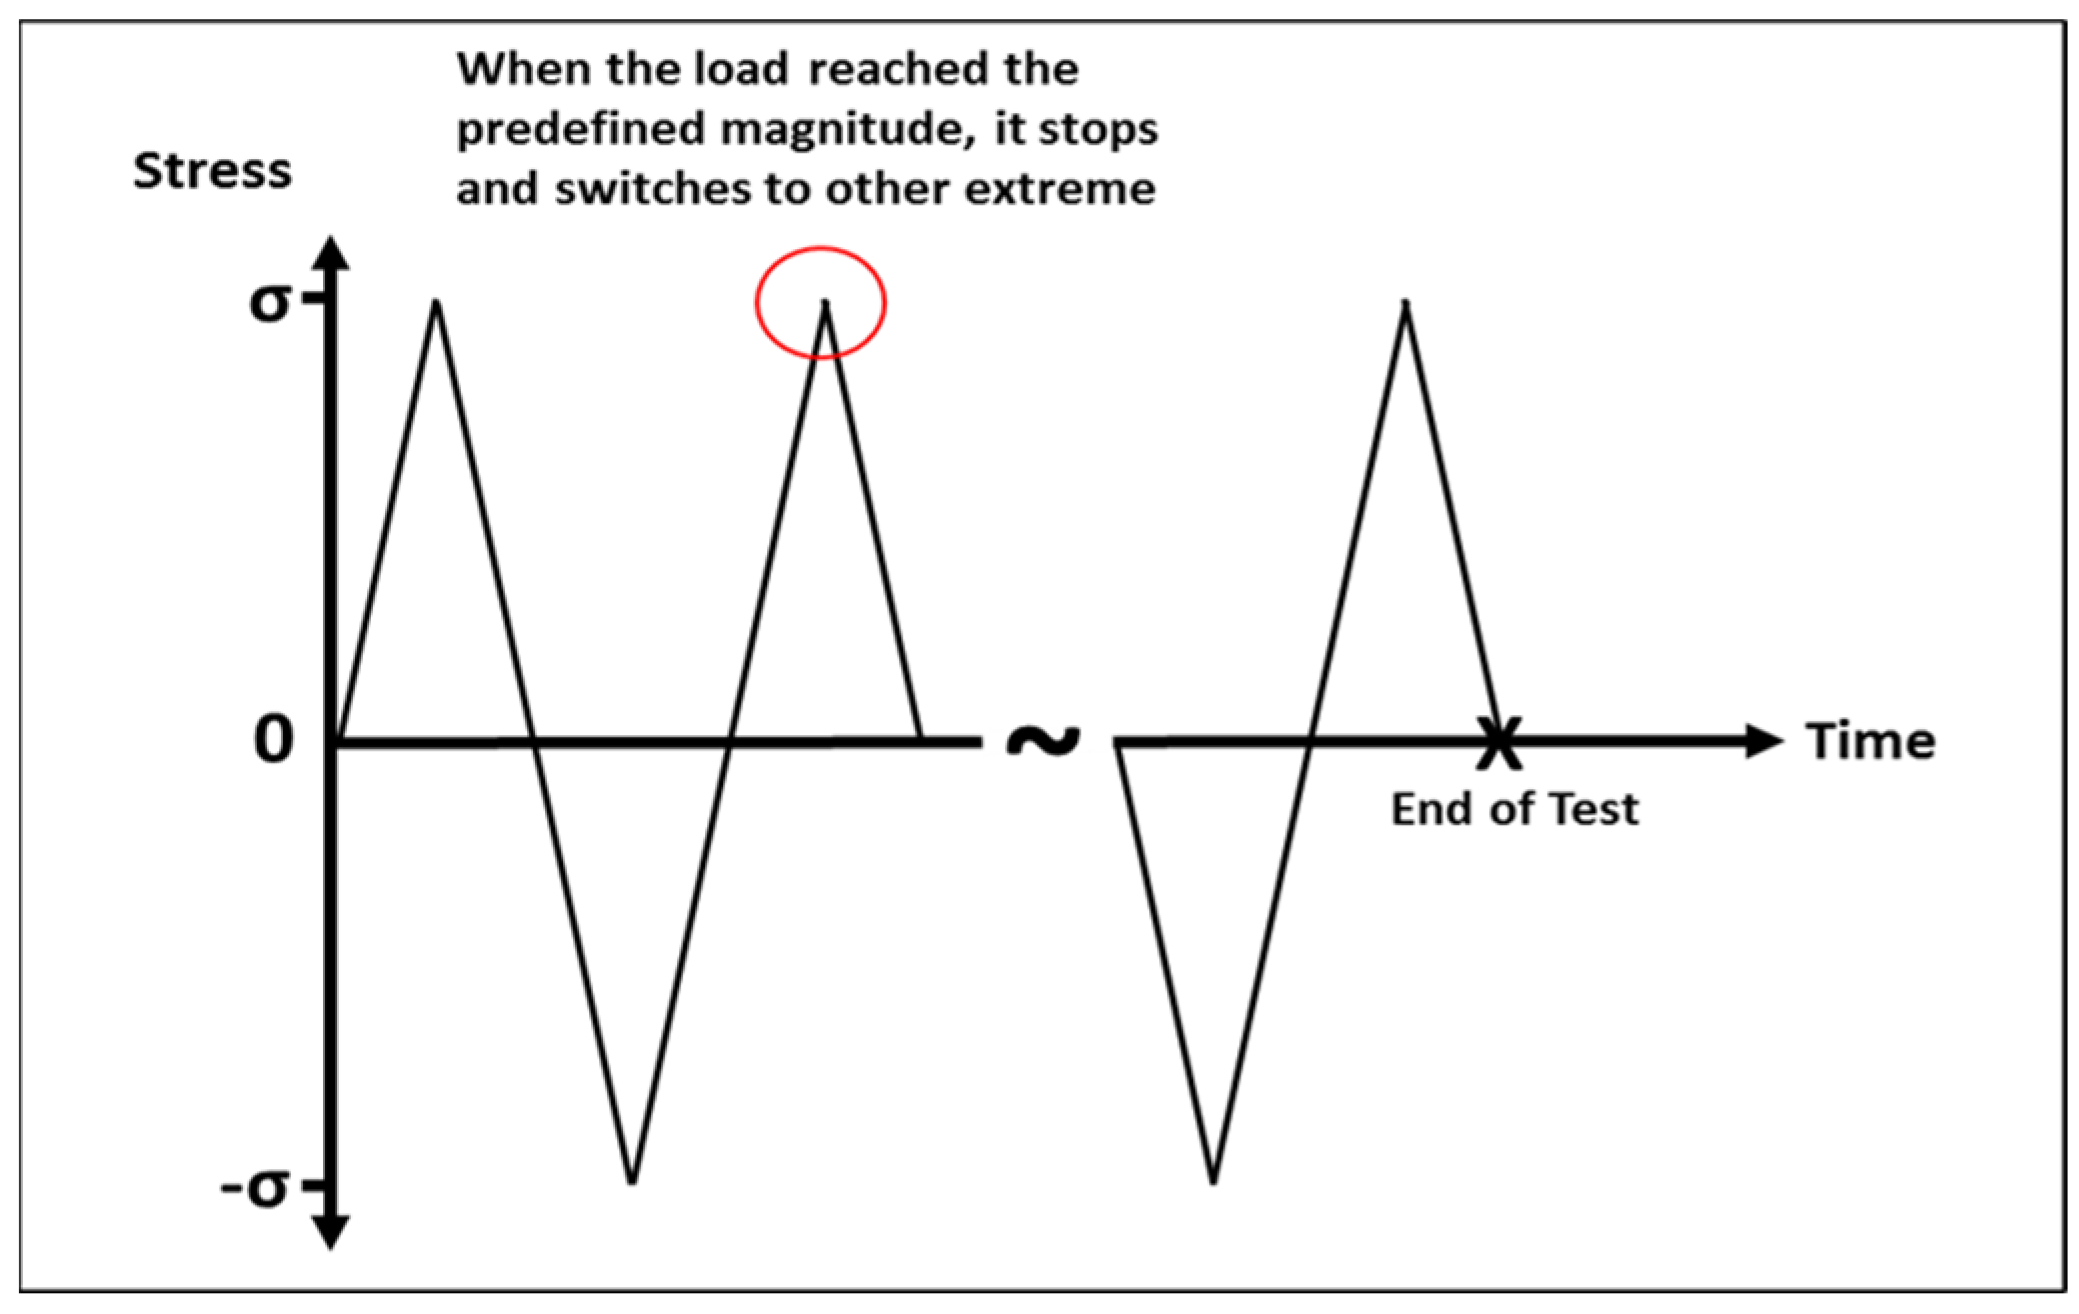
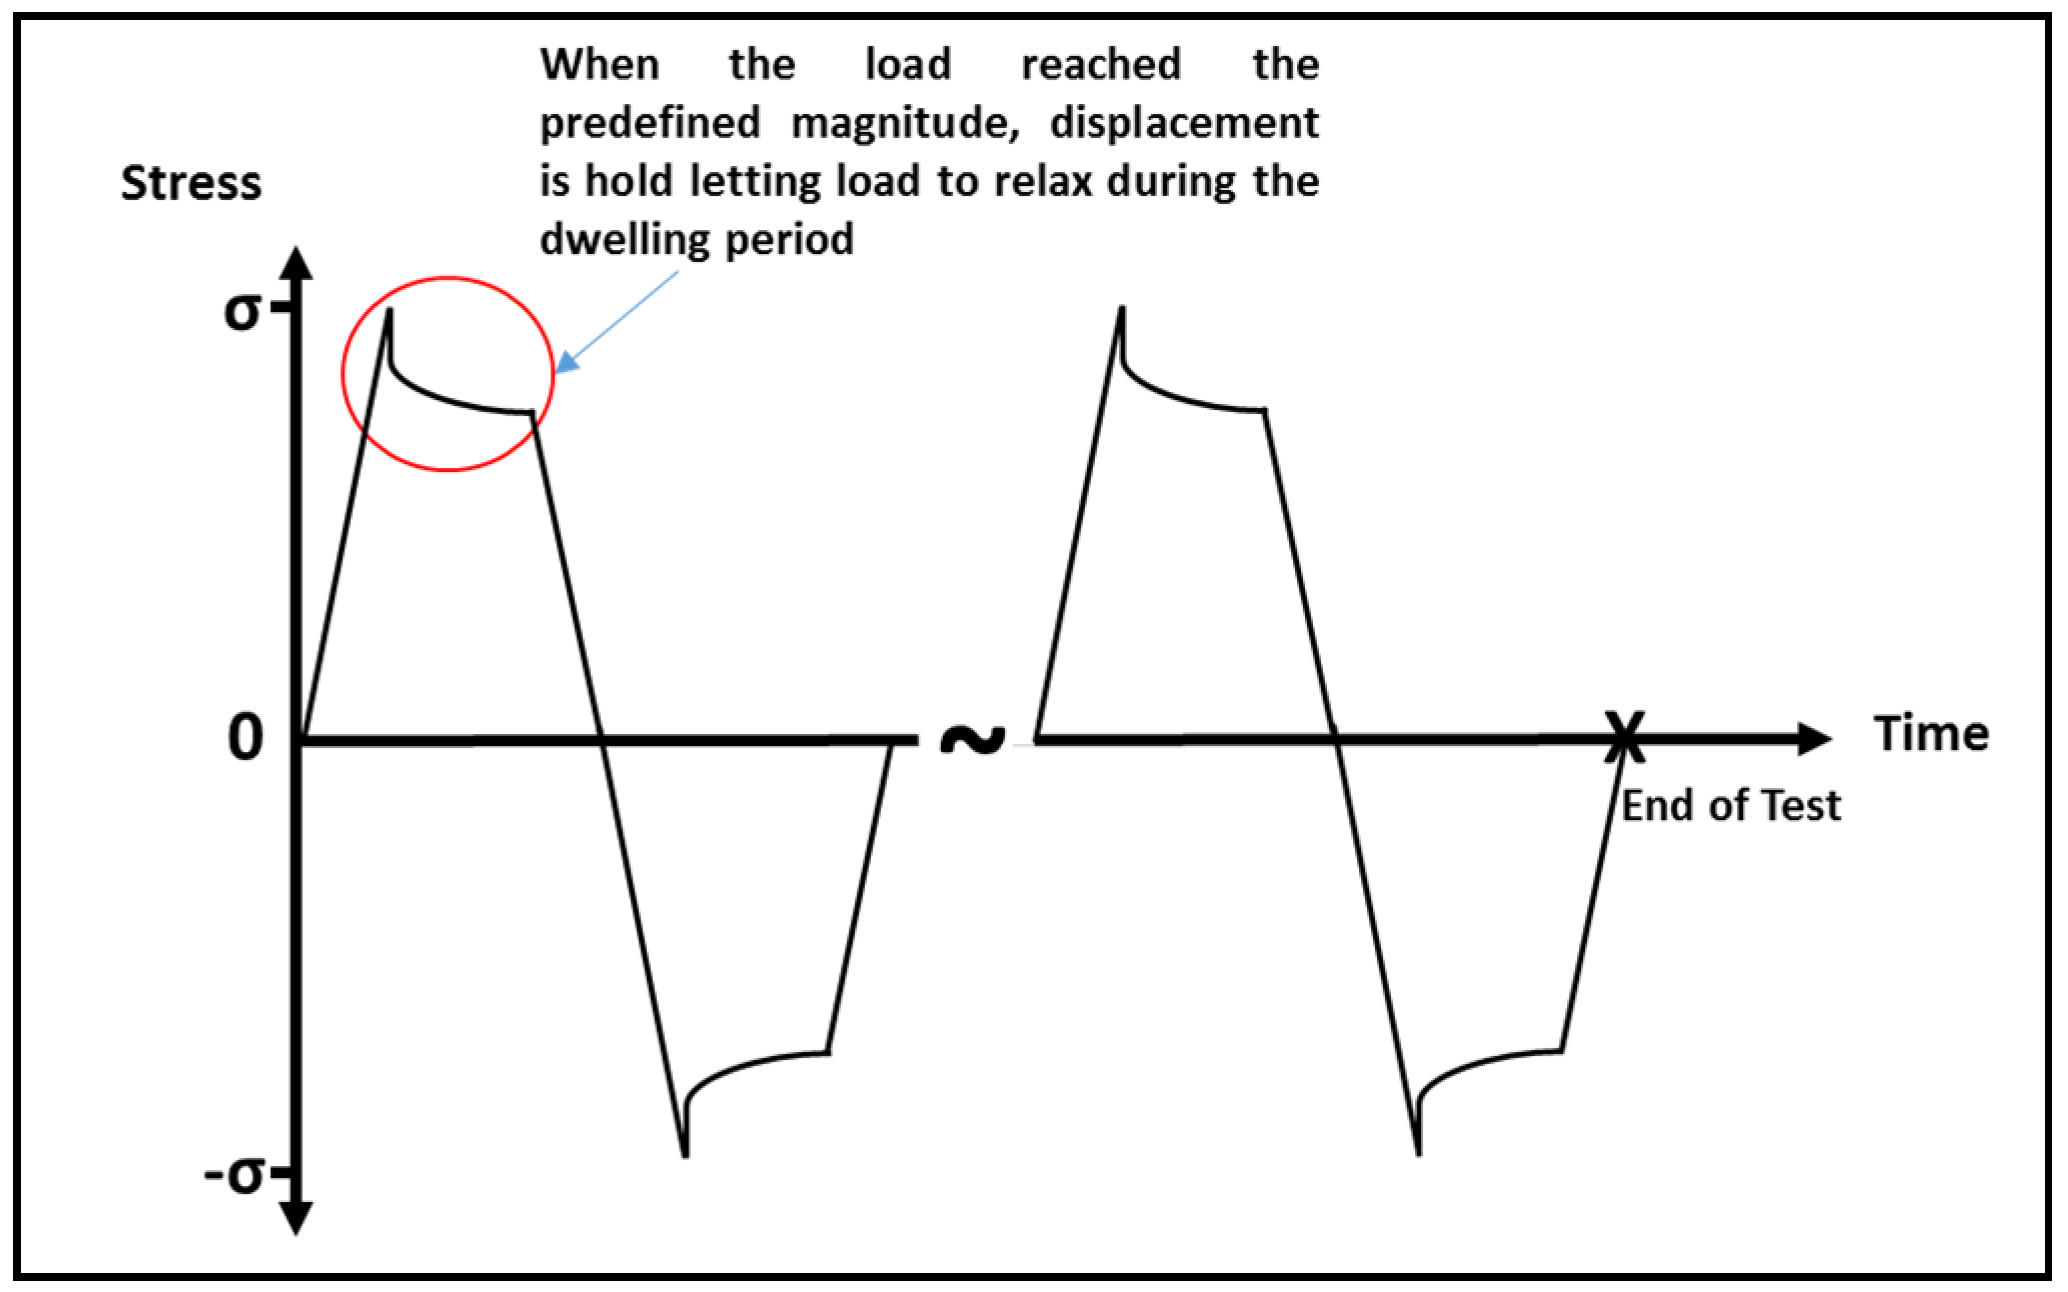
2.3. Test Profile
3. Results and Discussions
3.1. Weibull Plots Analysis and Prediction Modeling
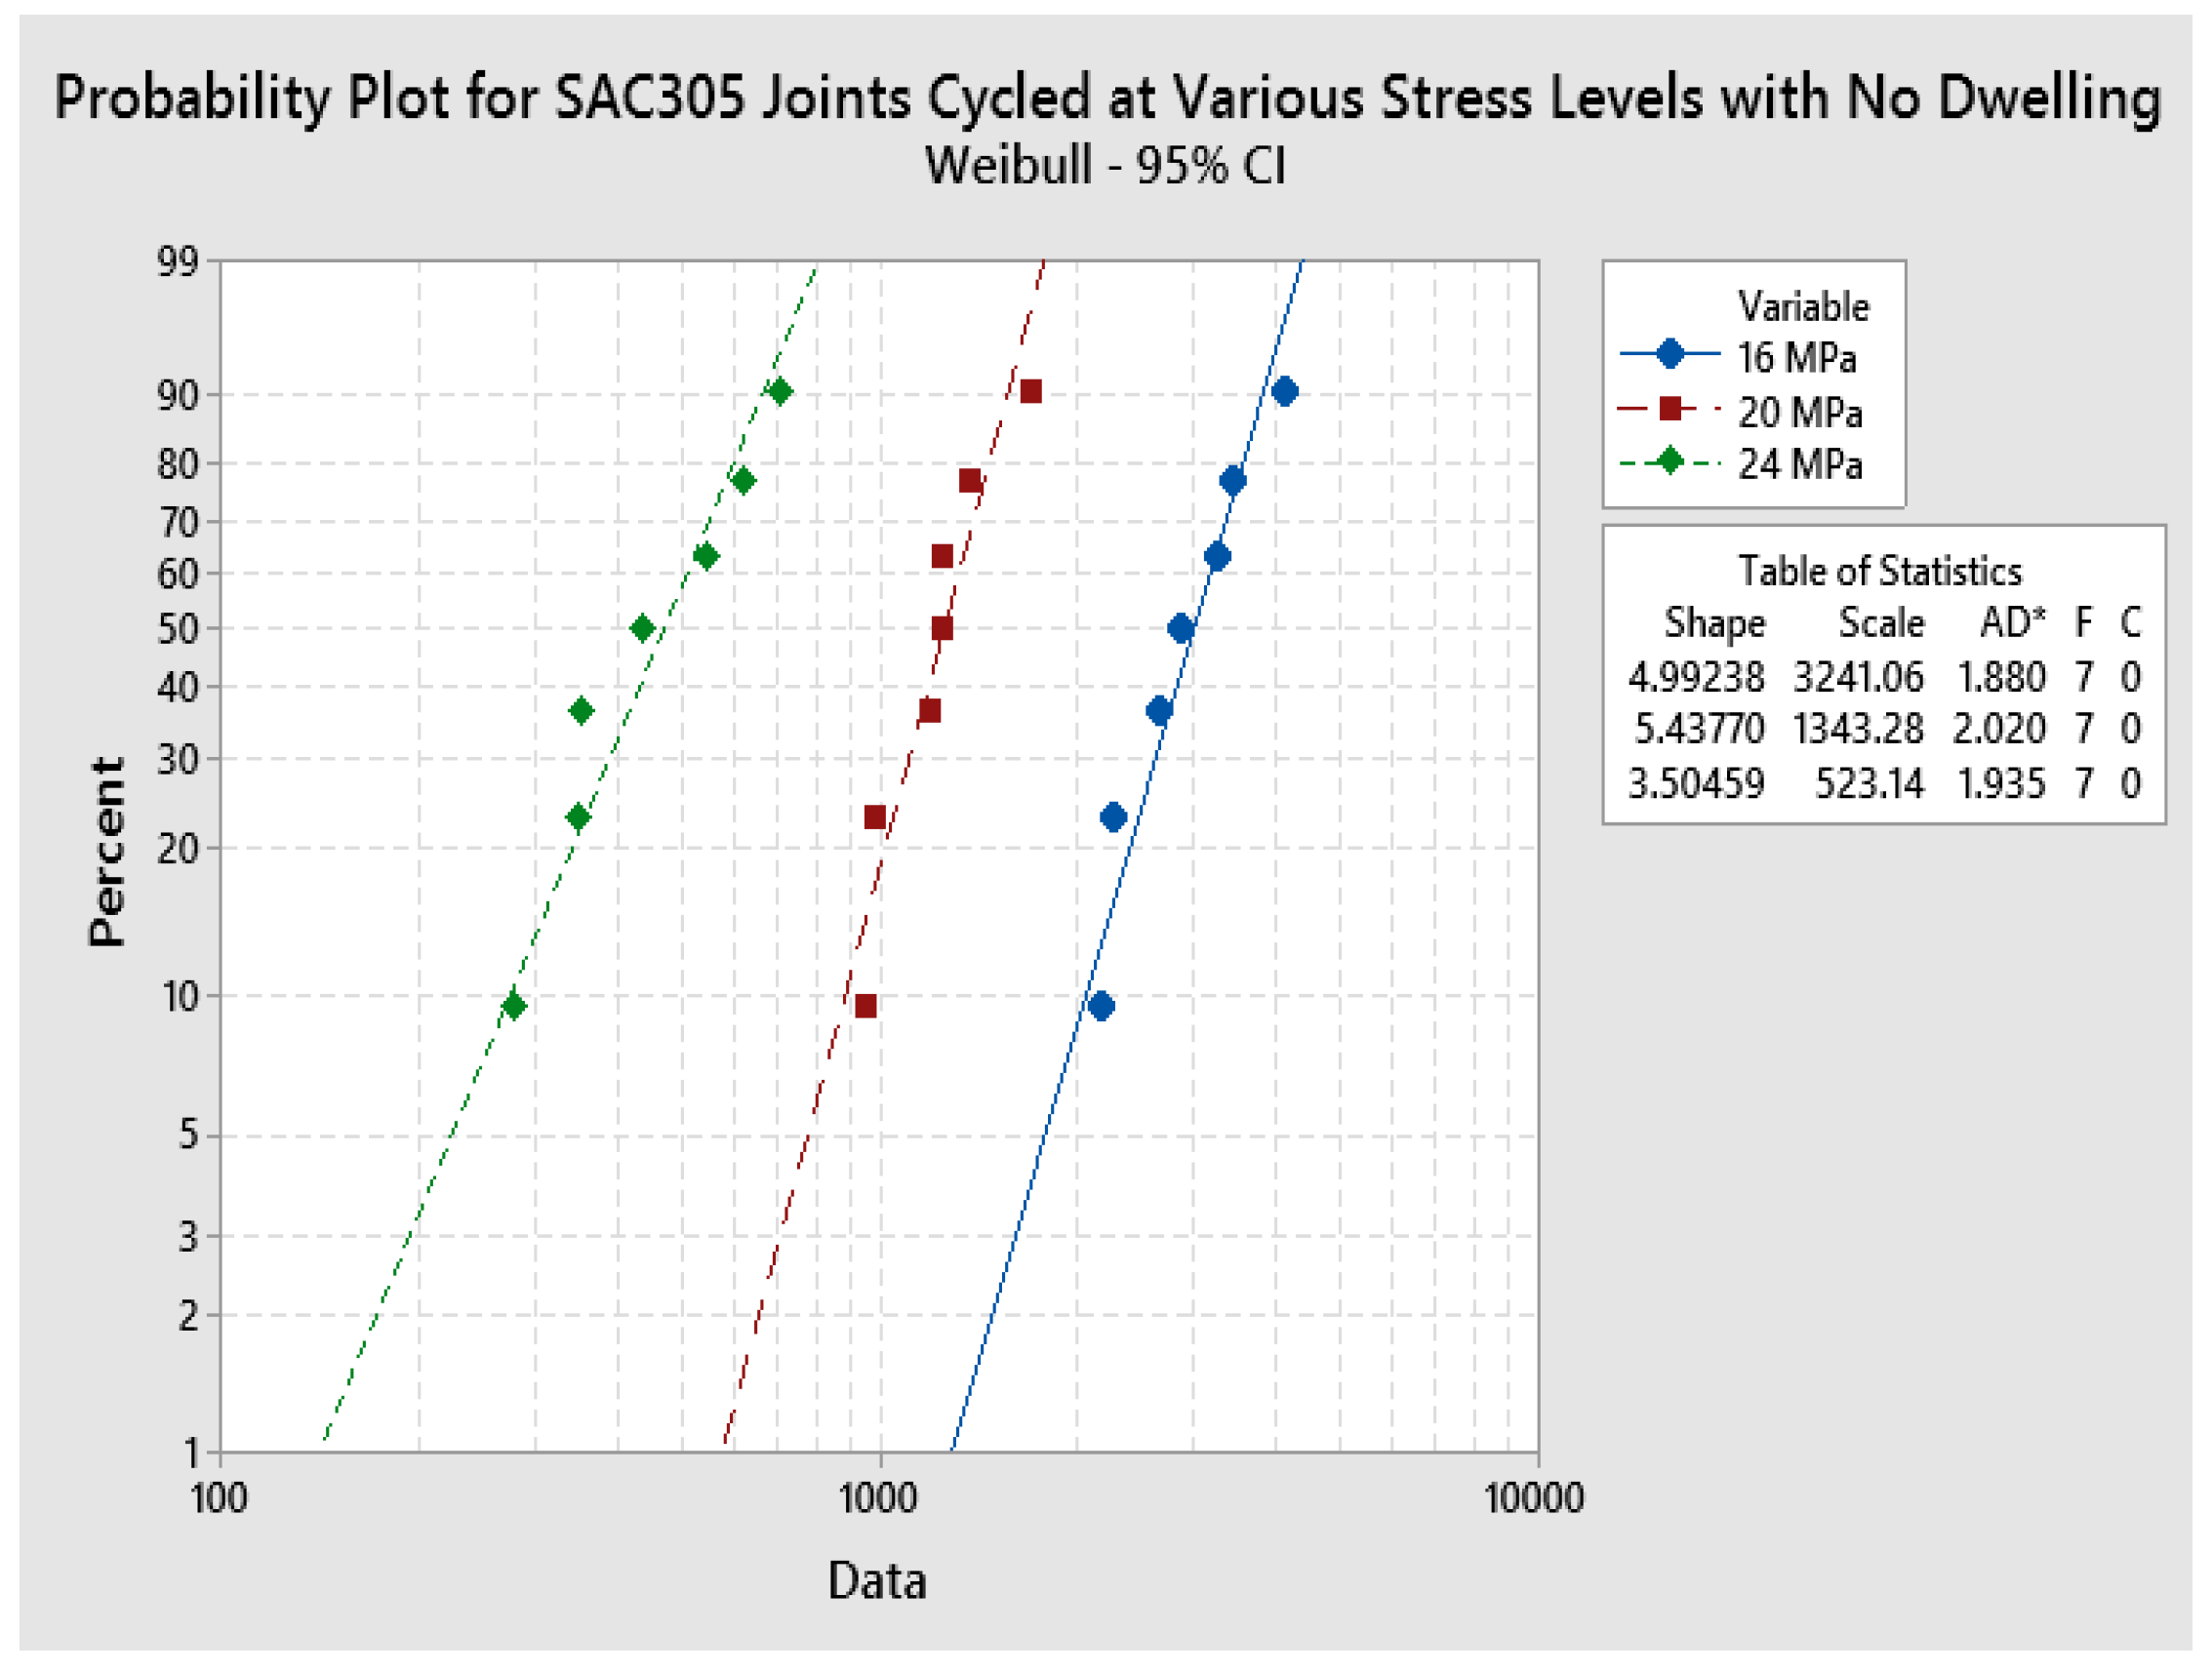
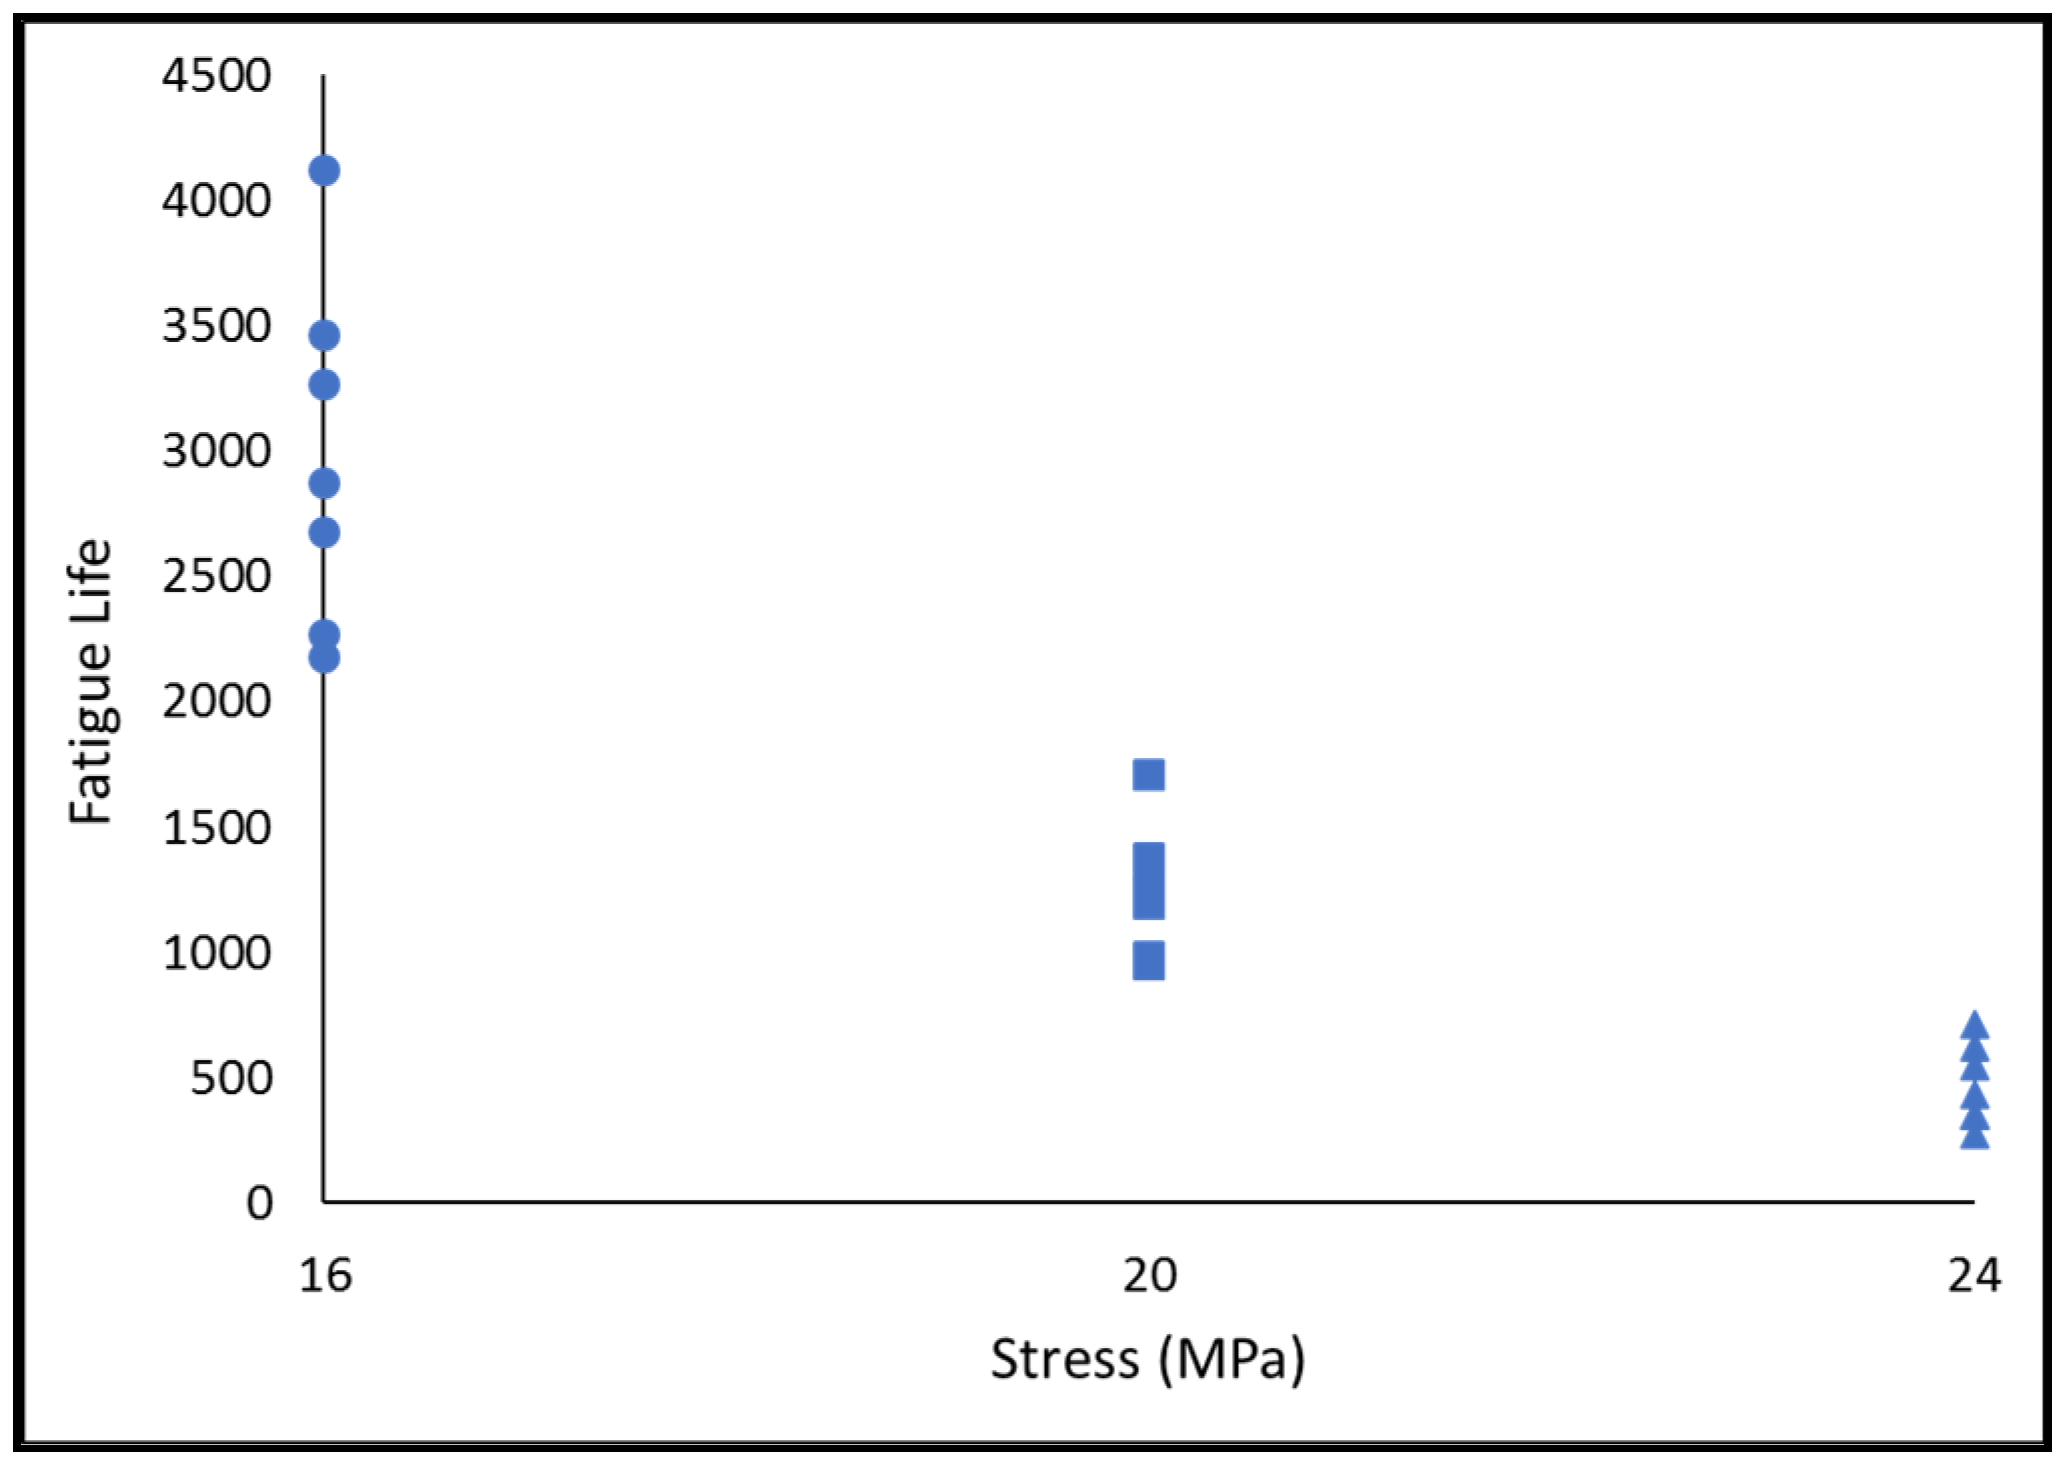
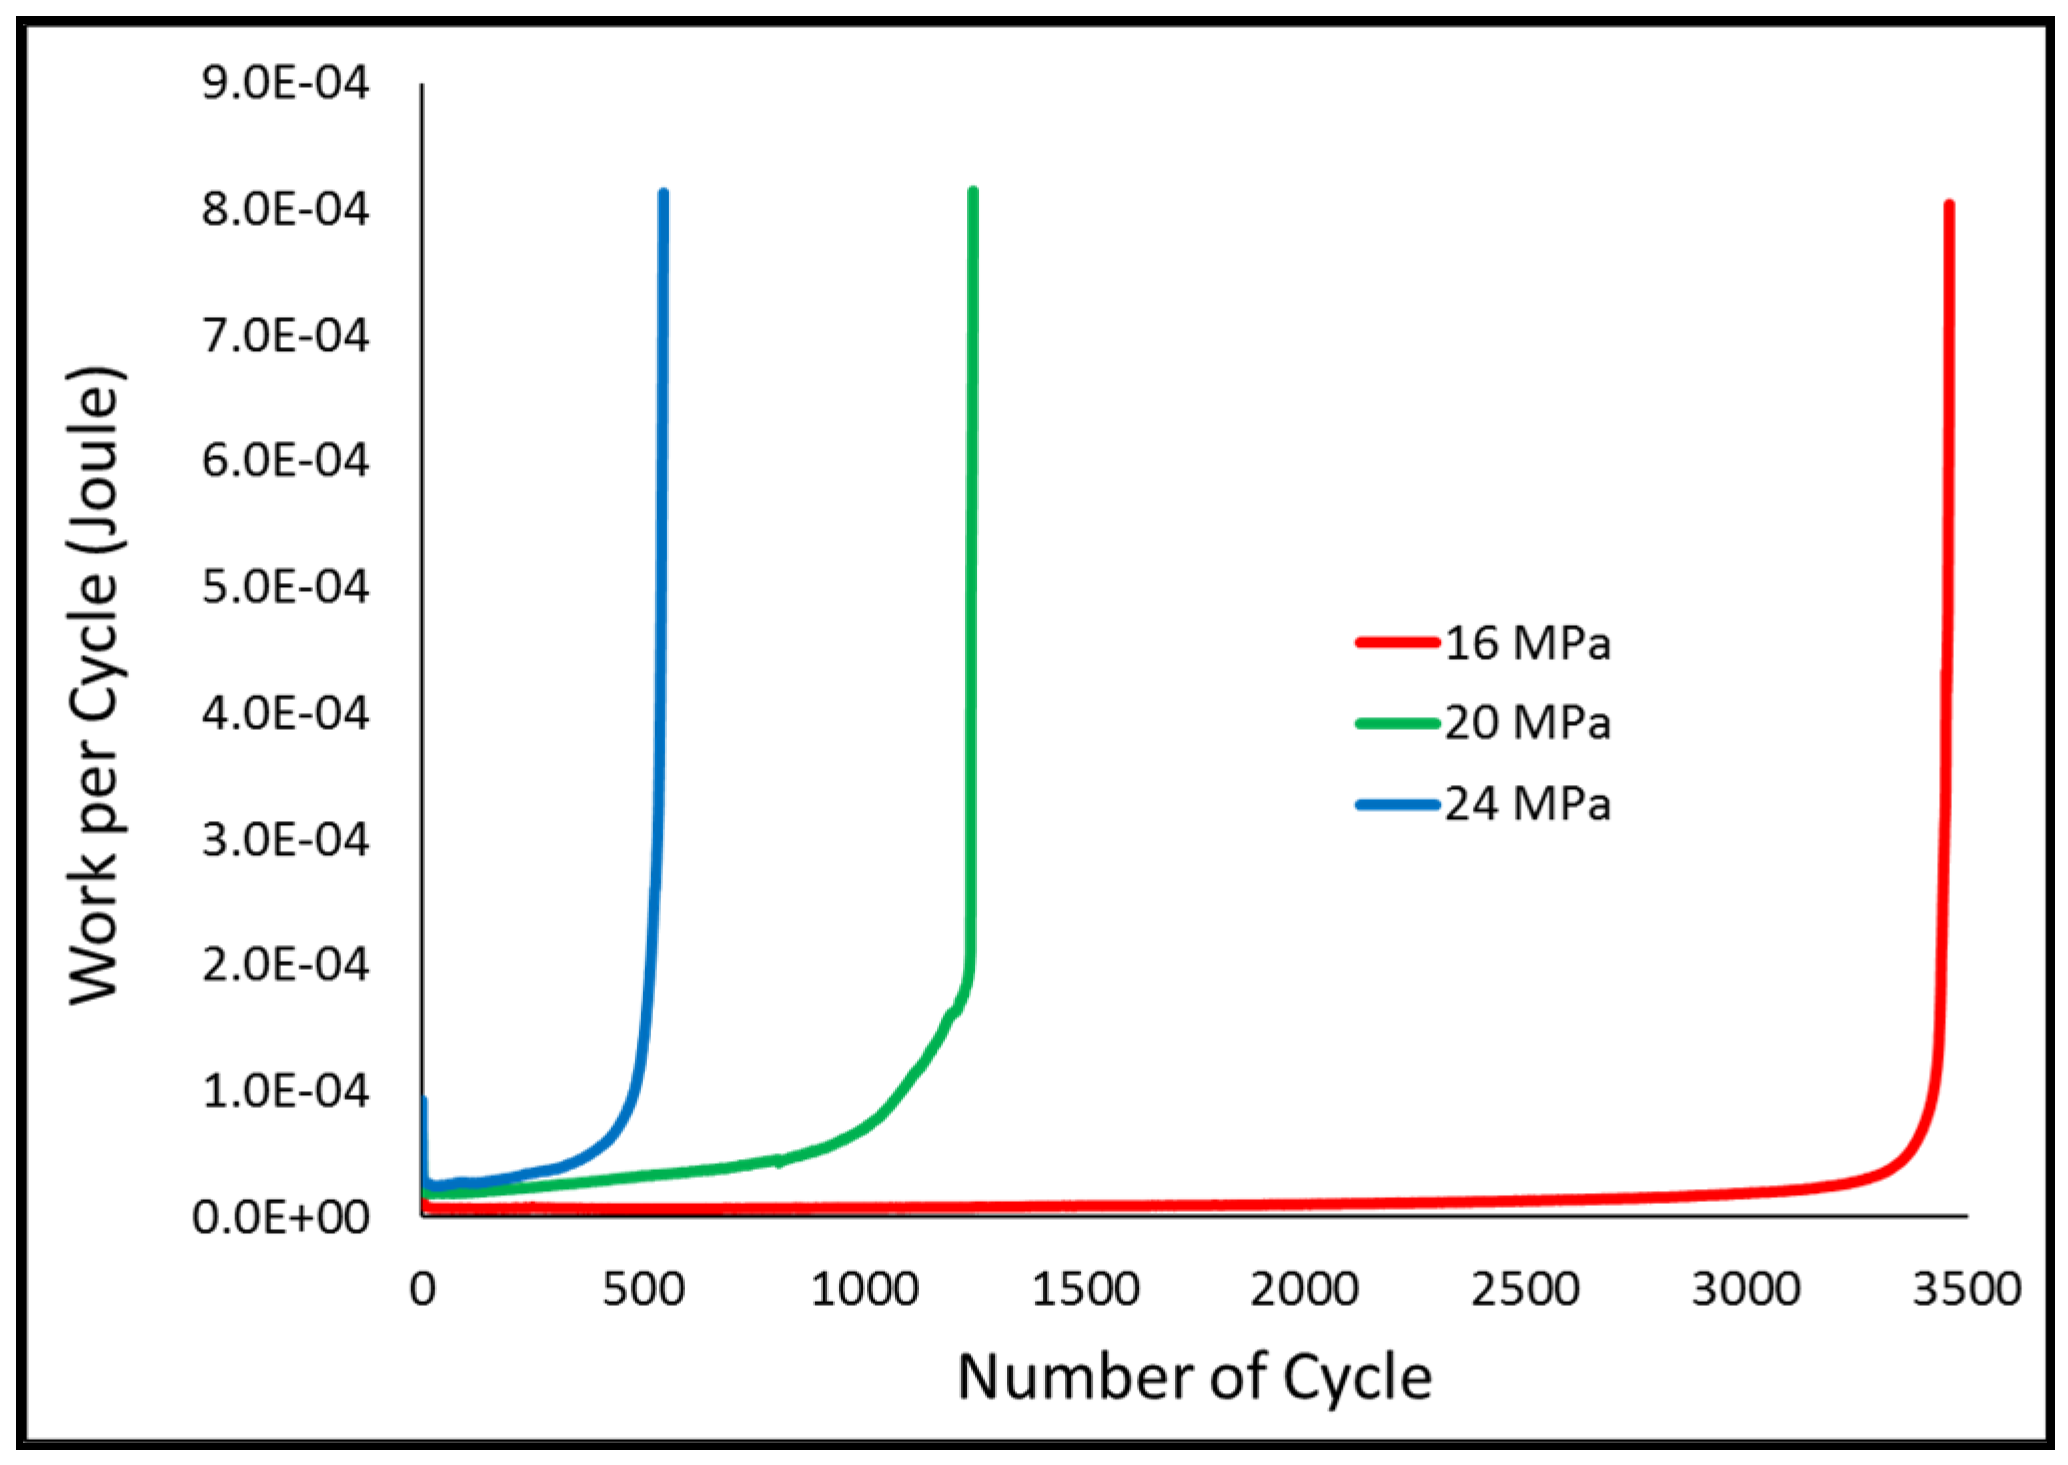
3.1.1. Mechanical Fatigue Condition
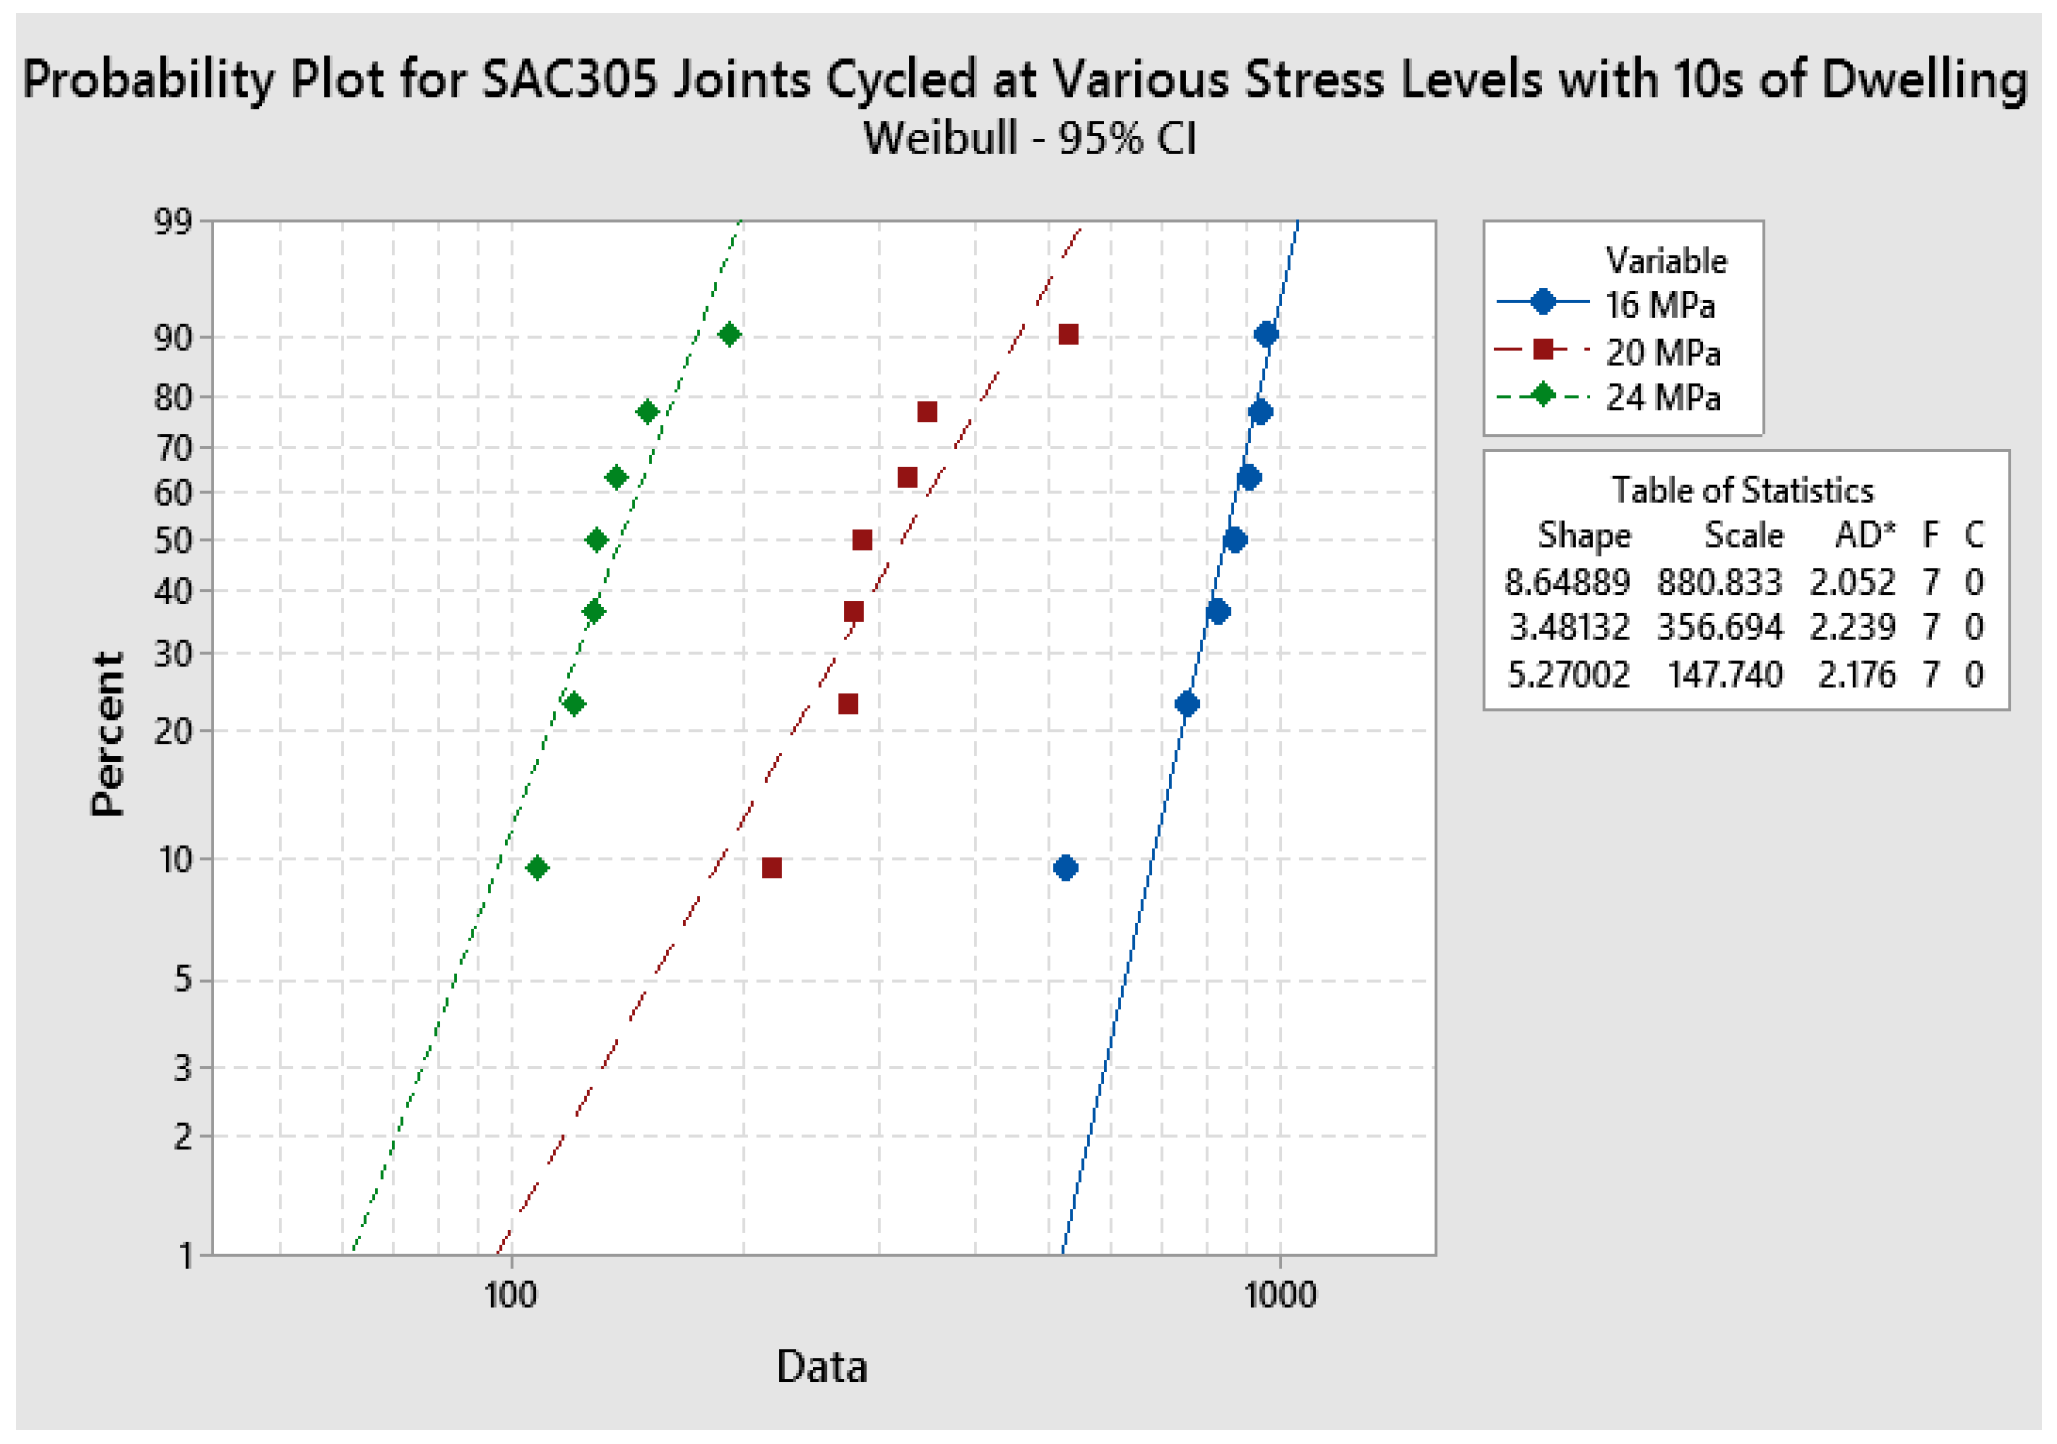
Weibull Plots
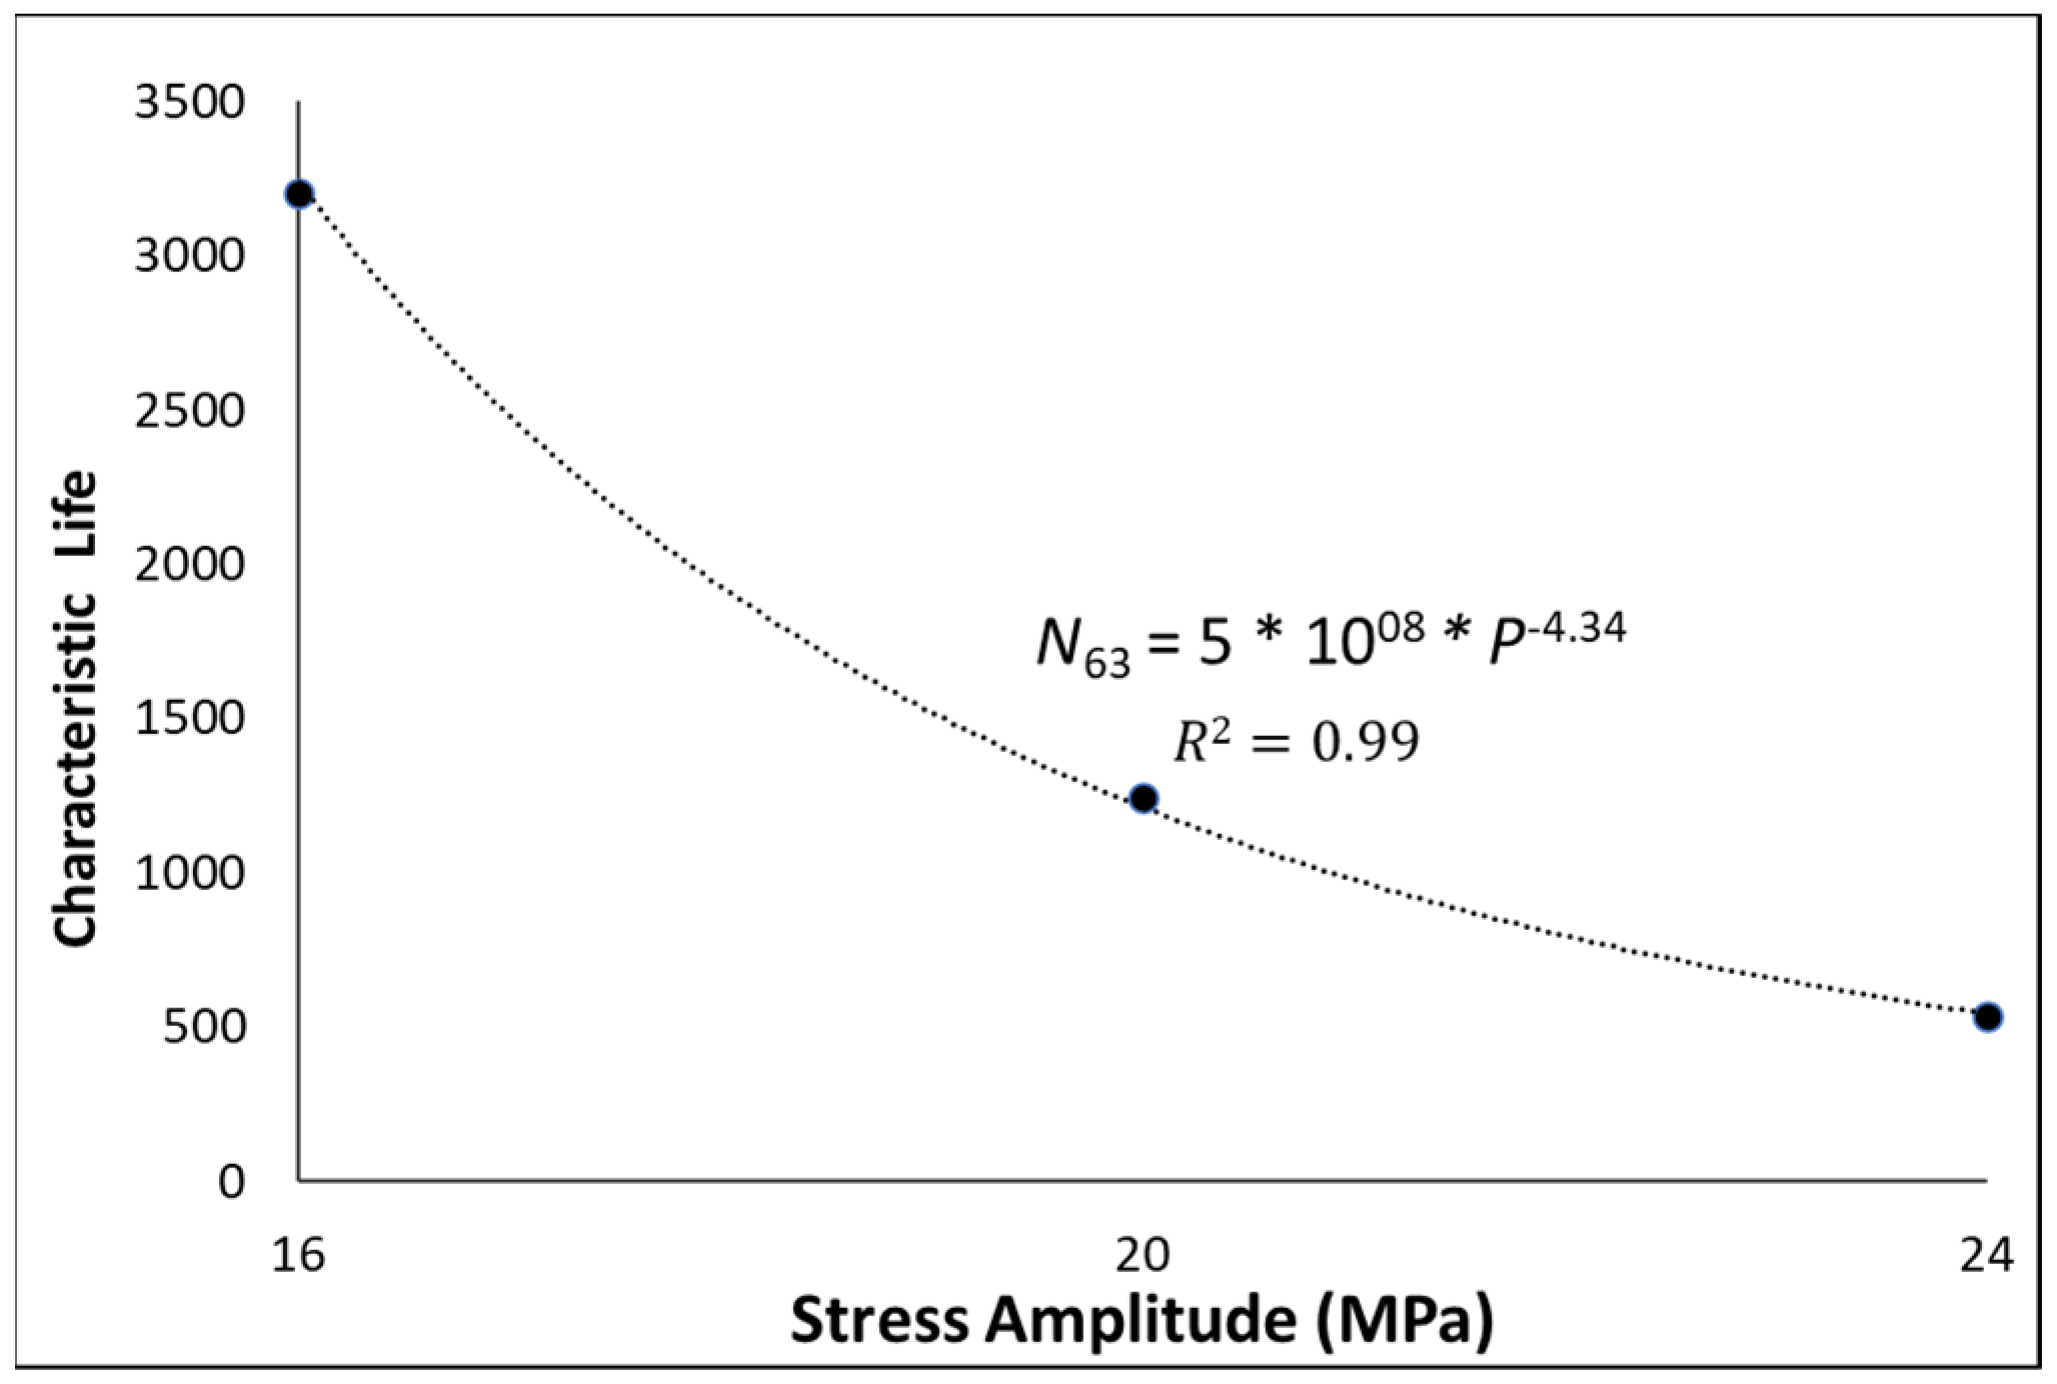
Prediction Modeling
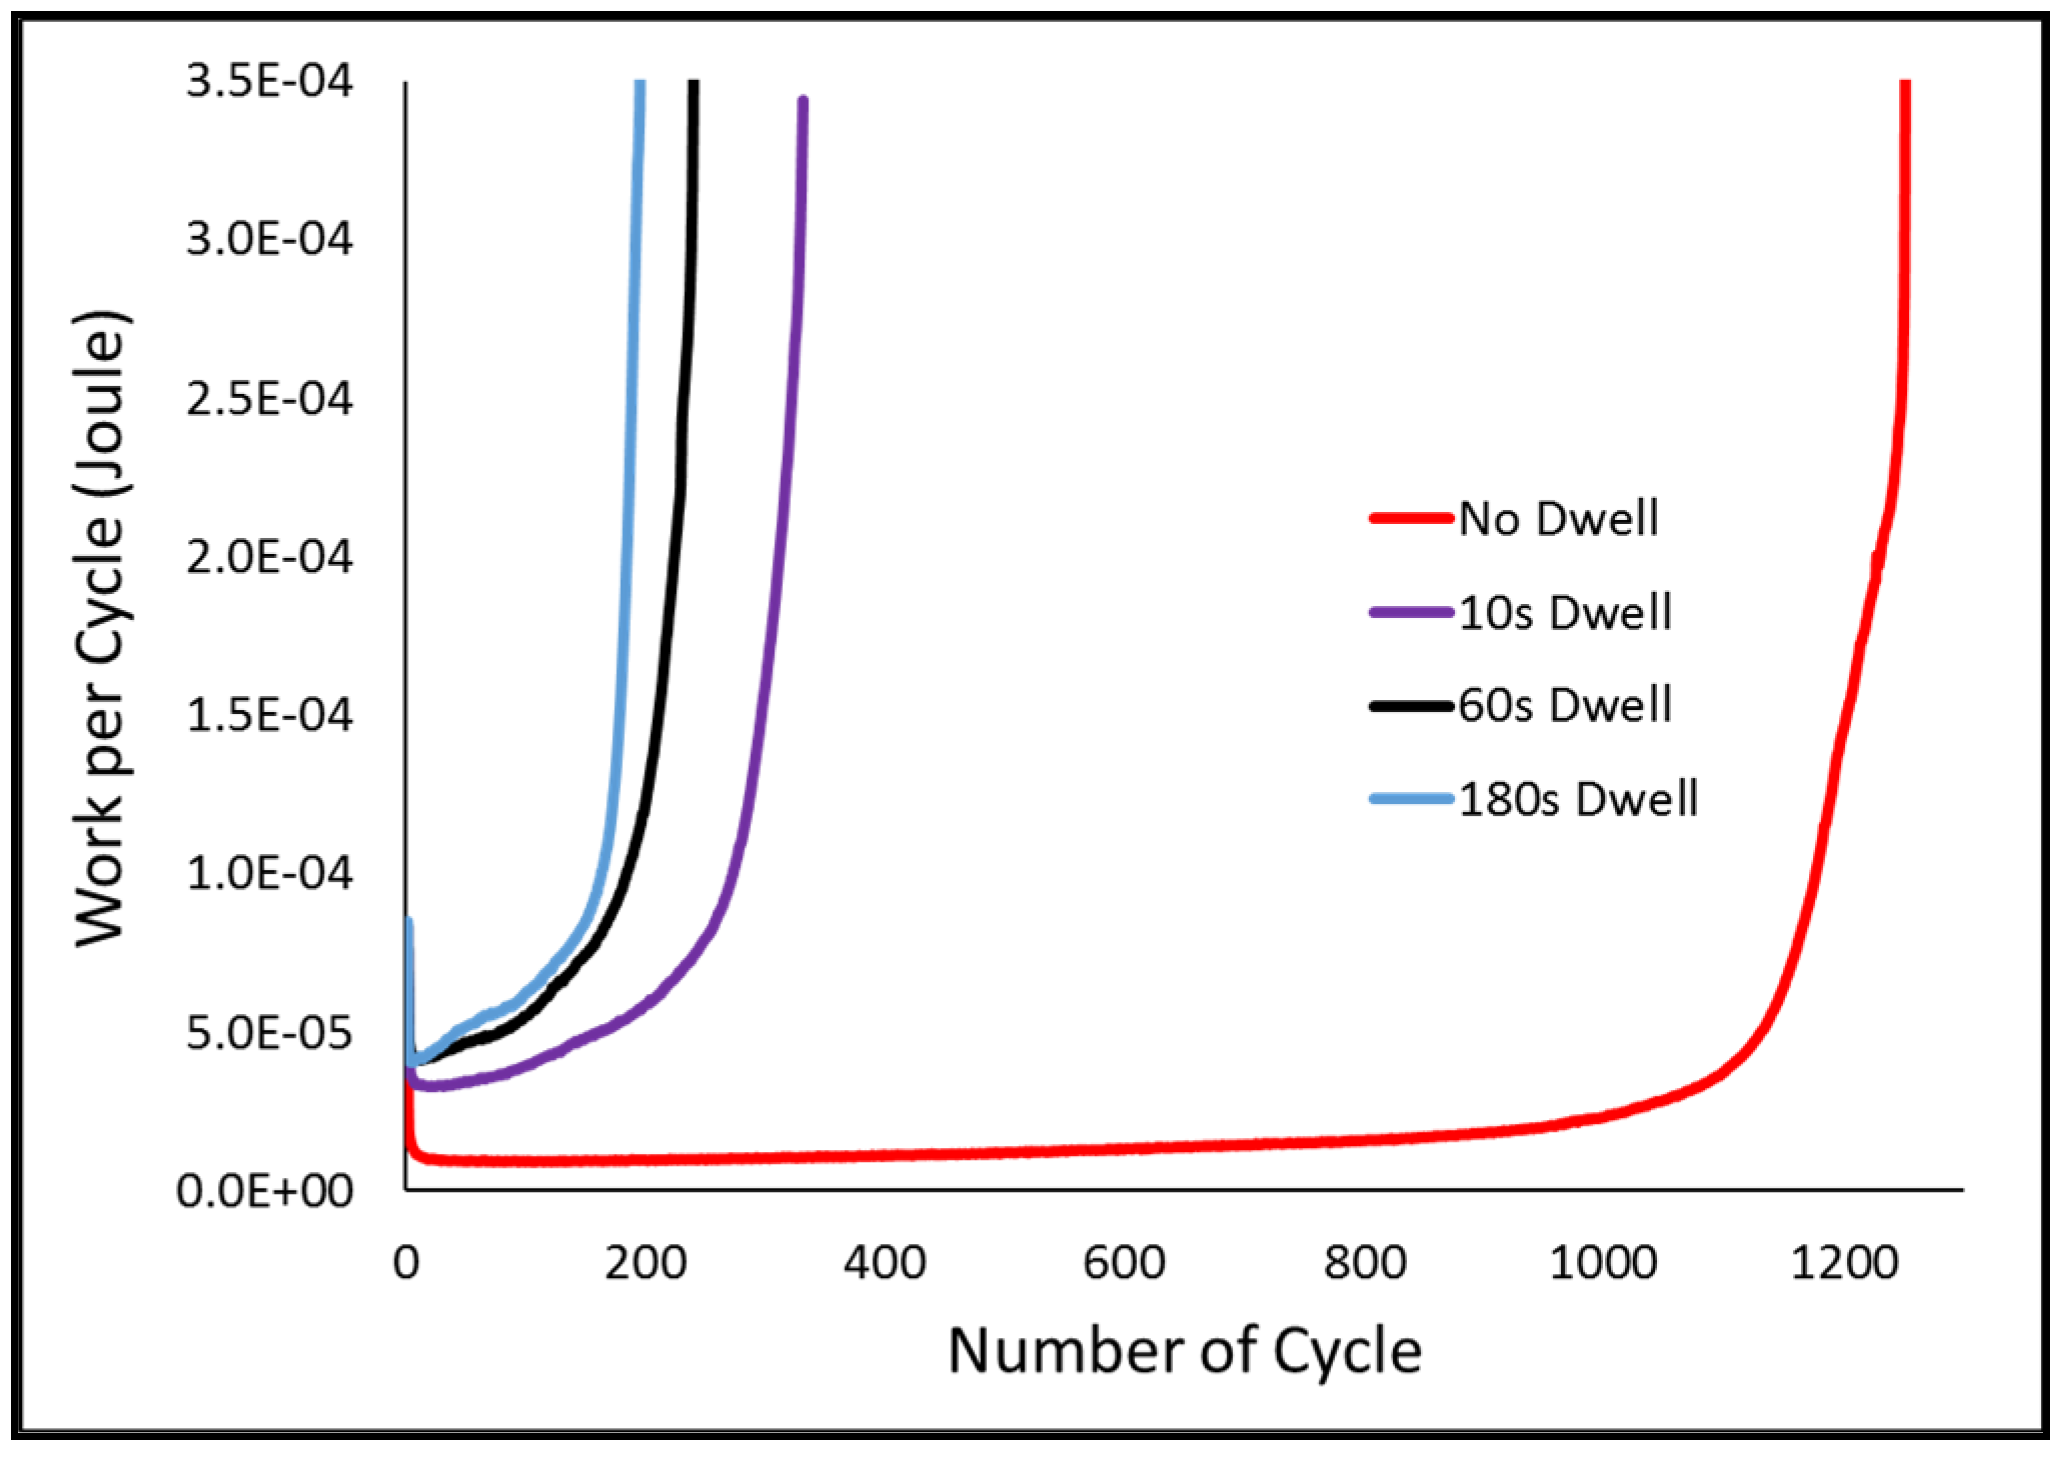
3.1.2. Dwelling (Creep–Fatigue) Condition
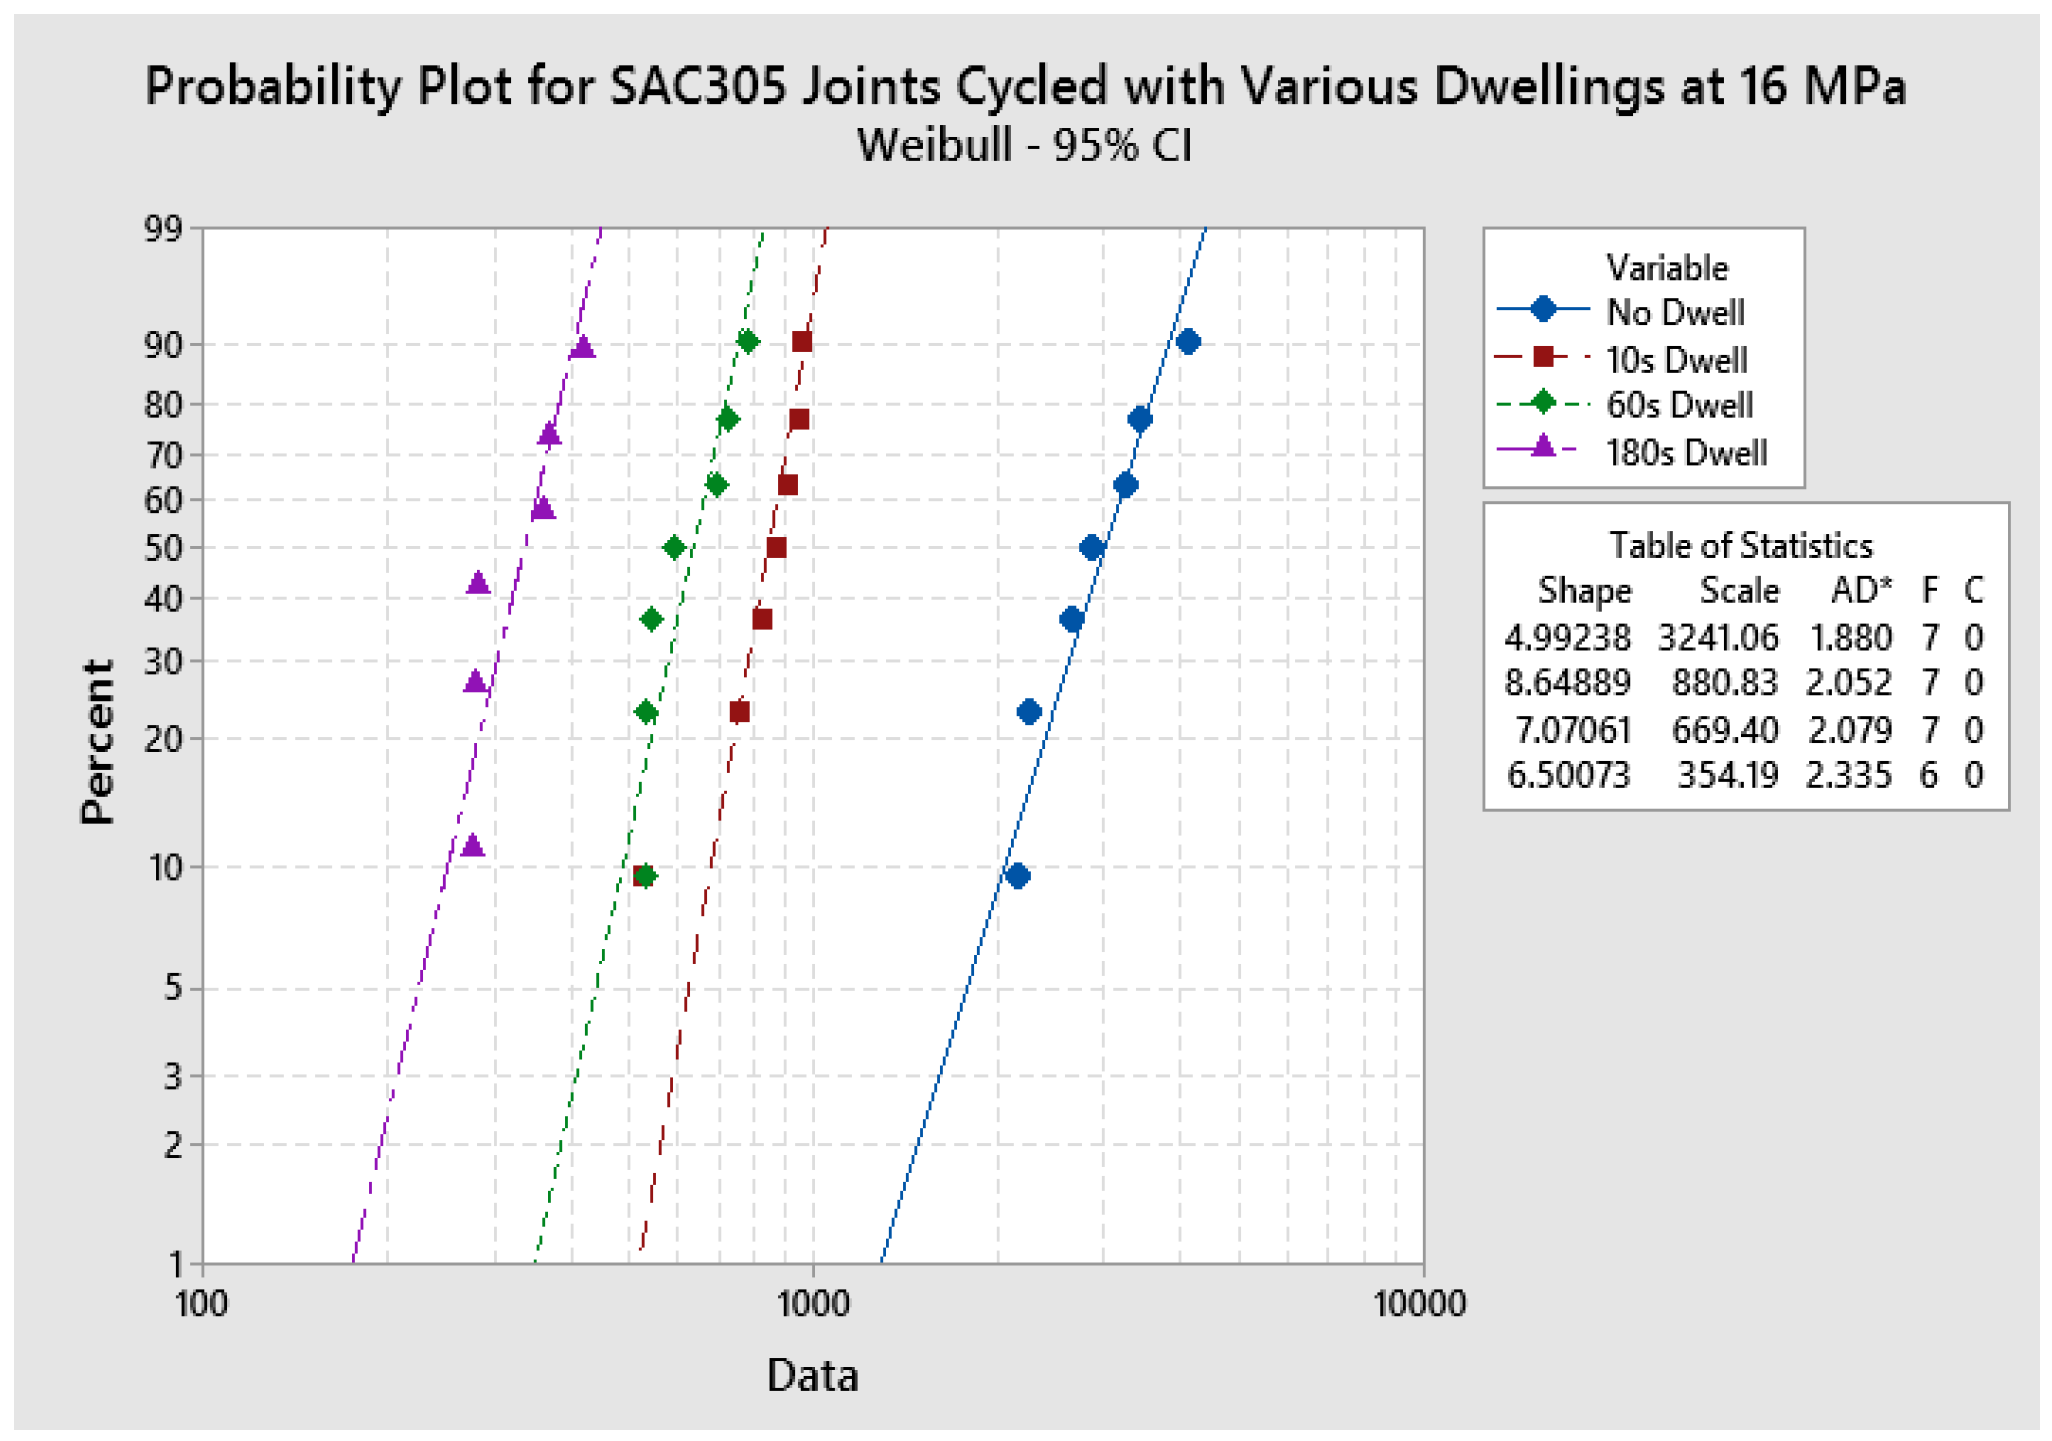
Weibull Plots
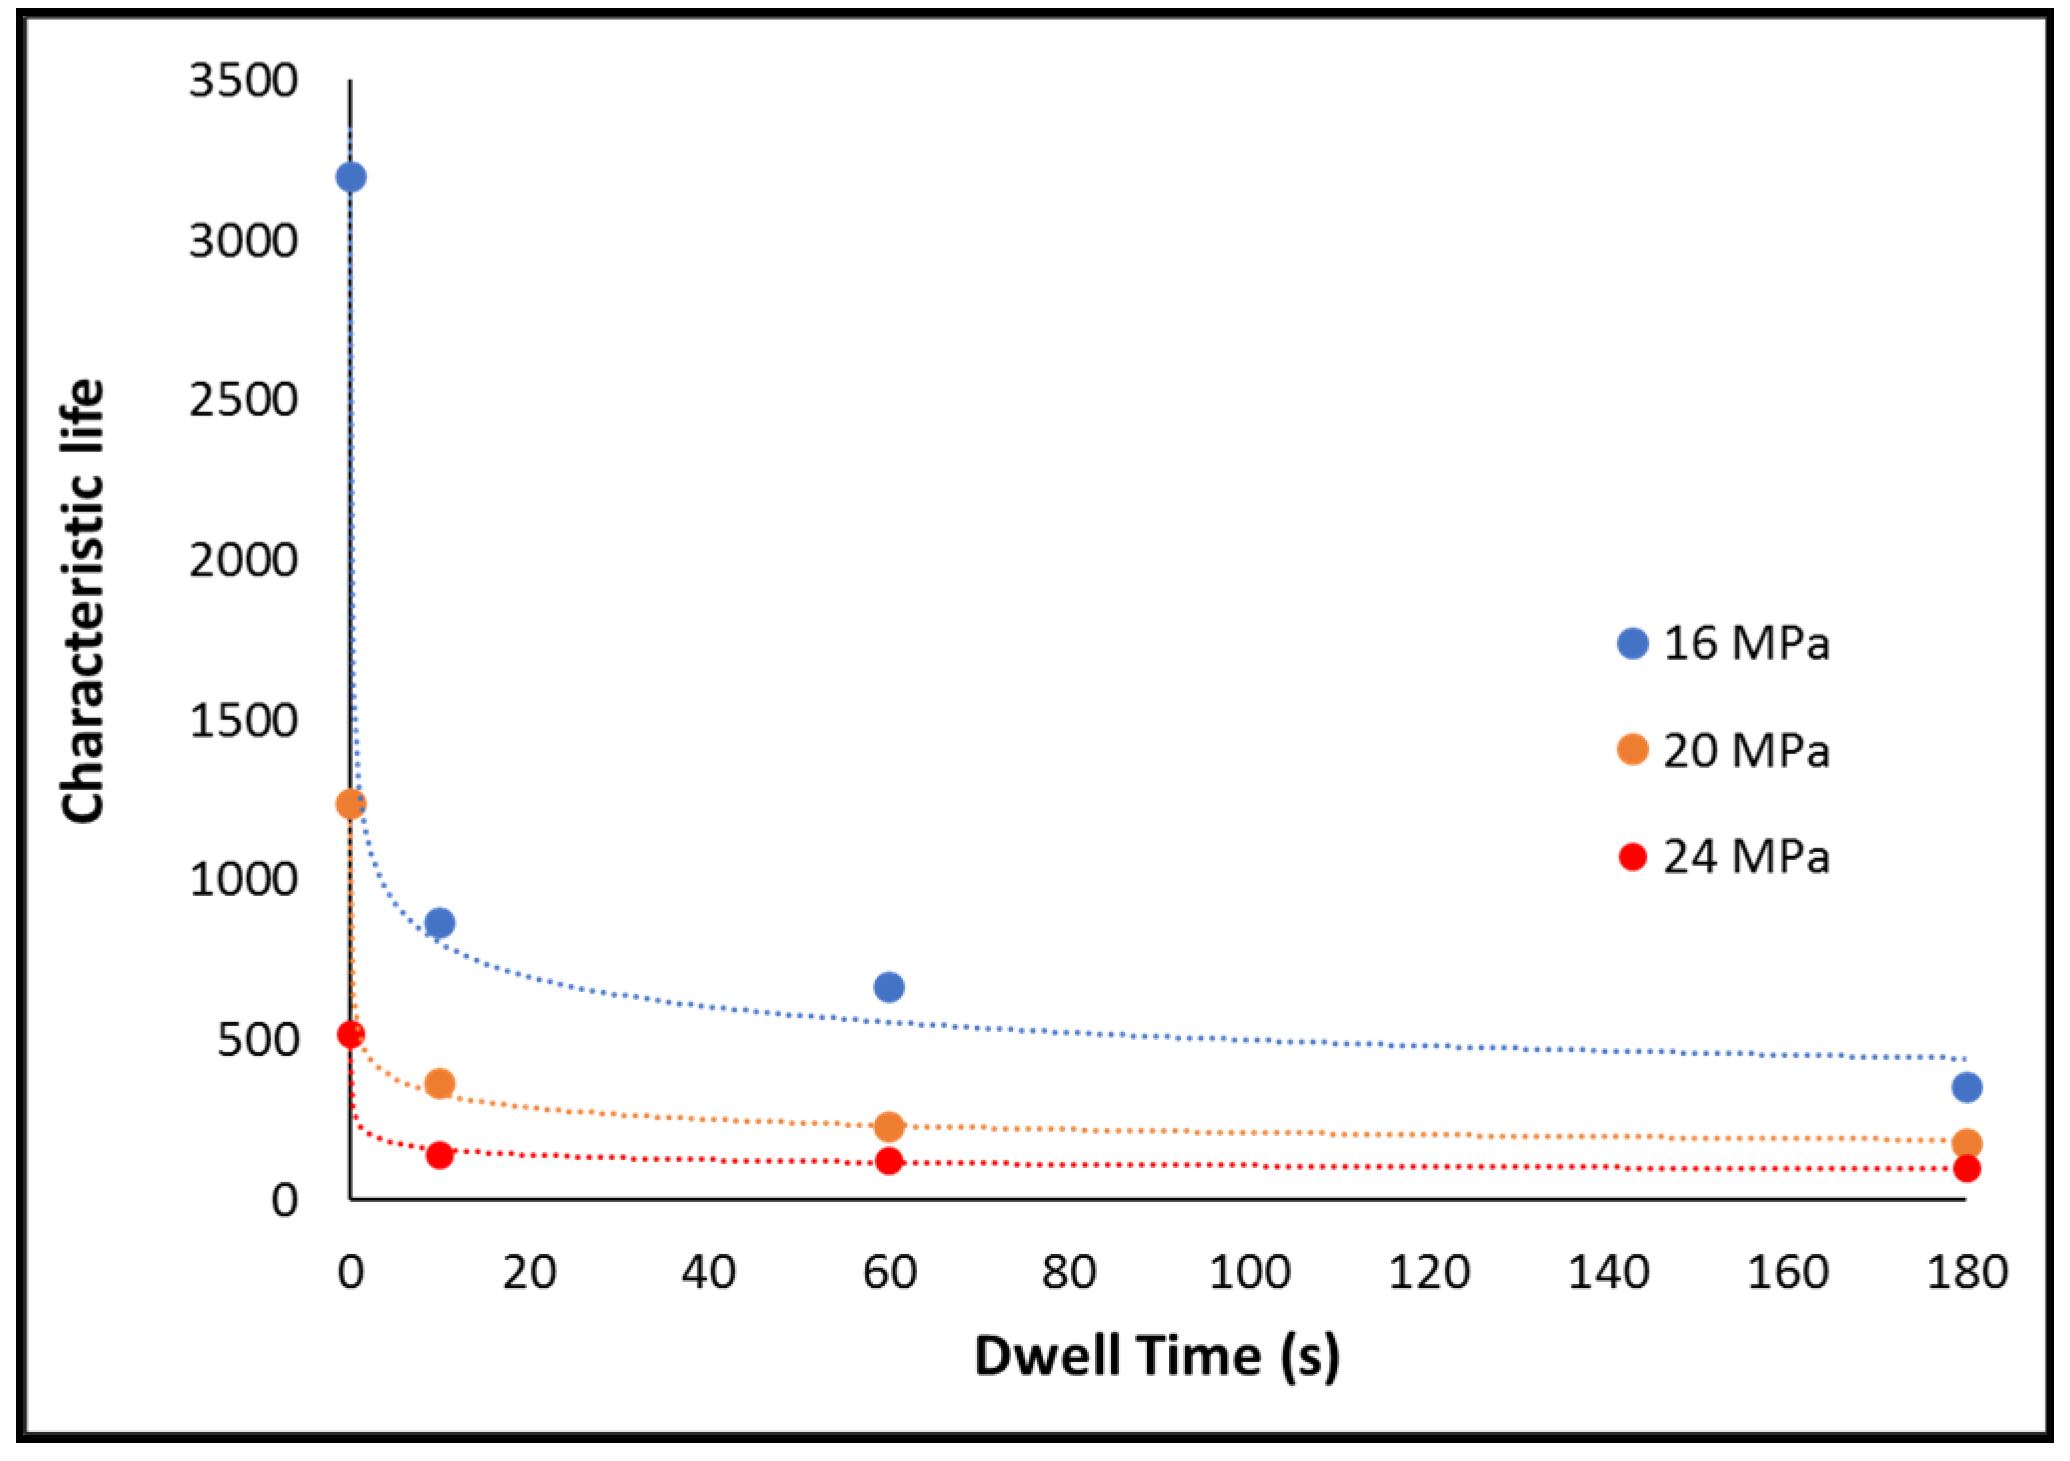
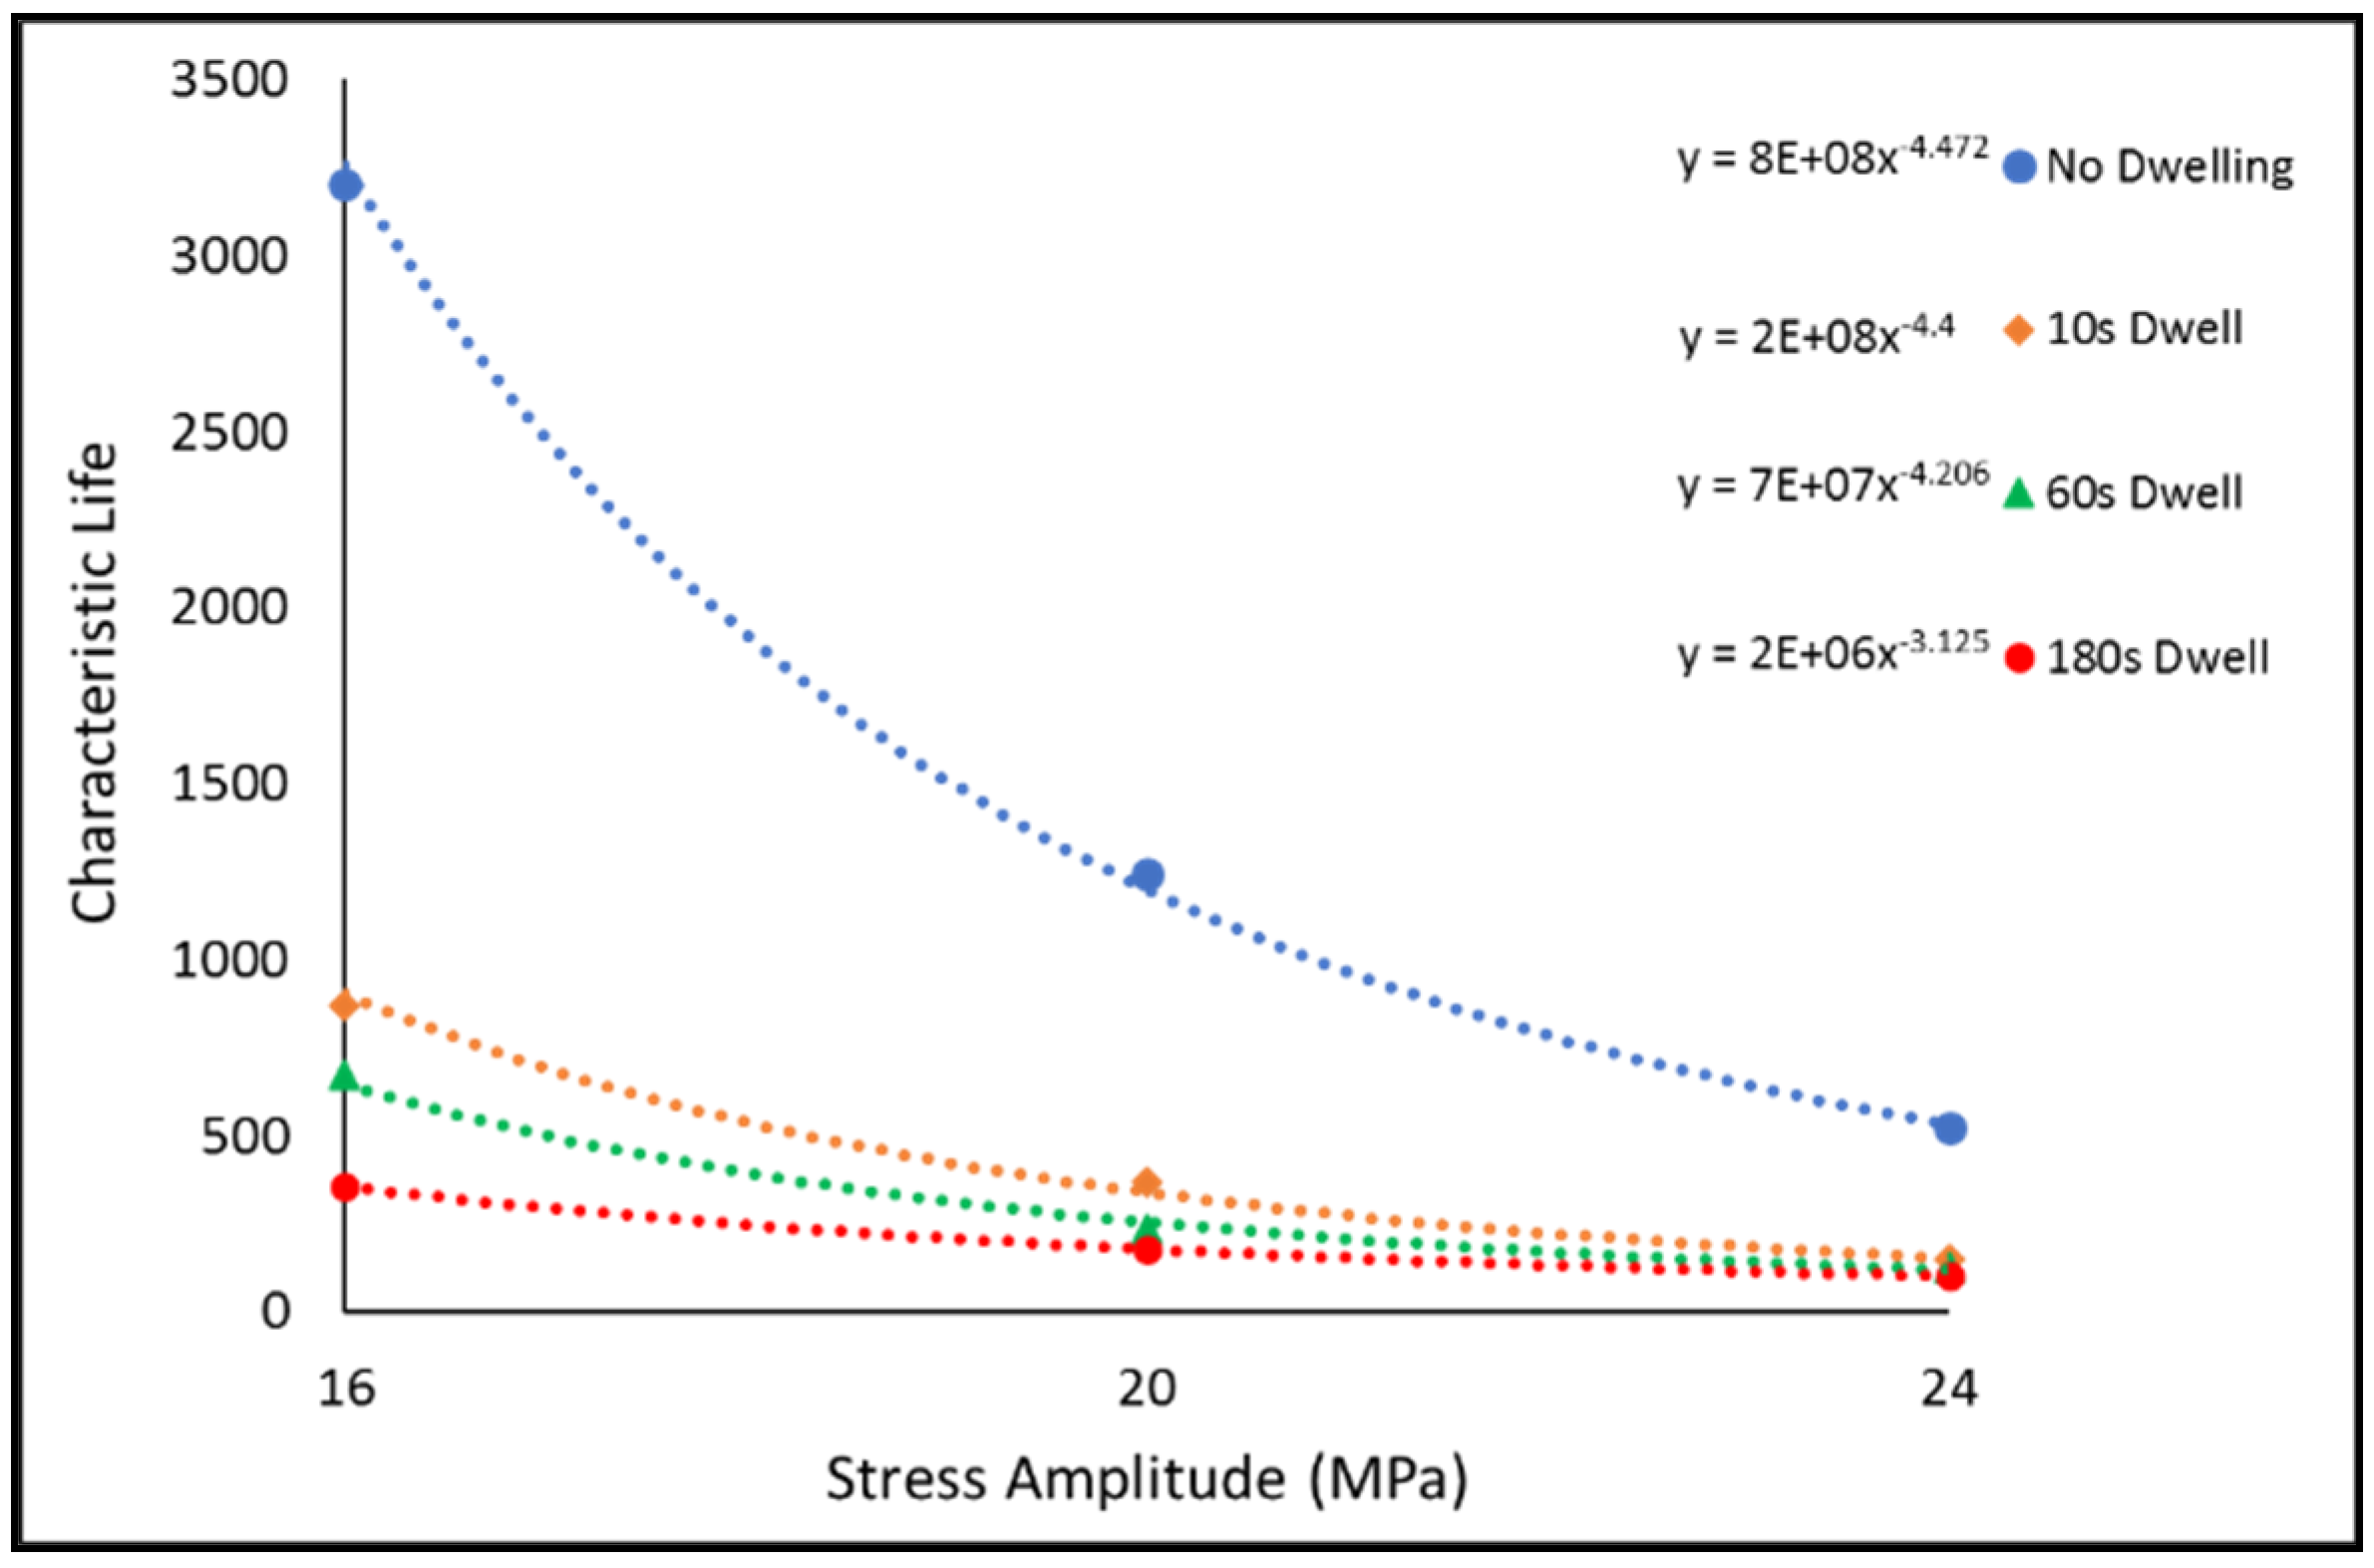
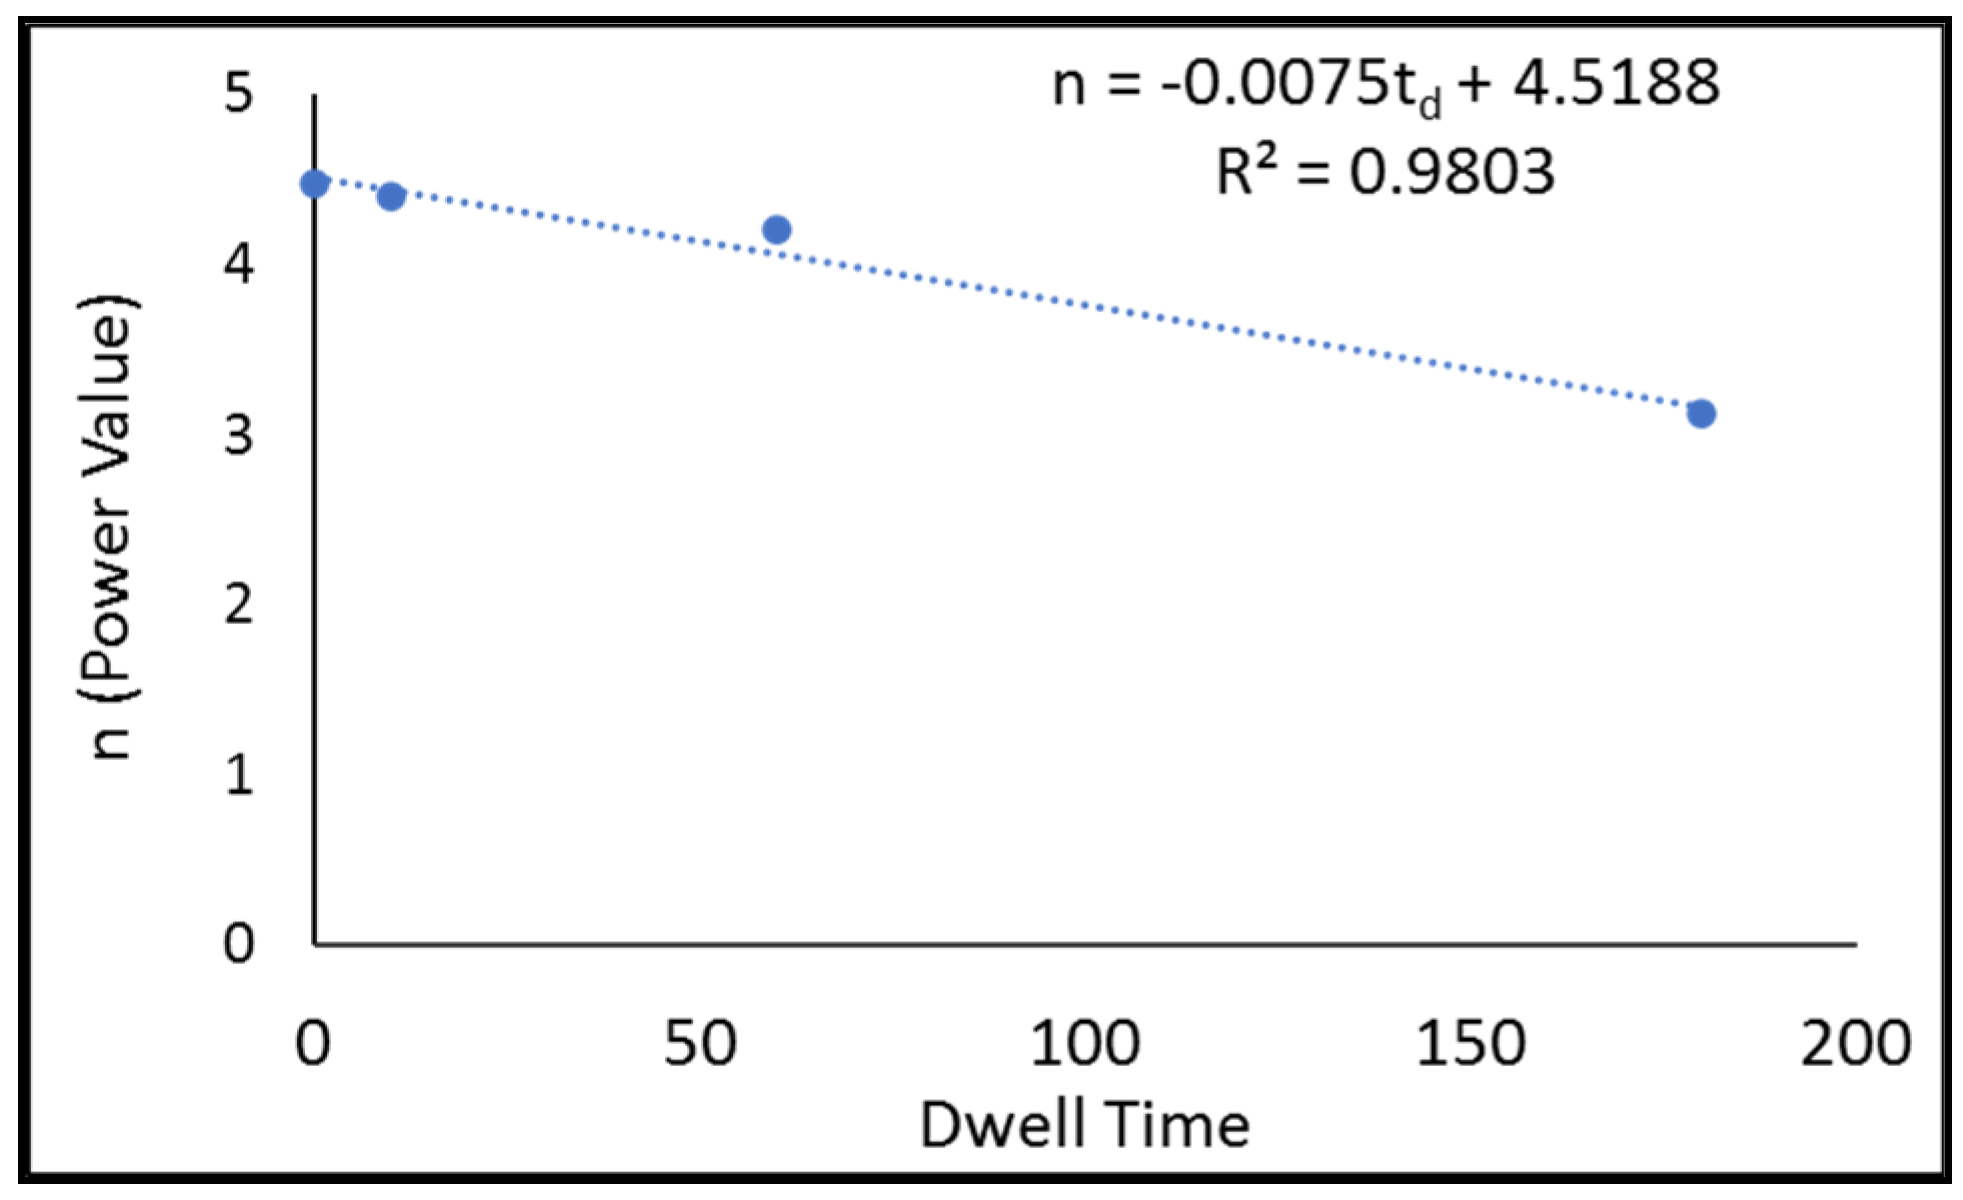
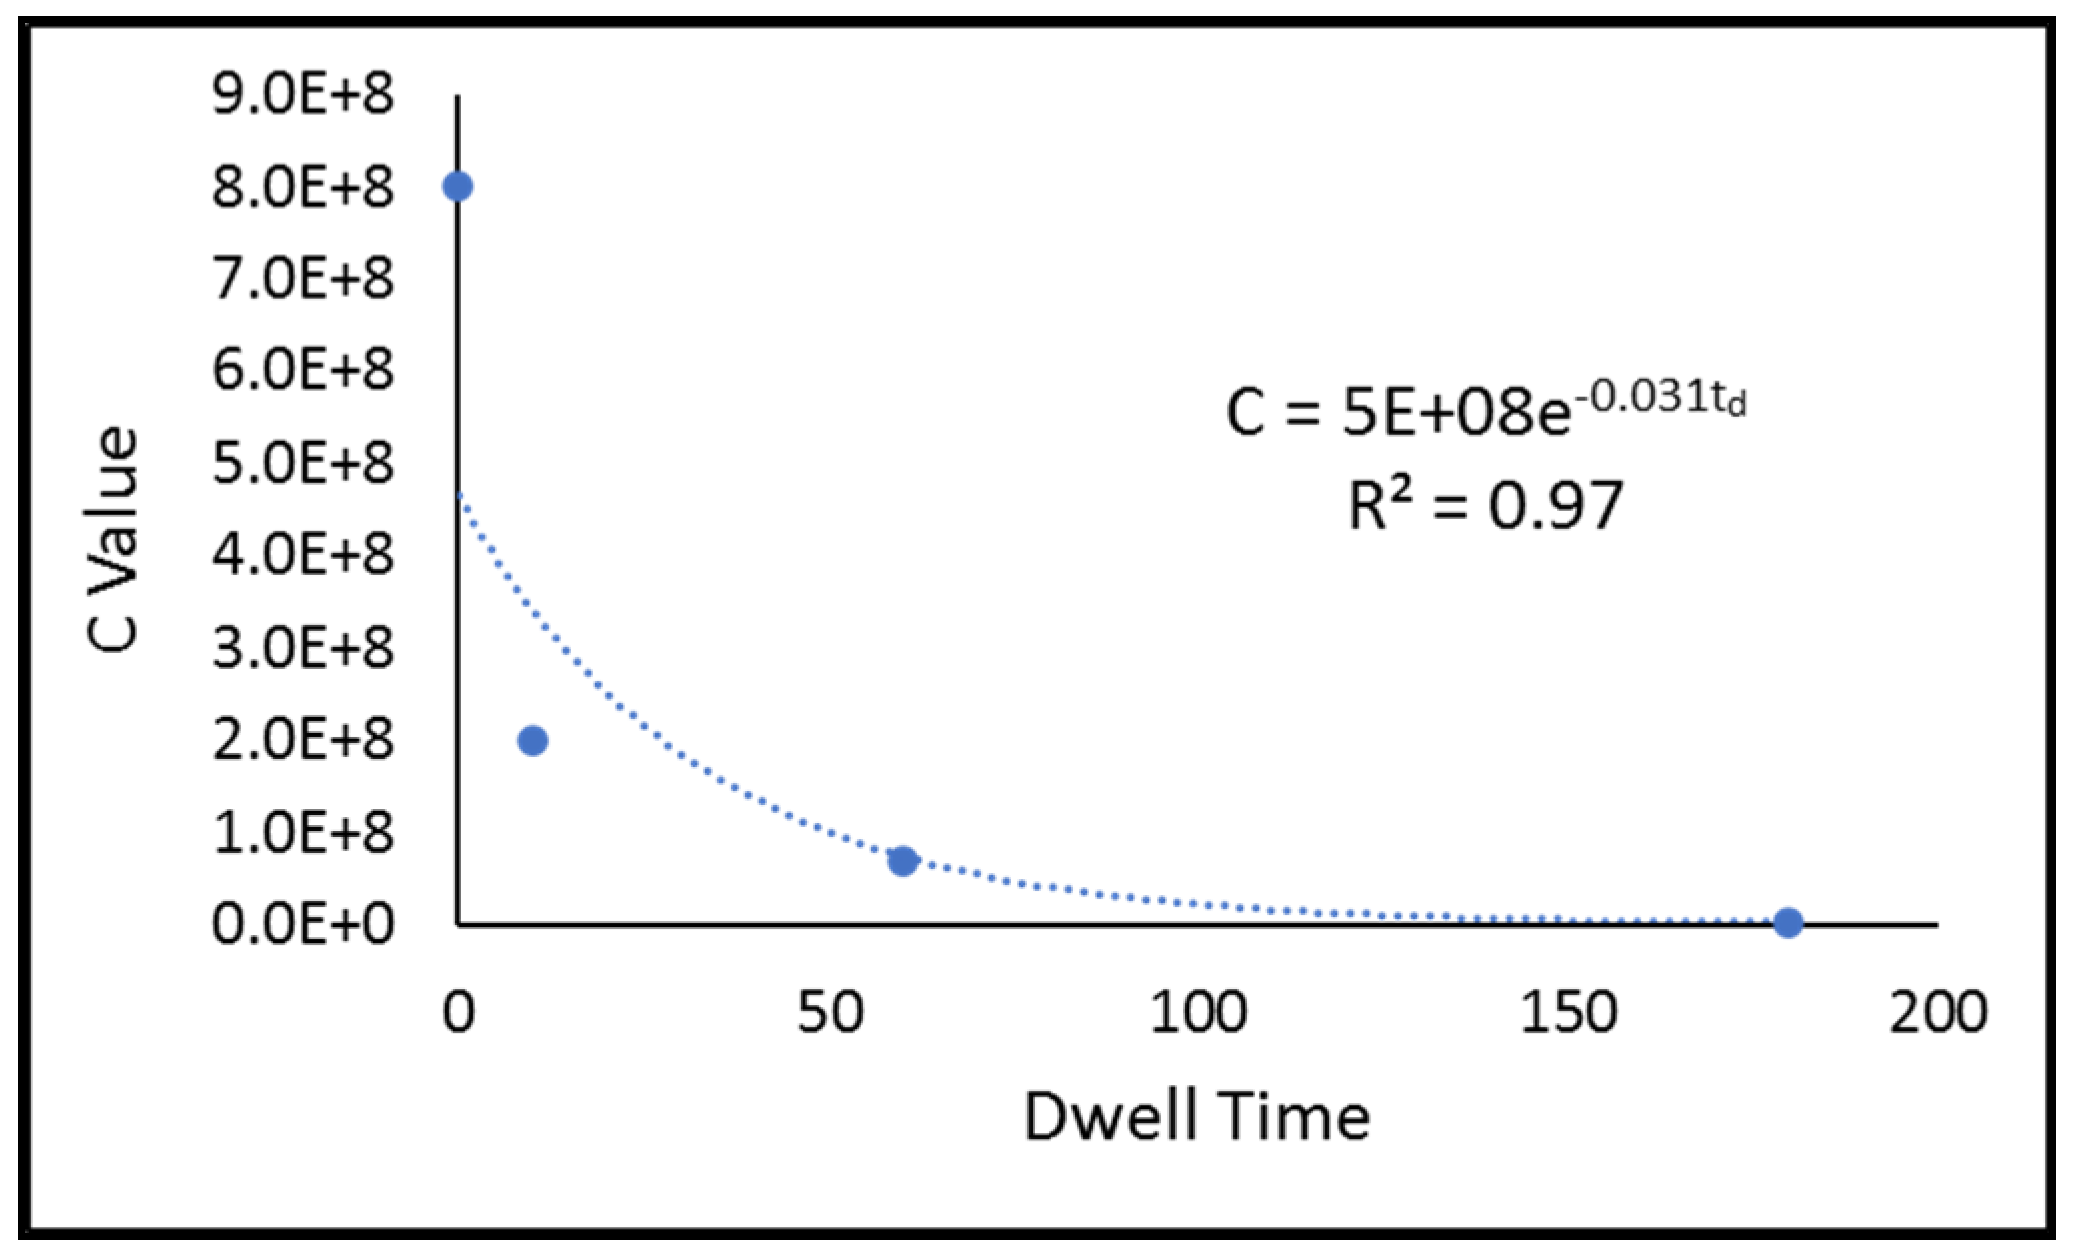
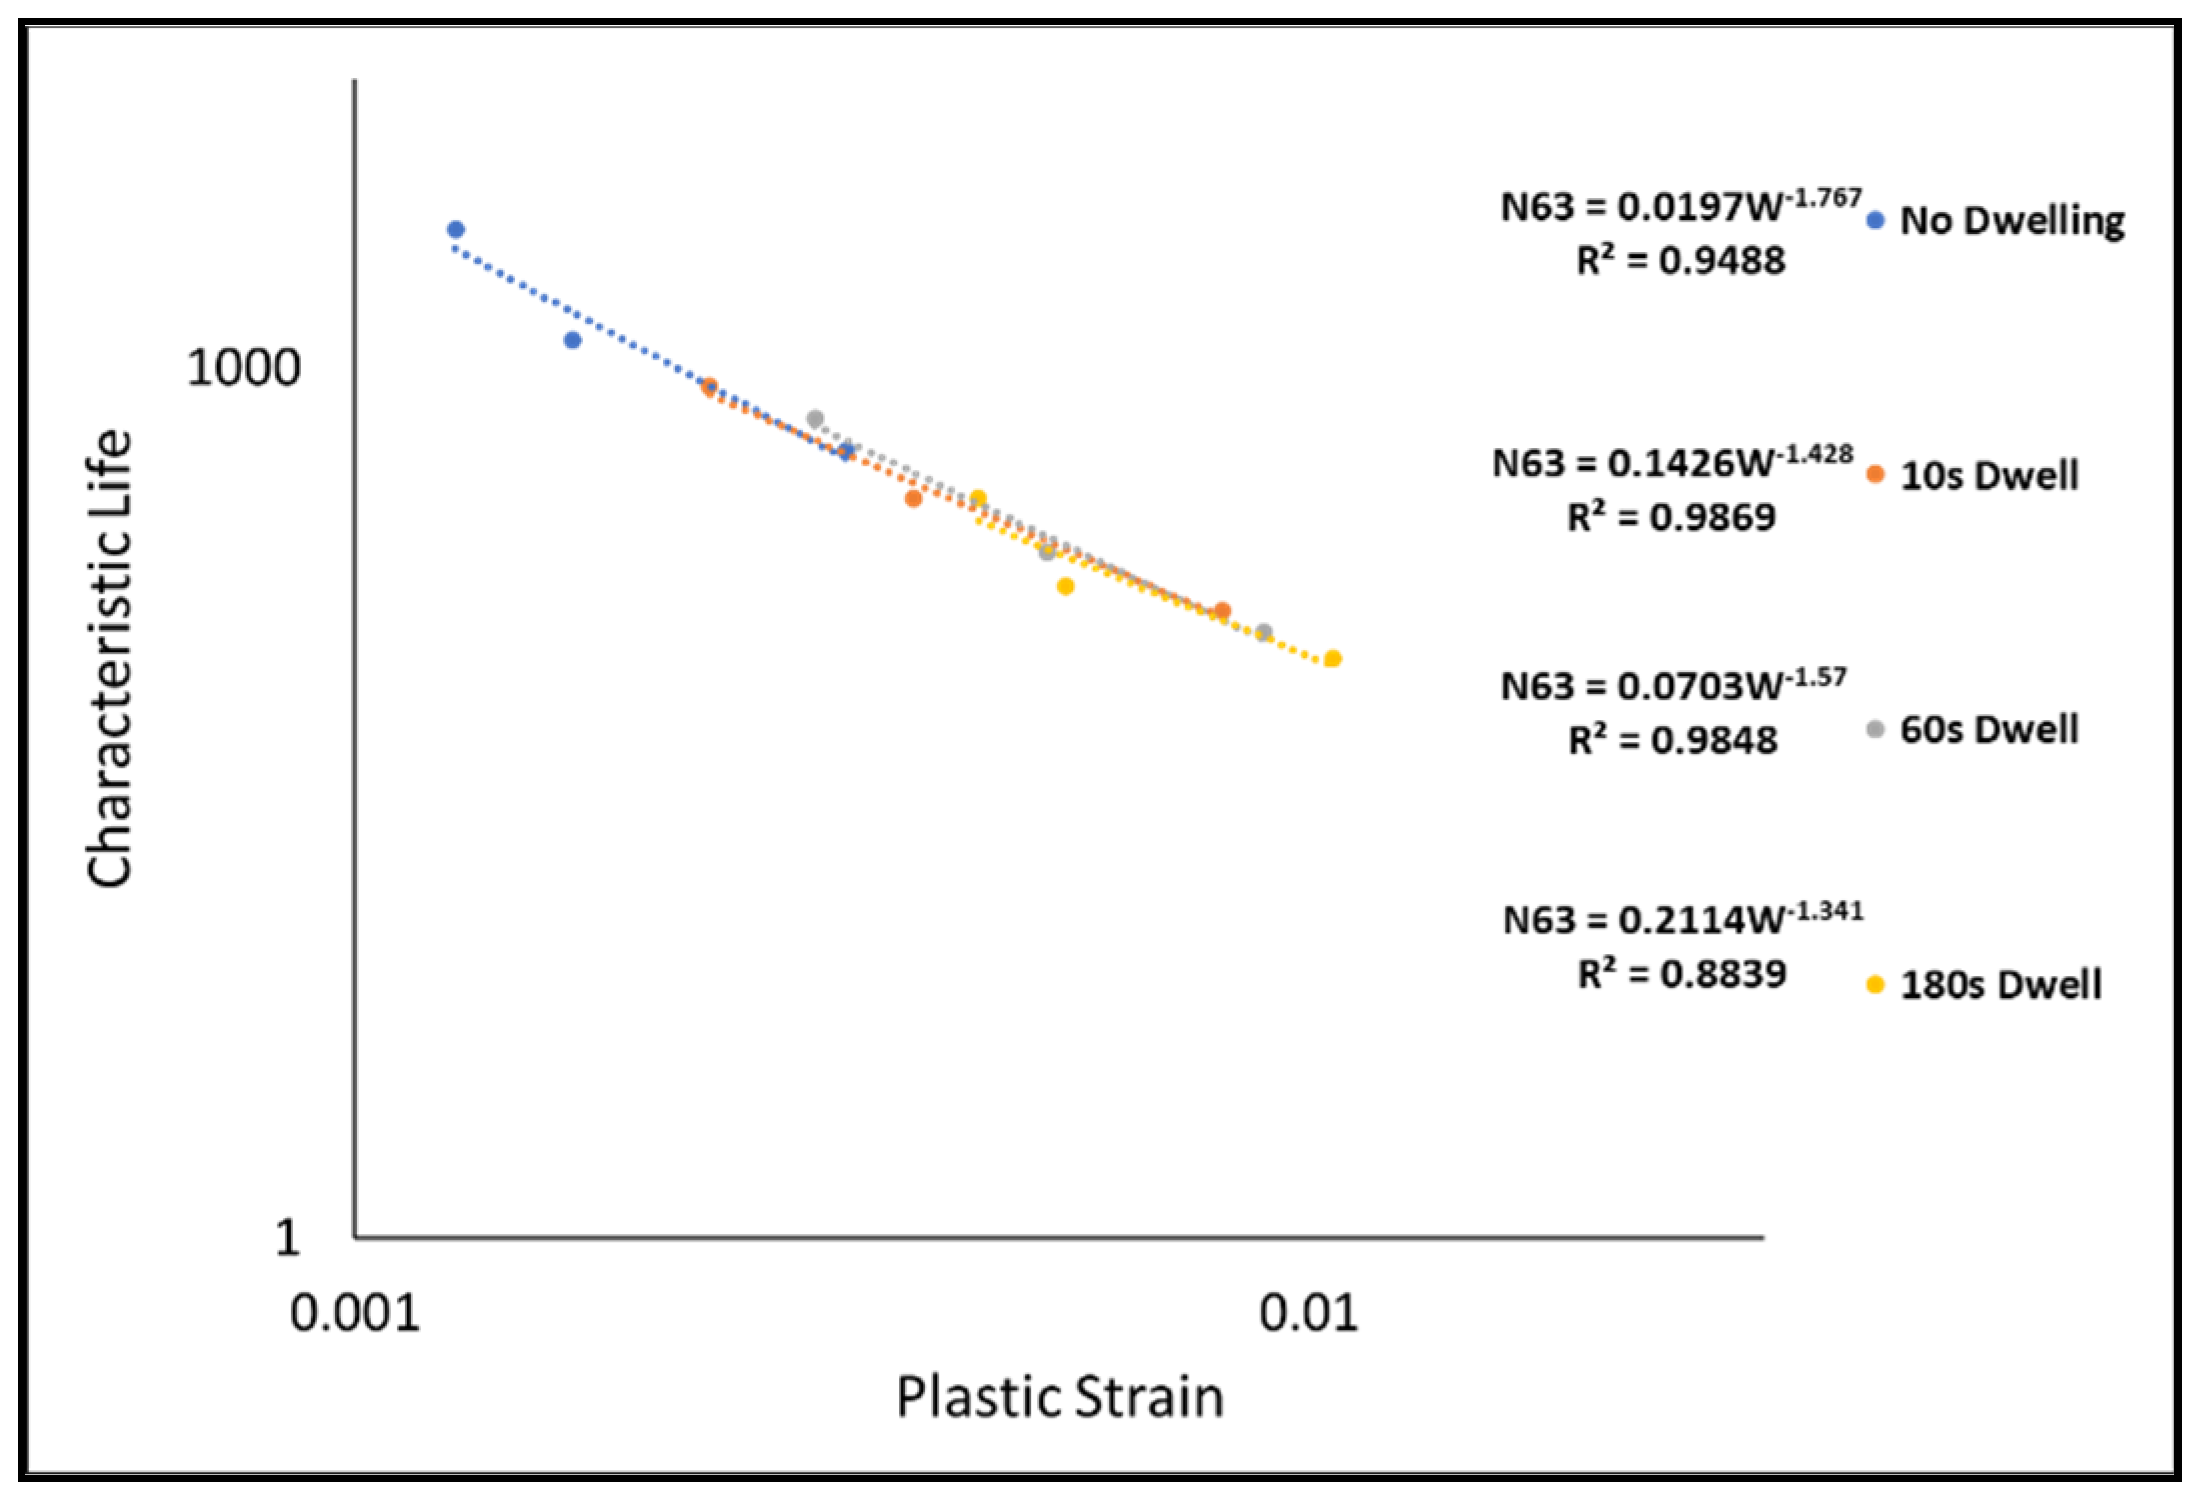
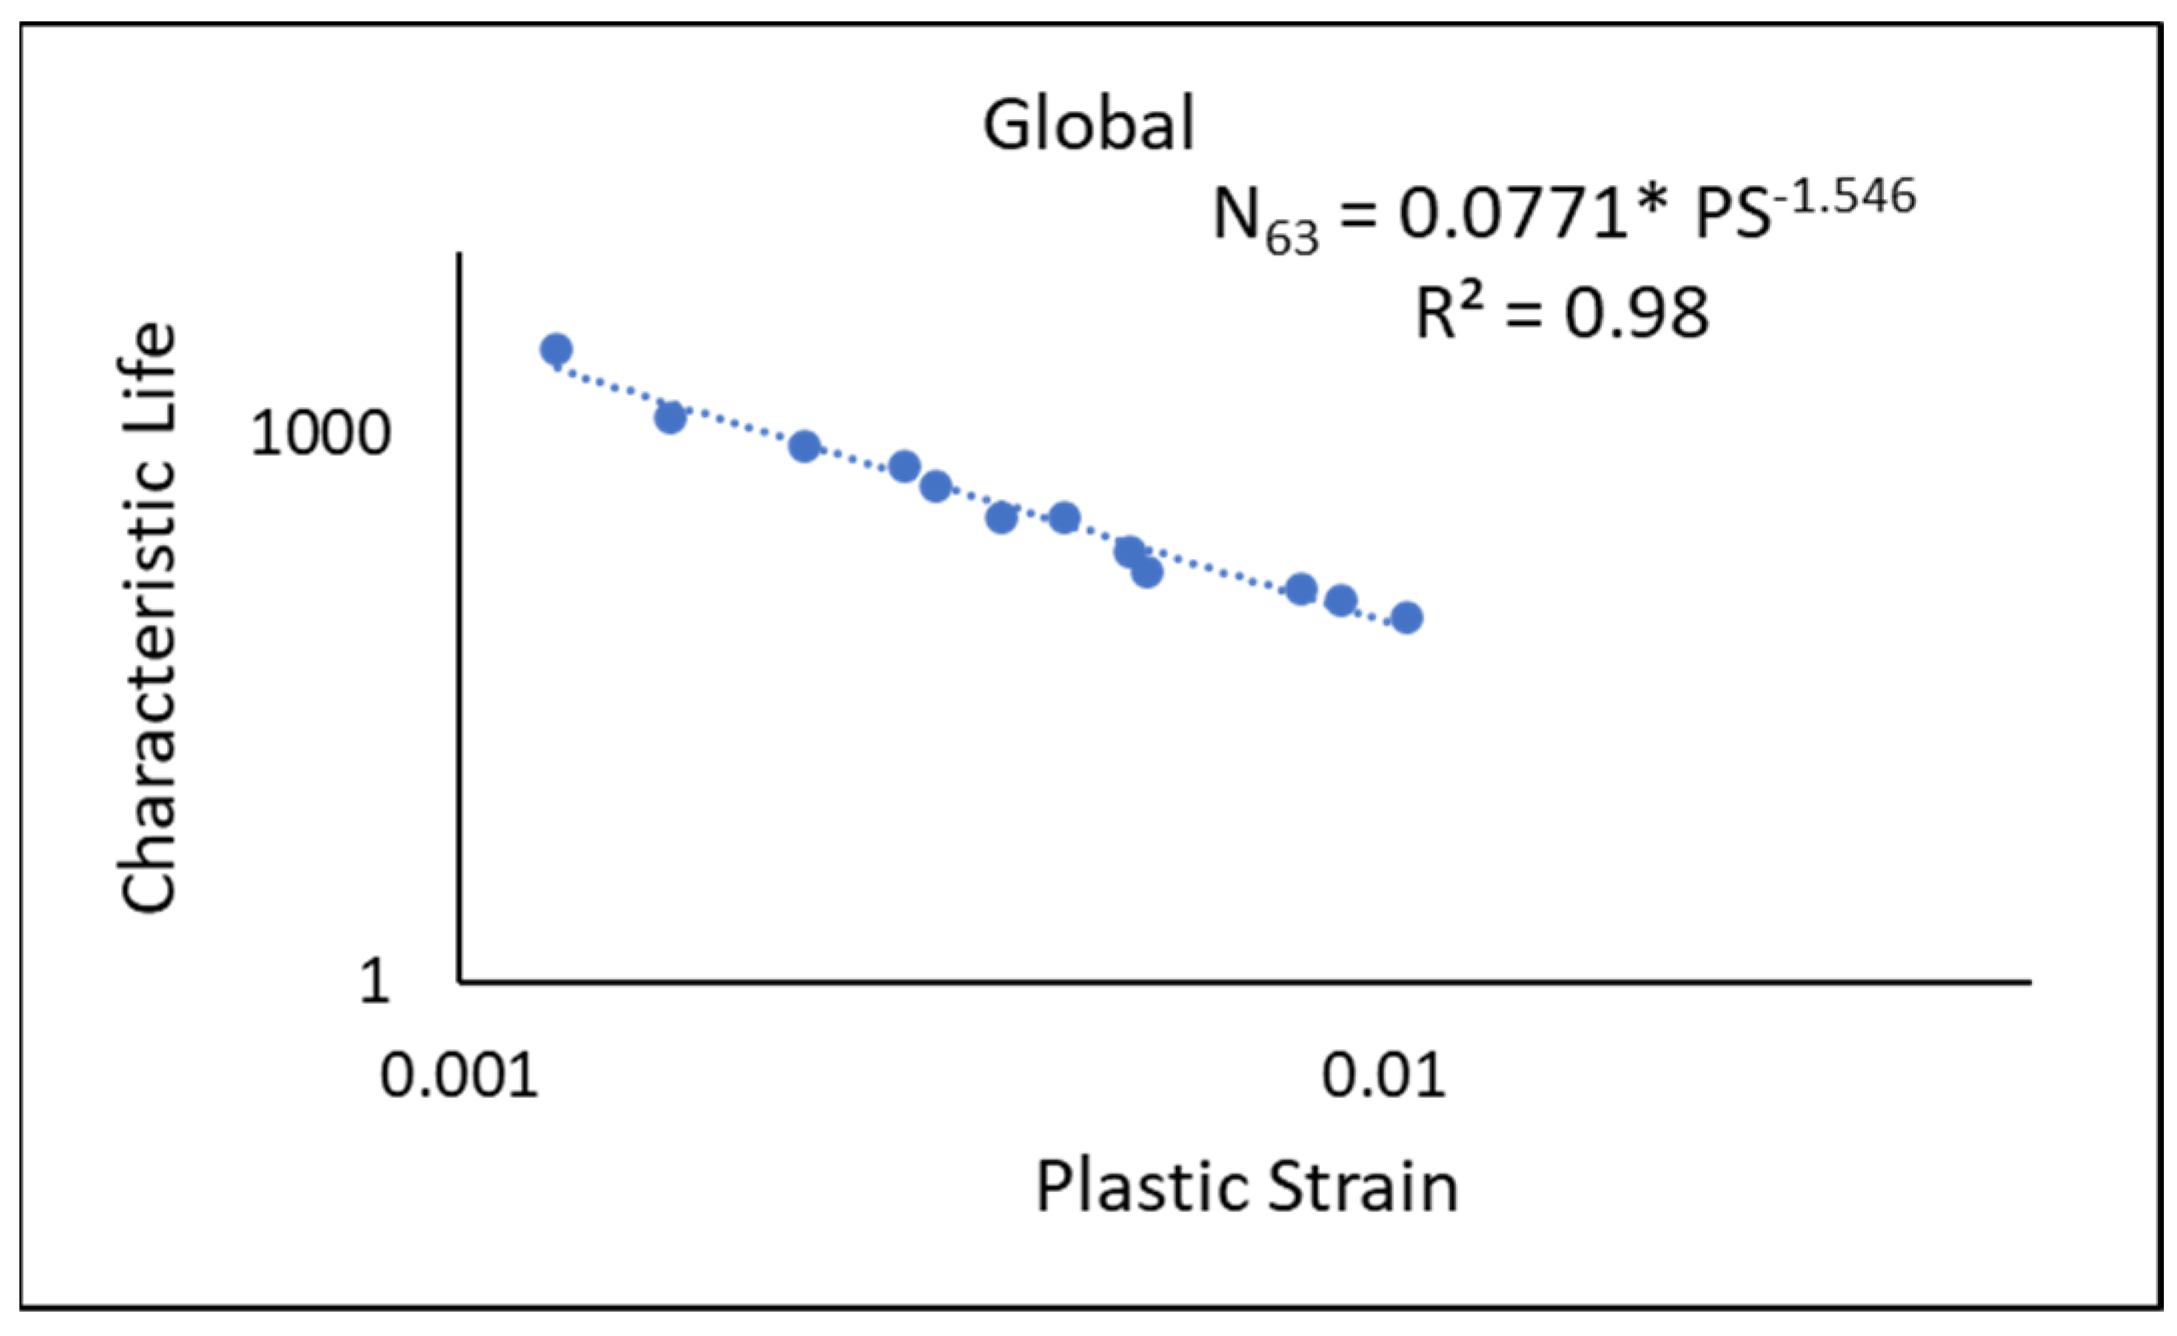
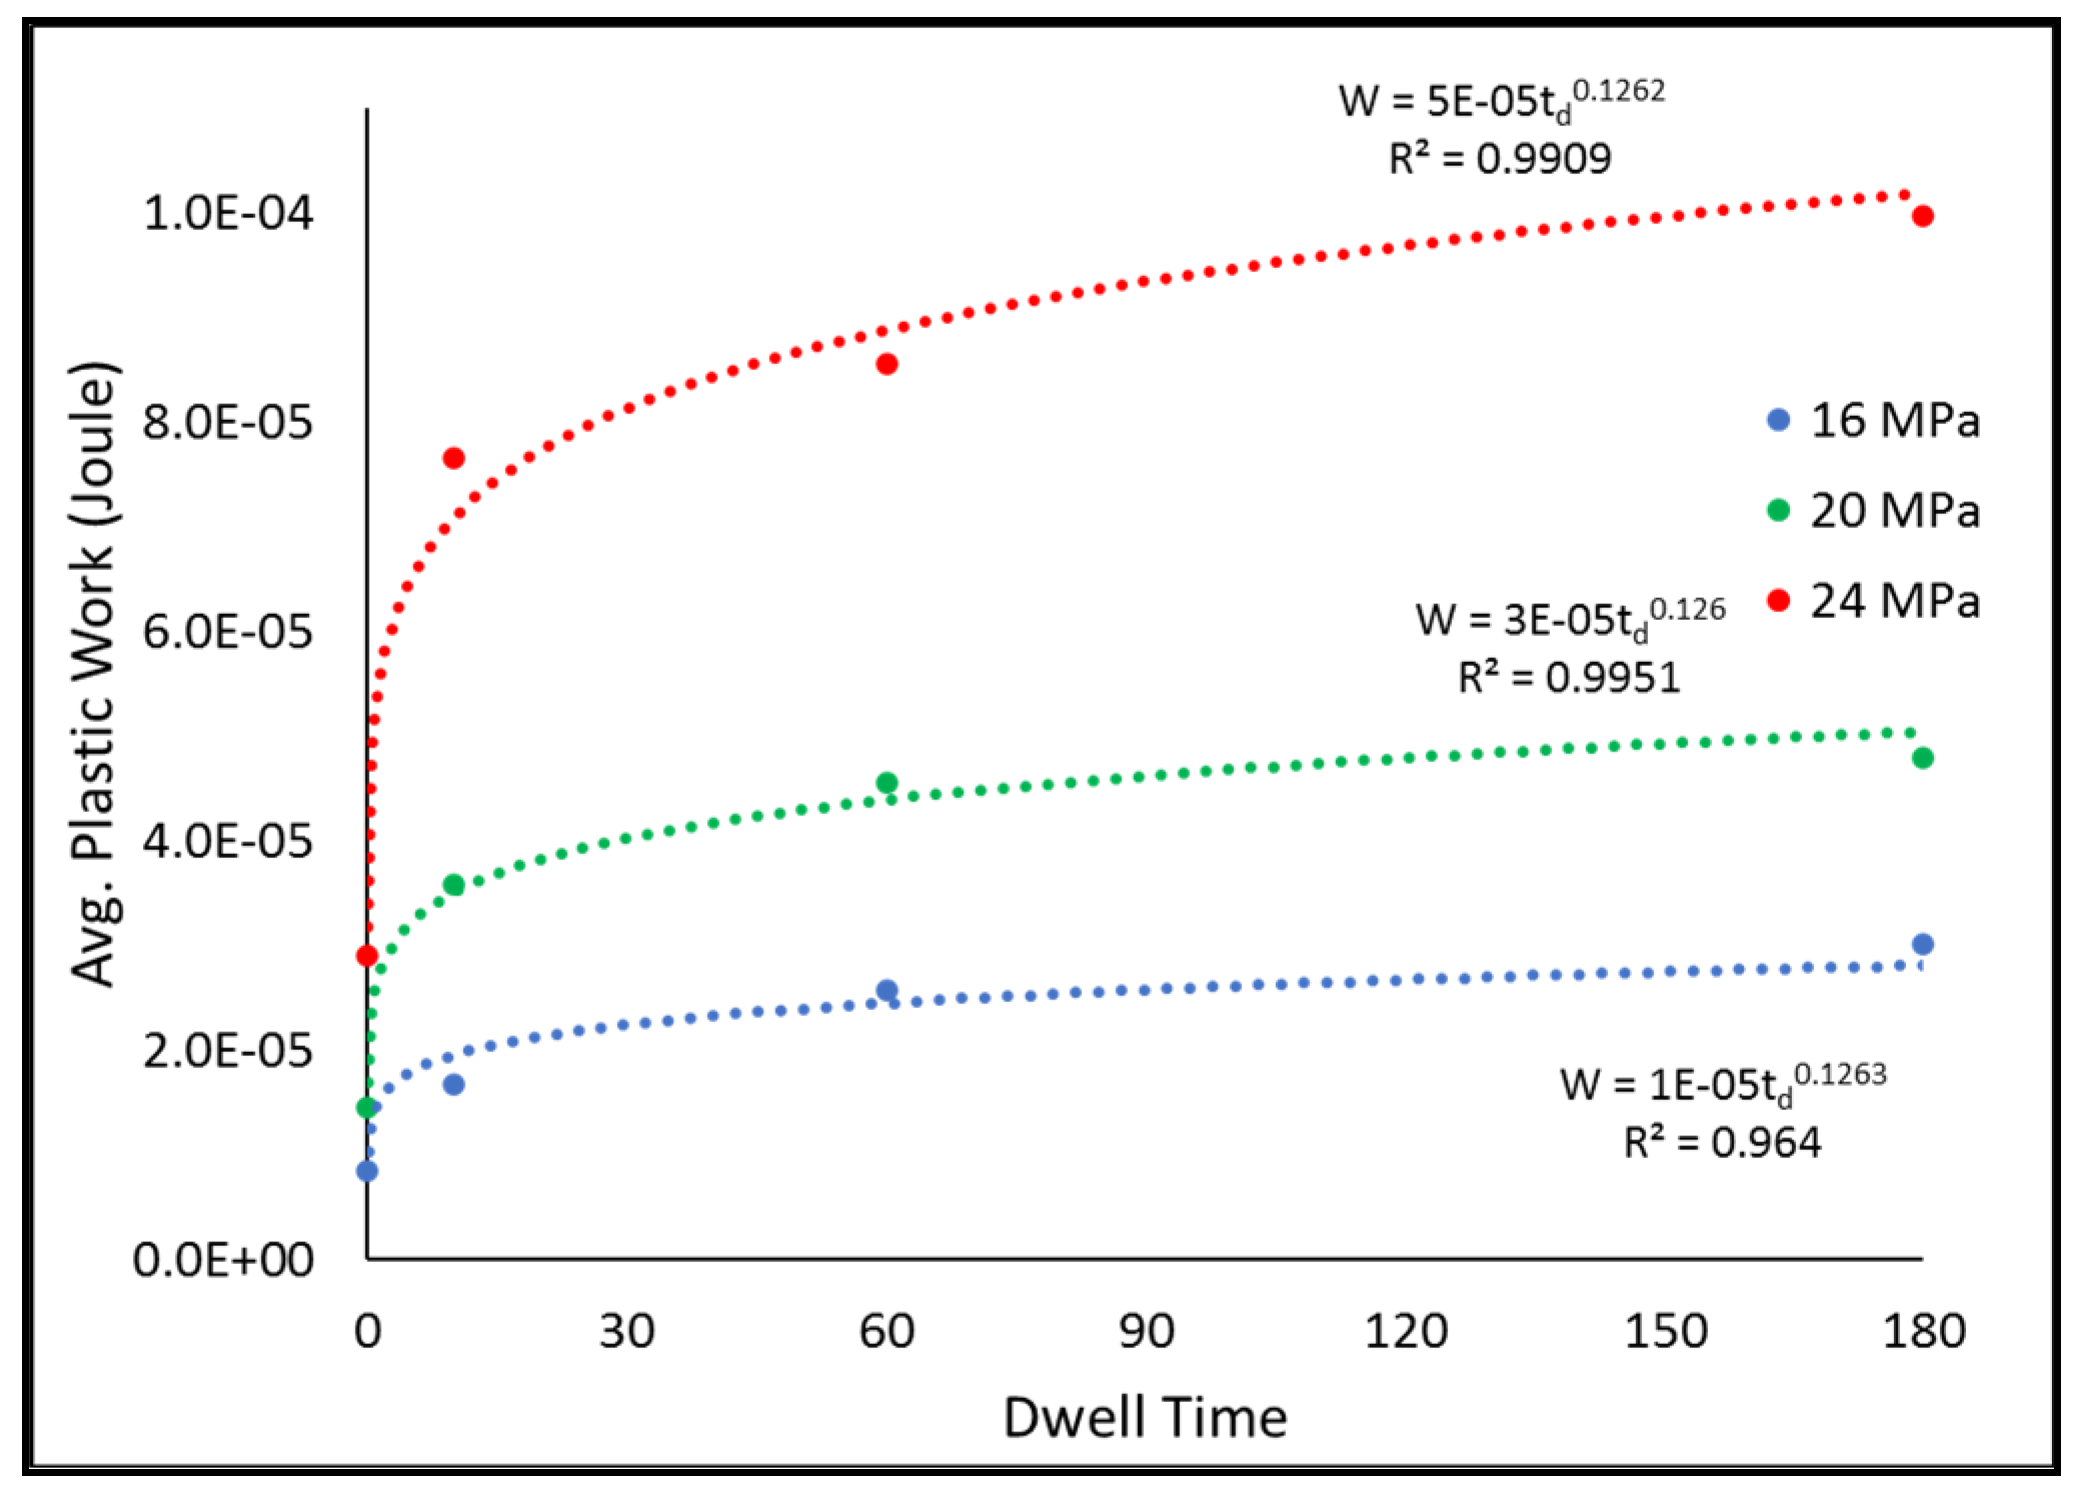
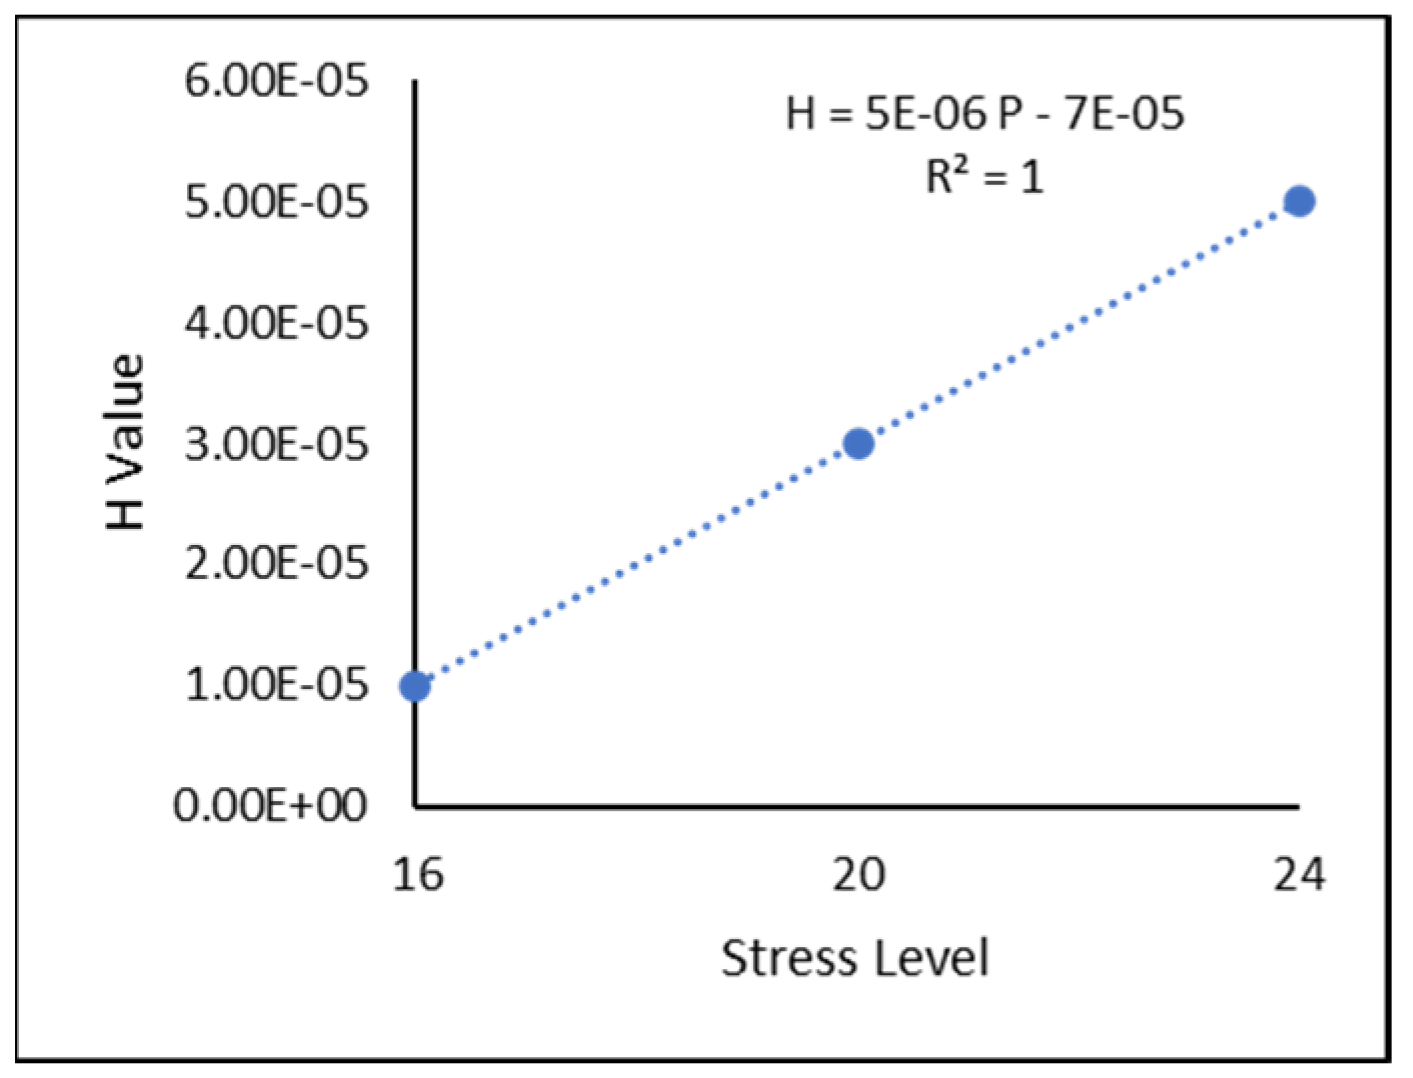
Prediction Modeling
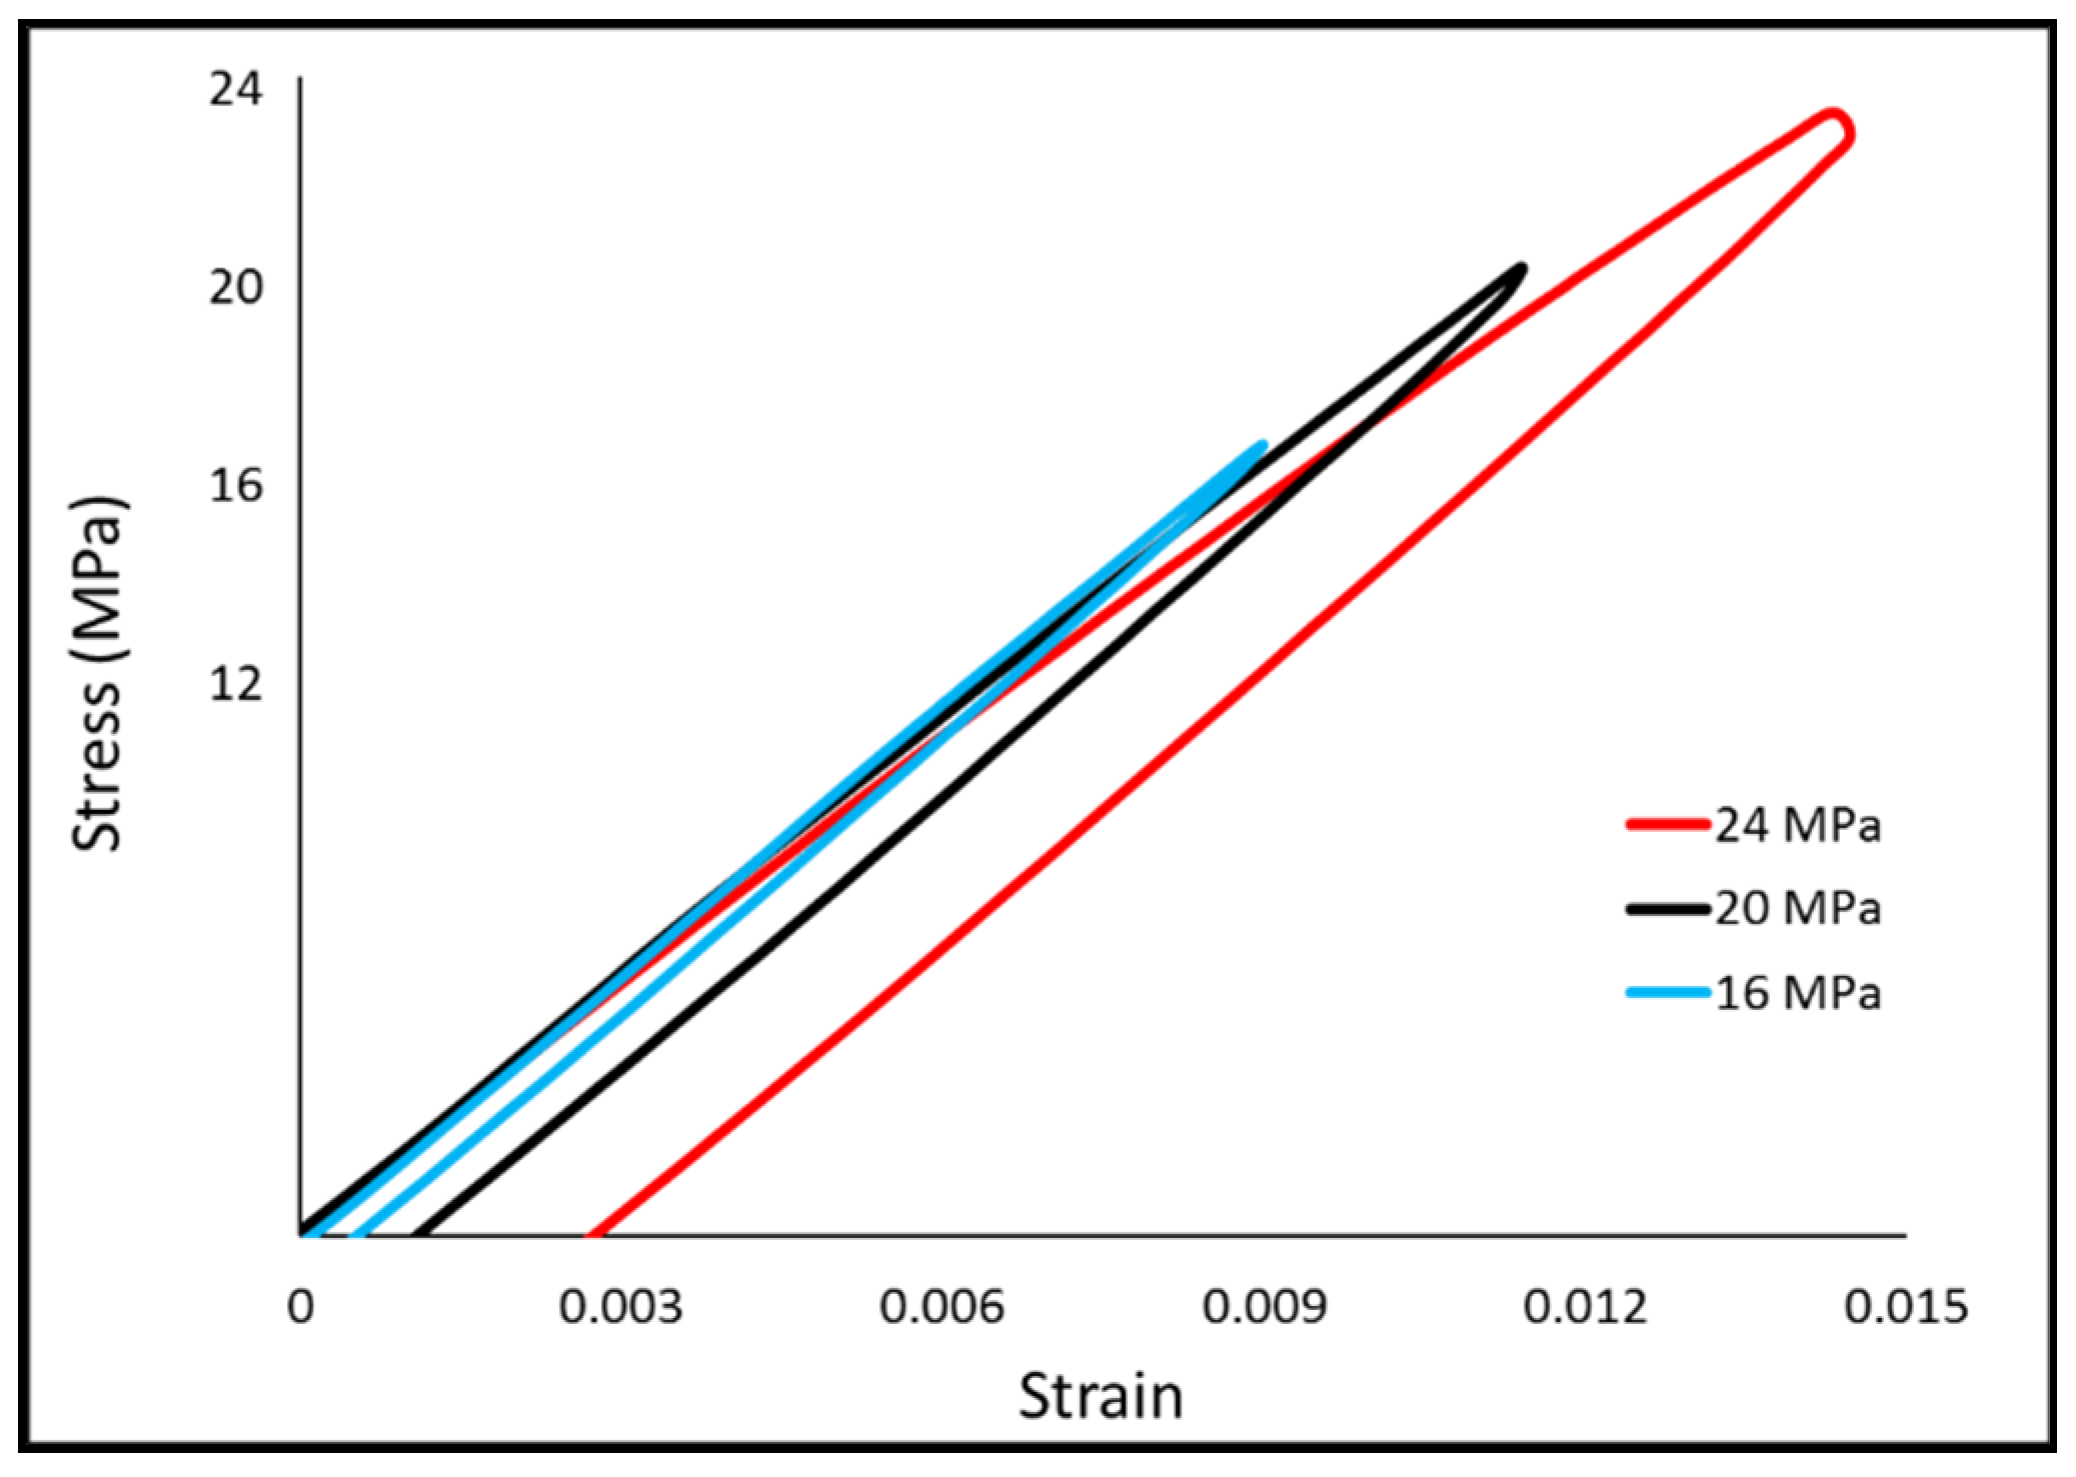
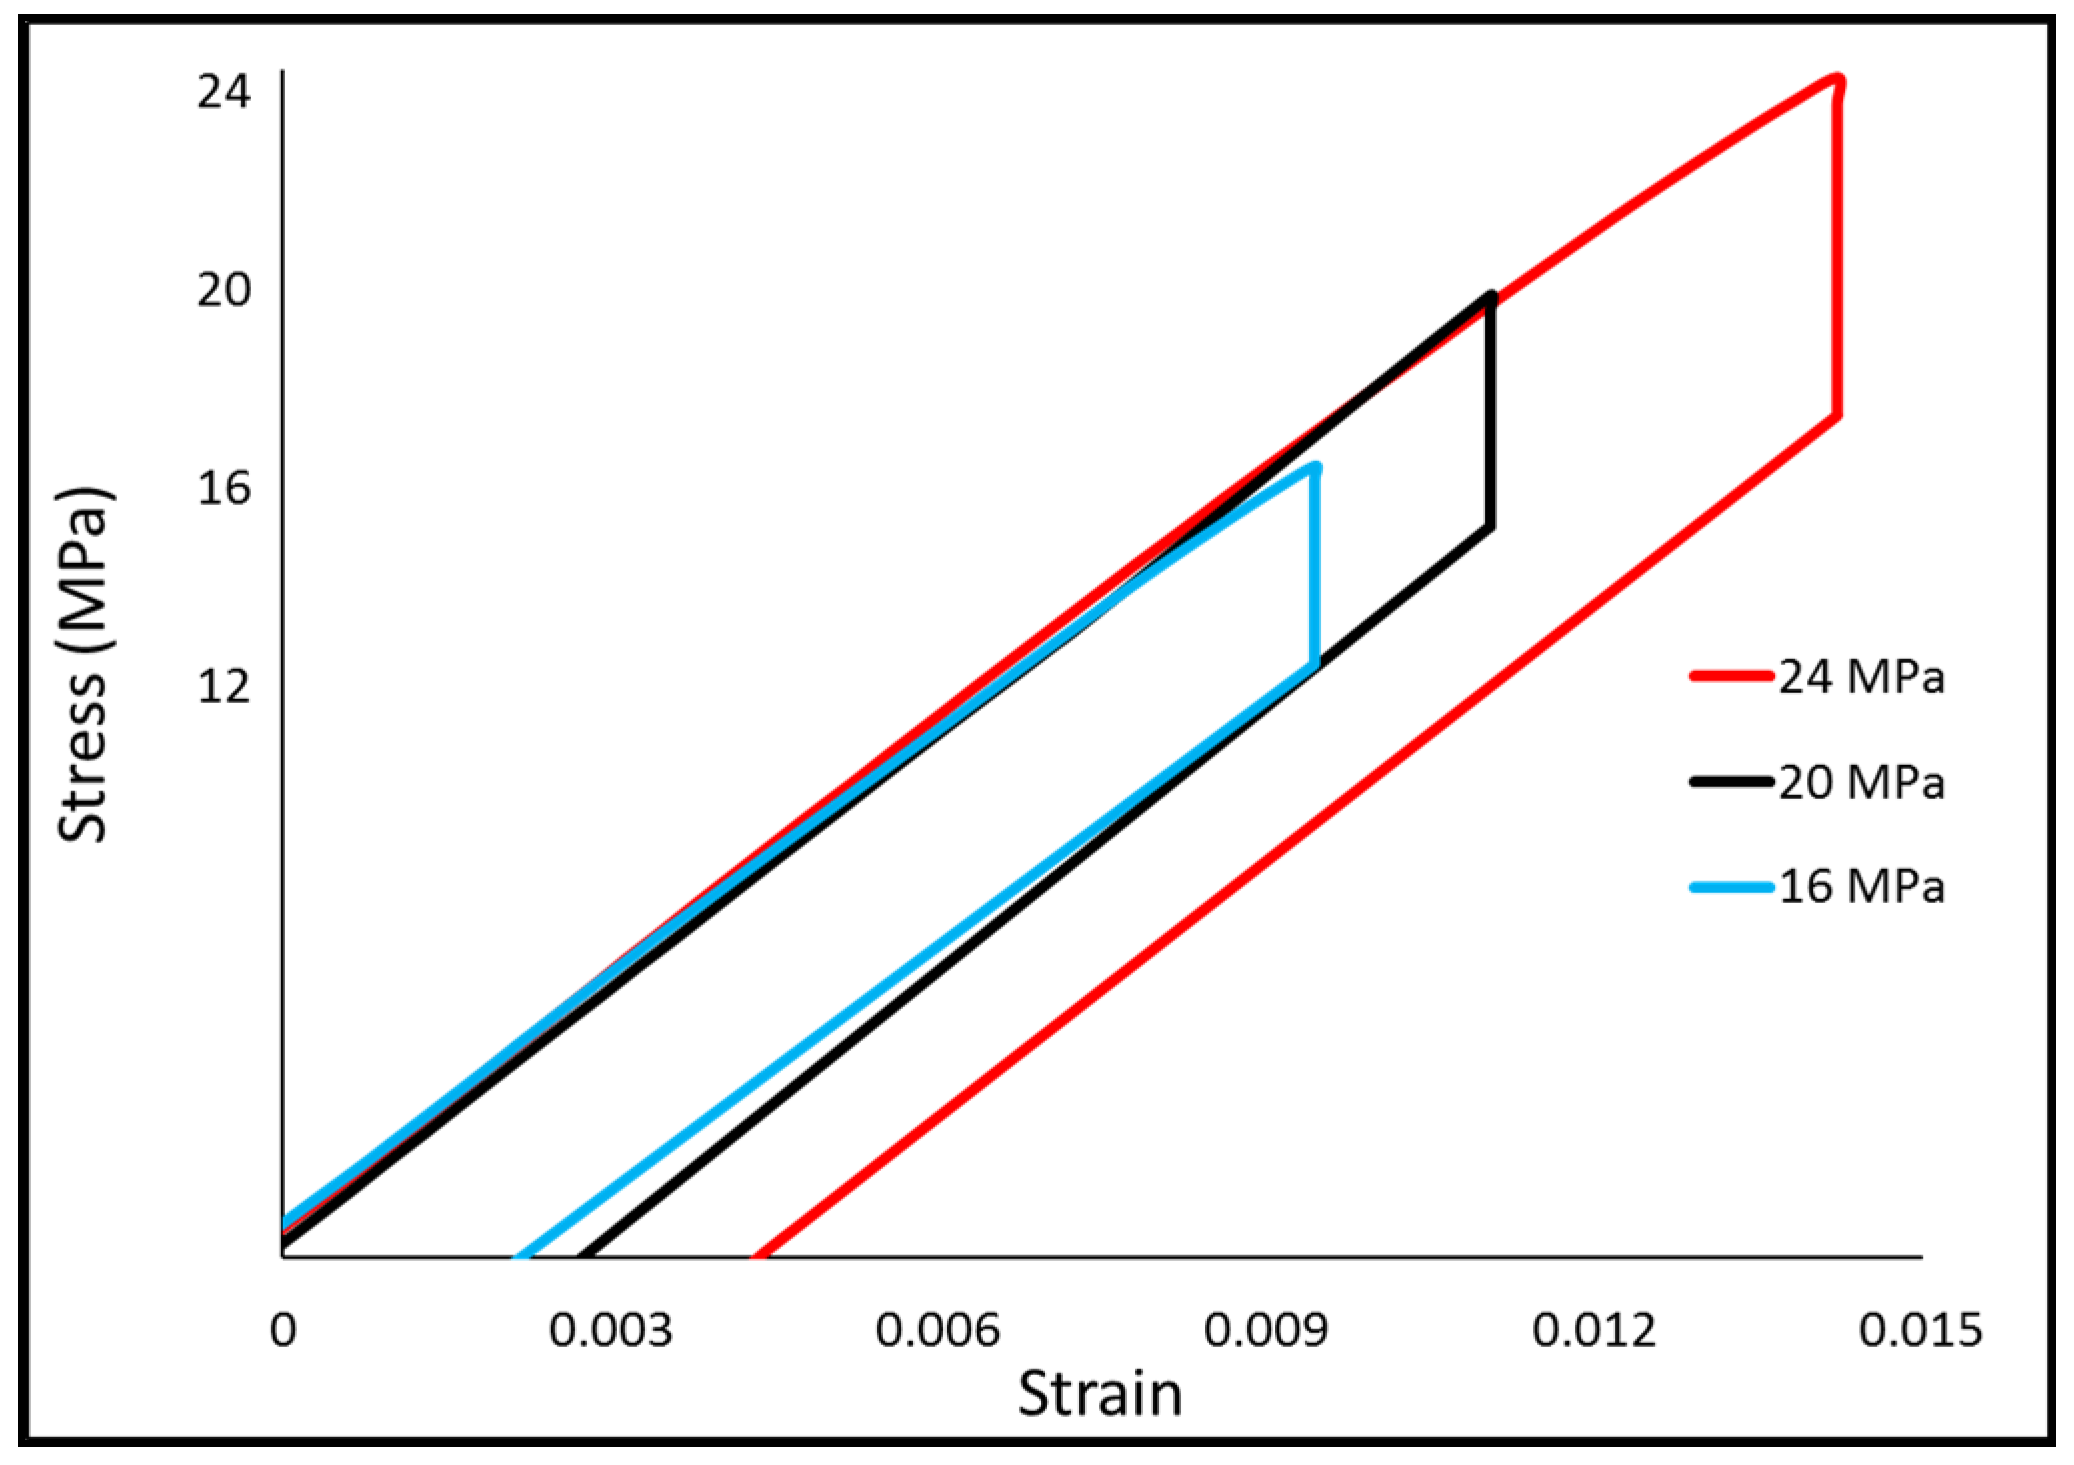
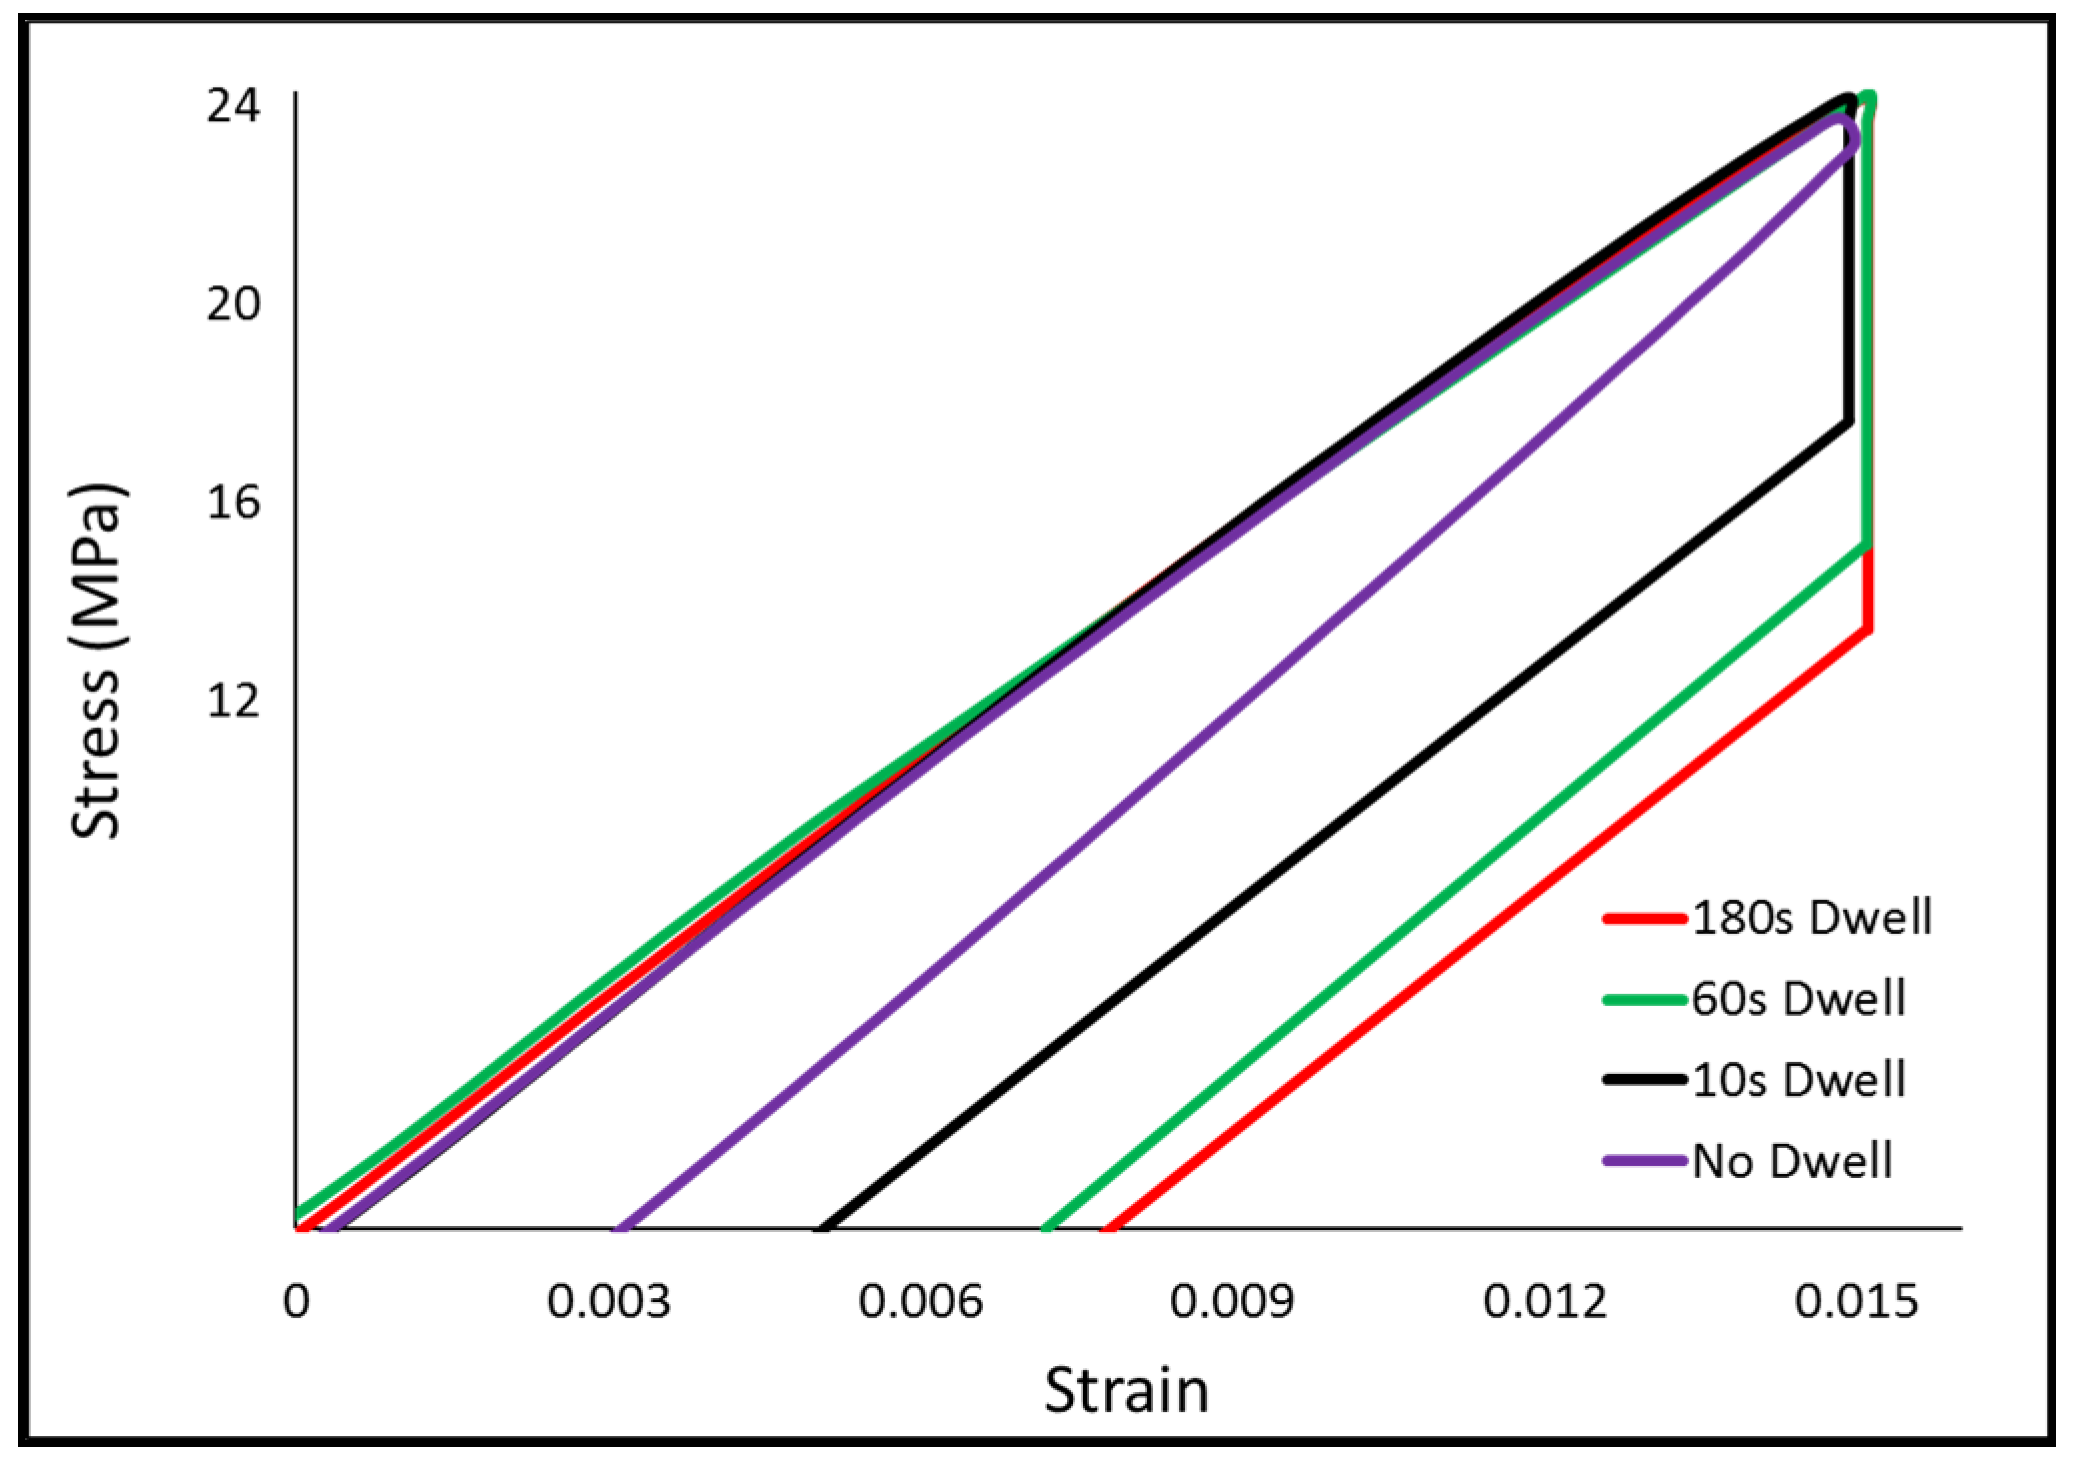
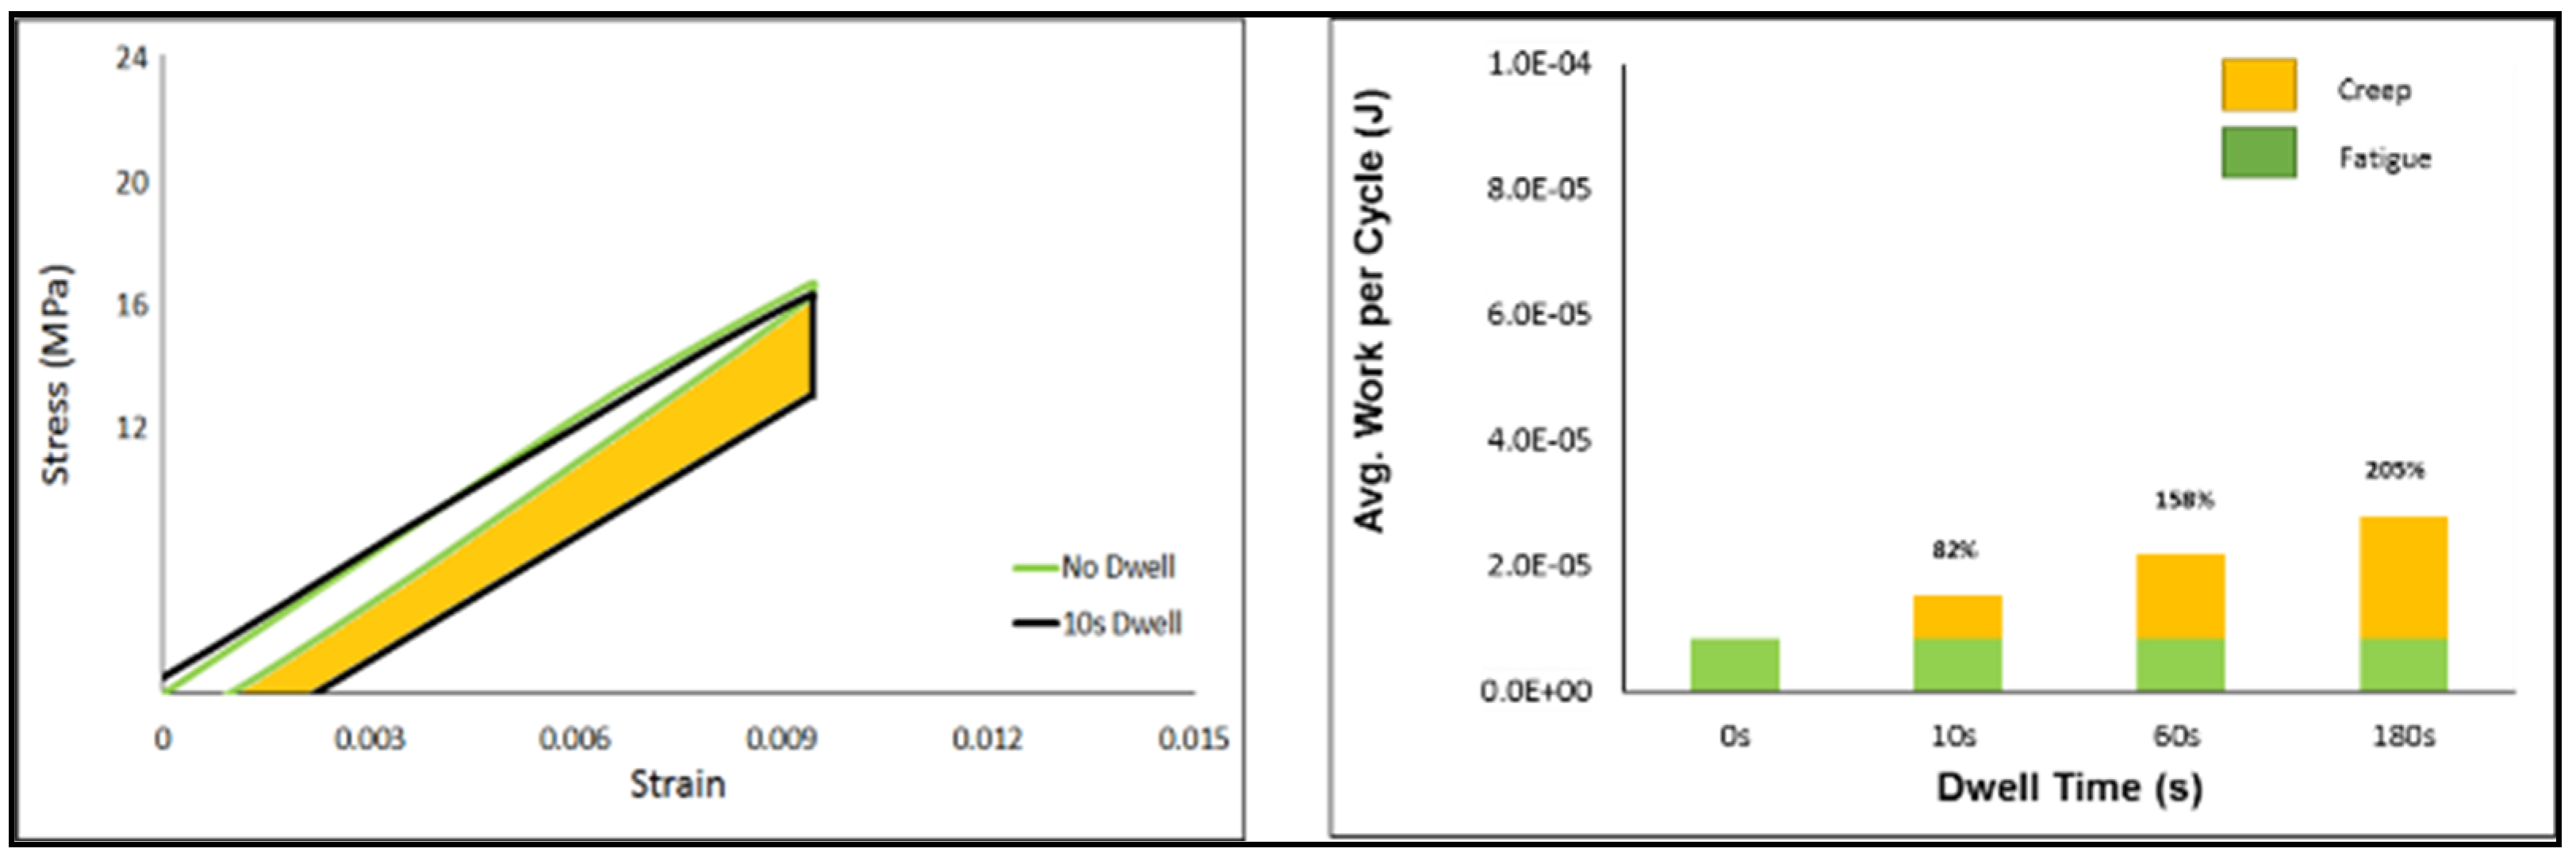
3.2. Stress–Strain Analysis
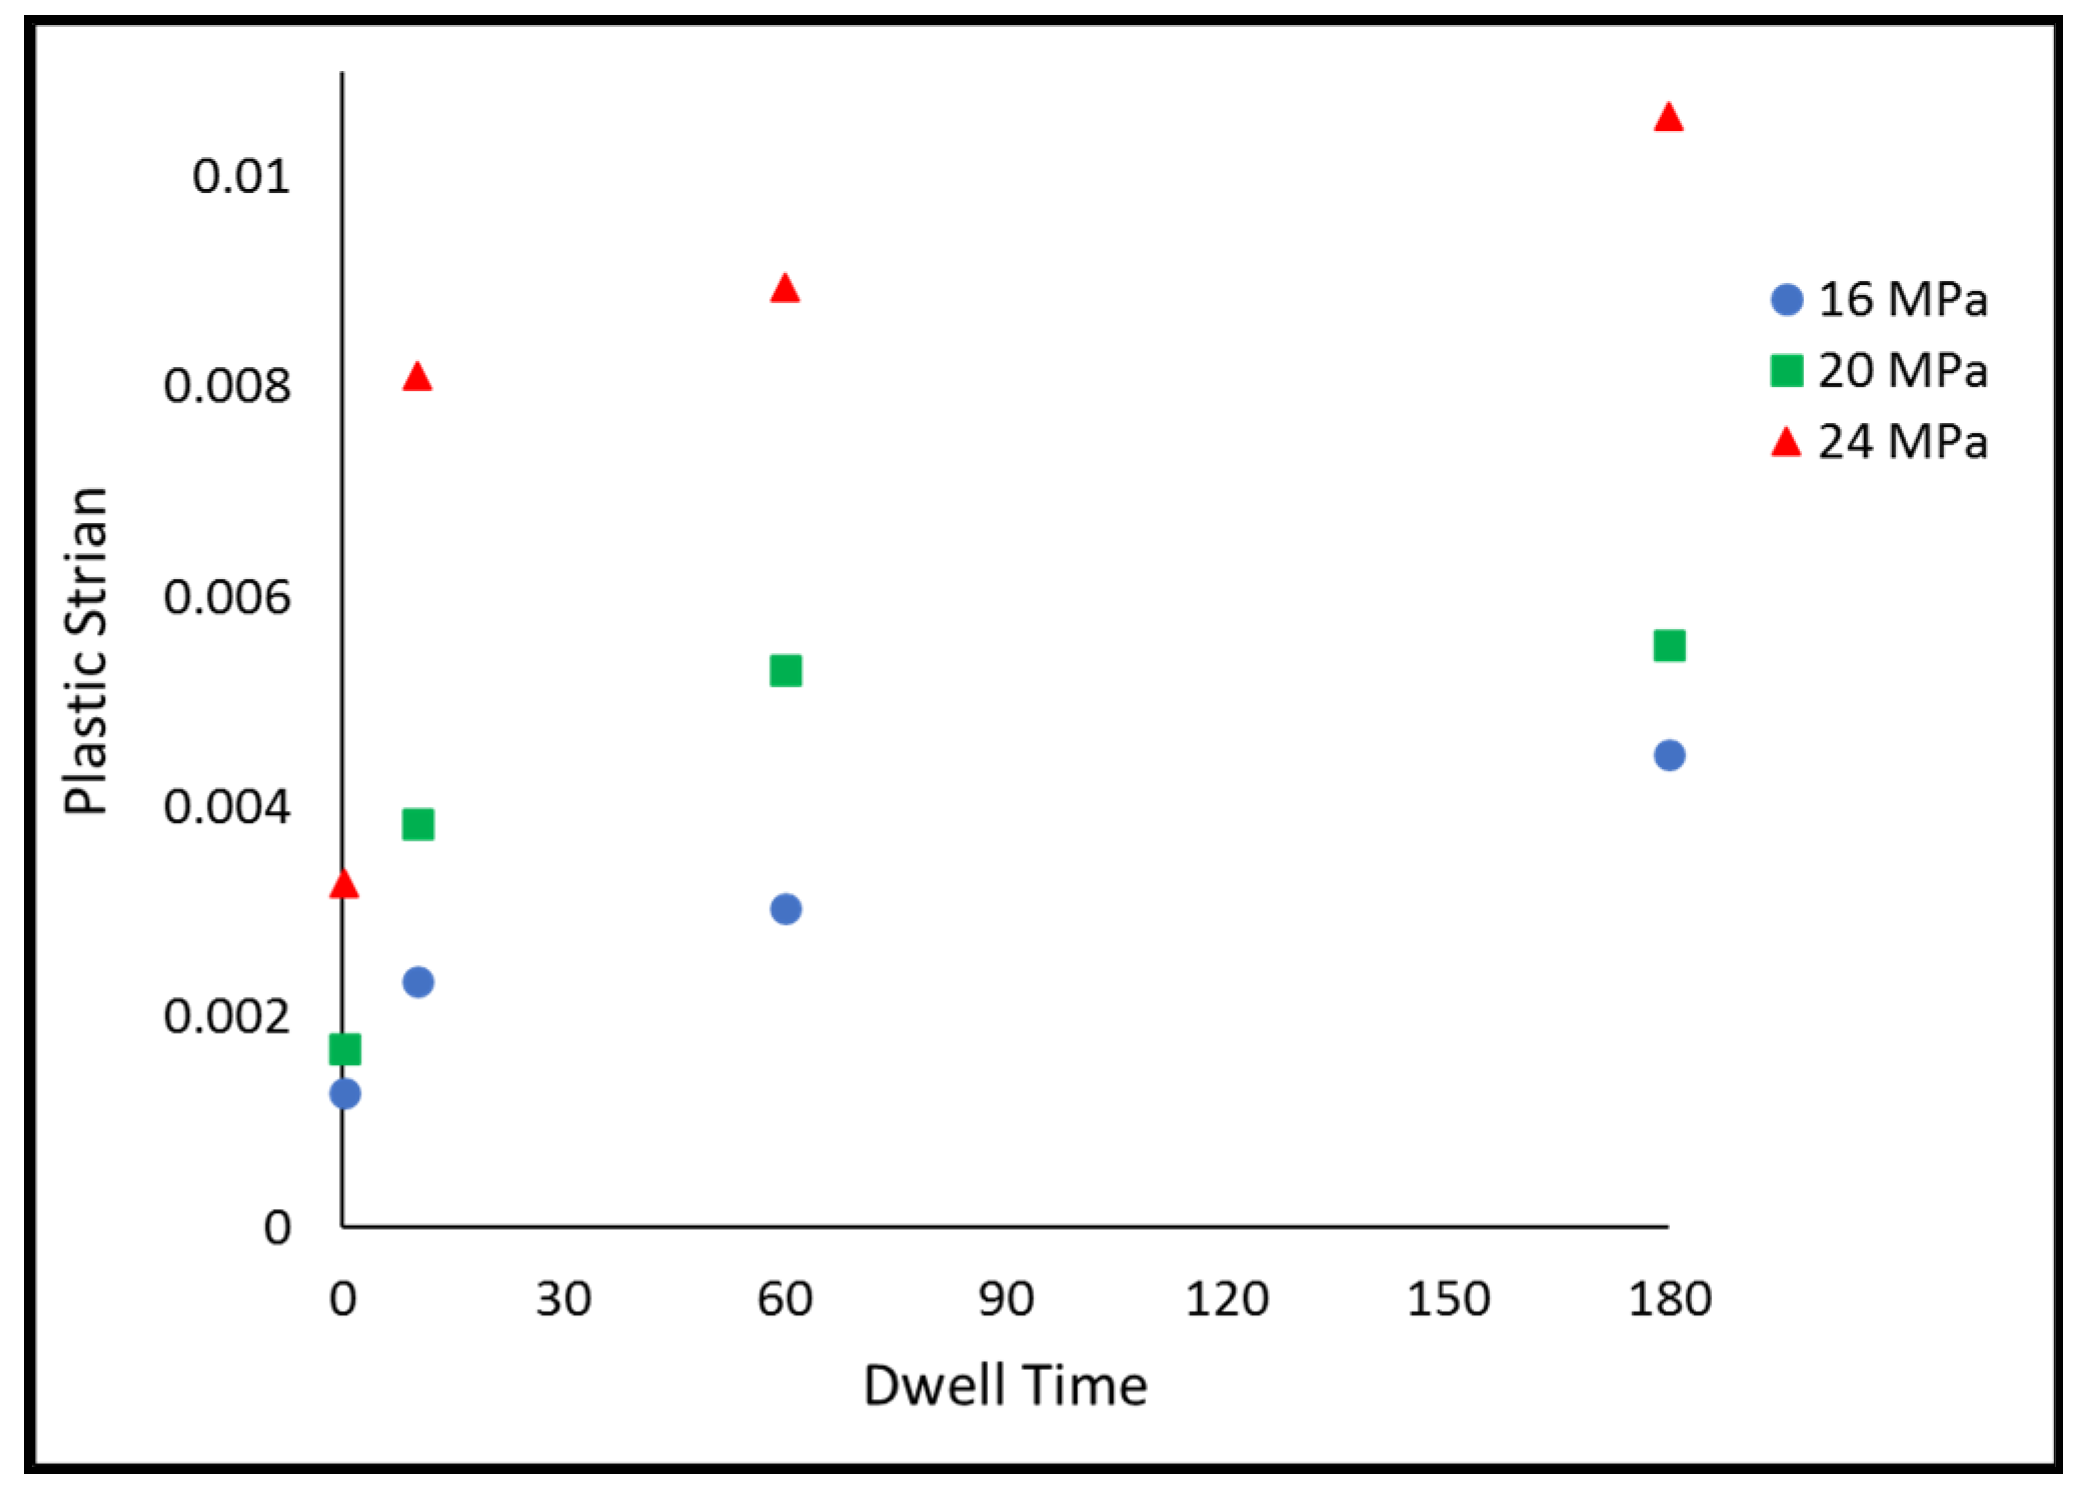
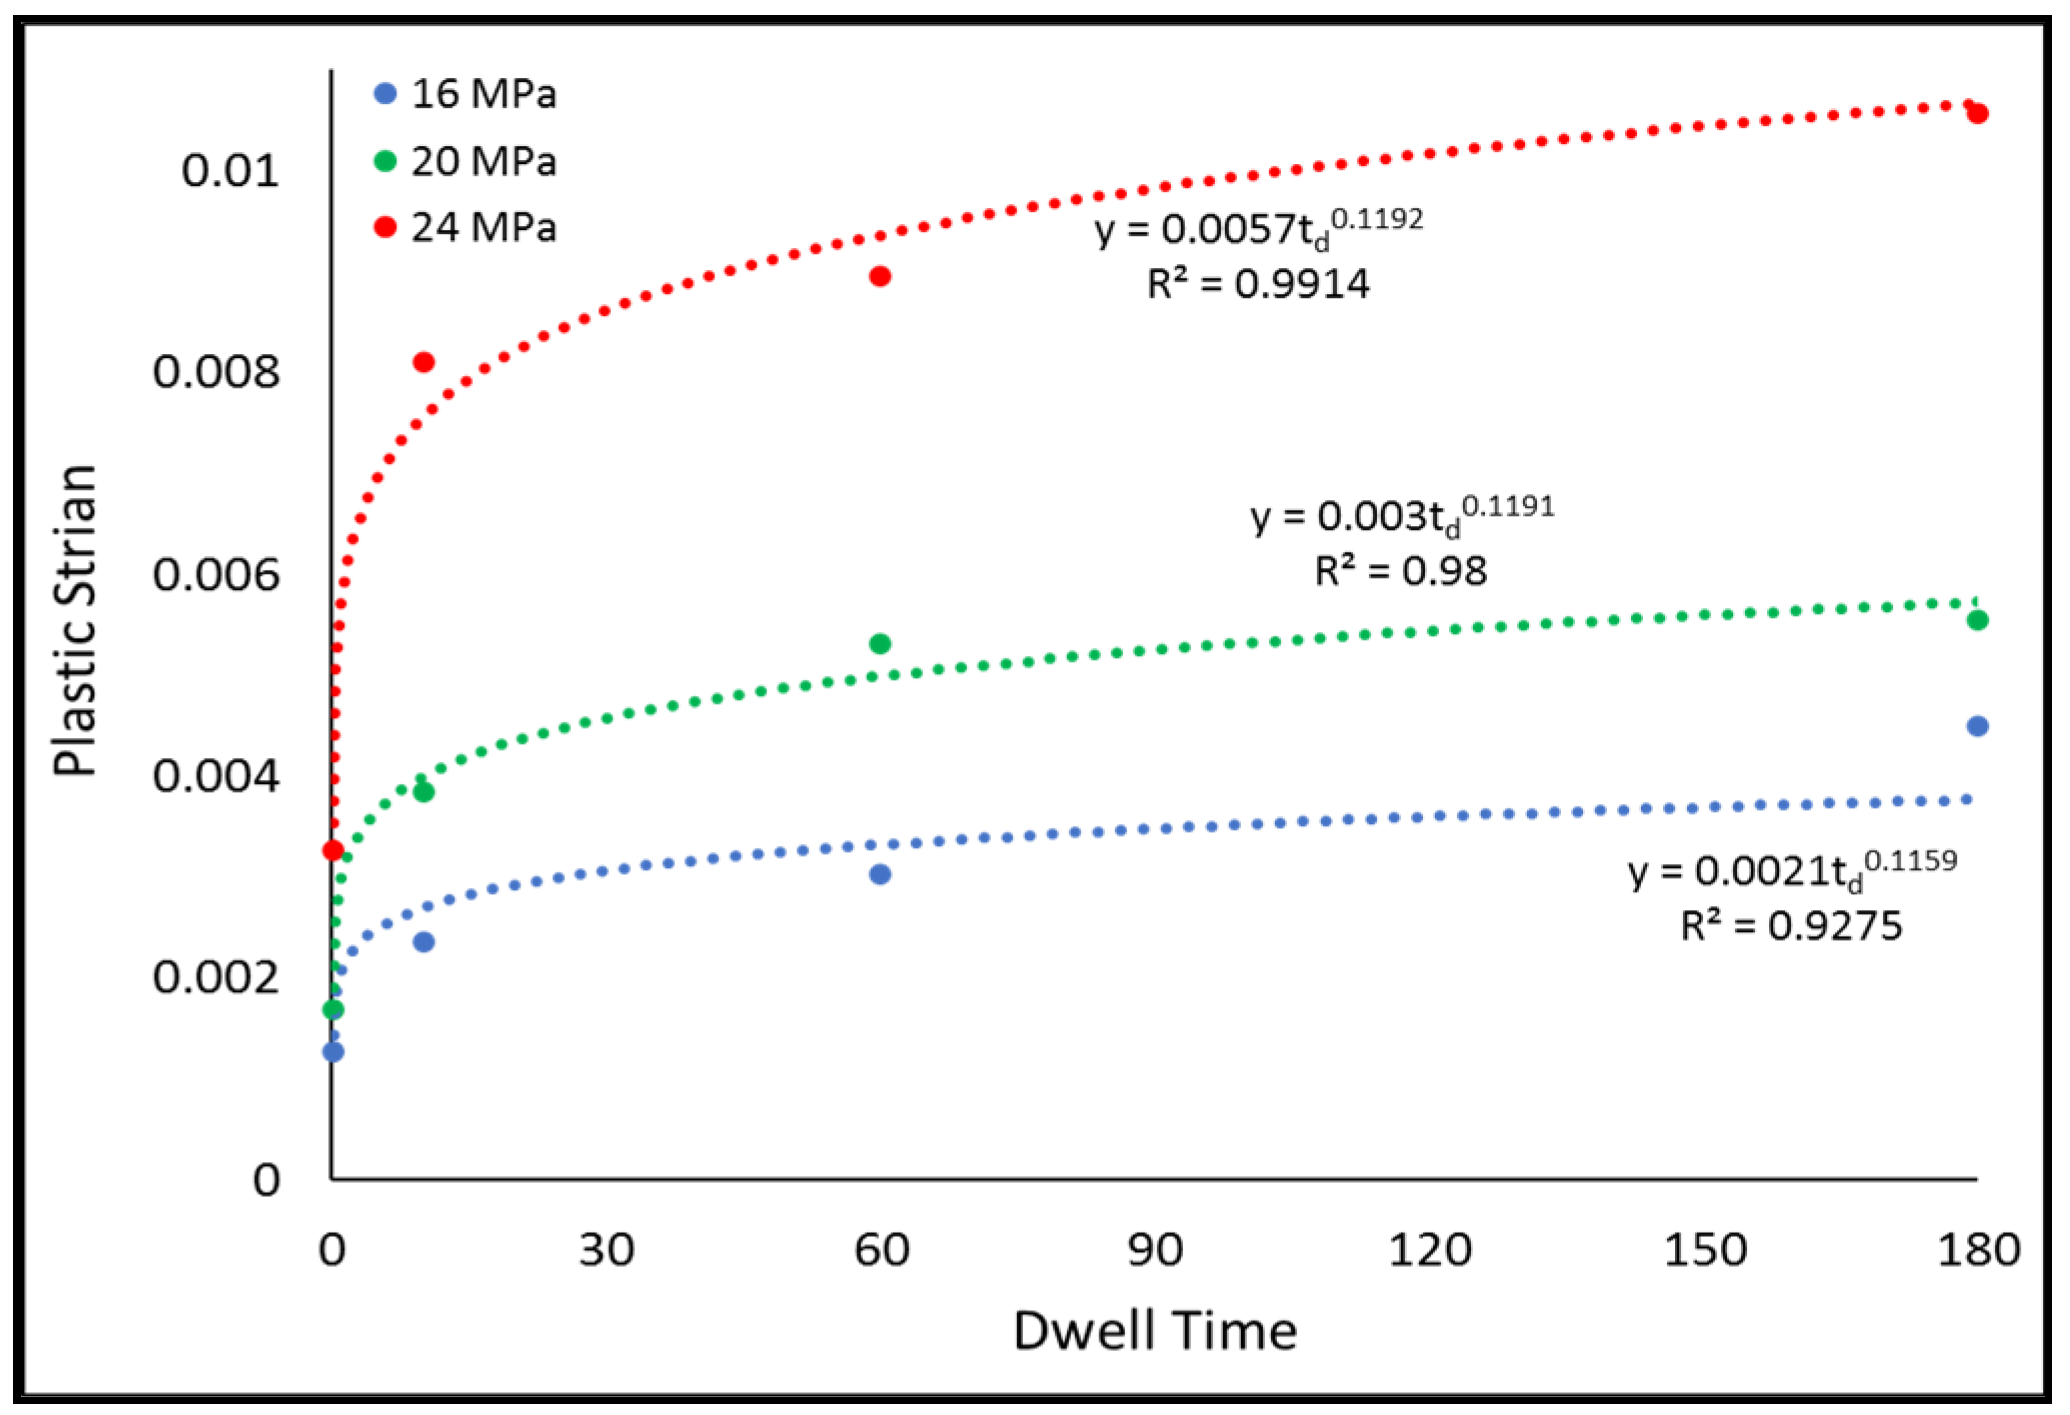
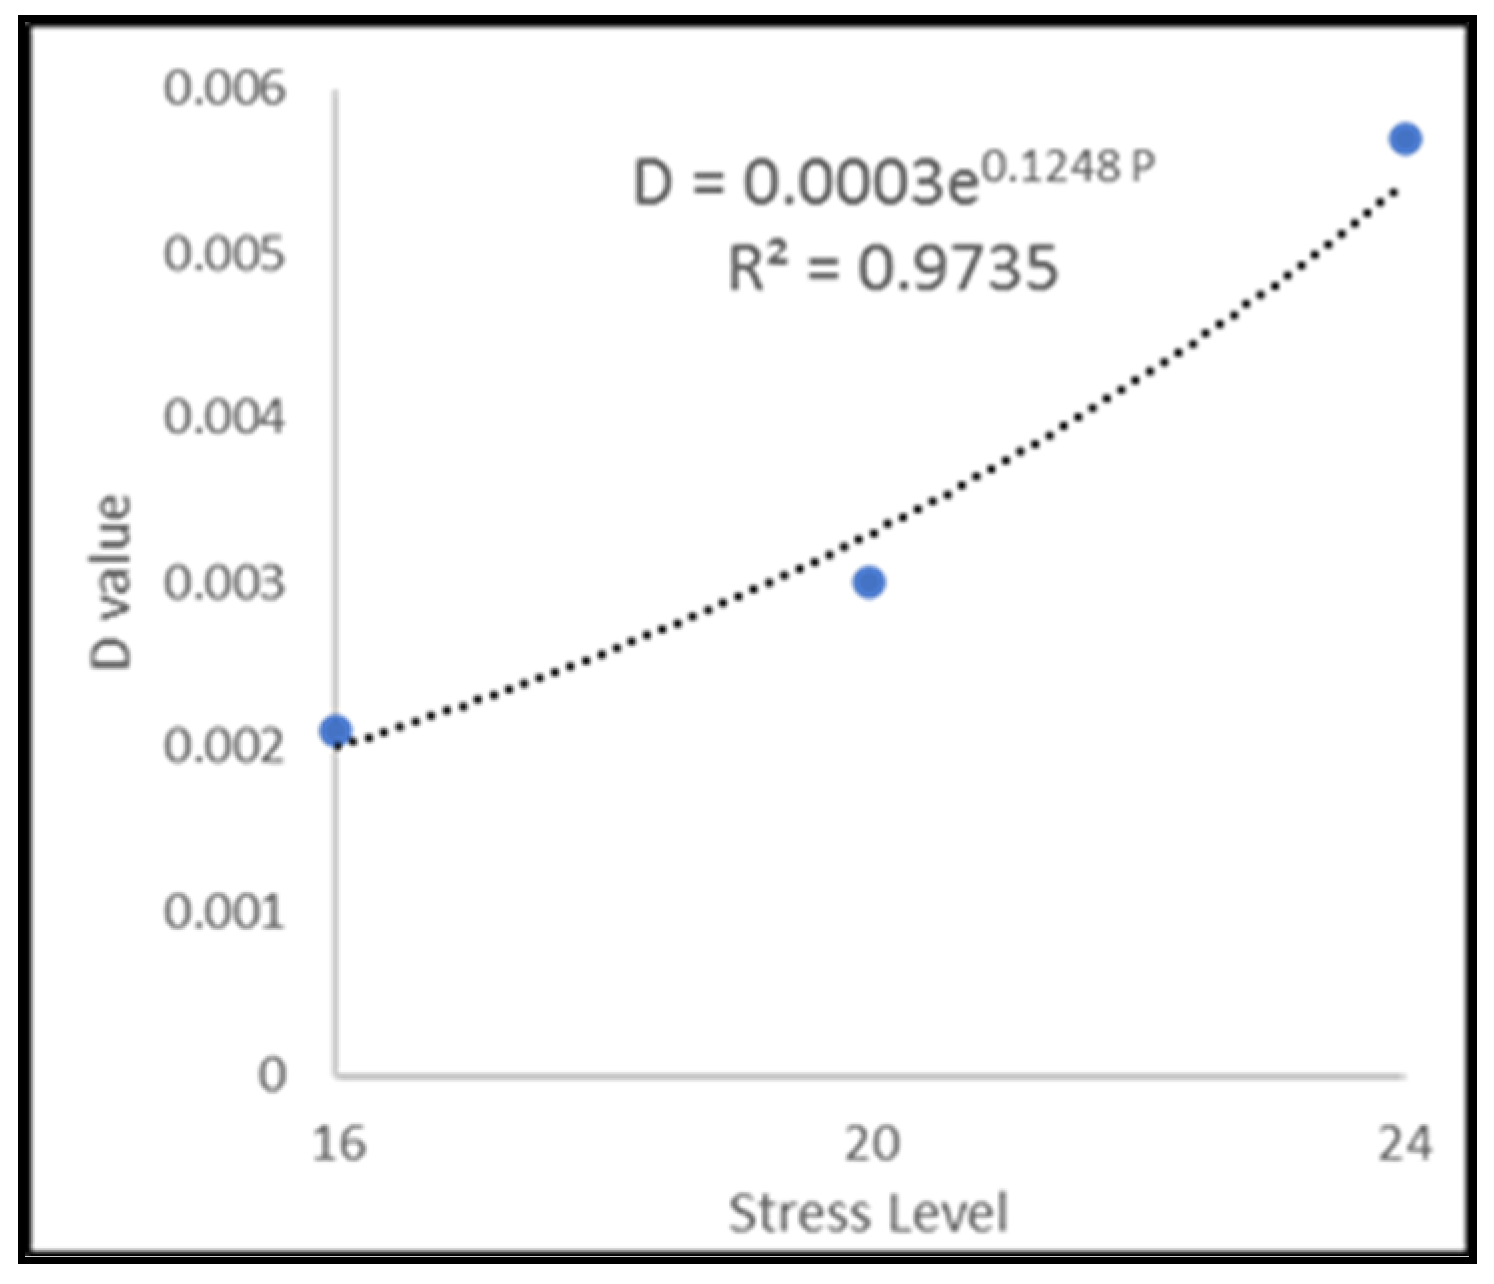
3.3. Creep Effect
3.4. The Coffin–Manson and Morrow Energy Models
Coffin–Manson Model
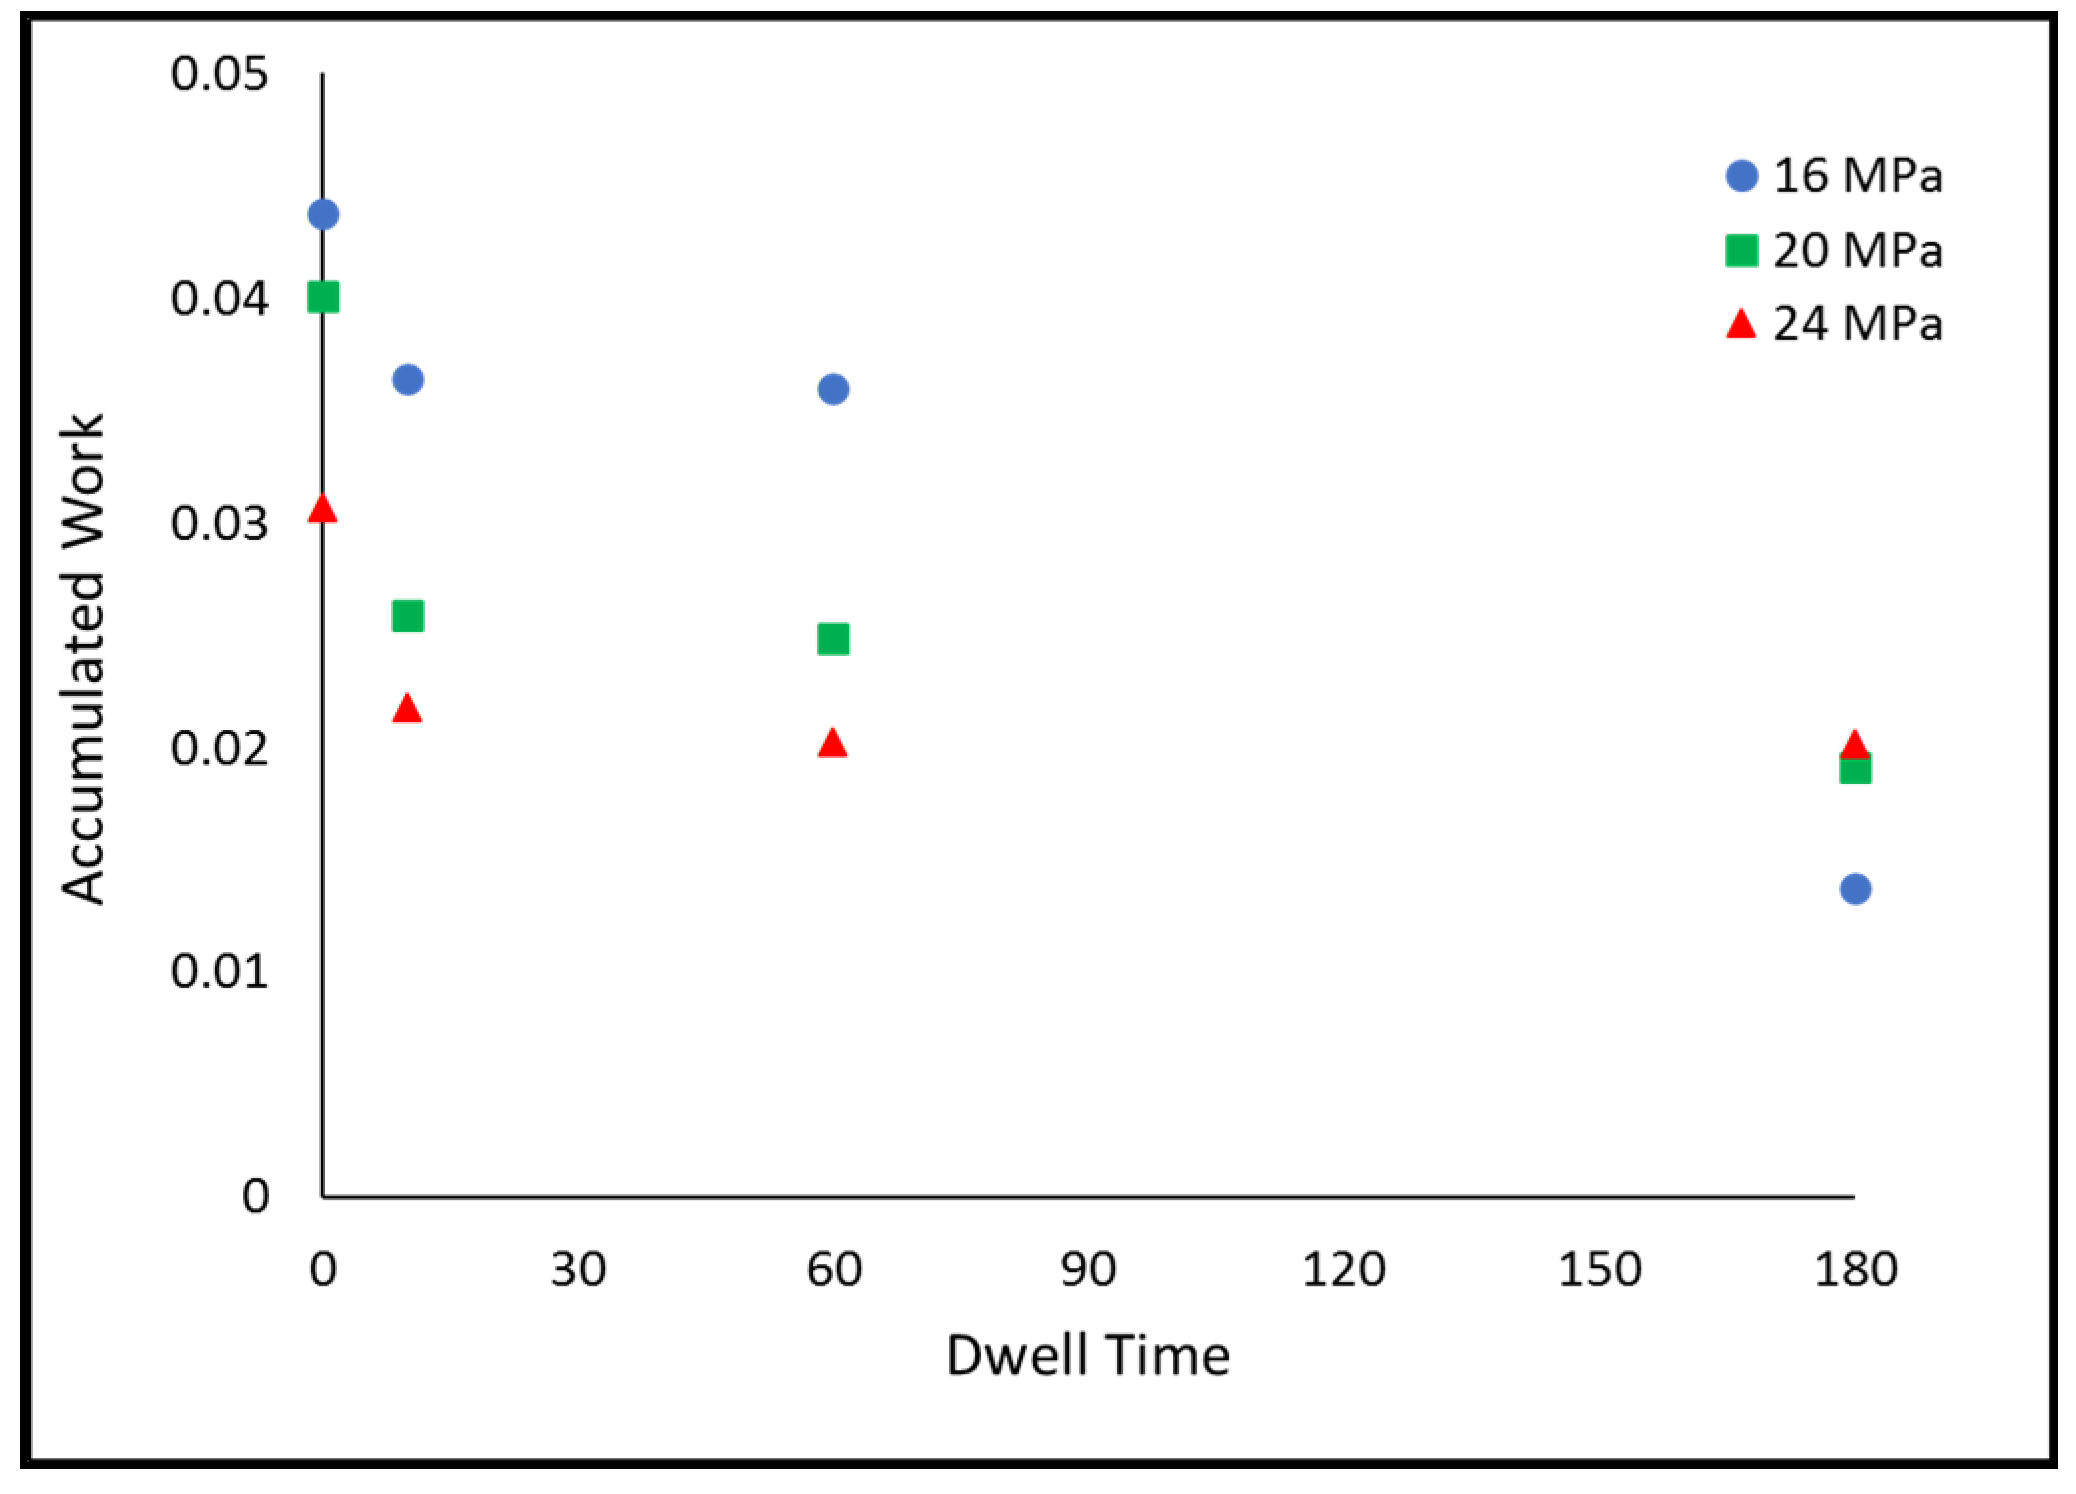
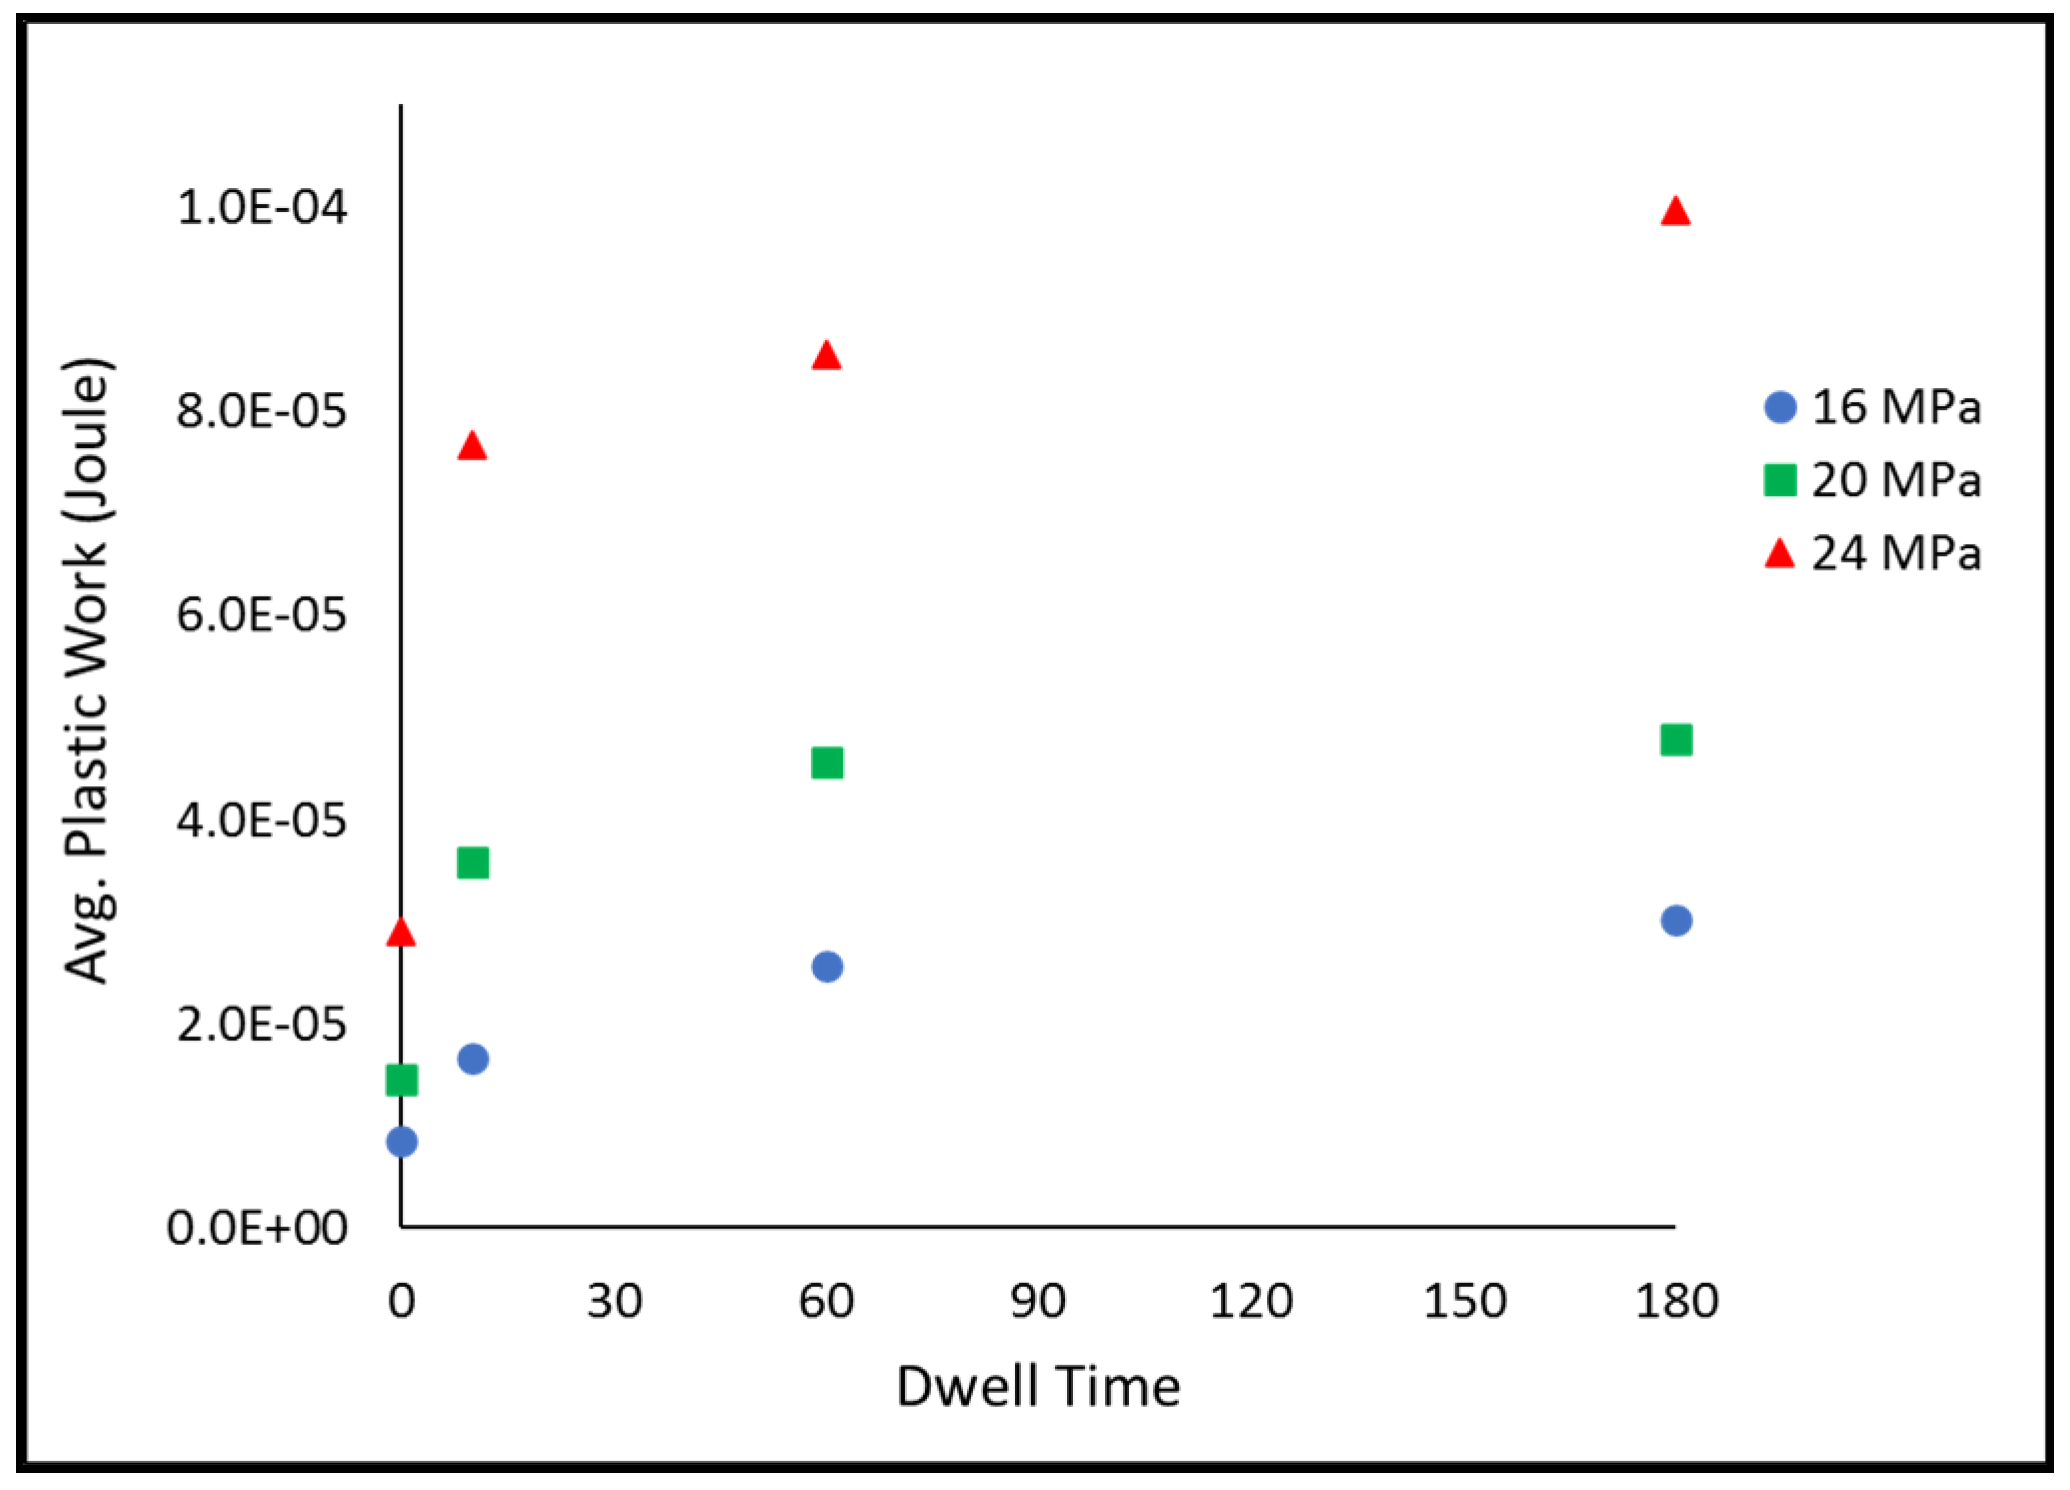
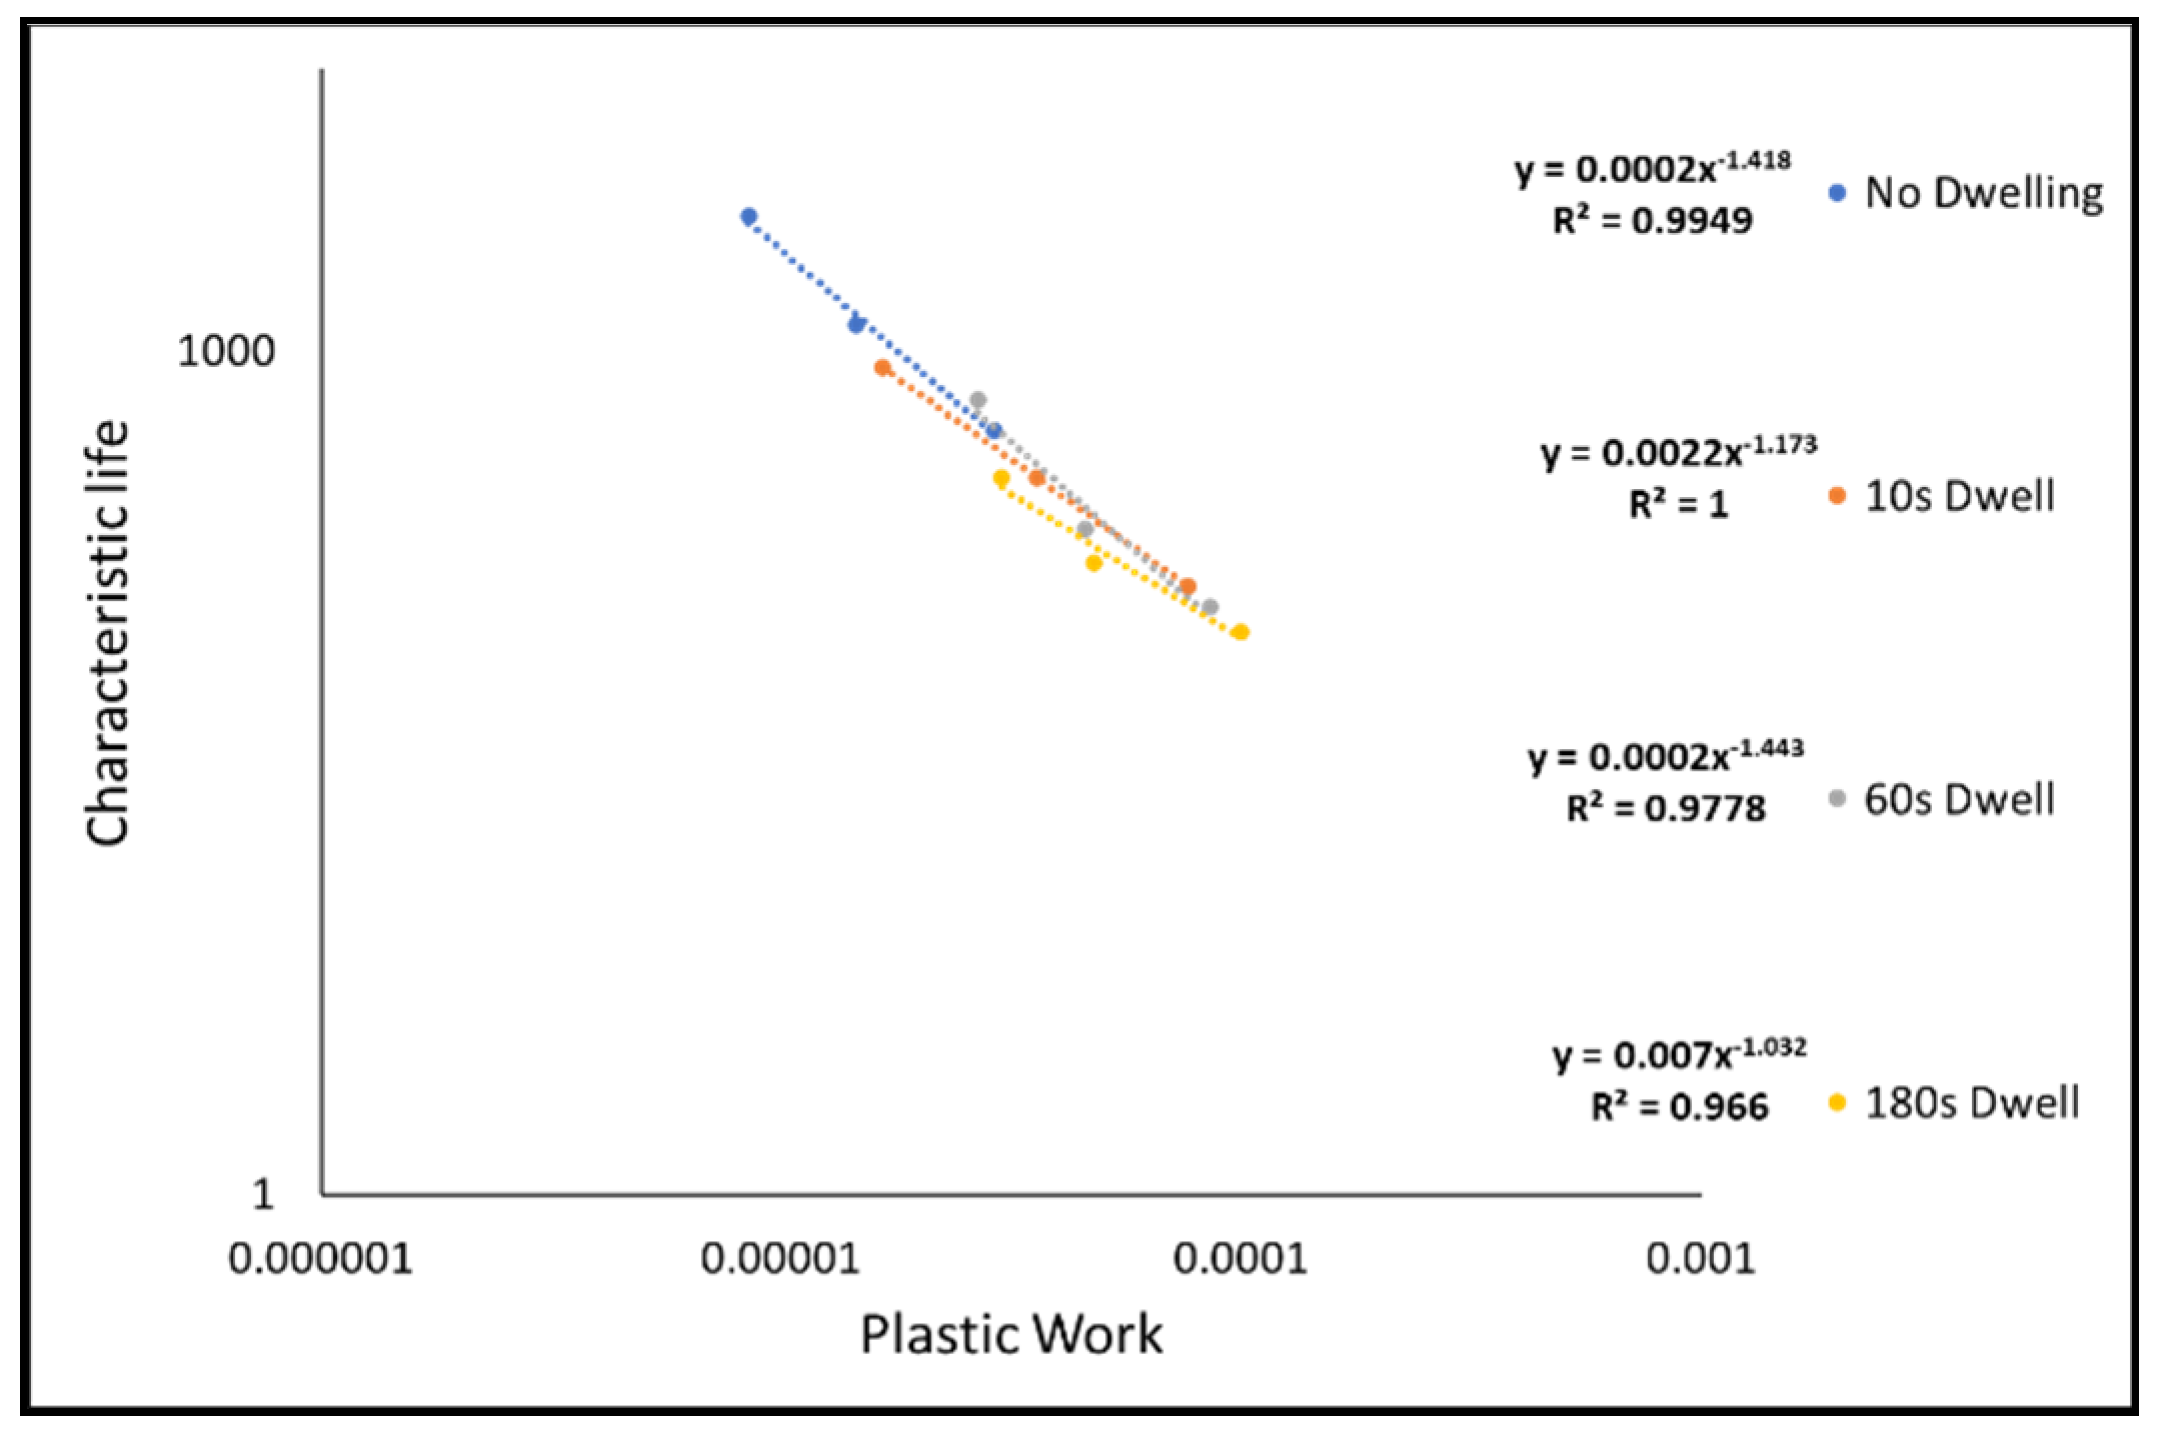
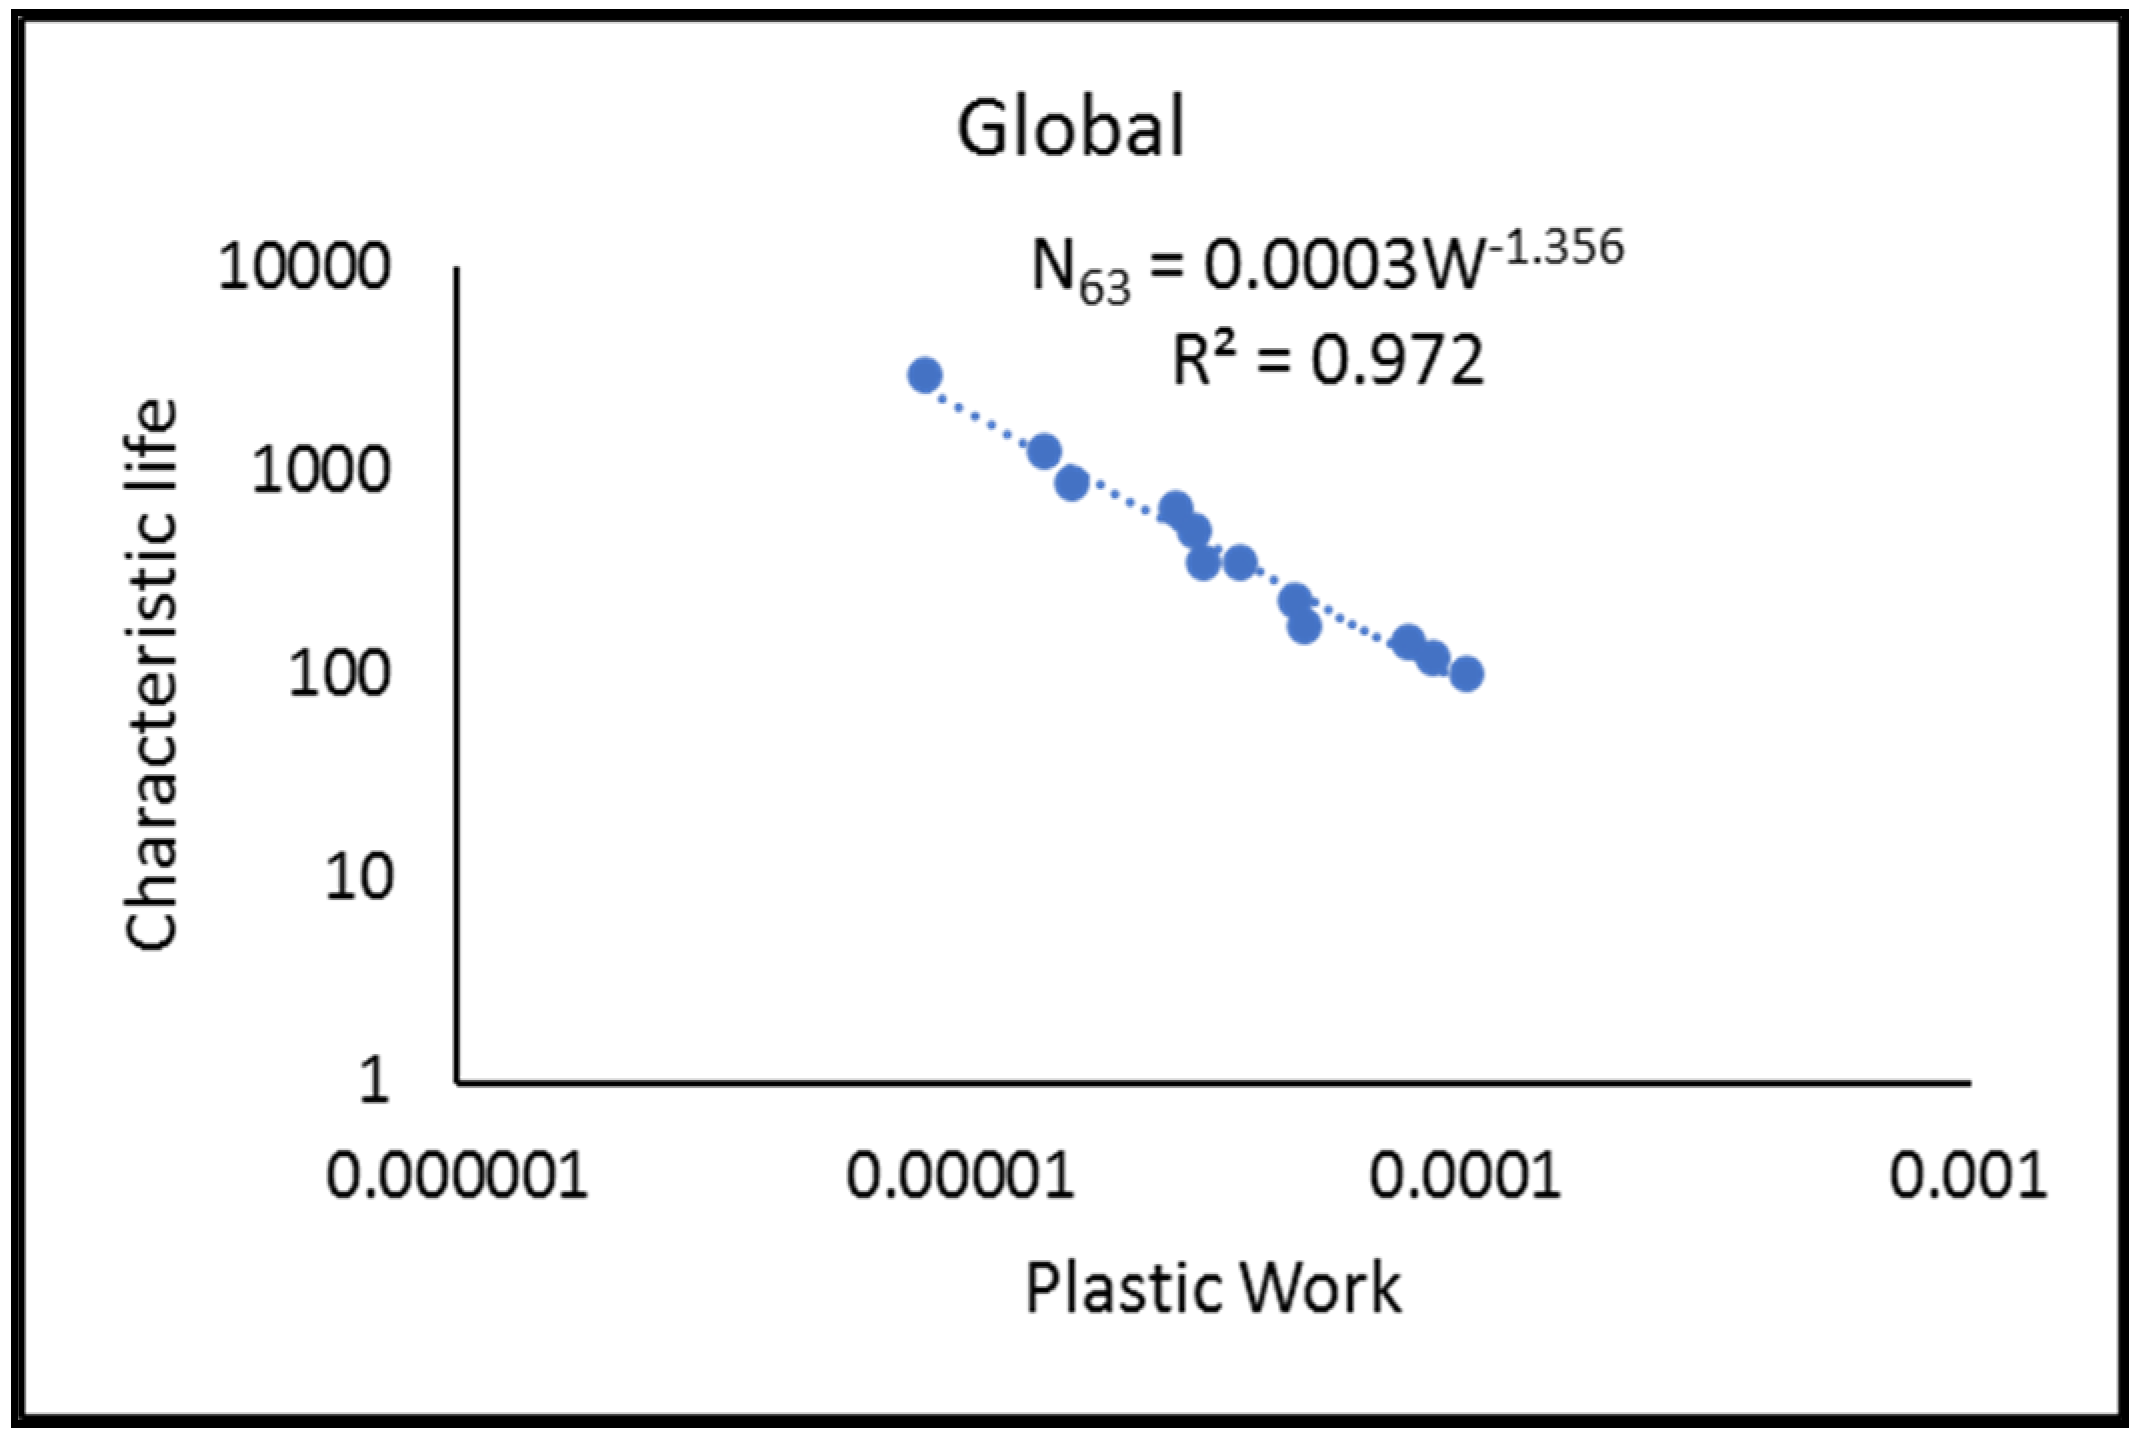
3.5. Morrow Energy Model
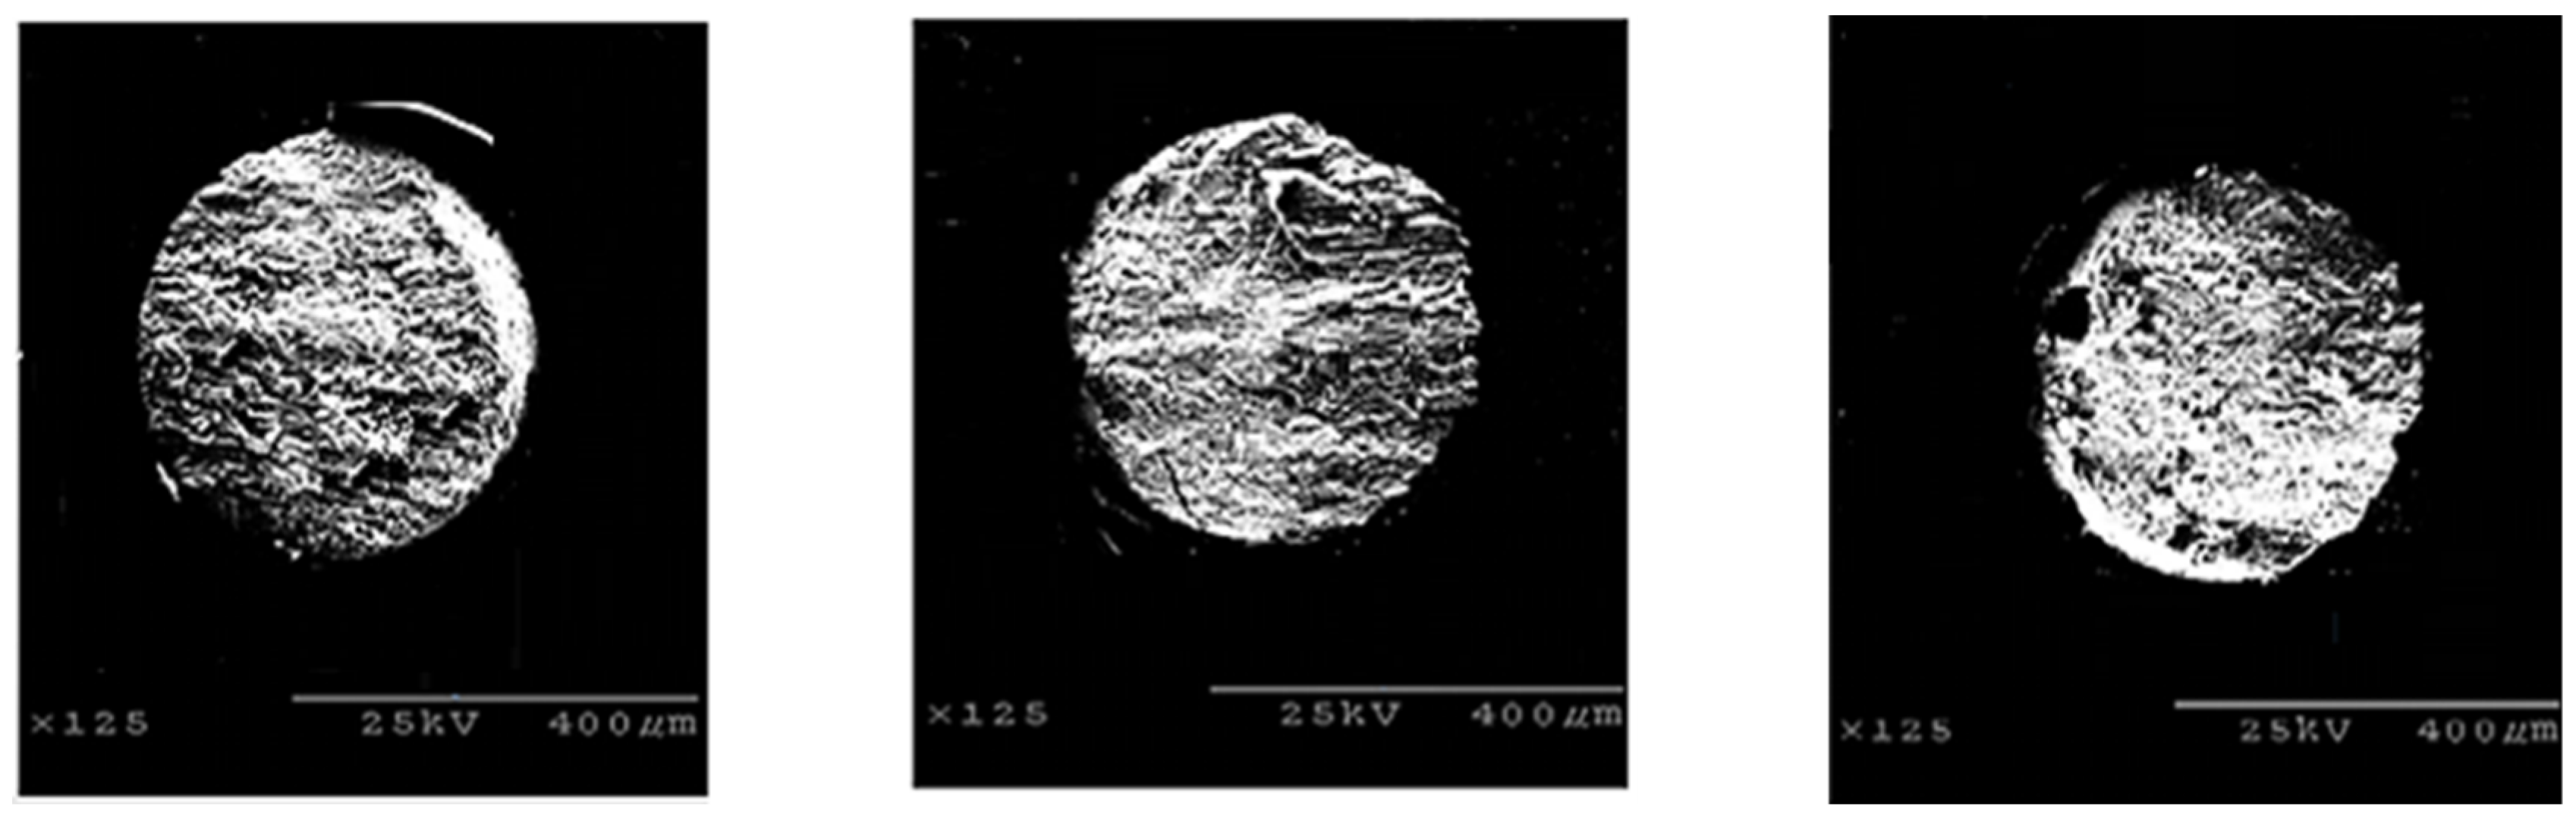
3.6. Microstructure Analysis
4. Conclusions
Author Contributions
Funding
Institutional Review Board Statement
Informed Consent Statement
Data Availability Statement
Conflicts of Interest
References
- Lau, J.H. Electronics packaging technology update: BGA, CSP, DCA and flip chip. Circuit World 1997, 23, 22–25. [Google Scholar] [CrossRef]
- Murty, G.S. Stress relaxation in superplastic materials. J. Mater. Sci. 1973, 8, 611–614. [Google Scholar] [CrossRef]
- Kim, Y.M.; Kim, Y.H. Drop impact reliability of Cu-Zn/Sn-Ag-Cu/Cu-Zn solder joints. In Proceedings of the 2008 International Conference on Electronic Materials and Packaging, Taipei, Taiwan, 22–24 October 2008; IEEE: Piscataway, NJ, USA, 2008; pp. 236–238. [Google Scholar] [CrossRef]
- Waidhas, B.; Proschwitz, J.; Pietryga, C.; Wagner, T.; Keser, B. Study of the board level reliability performance of a large 0.3 mm pitch wafer level package. In Proceedings of the 2019 IEEE 69th Electronic Components and Technology Conference (ECTC), Las Vegas, NV, USA, 28–31 May 2019; IEEE: Piscataway, NJ, USA, 2019; pp. 1159–1164. [Google Scholar] [CrossRef]
- Xu, L.; Pang, J.H. Effect of intermetallic and Kirkendall voids growth on board level drop reliability for SnAgCu lead-free BGA solder joint. In Proceedings of the 56th Electronic Components and Technology Conference, San Diego, CA, USA, 30 May–2 June 2006; IEEE: Piscataway, NJ, USA, 2006; p. 8. [Google Scholar] [CrossRef]
- Lee, J.H.; Kumar, S.; Kim, H.J.; Lee, Y.W.; Moon, J.T. High thermo-mechanical fatigue and drop impact resistant Ni-Bi doped lead free solder. In Proceedings of the 2014 IEEE 64th Electronic Components and Technology Conference (ECTC), Orlando, FL, USA, 27–30 May 2014; IEEE: Piscataway, NJ, USA, 2014; pp. 712–716. [Google Scholar] [CrossRef]
- Xu, L.; Pang, J.H. Effect of thermal and electromigration exposure on solder joint board level drop reliability. In Proceedings of the 2006 8th Electronics Packaging Technology Conference, Singapore, 6–8 December 2006; IEEE: Piscataway, NJ, USA, 2006; pp. 570–575. [Google Scholar] [CrossRef]
- Abueed, M.; Athamenh, R.; Hamasha, S.; Suhling, J.; Lall, P. Effect of Fatigue on Individual SAC305 Solder Joints Reliability at Elevated Temperature. In Proceedings of the 2020 19th IEEE Intersociety Conference on Thermal and Thermomechanical Phenomena in Electronic Systems (ITherm), Orlando, FL, USA, 21–23 July 2020; IEEE: Piscataway, NJ, USA, 2020; pp. 1043–1050. [Google Scholar] [CrossRef]
- Arfaei, B.; Cotts, E. Correlations between the microstructure and fatigue life of near-eutectic Sn-Ag-Cu Pb-free solders. J. Electron. Mater. 2009, 38, 2617–2627. [Google Scholar] [CrossRef]
- Bieler, T.R.; Jiang, H.; Lehman, L.P.; Kirkpatrick, T.; Cotts, E.J.; Nandagopal, B. Influence of Sn grain size and orientation on the thermomechanical response and reliability of Pb-free solder joints. IEEE Trans. Compon. Packag. Technol. 2008, 31, 370–381. [Google Scholar] [CrossRef]
- Arfaei, B.; Xing, Y.; Woods, J.; Wolcott, J.; Tumne, P.; Borgesen, P.; Cotts, E. The effect of Sn grain number and orientation on the shear fatigue life of SnAgCu solder joints. In Proceedings of the 2008 58th Electronic Components and Technology Conference, Lake Buena Vista, FL, USA, 27–30 May 2008; IEEE: Piscataway, NJ, USA, 2008; pp. 459–465. [Google Scholar] [CrossRef]
- Bieler, T.R.; Zhou, B.; Blair, L.; Zamiri, A.; Darbandi, P.; Pourboghrat, F.; Lee, T.-K.; Liu, K.-C. The role of elastic and plastic anisotropy of Sn in recrystallization and damage evolution during thermal cycling in SAC305 solder joints. J. Electron. Mater. 2012, 41, 283–301. [Google Scholar] [CrossRef]
- Lehman, L.P.; Xing, Y.; Bieler, T.R.; Cotts, E.J. Cyclic Twin Nucleation in Tin-Based Solder Alloys. Acta Mater. 2010, 58, 3546–3556. [Google Scholar] [CrossRef]
- Lee, T.K.; Zhou, B.; Bieler, T.R. Impact of isothermal aging and Sn grain orientation on the long-term reliability of wafer-level chip-scale package Sn–Ag–Cu solder interconnects. IEEE Trans. Compon. Packag. Manuf. Technol. 2012, 2, 496–501. [Google Scholar] [CrossRef]
- Telang, A.U.; Bieler, T.; Lucas, J.P.; Subramanian, K.N.; Lehman, L.; Xing, Y.; Cotts, E.J. Grain-boundary character and grain growth in bulk tin and bulk lead-free solder alloys. J. Electro. Mater. 2004, 33, 1412–1423. [Google Scholar] [CrossRef]
- Mondal, D.; Haq, M.A.; Suhling, J.C.; Lall, P. Effects of β-Sn Crystal Orientation on the Deformation Behavior of SAC305 Solder Joints. In Proceedings of the 2022 IEEE 72nd Electronic Components and Technology Conference (ECTC), San Diego, CA, USA, 31 May–3 June 2022; IEEE: Piscataway, NJ, USA, 2022; pp. 1658–1667. [Google Scholar] [CrossRef]
- Fu, X.; Zhou, B.; Yao, R.; En, Y.; Chen, S. Effect of grain orientation and microstructure evolution on electromigration in flip-chip solder joint. In Proceedings of the 2019 IEEE 69th Electronic Components and Technology Conference (ECTC), Las Vegas, NV, USA, 28–31 May 2019; IEEE: Piscataway, NJ, USA, 2019; pp. 1324–1327. [Google Scholar] [CrossRef]
- Etris, S.; Lieb, K.; Sisca, V.; Moore, I.; Batik, A.; Rathore, H.; Yih, R.; Edenfeld, A. Fatigue behavior of solders used in flip-chip technology. J. Test. Eval. 1973, 1, 170–178. [Google Scholar] [CrossRef]
- Hamasha, S.; Jaradat, Y.; Qasaimeh, A.; Obaidat, M.; Borgesen, P. Assessment of solder joint fatigue life under realistic service conditions. J. Electron. Mater. 2014, 43, 4472–4484. [Google Scholar] [CrossRef]
- Hamasha, S.; Akkara, F.; Su, S.; Ali, H.; Borgesen, P. Effect of cycling amplitude variations on SnAgCu solder joint fatigue life. IEEE Trans. Compon. Packag. Manuf. Technol. 2018, 8, 1896–1904. [Google Scholar] [CrossRef]
- Chowdhury, M.; Hoque, M.A.; Fu, N.; Suhling, J.C.; Hamasha, S.; Lall, P. Characterization of material damage and microstructural evolution occurring in lead free solders subjected to cyclic loading. In Proceedings of the 2018 IEEE 68th Electronic Components and Technology Conference (ECTC), San Diego, CA, USA, 29 May–1 June 2018; IEEE: Piscataway, NJ, USA, 2018; pp. 865–874. [Google Scholar] [CrossRef]
- Su, S.; Jian, M.; Wei, X.; Akkara, F.J.; Hamasha, S.; Suhling, J.; Lall, P. Effect of Surface Finish on the Fatigue Behavior of Bi-based Solder Joints. In Proceedings of the 2019 18th IEEE Intersociety Conference on Thermal and Thermomechanical Phenomena in Electronic Systems (ITherm), Las Vegas, NV, USA, 28–31 May 2019; IEEE: Piscataway, NJ, USA, 2019; pp. 1155–1159. [Google Scholar] [CrossRef]
- Kim, K.S.; Huh, S.H.; Suganuma, K. Effects of intermetallic compounds on properties of Sn–Ag–Cu lead-free soldered joints. J. Alloy. Compd. 2003, 352, 226–236. [Google Scholar] [CrossRef]
- Yoon, J.W.; Kim, S.W.; Jung, S.B. IMC morphology, interfacial reaction and joint reliability of Pb-free Sn–Ag–Cu solder on electrolytic Ni BGA substrate. J. Alloy. Compd. 2005, 392, 247–252. [Google Scholar] [CrossRef]
- Yu, D.Q.; Wang, L. The growth and roughness evolution of intermetallic compounds of Sn–Ag–Cu/Cu interface during soldering reaction. J. Alloy. Compd. 2008, 458, 542–547. [Google Scholar] [CrossRef]
- Hamasha, S.D.; Borgesen, P. Effects of strain rate and amplitude variations on solder joint fatigue life in isothermal cycling. J. Electron. Packag. 2016, 138, 021002. [Google Scholar] [CrossRef]
- Su, S.; Akkara, F.J.; Abueed, M.; Jian, M.; Hamasha, S.; Suhling, J.; Lall, P. Fatigue properties of lead-free doped solder joints. In Proceedings of the 2018 17th IEEE Intersociety Conference on Thermal and Thermomechanical Phenomena in Electronic Systems (ITherm), San Diego, CA, USA, 29 May–1 June 2018; IEEE: Piscataway, NJ, USA, 2018; pp. 1243–1248. [Google Scholar] [CrossRef]
- Xu, H.; Lee, T.K.; Kim, C.U. Fatigue properties of lead-free solder joints in electronic packaging assembly investigated by isothermal cyclic shear fatigue. In Proceedings of the 2014 IEEE 64th Electronic Components and Technology Conference (ECTC), Orlando, FL, USA, 27–30 May 2014; IEEE: Piscataway, NJ, USA, 2014; pp. 133–138. [Google Scholar] [CrossRef]
- Akkara, F.J.; Zhao, C.; Ahmed, S.; Abueed, M.; Su, S.; Hamasha, S.D.; Suhling, J.; Lall, P. Thermal cycling reliability of newly developed lead-free solders for harsh environments. In Proceedings of the SMTA International, Rosemont, IL, USA, 22–26 September 2019. [Google Scholar]
- Hamasha, S.; Akkara, F.; Abueed, M.; Rababah, M.; Zhao, C.; Su, S.; Suhling, J.; Evans, J. Effect of Surface Finish and High Bi Solder Alloy on Component Reliability in Thermal Cycling. In Proceedings of the 2018 IEEE 68th Electronic Components and Technology Conference (ECTC), San Diego, CA, USA, 29 May–1 June 2018; pp. 2032–2040. [Google Scholar] [CrossRef]
- Coyle, R.; Parker, R.; Longgood, S.; Sweatman, K.; Howell, K.; Arfaei, B. iNEMI Pb-Free Alloy Characterization Project Report: Part VI-The Effect of Component Surface Finishes and Solder Paste Composition on Thermal Fatigue of SN100C Solder Balls. In Proceedings of the SMTA International Conference, Fort Worth, TX, USA, 13–17 October 2013. [Google Scholar]
- Al Athamneh, R.; Abueed, M.; Hani, D.B.; Hamasha, S.D. Effect of aging on SAC 305 solder joints reliability in accelerated fatigue shear test. In Proceedings of the SMTA International Conference, Rosemont, IL, USA, 14–18 October 2018. [Google Scholar]
- Al Athamneh, R.; Abueed, M.; Hani, D.B.; Su, S.; Hamasha, S.; Suhling, J.; Lall, P. Effect of aging on the fatigue life and shear strength of SAC305 solder joints in actual setting conditions. In Proceedings of the 2019 18th IEEE Intersociety Conference on Thermal and Thermomechanical Phenomena in Electronic Systems (ITherm), Las Vegas, NV, USA, 28–31 May 2019; IEEE: Piscataway, NJ, USA, 2019; pp. 1146–1154. [Google Scholar] [CrossRef]
- Yang, C.; Chan, Y.S.; Lee, S.R.; Ye, Y.; Liu, S. Comparison of thermal fatigue reliability of SnPb and SAC solders under various stress range conditions. In Proceedings of the 2009 International Conference on Electronic Packaging Technology & High Density Packaging, Beijing, China, 10–13 August 2009; IEEE: Piscataway, NJ, USA, 2009; pp. 1119–1123. [Google Scholar] [CrossRef]
- Osterman, M.; Dasgupta, A.; Han, B. A strain range based model for life assessment of Pb-free SAC solder interconnects. In Proceedings of the 56th Electronic Components and Technology Conference, San Diego, CA, USA, 30 May–2 June 2006; IEEE: Piscataway, NJ, USA, 2006; p. 7. [Google Scholar] [CrossRef]
- Dudek, R.; Kaulfersch, E.; Rzepka, S.; Rollig, M.; Michel, B. FEA based reliability prediction for different Sn-based solders subjected to fast shear and fatigue loadings. In Proceedings of the 2008 International Conference on Electronic Packaging Technology & High Density Packaging, Shanghai, China, 28–31 July 2008; IEEE: Piscataway, NJ, USA, 2008; pp. 1–7. [Google Scholar] [CrossRef]
- Hasan, S.M.K.; Fahim, A.; Suhling, J.C.; Hamasha, S.; Lall, P. Evolution of the Mechanical Behavior of Lead Free Solders Exposed to Thermal Cycling. In Proceedings of the 2019 18th IEEE Intersociety Conference on Thermal and Thermomechanical Phenomena in Electronic Systems (ITherm), Las Vegas, NV, USA, 28–31 May 2019; IEEE: Piscataway, NJ, USA, 2019; pp. 1332–1341. [Google Scholar] [CrossRef]
- Fahim, A.; Hasan, K.; Ahmed, S.; Suhling, J.C.; Lall, P. Mechanical Behavior Evolution of SAC305 Lead Free Solder Joints under Thermal Cycling. In Proceedings of the 2019 18th IEEE Intersociety Conference on Thermal and Thermomechanical Phenomena in Electronic Systems (ITherm), Las Vegas, NV, USA, 28–31 May 2019; IEEE: Piscataway, NJ, USA, 2019; pp. 734–744. [Google Scholar] [CrossRef]
- Zhao, X.; Watte, P.; de Vries, H.; van Hees, G. Challenges in Predicting the Solder Interconnect Lifetime of High Power Electronics. In Proceedings of the 2018 19th International Conference on Electronic Packaging Technology (ICEPT), Shanghai, China, 8–11 August 2018; IEEE: Piscataway, NJ, USA, 2018; pp. 1511–1517. [Google Scholar] [CrossRef]
- Kumar, P.M.; Gergely, G.; Horváth, D.K.; Gácsi, Z. Investigating the microstructural and mechanical properties of pure lead-free soldering materials (SAC305 & SAC405). Powder Metall. Prog. 2018, 18, 49–57. [Google Scholar] [CrossRef]
- Fahim, A.; Hasan, S.K.; Suhling, J.C.; Lall, P. Nanoindentation Testing of SAC305 Solder Joints Subjected to Thermal Cycling Loading. In Proceedings of the International Electronic Packaging Technical Conference and Exhibition, Anaheim, CA, USA, 7–9 October 2019; American Society of Mechanical Engineers: New York, NY, USA, 2019; Volume 59322, p. V001T08A005. [Google Scholar] [CrossRef]
- Pang, J.H.; Low, T.H.; Xiong, B.S.; Luhua, X.; Neo, C.C. Thermal cycling aging effects on Sn–Ag–Cu solder joint microstructure, IMC and strength. Thin Solid Films 2004, 462, 370–375. [Google Scholar] [CrossRef]
- Fahim, A.; Ahmed, S.; Suhling, J.C.; Lall, P. Mechanical characterization of intermetallic compounds in SAC solder joints at elevated temperatures. In Proceedings of the 2018 17th IEEE Intersociety Conference on Thermal and Thermomechanical Phenomena in Electronic Systems (ITherm), San Diego, CA, USA, 29 May–1 June 2018; IEEE: Piscataway, NJ, USA, 2018; pp. 1081–1090. [Google Scholar] [CrossRef]
- Yin, L.; Meilunas, M.; Arfaei, B.; Wentlent, L.; Borgesen, P. Effect of microstructure evolution on Pb-free solder joint reliability in thermomechanical fatigue. In Proceedings of the 2012 IEEE 62nd Electronic Components and Technology Conference, San Diego, CA, USA, 29 May–1 June 2012; IEEE: Piscataway, NJ, USA, 2012; pp. 493–499. [Google Scholar] [CrossRef]
- Fahim, A.; Ahmed, S.; Chowdhury, M.R.; Suhling, J.C.; Lall, P. High temperature creep response of lead free solders. In Proceedings of the 2016 15th IEEE Intersociety Conference on Thermal and Thermomechanical Phenomena in Electronic Systems (ITherm), Las Vegas, NV, USA, 31 May–3 June 2016; IEEE: Piscataway, NJ, USA, 2016; pp. 1218–1224. [Google Scholar] [CrossRef]
- Teo, J.R. Thermal cycling aging effect on the reliability and morphological evolution of SnAgCu solder joints. IEEE Trans. Electron. Packag. Manuf. 2007, 30, 279–284. [Google Scholar] [CrossRef]
- Zhang, J.; Hai, Z.; Thirugnanasambandam, S.; Evans, J.L.; Bozack, M.J.; Zhang, Y.; Suhling, J.C. Thermal aging effects on the thermal cycling reliability of lead-free fine pitch packages. IEEE Trans. Compon. Packag. Manuf. Technol. 2013, 3, 1348–1357. [Google Scholar] [CrossRef]
- Basit, M.M.; Motalab, M.; Suhling, J.C.; Hai, Z.; Evans, J.; Bozack, M.J.; Lall, P. Thermal cycling reliability of aged PBGA assemblies-comparison of Weibull failure data and finite element model predictions. In Proceedings of the 2015 IEEE 65th electronic components and technology conference (ECTC), San Diego, CA, USA, 26–29 May 2015; IEEE: Piscataway, NJ, USA, 2015; pp. 106–117. [Google Scholar] [CrossRef]
- Akkara, F.J.; Zhao, C.; Athamenh, R.; Su, S.; Abueed, M.; Hamasha, S.; Suhling, J.; Lall, P. Effect of solder sphere alloys and surface finishes on the reliability of lead-free solder joints in accelerated thermal cycling. In Proceedings of the 2018 17th IEEE Intersociety Conference on Thermal and Thermomechanical Phenomena in Electronic Systems (ITherm), San Diego, CA, USA, 29 May–1 June 2018; IEEE: Piscataway, NJ, USA, 2018; pp. 1374–1380. [Google Scholar] [CrossRef]
- Yang, L.; Fenglian, S.; Hongwu, Z.; Yang, W. Influence of Ag, Cu and additive Bi elements on the thermal property of low-Ag SAC solder alloys. In Proceedings of the 2011 6th International Forum on Strategic Technology, Harbin, China, 22–24 August 2011; Volume 1, pp. 72–75. [Google Scholar] [CrossRef]
- Akkara, F.J.; Zhao, C.; Gordon, S.; Su, S.; Abueed, M.; Hamasha, S.; Suhling, J.; Lall, P. Effect of Aging on Component Reliability in Harsh Thermal Cycling. In Proceedings of the 2019 18th IEEE Intersociety Conference on Thermal and Thermomechanical Phenomena in Electronic Systems (ITherm), Las Vegas, NV, USA, 28–31 May 2019; IEEE: Piscataway, NJ, USA, 2019; pp. 717–723. [Google Scholar] [CrossRef]
- Akkara, F.J.; Zhao, C.; Su, S.; Hamasha, S.; Suhling, J. Effects of mixing solder sphere alloys with bismuth-based pastes on the component reliability in harsh thermal cycling. In Proceedings of the SMTA International, Rosemont, IL, USA, 14–18 October 2018. [Google Scholar]
- Chen, H.; Wang, L.; Han, J.; Li, M.; Liu, H. Microstructure, orientation and damage evolution in SnPb, SnAgCu, and mixed solder interconnects under thermomechanical stress. Microelectron. Eng. 2012, 96, 82–91. [Google Scholar] [CrossRef]
- Fu, N.; Suhling, J.C.; Hamasha, S.; Lall, P. Evolution of the cyclic stress-strain and constitutive behaviors of SAC305 lead free solder during fatigue testing. In Proceedings of the 2017 16th IEEE Intersociety Conference on Thermal and Thermomechanical Phenomena in Electronic Systems (ITherm), Orlando, FL, USA, 30 May–2 June 2017; IEEE: Piscataway, NJ, USA, 2017; pp. 1353–1360. [Google Scholar] [CrossRef]
- Erinc, M.; Schreurs, P.J.G.; Geers, M.G.D. Intergranular thermal fatigue damage evolution in SnAgCu lead-free solder. Mech. Mater. 2008, 40, 780–791. [Google Scholar] [CrossRef]
- Norris, K.C.; Landzberg, A.H. Reliability of controlled collapse interconnections. IBM J. Res. Dev. 1969, 13, 266–271. [Google Scholar] [CrossRef]
- Engelmaier, W. Fatigue life of leadless chip carrier solder joints during power cycling. IEEE Trans. Compon. Hybrids Manuf. Technol. 1983, 6, 232–237. [Google Scholar] [CrossRef]
- Vayman, S.; Fine, M.E.; Jeannotte, D.A. Isothermal fatigue of low tin lead based solder. Metall. Trans. A 1988, 19, 1051–1059. [Google Scholar] [CrossRef]
- Salmela, O. Acceleration factors for lead-free solder materials. IEEE Trans. Compon. Packag. Technol. 2007, 30, 700–707. [Google Scholar] [CrossRef]
- Solomon, H. Fatigue of 60/40 solder. IEEE Trans. Compon. Hybrids Manuf. Technol. 1986, 9, 423–432. [Google Scholar] [CrossRef]
- Pan, N.; Henshall, G.A.; Billaut, F.; Dai, S.; Strum, M.J.; Benedetto, E.; Rayner, J. An acceleration model for Sn-Ag-Cu solder joint reliability under various thermal cycle conditions. In Proceedings of the SMTAI, Chicago, IL, USA, 25 September 2005; pp. 876–883. [Google Scholar]
- Al Athamneh, R.; Hamasha, S. Fatigue behavior of SAC-Bi and SAC305 solder joints with aging. IEEE Trans. Compon. Packag. Manuf. Technol. 2019, 10, 611–620. [Google Scholar] [CrossRef]
- Motalab, M.; Cai, Z.; Suhling, J.C.; Zhang, J.; Evans, J.L.; Bozack, M.J.; Lall, P. Improved predictions of lead free solder joint reliability that include aging effects. In Proceedings of the 2012 IEEE 62nd Electronic Components and Technology Conference, San Diego, CA, USA, 29 May–1 June 2012; IEEE: Piscataway, NJ, USA, 2012; pp. 513–531. [Google Scholar] [CrossRef]
- Al Athamneh, R.; Hani, D.B.; Ali, H.; Hamasha, S. Fatigue life degradation modeling of SnAgCu solder joints after aging. IEEE Trans. Compon. Packag. Manuf. Technol. 2020, 10, 1175–1184. [Google Scholar] [CrossRef]
- Abueed, M.; Alathamneh, R.; Suhling, J.; Lall, P. Effect of Creep And Fatigue on Individual SAC305 Solder Joint Reliability in Iso-Thermal Cycling. In Proceedings of the SMTA International, Rosemont, IL, USA, 22–26 September 2019; pp. 308–314. [Google Scholar]
- Won, Y.; Cho, J.; Agonafer, D.; Asheghi, M.; Goodson, K.E. Fundamental cooling limits for high power density gallium nitride electronics. IEEE Trans. Compon. Packag. Manuf. Technol. 2015, 5, 737–744. [Google Scholar] [CrossRef]


| Load Amplitude (Mpa) | Fatigue Only Test | Creep–Fatigue Test | ||
|---|---|---|---|---|
| 0 s Dwell | 10 s Dwell | 60 s Dwell | 180 s Dwell | |
| 16 MPa | 7 samples | 7 samples | 7 samples | 7 samples |
| 20 MPa | 7 samples | 7 samples | 7 samples | 7 samples |
| 24 MPa | 7 samples | 7 samples | 7 samples | 7 samples |
| Dwelling Time | Fatigue Ductility (Z) | The Fatigue Exponent (R) |
|---|---|---|
| 0 | 0.108 | 0.565 |
| 10 | 0.255 | 0.7 |
| 60 | 0.185 | 0.636 |
| 180 | 0.313 | 0.745 |
| Global | 0.19 | 0.646 |
| Dwelling Time | Fatigue Ductility (G) | The Fatigue Exponent (m) |
|---|---|---|
| 0 | 0.0023 | 0.713 |
| 10 | 0.0055 | 0.85 |
| 60 | 0.0028 | 0.69 |
| 180 | 0.0085 | 0.96 |
| Global | 0.0025 | 0.737 |
Publisher’s Note: MDPI stays neutral with regard to jurisdictional claims in published maps and institutional affiliations. |
© 2022 by the authors. Licensee MDPI, Basel, Switzerland. This article is an open access article distributed under the terms and conditions of the Creative Commons Attribution (CC BY) license (https://creativecommons.org/licenses/by/4.0/).
Share and Cite
Abueed, M.; Al Athamneh, R.; Tanash, M.; Hamasha, S. The Reliability of SAC305 Individual Solder Joints during Creep–Fatigue Conditions at Room Temperature. Crystals 2022, 12, 1306. https://doi.org/10.3390/cryst12091306
Abueed M, Al Athamneh R, Tanash M, Hamasha S. The Reliability of SAC305 Individual Solder Joints during Creep–Fatigue Conditions at Room Temperature. Crystals. 2022; 12(9):1306. https://doi.org/10.3390/cryst12091306
Chicago/Turabian StyleAbueed, Mohammed, Raed Al Athamneh, Moayad Tanash, and Sa’d Hamasha. 2022. "The Reliability of SAC305 Individual Solder Joints during Creep–Fatigue Conditions at Room Temperature" Crystals 12, no. 9: 1306. https://doi.org/10.3390/cryst12091306