Article

Comparison of Structural, Microstructural, Elastic, and Microplastic Properties of the AAAC (A50) and ACSR (AC50/8) Cables after Various Operation Periods in Power Transmission Lines

by
Aleksandr A. Levin
1,*,
Maria V. Narykova
1,
Alexey I. Lihachev
1,
Boris K. Kardashev
1,
Andrej G. Kadomtsev
1,
Nikita D. Prasolov
1,
Andrei G. Panfilov
1,
Roman V. Sokolov
1,
Pavel N. Brunkov
1,
Makhsud M. Sultanov
2,
Alexander V. Strizhichenko
2 and
Ilia A. Boldyrev
2
1
Ioffe Institute, Politekhnicheskaya ul. 26, St. Petersburg 194021, Russia
2
“Moscow Power Engineering Institute”, National Research University, Volzhsky Branch, Lenina pr. 69, Volzhsky 404110, Russia
*
Author to whom correspondence should be addressed.
Crystals 2022, 12(9), 1267; https://doi.org/10.3390/cryst12091267
Submission received: 12 August 2022 / Revised: 30 August 2022 / Accepted: 1 September 2022 / Published: 6 September 2022
(This article belongs to the Special Issue Applications of Crystal Plasticity in Forming Technologies)

Abstract

:
In modern economic infrastructure, Al cables of overhead power transmission lines are used both without and with a steel core (respectively, all aluminum alloy conductor (AAAC) and aluminum conductor steel reinforced (ACSR) cables). In this article, the changes in structural, microstructural, and elastic-microplastic properties have been analyzed for the outer wires of the AAAC (A50) and ACSR cables (AC50/8 cables with a steel core of ~8 mm2 cross-section, hereinafter referred to as AC50) with the cross-section of the stranded conductor of ~50 mm2, which were in operation for 0–20 years in the Volgograd region of Russia. Using the techniques of X-ray diffraction, electron backscattered diffraction, densitometry, and the acoustic method, the structural and microstructural features of the wires have been compared and found to be correlated with their elastic-microplastic properties. It has been ascertained that the presence of a steel core in AC50 leads to a decrease in the defectiveness of the near-surface layer of their aluminum wires. Compared with A50 cables, the development of void defects in the near-surface layer of Al-wires of AC50 cables slows down (by ~1 year with a service life of ~10 years and by ~3 years with a service life of ~20 years).

1. Introduction

Uninsulated (bare) cables A50 and AC50/8 (hereinafter also referred to as AC50) are mainly used for transmitting electrical energy in overhead electrical networks on land in all macroclimatic regions with either mild or cold climates. The main difference between AC50 and A50 cables is the presence of a steel core in the AC50 ones. Comparative characteristics of the investigated types of cables according to the manufacturer’s certificates [1] are given in Table 1. It is obvious that the presence of a steel core in the AC50 cables of the ACSR (aluminum conductor steel reinforced) type significantly increases the bearing capacity to withstand higher loads than the capabilities of the A50 cable belonging to the AAAC (all aluminum alloy conductor) type. The advantages of the A50 cable include its low weight (since it is completely made of aluminum) and a higher current conductivity (slightly higher than AC50 with a close full diameter of the cable conductor).
Overhead power lines are mainly constructed of supports, cables, and insulators, with cables (wires in them) being the most weak (“vulnerable”) element of this system. The expected service life of the cables listed in Table 1 is at least 45 years [1], but it is not limited to this period and, rather, is determined by the technical condition of the wires. The study of the factors that cause the destruction of wires and the prediction of their serviceability is a vital area of research to develop ways to improve their normal operational properties.
There are several reasons for the premature failure of cables of overhead power lines; therefore, let us briefly analyze some of them. The first reason is wire damage and defects, which can occur at any stage of manufacturing of the cables and processing of the cable wires, including continuous casting, extrusion, wire drawing, or stranding. In the papers [2,3], various defects were investigated and the reasons for their appearance were explained. In particular, one of the most common causes is the presence of oxide particles in aluminum conductors (the starting material for wires) and shrinkage porosity. Such defects (nano and micropores, inclusions such as oxides, carbides, etc.) can indeed be stress concentrators and lead to the formation of microcracks with further destruction [4,5] that reduces their service life. Compliance with the required standards in the manufacture of cables is an important and necessary step to ensure a long service life.
Another reason for the premature failure of cables may be a significant increase in the mechanical load due, for example, to the action of a strong wind or ice formations [6,7]. Furthermore, one of the most dangerous types of loads is high-frequency vibrations due to the laminar wind regime, which induces fatigue fretting (fretting deterioration in between conductor strands) [8]. Fretting deterioration residues oxidize and become harder. These hard particles increase the run-off of conductors [2,3,9,10]. For instance, a study to assess the causes of premature fatigue failure of AAAC cables (Brazil) showed that vibration reduction led to a more than threefold increase in residual service life [11]. Fretting fatigue studies have also been performed in laboratory conditions for AAAC cables (e.g., [12,13,14]) and for ACSR ones as well (e.g., [15,16]).
Environmental conditions are of great importance during the operation of cables. As is known, overhead power lines are exposed to atmospheric corrosion [17,18,19]. The aluminum wires that make up the outer coil of A50 and AC50 cables have high corrosion resistance due to the formation of a resistant amorphous oxide film up to ~10 nm thick on the aluminum surface in ambient air [18,19,20,21]. Galvanized steel is used as the central element of the AC50 cable inasmuch as zinc coating is an effective way to protect the steel core from direct contact with the aluminum part of the cable [20]. However, existing operating conditions can lead to the destruction of the zinc layer and the development of galvanic corrosion between steel and aluminum. It has been found that the pH of the aqueous medium (water film, air atmosphere) is of decisive importance for the zinc coating corrosion process since it controls the dissolution of the passive oxyhydroxide surface [22]. Therefore, external conditions are of particular importance here, such as the relative humidity of the air, the amount of precipitation, the presence of industrial enterprises, etc. [19,23]. The results of studies of ACSR cables after operation show different results in assessing the integrity of the zinc coating of the steel core and its effect on the degradation of the structure of the aluminum part of the cables. In fact, some studies have shown that no obvious corrosion is found on a steel core under mild climate conditions [24,25]. On the contrary, a significant violation of the zinc coating and corrosion damage of aluminum wires were observed in some studies, although the mechanical strength of these cables (with steel cores) still remained at a fairly high level [26,27,28]. In [29], data on cables with steel cores are adduced, according to which the electrical resistance is significantly increased as a result of galvanic corrosion, so that the local corrosion leads to the failure of power lines. A comparative study showed that the rate of galvanic corrosion in ASCR cables was significantly higher than in AAAC ones [30]. Given the various results of studying the effect of galvanic corrosion on the performance properties of cables, various methods are proposed to improve the solution to this problem, from taking the geographical zoning into account [31] to various methods for assessing its impact [32] (because of the peculiarity of the location of the development of galvanic corrosion and the impossibility of its determination during visual inspection).
Ref. [33] discussed the advantages of using AAAC cables (vs. ASCR) due to the lack of galvanic corrosion, lower resistance, and better nominal current in it. As with ASCR cable corrosion, the main challenge is knowing where to start looking in order to identify incipient damage in time for repair. In [34], AAAC and ACSR conductors were studied in real-life conditions, and it has been concluded that the use of AAAC conductors is more efficient than ACSR, since the latter have a noticeably greater weight, which limits their use (when used on relatively weak structures of wooden supports). However, a comparative study of the fatigue characteristics of AAAC and ACSR cables in laboratory conditions showed that the ASCR type had a fatigue life fivefold greater than the AAAC type, which is an important parameter in evaluating the performance of cables [13,35]. A separate study evaluating the fatigue strength of ASCR cables in a dry environment and in a NaCl corrosive environment showed that wear damage was more severe in a corrosive environment [36]. A similar conclusion about the criticality of corrosion abrasion of cables with a steel core was made in [2].
Analysis of the available scientific data has shown that AAAC and ASCR cables have their advantages and disadvantages depending on the operating conditions. In laboratory studies, it is unlikely to be possible to achieve real operating conditions that take the whole range of factors which provoke early destruction of the conductor into account. The complexity of predicting the behavior of wires during their use is due to the fact that it depends on many factors: the structural state of wire elements, the state of the surface layer, environmental conditions, mechanical stress, friction, the presence/absence of galvanic corrosion, and a number of other conditions. Previously [10,37,38], we studied changes in the structure and microstructure of the individual outer wires of A50 cables (AAAC type) as a function of their service life, correlating with changes in their elastic-plastic properties and surface electrical resistance. In this paper, the methods used to study those cables (namely, the acoustic method for measuring elastoplastic properties and complementary methods of energy-dispersion microanalysis (EDX), scanning electron microscopy (SEM), electron backscattered diffraction (EBSD), X-ray diffraction (XRD), and densitometry) are applied to similar individual outer wires from AC50 cables (ACSR type). The comparison of two types of cables, A50 and AC50, carried out in this work is of interest because the results obtained can be analyzed, taking into account the identity of their operating conditions, particularly the temperature and environment of use (in the Volgograd region of Russia), scale factor (wire/cable diameter), type of stress state, and service lifetime. The main difference is the presence of a steel core in an AC50 cable, which, as the analysis of literature data shows, has its advantages and disadvantages. In this regard, the identification of the characteristics that change most strongly with time may make it possible to identify the parameters that are precursors of destruction. In this article, complementing [10,37], we contribute to increasing the available data on the analysis and predicting the performance of overhead power line cables by considering wires from AC50 cables compared to wires from A50 cables with comparable service lives of 0 to ~20 years.

2. Materials and Methods

2.1. Samples

To compare the structural, microstructural, elastic, and microplastic properties of two types of uninsulated cables, namely, A50 (AAAC) and AC50 (ACSR), individual aluminum wires of overhead power-line cables were studied after different periods of operation, see Table 2. Hereinafter, wires of the A50-type cables will be referred to as “A50-type wires” or “A50 wires” for short, and wires of the AC50-type cables will be referred to as “AC50-type wires” or, for short, “AC50 wires”.
The nominal characteristics of the A50 and AC50 types of cables according to the manufacturer’s passport (Interstate Technical Standard GOST 839-2019) [1]) are summarized in Table 1. The A50 cable consists of seven separate Al wires and, according to the cable passport, has a cable conductor cross-section of 49.5 mm2, the diameter of individual aluminum wires is 3 mm, the estimated cable weight is 135 kg/km. Steel-aluminum cables designated as AC50 were also investigated. They contain six Al wires with a diameter of 3.2 mm, whirled around a steel core with the same diameter of 3.2 mm. The cross-sections of the AC50 cable according to the passport are 48.2 mm2 (Al) and 8.04 mm2 (steel), the estimated weight of the cable is 195 kg/km. It should be noted that the values of the diameters of the wires studied, measured experimentally, differ from the nominal values and range from 2.85 mm to 3.03 mm and from 3.20 mm to 3.24 mm for A50 and AC50 wires, respectively (Table 2).
In manufacturing the aluminum wires of the above cables, cold-drawn aluminum of grade A7E (GOST 11069) [39] was used. Table 3 shows the chemical composition of the aluminum alloy according to the manufacturer’s quality certificate.
All the Al wires are manufactured using the same technology from aluminum of the same grade, and the results of XRD studies [37] revealed that the unexploited A50 and AC50 wires (respectively, N5-2 and N5) showed almost the same structural and microstructural parameters. That is why, in the study by different methods of a series of A50-type samples of different length service lives, the results obtained on N5 AC50-type wire were considered as related to the initial state (service life of 0 years), unless otherwise indicated.
Samples of the optimal length for the studies will be specified in the description of each method. They were cut from the outer wire of the tested cables and washed in an ultrasonic acetone bath to remove external impurities and protective grease. Under the term “outer wires”, we mean Al wires under the influence of the atmosphere and also other wires (either exclusively Al wires in the case of A50 cables or, in addition, steel core in the case of AC50 ones).
It should be noted that from the available samples, wires of A50 and AC50 types with the maximum possible service life were selected for comparison. However, there is a difference of 2 years between the service life of the samples after operation (10 and 8 years or 18 and 20 years for samples A50 and AC50, respectively, see Table 2). Taking into account the long expected service life of 45 years in accordance with the manufacturer’s standard [1], it can be expected that this difference will be insignificant when comparing their properties.

2.2. Experimental Details of Measurements and Analysis

All details of the experiment and analysis of the results of EDX, SEM, EBSD, XRD measurements, and densitometric and acoustic investigations are detailed in [10,37]. Therefore, this article provides only a brief description of the experimental equipment, measurements, and their analysis.

2.2.1. Experimental Details of EDX, SEM, and EBSD

To study samples by SEM, EDX, and EBSD by use of a JSM 7001F scanning electron microscope (JEOL, Tokyo, Japan) equipped with an INCA PentaFETx3 system for EDX microanalysis and with an HKL Nordlys detector (Oxford Instruments, Abingdon-on-Thames, UK) to obtain EBSD maps, polished cross sections of wire samples with a diameter of 2.85–3.24 mm were prepared (see Table 2). For the preparation of polished cross sections, a MultiPrep8 machine (Allied, San Francisco, CA, USA) was used with a gradual reduction in the abrasive grain for mechanical grinding of the section. The final polishing of the section surface was carried out with an argon-ion beam using a 1061 SEM Mill system of ion milling and polishing (Fischione, Export, PA, USA). The EBSD maps were taken with a step of 0.5 μm in areas of 100 × 100 μm2 in size, approximately in the center of the cross sections and near their edges at a distance of ~150 μm from the outer surface of the wires, i.e., in positions corresponding to the internal bulk and near-surface layers of wires, respectively. The EDX analysis was carried out on an area of 500 × 500 μm2 in cross-section to obtain averaged values of the sample composition. During the analysis, the spectrum was continuously accumulated while the area was scanned by an electron beam.

2.2.2. Experimental Details of Densitometric Measurements

The densities of wire samples were determined by hydrostatic weighing on a Shimadzu AUW 120D analytical balance using an SMK-301 attachment (Shimadzu Corporation, Kyoto, Japan). This method, called the densitometric method, employs weighing a sample in air and in a liquid as well as determining the density of the liquid used at a given temperature. This method makes it possible to obtain the integral densities ρd of the samples (hereinafter also referred to as “densitometric density” or “integral density”). To accurately determine the density, samples of aluminum wires 80 mm long and weighing about 1.5 g were used, and distilled water was used as the liquid. The dependence of the density on the temperature of such a liquid is known with the required accuracy. So, the relative error δρd/ρd in determining the density did not exceed 1 ∙ 10−4. To study the surface-layer influence, the wires were investigated after different periods of service life, and the distribution of the change in density over the cross-section of the wires (density defect ΔρdL/ρdL) was obtained. Chemical etching was carried out in a 20% NaOH aqueous solution. During etching, the thickness of the removed layer was determined as [10]:
T etch R 0 · ( 1 m i m 0 ) ,
where R0 and m0 are the radius and mass of the sample in the form of a cylindrical rod before polishing, respectively, and mi is the mass of the sample after polishing the ith layer.
The layer density (ρdL) and the value of the density defect ΔρdL/ρdL in polished layers were calculated with the formulas [10]:
ρ d L = ( m 0 m i ) · ρ d i · ρ d 0 m 0 · ρ d i m i · ρ d 0 ,
Δ ρ dL ρ dL = ρ dL ρ d 0 ρ dL ,
where ρd0 is the density of the sample before polishing, while ρdi is that after polishing of the ith layer.
The thickness of each removed layer ranged from a few microns near the wire surface to ~5 μm after the thickness of the removed layer reached Tetch ≈ 20 μm. This provided information on the distribution of the density defect over the cross-section of the sample with a decrease in its radius.

2.2.3. Experimental Details of XRD Measurements and Analysis

Samples for XRD measurements were cut in the form of a cylinder ~25 mm long and ~3–3.2 mm (Table 2) in diameter and glued onto a low-background single-crystal Si(119) holder. XRD measurements were carried out on a D2 Phaser powder diffractometer (Bruker AXS, Karlsruhe, Germany) in the Bragg–Brentano θ-θ geometry with Cu-Kα1,2 radiation from a copper anode after a Kβ-filter in the form of a Ni-foil and a linear position-sensitive semiconductor X-ray detector LYNXEYE (Bruker AXS, Karlsruhe, Germany) with an opening angle of 5°. The temperature in the chamber where the holder with the sample was installed was kept equal to 314 ± 1 K during the measurements. The measurements were carried out using the method of θ-2θ scanning in the range of diffraction angles 2θ = 6–141° with a step of Δ2θstep = 0.02°. The regimes were used either with sample rotation around an axis coinciding with the axis of the diffractometer goniometer or without rotation, when the X-ray beam was incident on the long side of a cylinder-like sample (see illustration in [10]). Owing to XRD patterns obtained with rotation, the influence of the averaged effects of preferential orientation was estimated. XRD patterns measured without rotation were used to obtain the parameters of XRD reflections (observed Bragg angle (2θobs), observed full width at half-maximum intensity (FWHMobs), maximum (Imax), and integral (Iint) intensities of a reflection) for quantitative analysis of the structural and microstructural parameters of the Al material of the studied samples. Using the EVA program [40], the XRD patterns were corrected for the contribution of the background and Cu-Kα2 radiation, and the values of the above reflection parameters were determined. The obtained observed Bragg angles 2θobs of the reflections were adjusted with the angular corrections Δ2θzero (detector zero shift) and Δ2θdispl (displacement due to the mismatch of the sample surface with the focal plane of the diffractometer; see [10]), which were determined from additional XRD measurements of the samples, immersed to surface level in NaCl powder, certified with XRD powder standard Si640f (NIST, Gaithersburg, MD, USA). X-ray phase analysis was performed by means of the EVA program using the Powder Diffraction File-2 (PDF-2) powder database [41].
Using the Bragg angles 2θB obtained after angular corrections and the Miller indices hkl of the reflections, the parameters a of the cubic unit cell of the wire Al material were calculated, corresponding to each individual XRD reflection. In this case, the estimated standard deviation (e.s.d.) δa of the parameter a was calculated analytically from δ2θB (e.s.d. of the Bragg angle), which was taken as half of the step Δ2θstep with which the XRD pattern was measured (i.e., δ2θB = 0.01°). The average value of the parameter a was determined using the Celsiz program [42], which performs refinement using the least squares method.
The density of the Al material ρx (g/cm3) determined from XRD data (hereinafter “X-ray density” or “XRD density”) was calculated from the ratio of the mass of the unit cell of the crystalline Al phase to the volume of the unit cell as:
ρ x   = C a . m . u . Z · A r V cell · 10 24 ,
where Vcell3) = a3 is the volume of the Al cubic unit cell, Z = 4 is the number of formula units in the Al unit cell, Ar = 26.9815384 a.m.u. (atomic mass units) is the tabular value of the atomic mass of Al, and Ca.m.u. = 1.660539066 10−24 g/a.m.u. is the conversion factor from a.m.u. to grams.
Using the expression:
Δ p p = p p 0 p ,  
the defect of the unit cell parameter, Δa/a, and the X-ray density defect, Δρx/ρx were also calculated. In these calculations, in expression (5), p = a or ρx for any reflection from the sample (either the average value of the unit cell parameter or density of a sample), and p0 is either the value of the unit cell parameter a0 or the density ρx0 of the Al material in the bulk of a new sample (0 years of service).
The determination of microstructural parameters (average size D of coherent scattering regions, which are also called crystallites, and absolute value of average microstrain εs in them) was carried out using the SizeCr program [43] in accordance with the method described in [10,37] and analyzed in detail in [43]. Using the SizeCr program, based on the observed ratio FWHMobs/Bint (where Bint = Iint/Imax is the integral width of a reflection), the reflection’s type (Gaussian, or Lorentzian, or pseudo-Voigt (pV)) was determined for each reflection, and, depending on the type of reflection, a correction of FWHMobs for instrumental broadening was made, see [10,37,43]. As a rule, the observed XRD reflections were pV-type ones. That is, they were characterized by the ratio 0.637 < FWHMobs/Bint < 0.939. The values FWHMcorr (FWHMobs corrected for instrumental broadening according to reflection type) were used to calculate the microstructural parameters. The microstructural characteristics of Al wire materials (average crystallite size D and absolute value of average microstrain εs) were determined by the graphical methods WHP (Williamson–Hall plot) [44] and SSP (Strain–Size plot) [45] adapted to the observed pV type of XRD reflections. The points of the WHP and SSP graphs, corresponding to every XRD reflection hkl, were calculated using the SizeCr program, utilizing the coefficients KScherrer = 0.94 and Kstrain = 4 of the Scherrer and Wilson–Stokes equations, connecting the corresponding FWHMcorr components with crystallite size Dhkl and microstrain εshkl values, respectively (see [43,44,45]). In the absence of microstrains (model εs = 0), the SizeCr program calculated the sizes Dhkl0 of crystallites for each observed reflection as well as the mean-square-root value D0 for all reflections. When setting a fixed value of Dhkl, the values of the microstrain εshkl corresponding to each observed XRD reflection hkl were calculated.
The penetration depth T pen h k l of X-rays for each reflection with Miller indices hkl (see [46] and illustration in [10]) was estimated as:
T pen h k l = sin ( θ B ) 2 · μ l · ρ x ,
where μl = 48.657 cm2/g is the linear absorption coefficient of Al in the case of Cu-Kα1 radiation (after correcting for the Cu-Kα2 contribution), and θB is half of the 2θB Bragg angle (after accounting for angular corrections). The structural and microstructural characteristics of the sample material, which were calculated for each reflection with Miller indices hkl, correspond to the material’s state averaged along the crystallographic direction [hkl] over the volume of the near-surface layer with a thickness equal to the penetration depth T pen h k l . As a result, analysis of different reflections detected at different Bragg angles 2θB makes it possible to obtain profiles of changes in structural and microstructural parameters with depth from the surface.

2.2.4. Experimental Details of Acoustic Measurements

Acoustic resonant methods are based on the analysis of steady oscillations of samples in the form of rods, the length of which is much greater than their transverse dimensions. The determination of elastic and microplastic properties (elastic modulus E and decrement δ of elastic vibrations and microplastic deformation diagrams σ(εd)) makes it possible to study microprocesses that can take place in samples when external conditions change.
Acoustic properties were studied with the composite oscillator technique applied to aluminum samples in the form of rods ~25 mm long. This length corresponds to the resonant frequency of a polycrystalline aluminum sample of about 100 kHz. Young’s modulus E (also called the “modulus of elasticity” or “elastic modulus”) and elastic vibration decrement δ were measured in the range of amplitudes of vibrational deformation ε from ~1 ∙ 10−6 to ~3 ∙ 10−4. The modulus of elasticity was determined using the formula [47]:
E = 4 ρ · l 2 · f 2 ,
where l is the sample length, ρ is its density (for calculations of E, the density ρd determined by the densitometric method was used), and f is the oscillation frequency of the rod-shaped wire samples close to 100 kHz. Upon studying the E(ε) dependence, microplastic deformation diagrams σ(εd) were constructed, which made it possible to evaluate the properties of the material in the “stress—inelastic strain” coordinates customary in mechanical tests, when the value of the amplitudes of vibrational stresses σ = E ∙ ε (Hooke’s law) is plotted along the ordinate axis, and the nonlinear inelastic deformation εd = ε ∙ (ΔE/E)h is plotted along the abscissa axis, where (ΔE/E)h = (EEi)/Ei is the amplitude-dependent defect of Young’s modulus. The quantities Ei and δi measured at small amplitudes ε when both E and δ are yet independent of ε are called amplitude-independent Young’s modulus and amplitude-independent decrement of elastic vibrations, respectively.
Note that the measurements were performed at moderate amplitudes, i.e., the dislocation structure of the material did not change.

3. Results

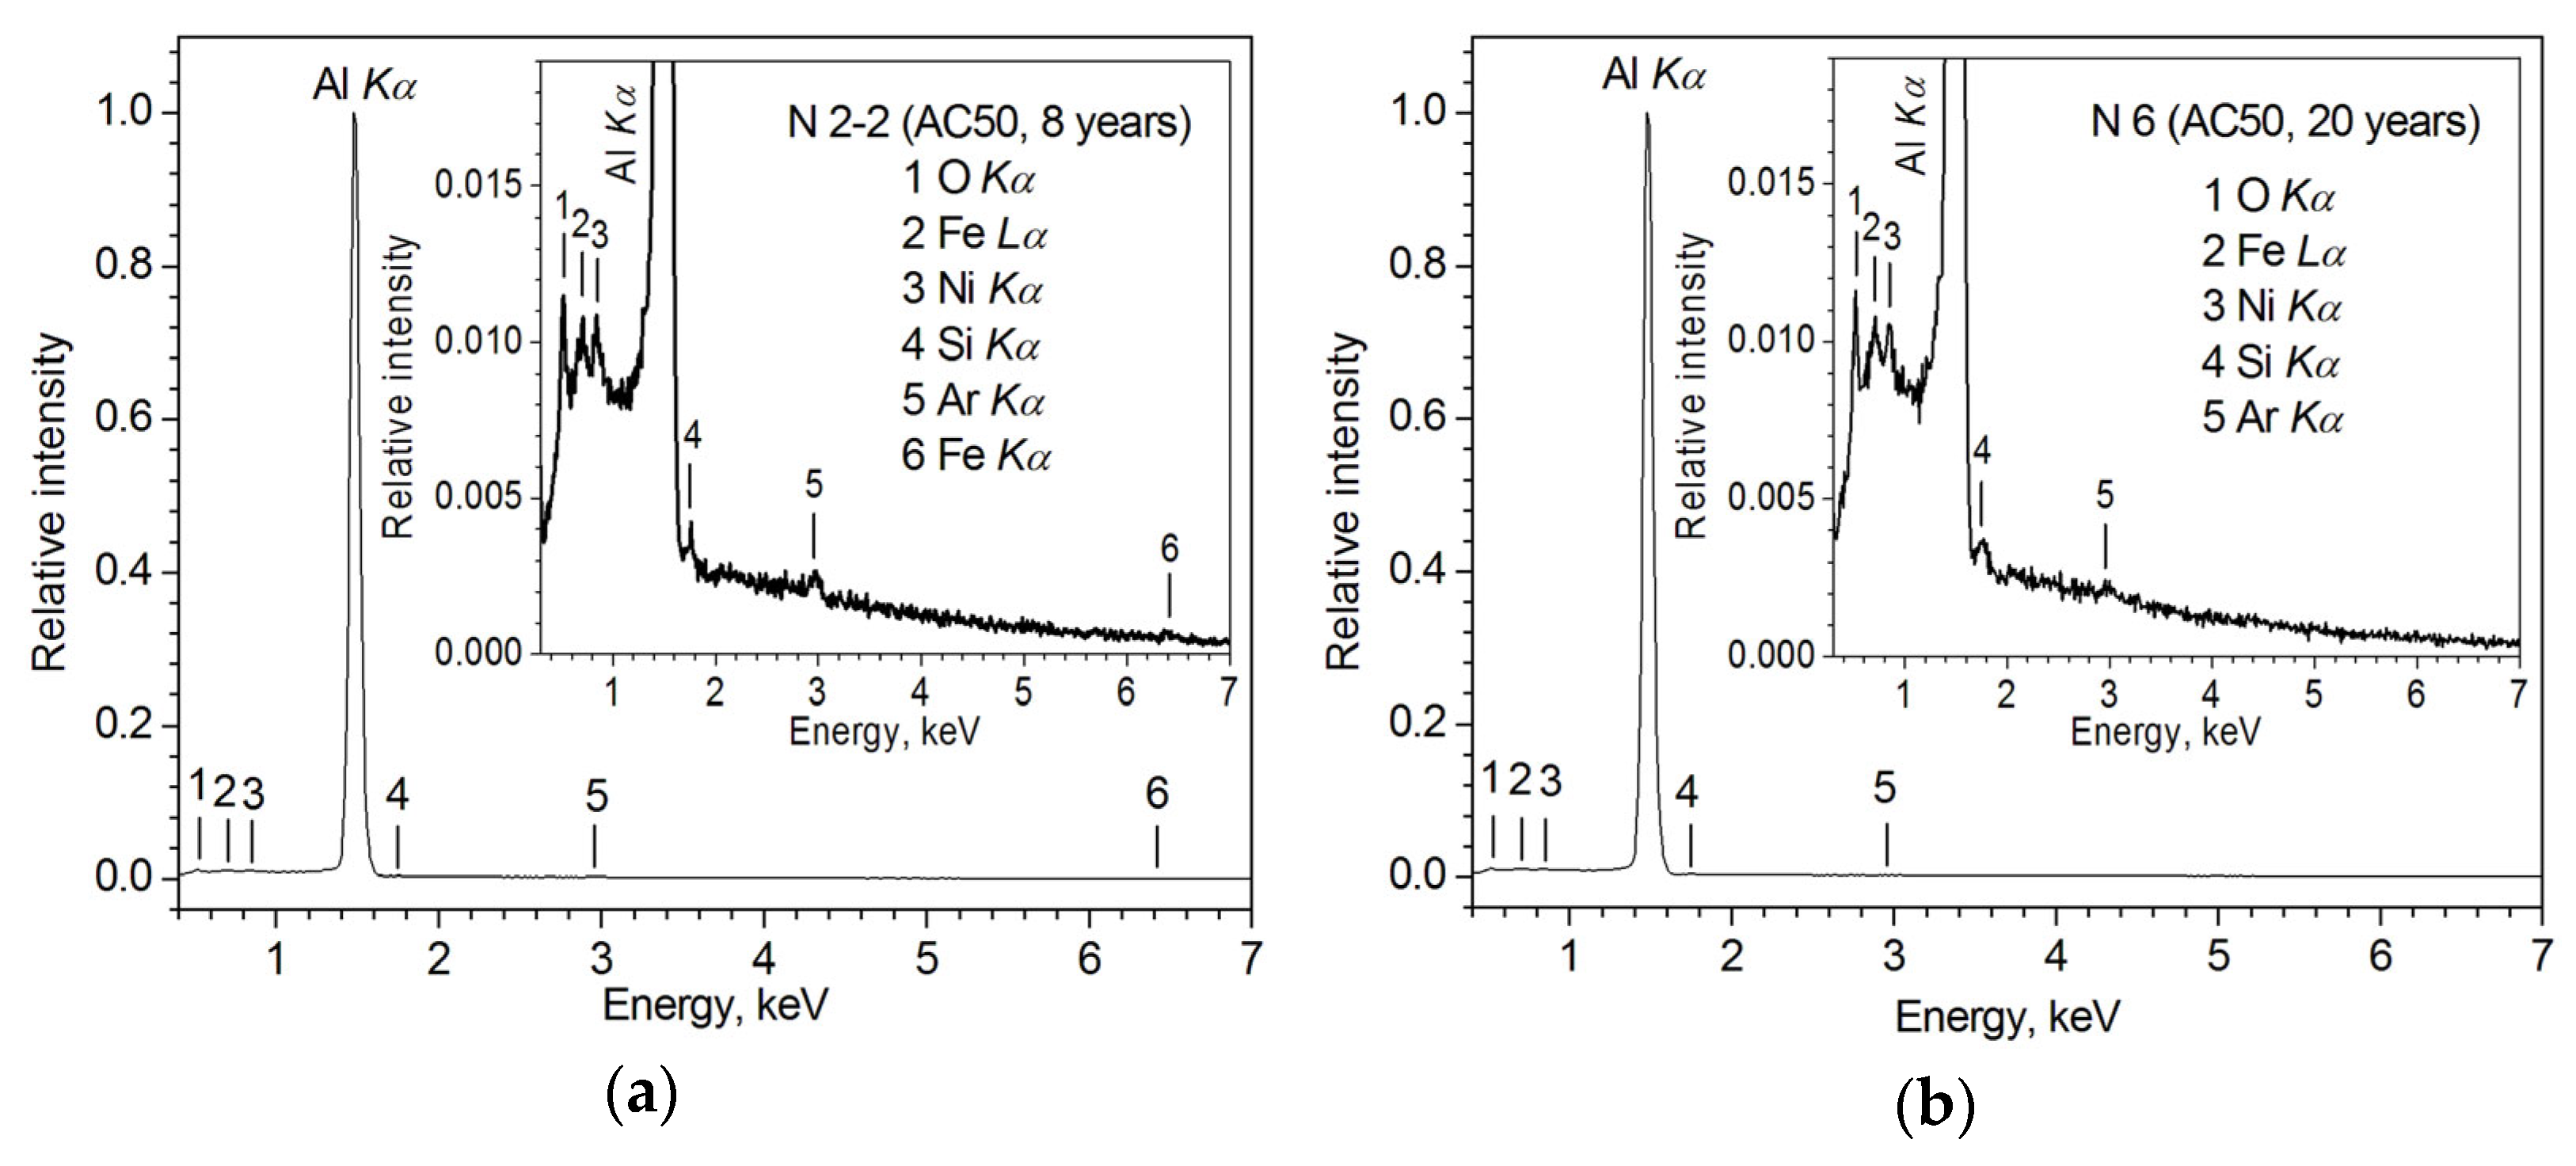
3.1. SEM and EDX Results
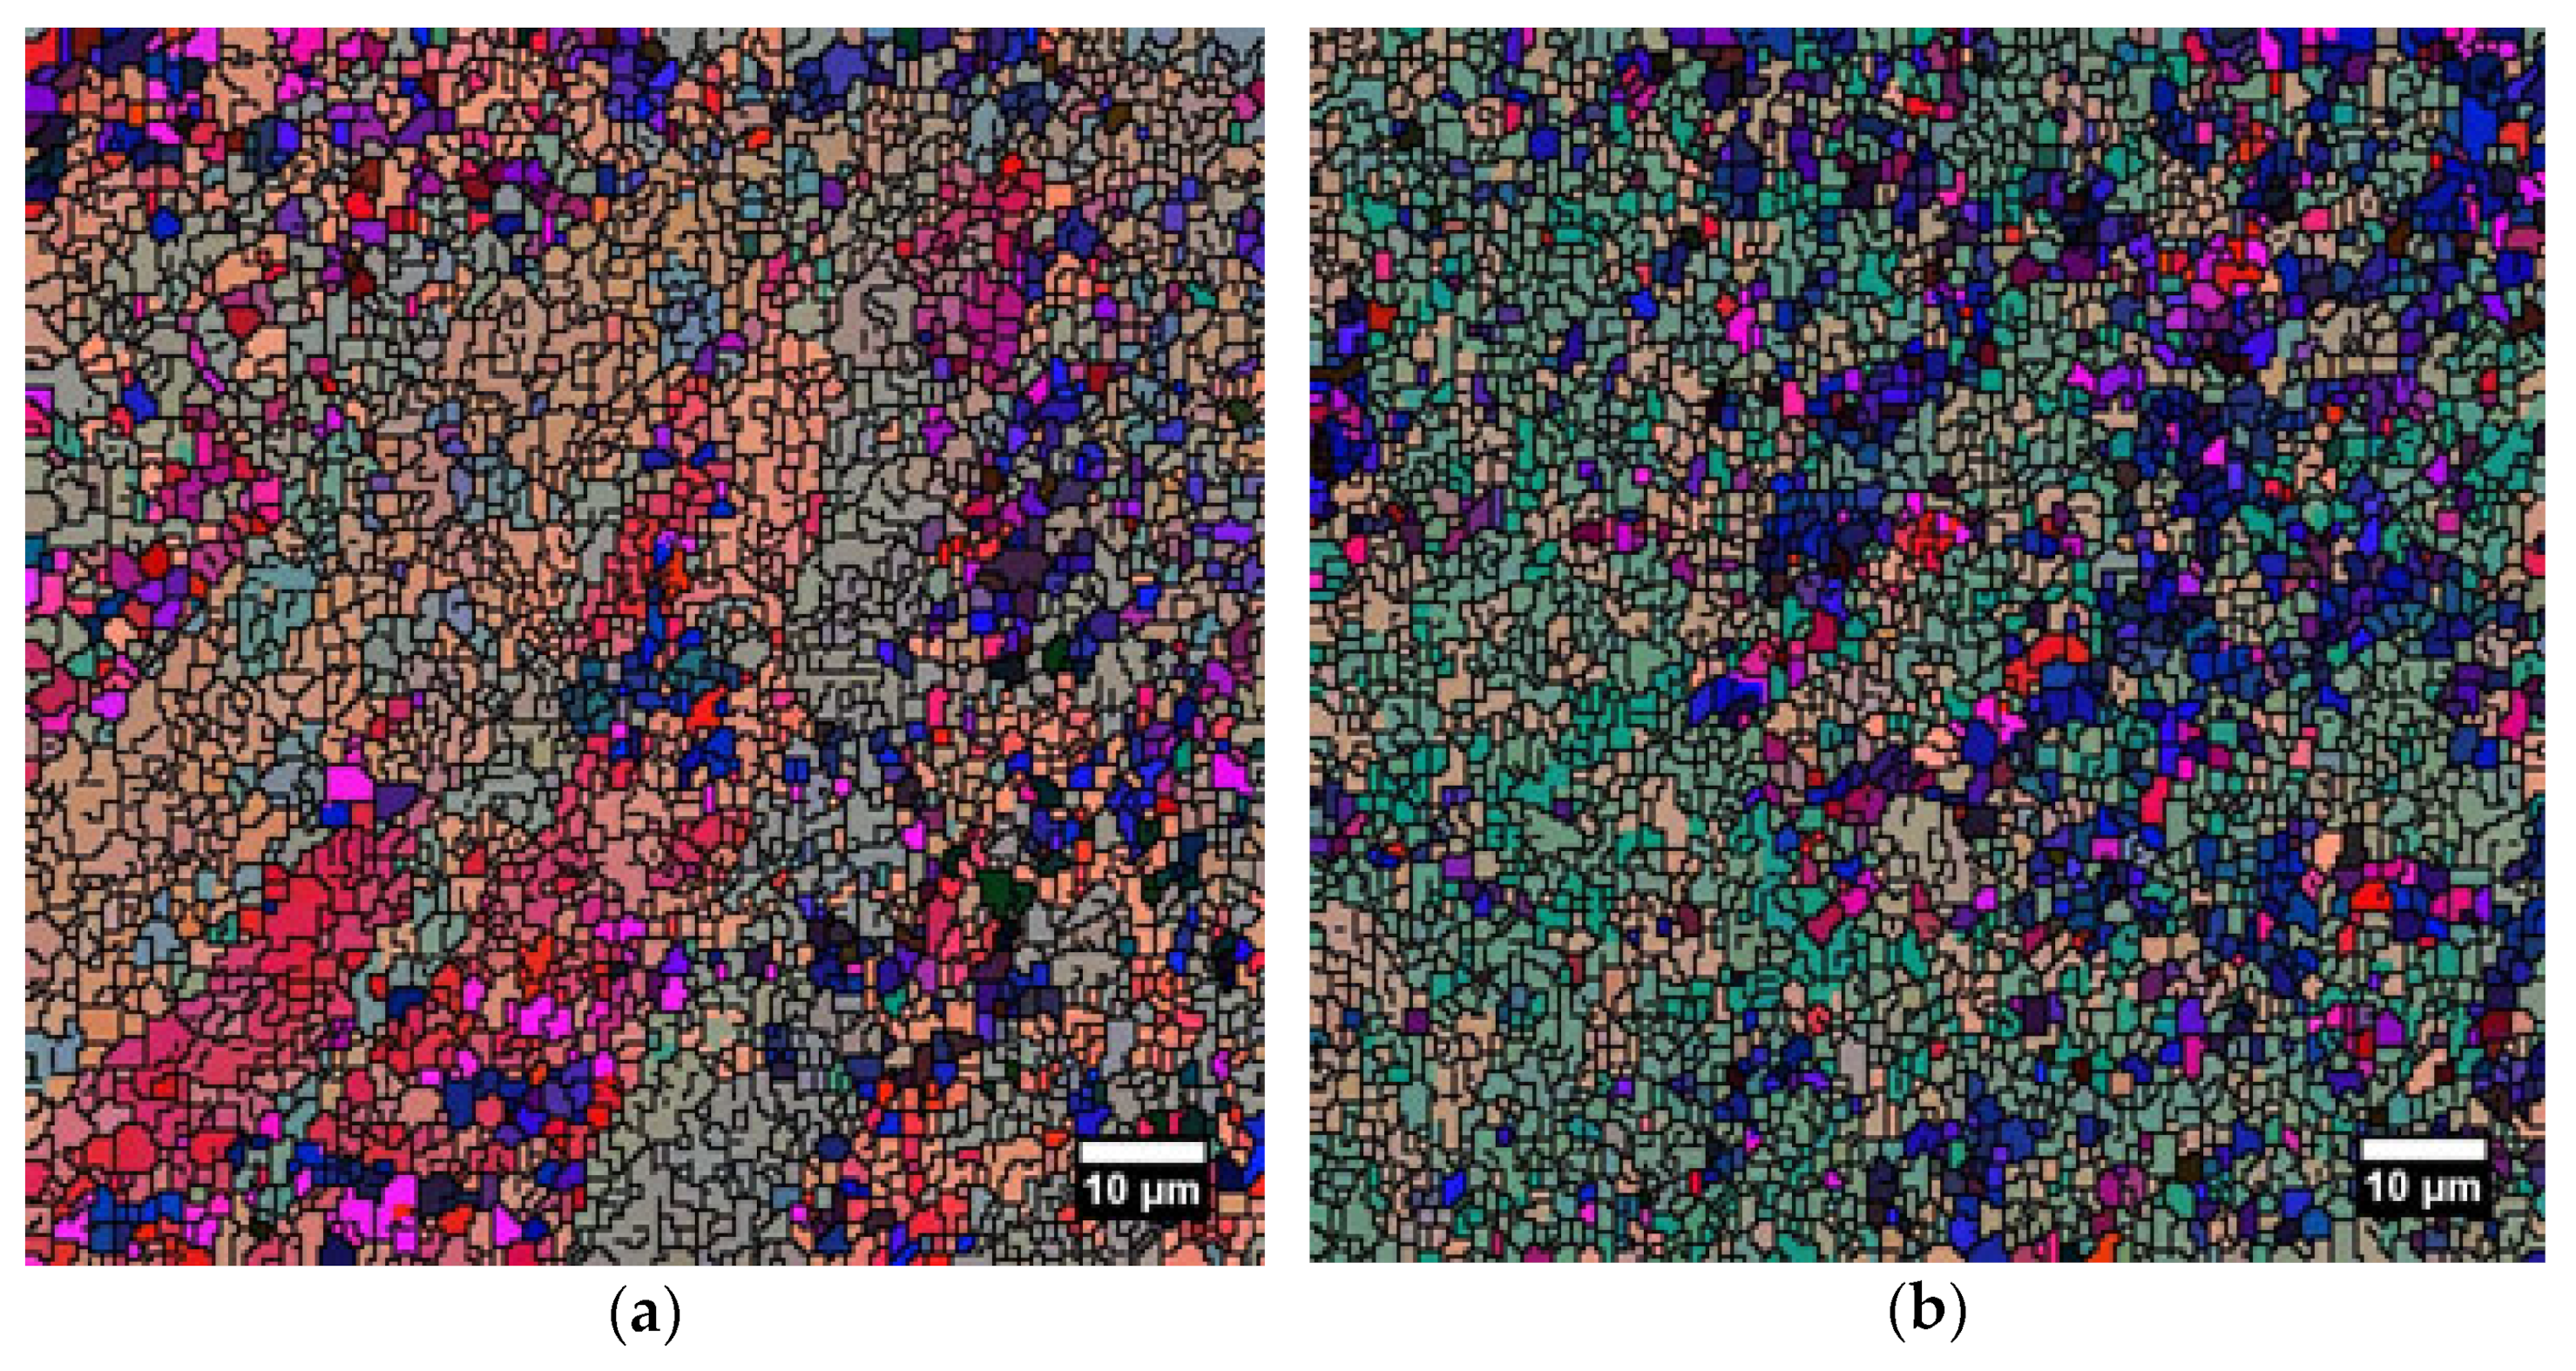
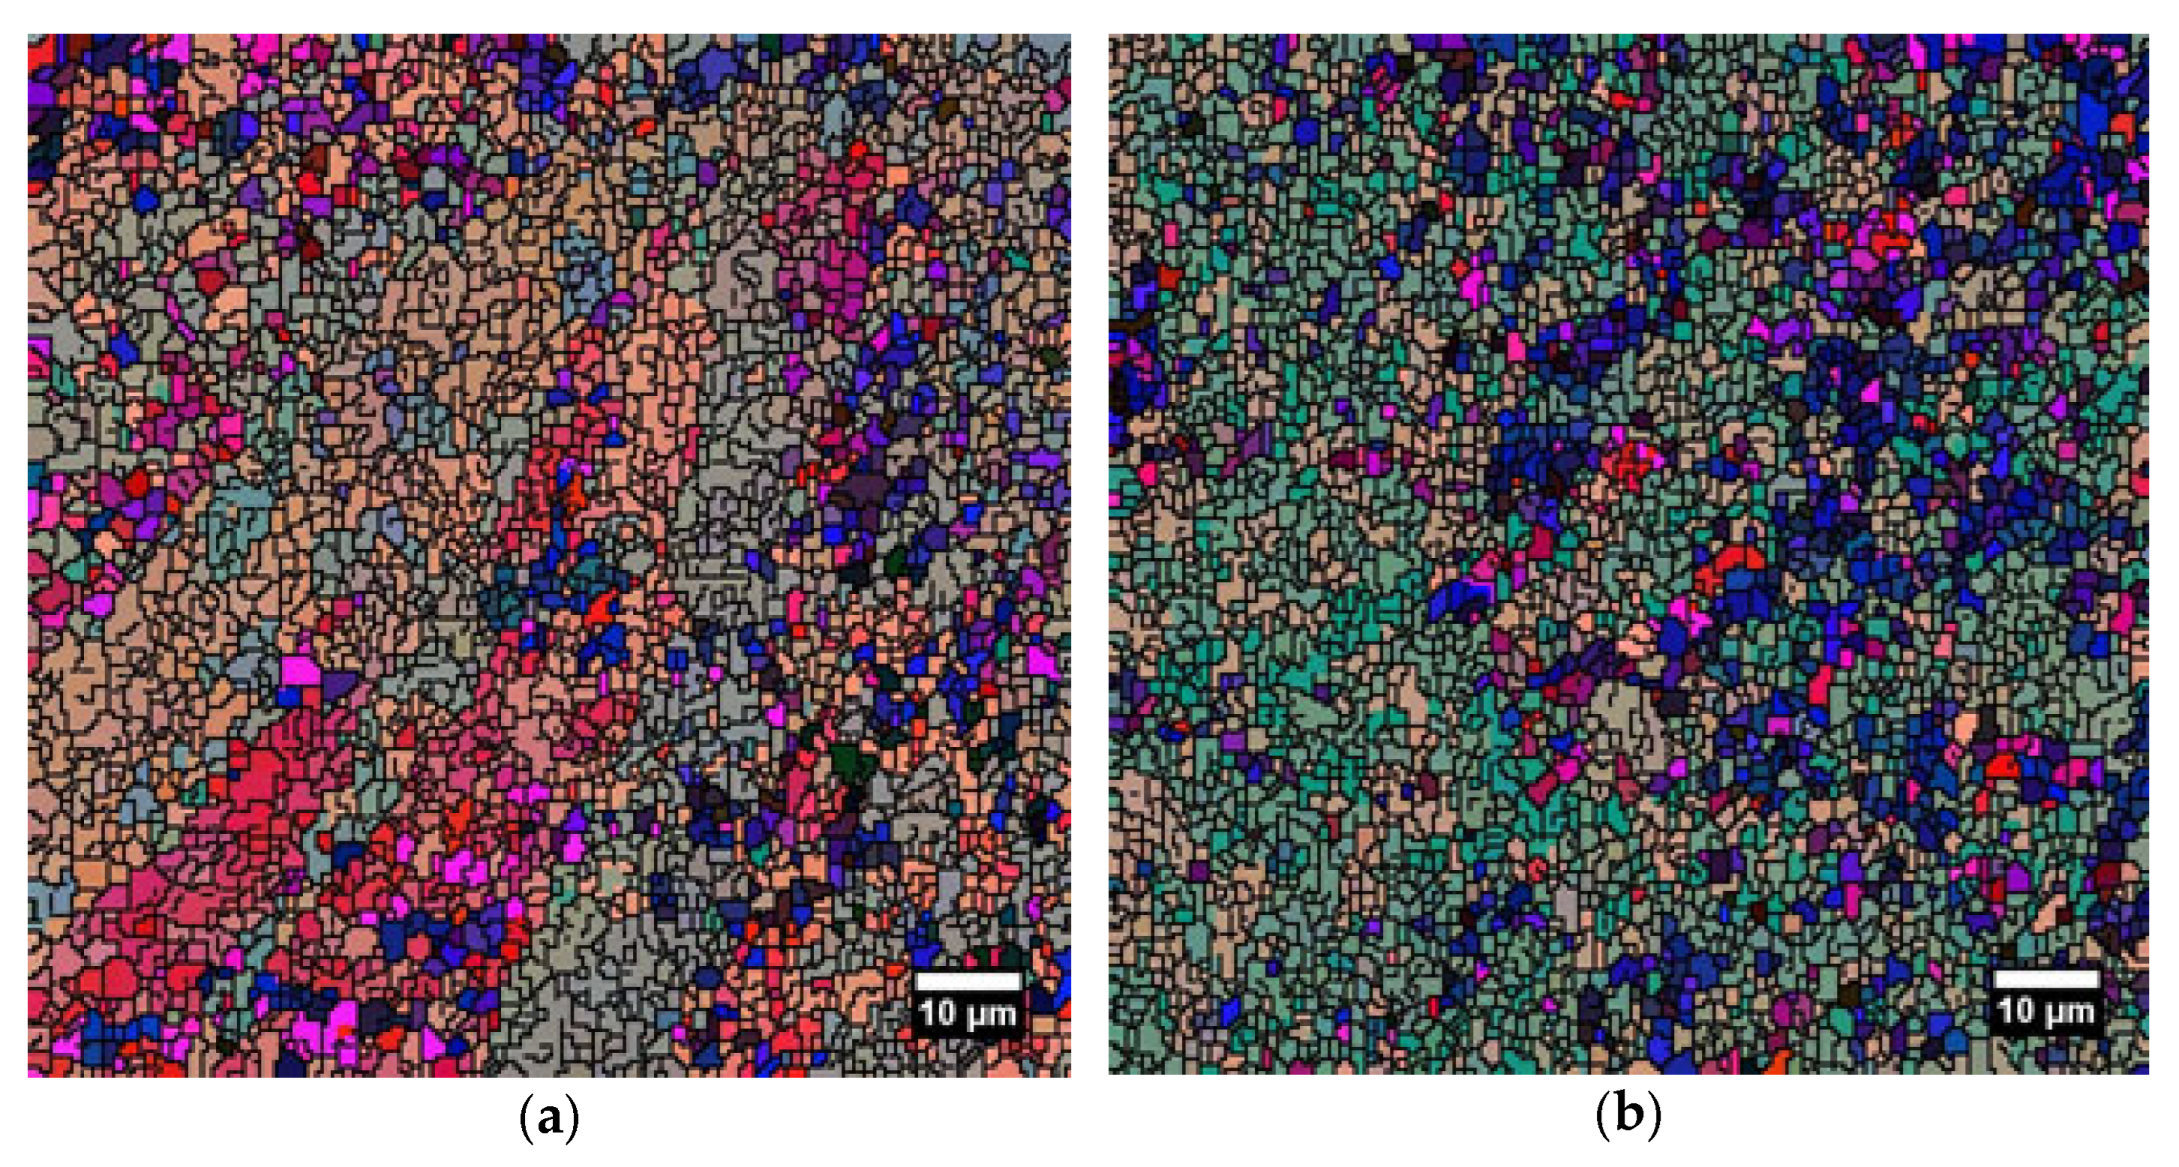
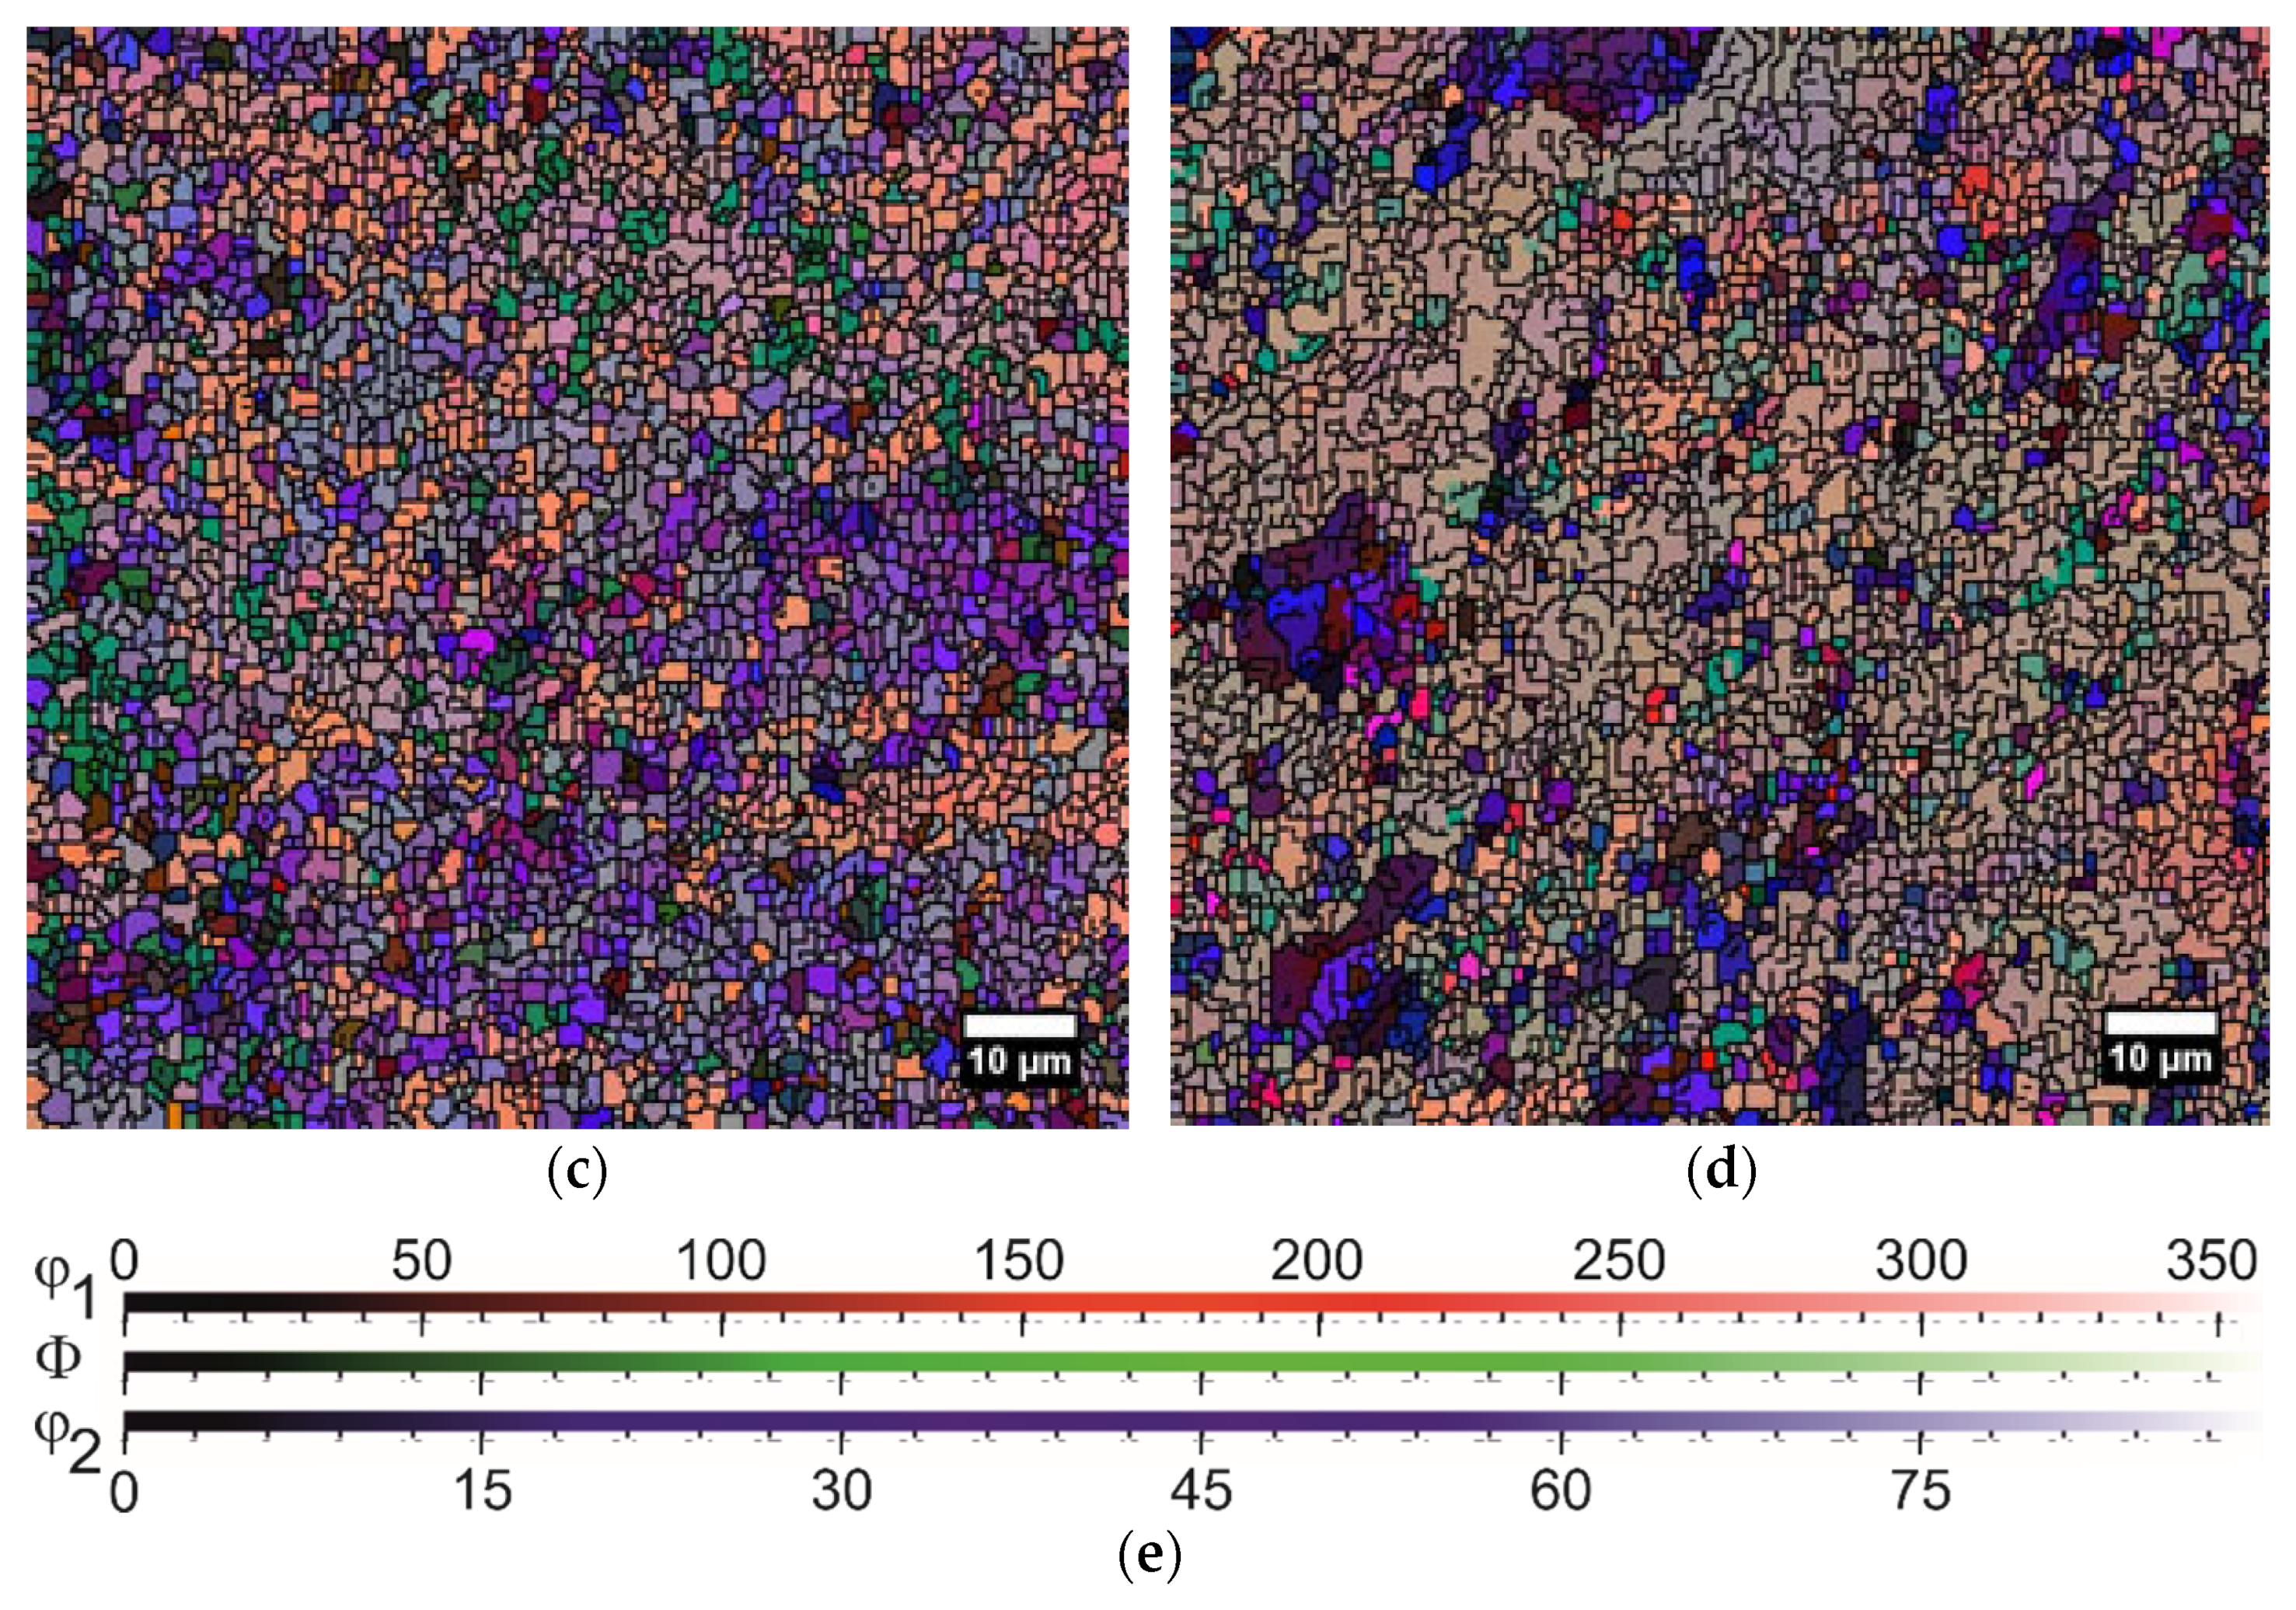
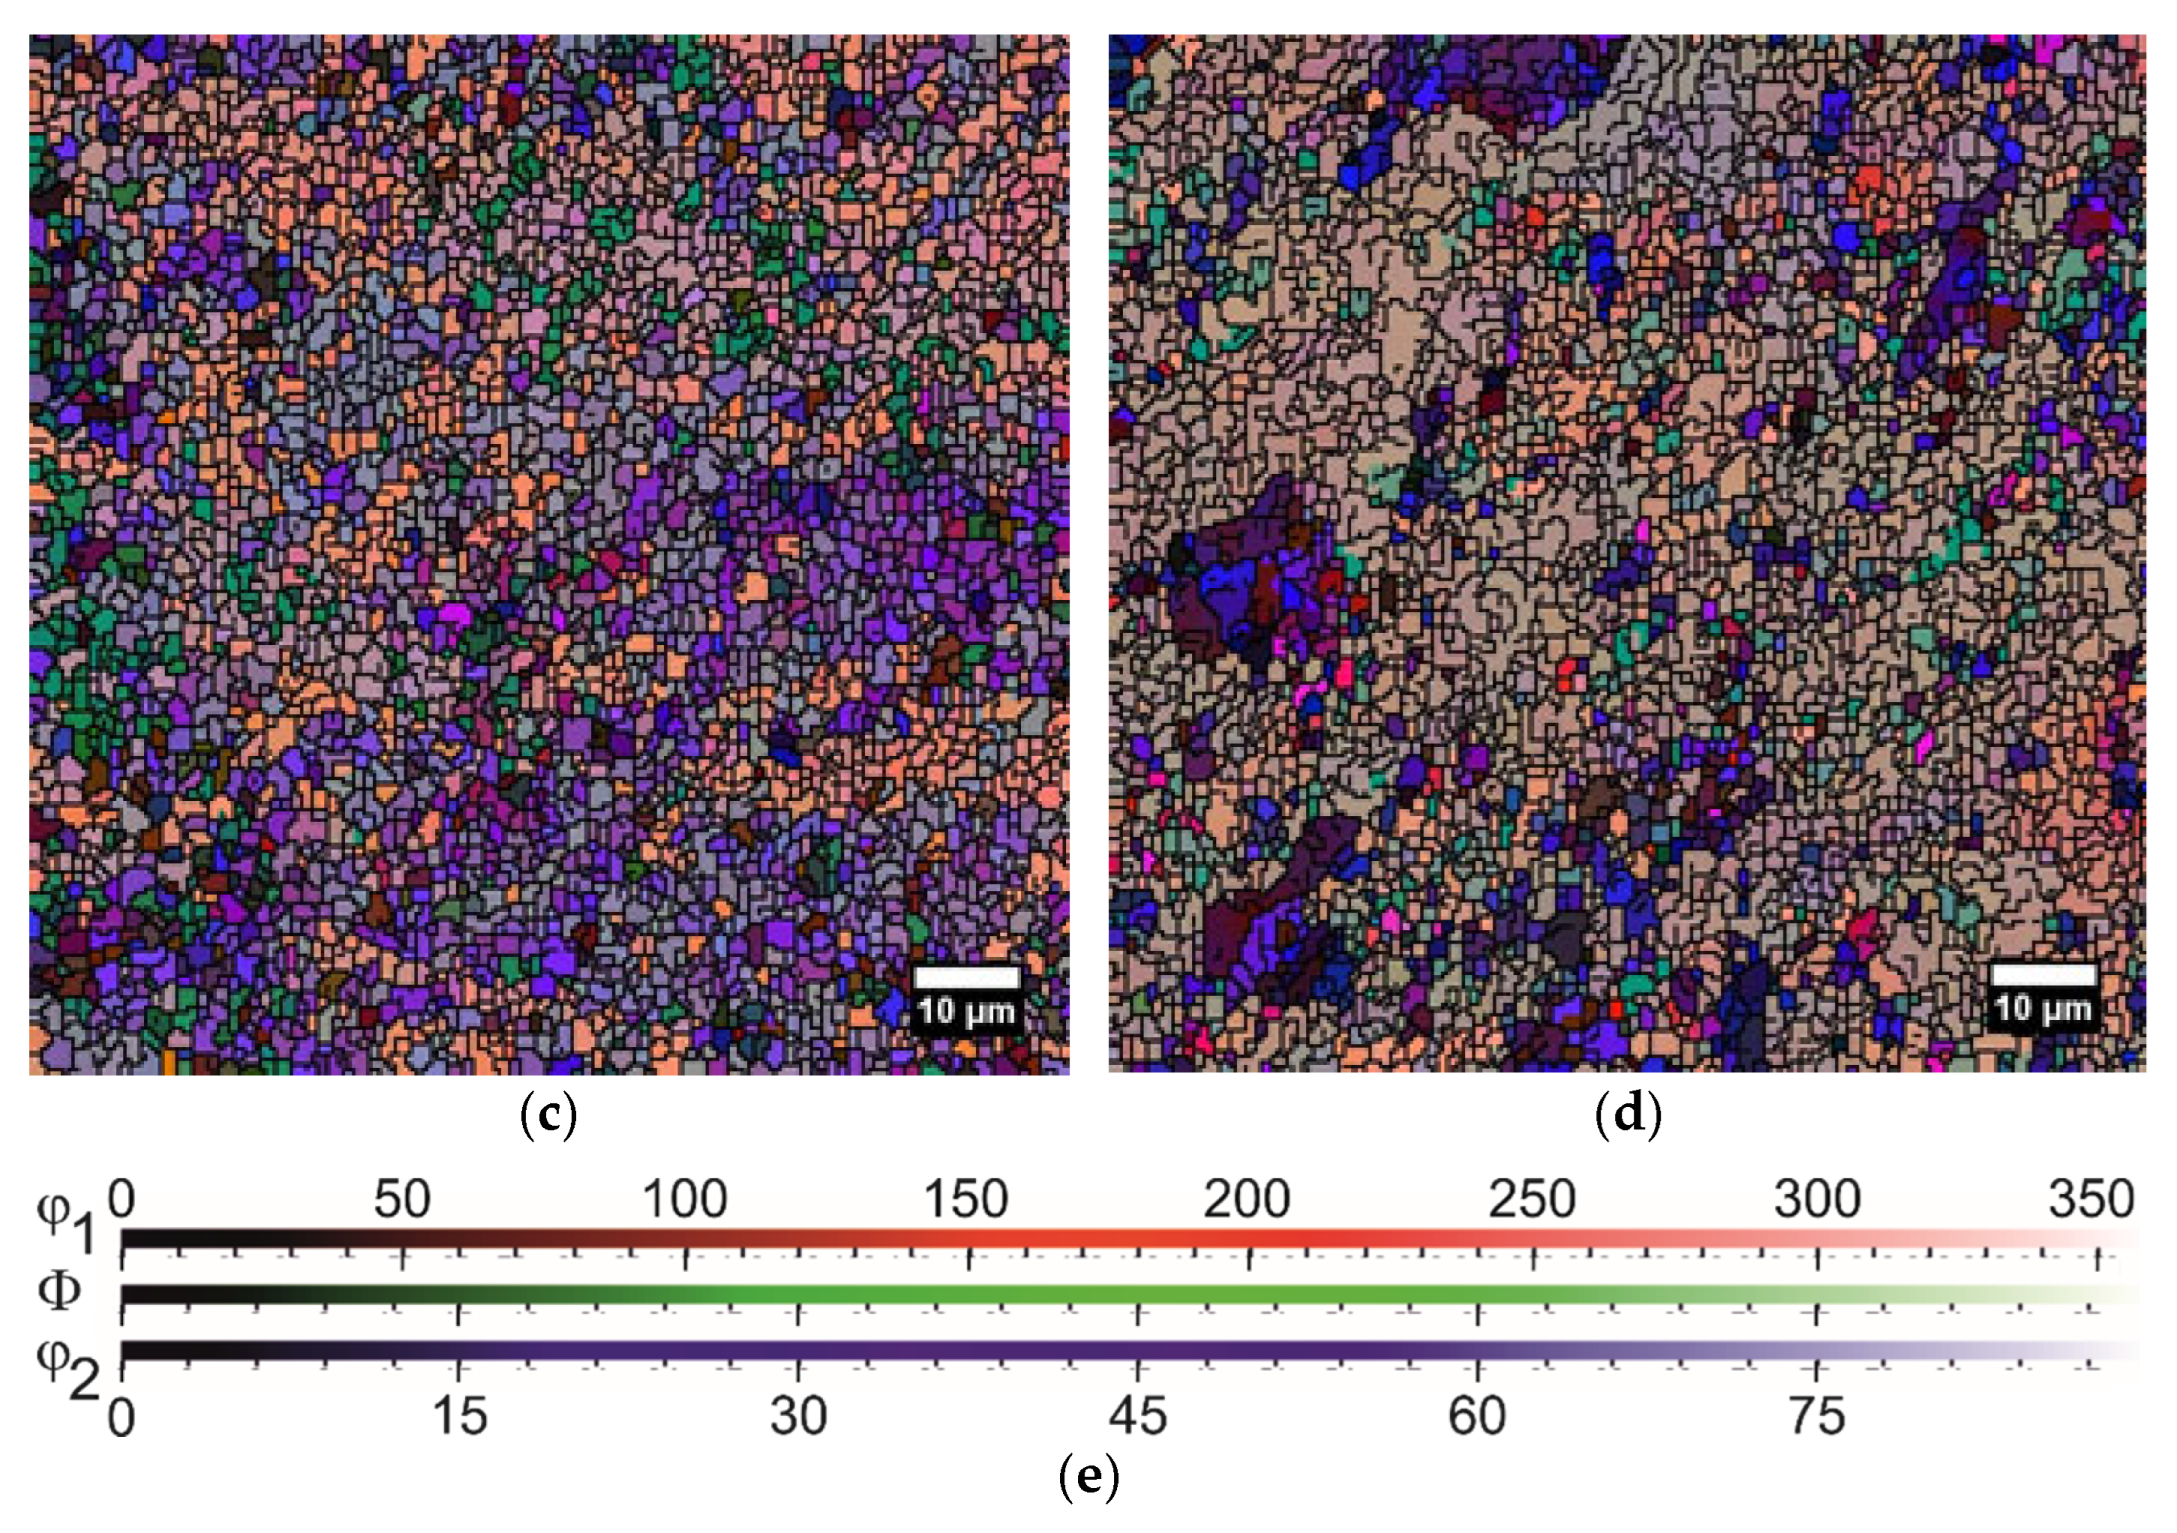
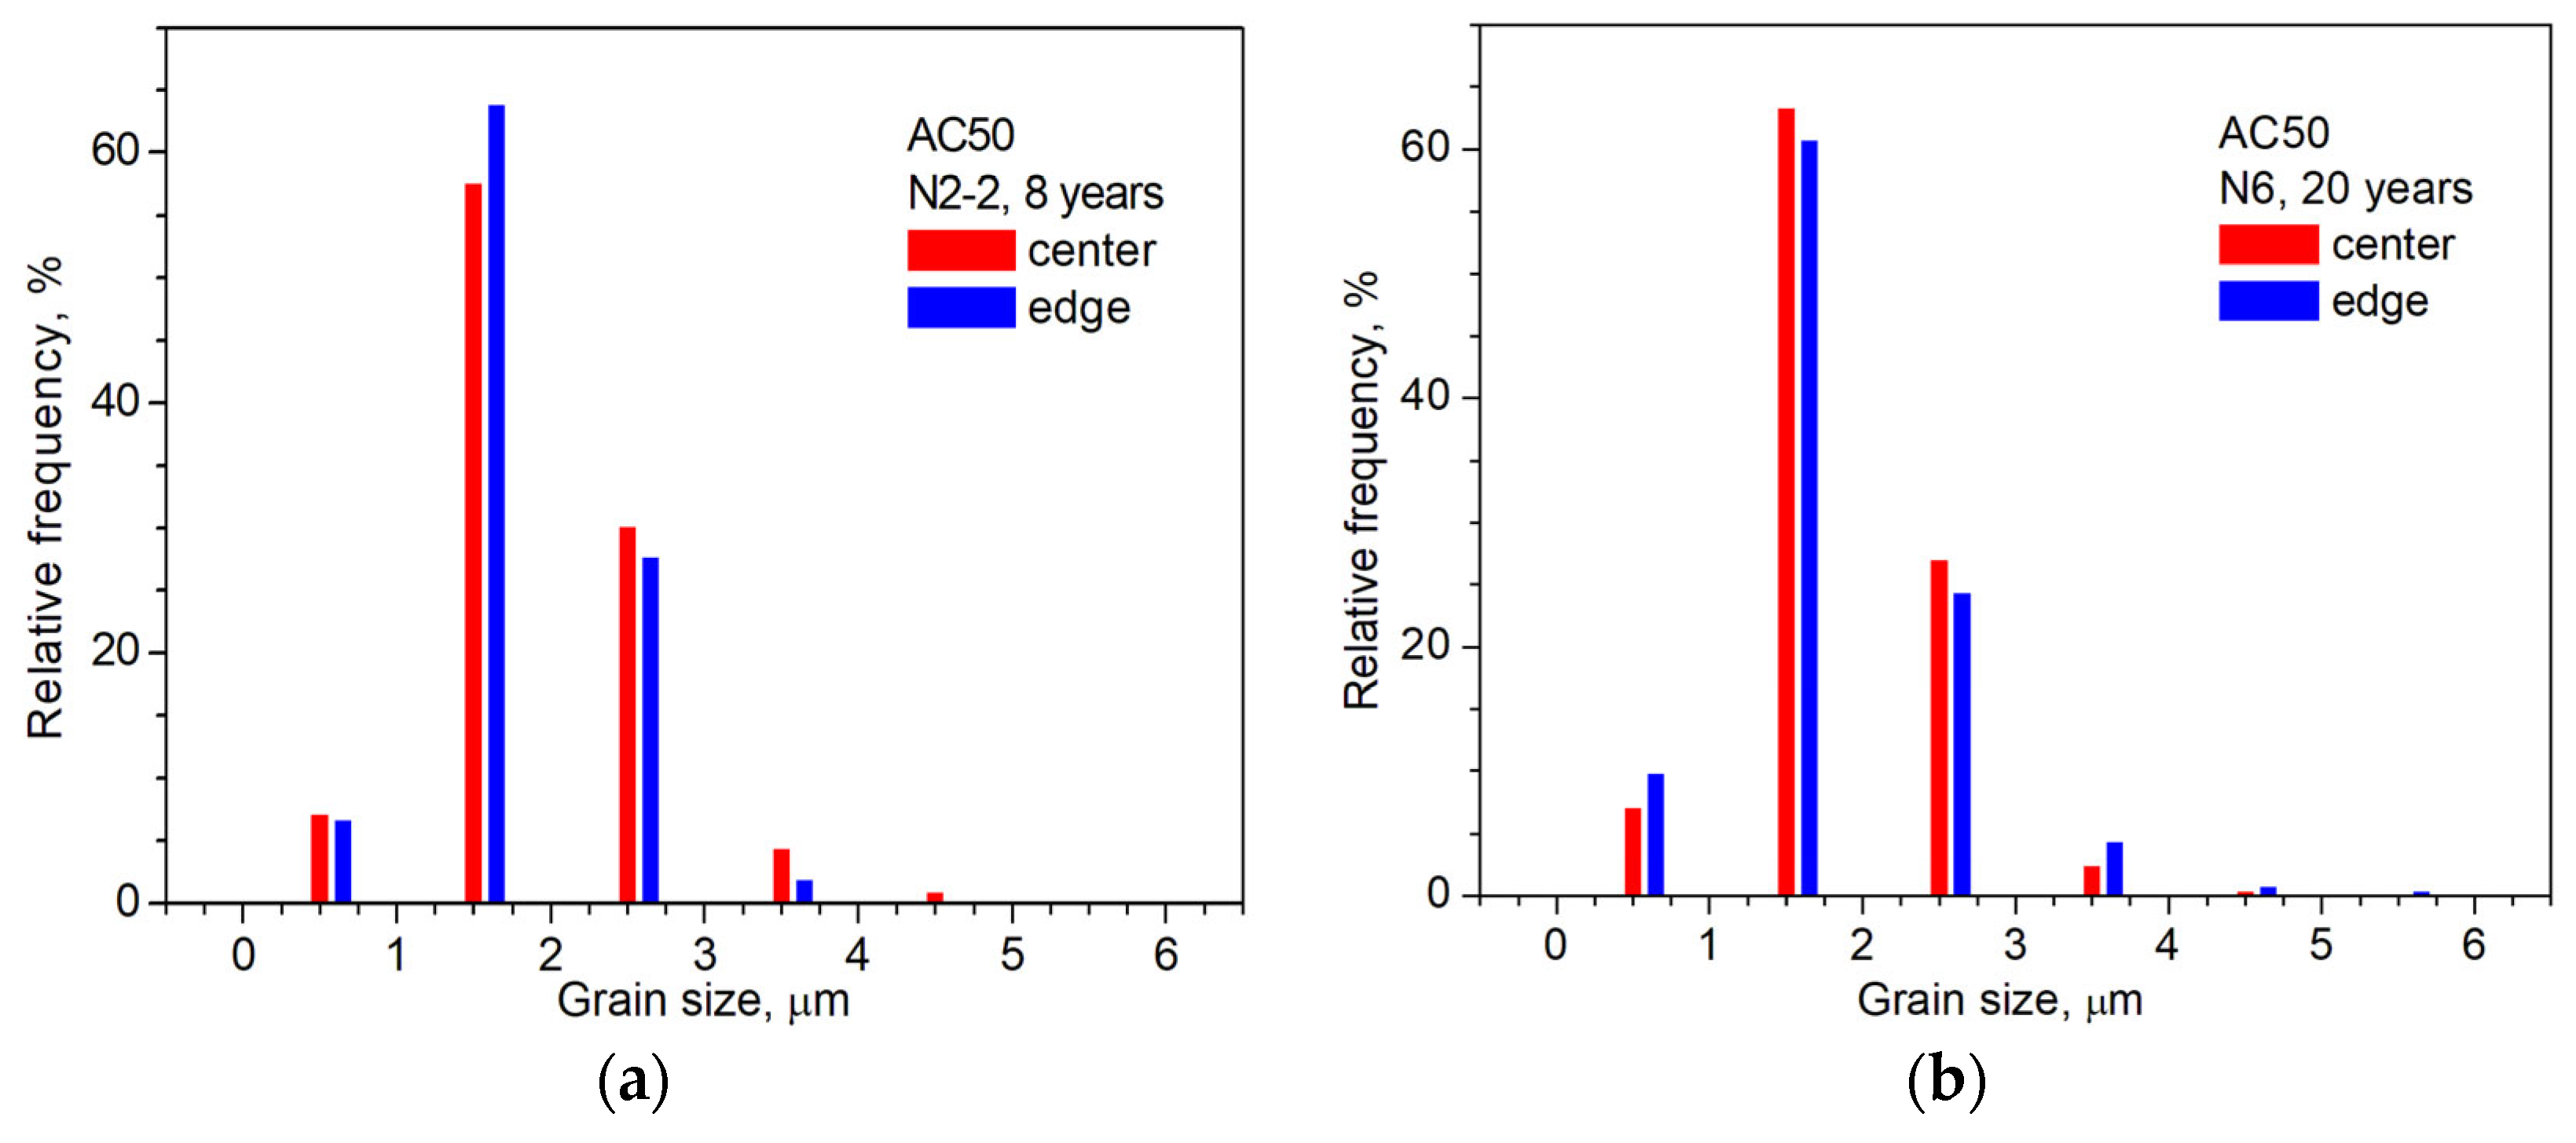
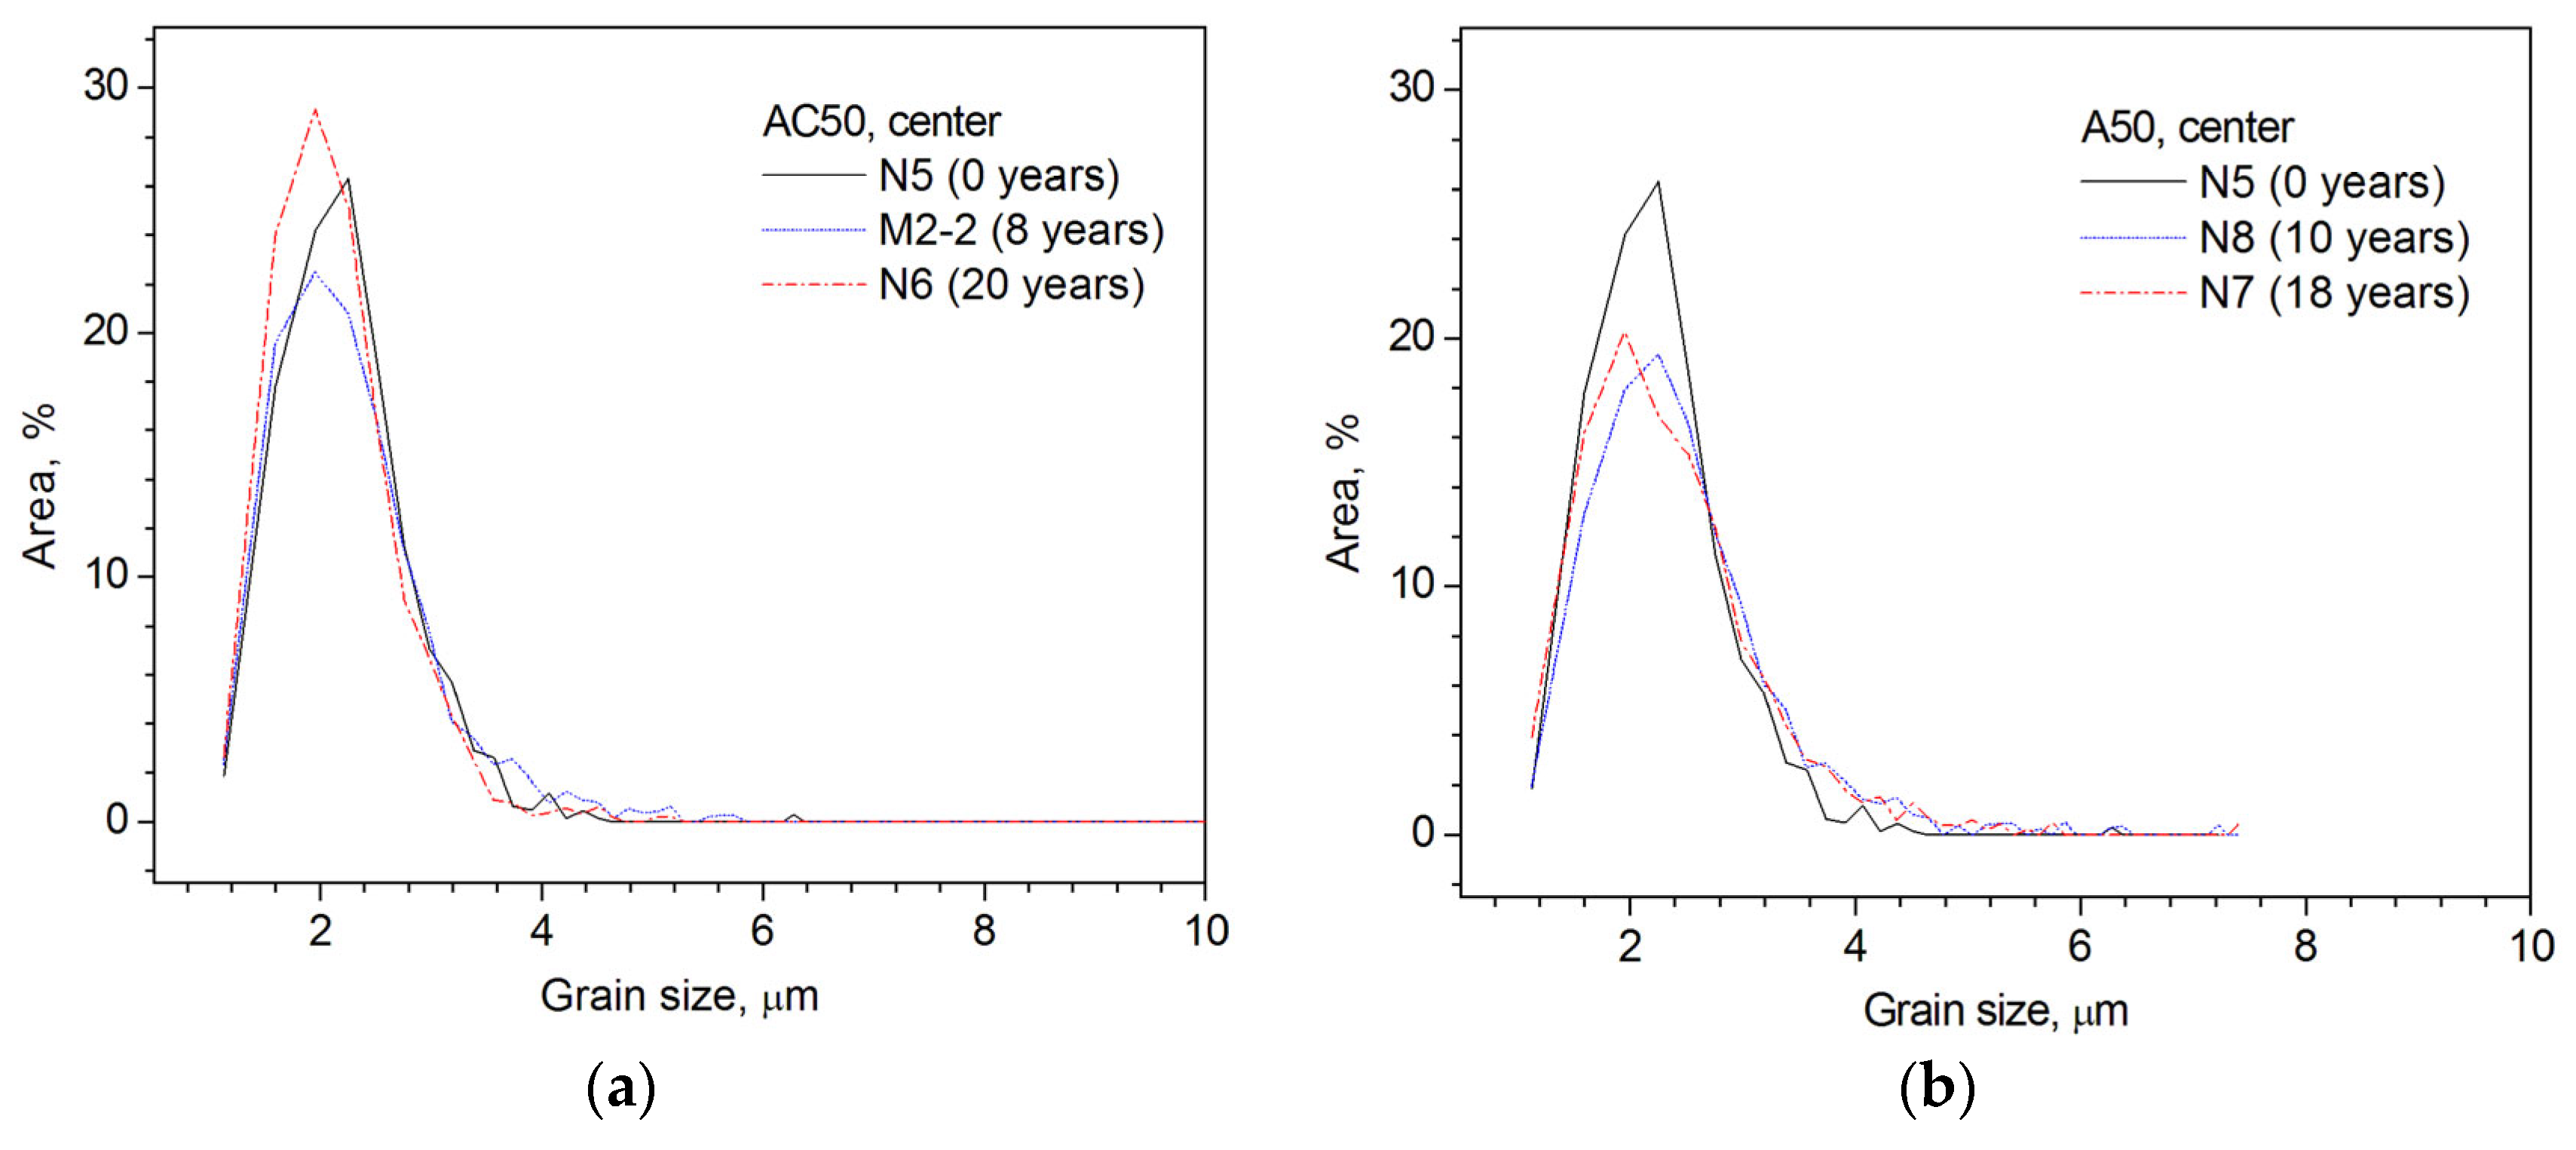
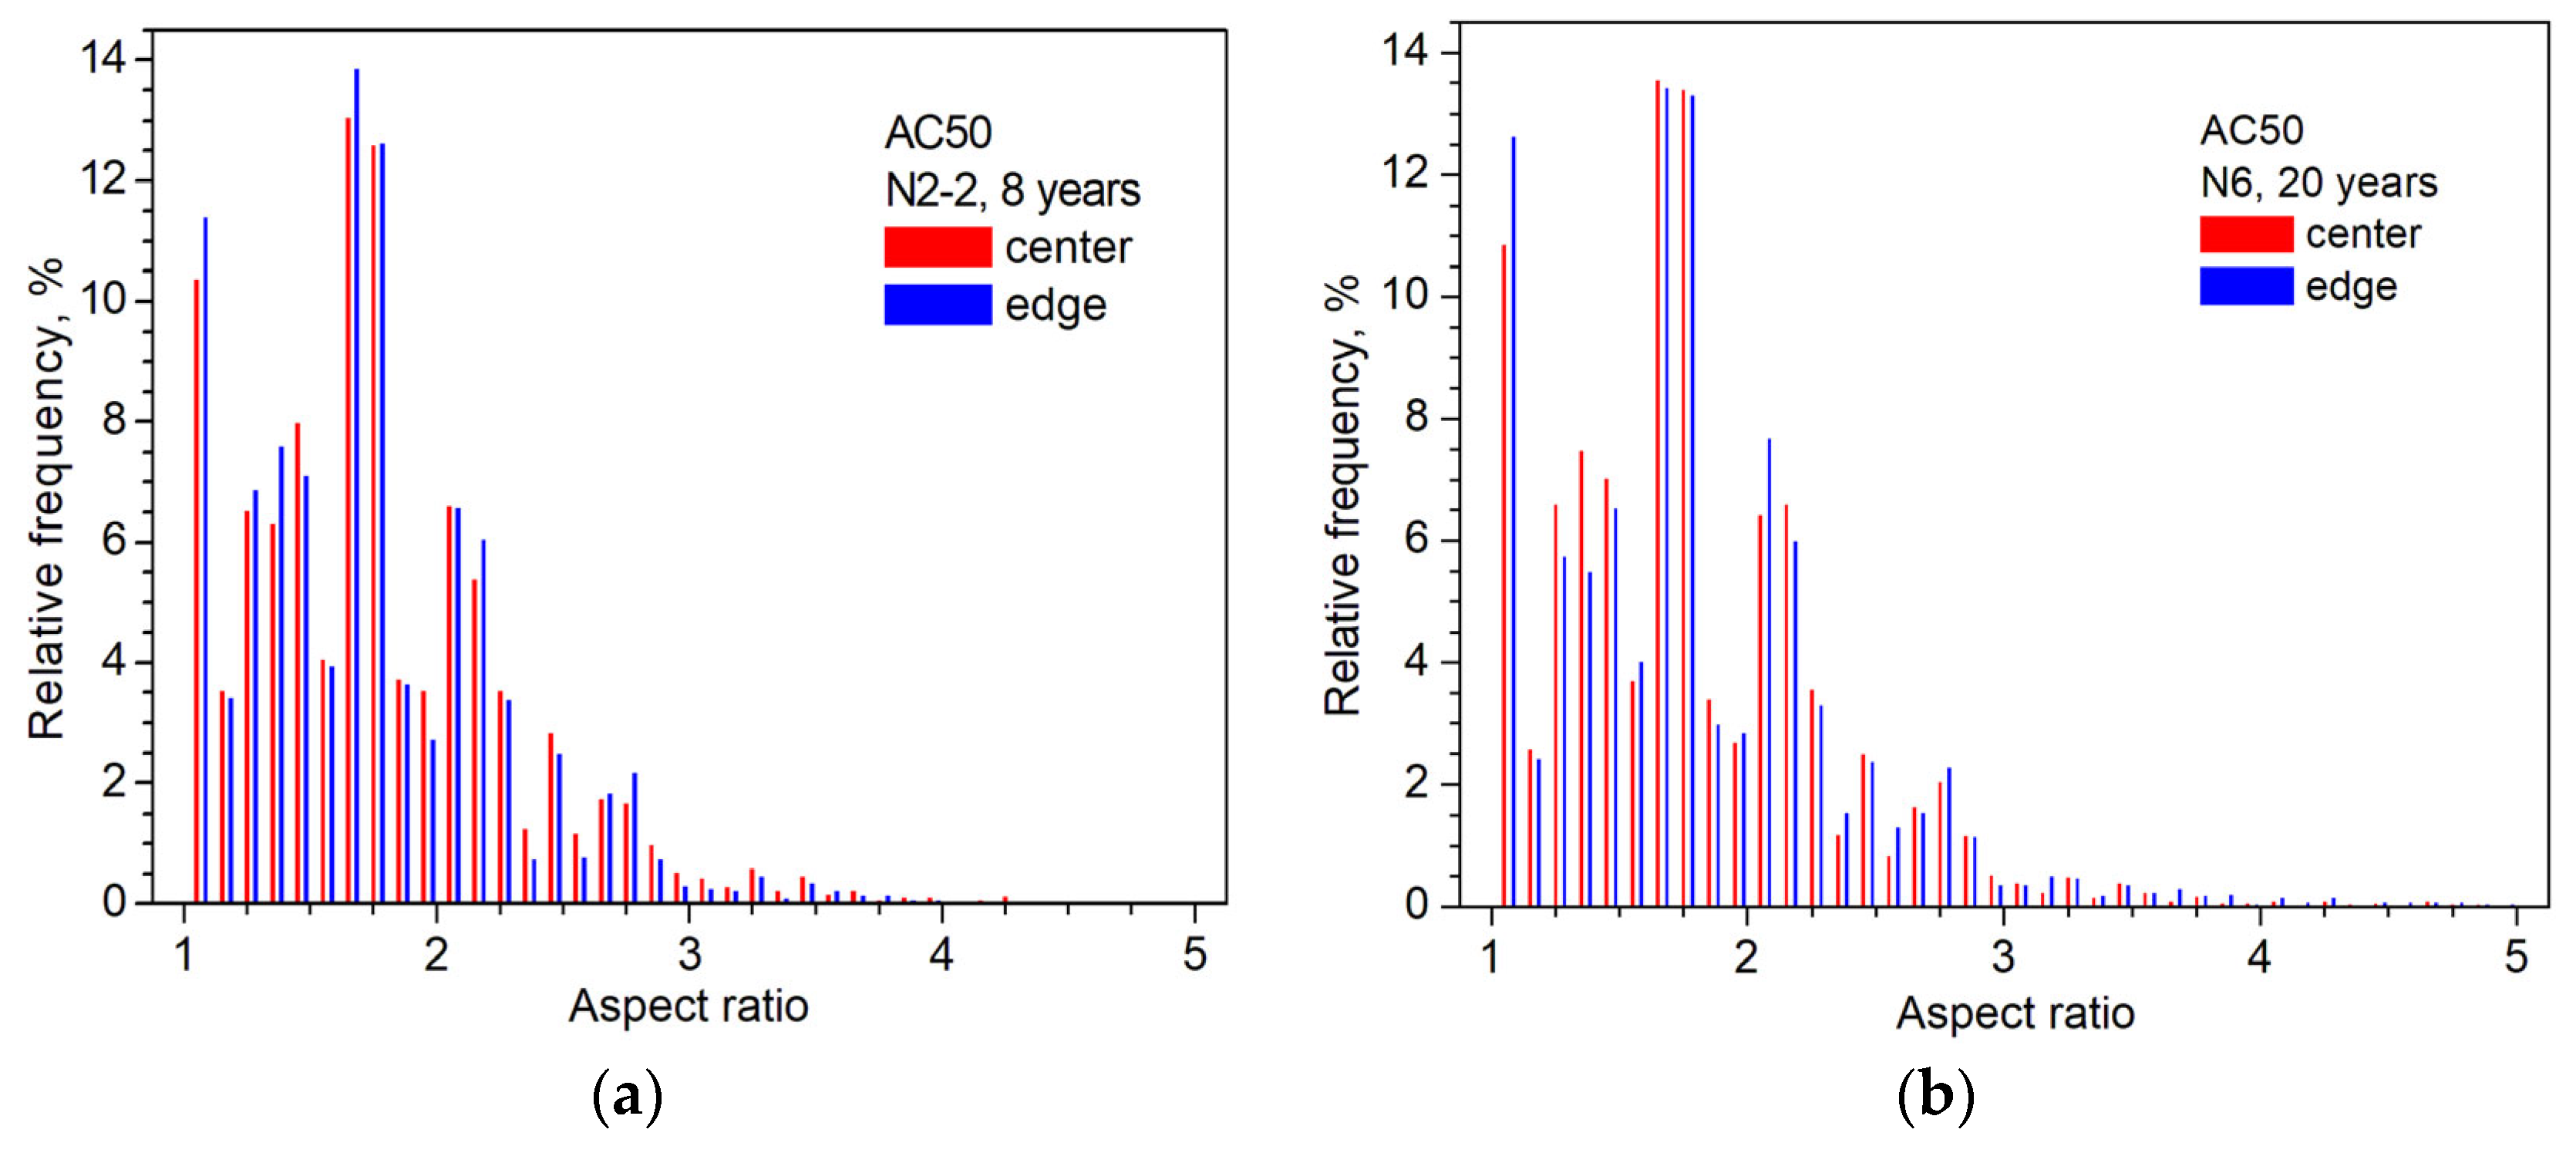
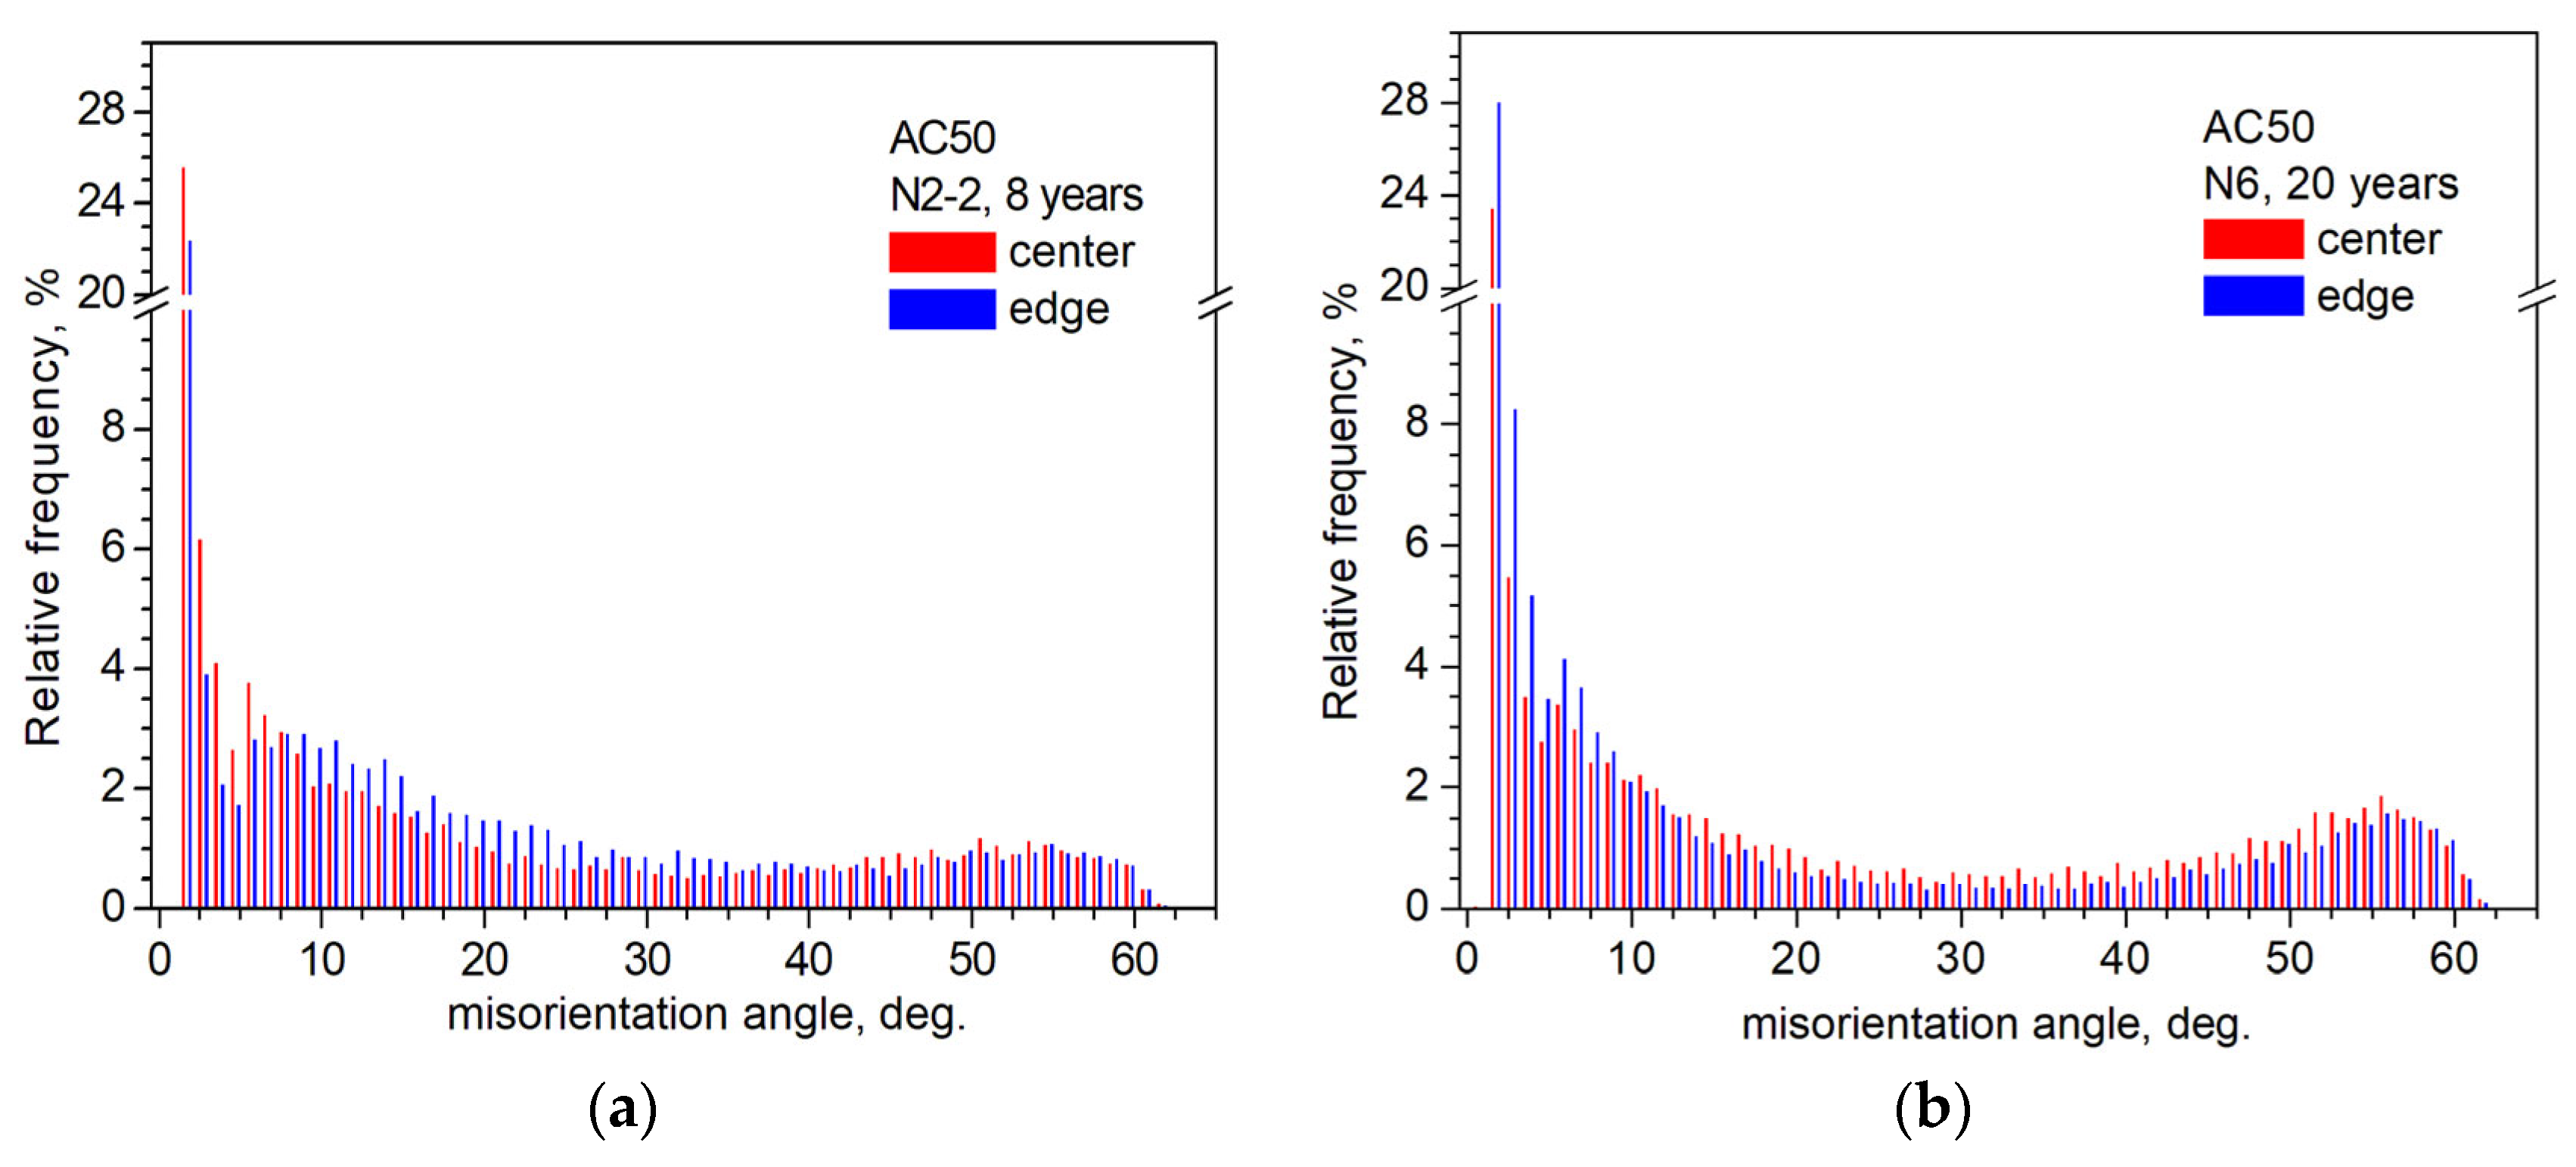
SEM and EDX results for the N8 and N7 outer wires with service lifetimes of 10 and 18 years, respectively, taken from A50-type cables (i.e., without steel cores) as well as for new (0 years of service) wires of an AC50-type cable were discussed earlier in [10,37]. As in the case of A50-type wires, SEM images have shown that the prepared outer-wire cross-sections of AC50-type steel core cables are quite suitable for obtaining the EDX spectra and EBSD mapping. The EDX spectra of cross-sectional surfaces from N2-2 and N6 AC50-type samples with service lives of 8 and 20 years, close to the service lives of wires of A50-type cables mentioned above, are shown in Figure 1. According to the results of the analysis of EDX spectra, the chemical composition of the elements of wire samples of both types of different service life from 0 to 20 years has demonstrated no significant difference and is consistent with the composition of the certificate data (Table 3). As expected, the Al content of ~99 wt% prevails in all samples. The EDX spectra show peaks corresponding to the Fe and Si atoms, which, according to the certificate data (Table 3), are the most abundant among impurity atoms, as well as peaks attributed to O atoms due to Al oxidization [10,37]. The EDX spectra also show the presence of peaks of extraneous elements, namely, Ar as a result of argon ion polishing of the surface of the samples and Ni from the walls of the microscope chamber.

3.2. EBSD Results

Distribution EBSD maps of Euler orientation angles φ1, Φ, and φ2 (correspondingly, angles of intrinsic rotation, nutation, and precession, see Ref. [48] for definition) with superimposed grain boundaries are shown in Figure 2. As grains, regions of the crystal structure were considered the misorientation within which did not exceed 2°. The colors of the grains on the map correspond to a combination of Euler angles that describe the orientation of the crystal lattice in a given grain.
As a result of the analysis of maps of the distribution of Euler orientation angles in the center and at the edge of the studied thin sections of the cross-sections of the AC50-type samples after operation for 8–20 years (N2-2 and 6), we have constructed histograms of the distribution of grains by size (Figure 3), dependences of the area occupied by grains on their size (Figure 4a), grain-aspect-ratio distribution histogram that is ratio of the maximum grain size to the minimum (Figure 5), and distribution of grain boundary misorientation angle (Figure 6). For the non-exploited AC50 sample (N5, 0 years of service life) and the A50 sample N8 after 10 years of operation, the distribution maps of the Euler orientation angles in the center and at the edge and the distribution histograms constructed for them are presented in [10], while the dependence of the area occupied by grains vs. grain size for these A50 type specimens is plotted in Figure 4b. For the central regions of wire cross-sections of A50-type long-service life (up to 62 years) cables, similar EBSD studies were carried out in [37].
One can see from Figure 3a,b that, as in the case of A50-type cables [10], the general nature of the grain size distribution in the center and at the edge of the cross-section of samples of different service life periods does not change, and in all cases, the most frequently occurring grain sizes are of ~2 μm. At the same time, in the entire size range from 0.5 to 6 µm, insignificant differences are observed in the relative frequency of occurrence of grains in the center and near the edge of the samples.
With an increase in the service life of 0 to 18–20 years, the relative area occupied by grains with sizes of ~2 µm changes slightly (within ~±5% of ~26% in N5 wire without operation) in the bulk of AC50 and A50 wires (Figure 4a,b). At the same time, the area occupied by grains with sizes 4–6 µm increases slightly from ~0.5–1% to ~1–2%.
As for the A50-type samples [10,37], the grain aspect ratio distribution histograms in the AC50 type samples (Figure 5a,b) weakly vary depending on the period of operation and position, remaining practically unchanged in the center and at the edges of the cross-sections of the wires and after various periods of operation. This invariance of the aspect ratio shows that the grain shape in the A50- and AC50-type samples is practically the same inside the cables and in their near-surface layers and remains the same during operation.
Recently [37], angle-distribution histograms of grain-boundary misorientation, which were constructed for the bulk regions of A50 wires (centers of cross-sections) with different service lives, have shown that the number of high-angle grain boundaries with misorientation in the range of 50–60° decreases when the service life is long (down to 0.5–0.9% in the sample with a service life of 62 years from 1.5–2.5% in the unexploited sample N5 (0 years)). This decrease is accompanied by an increase in the number of low-angle boundaries with a misorientation angle of less than 15° (up to 1.9–28% in the sample with a service life of 62 years from 1.7–22% for N5 (0 years) wire). It has been suggested in [37] that such a distribution of the misorientation angle of grain boundaries is caused by the alignment of the crystal lattice of grains along one common direction. Meanwhile, at shorter service lives of A50 wires, a similar process of reducing the number of high-angle boundaries with a misorientation in the range of 50–60° is initially observed after 10 years of operation (sample N8, 0.4–0.8%) [37] in comparison with the non-operated cable (sample N5, 1.5–2.5%). With a further increase in the service life to 18 years (A50 sample N7), the number of high-angle boundaries with a misorientation of 50–60° increases again, up to 0.8–1.2%, although not recovering to the value in the N5 wire (0 years) [37]. This growth, respectively, can be associated with the destruction of grain alignment along the general direction.
The grain boundary misorientation angle distribution histograms for the bulk regions (centers of cross-sections) of the outer wires of AC50 cables (Figure 6 for samples with a service life of 8 and 20 years, see also [10] for a non-exploited sample) show an evolution similar to A50-type wires with comparable service lives up to the 18 years described above. Initially, with an increase in the service life from 0 years (sample N5 [10,37]) to 8 years (N2-2), there is a decrease in the number of high-angle boundaries with a misorientation in the range of 50–60°, although somewhat less than in the A50 wire after 10 years of operation (from 1.5–2.5% in sample N5 (service life of 0 years) down to 0.75–1.2% in sample N2-2 (8 years, AC50) and 0.4–0.8% in sample N8 (10 years, A50)), i.e., the grains probably tend to line up along one direction. With a further increase in the service life of AC50-type wires up to 20 years (sample N6), there is an increase in the number of high-angle boundaries with a misorientation of more than 15°, in particular, with a misorientation in the range of 50–60° to 1.1–1.8% (in comparison to 0.8–1.2% in the A50 wire N7 (service life of 18 years)), which presumably indicates an increase in the number of grains with an arbitrary orientation of the crystal lattice.
The grain boundary misorientation angle distribution histograms for near-surface layers of wires (edges of cross sections) of the outer wires of AC50 cables (for samples with a service life of 8 and 20 years, see Figure 6; for an unused sample, see [10]) are similar to the histograms obtained for the centers of cross-sections. At the edges, there is only a slight decrease in the number of high-angle boundaries with a misorientation in the range of 50–60° compared to the centers of the sections (respectively, for the edge and center, 1.0–1.9% and 1.5–2.5% in sample N5 (0 years), 0.75–1.0% and 0.75–1.2% in sample N2-2 (8 years), and 0.95–1.6% and 1.1–1.8% in sample N6 (20 years)), i.e., the misorientation of the grains practically does not change either in the bulk or in the near-surface layers of the AC50 wires. A completely opposite situation is observed in the wires of the A50-type wires. In addition to the drop in high-angle grain boundaries after 10 years of service, as discussed above, the absence of a rigid steel core in A50 cables results in a noticeable difference in histograms obtained from the center and from the edge of the cross-section. At the edge of the section, i.e., in the near-surface layer of the A50 wires, the number of high-angle boundaries with misorientations in the range of 50–60° is noticeably reduced (respectively, ~0.1% and 0.4–0.8% at the edge and in the center of the cross-section of sample N8 (10 years) [10]), which probably indicates that in the near-surface layer of the A50 wires, the crystal lattice of grains tends to align along one common direction more strongly than in the bulk regions of the wires.
Thus, the analysis of EBSD maps obtained from the centers and edges of the cross-sections of the samples (Figure 2 and Refs. [10,37]) shows that the distribution histograms of the misorientation angle of the grain boundaries (Figure 6) are the most sensitive to changes in the microstructure, whereas the grain-size distribution histograms (Figure 3) are less sensitive. Compared with AC50 wires, in wires taken from A50 type cables without a steel core in a layer at a distance of ~150 µm from the surface, there is a tendency towards greater grain alignment. The presence of a steel core in AC50-type cables leads to a significant change in grain misorientation in AC50-type wires compared to A50 wires after a comparable service life of up to 20 years in power lines. Grain misorientation in near-surface layers (near the edge of the wire cross-section) and in the bulk of AC50 wires varies slightly for samples of the same service life, although depending on the duration of operation in a manner similar to the A50-type wires (initially, there is a tendency to align the crystal lattices of grains with a service life of 8 to 10 years, with an increase in the duration of operation up to 18–20 years, the arbitrariness of grain orientation increases). In the wires of both types of cables, the aspect ratios of grains in near-surface layers and in the bulk of the wires practically do not change (Figure 5), indicating the invariance of the grain shape in both regions of the samples.

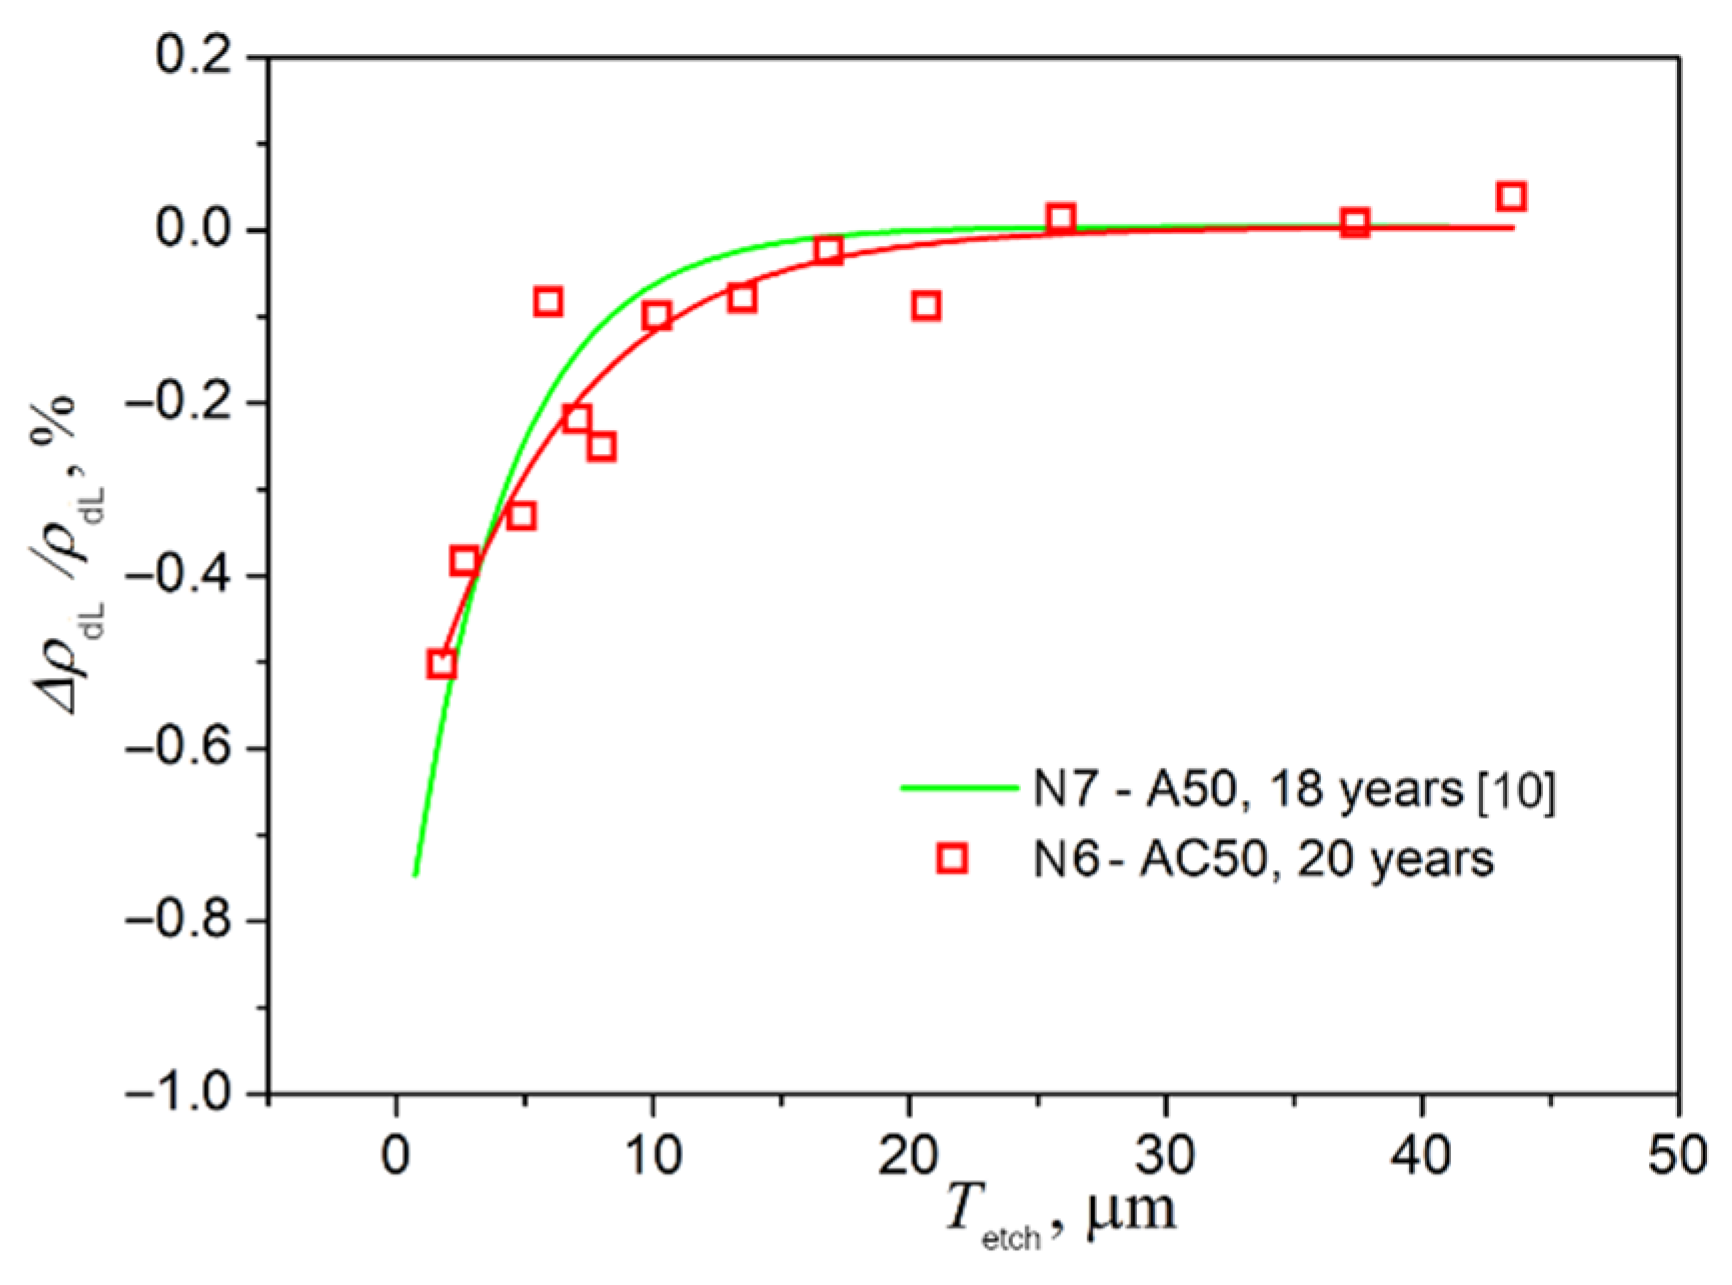
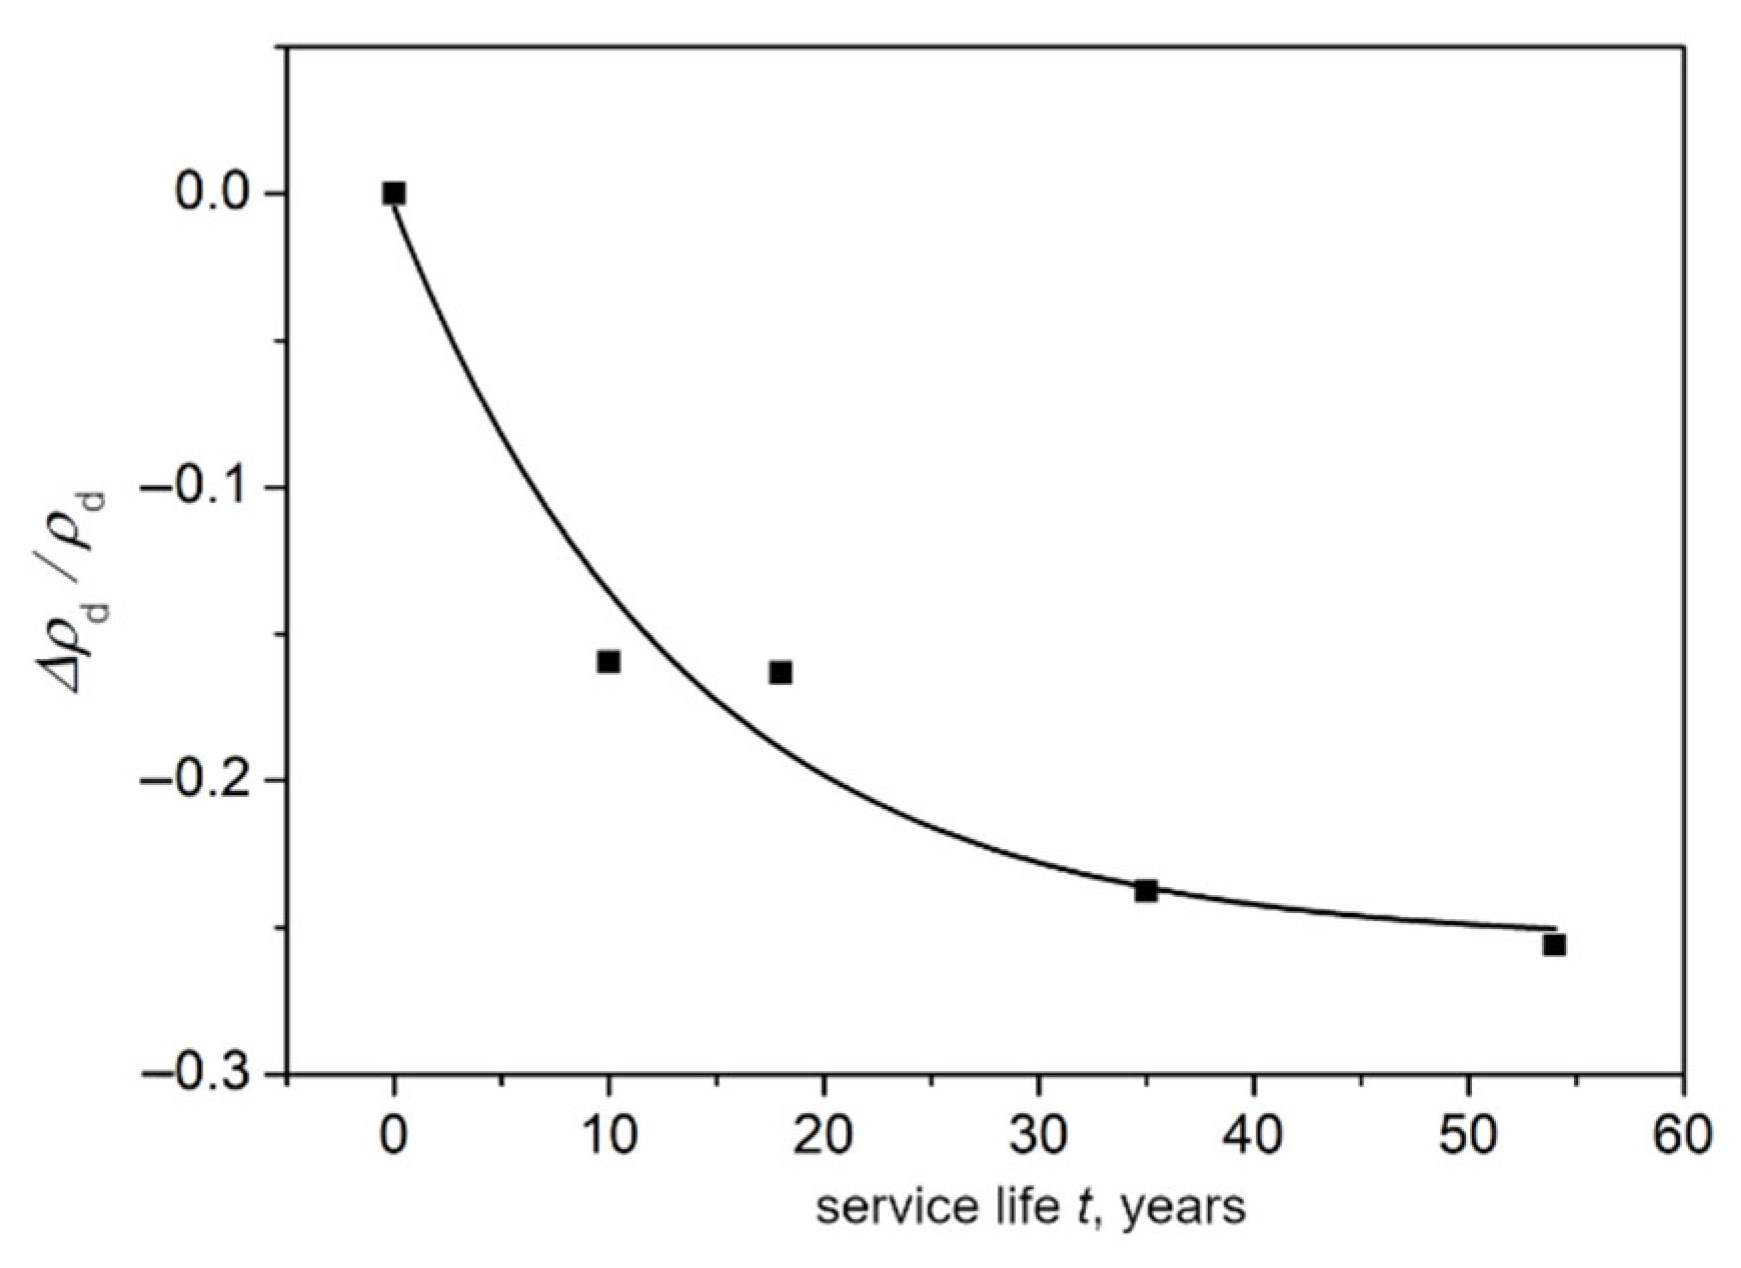
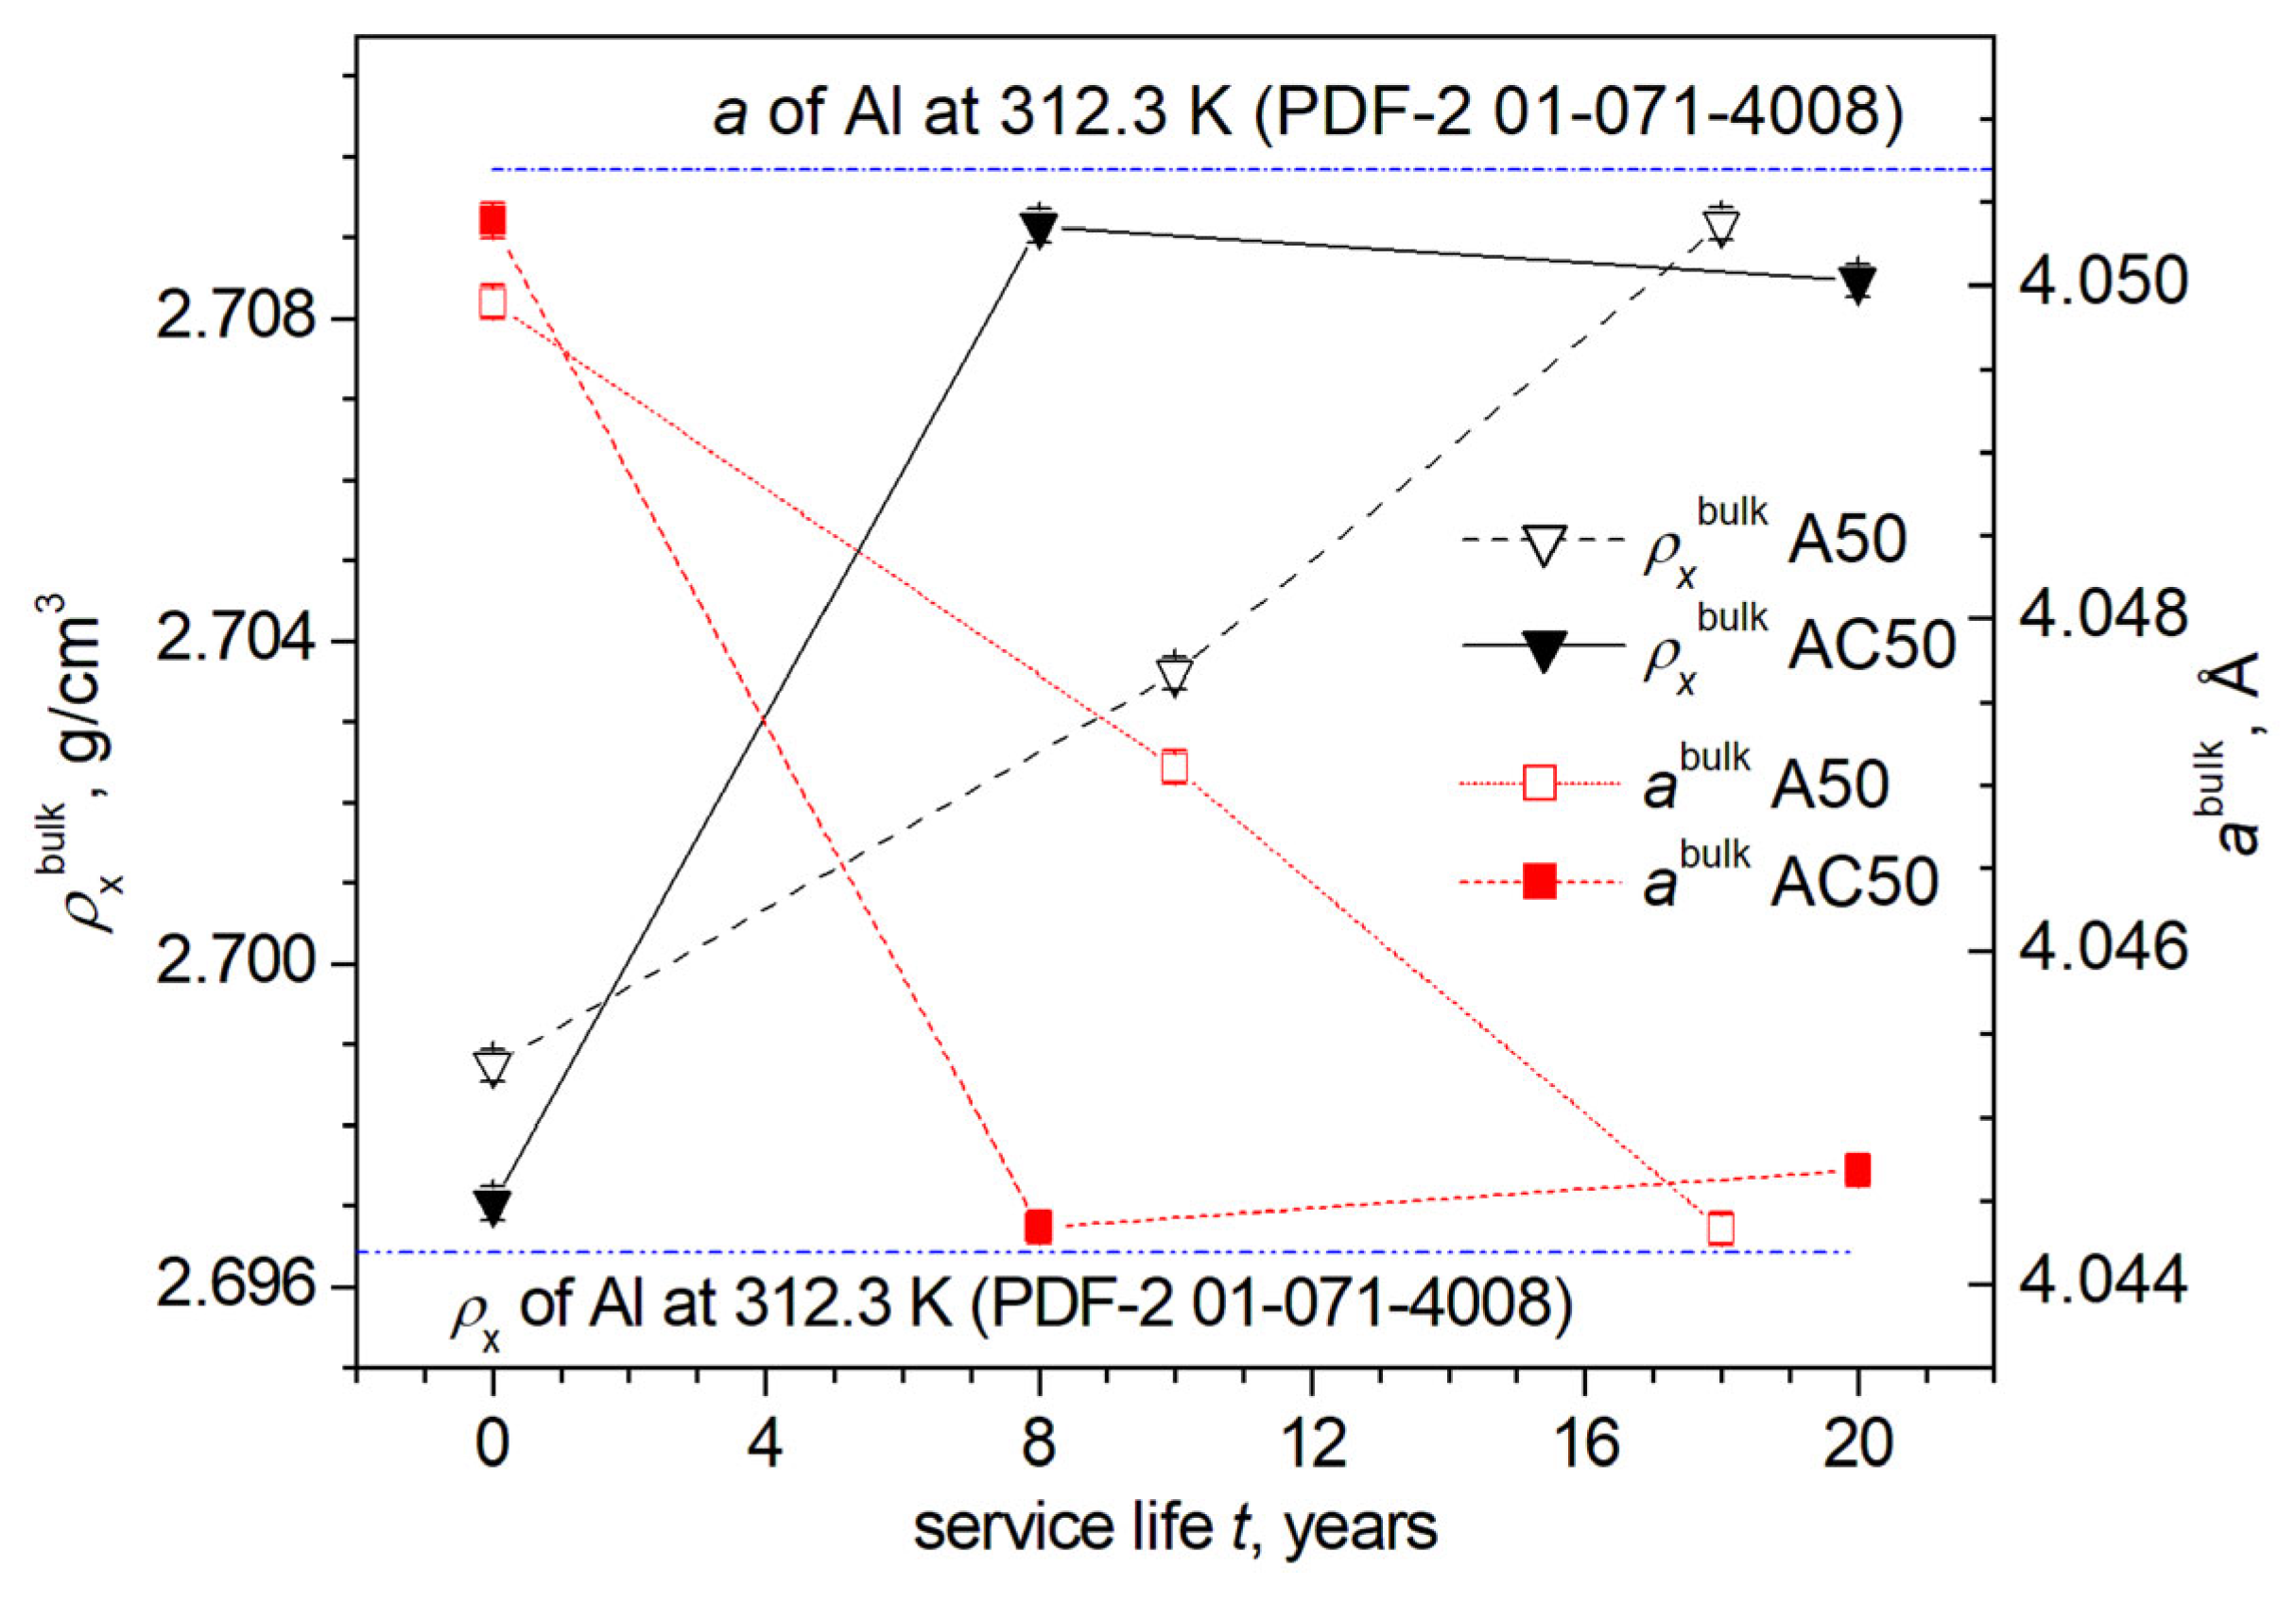
3.3. Results of Densitometric Measurements

Systematic determination of the density ρd of wires from used A50- and AC50-type cables of approximately the same service life, carried out by densitometry, has shown that the density of the aluminum part of the AC50 cable is somewhat higher than that of the A50 one, despite the fact that the service life of AC50 wires is somewhat longer. For instance, the integral density ρd of aluminum wire of sample N6 (AC50) is 0.05% higher than that of N7 (A50), with a service life of 20 and 18 years, respectively.
To elucidate the possible reasons for this difference, we determined the density ρdL of the near-surface layer of the samples under study (see Formula (2)). Figure 7 shows examples of such distributions of the true density defect (cf. Formula (3), in %) over the cross-section for the studied samples of A50 wires (from [10]) and for AC50 ones after 18 and 20 years of operation, respectively, where Tetch is the thickness of the removed layer, determined by Formula (1), and ΔρdL/ρdL is the value of the defect in the density of the near-surface layer relative to the density of the entire cross-section of the wire. As follows from the analysis of dependences, the absolute value of the density defect decreases as much as the near-surface layer is removed, i.e., the deviation of the integral density ρdL of the surface layer decreases with respect to the density in the bulk of the wire. The main change in the density defect in wires of both types is observed in a relatively thin layer about 10 μm thick, that is, the lowest value of the layer density is observed in a narrow near-surface layer. Such a change in density indicates that defects of a void nature (nano and micropores, microcracks) are concentrated just in this narrow near-surface layer. After the removal of this layer (~10 μm) in both types of wires, an insignificant decrease in the absolute value of ΔρdL/ρdL continues until a layer of ~30 μm is removed from the surface.
Thus, within the statistical spread of the experimental values ΔρdL/ρdL, both types of wires show the presence of two characteristic values of the thickness of near-surface defect layers (NSDLs), in which there appears to be a noticeable decrease in density compared to the bulk of the wires. In narrow near-surface layers less than ~10 μm thick, the density is the lowest due to the high concentration of void defects and demonstrates the greatest changes with distance from the surface in depth, and at depths from the surface of ~10 to ~30 μm, it weakly increases until stabilization, apparently due to the reduction in the number of defects. It is also worth noting that the absolute value of the density defect of the near-surface layer in wires from cables with a steel core (AC50) is somewhat less (by ~0.1–0.2%) than for A50 wires, and, as follows from Figure 7, this difference is most noticeable in a narrow near-surface layer ~5–10 μm thick. The smaller absolute value of the NSDL-density defect in AC50 wires probably reflects a smaller number of void defects in these wires due to the softening effect of the steel core.
Additionally, the densitometry method was used to study the relative change in the integral density (defect Δρd/ρd of the integral density) of A50 samples in the range from 0 to 54 years (Figure 8). The values of the integral density Δρd were determined for the wires after 0, 8, 18, 35, and 54 years of operation (see Table 2 for sample numbers). It has been established that the most dramatic change in the integral density ρdL is observed in the range from 0 to 20 years of operation. An increase in service life of more than 20 years also leads to a further slight decrease in the density of the wire material. However, when analyzing the data, it should also be taken into account that, as was shown in [10,37], a noticeable amount of Al2O3 oxides are formed on the surface of the wires, the density of which (~3.7 g/cm3) is significantly higher than the density of aluminum (~2.7 g/cm3). That is why it can be assumed that the true absolute value of the integral defect of aluminum wire without the aluminum oxide contribution is greater due to the formation of void microdefects, i.e., with a service life of more than 20 years, the density fitting curve without taking into account the contribution of aluminum oxides will go lower in the graph of Figure 8.

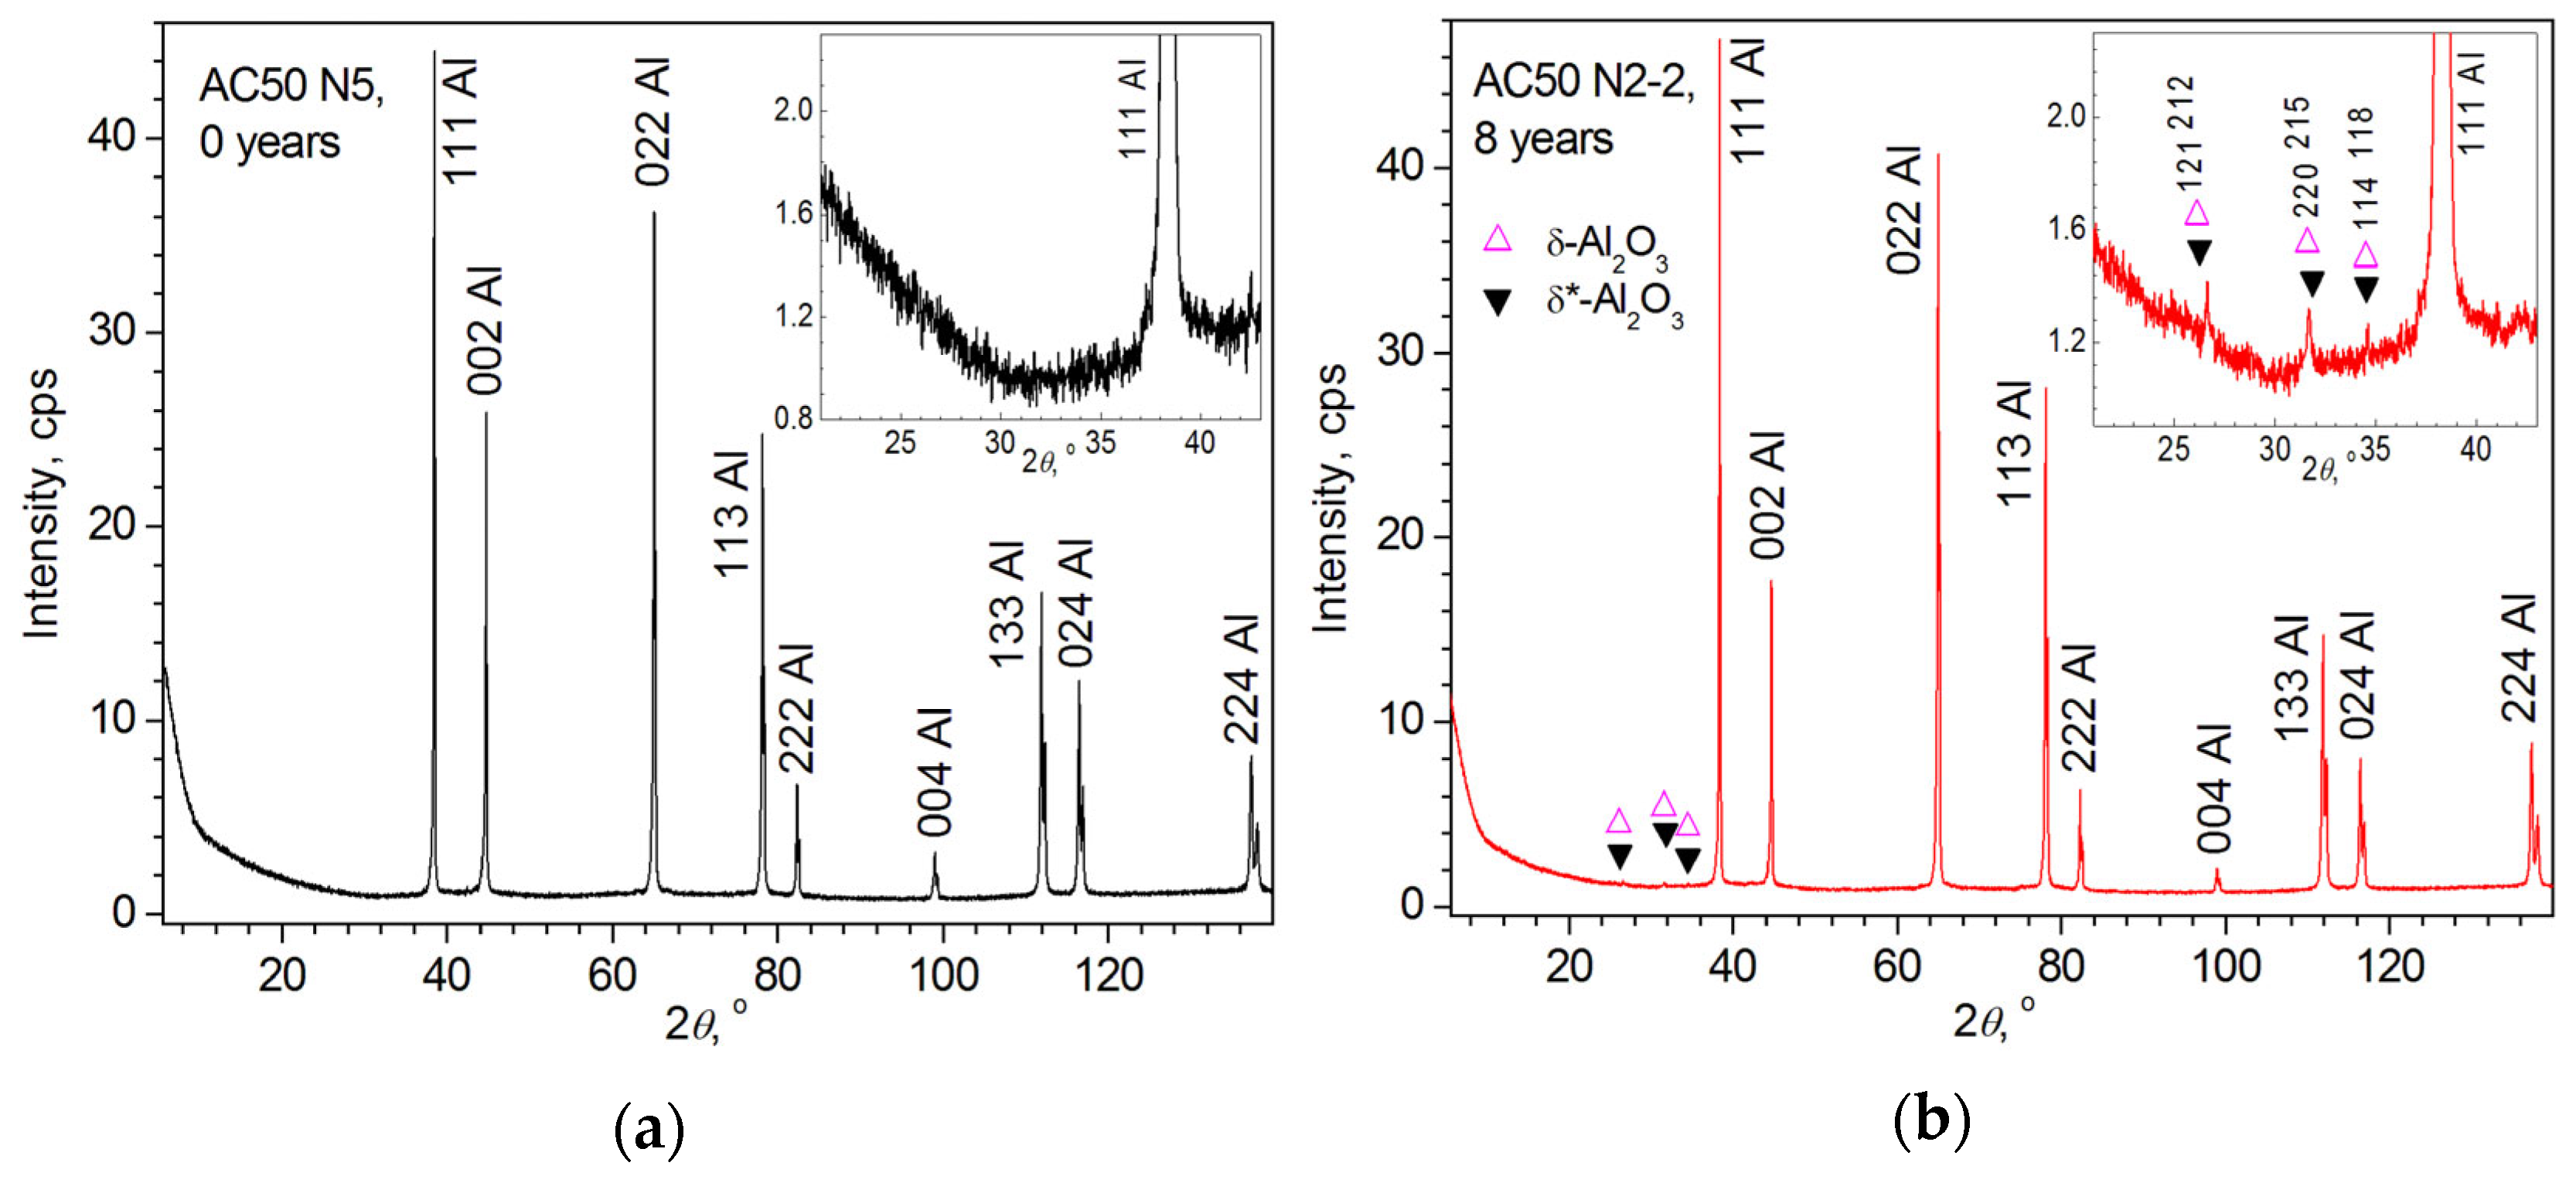
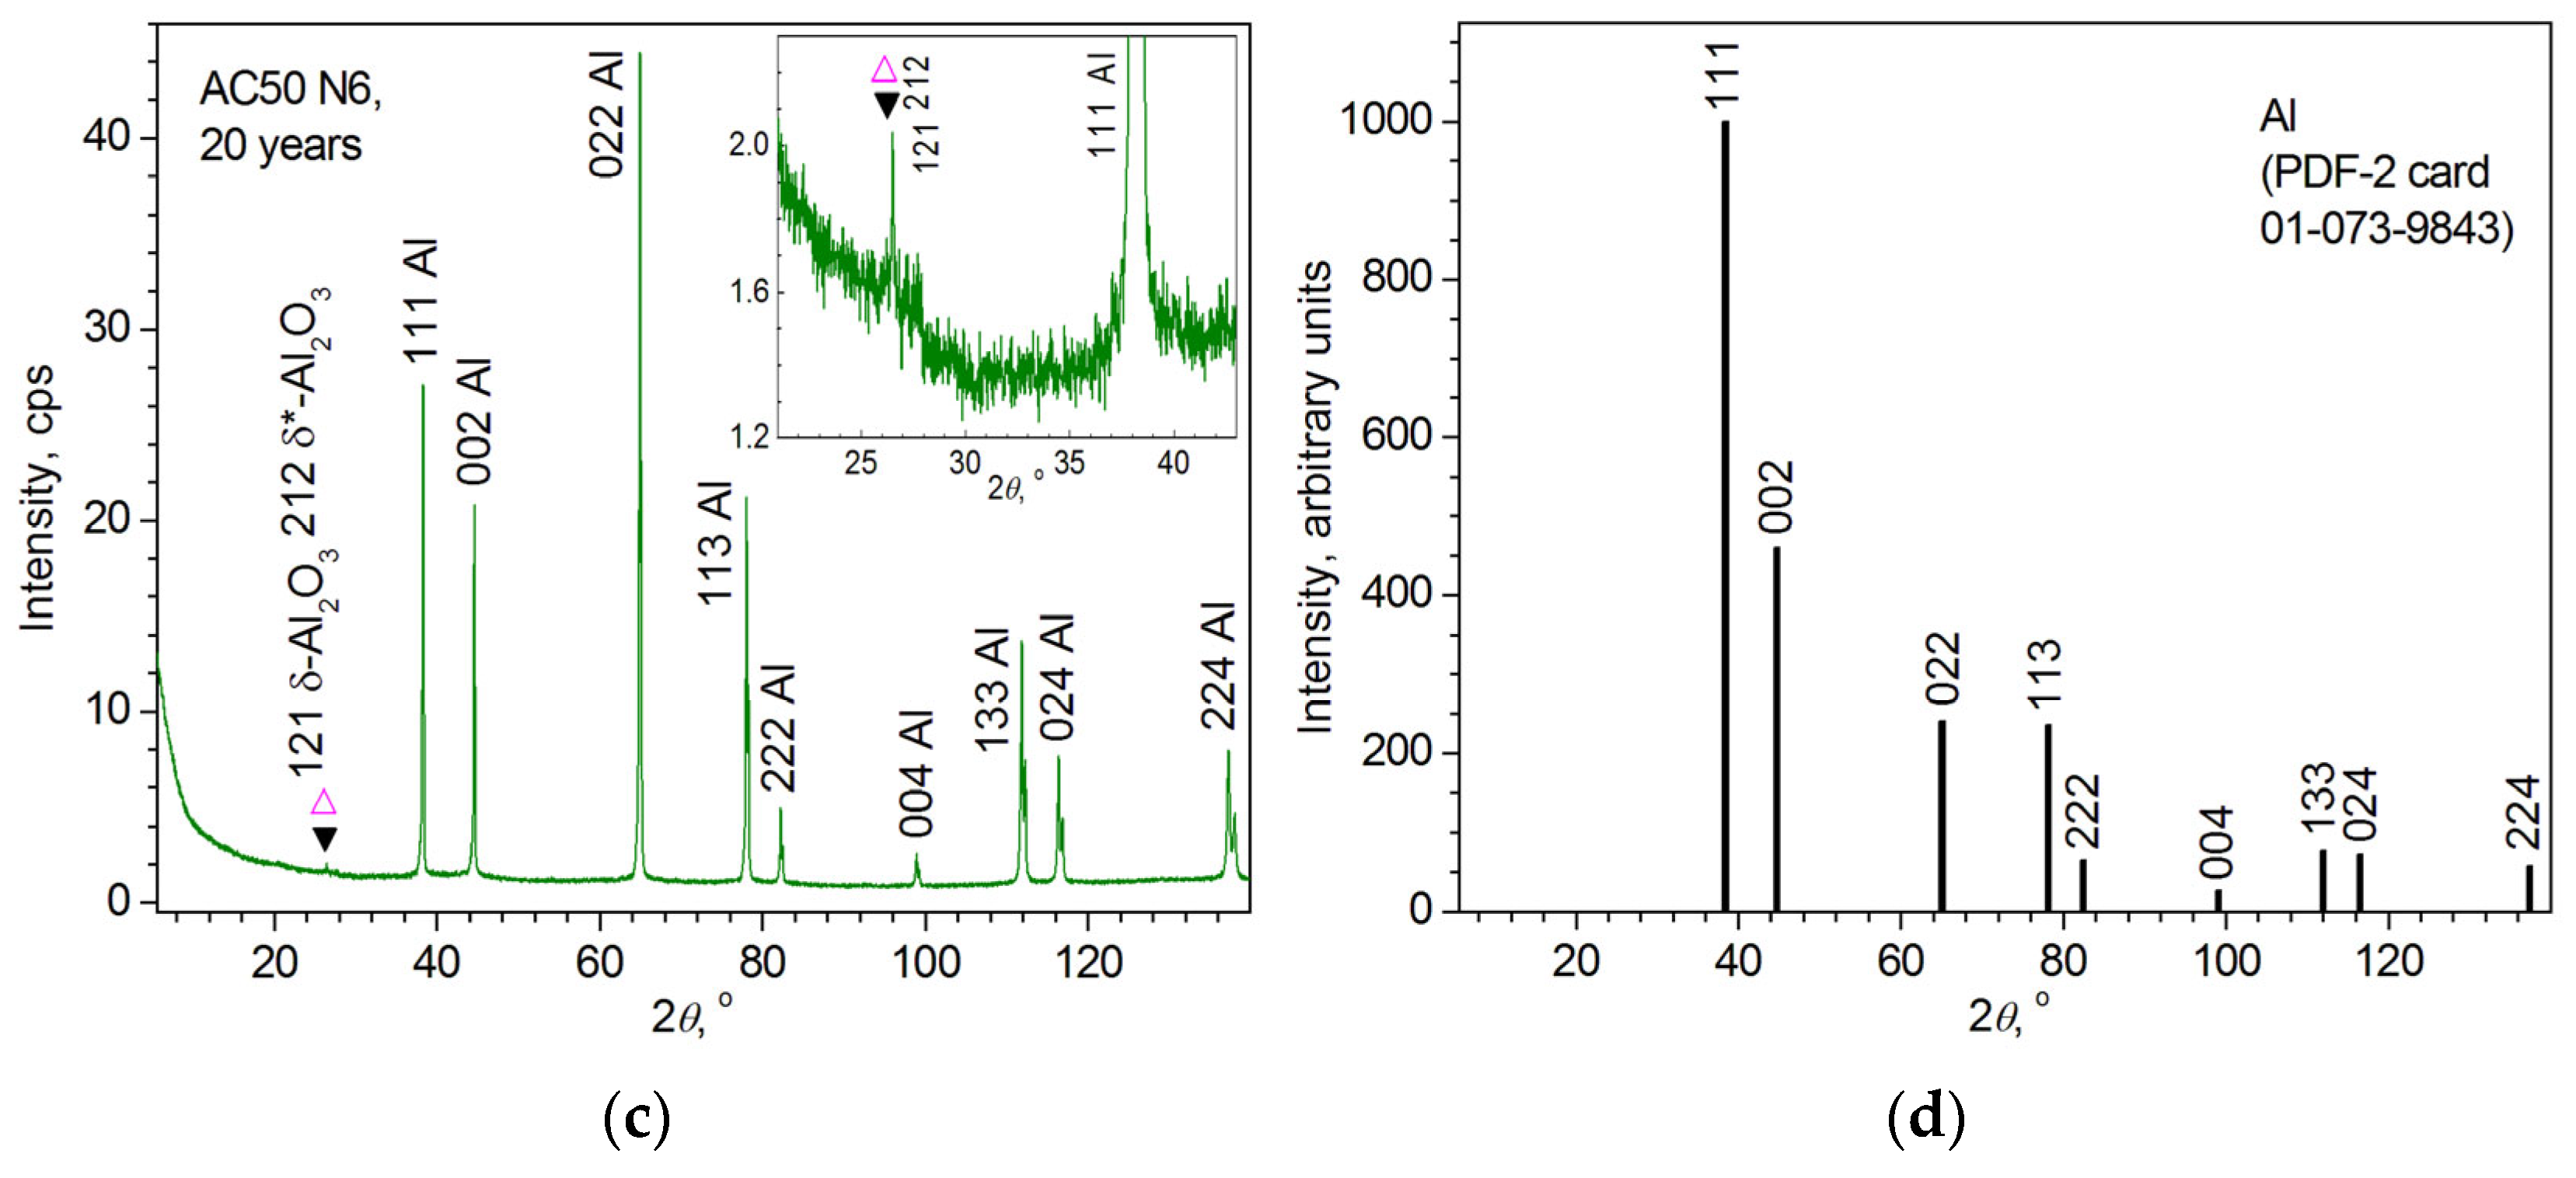
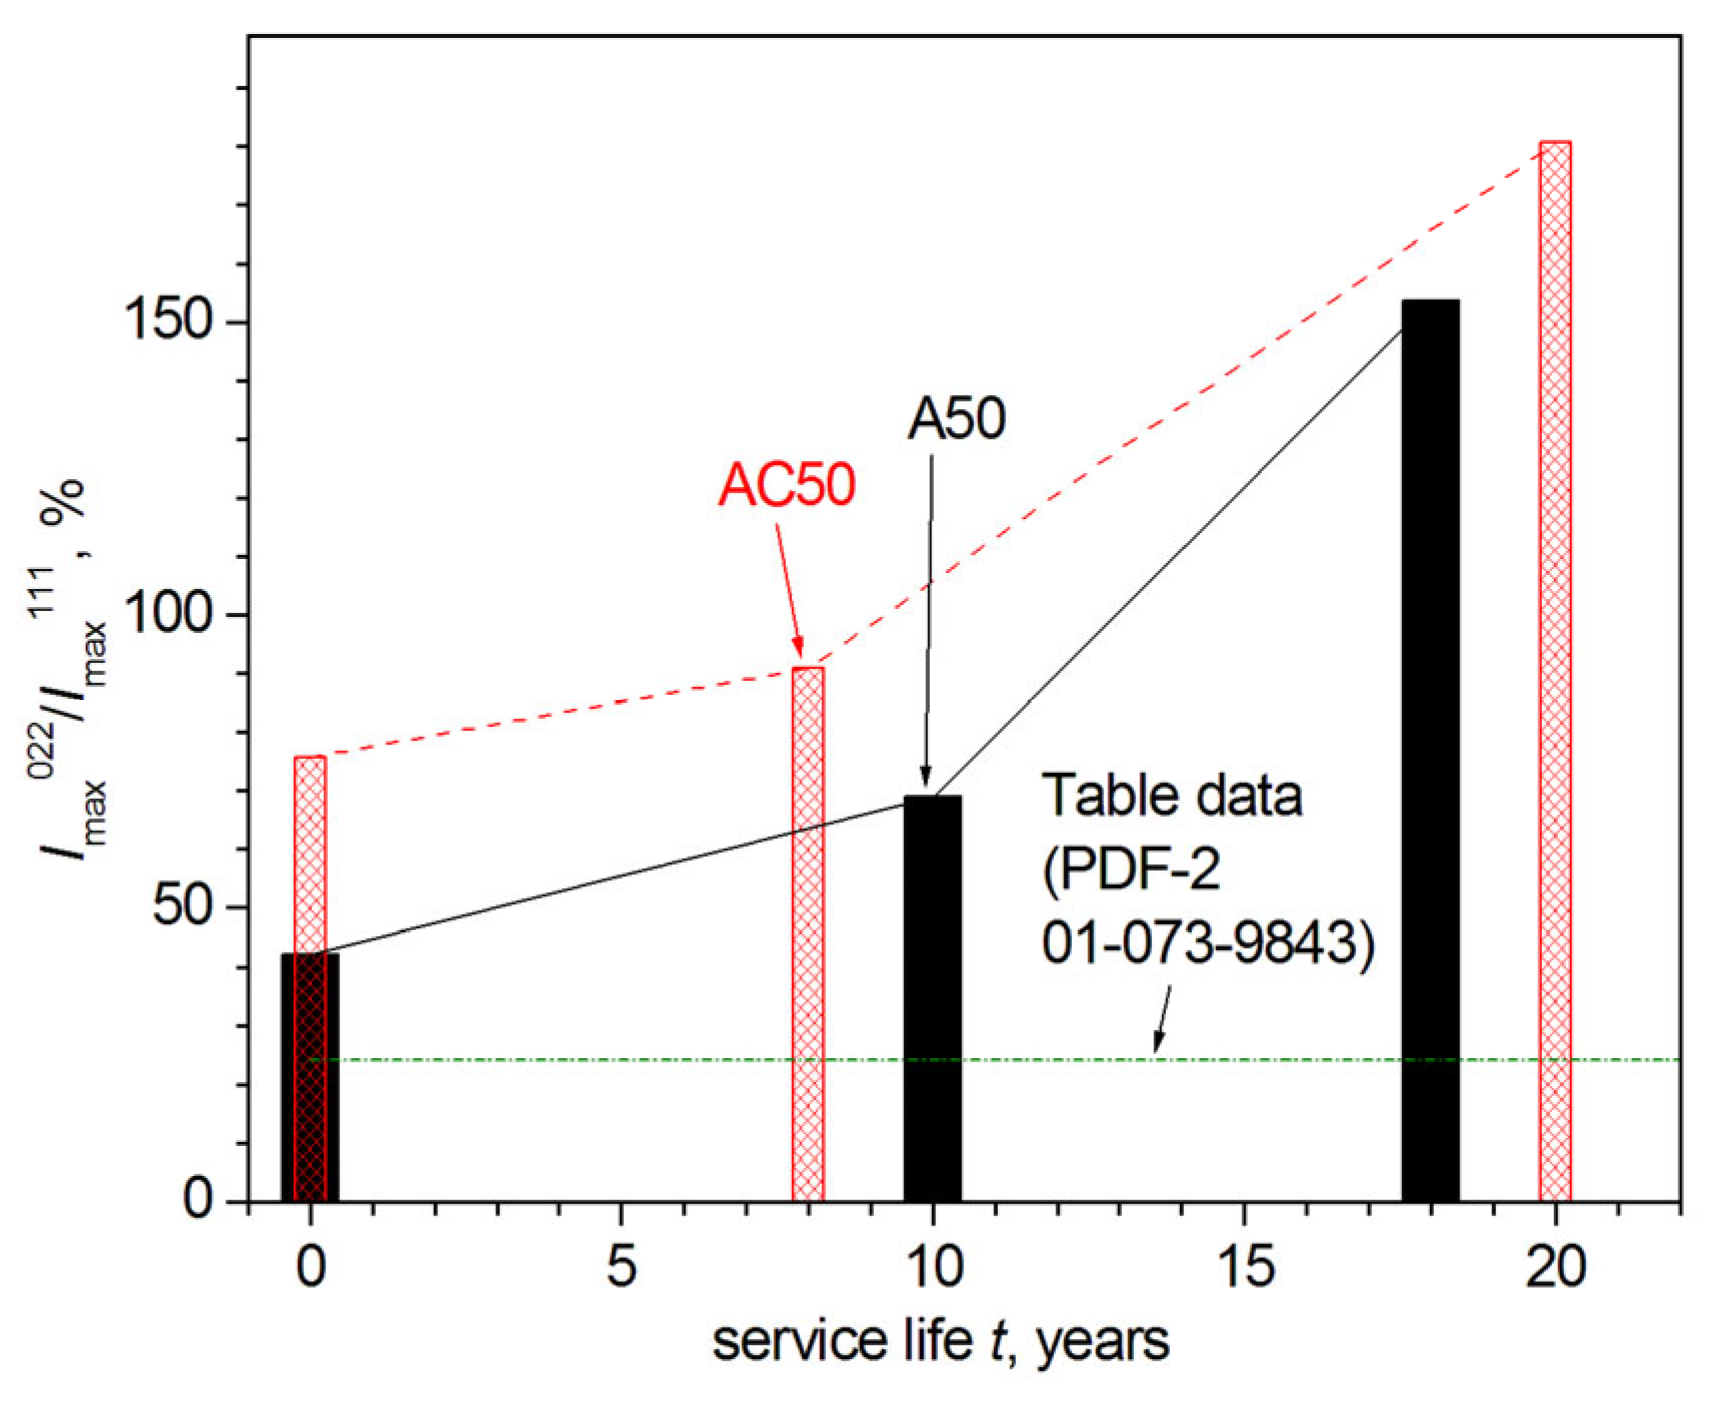
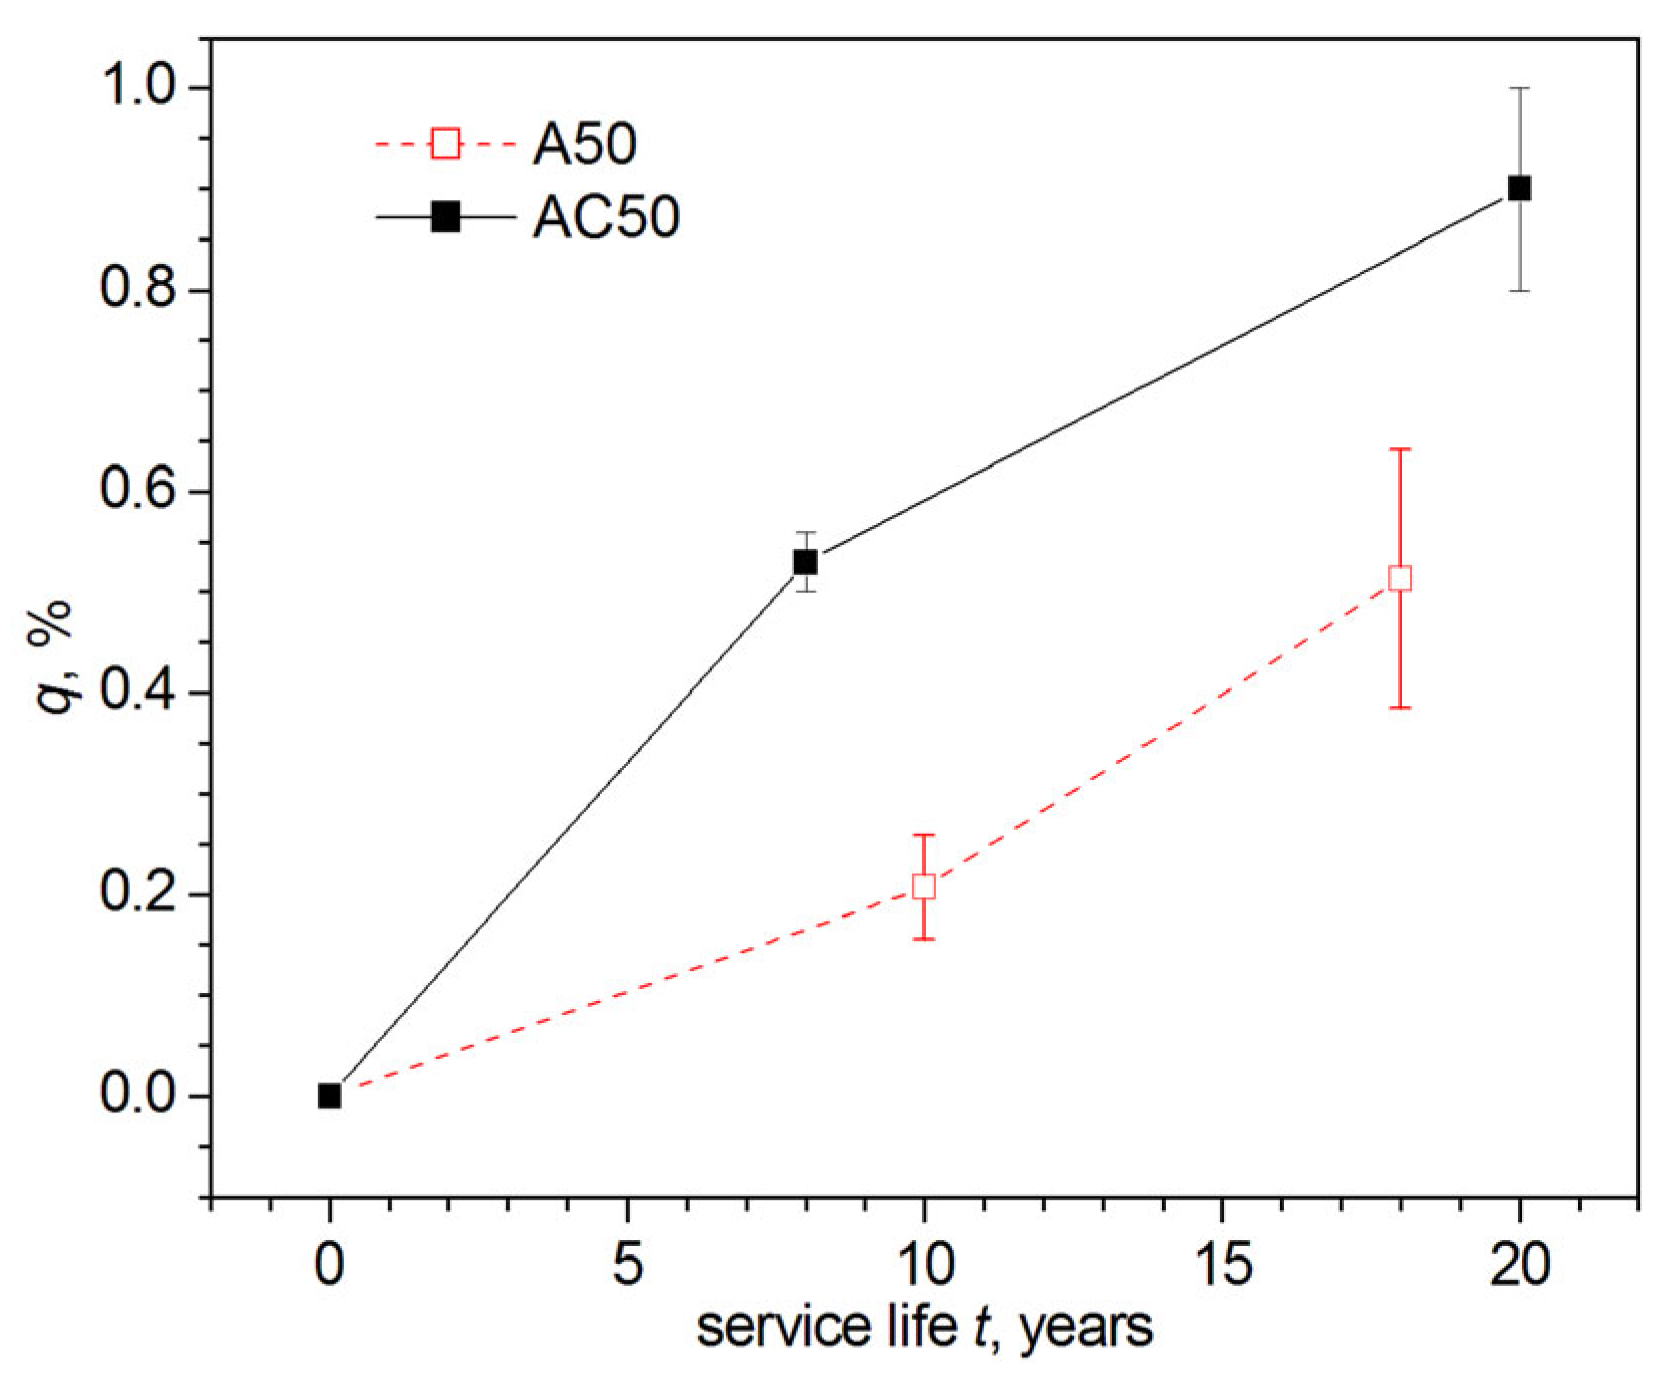
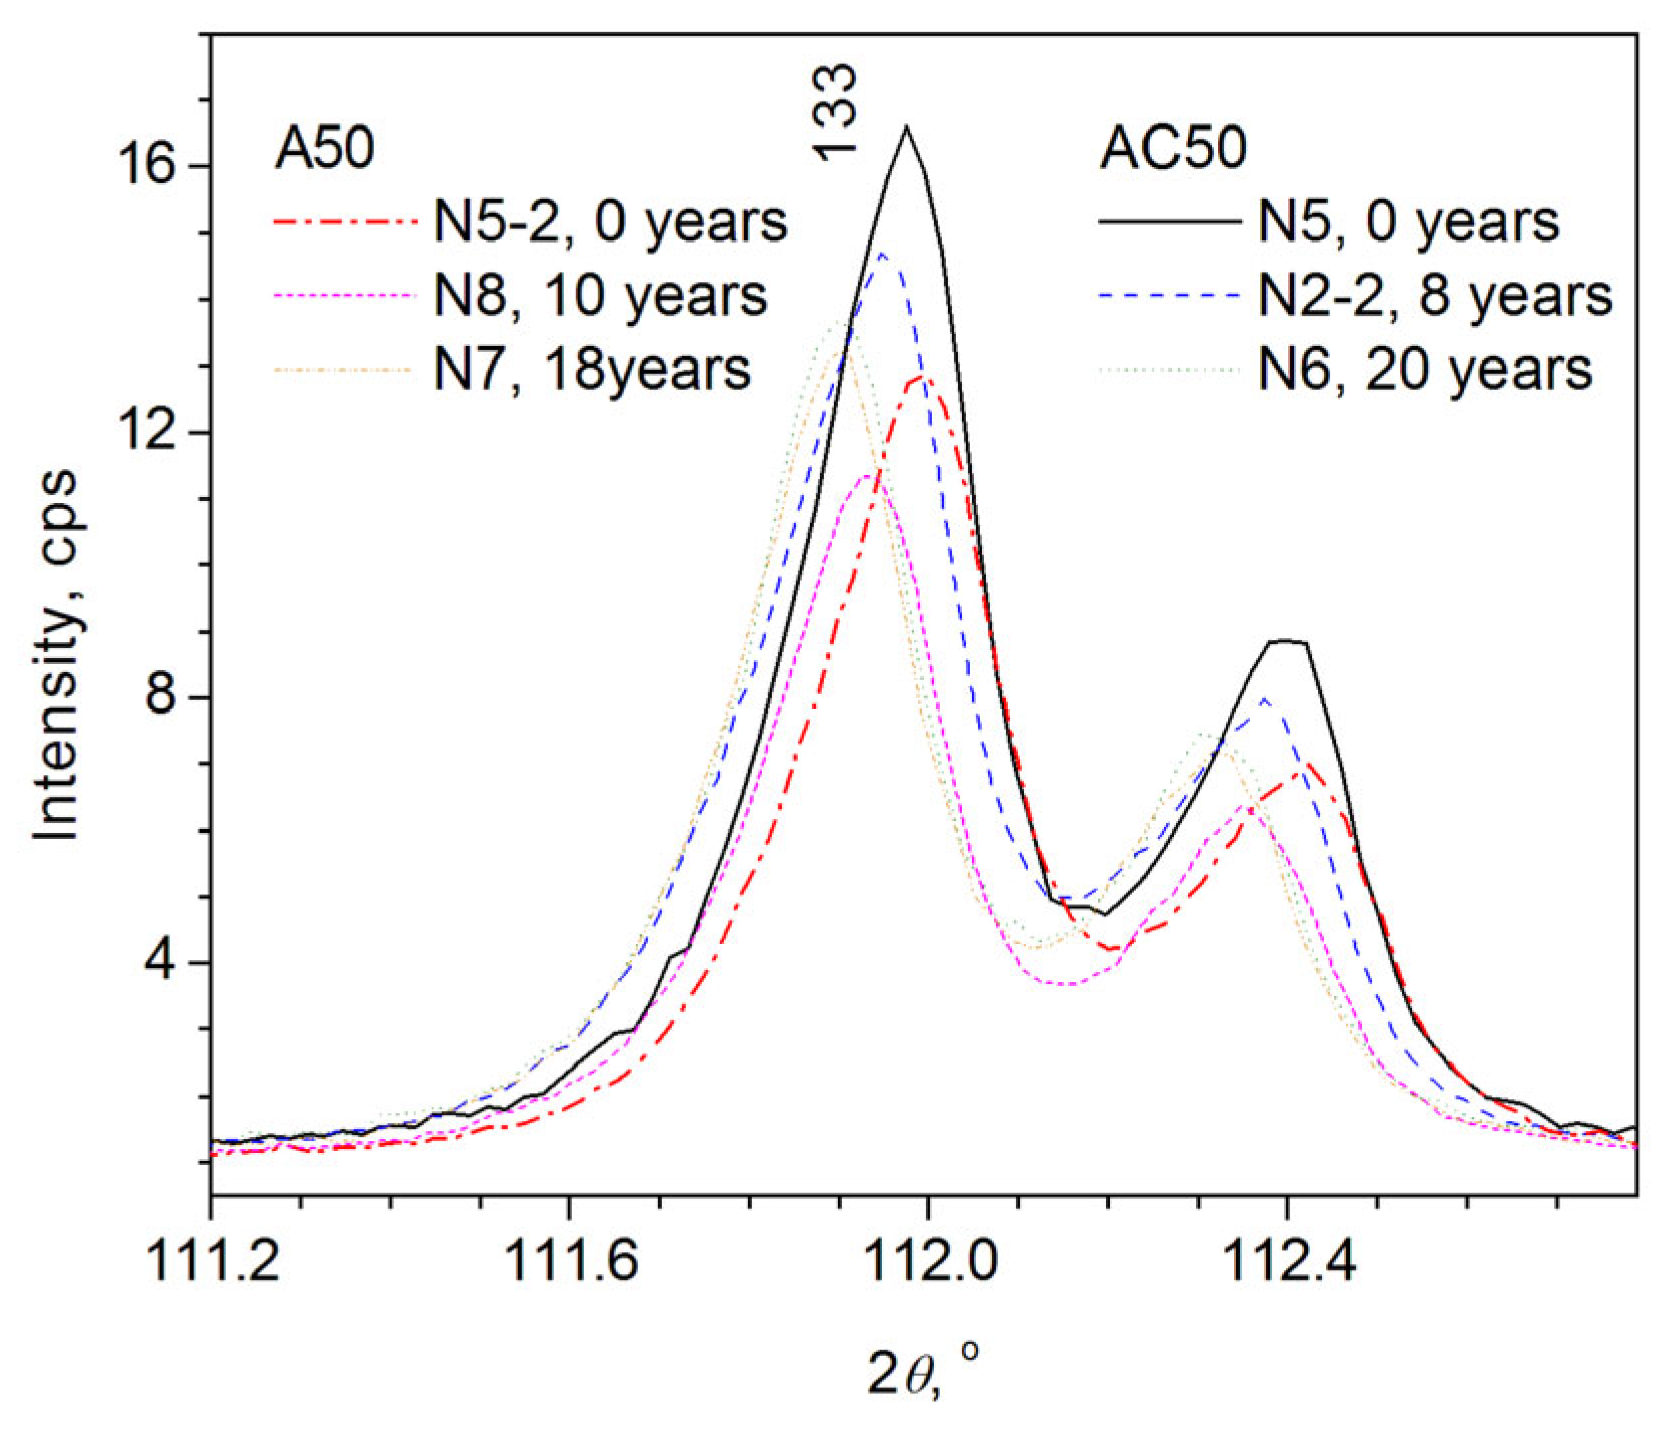
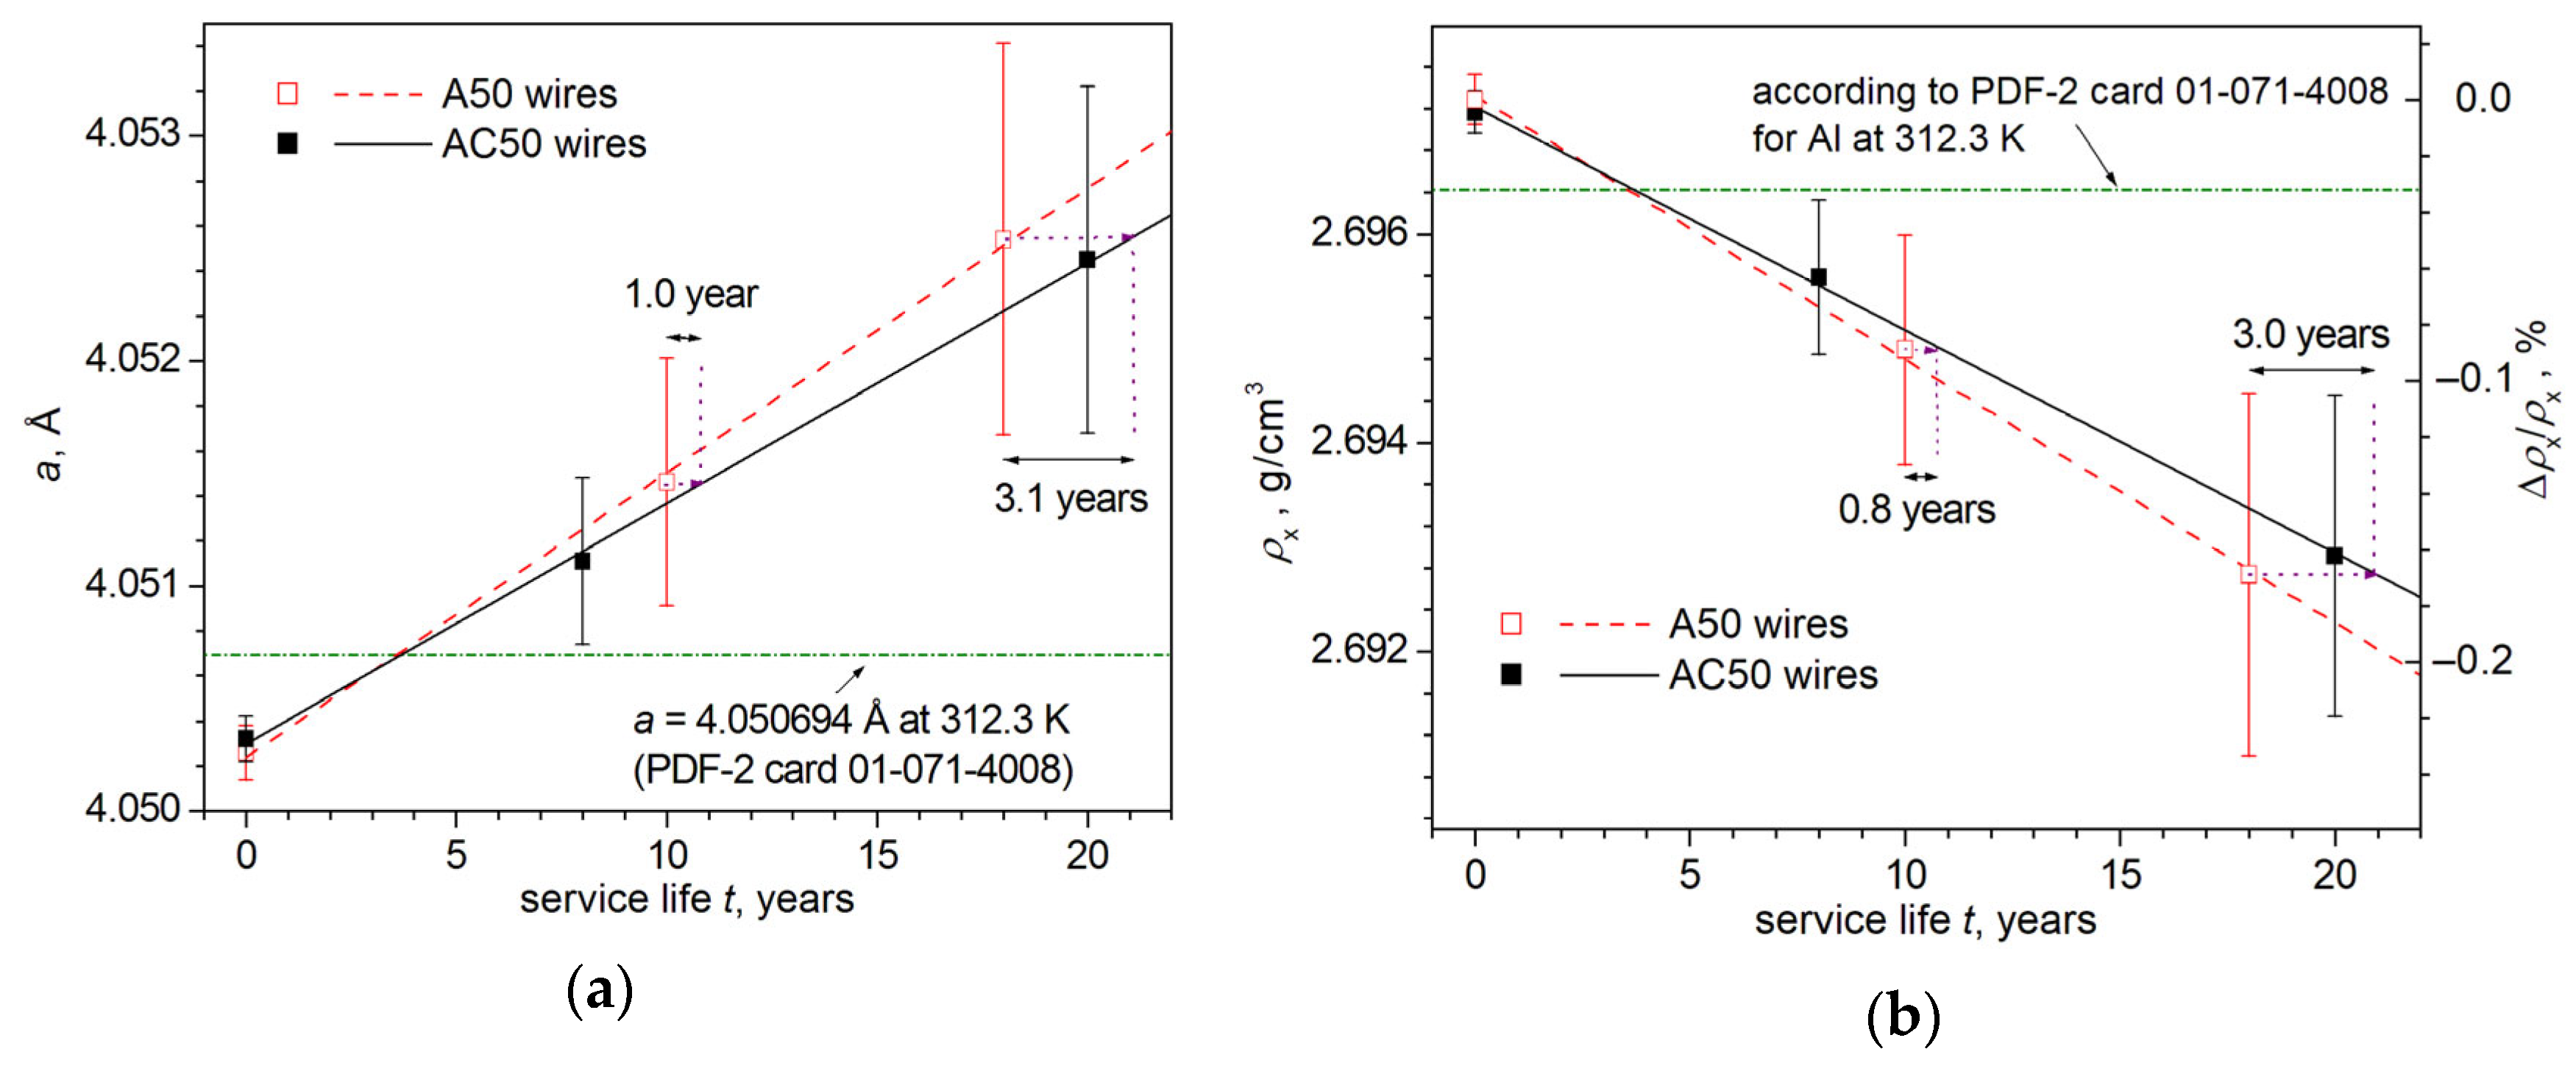
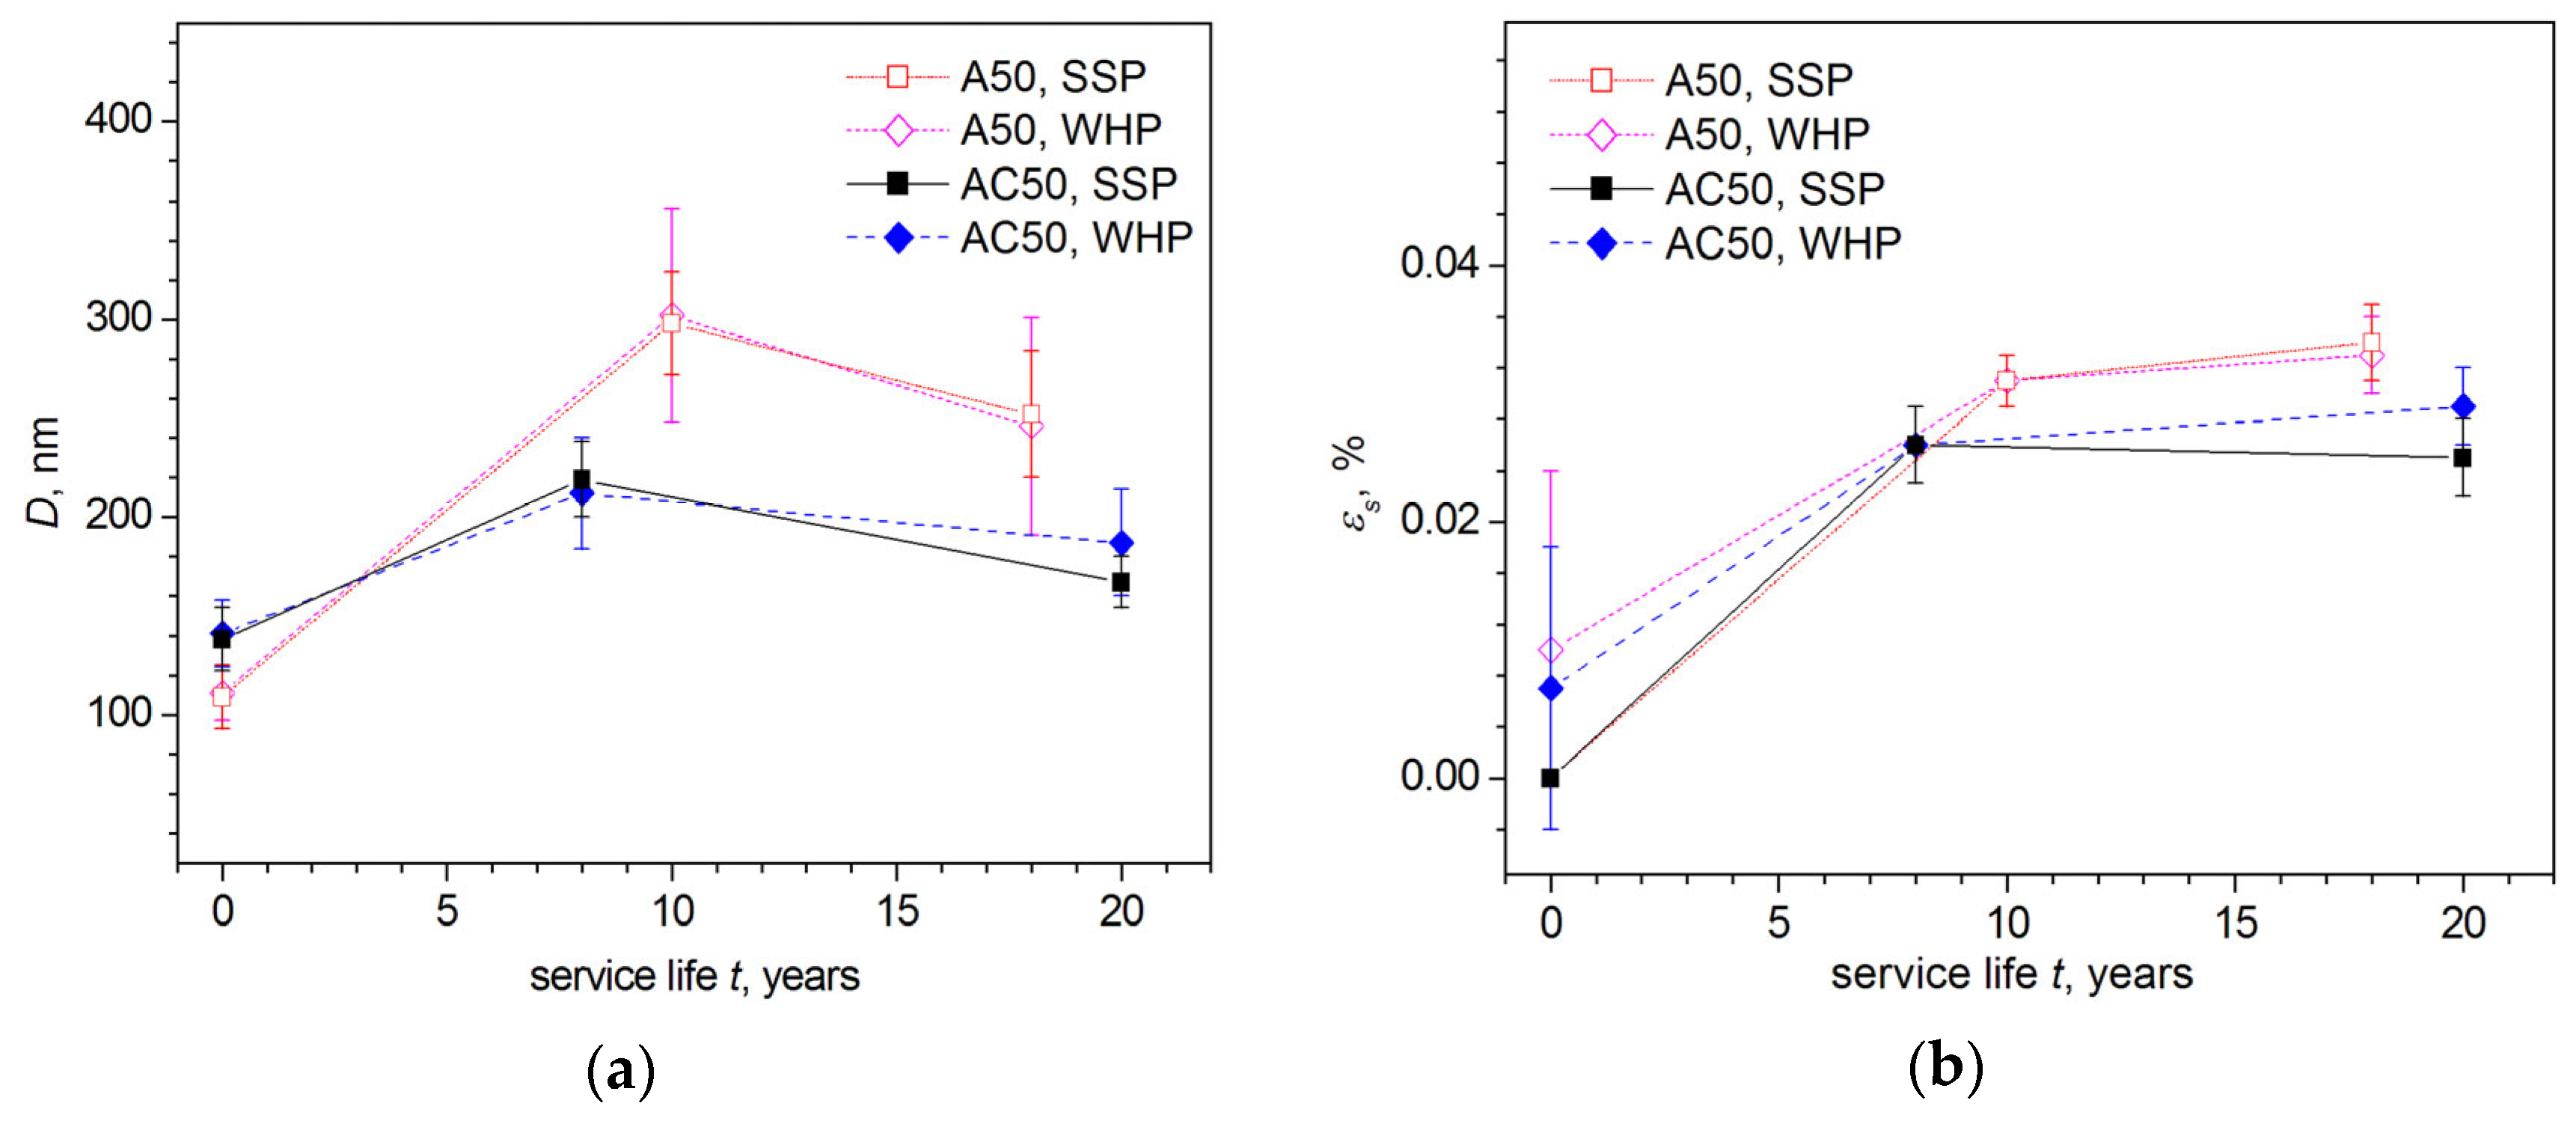
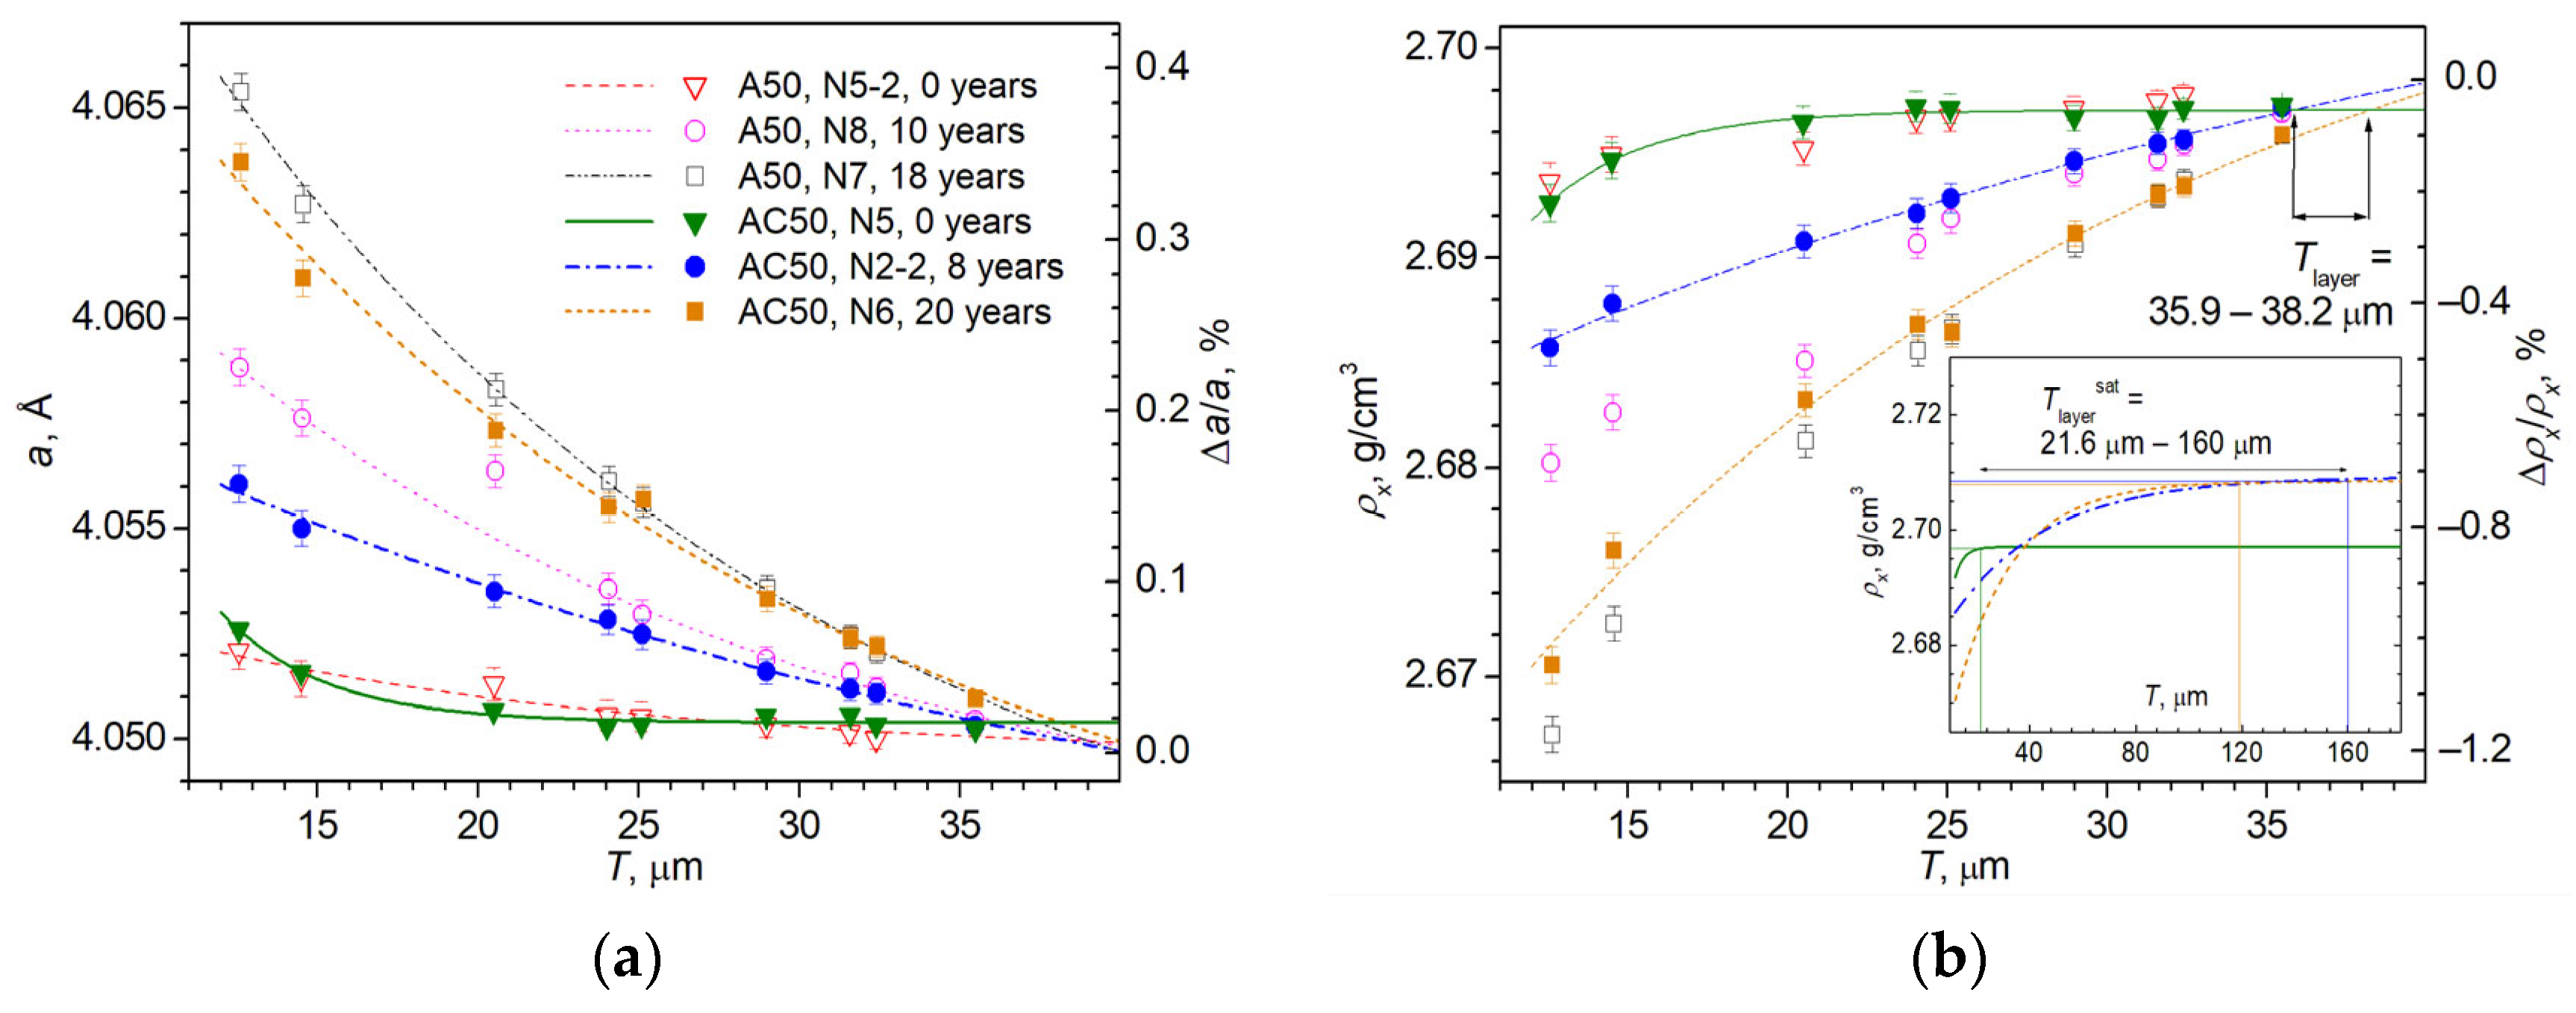
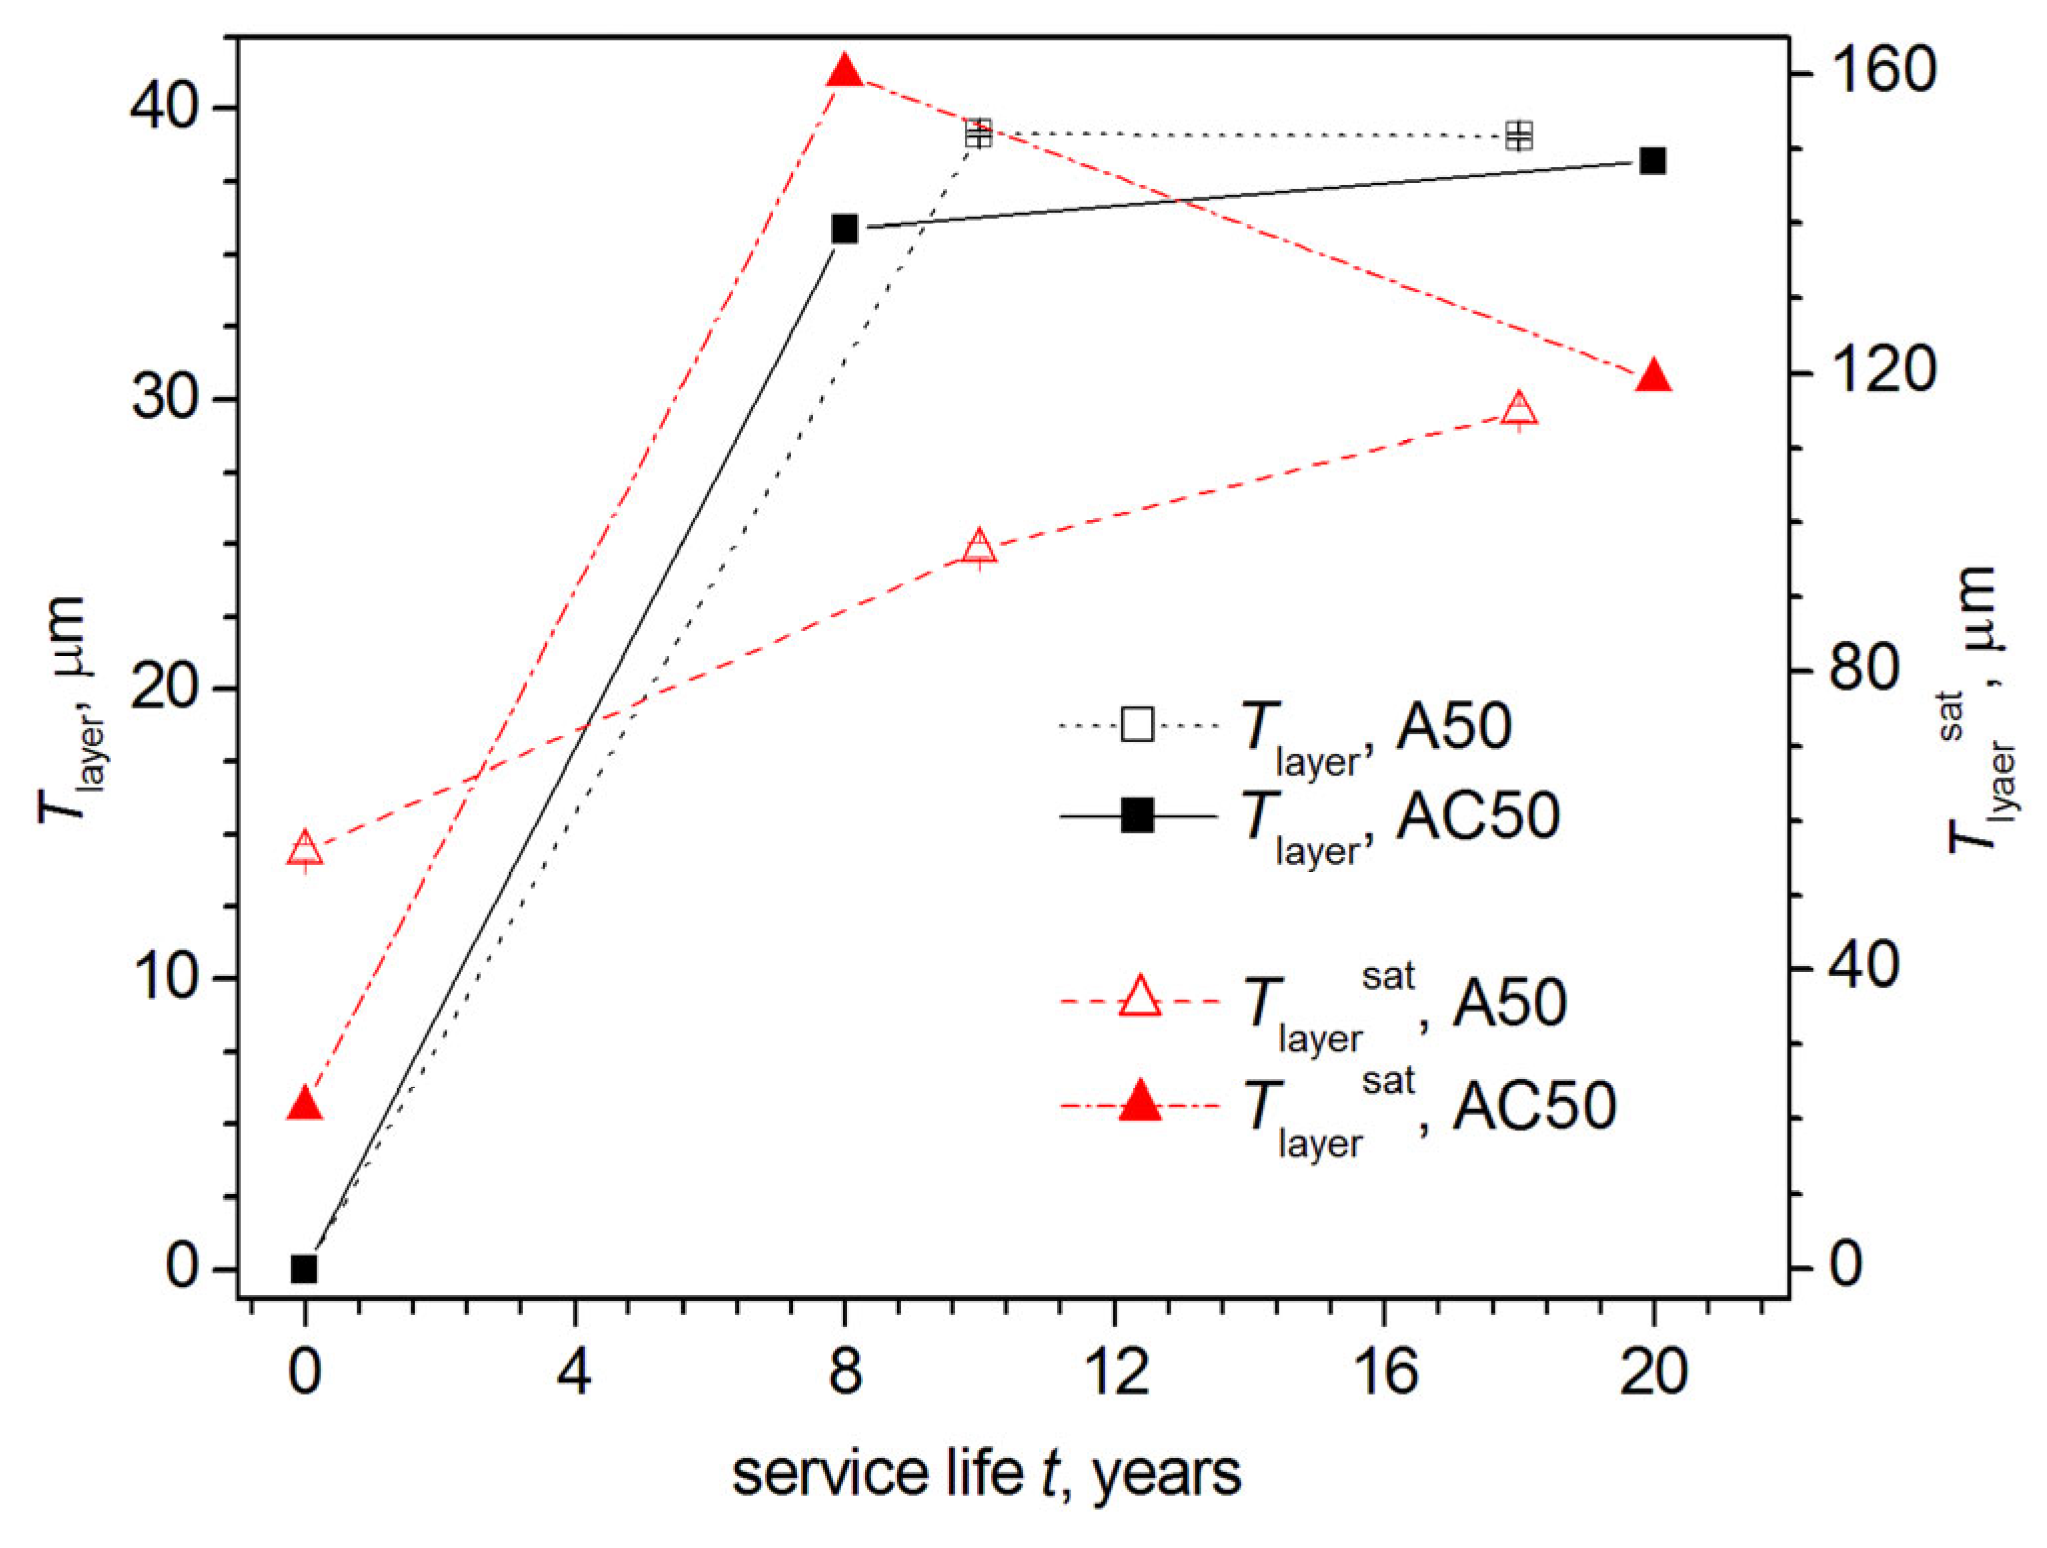
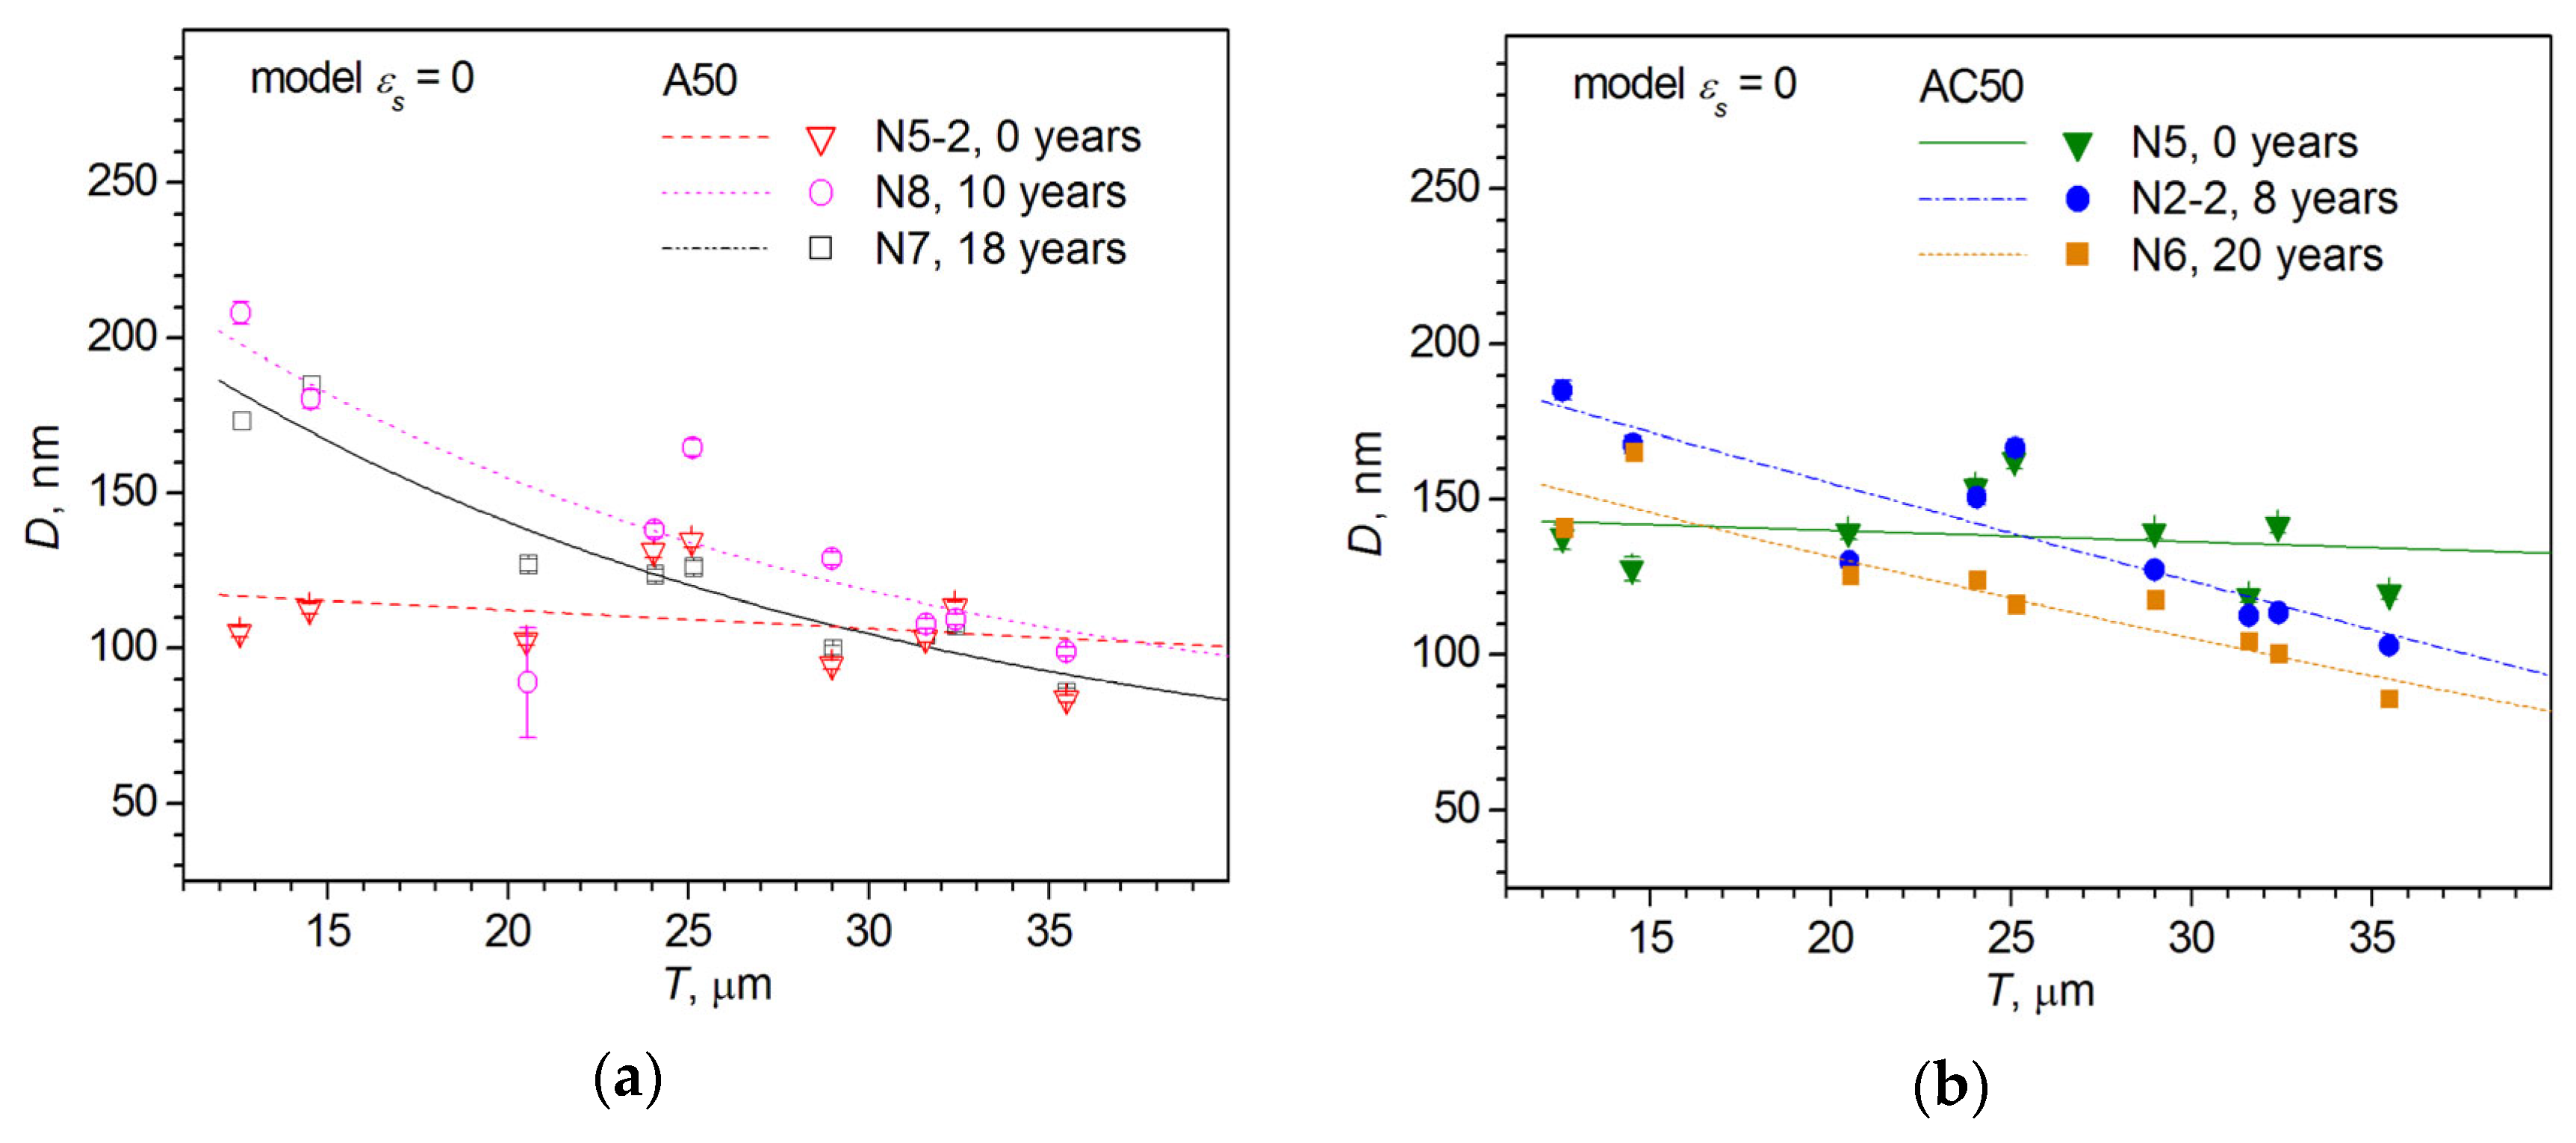
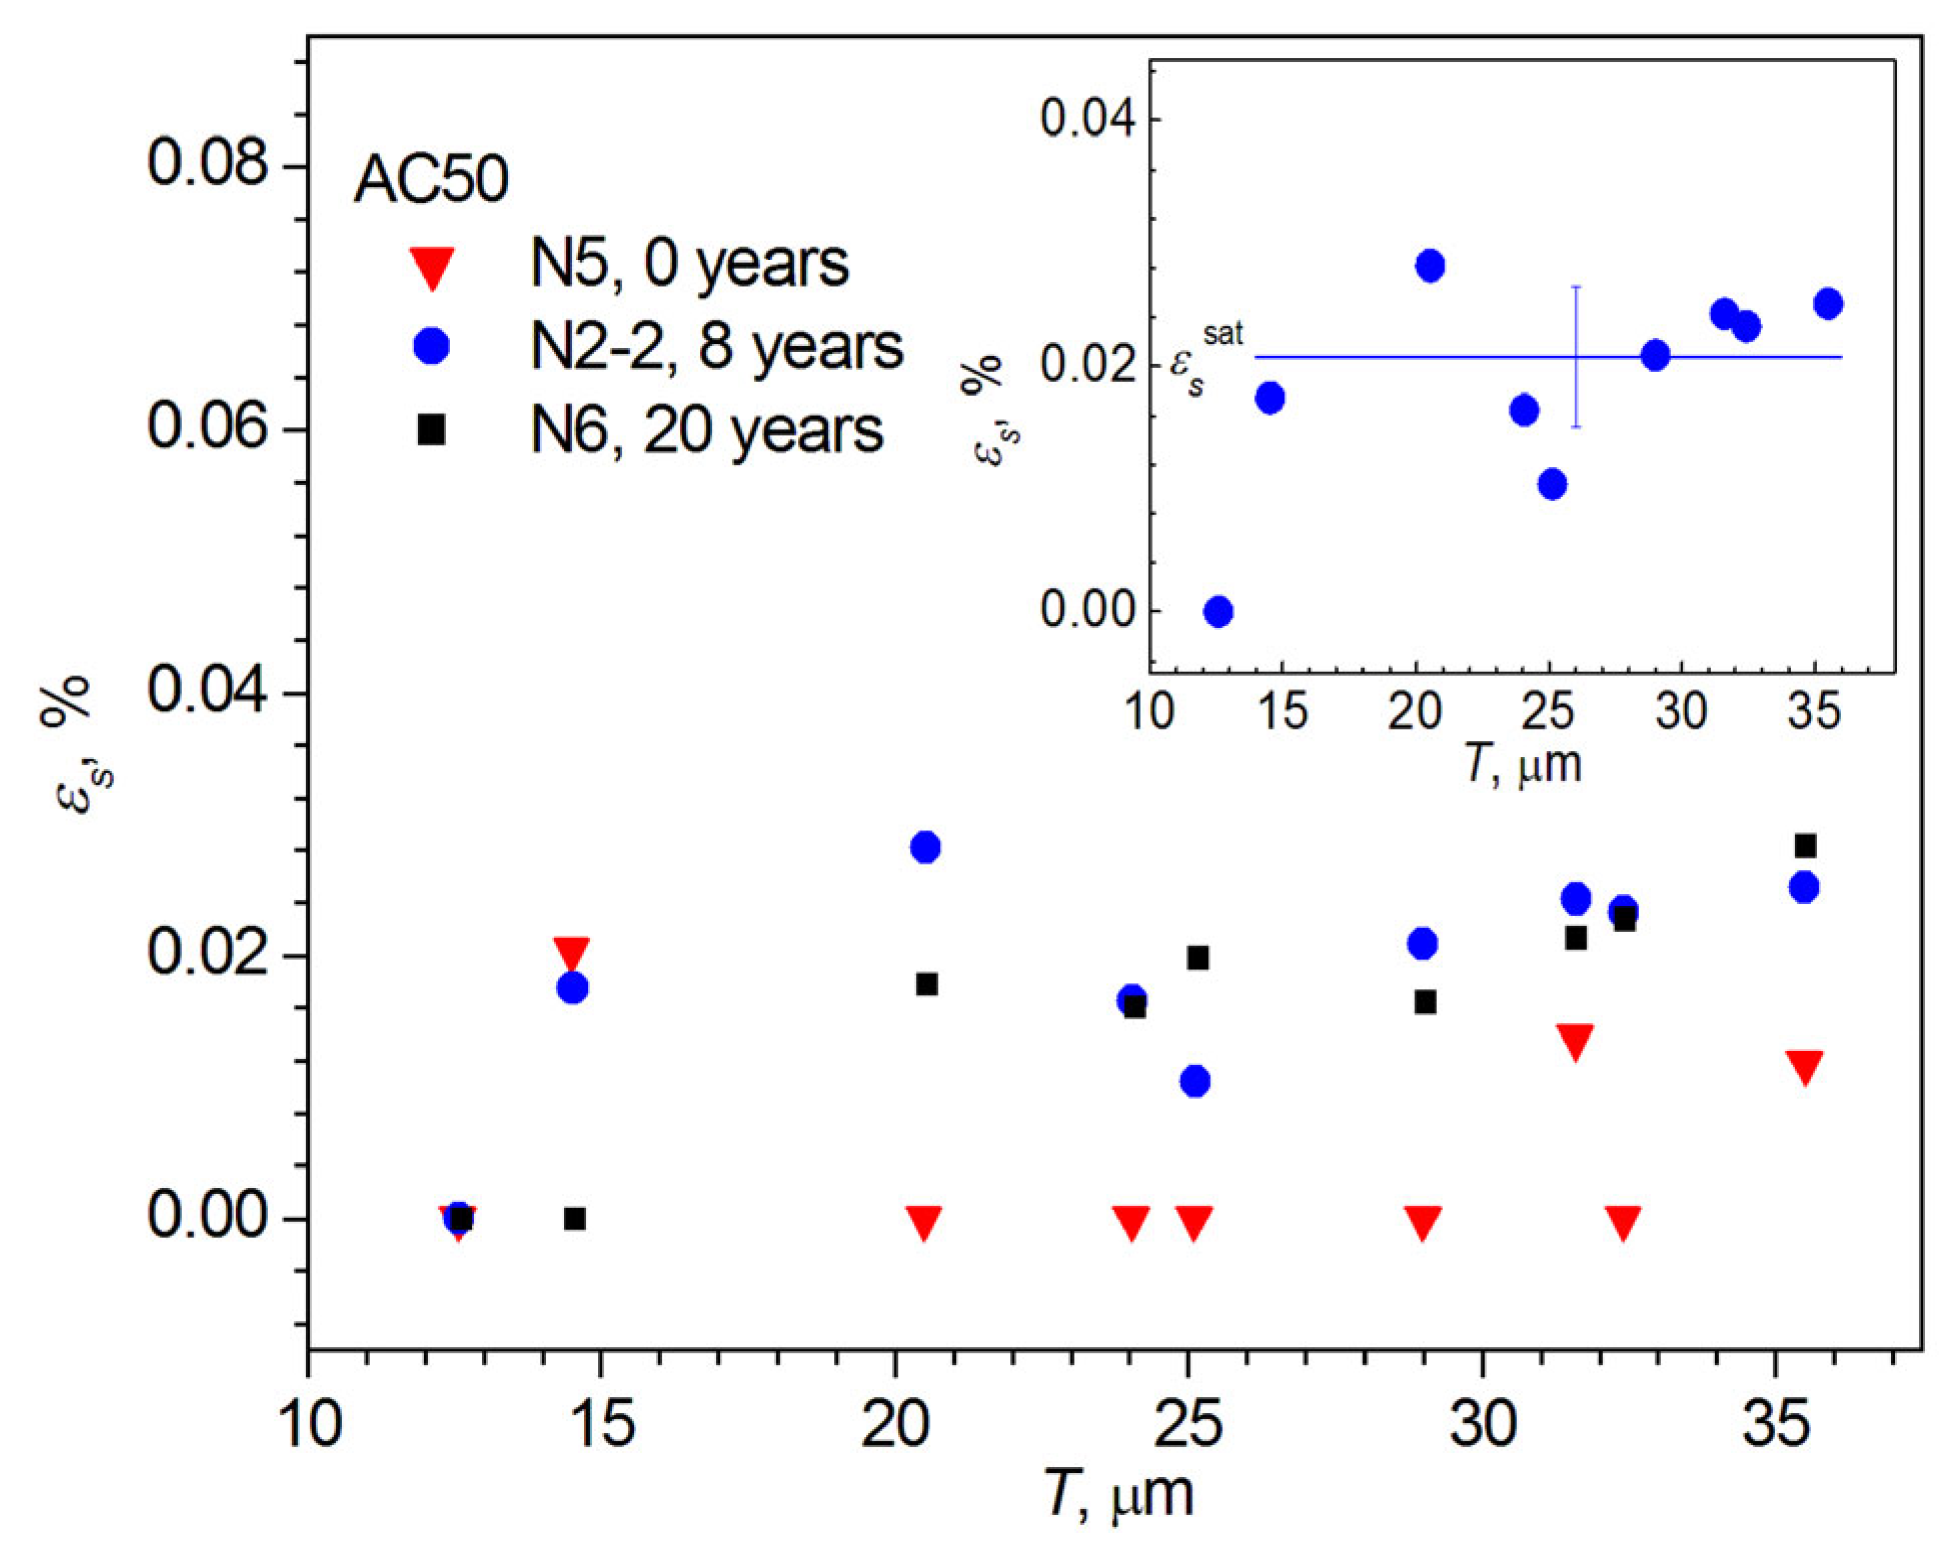
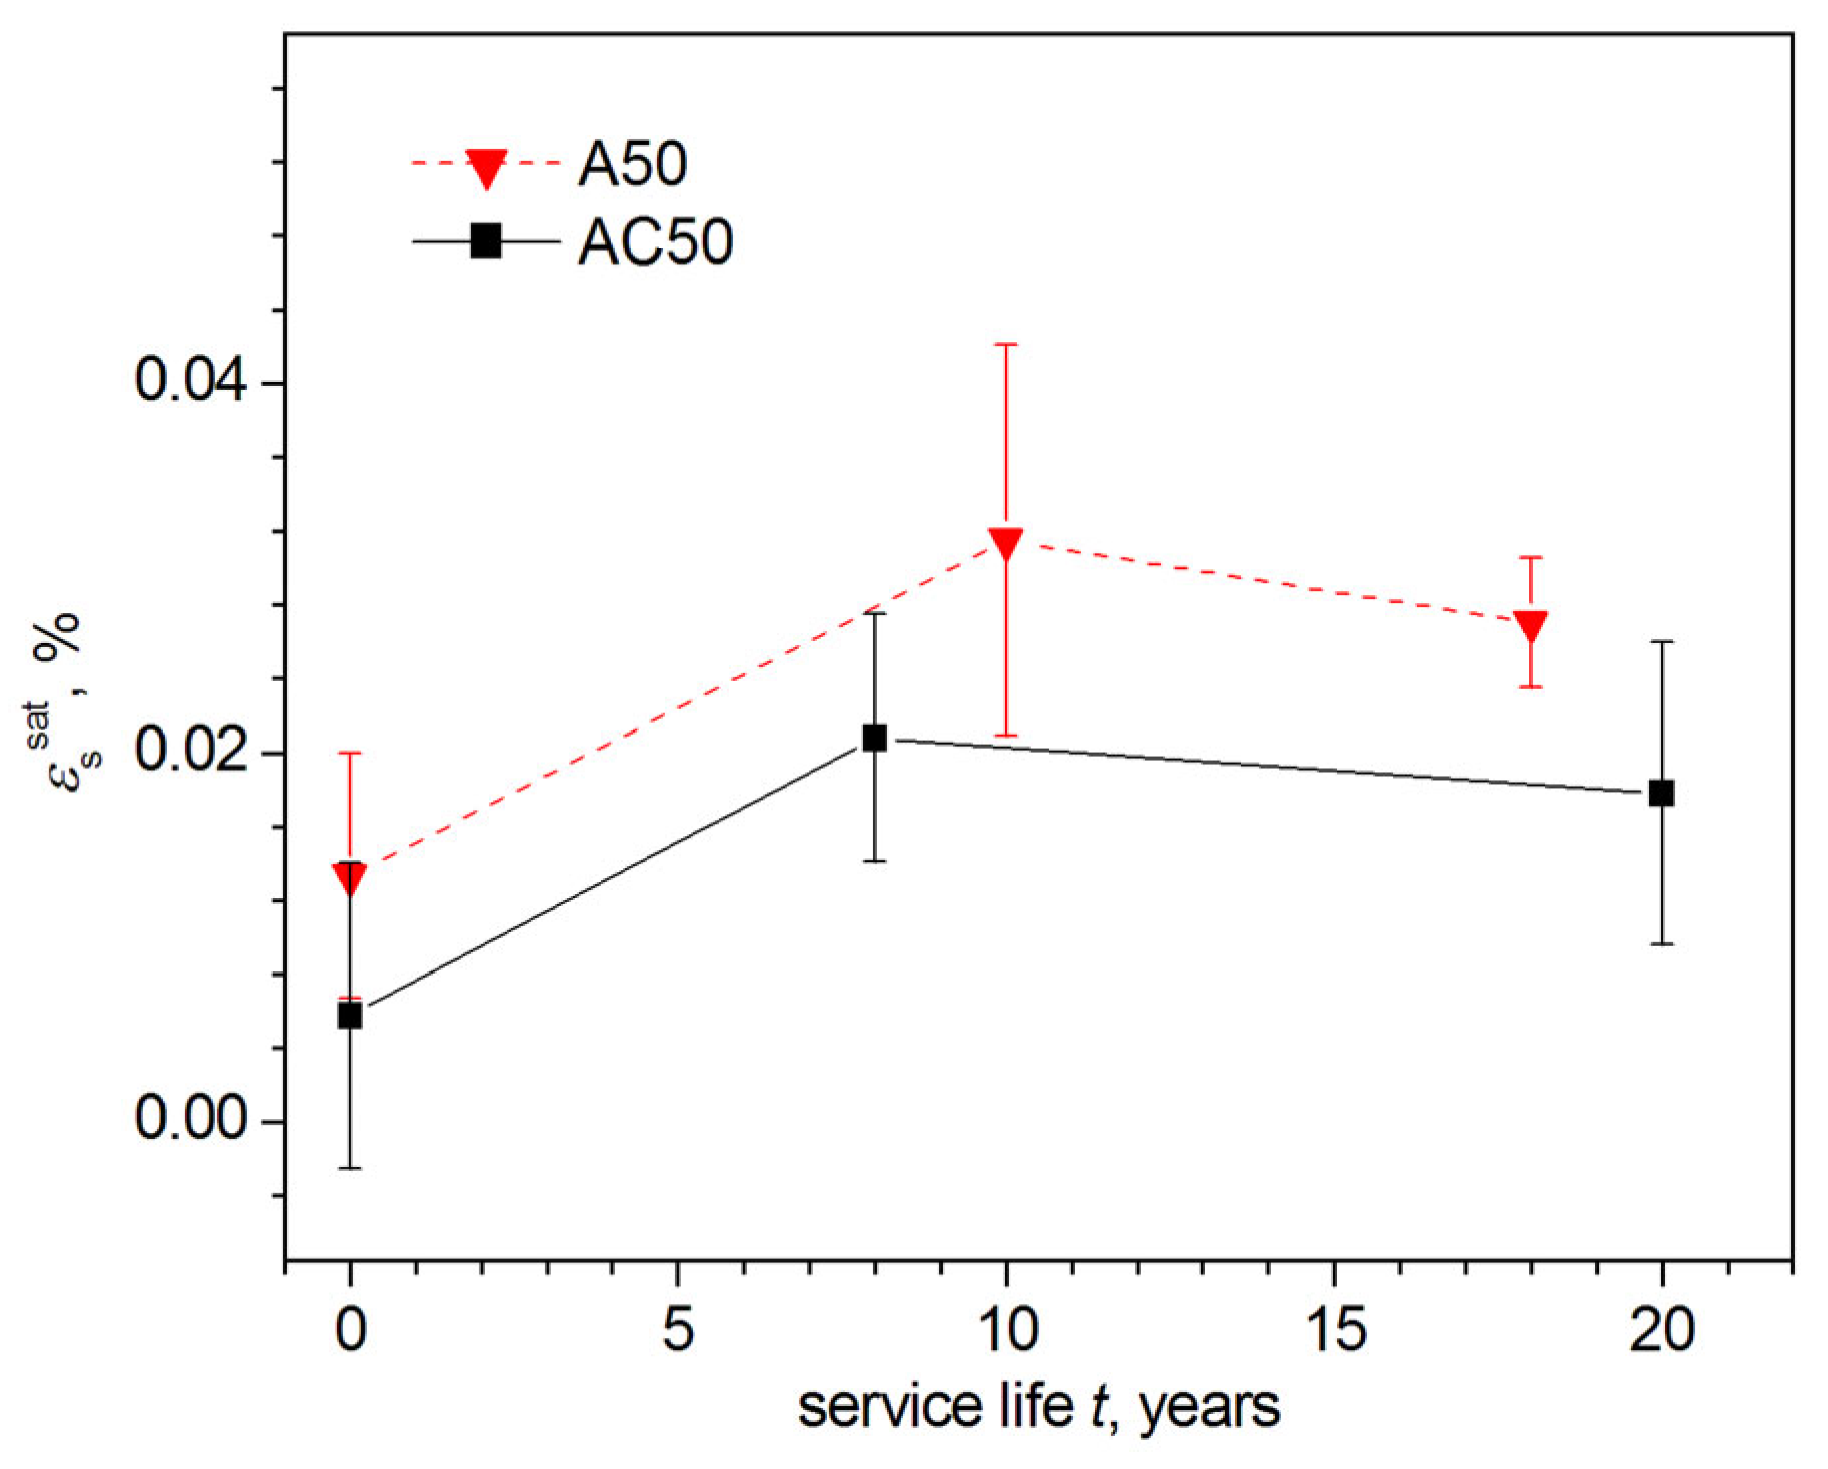
3.4. Results of XRD Investigations

Figure 9a–c presents the measured XRD patterns of AC50 samples with service lives from 0 to 20 years. For A50-cable wires with comparable service lifetimes of up to 18 years, the XRD patterns can be found in [10,37]. The XRD reflections of the cubic Al crystalline phase at angular 2θ positions corresponding to Bragg angles are schematically shown in Figure 9d by vertical bars whose heights are proportional to the intensities of the reflections according to the PDF-2 card 01-073-9843 [49].
As in the case of wires from the A50-type cables [37], the XRD patterns of the AC50 wires contain all the Al reflections with an enlarged 022 reflection intensity that indicates the polycrystalline nature of the wires with a noticeable effect of preferential orientation along the [011] crystallographic direction (see Figure 9a–d for comparison). As for the A50 wires, the intensity of the 111 reflection for the AC50 wires with a service life of up to 8 years remains the highest despite the presence of a preferential orientation along the [011] direction (Figure 9a,b), whereas the preferential orientation along [011] develops more strongly for wires after 20 years of operation, the 022-reflection intensity becomes the highest.
Quantitative ratios of the intensities of reflections 022 to 111 and 002 to 022, which characterize the preferential orientation of Al wires from AC50 and A50 cables, are given in Table 4 and are graphically shown in Figure 10. As one can see, both types of wires show the identical tendency to grow for the preferential orientation along the [011] crystallographic direction. Nevertheless, in AC50 type wires (with a steel core), the preferential orientation is more pronounced at all service lives, although the difference in preferential orientation between the AC50 and A50 wires decreases as the service life increases to 20 years. At the same time, the ratio of maximum intensities of XRD Al 022 and 111 reflections (Imax022/Imax111) increases by ≈2.2 times in A50 wires with an increase in service life from 8 to 20 years compared with ≈2.0 times in AC50 wires with an increase in service life from 10 to 18 years. Such a decrease in the rate of amplification of the effects of preferential orientation can be attributed to the stabilizing effect of the steel core in AC50 wires. In addition, it is likely that the stronger influence of the effects of preferential orientation in AC50 wires is due to the fact that in the starting state of AC50 wire (0 years of operation), the preferential orientation along [011] is already more pronounced than in A50 wire without operation, which is probably due to the peculiarity of the technological process in the production of aluminum wire of various batches for A50 and AC50 wires.
As in the case of the A50 wires [37], the XRD patterns of the AC50 wires after operation (Figure 9b,c) show the formation of very weak reflections attributed to δ*- and/or δ-modifications of Al2O3 [51,52] (δ-phase, space group P41212 (92), PDF-2 card 00-056-1186; δ*-phase, space group P222 (16), PDF-2 card 00-046-1215). With a service life of up to 20 years, δ*-/δ-Al2O3 reflections in AC50 wires after operation develop more strongly compared to those in A50 ones (without a steel core), apparently due to the oxidizing effect of the steel core, which is enhanced by possible damage to aluminum wires when rubbing against the steel core. Whereas the ratios q of the integrated intensity Iint of the 121 δ*- (and/or 212 δ-) Al2O3 reflection to Iint of the Al reflection with the highest intensities (with Miller indices hkl = 111 for service life up to 10 years and 022 after 18 years) in A50 wires are, respectively, 0.21(5)% and 0.5(1)% for samples N8 (service life of 10 years) and N7 (18 years), this value q amounts to 0.53(3)% and 0.9(1)% for the AC50 wires N2-2 (10 years) and N6 (20 years), respectively, see Figure 11.
A thorough investigation of the XRD patterns measured from samples of various life time periods showed that reflections corresponding to the same Miller indices hkl are systematically shifted, which corresponds to a change in the cubic unit cell parameter of the wire Al material, even after applying the angular corrections for zero shift and displacement, as described in Section 2.2.3. As an example, Figure 12 shows a reflection with a Miller index of hkl = 133 for the studied A50 and AC50 wires with a service life of 0 to 18–20 years.
Cubic unit cell parameters a of the Al material of the A50 and AC50 wires, averaged over all observed reflections and calculated by the Celsiz [42] program using the least-squares method, are presented in Table 4 and graphically shown in Figure 13a against the service life duration. The corresponding X-ray densities ρx and density defects Δρx/ρx of the Al material of A50 and AC50 wires, which are calculated with Formulas (4) and (5), respectively, are shown in Table 4 and Figure 13b.
As one can see from Table 4 and Figure 13a,b, the unit cell parameter and density Al of the material of the wires from the A50 and AC50 cables in the initial state (service life of 0 years) are almost the same (within e.s.d. to within the fourth decimal place, namely, a = 4.05026(12) Å and 4.05032(10) Å and ρx = 2.6973(2) g/cm3 and 2.6972(2) g/cm3, respectively, at an XRD measurement temperature of 314 ± 1 K). The values of these parameters are noticeably differ from the tabulated Al values (a = 4.05069 Å and ρx = 2.6964 g/cm3) at a temperature of 312.3 K, which is close to the temperature of the XRD measurements in this work. As previously noted [37], a decrease in the average unit cell parameter and, accordingly, an increase in the Al density of the wire material can be associated with the incorporation of a small number of Fe and Si atoms into the Al structure, which, according to the manufacturer’s passport [39] and EDX results (Figure 1a,b and Ref. [37]), are present in the wire composition in amounts up to 0.20 wt.% and 0.08 wt.% (see Table 3), respectively.
When the service life t of cables of both types in overhead power lines increases, both the cubic unit cell parameter a and the X-ray density ρx of the wire Al material alter almost linearly over the studied time intervals up to 20 years (Figure 13a,b), with lattice parameter a increasing and ρx decreasing for wires from cables of both types. Although the nature of the tendencies of changes in the structure parameters of wires from AAAC (A50) and ACSR (AC50) cables over time is the same, yet the rate of temporal change of the characteristics of A50 and AC50 wires is different. The presence of a steel core in AC50 cables leads to a decrease in the stretching rate of the unit cell parameter a of the Al wire material from 1.26(4) ∙ 10−4 Å/year in A50 wires down to 1.07(3) ∙ 10−4 Å/year in AC50 wires with a service life of up to 20 years. At the same time, the rate of decrease in the density ρx of the A50 and AC50 wires (i.e., the rate of degradation of Al wire due to the formation of void defects) decreases in absolute value from −2.52(8) ∙ 10−4 g/cm3/year to −2.13(7) ∙ 10−4 g/cm3/year, respectively. As a result, after about 11 years of service, the unit cell parameter a and density ρx of the Al material of AC50 type wires are the same as in Al wires from A50 type cables after 10 years. With a long service life of ~20 years of operation, the gain for AC50 wires is already ~3 years (see Figure 13a,b), i.e., the structure parameters of AC50-wire Al material after about 23 years of service are the same as those of A50-wire Al material after 20 years. Thus, the presence of a steel core in an ACSR (AC50) cable delays the structural degradation of the Al material of the cable wires.
The average sizes D0 of crystallites, averaged over all Dhkl values obtained from the FWHMcorr of each observed Al reflection with the Miller indices hkl according to the Scherrer equation in the framework of the model of zero contribution of microstrains (model εs = 0), reveal close values in wires of both types, namely, within D0 = 109(16)–138(16) nm for unused wires (0 years of service life), 139(41)–136(29) nm and 126(33)–120(23) nm for A50/AC50 wires after 10/8 years and 18/20 years of operation, respectively (Table 4, see also Supplementary Materials (SM) Figure S1).
However, the XRD-data analysis by means of the WHP and SSP techniques (see WHP and SSP plots in Figure S2 in SM for AC50 samples and Ref. [37] for A50 wires) shows that, whereas average microstrain εs is zero or very close to zero for unused wires of both types (service life of 0 years) and the average crystallite sizes D are slightly larger in unused AC50 wires (in A50 (N5-2) wires, εs = 0.010(14)%, D = 111(14) nm and εs = 0%, D = 109(6) nm according to WHP and SSP, respectively, compared with εs = 0.007(11)%, D = 141(17) nm (WHP) and εs = 0%, D = 138(16) nm (SSP) in AC50 (N5) wires), microstrains in the wires after operation evolve accompanied with a notable increase in the size of crystallites (see Table 4 and Figure 14). Moreover, in wires from cables without a steel core (A50 type cables), absolute values of average microstrain εs and average crystallite sizes D grow after 10–18 years of operation, noticeably larger than in wires from AC50 cables (with a steel core) after 8–20 years of service in overhead power lines (cf. εs = 0.031(2)% and 0.034(3)%, D = 246(55) nm and 302(54) nm according to WHP and SSP techniques, respectively, for A50 wires and εs = 0.025(3)% and 0.029(3)%, D = 167(13) nm and 219(19) nm according to WHP and SSP techniques, correspondingly, for AC50 wires).
Thus, the use of a steel core in the AC50-type cable (the cross-sectional area of the aluminum components of the cable remains practically the same, ~50 mm2, as in A50-type cable without the steel core) slows down the changes in the average parameters of not only the structure (the cubic unit cell parameter a of the Al material and its density ρx), but also of the microstructure (the average size D of crystallites and absolute value of average microstrain εs in them) of the Al material of cable wires.
It is to be expected that the steel core will affect not only the average characteristics of the wires but also their NSDLs. In order to investigate how the presence of a steel core in a cable affects the state of NSDLs of wires from that cable, XRD profiling of the structural and microstructural characteristics of AC50 wires in comparison with A50 wires was carried out by means of the method described in [10]. As noted in experimental Section 2.2.3, the essence of XRD profiling is that each Bragg angle 2θB of the reflection with Miller indices hkl corresponds to the X-ray penetration depth T pen h k l in accordance with Formula (6), determined by the linear absorption coefficient μl and the X-ray density ρx of the material (Al in the case of the wires under study). If the samples were powder or there was no profile dependence on the depth of penetration of X-rays, then the structural and microstructural characteristics obtained from the analysis of reflections, i.e., at all depths from the sample surface, would have close values statistically disordered for different reflections within e.s.d.
Figure 15a,b presents a comparison of the distributions of the values of the cubic unit cell parameter a and the XRD mass density ρx of the wire Al material, which are calculated from the structural data with Formula (4), along with the penetration depth T = T pen h k l of X-rays, which is estimated with the Formula (6) from the Bragg angles 2θB of the observed reflections, for wires from AAAC (A50) and ACSR (AC50) cables.
As one can see from Figure 15a,b, the cubic unit cell parameter a and the density ρx of the Al material of wires with different service life lengths from cables of both types are not the same at different depths T from the surface of the wires, but show smooth dependences a(T) and ρx(T), which are fairly well described by approximation curves that correspond to the exponential decay law. To simplify the perception, the fitting curves are not shown in Figure 15b for the experimental points corresponding to the A50 wires. An analogue of Figure 15b with all fitting curves is given in SM Figure S3.
Since the XRD density ρx is inversely proportional to the cube of the parameter a (ρx ~1/a3, see Formula (4)), it is satisfactory to consider the dependences ρx(T) alone. For wires from cables of both types, the density ρx is maximum and practically does not change at a sufficient distance from the surface in the bulk of the wires. Near the surface, ρx is minimum, which is the result of the formation of defects of a void nature in the near-surface layers [10] (i.e., of the formation of NSDLs).
The main changes in the structure and density of the wire Al material occur in the near-surface layer with a thickness of Tlayer = 36.4–39.1 μm for A50 wires or a bit smaller, Tlayer = 35.9–38.2 μm, for AC50 wires, which were determined from the intersection of the approximation curves ρx(T) referring to wires after operation with the fitting curves of unused wires of the corresponding type (see Figure 15b for AC50 samples and Ref. [10] for A50 wires). The approximation curves ρx(T) of the unoperated A50 (N5-2) and AC50 (N5) wires are very close. At depths T from ~25 μm for both wires, the density defect is Δρx/ρx ≈ −0.05% and practically does not change. When approaching the surface, only a slight drop in density is observed in the wires of both types (Δρx/ρx ≈ −0.2% at a depth of T ≈ 12.5 μm). Thus, NSDL with almost the same negative density defect (i.e., with a decrease in density due, apparently, to defects of a void nature), which does not exceed ~0.2% in absolute value at a depth of T ≈ 12.5 μm, already exists in wires from unused cables of both A50 and AC50 types.
As follows from the definition of the Tlayer value (see above), in A50 and AC50 wires after operation at a depth equal to Tlayer ~35.9–39.1 μm from the surface, the density defect is the same as in non-operated wires (Δρx/ρx ≈ −0.05%). However, after operation, the density of the near-surface layers noticeably decreases the greater the closer the layer is to the surface, and in A50 wires (from AAAC cables without a steel core), this decrease in density is significantly greater than in AC50 wires. For example, in A50 wires at depths of T ≈ 12.5 μm, the density defect reaches Δρx/ρx ≈ −0.68% and −1.17% for wires after 10 (sample N8) and 18 years (N7) of operation in comparison with Δρx/ρx ≈ −0.48% and −1.04% for AC50 wires after service life durations of 8 (sample N2-2) and 20 years (N6), respectively, i.e., the density defect in AC50 wires is less in absolute value by ~30% and ~10% after ~10 and ~20 years of operation. Thus, the use of a steel core in AC50-type ACSR cables leads to less degradation (smaller decrease in the density) of near-surface layers with a thickness of at least ~25 μm (as can be seen from Figure 15b, the largest deviations of the approximation curves ρx(T) for A50- and AC50-type wires start at depths from the surface of less than ~25 μm).
Extrapolation of the approximation curves ρx(T) to large depths from the surface shows that, for wires of both types, the estimated density ρx200μm at depths of ≥200 μm does not change with an accuracy of a thousandth of a percent, and the dependence ρx(T) almost reaches a plateau, which can be related to the mass density ρxbulk of the wires in the bulk.
Estimates show that the density ρxTlayer at a depth of Tlayer for A50 and AC50 wires after operation is ~99.6% of ρx200μm (i.e., of ρxbulk). Most of the XRD mass density ρx drop is occurring in a layer with a thickness equal to Tlayer from the surface ( ρ x 12.5 μ m     ρ x T layer ρ x 12.5 μ m     ρ x 200 μ m · 100 % ~70% for most samples (N8 (A50 type, 10 years of service life), N7 (A50 type, 18 years), and N6 (AC50 type, 20 years)) and ~50% for AC50 sample N2-2 after 8 years of operation). Apparently, this significant drop of ρx evidences that most of the defects of a void nature after the operation of cables of both types are formed in a layer of wires with a thickness equal to the value of Tlayer from the surface of the wires.
We have also made estimations of the depth Tlayersat from the surface where the density ρxsat is 99.99% of the value ρx200μm (which is taken as the value of ρxbulk). In the inset of Figure 15b, these estimates are shown graphically for AC50 samples and were given in [10] for A50 wires. According to the ρ x 12.5 μ m     ρ x sat ρ x 12.5 μ m     ρ x 200 μ m · 100 %   ≈99% criterion for all studied samples of both types, in the near-surface layer of thickness Tlayersat, almost the entire observed decrease in the XRD mass density ρx occurs in comparison with the values of density ρxbulk in the bulk of the wires.
Figure 16 presents a comparison of the thickness estimates obtained for both characteristic near-surface layers, namely, Tlayer (~50–70% reduction in density ρx) and Tlayersat (~99% reduction in density ρx). The thickness Tlayer of NSDL, where most void defects are concentrated, increases to 39.2(1) μm in A50 wires after a service life of 10 years (sample N8), then remains practically unchanged (39.1(1) μm) in sample N7 after 18 years of operation. Perhaps due to the influence of the steel core, the thickness of the Tlayer of a similar NSDL in AC50 wires is a bit less, reaching 35.9(1) μm in sample N2-2 after 8 years of operation and slightly increasing to 38.2(1) μm in sample N6 after 20 years of service. After the operation of wires in cables of overhead transmission power lines, the thickness Tlayersat of NSDL, where almost all void defects are concentrated, is significantly (3–4 times) greater than Tlayer for wires from cables of both types. In A50 wires, the value of Tlayersat increases almost linearly with service life duration from 55.8(1) μm (N5-2, service life of 0 years) to 96.3(1) μm (N8, 10 years) and 114.7(1) μm (N7, 18 years). In AC50 wires (with steel core), the value of Tlayersat also increases, though non-linearly, from 21.6(1) μm (N5, 0 years) to 160.0(1) μm (N2-2, 8 years) and 119.1(1) μm (N6, 20 21.6(1) μm (N5, 0 years) to 160.0(1) μm (N2-2, 8 years) and 119.1(1) μm (N6, 20 years). As one can see, NSDL is already present in non-operated wires. The difference in its thickness by almost 2.5 times may be associated not with the type of wires but with the features of their manufacture and with experimental inaccuracies. Samples after 18 and 20 years of operation (respectively, A50 sample N7 and AC50 sample N6) are characterized by similar values of the Tlayersat. At the same time, the AC50 sample N2-2 after 8 years of operation has a Tlayersat value that is ~1.5 times greater than that of the A50 sample N8 after a comparable 10 years of service. This difference may also be related to the features of operation and inaccuracies of the experiment.
The unit cell parameter a and the calculated X-ray density ρx of the Al material are not exclusive characteristics which demonstrate smooth dependences on the depth T (=   T pen h k l   in the case of the hkl reflection) from the surface from which the diffracted X-rays come. There are the microstructural parameters too. As shown above, there is a microstrain in the Al crystallites. Average size D of crystallites and absolute values of average microstrain εs were estimated by WHP and SSP techniques using all the observed XRD reflections (see Table 4, Figure 14, and SM Figure S2).
At the same time, with an increase in the X-ray penetration depth T pen h k l , not only the values of the Bragg angles 2θB of XRD reflections regularly change, which determine the value of the unit cell parameter a (i.e., the value ρx), but also their FWHMobs, from which one can estimate the size of the crystallite Dhkl and the absolute value of microstrain εshkl after making the appropriate correction of FWHMobs for instrumental broadening (see [37,43]), corresponding to an hkl reflection.
Since it is impossible to determine two values, Dhkl and εshkl, from one reflection at once, in order to identify patterns of trends in changes in microstructural parameters, we first estimated the values D = Dhkl0 within the model of the absence of microstrains (εs = 0) for the A50 and AC50 wires under study (Figure 17a,b).
As one can see from Figure 17, wires from cables of both types (with and without a steel core) demonstrate identical trends of a smooth change in the crystallite size D = Dhkl0, calculated in the zero microstrain approximation (εs = 0) for different reflections corresponding to different depths T from the surface. It is worth noting that, obviously due to the lower precision of determining the parameters of the microstructure compared to the parameters of the structure, the scatter of the experimental points Dhkl0 around the approximation curves is rather large, which makes it difficult to obtain sufficiently accurate quantitative characteristics, although the trends in Dhkl0(T) are rather apparent.
The sizes of crystallites Dhkl0 in non-exploited A50 (N5-2) and AC50 (N5) wires change slightly and almost linearly at different depths T from the surface (if one considers the approximation lines at experimentally achievable depths up to T ~35.5 μm; see Figure 17a,b). For the A50 N5-2 wire (service life of 0 years), the experimental values of Dhkl0 corresponding to different reflections (i.e., to different depths T from the surface) give an average crystallite size of 109(16) nm, while for the AC50 wire N5 (0 years), the experimental points corresponding to different T are scattered around an almost straight horizontal line corresponding to a larger average value of 138(16) nm (model εs = 0 in Table 4). Approximation curves of operated samples for experimental values of Dhkl0 obey the exponential decay law or the nearly linear drop law in the case of AC50 wires, i.e., in both cases, the farther from the surface (within ~35.5 μm thick NSDL), the smaller Dhkl0. For wires of both types, the approximation curves for Dhkl0(T) in wires with a service life of 8–10 years go higher than for wires with a longer service life of 18–20 years. The presence of a steel core in AC50 type wires leads to a smaller crystallite size Dhkl0 near the surface than in the case of A50 wires without a core, while the sizes Dhkl0 of crystallites are almost the same far from the surface (compare 185 nm and 208 nm near surface at a depth T of ~12.5 μm for AC50 and A50 wires after 8 (sample N2-2) and 10 (N8) years of exploitation, respectively, and ≈100 nm for both wires at T ~35.5 μm with, correspondingly, 141 nm and 173 nm at T ~12.5 μm and ≈90 nm at T ~35.5 µm for AC50 and A50 wires after 20 (N6) and 18 (N7) years). As a result, the amplitude of variation of the Dhkl0(T) approximation curves in NSDL at depths from the surface T ~12.5 µm to ~35.5 µm for AC50 wires is noticeably smaller than for A50 wires (respectively, ≈74 nm and ≈62 nm in AC50 wires with service lives of 8 (N2-2) and 20 (N6) years compared with ≈94 nm (N8, 10 years) and ≈91 nm (N7, 18 years) in A50 wires).
As in [10] for wires of the A50 type, we have estimated the distribution of the absolute value of microstrain εs in crystallites at depths up to T ~12.5 μm for AC50 wires under the assumption that there are no microstrains near the surface at depths up to T ~12.5 μm (εs = 0), while the crystallite sizes at large depths T ≥ 15 μm are fixed and equal to the crystallite size D12.5μm at a depth of T ~12.5 μm.
Figure 18 shows the εshkl distributions obtained for AC50 wires with different service lifetimes under the above assumptions. Similar estimates of the εshkl distribution for A50 wires with various service lifetimes can be found in [10].
An analysis of the obtained distributions of εshkl over depth T from the surface for NSDLs of AC50 and A50 wires shows that the microstrains εshkl estimated under the assumption of crystallite sizes fixed at D12.5μm at a depth T ~12.5 μm become constant in value (“saturated”, εssat) already at depths of T ~15 μm. An example of evaluating the value of εssat is given in the inset in Figure 18 for AC50 N2-2 wire with a service life of 8 years and in [10] for A50 wires. Upon comparing the distribution profiles εshkl(T), one can conclude that the values of εssat for AC50 wires are smaller than for A50 wires with a comparable service life. Figure 19 shows εssat vs. service life t for both wire types. As can be seen, the form of the εssat(t) dependences is very similar for both types of wires. Yet, for AC50 wires, the dependence εssat(t) is shifted to smaller values, i.e., the presence of a steel core in AC50 type cables reduces the absolute value of microstrain in the wires of this type of cable compared to A50 wires without a core. The results obtained confirm the trends and even the numerical values of absolute values of average microstrain εs obtained by the WHP and SSP techniques for microstrains averaged over NSDL with a thickness of ~35.5 μm (see Figure 14b).
It should be noted that both considered cases (the absence of microstrains (εs = 0, Figure 17a,b) and a fixed crystallite size equal to the size of crystallites near the surface of the samples (Figure 18)) are limiting. If, for example, the size D of crystallites from the surface to the depth first increases and then decreases, then, in accordance with the formulas for calculating the parameters of the microstructure (see [10,43]), the absolute value of microstrain εs also first increases and then decreases. As a result, in this case, the dependences Dhkl0(T) and εshkl(T) in NSDL will acquire a form close to bell-shaped.
Thus, the XRD study of wires from A50 and AC50 cables of different service life lengths from 0 to 20 years revealed the features of changes in the structural and microstructural parameters of NSDL of wires (characteristics averaged over the NSDL with a thickness of ~35.5 μm in accordance with the values of the Bragg angles of the observed reflections and the profiles of these characteristics in depth from the surface of the wire) depending on the presence of a steel core in the cables of overhead power lines from which these wires are extracted.

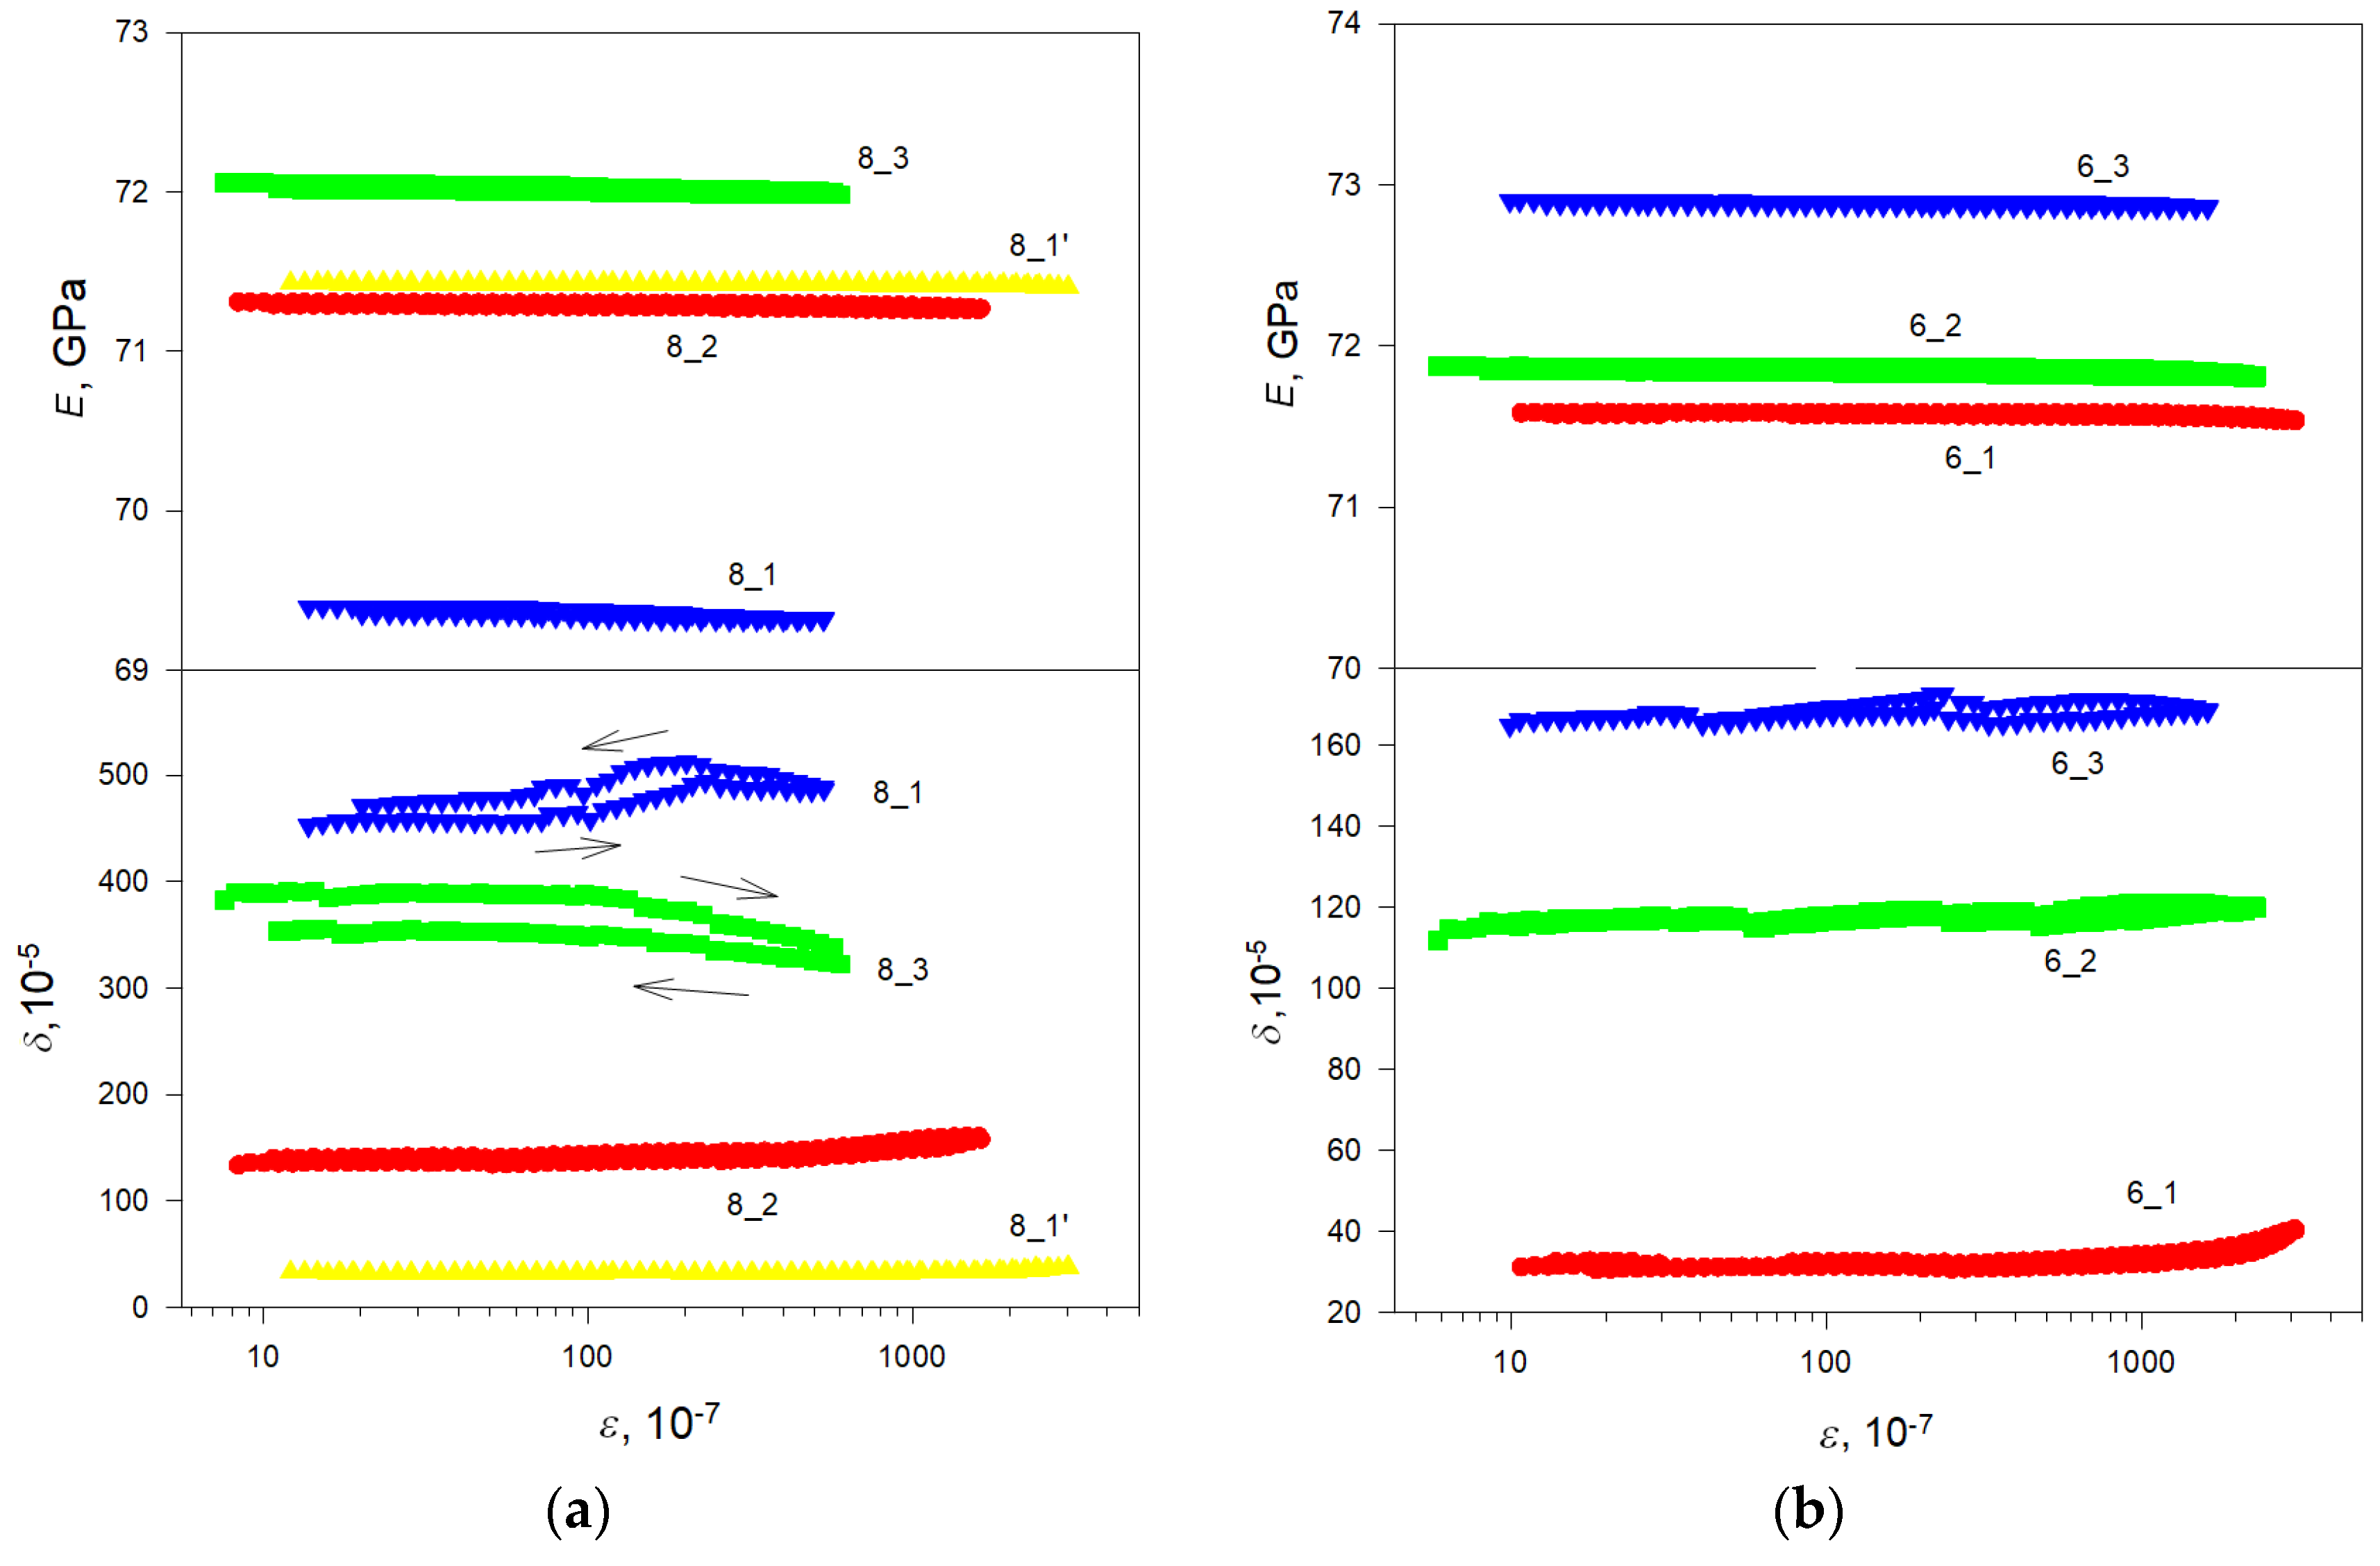
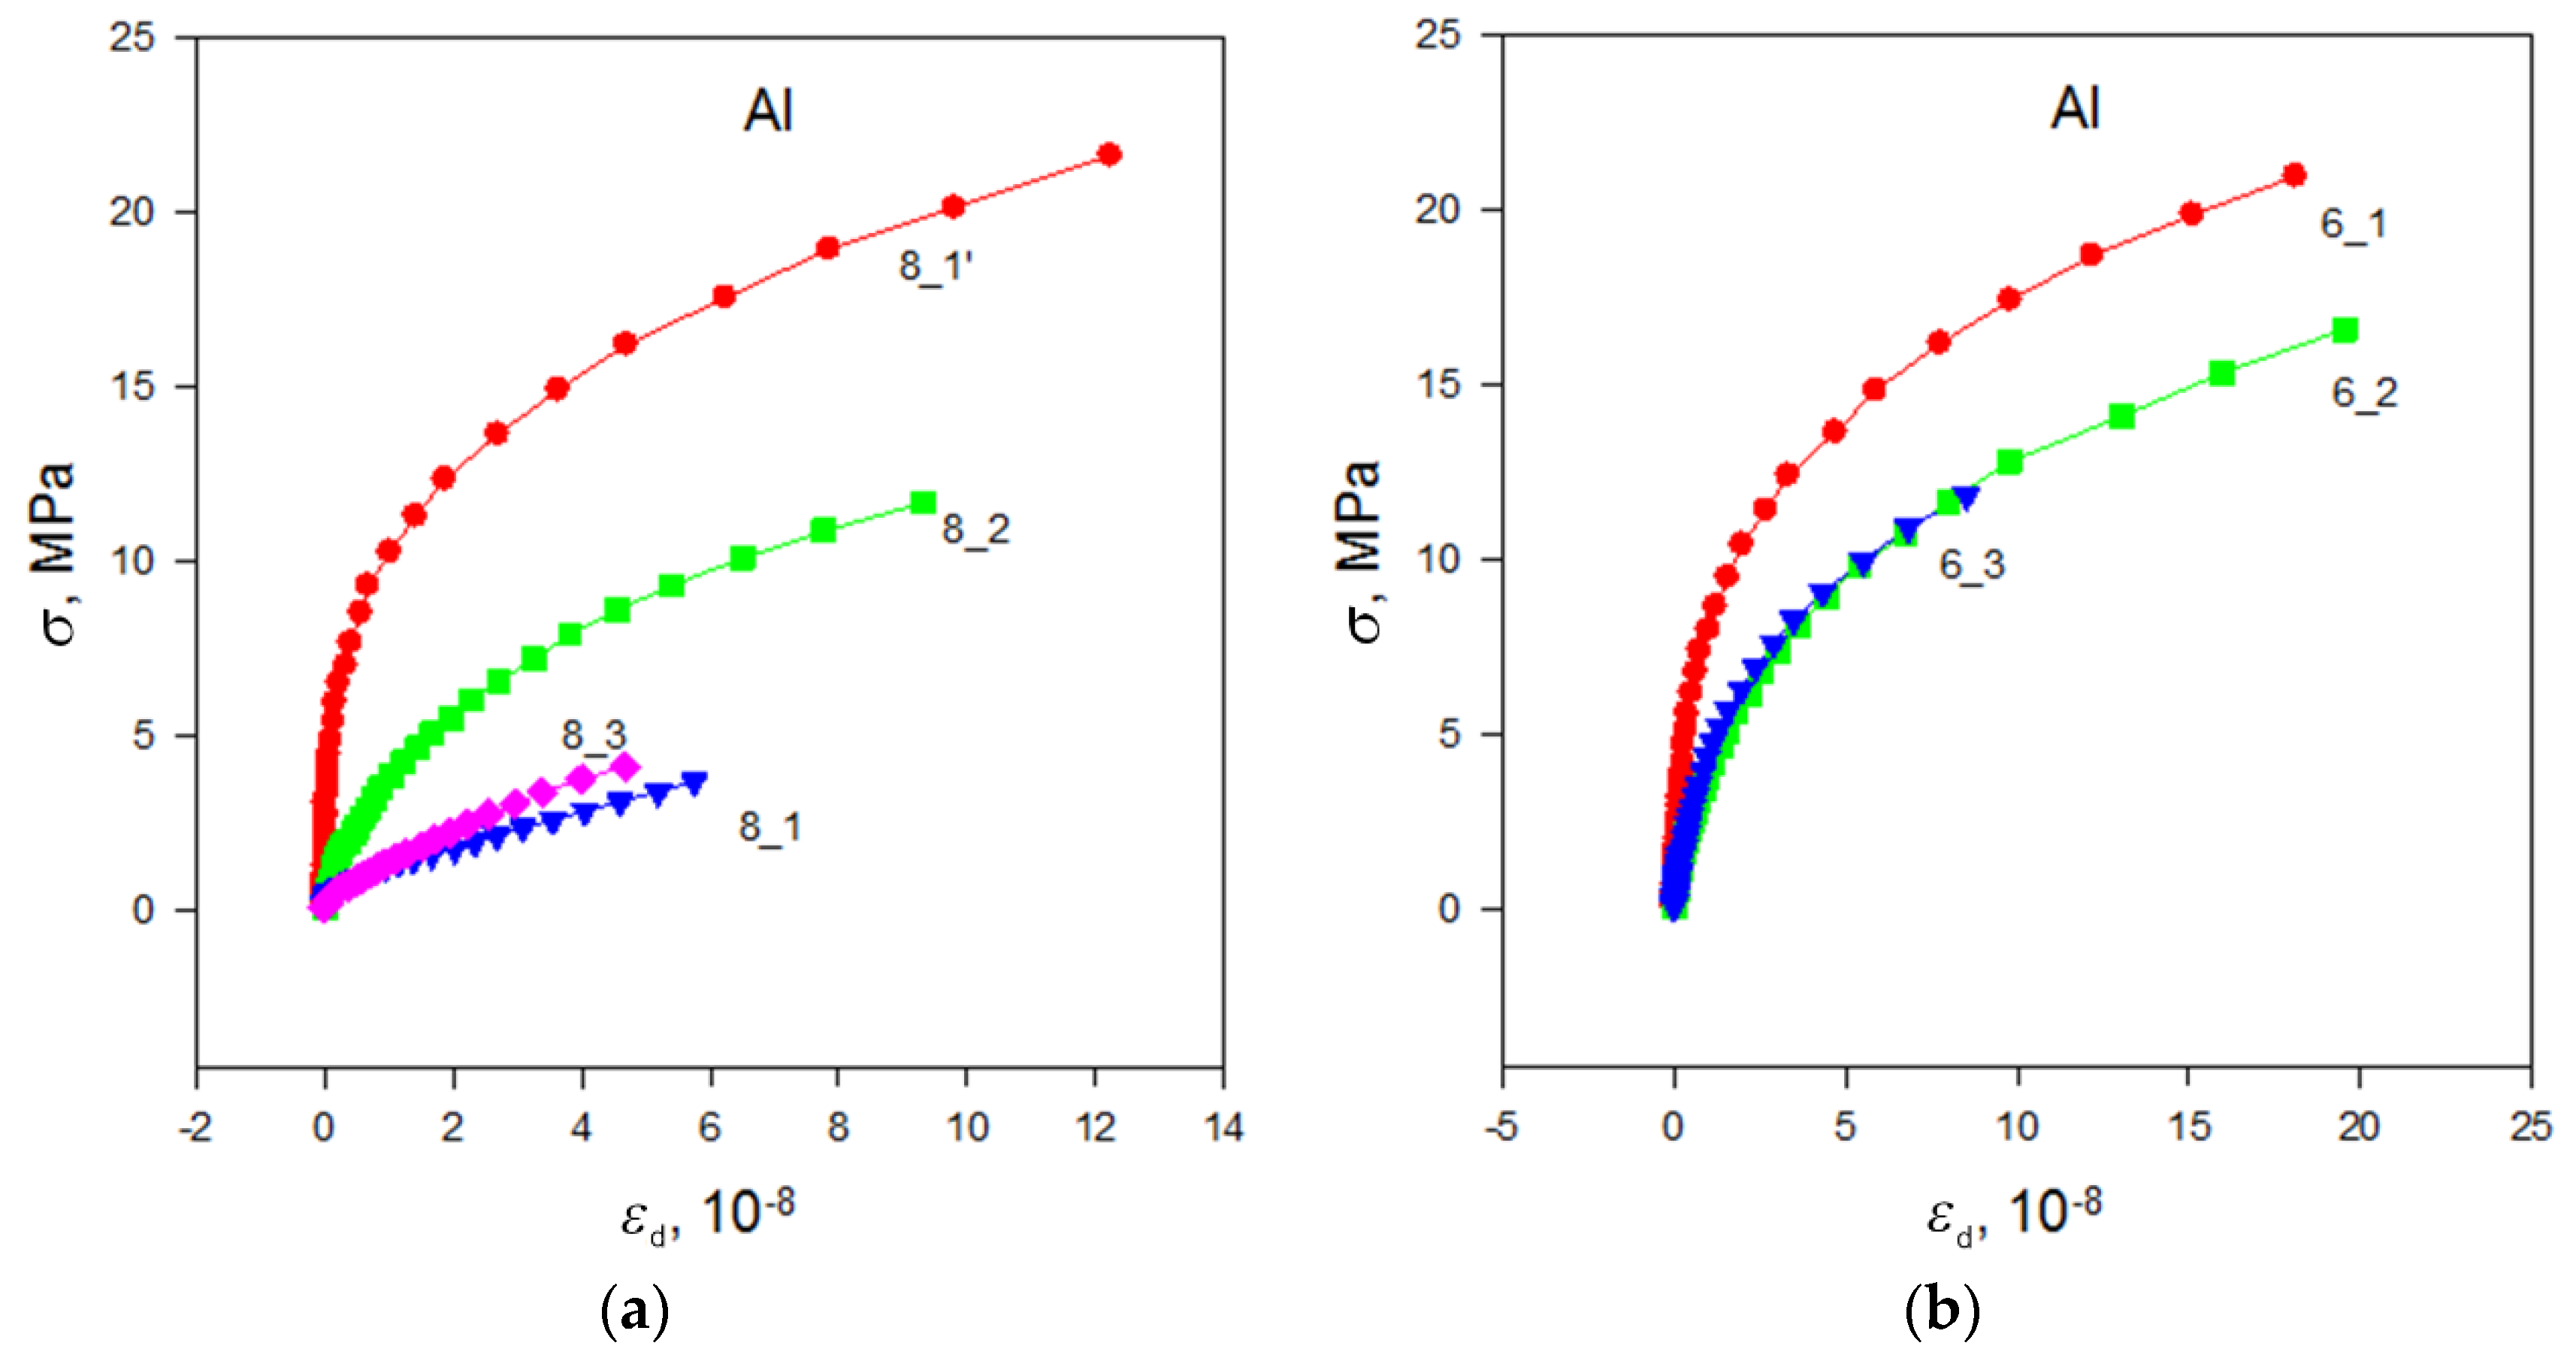
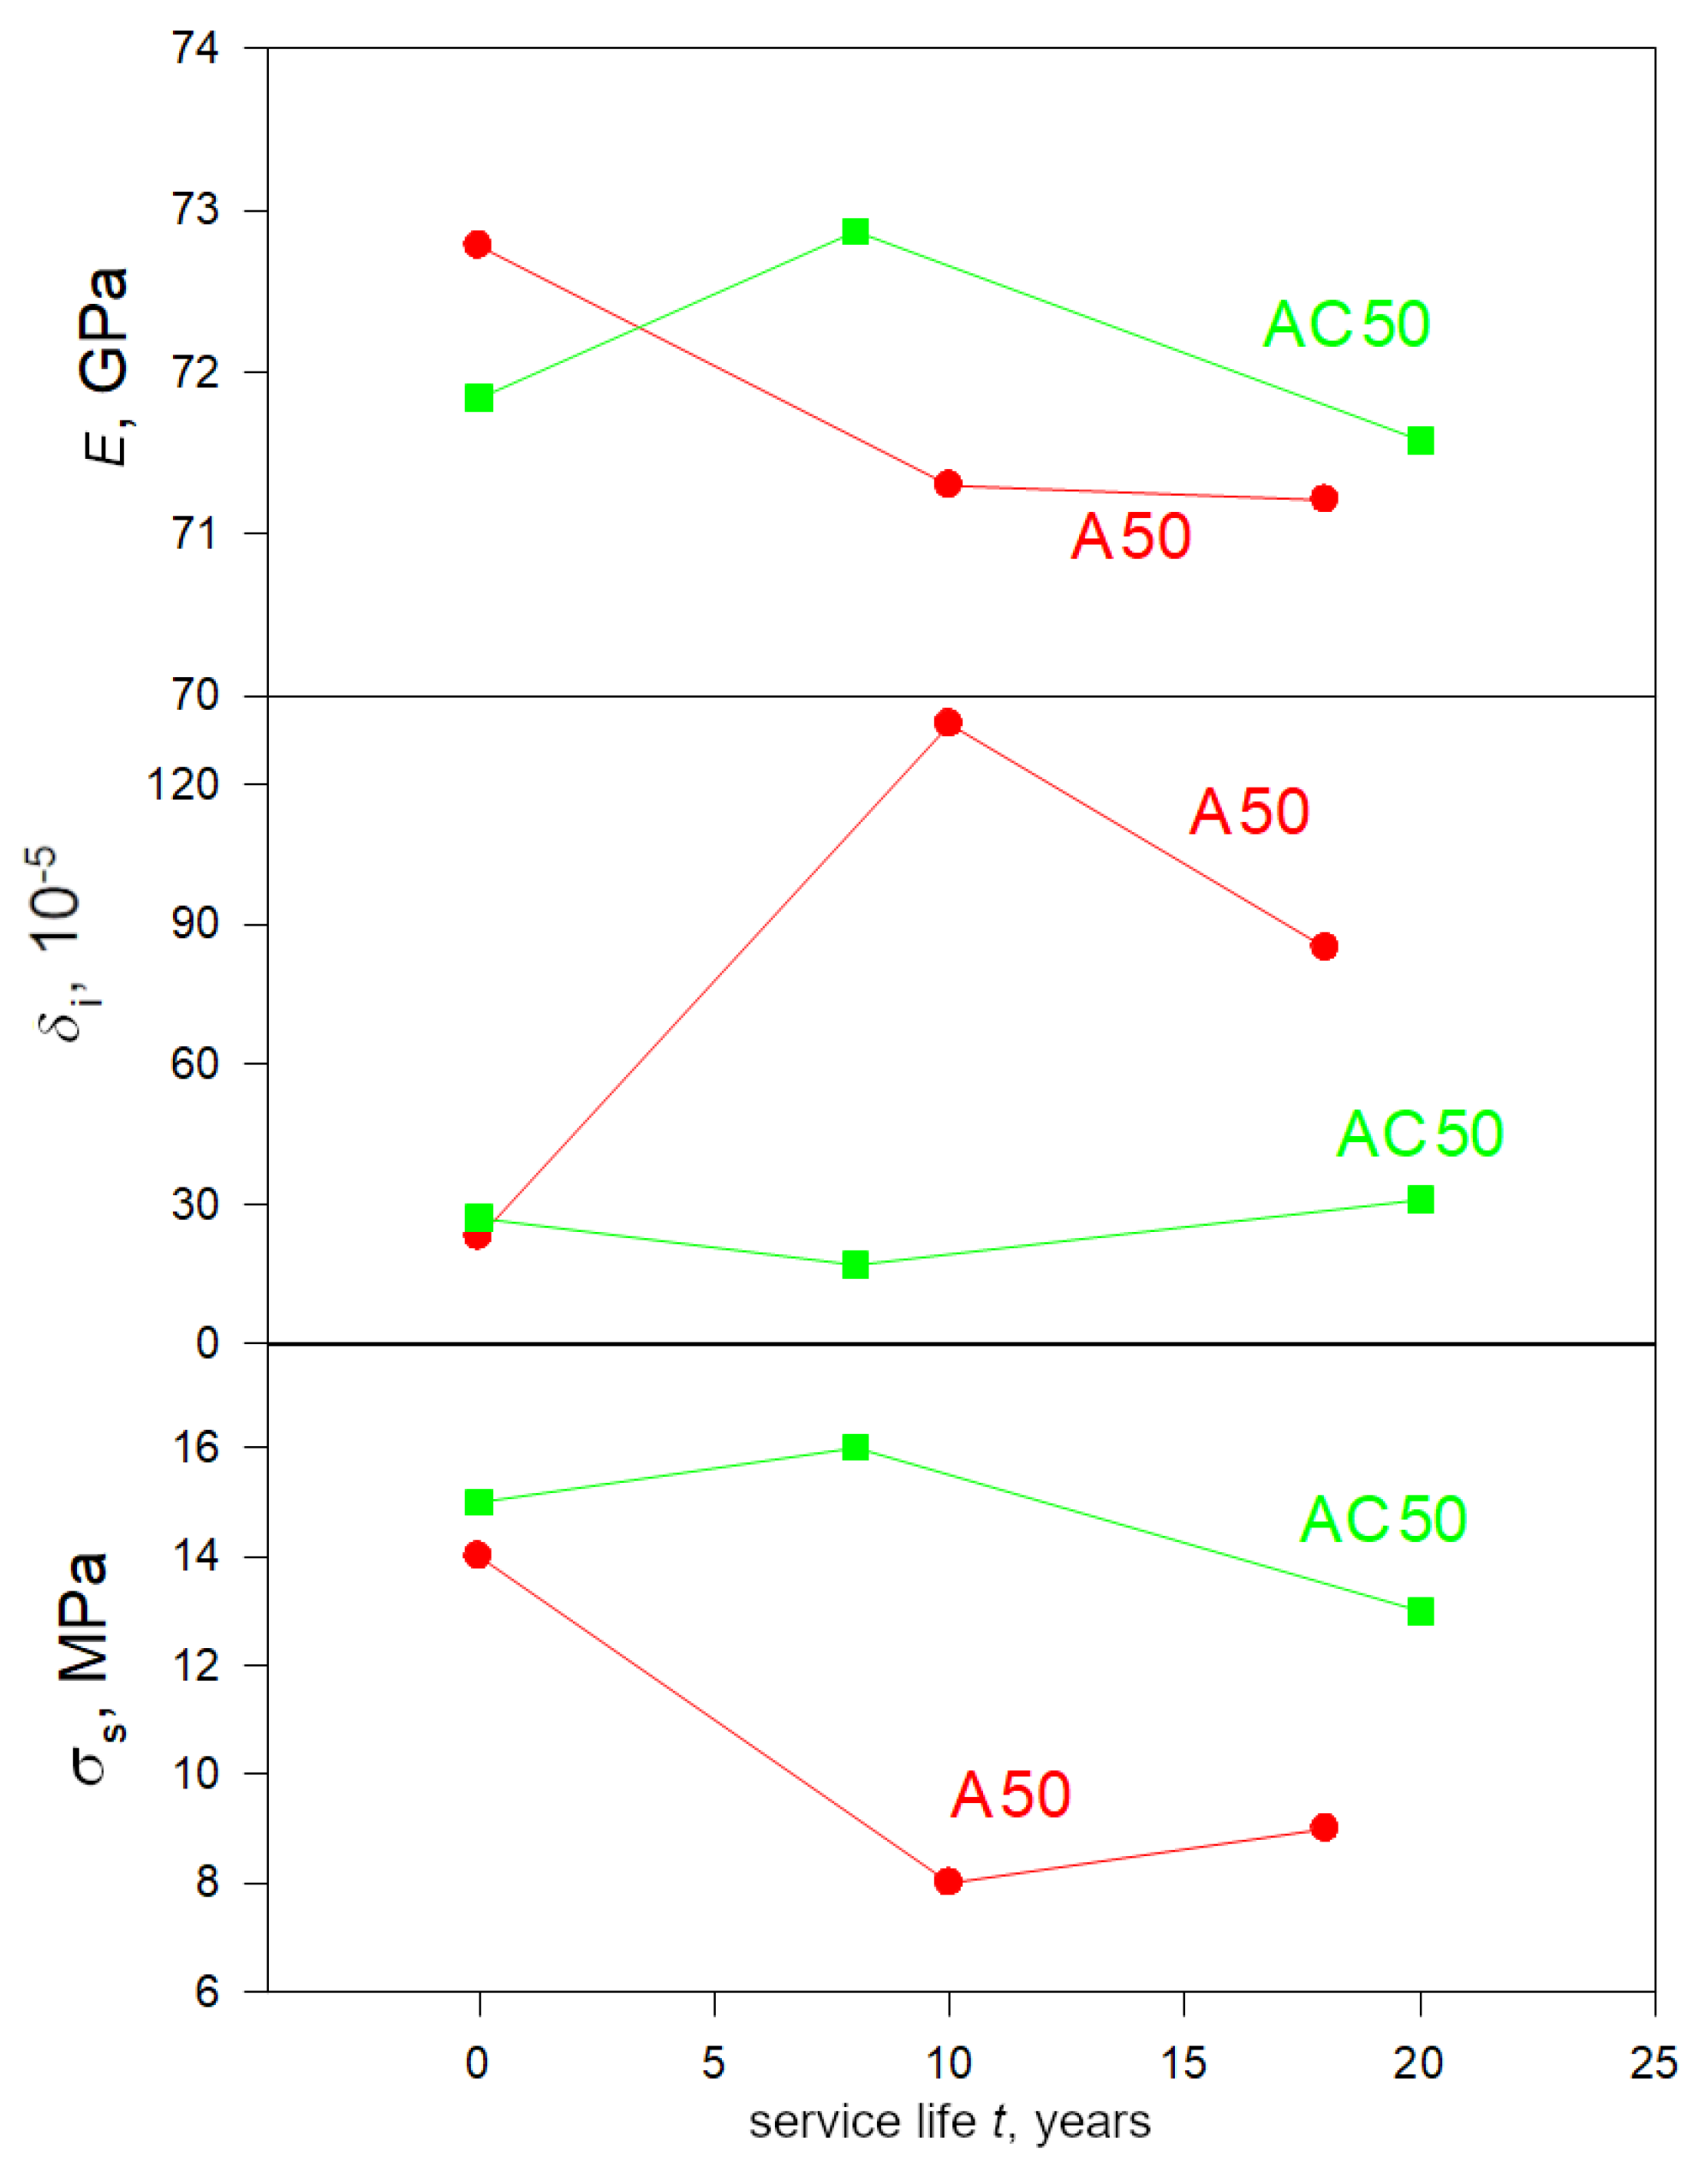
3.5. Results of Acoustic Studies

To study the quite probable scatter of experimental data of the acoustic study along the wire segment, samples with a length of ~25 mm were cut from different sections of the wire (as a rule, there were three pieces for each service life). This scatter can be caused both by the different deformation prehistory of wire sections during cable manufacture and by its operation duration. As an example, the results of the measurements of the amplitude dependence (i.e., dependence on the amplitude of vibrational strain ε) of both the Young’s modulus E(ε) and the decrement of elastic vibrations δ(ε), as well as the dependence of oscillatory stress on the amplitude of the nonlinear inelastic deformation, σ(εd), for three studied samples with the same service life are shown in Figure 20a and Figure 21a (A50, samples N8, 10 years of service life) and Figure 20b and Figure 21b (AC50, N6, 20 years of service life). It can be seen from the Figures that the data obtained from pieces cut from different sections of wire of the same service life noticeably differ from each other. The greatest difference (several times) is observed for the values of δ and σ. The Young’s modulus E turns out to be structurally sensitive only in the third or fourth significant decimal place, and, apparently, this sensitivity is determined mainly by the presence of defects and the microplastic properties of a particular piece.
We have made an attempt to reveal the effect of operating time on the studied parameters. To do that, one sample with the smallest value of the amplitude-independent decrement δi was selected for each material (A50 and AC50) and service life. In such a wire piece, the plastic deformation and, consequently, defect formation, which can occur during the manufacture of the cable, are apparently less than in the other wire areas. When these values are the minimum, the effect of unfavorable factors (wind, snow sticking, etc.) on the decrement, leading to the appearance of additional defects and their evolution during operation, should be more apparent. The obtained data are summarized in Table 5 and, for explicitness, are shown in Figure 22 in the form of dependences on the operating time, the Table and Figure show the values of the elastic modulus E, amplitude-independent decrement δi, and microplastic flow stress σs = σ measured at inelasticstrain amplitude εd = 4 ∙ 10−8 obtained for specimens with the lowest δi value for all investigated wires.
When looking at Figure 22, the first thing that catches the eye is the noticeable effect of the steel core. The use of this core in AC50 type samples maintains a low level of amplitude-independent decrement δi and a high level of stress σs of microplastic flow in comparison with the wires of the A50-type cables without a steel core. At the same time, as expected, the values of δi and σs differ insignificantly for A50 and AC50 unused samples (0 years of service life).
As for the dependences of δi and σs on the operating time (Figure 22), these parameters change much less for the wires of a steel core (ACSR) AC50 cable than for those of an all-aluminum (AAAC) A50 cable. One can also note the difference in the behavior of E, δi, and σs for wires from the former cable and the latter one, namely the fact that, at approximately the service life, where there is a maximum in the operating-time dependence of E(t), δi(t), and σs(t) for one, the minimum is observed for the other one. The presence of a steel core in an ACSR AC50 cable at the beginning of operation for a service life of up to 8 years is favorable for Al wires from the cable (δi decreases while both E and σs increase), then there are slight changes for the worse with an increase in service life up to 20 years. On the contrary, in Al wires of an all-aluminum (AAAC) A50 cable, at first, significant unhardening is observed after 10 years of service, then there is a slight improvement in deformation characteristics with an increase in service life up to 18 years. However, it should be noted that the results obtained should be treated with caution since the number of samples studied is small. Nevertheless, the positive role of the steel core for power transmission lines is not in doubt, as it has already been discussed in the review of the available literature in Section 1 (Introduction).
In this paper, apparently, we need to once again pay attention to a result discussed in detail in [10], namely, the fact that the defects are mainly located in the NSDL of the Al wires. Figure 20a and Figure 21a show data for A50 sample N8_1 (service life of 10 years) in its original state and after etching (N8_1′), when a layer of about 35 µm thick was removed from the surface. In the initial state before etching, this sample had the largest amplitude-independent decrement δi, the lowest level of microplastic stress σ, and the smallest value of Young’s modulus E. Upon etching, it turned out to have the smallest decrement δi and the largest value of σ among all the investigated samples with numbers N8_i (i = 1 − 3). Young’s modulus of the sample N8_1’ also increased noticeably, i.e., an improvement in the deformation characteristics is observed after the removal of the near-surface layer by etching. Evidently, this indeed means that most of the defects are located in the near-surface layer. Undoubtedly, one can dare to attribute this result to other samples (N8_2 and N8_3, N6_1,2,3 and so on), for which etching was not carried out.

4. Discussion

First of all, let us discuss the difference of 2 years in the service life of the compared wires (A50 N8, 10 years and AC50, N2-2, 8 years; A50 N7, 18 years and AC50, N6, 20 years). The results of data analysis have shown that the dependences of the wire parameters on the service life (unit cell parameter a(t) of Al, Figure 13a; XRD density ρx(t), Figure 13b) are linear or close to linear (fraction of aluminum oxide q(t), Figure 11). Thus, the difference of 2 years between the compared parameters for wires of different types does not play a role because the dependences for the wires of different types differ well from each other, and the values of these parameters for a wire of the same type with a difference of 2 years are close. The same can be said about the time dependences of other parameters (Figure 16 and Figure 19), particularly about the dependence of the deformation characteristics of wires on their service life (Figure 22).
As for the profile dependences (a(T) and ρx(T), Figure 15a,b), then, taking into account that according to determined values of the rate of change of these quantities with time (see Section 3.4), in 2 years they will change only by ~1 · 10−4 Å and ~2 · 10−4 g/cm3, respectively. Moreover, the parameter a of the Al unit cell will increase, and the density ρx will decrease. As a result, if we scale the values of a and ρx of A50 wires (service life of 10 years and 18 years) to the values for AC50 wires (service life of 8 years and 20 years) by substraction/addition of the corresponding quantity for 2 years, then the difference between the dependences a(T) and ρx(T) for different types of wire will change only slightly. All trends remain, and numerical values are virtually unchanged (up to the fourth digit after the decimal point). As an illustration, the SM Figure S3 shows an example of the dependencies of ρx(T) Al wires on A50 cables, reduced to the same service life as the AC50 cable wires. Obviously, this conclusion also applies to the profile dependence of the densitometric density ρdL of NSDL (density defect ΔρdL/ρdL, Figure 7).
Thus, the analysis of the data obtained indicates that when comparing the Al wires of A50 and AC50 type cables, the difference of 2 years in service life does not significantly affect the comparison results.
As stated in [37], the changes in structure, microstructure, and various physical properties, which are observed for wires in overhead power transmission cables, are probably related to processes occurring during operation. Among these processes, it is worth emphasizing the stretching of wires due to either vibrations or swaying of cables under the action of the variable wind and temperature of the surrounding air atmosphere, the phenomenon of fretting (vibration fatigue due to the friction of the wires in the cable against each other), and the formation of defects of a void nature, especially in the near-surface layers of the wires. AAAC (A50) type cables are characterized by approximately the same ~50 mm2 cross-sectional area of their aluminum component as ACSR (AC50) cables (Table 1). The most significant difference in their design is the replacement of an additional central aluminum wire in AAAC (A50) cables with a steel core wire of approximately the same diameter in ACSR (AC50) cables. As can be expected, the presence of a steel core in ACSR (AC50) type cables, which is much stiffer than the Al wires of these cables, will reduce the influence of at least some of the above factors, such as stretching and abrasion of wires, in ACSR (AC50) type cable wires compared to AAAC (A50) cable wires. As a result of using the steel core, changes in the structure, microstructure, and, as a result, in the physical properties of AC50 wires will occur more slowly.
Indeed, a comparative study of wires from A50 (AAAC type) and AC50 (ACSR type) cables, similar in geometric dimensions and structure, with the exception of the material of the central wire (Al wire in A50 (AAAC) cable and steel core wire in AC50 (ACSR), by means of the XRD, EBSD, and densitometry methods in combination with acoustic studies, has shown a noticeable difference in the structure, microstructure, and elastic-plastic properties of these wires.
The methods of EBSD, densitometry, and XRD showed the presence of NSDL (near-surface defect layer, in which most of the defects of the void nature are concentrated) in the wires of cables of both types. A significant change in the Young’s modulus, decrement, and stress of the microplastic flow after the removal of the surface layer also indirectly confirmed the existence of defects in the near-surface layer of the Al wire and their significant contribution to the physical properties of the wire.
Analysis of the EBSD maps (Figure 2 and Refs. [10,37]) taken in the center and at a distance of ~150 µm from the edge of the facets of the cross-sections of the wires, which, based on the constructed histograms of grain-boundary misorientation-angle distribution (Figure 6), has made it possible to gain a qualitative conclusion about the difference in the morphology of the near-surface layers and the bulk region in wires of both types after operation. The presence of a steel core in AC50 cables makes the grain misorientation change slightly both in the bulk and in the near-surface layers of AC50 wire over a service life, in contrast to the wire from A50 cables without the stabilizing effect of the steel core, where in the near-surface layers there is a more pronounced tendency to align the crystal lattice of grains along one common direction. The formation of such a textured structure in the near-surface layers of Al wires is probably associated with the combined effect for a long time of the ambient temperature during operation, electric current, and electric voltage, as well as the tensile load, which is noticeably higher in wires of A50 type cables than in AC50 ones due to the absence of a steel core in the A50 cables. Such low-temperature annealing under load contributes to the fact that the grain size in the direction of stretching increases more than in the transverse direction, that is, there is some “pulling” of the grains in the direction of the load [53], as it was observed on the EBSD maps obtained from the longitudinal sections of A50 wires [10].
The application of the densitometry method to the wires after the sequential removal of near-surface layers of a certain thickness by etching has made it possible to quantify the NSDLs’ characteristic thicknesses (Figure 7), amounting to ~10 μm and ~30 μm for wires of both types. In both cases, when approaching the surface, the integral density ρd measured by densitometric technique decreases according to a law close to the exponential-decay law. The greatest drop in ρd is observed in a narrow near-surface layer up to ~10 μm (~80–85% of the total reduction), the smallest value of ρd being near the surface. Taking into account the absence of light chemical elements in sufficiently large quantities according to the results of the EDX microanalysis (Table 3 and Section 3.1), obviously, it indicates the presence of defects of a void nature (nano and micropores, microcracks) in the narrow near-surface layer, the concentration of these defects increasing when approaching the surface. Deeper inside a wire, ρd grows weakly until stabilization at depths from ~10 μm to ~30 μm from the surface, apparently due to a decrease in the number of defects. Such a change in the density and in the number of defects is expected since it is the surface of a wire that is affected by the environment and neighboring wires in the first place.
As noted in Section 3.3, the presence of a steel core leads to the phenomenon that in a narrow (~5 μm thick) near-surface layer of an AC50 wire, the integral density defect ΔρdL/ρdL (calculated by Formula (3)) is somewhat smaller (by ~0.1–0.2%) in absolute value than in an A50 wire (Figure 7), i.e., the integral density ρdL in this thin layer in the AC50 sample obtained by densitometric measurements of the wire after etching (Formula (2)) is slightly higher than that in the A50 wire. Moreover, the integral density ρd of the entire AC50 wire is ~0.05% higher than that of the A50 wire.
Thus, the density of NSDL in AC50 wire and the integral density of the entire AC50 wire are greater than in A50 wire, which can be caused by various reasons.
First, when the cable is stretched because of sagging and under the influence of the surrounding atmosphere, changes in ambient temperature, and vibrations caused by the wind, the parameter a of the unit cell of the wire Al-material increases, as was established by XRD studies (Figure 13a). As a result of stretching the crystal lattice of Al wires after operation, the X-ray density ρx of the wire Al material, calculated from structural data, decreases (see Formula (4) and Figure 13b). Obviously, this also leads to a decrease in the integral density ρdL of NSDL and the integral density ρd of the entire wire, measured by densitometry. The same causes lead to the formation of microvoids (microcracks) with a higher concentration of them near the surface due to the effect of fretting, which leads to a decrease in the ρdL in NSDL and the integral density ρd of the entire wire. In the presence of a steel core, the influence of many of the above listed factors (sagging, vibrations, etc.), leading to a reduction in the integral density of the NSDL and the whole wire, is reduced. As a result, the integral densities ρdL of NSDL in the AC50 wire and the ρd of the entire AC50 wire degrade (decrease) less than in the A50 wire.
Second, as is known, the maximum acceptable operating temperature of wires of the A50 and AC50 types does not exceed 90 °C, with the possible interval of air temperature being from −40 °C to +40 °C. It is worth recalling that the coefficients of linear thermal expansion are different for aluminum and steel. So, under certain conditions, despite the fact that steel is much stronger than aluminum, the tension of the aluminum part of the wire can noticeably weaken as the temperature rises, whereas the mechanical load on the steel elements of the wire increases slightly. It is possible that this is just a circumstance that provides a greater value of densities ρdL in NSDL and ρd of aluminum wires of an AC50 type cable after operation compared to an A50 cable without a steel core.
Furthermore, taking into account the fact that densities ρd of wire and ρdL of wire NSDL obtained by the densitometric method are integral quantities averaged, respectively, over the densities of all wire or wire NSDL components, the higher density ρdL in NSDL of the Al wires of the AC50 cable compared to the A50 cable, at least at depths up to ~5–10 µm (and, accordingly, a lower value in terms of the absolute magnitude of the negative density defect ΔρdL/ρdL, see Figure 7) can be due to a larger proportion of Al oxides formed in the NSDL of wires of the AC50 cable (Figure 11), probably as a result of the oxidizing action of the steel core. These aluminum oxides (δ- and/or δ*-Al2O3) are characterized by a higher nominal calculated XRD density (~3.7 g/cm3) [51,52] compared to Al (~2.7 g/cm3) [50]. Hence, the observed integral density ρdL of NSDL and, consequently, the total integral density ρd of the Al wires of an AC50 type cable will be higher than that of an A50 cable. However, it should be noted that alumina crystallites formed in NSDLs of wires are much denser and harder than aluminum crystallites. It enhances the influence of the fretting effect and, as noted above, leads to the opposite effect of a decrease in density due to the formation of void defects. Since in AC50 wires, probably due to the oxidizing effect of the steel core, the proportion of aluminum oxides is higher compared to A50 wires, the influence of both effects in AC50 wires will arise competitively. On the one hand, due to the greater proportion of aluminum oxides with a higher XRD density than the XRD density of aluminum, integral densities ρd and ρdL increase. On the other hand, due to the greater influence of fretting, more voids are formed and the integral densities ρd and ρdL decrease.
Profiling the near-surface layer by analyzing XRD reflections with different Bragg angles 2θB corresponding to different X-ray-penetration depths has confirmed the presence of NSDLs in Al wires of both types and made it possible to obtain their quantitative characteristics. All trends indicated by the results of density measurements discussed above are also confirmed. As a result of the smooth expansion of the Al lattice (an increase in the unit cell parameter a of the wire Al material) while approaching the sample surface, the X-ray density ρx calculated from the structural data decreases (see Formula (4)). This decrease in ρx with decreasing depth T from the surface occurs according to an exponential decay law similar to the dependence of the densitometric density ρdL of the near-surface layer on the thickness Tetch of the layer removed by etching, although flatter (cf. Figure 7 and Figure 15b).
Based on the dependences ρx(T) obtained from the analysis of XRD reflections corresponding to different X-ray penetration depths (i.e., different depths from the wire surface), two characteristic thicknesses of NSDLs of the wires were estimated. One of the characteristic thicknesses obtained from XRD studies (Section 3.4) is close to the characteristic NSDL thickness of ~30 μm obtained from densitometric measurements. In particular, the characteristic thickness Tlayer, corresponding to the density ρxTlayer ~99.6% of the density ρxbulk in the bulk of wire, is Tlayer = 36.4–39.1 μm for A50 wires and Tlayer = 35.9–38.2 μm for AC50 wires of different service life lengths (Figure 16).
Thus, the presence of a steel core (in ACSR (AC50) cable) results in a lower Tlayer, i.e., in a smaller thickness of that part of the NSDL where the main drop of the X-ray density ρx occurs (~50–70% of the total decrease from ρxbulk) when approaching the surface. Although the second characteristic thickness Tlayersat, which corresponds to the density ρxsat ~99.99% of ρxbulk and thus to the entire thickness of the layer from the surface, where almost the entire observed decrease in the X-ray mass density ρx (~99%) occurs, is practically the same for A50 and AC50 type wires after 18–20 years of operation (115 µm–119 µm) and ~1.5 times more after 8–10 years of service for AC50 wire (with steel core) than for A50 wire without steel core (160 µm vs. 96 µm, respectively). At the same time, in wires without operation, the value of Tlayersat of the total thickness of NSDL in AC50 wire was, on the contrary, ~2.5 times less compared to A50 wire (respectively, ~56 μm vs. ~22 μm, see Figure 16). It is possible, however, that such a non-smooth (irregular) dependence of the total thickness of Tlayersat of NSDL in AC50 wires on the cable-operation duration t, in contrast to the almost linear increase in Tlayersat for A50 wires, is not due to the presence of a steel core in AC50 wires, but to the peculiarities of manufacturing the cables under study.
A noticeable difference in the amplitude of changes in the unit cell parameter a of the wire Al material and, thus, in both the calculated X-ray density ρx and density defect Δρx/ρx depending on the depth T from the surface (Figure 15a,b) is another peculiarity obtained from the analysis of XRD reflections from wires, which indicates a notable effect of the steel core in cables AC50 and A50 of the same cross section of ~50 mm2 of the Al component of the cables. For unused wires and at depths T ≈ 25 μm–36 μm from the wire surface after operation for both types of cables, the approximation dependences ρx(T) practically coincide. On approaching the surface, the approximation curves ρx(T) begin to diverge for operated wires of different types, and the closer to the surface they get, the greated. Moreover, in the presence of a steel core, the decrease in ρx(T) and in Δρx/ρx is smaller. For example, near the surface (T ≈ 12 μm) of wires from cables of the AC50 and A50 types, respectively, after 8 years–10 years of operation, the density defect Δρx/ρx decreases in absolute value by ≈9 and ≈14 times compared to the value established for the depth from the surface Tlayer. After 18 years–20 years of operation, this difference is ≈21 and ≈23 times for AC50 and A50 wires, respectively.
Thus, in the presence of a steel core in the cable after operation in overhead power lines, the decrease in the X-ray density ρx in the NSDLs of the cable wires when approaching the surface from the depth of the wire occurs more gently. This flatter course of ρx(T) in NSDLs of AC50 wires indicates that the degradation (“aging”) of the AC50 wires from cables with steel cores is slower. The quantitative characteristics of wire degradation were obtained by analyzing the wire parameters averaged over all observed reflections, i.e., over the NSDL with a thickness of ~35.5 μm (Figure 13a,b). In the presence of a steel core (ACSR (AC50) cable), the rate of expansion of the crystal lattice and, thus, that of decrease in the X-ray density ρx of the Al material of wires in NSDL with a thickness of ~35.5 μm is ~1.2 times lower (−2.13(7) ∙ 10−4 g/cm3/year for AC50 wires in comparison to −2.52(8) ∙ 10−4 g/cm3/year for A50 ones, see Section 3.4). As a result, the delay in the degradation of the lattice and ρx of the Al material of the AC50-type wires ranges from ~1 year after a service life of ~10 years up to ~3 years after ~20 years of operation.
The method of calculating ρx (namely, from the unit cell volume of the Al material in NSDLs of wires (Formula (4)) directly indicates that the cables are less stretched because of vibrations due to wind and, possibly, temperature fluctuations of the surrounding atmosphere, which are the main reasons for the higher density ρx in NSDL of Al wires from AC50 cables compared to A50 ones. Due to the stabilizing effect of the steel core, the wires of an AC50 cable are less affected by vibrations and stretches. As a result, the Al lattice of the wire material of AC50 cable expands less, and accordingly, the X-ray density ρx estimated from XRD structural data decreases less compared to A50 wires.
The ~10% lower rate of amplification of the effects of the preferential orientation of XRD reflections attributed to the Al material of the wires of the AC50-type cable during operation with an increase in service life from 8 to 20 years compared to those of the A50 one with an increase in service life from 10 to 18 years (Table 4 and Figure 10) can probably also be associated with the stabilizing effect of the steel core in AC50 wires and, thus, limitation of the cable stretch during vibrations because of the wind influence. This observation is also consistent with the result of the EBSD analysis (Section 3.2), that in the near-surface layer of AC50 wires there is a less pronounced tendency to align the crystal lattice of grains along one common direction than for A50 wires.
The lower stretch of the AC50 cable during service due to the stabilizing effect of a steel core in comparison to the A50 cable without a steel core is probably also a reason for the lower value of average microstrain εs formed in the Al crystallites of NSDL of wires of AC50 cables after service in comparison with that of A50 cables (Figure 14b). Moreover, apparently, the same reason is associated with a lower value of microstrains εssat observed at depths T below the wire surface in AC50 wires after operation compared to A50 ones (Figure 19). In this case, directly at a depth from the surface down to T ≈ 12.5 μm, the wires of both types are apparently relaxed (εs = 0), which seems to be the natural state of the surface of the wires.
One can see from Figure 15b for AC50 wires and from [10] for A50 samples that the value of the X-ray density ρxbulk in the bulk of the wire at depths T of 200 μm and more (and, accordingly, the value ρxsat = 0.9999 ∙ ρxbulk), which are estimated by extrapolation from the approximation curves ρx(T) for unexploited samples A50 and AC50, are close to each other. Quantitative estimation by approximating curves ρx(T) gives ρxbulk = 2.6987(2)g/cm3 and 2.6970(2) g/cm3 for A50 and AC50, respectively. These ρxbulk values also agree satisfactorily with the average density values in NSDL of wires ρx = 2.6973(2) g/cm3 and 2.6972(2) g/cm3 (Table 4). Therefore, the X-ray densities ρx estimated for NSDLs of wires and their bulk agree satisfactorily for the two types of zero-service-life wires. These estimated values of ρx are larger than the tabular calculated X-ray density of Al material at a temperature of 312.3 K, which is close to the temperature of XRD measurements in this work (ρx = 2.6964 g/cm3 according to PDF-2 card 01-071-4008). As discussed in Section 3.4, this discrepancy may be because of the inclusion of a few Si and Fe atoms in the Al structure, which are present in the composition of wires according to EDX (Table 3, Figure 1a,b and Ref. [37]).
For wires of both types, when service life increases from 0 to 18–20 years, a decrease in both the X-ray density ρx of the Al material averaged over NSDL of 35.5 μm thick (i.e., averaged over the near-surface layer with a thickness of about 1st characteristic thickness Tlayer of NSDL from the wire surface, see Figure 13b) and the integral density ρd of entire wire (Figure 8) obtained from densitometry measurements is observed. Moreover, for A50 wire from the AAAC type cable, the average X-ray density defect Δρx/ρx (NSDL characteristic) and the defect of the integral (densitometric) density of the entire wire increase in absolute value from ~0% for unused wire to practically the same value ≈ −0.17% after 18 years of operation. In the case of AC50 wires from the ACSR cable, the average defect of the X-ray density of NSDL wire is also ~0% for unused wire and Δρx/ρx = −0.162(1)% after 20 years of operation, i.e., somewhat less in absolute value than for A50 wire with a comparable service life. Thus, although the tendency to decrease the density ρx of the NSDL with a thickness of Tlayer ~35.5 µm is the same for both types of cables, for AC50 wire the decrease is less than for A50 wire, which once again emphasizes the stabilizing effect of the steel core in AC50 cables.
However, as one can see from the inset to Figure 15b for AC50 wires and Ref. [10] for A50 wires, unlike the average ρx in NSDL of a thickness from the surface of about Tlayer ~35.5 µm, the XRD density ρxsat = 0.9999 ∙ ρxbulk at depths T = Tlayersat (~100 µm–160 µm for wires after operation ~10–20 years) does not decrease but increases with an increase in service life from 0 to ~20 years. Figure 23 shows the obtained values of the density ρxbulk and the unit cell parameter abulk of the Al material in the bulk, recalculated from ρxbulk using Formula (4) depending on the service life t. For both kinds of wires, the initial value (t = 0 years of operation) of ρxbulk is close to the tabular value ρx of pure Al powder at a temperature approximately equal to the temperature of XRD measurements in this work. As can be seen, the dependences ρxbulk(t) for wires of both types qualitatively resemble the dependences of the fraction q(t) of the Al2O3 phases in the wires (Figure 11). For wires of the A50 cables, the dependences ρxbulk(t) and q(t) are close to linear in the interval from 0 to 18 years, with the density ρxbulk increasing from the initial value by ≈0.4% to ρxbulk = 2.7092(2) g/cm3 after 18 years of service. In the presence of a steel core (the AC50 cables), ρxbulk increases from the initial value to almost the same value ρxbulk = 2.7091(2) g/cm3 after 8 years of service, slightly decreasing to ρxbulk = 2.7085(2) g/cm3 after 20 years of operation.
This contradiction can probably be qualitatively explained as follows. The integral density ρd obtained in densitometric investigations is a characteristic of the entire wire volume (NSDL and bulk, including all crystalline and non-crystalline phases), which is measured experimentally. On the contrary, the X-ray densities ρxbulk in the bulk of the wires are estimated from the approximation dependences of the X-ray densities ρx(T) down to large depths T ~200 μm from the surface, where the experimental values of ρx are calculated from the experimental values of the unit cell parameter a of the Al material in the NSDL of wires at depths T from ≈12.5 μm to ≈35.5 μm. Along with a possible partial overestimation of the value of ρxbulk due to experimental errors in determining the Bragg angles 2θB of the observed Al reflections and, accordingly, the individual values of the X-ray density ρx corresponding to these reflections, another physical reason for the increase in the X-ray density of ρxbulk in the volume (in the bulk) of wires can be considered. The increase in the density ρxbulk in the bulk of the wires corresponds to the compression of the lattice in the bulk and correlates with the increase in the proportion of aluminum oxides δ- and/or δ*-Al2O3 (Figure 11), with higher mass densities ~3.7 g/cm3 than ~2.7 g/cm3 of aluminum. Presumably, the formed aluminum oxide crystallites compress the Al lattice of the wire material, the values of ρxbulk increasing consequently.
Structural and microstructural data obtained by the methods of EBSD, XRD, and densitometry fully explain the changes in elastic and microplastic properties during the operation of wires (Figure 22). The decrease in the elastic modulus E for the A50 for the entire 18-year period of operation and after 8 years of service for the AC50 is most likely due to a decrease in the integral (ρd) and XRD (ρx) density of samples detected by densitometry and XRD methods. A slight increase in the E modulus for the AC50 from 0 to 8 years of operation can be explained by taking into account the data on the proportion of aluminum oxides shown in Figure 11. For AC50, after 8 years of service, the volume fraction of Al2O3 oxides in the wire NSDL is almost three times greater than for A50. According to the literature data, the elastic modulus for Al2O3 is E = 247–380 GPa compared to E ~70 GPa for Al, therefore, the formation of such a layer contributes to the increase in the elastic modulus of the AC50 wire. With an increase in the service life of up to 20 years, it is likely that the formation of defects of a hollow nature (nano and micropores, etc.) in Al wires is decisive for changing the E modulus and leads to its decrease in AC50 wires. In addition, the alignment of the crystal structure of grains in the near-surface layer along one direction and their elongation in the direction of stretching [10] and the crystallographic texture of crystallites along [011], which is enhanced for both types of wires during their operation, can also affect the modulus of elasticity [54].
In the behavior of the amplitude-independent decrement δi, depending on the operating time t (Figure 22), it can be noted that for AC50, the decrement δi changes slightly, while for A50, its changes are substantial. The observed change for the A50 is most likely due to more intensive plastic deformation processes caused by a greater load resulting from the absence of a steel core. This is also indirectly confirmed by the results of EBSD for longitudinal sections of A50 wires, according to which the process of changing the shape of the grains to a more elongated one in the direction of the load action takes place in the surface layer [10]. At the same time, the non-monotonic nature of the change in δi(t) for A50 correlates with the dependence of the sizes of the crystallites D(t) (Table 4 and Figure 14a). These microstructural changes are associated, among other things, with a change in the dislocation structure of the material, which determines the changes in the decrement δi. The same structural changes also affect the change in the microplastic stress σs(t) (Figure 22), which demonstrates the positive effect of the steel core in overhead power line cables, leading to the preservation of a high level of σs in AC50 wires with a service life of up to 20 years for the studied samples.
Thus, EBSD, densitometry, and XRD methods have shown that the steel core in AC50 type cables leads to a slower change in NSDL of Al wires from cables of this type compared to wires from A50-type cables (without steel core). Remarkably, acoustic studies demonstrated less change and even improvement in the deformation characteristics of AC50 wires compared to A50 wires, which correlates with the results of EBSD, densitometry, and XRD.

5. Conclusions

The studies carried out using EDX, EBSD, densitometry, XRD, and acoustic techniques have made it possible to quantitatively estimate the structural, microstructural, and deformation characteristics of Al wires from AAAC (A50) and ACSR (AC50, or AC50/8 in full designation) overhead power line cables after different service life periods from 0 to 20 years.
It has been found that NSDLs with defects of a void nature are formed in Al wires of both types. The integral density ρd, which is measured using the densitometric method, and the X-ray density ρx, which is calculated from the unit cell parameter a of the lattice of the Al material in NSDL of wires, decrease according to a law close to the exponential-decay law as the depth T from the surface decreases, although more gentle in the case of ρx(T) than ρd(T). With an increase in the operating time, the ρx and ρd values at depth ~12.5 μm near the wire surface decrease significantly (density defect Δρx/ρx ≈ −1.1% after a service life of ~20 years in comparison to Δρx/ρx ≈ −0.2% in non-exploited samples and ≈ 0% in the bulk).
The characteristic thicknesses of NSDLs of ~10 μm, ~30 μm–40 μm, and ~100 μm–160 μm for the two types of wires after operation were established, corresponding to ~(80–85)% of the total drop of ρd, ~100% of the total decrease in the ρd and ~50%–70% of the total decrease in ρx, and a ~99% decrease in the X-ray mass density ρx, respectively. The difference in the results obtained by the methods of densitometric and XRD profiling is associated with the different sensitivity of the methods to different effects on the wires during operation. In the case of X-ray density ρx, which is calculated from structural data, the structural state of the Al material of the NSDL of wire will play a major role. The Al lattice of the NSDL of wire expands when approaching the surface, and, accordingly, the X-ray density ρx decreases, which is mainly due to the formation of defects of a void nature in the NSDL of wires under the action of vibrations due to wind, temperature fluctuations of the surrounding atmosphere, and fretting. In the case of densitometric density ρd, which is an integral value, an important role is also played by the contribution of other phases, aluminum oxides in particular, the crystallites of which are formed when the service life increases, which, in turn, leads to the formation of a larger number of void defects near the surface because of the fretting amplification.
The presence of a steel core plays a stabilizing role in changing the structural, microstructural, and deformation characteristics.
In the presence of a steel core in the AC50 type cables, the wires of this cable show a ~0.2% lower drop in both integral and X-ray densities in comparison with the wires of AAAC A50 cables with comparable service life durations. Furthermore, in the presence of a steel core (ACSR-type AC50 cable), the thickness Tlayer of that part of the NSDL where the main decrease in X-ray density ρx (~50–70% of the total drop) occurs when approaching the surface is 1–2% less than that in wires from AAAC-type A50 cables without a steel core. For wires from AC50 cables, a smaller value of microstrains is observed, which are formed at depths T ≥ 15 μm from the wire surface in NSDL after operation, compared to A50 cables, and it is associated with the steel core effect limiting cable vibrations because of wind.
The degradation rate of the average parameter a of the Al cubic unit cell of wires with a service life of 0–20 years and their density ρx, which is calculated from XRD data in NSDL with a thickness of ~35.5 μm, with the service life in the presence of a steel core is noticeably lower (respectively, 1.07(3) ∙ 10−4 Å/year and −2.13(7) ∙ 10−4 g/cm3/year for AC50 wires compared to 1.26(4) ∙ 10−4 Å/year and −2.52(8) ∙ 10−4 g/cm3/year for A50 wires). As a result, the expansion of the lattice in the NSDL and, accordingly, the decrease in the X-ray density ρx of the NSDL Al wire material from A50 type cables without a steel core occurs faster by ~1 year after a service life of ~10 years and by ~3 years after ~20 years of operation.
At the same time, in comparison with A50 cables, the presence of a steel core in AC50-type cables leads to a significantly smaller change in the deformation characteristics of AC50 wires and, even, to some improvement in their early stages of operation, lasting at least up to 8 years. This smaller change and improvement in the deformation characteristics of AC50 wires is associated with less development of defects in the near-surface layer of up to ~30 µm thick for wires made of AC50 type cables compared to wires made of all-aluminum A50 cables.

Supplementary Materials

The following supporting information can be downloaded at https://www.mdpi.com/article/10.3390/cryst12091267/s1, Section S1. X-ray diffraction details: Figure S1. Comparison of dependences of the average crystallite size D, calculated within the framework of the zero microstrain model (εs = 0), on the service life duration t for Al-wires of A50 and AC50 type cables of the overhead power lines; Figure S2. WHP and SSP of AC50 wires, without exploitation and after 8 (and 20 years of exploitation.; Figure S3. Distribution of the mass X-ray density ρx(T) of the wire Al material along the depth T from the surface of the A50 and AC50 wires.

Author Contributions

A.A.L., Conceptualization, Investigation (XRD), Methodology, Validation, Project administration, Software, Data curation, Formal analysis, Visualization, Writing—original draft preparation, Writing—review and editing; M.V.N., Conceptualization, Investigation (densitometry, acoustic), Methodology, Validation, Software, Visualization, Writing—original draft preparation; A.I.L., Investigation (SEM, EDX, EBSD), Methodology, Software, Visualization, Writing—original draft preparation; B.K.K., Investigation (acoustic), Methodology, Software, Visualization; A.G.K., Conceptualization, Investigation (acoustic), Methodology, Software; N.D.P., Data curation; Validation, Project administration; A.G.P., Writing—original draft preparation, Conceptualization; R.V.S., Conceptualization, Methodology, Project administration; P.N.B., Supervision, Conceptualization, Methodology, Funding acquisition; M.M.S., Conceptualization, Methodology; Resources; Funding acquisition; A.V.S., Conceptualization, Methodology; Resources; I.A.B., Conceptualization, Methodology; Resources. All authors have read and agreed to the published version of the manuscript.

Funding

This research was funded by Russian Federation public contract No. FSWF-2020-0025 “Technique development and method analysis for ensuring power system object security and competitiveness based on the digital technologies”.

Institutional Review Board Statement

Not applicable.

Informed Consent Statement

Not applicable.

Data Availability Statement

The data presented in this study are available on request from the corresponding author.

Acknowledgments

The work was carried out using the equipment and software of the Center of Joint Use “Materials Science and Diagnostics in Advanced Technologies” (Ioffe Institute, St. Petersburg, Russia).

Conflicts of Interest

The authors declare no conflict of interest.

Abbreviations

The following abbreviations and nomenclature are used in this manuscript:
A50AAAC cable with an Al conductor cross-section of 49.5 mm2
A7Egrade of cold-drawn aluminum according to GOST
AAACall aluminum alloy aonductor
AC50 (AC50/8)ACSR cable with Al conductor cross-section of ~50 mm2 and ~8 mm2 cross-section of steel core
ACSRaluminum conductor steel reinforced
a.m.u.atomic mass unit
EBSDelectron backscattering diffraction
EDXenergy dispersive X-ray microanalysis
e.s.d., e.s.d.s.estimated standard deviation(s)
FWHMfull width at half-maximum of XRD reflection
GOSTinterstate technical standard
NSDL, NSDLsnear-surface defect layer(s)
PDF-2Powder Diffraction File-2
pVpseudo-Voigt
Ref., Refs.Reference(s)
SEMscanning electron microscopy
SSPsize-strain plot
SMSupplementary Materials
WHPWilliamson–Hall plot
XRDX-ray diffraction
e.g.,Latin” exempli gratia” (for example)
i.e.,Latin “id est” (that is)
etc.Latin “et cetera” (and so on)
cf.Latin “confer” (compare)
2θdiffraction angle
2θBBragg angle of XRD reflection corrected to angular corrections (zero shift Δ2θzero and displacement Δ2θdispl)
2θobsobserved Bragg angle of XRD reflection
Artabular value of the atomic mass of aluminium
acubic unit cell parameter of Al
a0parameter of the Al cubic unit cell in the bulk of a new (0 years of service) wire
abulkparameter of the Al cubic unit cell in the bulk of wire of non-zero service life
Bintintegral width of XRD reflection
Ca.m.u.conversion factor of a.m.u. into gram
Daverage size of crystallites
D0mean square root value of crystallite size after averaging the Dhkl0 values over all reflections in framework of model with absence of microstrains (εs = 0)
Dhklsize of crystallite corresponding to XRD reflection with Miller indices hkl
Dhkl0size of crystallite corresponding to XRD reflection with Miller indices hkl in framework of model with absence of microstrains (εs = 0)
EYoung’s modulus (modulus of elasticity, elastic modulus)
Eiamplitude-independent Young’s modulus
foscillation frequency of wire-samples
FWHMcorrFWHMobs corrected for instrumental broadening
FWHMobsobserved full width at half-maximum of XRD reflection
hklMiller indices of XRD reflection
[hkl]Miller indices of crystallographic direction
KScherrercoefficient in Scherrer equation
Kstraincoefficient in Wilson–Stokes equation
Imaxmaximum intensity of XRD reflection
Imax022, Imax111, Imax002maximum intensitie of XRD reflection with Miller indices 022, 111, and 002, respectively
Iintintegral intensity of XRD reflection
IintAlintegral intensity of the strongest Al reflection
IintAl2O3integral intensity of the 121 δ*-(212 δ-) Al2O3 reflection
lwire-sample length
m0mass of the sample before polishing (etching)
mimass of the sample after polishing of the ith layer
N5, N5-1, etc.Number 5, Number 5-1, etc.
pa parameter of wire Al material (unit cell parameter a or X-ray mass density ρx)
p0a bulk parameter of Al material of a new (0 years of service) wire (unit cell parameter a0 or X-ray mass density ρx)
qfraction of the Al2O3 crystalline phases in wires
R0radius of the wire-sample in the form of a cylindrical rod (before polishing (etching))
tservice life duration
Tdepth from the wire surface or or penetratiun depth or temperature (in dependence on context)
Tetchthickness of the layer removed by polishing (etching)
Tlayerlayer thickness corresponding to depth where ~70% of the decrease in the mass density ρx occurs in comparison to the ρx200μm value
Tlayersatlayer thickness corresponding to depth where ~99% of the decrease in the mass density ρx occurs in comparison to the ρx200μm value
T pen h k l penetration depth of X-ray radiation, corresponding to XRD reflection with Miller indices hkl
Vcellvolume of the Al cubic unit cell
Znumber of formula units in the Al unit cell
Δ2θdispldisplacement correction
Δ2θstep2θ step of XRD scanning
Δ2θzerocorrecting shift of the zero of the counter
Δa/adefect (relative change) of the unit cell parameter a
E/E)hamplitude-dependent Young’s modulus defect (amplitude-dependent variation of E)
Δρd/ρddefect (relative change) of the mass density ρd
ΔρdL/ρdLdensity defect value of the etched layer
Δρxxdefect (relative change) of the mass density ρx
δ(logarithmic) decrement of the sample material ((logarithmic) decrement of elastic vibrations)
δ2θBe.s.d. of Bragg angle 2θB
δρd/ρdrelative error of integral density ρd
δae.s.d. of the Al cubic unit cell parameter a
δiamplitude-independent part of the logarithmic decrement δ (amplitude-independent decrement of elastic vibrations)
εvibrational strain amplitude (vibrational deformation)
εdnon-linear inelastic strain (non-linear inelastic deformation)
εsabsolute value of average magnitude of microstrains
εshklabsolute value of microstrain corresponding to XRD reflection with Miller inices hkl
εssataverage microstrain εssat in the NSDL at depths T ≥ 15 μm if the crystallite size is fixed and equal to the crystallite size at a depth of T ~12.5 μm
θhalf a diffraction angle
θBhalf a Bragg angle of XRD reflection 2θB
λwavelength of Cu-Kα1 radiation (after correction of Cu-Kα2 contribution)
μlthe linear mass absorption coefficient of material
ρmass density
ρdmass density of material measured by densitometry technique (‘densitometric density‘, ’integral density’)
ρd0density of a sample before polishing (etching) measured by densitometry technique
ρdidensity of a sample after polishing (etching) of the ith layer measured by densitometry technique
ρdLmass density of the etched layer obtained by densitometry technique
ρxmass density of material calculated according to XRD structural data (‘XRD density’, ‘X-ray density’)
ρx12.5μmXRD mass density at depth of 12.5 μm from the surface
ρx200μmXRD mass density at depth of 200 μm from the surface
ρxbulkXRD mass density in the bulk of the wire-sample
ρxTlayerXRD mass density of Al material at a depth of Tlayer
ρxsatXRD mass density of Al material at a depth of Tlayersat
ρx0XRD density in the bulk of a new (0 years of service) Al wire
ρx 0 yearsmean density of the A50 wire N5-2 (service life of 0 years)
σamplitude of vibrational stress (microplastic deformation, microplastic stress)
σsmicroplastic flow stress (microplastic stress, micro-flow stress) equal to σ at inelastic strain εd = 5.0 × 10⁻⁸
ΦEuler angle (angle of nutation)
φ1Euler angle (angle of intrinsic rotation)
φ2Euler angle (angle of precession)

References

  1. Nakhimova, L.I. (Ed.) GOST 839-2019. Non-Insulated Conductors for Overhead Power Lines. Specifications; Strojizdat: Moscow, Russia, 2019. (In Russian) [Google Scholar]
  2. Karabay, S.; Ertürk, A.T.; Zeren, M.; Yamanoğlu, R.; Karakulak, E. Failure analysis of wire-breaks in aluminum conductor production and investigation of early failure reasons for transmission lines. Eng. Fail. Anal. 2018, 83, 47–56. [Google Scholar] [CrossRef]
  3. Karabay, S.; Feyzullahoğlu, E. Determination of early failure sources and mechanisms for Al 99.7% and Al–Mg–Si alloy bare conductors used in aerial transmission line. Eng. Fail. Anal. 2014, 38, 1–15. [Google Scholar] [CrossRef]
  4. Betekhtin, V.I.; Sklenicka, V.; Kadomtsev, A.G.; Kolobov, Y.R.; Narykova, M.V. Defect Structure and Thermomechanical Stability of Nano- and Microcrystalline Titanium Obtained by Different Methods of Intense Plastic Deformation. Phys. Solid State 2017, 59, 960–966. [Google Scholar] [CrossRef]
  5. Betekhtin, V.I.; Kadomtsev, A.G.; Narykova, M.V. Evolution of a Defect Structure during Creep Tests of Ultrafine-Grained Metals and Alloys Produced by Severe Plastic Deformation. Phys. Solid State 2020, 62, 318–324. [Google Scholar] [CrossRef]
  6. Brettschneider, S.; Fofana, I. Evolution of Countermeasures against Atmospheric Icing of Power Lines over the Past Four Decades and Their Applications into Field Operations. Energies 2021, 14, 6291. [Google Scholar] [CrossRef]
  7. Lu, J.; Hu, J.; Fang, Z.; Qiao, X.; Zhang, Z. Electric Field Distribution and AC Breakdown Characteristics of Polluted Novel Lightning Protection Insulator under Icing Conditions. Energies 2021, 14, 7493. [Google Scholar] [CrossRef]
  8. Zhou, Z.R.; Cardou, A.; Goudreau, S.; Fiset, M. Fundamental investigations of electrical conductor fretting fatigue. Tribol. Int. 1996, 29, 221–232. [Google Scholar] [CrossRef]
  9. Azevedo, C.R.F.; Cescon, T. Failure analysis of aluminum cable steel reinforced (ACSR) conductor of the transmission line 1232 crossing the Parana River. Eng. Fail. Anal. 2002, 9, 645–664. [Google Scholar] [CrossRef]
  10. Narykova, M.V.; Levin, A.A.; Prasolov, N.D.; Lihachev, A.I.; Kardashev, B.K.; Kadomtsev, A.G.; Panfilov, A.G.; Sokolov, R.V.; Brunkov, P.N.; Sultanov, M.M.; et al. The structure of the near-surface layer of the AAAC overhead power line wires after operation and its effect on their elastic, microplastic, and electroresistance properties. Crystals 2022, 12, 166. [Google Scholar] [CrossRef]
  11. Kalombo, R.B.; Araujo, J.A.; Ferreira, J.L.A.; da Silva, C.R.M.; Alencar, R.; Capra, A.R. Assessment of the fatigue failure of an All Aluminium Alloy Cable (AAAC) for a 230 kV transmission line in the Center-West of Brazil. Eng. Fail. Anal. 2015, 61, 77–87. [Google Scholar] [CrossRef]
  12. Matos, I.M.; Rocha, P.H.C.; Kalombo, R.B.; Veloso, L.A.C.M.; Araujo, J.A.; Castro, F.C. Fretting fatigue of 6201 aluminum alloy wires of overhead conductors. Int. J. Fatique 2020, 141, 105884. [Google Scholar] [CrossRef]
  13. Kalombo, R.B.; Martínez, J.M.G.; Ferreira, J.L.A.; da Silva, C.R.M.; Araújo, J.A. Comparative fatigue resistance of overhead 1222 conductors made of aluminium and aluminium alloy: Tests and analysis. Proc. Eng. 2015, 133, 223–232. [Google Scholar] [CrossRef]
  14. Kalombo, R.B.; Pestana, M.S.; Freire, R.C.S.; Ferreira, J.L.A.; da Silva, C.R.M.; Veloso, L.A.C.M.; Camara, E.C.B.; Araujo, J.A. Fatigue life estimation of an all aluminium alloy 1055 MCM conductor for different mean stresses using an artificial neural network. Int. J. Fatique 2020, 140, 105814. [Google Scholar] [CrossRef]
  15. Lévesque, F.; Goudreau, S.; Cardou, A.; Cloutier, L. Strain Measurements on ACSR Conductors During Fatigue Tests I—Experimental Method and Data. IEEE Trans. Power Deliv. 2010, 25, 2825–2834. [Google Scholar] [CrossRef]
  16. Rocha, P.H.C.; Díaz, J.I.M.; Silva, C.R.M.; Araújo, J.A.; Castro. F., C. Fatigue of two contacting wires of the ACSR Ibis 397.5 MCM conductor: Experiments and life prediction. Int. J. Fatique 2019, 127, 25–35. [Google Scholar] [CrossRef]
  17. Kreislova, K.; Jaglova, M.; Turek, L.; Koukalova, A. Evaluation of corrosion of long-term exposed aluminium conductor. Koroze a Ochrana Materiálu 2013, 57, 25–34. [Google Scholar] [CrossRef]
  18. De Araujo, M.M.; Manheimmer, W.A.; Serra, E. Corrosion aspects in aluminum electrical conductors. Mater. Sci. 1988, 8, 175–197. [Google Scholar] [CrossRef]
  19. De la Fuente, D.; Otero-Huerta, E.; Morcillo, M. Studies of long-term weathering of aluminium in the atmosphere. Corros. Sci. 2007, 49, 3134–3148. [Google Scholar] [CrossRef]
  20. Vargel, C. Corrosion of Aluminium, 2nd ed.; Elsevier: Amsterdam, The Netherlands, 2020. [Google Scholar] [CrossRef]
  21. Sawada, S. Corrosion and overhead aluminum conductors and the prevention of it. Smitomo Electr. Tech. Rev. 1968, 11, 22–32. [Google Scholar]
  22. Graedel, E. Corrosion mechanism for aluminum exposed to the atmosphere. J. Electrochem. Soc. 1989, 136, 204C–212C. [Google Scholar] [CrossRef]
  23. Isozaki, M.; Adachi, K.; Hita, T.; Asano, Y. Study of corrosion resistance improvement by metallic coating for overhead transmission line conductor. Electr. Eng. Jpn. 2008, 163, 41–47. [Google Scholar] [CrossRef]
  24. Harvard, D.G.; Bellamy, G.; Buchan, P.G.; Ewing, H.A.; Horrocks, D.J.; Krishnasamy, S.G.; Motlis, J.; Yoshiki-Gravelsins, K.S. Aged ACSR conductors. I. Testing procedures for conductors and line items. IEEE Trans. Power Deliv. 1992, 7, 581–587. [Google Scholar] [CrossRef]
  25. Deng, Y.J.; Yu, J.C.; Xia, K.Q.; Yang, L. Corrosion Conditions Analysis of In-service ACSR Overhead Lines. Appl. Mech. Mater. 2013, 446–447, 753–758. [Google Scholar] [CrossRef]
  26. Havard, D.G.; Bissada, M.K.; Fajardo, C.G.; Horrocks, D.J.; Meale, J.R.; Motlis, J.Y.; Tabatabai, M.; Yoshiki-Gravelsins K., S. Aged ACSR conductors. II. Prediction of remaining life. IEEE Trans. Power Deliv. 1992, 7, 588–595. [Google Scholar] [CrossRef]
  27. Chen, G.H.; Wang, X.; Wang, J.Q.; Liu, J.J.; Zhang, T.; Tang, W.M. Damage investigation of the aged aluminium cable steel reinforced (ACSR) conductors in a high-voltage transmission line. Eng. Fail. Anal. 2012, 19, 13–21. [Google Scholar] [CrossRef]
  28. Lequien, F.; Auzoux, Q.; Moine, G.; Rousseau, M.; Pasquier-Tilliette, S.; Holande, A.; Ammi, S.; Heurtault, S.; Prieur, P. Characterization of an aluminum conductor steel reinforced (ACSR) after 60 years of operation. Eng. Fail. Anal. 2021, 120, 105039. [Google Scholar] [CrossRef]
  29. Kim, S.D.; Morcos, M.M. Mechanical deterioration of ACSR conductors due to forest fires. IEEE Trans. Power Deliv. 2003, 18, 271–276. [Google Scholar] [CrossRef]
  30. Hakansson, E.; Predecki, P.; Kumosa, M.S. Galvanic Corrosion of High Temperature Low Sag Aluminum Conductor Composite Core and Conventional Aluminum Conductor Steel Reinforced Overhead High Voltage Conductors. IEEE Trans. Realib. 2015, 64, 928–934. [Google Scholar] [CrossRef]
  31. Achiriloaiei, D.; Medeleanu, M. Studies on the Effects of Environmental Pollution on ACSR Conductors. Rev. Chim. 2019, 70, 3984–3986. [Google Scholar] [CrossRef]
  32. Jaffrey, N.A.; Hettiwatte, S. Corrosion Detection in Steel Reinforced Aluminium Conductor Cables. In Proceedings of the Australasian Universities Power Engineering Conference (AUPEC), Perth, Australia, 28 September–1 October 2014. [Google Scholar] [CrossRef] [Green Version]
  33. Karabay, S.; Önder, F.K. An approach for analysis in refurbishment of existing conventional HV–ACSR transmission lines with AAAC. Electr. Power Syst. Res. 2004, 72, 179–185. [Google Scholar] [CrossRef]
  34. Kopsidas, K.; Rowland, S.M. A Performance Analysis of Reconductoring an Overhead Line Structure. IEEE Trans. Power Deliv. 2009, 24, 2248–2256. [Google Scholar] [CrossRef]
  35. Kalombo, R.B.; Pestana, M.S.; Ferreira, J.L.A.; da Silva, C.R.M.; Araujo, J.A. Influence of the catenary parameter (H/w) on the fatigue life of overhead conductors. Tribol. Int. 2017, 108, 141–149. [Google Scholar] [CrossRef]
  36. Ma, X.C.; Gao, L.; Zhang, J.X.; Zhang, L.C. Fretting Wear Behaviors of Aluminum Cable Steel Reinforced (ACSR) Conductors in High-Voltage Transmission Line. Metals 2017, 7, 373. [Google Scholar] [CrossRef]
  37. Levin, A.A.; Narykova, M.V.; Lihachev, A.I.; Kardashev, B.K.; Kadomtsev, A.G.; Brunkov, P.N.; Panfilov, A.G.; Prasolov, N.D.; Sultanov, M.M.; Kuryanov, V.N.; et al. Modification of the structural, microstructural, and elastoplastic properties of aluminum wires after operation. Metals 2021, 11, 1955. [Google Scholar] [CrossRef]
  38. Kul’kov, V.G.; Tyshkevich, V.N.; Kuryanov, V.N.; Sultanov, M.M.; Norov, D.S.; Narykova, M.V.; Kadomtsev, A.G.; Prasolov, N.D.; Brunkov, P.N.; Likhachev, A.I.; et al. Experimental studies of fatigue strength and surface electrical resistance of aluminum wire of overhead power transmission lines. Saf. Reliab. Power Ind. 2021, 14, 189–195. (In Russian) [Google Scholar] [CrossRef]
  39. Nakhimova, L.I. (Ed.) GOST 11069-2001. Primary Aluminium. Grades; IPK Izdatel. Standartov: Moscow, Russia, 2004. (In Russian) [Google Scholar]
  40. Bruker AXS. Karlsruhe, Diffrac. Suite Eva, Version 5.1.0.5. DIFFRAC.SUITE User Manual. Bruker AXS GmbH: Karlsruhe, Germany, 2019.
  41. International Centre for Diffraction Data (ICDD). Powder Diffraction File-2 Release 2014; ICDD: Newton Square, PA, USA, 2014. [Google Scholar]
  42. Maunders, C.; Etheridge, J.; Wright, N.; Whitfield, H.J. Structure and microstructure of hexagonal Ba3Ti2RuO9 by electron diffraction and microscopy. Acta Crystallogr. Sect. B Struct. Sci. 2005, 61, 154–159. [Google Scholar] [CrossRef]
  43. Levin, A.A. Program SizeCr for Calculation of the Microstructure Parameters from X-ray Diffraction Data. Preprint. 2022. Available online: https://www.researchgate.net/profile/Alexander-Levin-6/research (accessed on 5 June 2022).
  44. Terlan, B.; Levin, A.A.; Börrnert, F.; Simon, F.; Oschatz, M.; Schmidt, M.; Cardoso-Gil, R.; Lorenz, T.; Baburin, I.A.; Joswig, J.-O.; et al. Effect of Surface Properties on the Microstructure, Thermal, and Colloidal Stability of VB2 Nanoparticles. Chem. Mater. 2015, 27, 5106–5115. [Google Scholar] [CrossRef]
  45. Terlan, B.; Levin, A.A.; Börrnert, F.; Zeisner, J.; Kataev, V.; Schmidt, M.; Eychmüller, A. A Size-Dependent Analysis of the Structural, Surface, Colloidal, and Thermal Properties of Ti1–xB2 (x = 0.03–0.08) Nanoparticles. Eur. J. Inorg. Chem. 2016, 2016, 3460–3468. [Google Scholar] [CrossRef]
  46. Welzel, U.; Ligot, J.; Lamparter, P.; Vermeulen, A.C.; Mittemeijer, E.J. Stress analysis of polycrystalline thin films and surface regions by X-ray diffraction. J. Appl. Crystallogr. 2005, 38, 1–29. [Google Scholar] [CrossRef]
  47. Nikanorov, S.P.; Kardashev, B.K. Elasticity and Dislocation Inelasticity of Crystals; Moscow Izdatel. Nauka: Moscow, Russia, 1985. (In Russian) [Google Scholar]
  48. Mason, J.K.; Schuh, C.A. Representation of Texture. In Electron Backscatter Diffraction in Material Science, 2nd ed.; Schwartz, A.I., Kumar, M., Adams, B.L., Field, D.P., Eds.; Springer: Boston, MA, USA, 2009; pp. 45–46. [Google Scholar] [CrossRef]
  49. Miller Jr, P.H.; DuMond, J.W.M. Tests for the Validity of the X-Ray Crystal Method for Determining N and e with Aluminum, Silver and Quartz. Phys. Rev. 1940, 57, 198–206. [Google Scholar] [CrossRef]
  50. Otte, H.M.; Montague, W.G.; Welch, D.O. X-ray diffractometer determination of the thermal expansion coefficient of aluminum near room temperature. J. Appl. Phys. 1963, 34, 3149–3150. [Google Scholar] [CrossRef]
  51. Tsybulya, S.; Kryukova, G. New X-ray powder diffraction data on δ-Al2O3. Powder Diffr. 2003, 18, 309–311. [Google Scholar] [CrossRef]
  52. Fargeot, D.; Mercurio, D.; Dauger, A. Structural characterization of alumina metastable phases in plasma sprayed deposits. Mater. Chem. Phys. 1990, 24, 299. [Google Scholar] [CrossRef]
  53. Kaibyshev, O.A.; Valiev, R.Z. Grain Boundaries and Properties of Metals; Metallurgiya: Moscow, Russia, 1987; pp. 156–157. (In Russian) [Google Scholar]
  54. Tromans, D. Elastic anisotropy of HCP metal crystals and polycrystals. Int. J. Res. Rev. Appl. Sci. 2011, 6, 462–483. [Google Scholar]
Figure 1. EDX spectra of the AC50 samples (a) N2-2 (8 years of service life), (b) N6 (20 years of service life).
Crystals 12 01267 g001
Figure 2. Distribution maps of Euler angles at the center (a,b) and at the edge (b,c) for cross-sections of AC50 samples after (a,c) 8 (sample N2-2) and (b,d) 20 (N6) years of service life. The legend for maps (ad) is shown in (e). Scale for the Euler angle Φ is the same as for φ2.
Crystals 12 01267 g002aCrystals 12 01267 g002b
Figure 3. Histograms of grain size distribution for the centers and edges of cross-sections of outer wires from the AC50 cables after (a) 8 years of service (N2-2) and (b) 20 years of service (N6). For better visualization, the histograms for sample edges are shifted along the abscissa axes in (a,b).
Crystals 12 01267 g003
Figure 4. Dependencies of the relative area occupied by grains vs. their size for the cross-sections of outer wires from the (a) AC50 and (b) A50 cables at the centers of the samples. All dependencies are given on the same scale for comparison. Numbers of samples and their service lives are indicated in the legends of the Figures.
Crystals 12 01267 g004
Figure 5. Histograms of grain aspect ratio distribution for the centers and edges of cross-sections of outer wires from the AC50 cables after (a) 8 years of service (N2-2) and (b) 20 years of service (N6). For better visualization, the histograms for sample edges are shifted along the abscissa axes in (a,b).
Crystals 12 01267 g005
Figure 6. Histograms of grain boundary misorientation angle distribution for the centers and edges of cross-sections of outer wires from the AC50 cables after (a) 8 years of service (N2-2) and (b) 20 years of service (N6). For better visualization, the histograms constructed for the edges of the samples are shifted along the abscissa axes in (a,b).
Crystals 12 01267 g006
Figure 7. Dependence of the value of the density defect in the near-surface layer of samples N7 (A50, service life of 18 years) [10] and N6 (AC50, service life of 20 years).
Crystals 12 01267 g007
Figure 8. Dependence of the integral value of the density defect in A50 wires on the service life during operation up to 54 years.
Crystals 12 01267 g008
Figure 9. XRD patterns detected from wires of AC50 cables after (a) 0 (N5), (b) 8 (N2-2), and (c) 20 (N6) years of exploitation. (d) schematically presents the XRD pattern of Al according to PDF-2 card 01-073-9843 (the height of each bar represents the intensity of the corresponding XRD reflection according to the PDF-2 card). Insets in (ac) present the 2θ diffraction angle range 21–43° on a larger scale, exhibiting the weak reflections attributed to δ*- and δ-Al2O3. The Bragg angle positions of the δ*- and δ-Al2O3 reflections are shown according to PDF-2 cards 00-056-1186 and 00-046-1215, respectively, using different symbols. The Miller indices hkl of the observed reflections are indicated.
Crystals 12 01267 g009aCrystals 12 01267 g009b
Figure 10. Dependence of the Imax022/Imax111 ratio on the service life t of the Al wires from the AC50 and A50 cables. Lines connecting the experimental points are guides to the eye only.
Crystals 12 01267 g010
Figure 11. The fraction q of the Al2O3 crystalline phases in wires from A50 and AC50 cables with an exploitation duration of up to 20 years, which is estimated as q = IintAl2O3/IintAl ∙ 100%, where IintAl2O3 is the integral intensity of the 121 δ*-(212 δ-) Al2O3 reflection and IintAl is the integral intensity of the strongest Al reflection.
Crystals 12 01267 g011
Figure 12. Part of the XRD patterns in the vicinity of the hkl = 133 reflection for several A50 and AC50 samples.
Crystals 12 01267 g012
Figure 13. The dependences of (a) the Al cubic crystal unit cell parameter a and (b) density ρx calculated from the XRD data on the service life t of the Al wires of overhead power transmission lines. At the right axis of (b), the scale of the corresponding density defect (reduction of density) Δρx/ρx (where Δρx = ρxρx 0 years, ρx 0 years is the mean density of the A50 wire N5-2 (service life of 0 years)) of the Al wires is shown. The horizontal line in (a) indicates the tabulated value of the Al cubic unit cell parameter a according to the PDF-2 card 01-071-4008 [50] and that in (b) exhibits the corresponding calculated ρx value. The lines running through the experimental points are guides to the eye only. In the graphs (a,b), the duration of the delay of changes of the a and ρx parameter values for A50 and AC50 wires are shown for two service life points.
Crystals 12 01267 g013
Figure 14. Comparison of dependences of (a) average crystallite size D and (b) absolute value of average microstrain εs, calculated by the WHP and SSP techniques, on the service-life duration t for Al wires from the cables of the AC50 and A50 types.
Crystals 12 01267 g014
Figure 15. Distribution of (a) the cubic unit cell parameter a(T) and (b) the XRD mass density ρx(T) of the wire Al material along the depth T from the surface of the A50 and AC50 wires. Samples are numbered according to Table 2 and their service lifetimes are shown in (a). The symbols for (b) are the same as shown in (a). At the right sides of (a,b), the axes are shown corresponding, respectively, to the lattice defect Δa/a and the density defect Δρx/ρx, which are estimated with respect to the bulk of the non-exploited sample of A50 type (N5-2, 0 years of operation). The approximation lines in (a,b) are drawn according to the exponential decay law. In (b), the thicknesses Tlayer of the NSDL are estimated for AC50 wires from the intersection of the distribution curves for AC50 samples of different non-zero service lives with the curve corresponding to a non-used sample (N5-2, service life of 0 years). The inset in (b) presents the extrapolations of the distribution curves of AC50 wires to depths of 200 μm from the surface for samples. The shown estimates of the total thickness Tlayersat of the NSDL for wires are obtained from the intersection with tangents drawn at the points when the distribution curves reach a plateau (when ρx reaches the value ρxsat = 99.99% of the density estimated from the distribution curve at a depth of 200 μm).
Crystals 12 01267 g015
Figure 16. Comparison of dependences of thicknesses of the NSDLs, at which there is a ~50–70% (Tlayer) and ~99% (Tlayersat) drop in XRD mass density, on the service life t of the wires from the overhead power line cables of A50 and AC50 types (respectively, without and with steel core).
Crystals 12 01267 g016
Figure 17. Distribution of the crystallite size D = Dhkl0 estimated in the framework of zero microstrain assumption (model εs = 0) in the Al wires along the depth T from the surface of the (a) A50 and (b) AC50 wires. Sample numbers according to Table 2 and their service lifetimes are shown in (a,b). The approximation lines in (a,b) are drawn according to the exponential-decay law.
Crystals 12 01267 g017
Figure 18. Distribution of microstrain εs = εshkl along the depth T from the surface of the AC50 wire. The microstrain εshkl is estimated under the assumption of a fixed crystallite size equal to the crystallite size D12.5μm near the surface (at a depth of T ~12.5 μm). Sample numbers according to Table 2 and their service lifetimes are shown. The inset shows an example of estimation of the average microstrain εssat in the NSDL at depths T ≥ 15 μm, if the crystallite size is fixed and equal to the crystallite size D12.5μm.
Crystals 12 01267 g018
Figure 19. Microstrain εssat calculated under the assumption of a fixed crystallite size equal to the crystallite size D12.5μm near the surface (at a depth of T ~12.5 μm) depending on the service life t of the Al wires of the overhead power lines of the A50 and AC50 types (correspondingly, AAAC and ACSR types, without and with steel cores).
Crystals 12 01267 g019
Figure 20. Dependences of the Young’s modulus E and decrement δ on the amplitude of vibrational deformation ε for Al wires of (a) A50 type after 10 years of service before (N8_1,2,3) and after (N8_1′) etching and (b) AC50 type after 20 years of service (N6_1,2,3). The measurements were taken at room temperature.
Crystals 12 01267 g020
Figure 21. Diagrams of microplastic deformation σ(εd) of Al wires of (a) A50 type after 10 years of service before (N8_1,2,3) and after (N8_1′) etching and (b) AC50 type after 20 years of service (N6_1,2,3). The measurements were taken at room temperature.
Crystals 12 01267 g021
Figure 22. Dependences of Young’s modulus E, amplitude-independent decrement δi, and microplastic stress σs for Al wires on operating time t. The measurements were taken at room temperature.
Crystals 12 01267 g022
Figure 23. Dependences of the densities ρxbulk and unit cell parameters abulk in the bulk of the wires from the cables of AAAC (A50) and ACSR (AC50) types on the service life t of the cables.
Crystals 12 01267 g023
Table 1. Characteristics of A50 and AC50 overhead power-line cables according to Ref. [1].
Cable TypeNumber of Al Wires in CableNumber of Steel Wires in CableIndividual Wire Diameter, mmCable Section, mm2Estimated Cable Weight, kg/kmCable Breaking
Strength
(≤), N
A50703.049.51358198
AC50613.256.24 a19517,112
a Al/Fe section is of 48.2 mm2/8.04 mm2.
Table 2. Samples of cables of overhead power lines with different service life, which were selected for research (samples A50 are from [10,37]) 1.
Sample, N5-2582-276
TypeA50AC50A50AC50A50AC50
Service life t, years001081820
Wire diameter d, mm3.023.202.853.243.033.07
1 Additionally, samples of the A50 type that do not have an AC50 counterpart in service life (N3, 35 years of service life (same as in Refs. [10,37]) and N10, 54 years) were investigated in some experiments.
Table 3. Chemical composition of A7E-grade aluminum used by the manufacturer (wt.%) according to Ref. [39]. The lower limit of the Al weight content and the upper limits of possible impurities in the wire material are indicated.
AlFeSiZnGaMgCuTi + V + Cr + MnOther
99.590.200.080.040.030.020.010.010.02
Table 4. XRD analysis results of A50 and AC50 wires (temperature of measurements is T = 314 ± 1 K). Sample numbers and sample service life (years) are given according to Table 2. Table data from PDF-2 for crystalline Al phase are shown for comparison.
Observed Preferential Orientation WHPSSP
Sample N/Years[hkl]Imax022/Imax111, %
Imax002/Imax022, %
a, Å/ρx, g/cm3
D0, nm (εs = 0)
D, nm
εs, %
D, nm
εs, %
A50 type
5-2/0[011]42.0(3)
76.4(7)
4.05026(12)/2.6973(2)
109(16)
111(14)
0.010(14)
109(16)0
8/10[011]69.0(4)
66.1(4)
4.0515(5)/2.6949(11)
139(16)
302(54)
0.031(2)
298(26)
0.031(2)
7/18[011]153.8(1.6)
55.6(6)
4.0525(9)/2.6927(17)
126(33)
246(55)
0.033(3)
252(32)
0.034(3)
AC50 type
5/0[011]75.8(9)
68.4(9)
4.05032(10)/2.6972(2)
138(16)
141(17)
0.007(11)
138(16)
0
2-2/8[011]90.9(6)
38.8(4)
4.0511(4)/2.6956(7)
136(29)
212(28)
0.026(3)
219(19)
0.026(3)
6/20[011]180.7(2.0)
42.7(5)
4.0525(8)/2.6929(15)
120(23)
187(27)
0.029(3)
167(13)
0.025(3)
Table data for crystalline Al powder
PDF-2 card
01-071-4008, [50]
T = 312.3 K
no-
-
4.050694/2.69642
-
--
PDF-2 card
01-073-9843, [49]
T = 298 K
no24.0
191.7
4.04932(2)/2.6992(4)
-
-
-
-
-
Table 5. Samples of cables of overhead power lines’ Young’s modulus E, amplitude-independent decrement of elastic vibrations δi, and microplastic flow stress σs of the aluminum samples prepared from wires of overhead power lines with different service life and selected according to the criterion of the smallest value of the amplitude-independent decrement δi. For each sample, the number of studied pieces cut from wires of the same service life is indicated.
Sample
N
TypeService Life t,
Years
E, GPaδi · 105σs, MPa
at εd = 4 ∙ 10−8
5-2 (3)A50072.782314
5 (1)AC50071.842715
8 (3)A501071.301338.0
2-2 (3)AC50872.871716
7 (1)A501871.21859.0
6 (3)AC502071.583113
Publisher’s Note: MDPI stays neutral with regard to jurisdictional claims in published maps and institutional affiliations.

