Review

Simulation of Microstructure Evolution in Mg Alloys by Phase-Field Methods: A Review

1
Henan Key Laboratory of Intelligent Manufacturing of Mechanical Equipment, Zhengzhou University of Light Industry, Zhengzhou 450002, China
2
National Engineering Research Center of Light Alloy Net Forming, Shanghai Jiao Tong University, Shanghai 200240, China
3
State Key Laboratory of Metal Matrix Composite, Shanghai Jiao Tong University, Shanghai 200240, China
4
Luoyang Institute of Special Materials Research, Luoyang 471600, China
*
Authors to whom correspondence should be addressed.
Crystals 2022, 12(9), 1305; https://doi.org/10.3390/cryst12091305
Submission received: 16 August 2022 / Revised: 8 September 2022 / Accepted: 10 September 2022 / Published: 15 September 2022
(This article belongs to the Special Issue Advances in Magnesium Alloys: Microstructure, Coating, and Machining)

Abstract

:
Microstructure is one of the vital factors that determine the mechanical properties of magnesium (Mg) alloys. However, traditional microstructure characterization methods hardly satisfy the needs of tracking the morphological evolution of Mg alloys. With the rapid development of computer simulation, using the phase-field method to simulate the evolution of microstructures in Mg alloys has become the new norm. This article provides a review of the applications of the phase-field method in Mg alloys. First, classic phase-field models and the derived multi-phase and polycrystalline phase-field models are reviewed, then a review of the twin and solid-state phase transition phase-field models was undertaken, and the research progress of phase-field simulation in the solidification, recrystallization, and solid-state phase transformation of Mg alloys, were gradually introduced. In addition, unresolved problems of phase-field simulation were summarized, and the possible direction of future studies on phase-field simulation in Mg alloys field were discussed.

1. Introduction

Mg alloys have received increasing interest in recent years for their structural components in automobile, bio-medical implants, and aerospace technology, due to their high specific strength, low density, and excellent castability [1,2,3,4]. These excellent properties primarily result from microstructures formed during solidification and other processing steps (rolling, machining, heat treatments, etc.). Dendrites are the most common microstructure in the solidification process of Mg alloys, and their morphological characteristics determine the mechanical properties of Mg alloys, while their microstructural morphology is usually influenced by the cooling rate and solidification rate [5]. Therefore, studying microstructure evolution during the manufacturing, processing, and service of Mg alloys is of critical importance for the accurate control and further improvement of their mechanical properties. However, traditional experimental methods, for example, electron micrograph observation, hardly acquire the whole temporal process of microstructure evolution accurately. In contrast to these methods, the development of synchrotron X-ray tomography techniques has enabled the in situ observation of microstructure formation of metallic material. Due to the limitation of sample thickness, only the two-dimensional (2D) and pseudo three-dimensional (3D) characterization of alloys’ microstructure can be realized [6,7]. In addition, experimental methods require a lot of time and budget. Consequently, a more efficient and convenient simulation method is urgently needed to predict the evolution of microstructure.
Recently, with the development of efficient numerical algorithms and computation technology, it becomes feasible to simulate the microstructural evolution of materials during the fabrication, processing, and service, of materials in real time and length scales. At present, typical simulation methods for microstructural evolution of alloy materials include deterministic simulation method [8,9], the stochastic method [10,11], and the phase-field method [12,13]. Among them, the deterministic method, which is based on solidification kinetics, establishes a functional relationship between interface kinetics and undercooling, and combines with the temperature field to predict the evolution of the microstructure in a wide range. However, the deterministic method could not describe the transformation process from columnar grain to equiaxed grain during solidification, and ignores some random behaviors in the grain growth, for example, the choice of preferred orientation of dendrite, which cannot accurately describe the dendrite growth in solidification. Therefore, simulation results show large deviations from actual microstructure evolution. The stochastic method, also called the probabilistic method, uses the mathematical probability method to study random distribution of grain nucleation and random orientation of dendrite growth during solidification. At present, the Monte Carlo method and the cellular automation method are widely used in the simulation of solidification microstructure. The stochastic method is suitable for microstructure evolution on a small scale, but it is difficult to simulate microstructure evolution on a large scale or actual castings. Compared with these simulation methods, the greatest advantage of the phase-field method is that it can avoid the trouble of tracking the microstructure interface, and accurately reproduce the movement of the interface and the morphology of microstructural. Moreover, it can also couple external fields such as temperature field, concentration field, etc. with the phase-field, so that the combination of micro and macro processes can describe the actual engineering problem with higher fidelity.
At present, the phase-field method has been widely used to study the microstructure evolution of alloys, such as solidification, recrystallization, and solid-state phase transformation, and has made great progress. Many scholars have reviewed the simulation of microstructure evolution by the phase-field method, but most of these focus on the simulation of solidification structure or solid-state transformation microstructure [14,15,16,17,18]. Furthermore, these pieces of literature are mainly devoted to the phase-field simulation of cubic structure alloys, while the review of simulation of microstructure evolution for hexagonal Mg alloys is rare. Taking Mg alloys as an example, this paper introduced the typical phase-field models of simulated microstructure and summarized the research progress of the phase-field method in microstructure evolution of Mg alloy in recent years, as shown in Figure 1 and Table 1. The main problems in this field are analyzed, and the future development trend of phase-field method for simulating Mg alloys microstructure is discussed.

2. Phase-Field Model Introduction

Since the early nineteenth century, interface motions have attracted attention, and sharp interface approaches have been introduced to solve these problems. The approach, which treated the regions separating the compositional or structural domains as mathematically sharp interfaces, has been successfully used to explain the kinetics of diffusional phase transformations in a one-dimensional system. However, there are various complex interface interactions during the phase transition, such as merging, dissolution, and dissolving, which makes it extremely difficult to track the interface, especially the 3D microstructures [12]. In comparison, the phase-field method overcomes these difficulties by introducing a set of conserved and non-conserved field variables. The continuous variation of field variables across interfaces avoids the trouble of having to separately deal with different phases and interfaces in the traditional sharp interface model. From the mathematical point of view, the phase-field method is convenient in numerical calculation by using the diffused interface; physically, the order parameter represents the state or volume of the phase and can indicate the disorder degree of the system. Meanwhile, the main advantage of the phase-field method is that the evolution of microstructure can be computed without additional efforts to track the positions of multiple interfaces. The temporal evolution of the conserved field variables that are described by the Cahn–Hilliard nonlinear diffusion equation (Equation (1)) [19,20], and the non-conserved field variables evolve with the Allen–Cahn equation (Equation (2)) [21,22]. By solving Equations (1) and (2), the shape and movement of any interface in the system can be reproduced. The expressions of Equations (1) and (2) are as follows:
c t = M δ F δ c r , t ,
φ t = L δ F δ φ r , t ,
where   r is the position, t is the time, M is the atomic mobility, and c is conserved field variables. L is the mobility of the non-conserved field variables,   φ . F is the free energy of the system.
Based on these two equations, the phase-field model has made a qualitative leap in the simulation of the microstructure of alloys after many modifications and improvements. Depending on the fields of application, phase-field model forms many classical branches, among which the phase-field models with high recognition include Wheeler-Boettinger-McFadden (WBM) model [23,24,25], Karma model [26,27,28,29], Kim-Kim-Suzuki (KKS) model [30,31,32,33], the multi-phase-field model [34,35,36,37,38,39,40,41], which was developed to solve eutectic and peritectic solidification, the polycrystalline phase-field model [42,43,44,45,46,47,48,49,50,51,52,53,54] targeting the problem of polycrystalline solidification, the solid-state phase transition phase-field model [55], and the twinning phase-field mode [56] etc. These different branches of the phase-field model are used to deal with different phase transition problems and coupling as many physical fields as possible to deal with real engineering situations.
The first phase-field model of single-phase solidification for alloy solidification is the WBM model, which is derived under the condition of consistent thermodynamics. It assumes that the solid-liquid interface is composed of solid-liquid phases with the same composition, which adds an additional double well potential to the model. Moreover, some phenomenological kinetic coefficients of the WBM model are usually obtained by the sharp interface asymptotic analysis for interface; that is, under the condition of thin interface limit approximation, the phase-field kinetic model of the diffusion interface is consistent with that of the sharp interface model. Although this method is a reasonable one to solve for the phenomenological coefficient, it has some short comings. Because of the thin interface approximation, the dynamic calculation of the phase-field model is closely related to the capillary length of the system, which limits the scale and efficiency of the calculation.
The mathematical expression of the model [23,24,25] is as follows:
F = V f c , φ , T + ε 2 2 φ 2 d V ,
f c , φ , T = 1 c f A φ , T + c f B φ , T + R T V m c ln c + 1 c ln 1 c + c 1 c Ω L 1 p φ + Ω s p φ + W g φ ,
φ t = L F φ ,
c t = · M c 1 c F c ,
T t = λ ρ C p 2 T + H C p A ¯ · φ t ,
where T is the temperature, f c , φ , T is the free energy density of the system, ε is the gradient energy coefficient, f A φ , T and f B φ , T are the free energy density of the solvent and the solute, respectively. R is the gas constant, Vm is the molar volume, Ω L and Ω s are the normal solution parameters, p φ is the interpolation function, W is the energy barrier, g φ is the double well potential function, which relates the phase-field and the component field, λ is the thermal conductivity, ρ is the density, C p is the specific heat, H is the latent heat of alloy solidification, A ¯ is the ratio of the area of the micro phase-field unit to the area of the macro temperature field unit.
In the early phase-field simulation, sharp interface analysis was used to solve the problem, and the model converged only when the interface thickness and spatial step size were large, which greatly limited the actual computing capability. Karma et al. [29] dealt with the sharp interface through asymptotic analysis under the restriction of thin interface and established the relationship between interface dynamic parameters and phase-field parameters, making the interface thickness in the model far larger than the actual interface thickness and smaller than the microstructure feature length (such as dendrite tip radius), and make the representation of interface dynamics fit the actual dynamics. This remarkable approach lays a foundation for quantitative simulation of microstructure evolution. For the existence of anomalous interface effects in the computation, Karma again found the solution [29]; all the anomalous interface effects could be suppressed by introducing an antitrapping current term into the diffusion equation. On this basis, a dilute solution binary alloy phase-field model is proposed, which makes quantitative simulation possible. The mathematical expression of the model is as follows [26,27,28,29]:
1 + k 2 1 k 2 φ U t = · D q φ U J a t + 1 + 1 k U 2 φ t ,
τ φ t = ω 2 2 φ + φ φ 3 λ 1 k φ φ 2 2 e u 1 ,
T t = D T 2 T + 1 2 H / C p Δ T 0 φ t ,
where U is the solute supersaturation, q φ = 1 φ + k 1 + φ D s / D l , here D s and D l are the diffusion coefficients in the solid and liquid, respectively.   J a t = 1 / 2 2 W 0 1 + 1 k U t φ φ / φ is the anti-trapping current.   λ is the coupling coefficient of phase-field, k is the solute partition coefficients, Δ T 0 is the cooling range, and τ is the timescale and ω is the anisotropic width of the diffuse interface.
In general, metal is not always an ideal solution and may contain multiple arbitrary components. In order to achieve quantitative simulation of the solidification structure of alloys, Kim et al. [30] successfully applied the idea of asymptotic analysis of thin interfaces to the phase-field simulation, and proposed the KKS model in 1999. Compared with the WBM model and the Karma model, the KKS model has the advantage of large simulation scale and interfacial energy can be reconciled. In addition, the KKS model can be coupled with the thermodynamic database, which makes the KKS model more widely used. However, the model is not truly quantitative. Almgren [33] pointed out that it is unreasonable to use the thin interface approximation method proposed by Karma in the pure material phase-field model, because of the difference of order of magnitude between solid and liquid diffusion coefficients, will inevitably cause three distortion effects: unreal interfacial diffusion, distorted interfacial chemical potential jumps, and interfacial bending effects. Due to the difference of diffusive properties of phases on both sides of the interface, these three effects cannot always disappear at the same time, and will also lead to spurious solute trapping effects at the interface. Antitrapping current is a great tool, but it is limited to dilute binary alloys. However, the actual engineering applications are mostly multi-component alloys. How to extend it from binary alloys to multi-component alloys, Kim [32] gave the answer in 2007. Based on the original KKS model [30], Kim coupled the phase-field model containing the antitrapping current term with the thermodynamic database, assuming that the solid-phase diffusion coefficient is much smaller than the liquid-phase diffusion coefficient, the simulation of the solidification of multi-component single-phase alloys is successfully achieved. The mathematical expression of the model is as follows [32]:
F = V f c , φ + ε 2 2 φ 2 d V ,
f c , φ = h φ f S + 1 h φ f L + w g φ ,
f S c i S = f L c i L μ i ,
1 M φ φ t = ε 2 2 φ w d g φ d φ d h p φ d φ ( f S f L + i = 1 n c i S c i L μ i ) ,
c i t = · 1 h d φ j = 1 n D i j L c j L + · α i φ t φ φ ,
c i = h r φ c i S + 1 h r φ c i L ,
In the above formula, F is the total free energy, f c , φ is the density free energy, f L and f S are the free energy density of the liquid-solid phase, respectively. Equation (13) is the isochemical potential condition at the interface, g φ = φ 2 1 φ 2 is double-well potential, w is potential height, ε is the gradient energy coefficient. The concentration c i of the i th solute at a given point is c i = c i S in the bulk solid and c i = c i L in the bulk liquid, in the interface area, obey the mixing law (16). · α i   φ / t φ / φ is the introduced antitrapping current term. α i is a function of c i S and c i L , h p , d , r ( φ ) is an interpolation function with a special form to eliminate abnormal interface effects.
The above three phase-field models are widely used in the solidification of single-phase alloys. With the development of the phase-field method, people are no longer limited to the simulation of single-phase or single crystal, instead, it is devoted to the research of solidification microstructure evolution of multiple phases and polycrystalline. In the single-phase phase-field model, a phase-field order parameter can well describe the phase transition process of solidification. However, in the multiple phases alloy system, a set of phase-field order parameters must be introduced to deal with the multiple phases or polycrystalline solidification problem. The core of the multi-phase-field model is to introduce a set of order parameters to describe the free energy of each bulk phase, so as to achieve the purpose of distinguishing different bulk phases. The multi-phase-field model is a method used to solve multiple phases solidification, which is generally used in solidification models such as eutectic and peritectic. For the multi-phase-field model, the basis is the single-phase solidification phase-field model. Although the definition and treatment of the multi-phase-field model are more complicated than those of the general phase-field models mentioned above, the mathematical properties of the multi-phase-field model are consistent with those of the general phase-field model on the phase interface. Assuming that the multiphase alloy system contains φ 1 , φ 2 , φ α , , φ N order parameters, these order parameters satisfy the following constraints as the volume fraction of each phase [34]:
α = 1 N φ α = 1 ,
The free energy functional of the multi-phase-field model can generally be expressed as [34]:
F = α , β , α < β N ε α β 2 2 φ α α φ β β 2 + f b u l k φ α , c i d V ,
In the above formula, α and β are angular indices of two different phases, ε α β is the gradient energy coefficient of the two phases, f b u l k φ α , c i is the free energy function of volume density, and different phase-field models have different expressions, φ α = φ 1 , φ 2 , φ α , , φ N , c i is the concentration of each component. In addition to the above multi-phase-field model, Nester et al. [35], Kim et al. [36], Moelans [37], and Folch et al. [38,39,40] also proposed multi-phase-field models based on single-phase solidification, respectively. Besides, the commercial simulation software MICRESS developed by RWTH Aachen University, Germany, also uses the multi-phase-field model as the basic structure [41,42], and successfully achieves the simulation of multiple component multiple phase solidification system.
In recent years, the phase-field simulation has gradually changed from the treatment of a solidification structure to the simulation of an actual process, and made a great breakthrough. The actual solidification of alloy is generally polycrystalline solidification. For the simulation of polycrystalline microstructure evolution, not only the volume phase (solid phase and liquid phase) and interface can be distinguished by the phase-field order parameters, but also the orientation difference between different grains can be described. Therefore, to establish the polycrystalline phase-field model, it is necessary to extend the general phase field model. There are three ways to implement the polycrystalline model: orientation field method, the mutli-phase-field method, and the continuous phase-field method.
The idea of multi-phases-field was first proposed by Steinbach et al. [34], it is mainly used for the evolution of different phases during alloy solidification, Eiken et al. [42,43,44] has done a lot of work on this basis to gradually expand it to polycrystalline systems. This method can describe not only multiple grains in a single-phase solidification system, but also multiple phases. The multi-phase-field method is to describe the different orientations of polycrystals by introducing a set of order parameters. In a system of volume V , introduce a set of phase-field variables φ α α = 1 , 2 , , n , and by imposing the following constraints at any point in space to ensure that the phase-field variable φ α = 1 inside each bulk phase or grain, while other phase-field variables φ β = 0 at this time, transitions from 1 to 0 at the interface, through multiple phase-field variables φ α ( α = 1 , 2 , , n ), the free energy function equation can be constructed as [42,43,44]:
α = 1 N φ α = 1 ,
F = V f c h e m + f i n t f + f o t h e r d V ,
f c h e m = α = 1 n h φ α f α c α i + μ i ( c i α = 1 n φ α c α i ) ,
f i n t f = α , β = 1 , 2 , , n , α β 4 σ α β η α β ( φ α φ β η α β 2 π 2 φ α · φ β ) ,
where f c h e m is the chemical free energy density, f i n t f is the interface free energy density, f o t h e r is the additional energy term provided by other external fields such as electric, magnetic, flow fields, etc. c α i is the i component of α volume phase, f α c α i is the chemcial free energy, which depends on c α i , μ i is the chemical potential of i . σ α β represents the interfacial energy between two phases or grains. η α β is the thickness of the interface. Multi-phase-field method is widely used not only to deal with the solidification of polycrystals, but also to deal with the microstructure evolution of various polycrystals, such as solid phase transformation, grain growth and recrystallization. In addition, he can be coupled with the computational phase diagram method (CALPHAD) to obtain the free energy function of alloy system. However, the mathematical process of this method is very complicated, especially in determining the interface position in the multi-element system.
The continuous phase-field model for simulating grain growth and recrystallization during heat treatment was first proposed by Chen, Wang, and Fan et al. [45,46,47]. Similar to the multi-phase-field method, the continuous phase-field method uses a set of continuous field variables η 1 r , η 2 r , , η p r with different orientations to describe the different orientations of different grains in the polycrystal in space, and construct the free energy function of multiple iso-depth potential wells. Where p represents the number of orientation fields, η p r is called the orientation field variable, it is spatially continuous and is used to describe the different orientations of grains. At any time, only one orientation field variable is 1 in a certain grain, and the other orientation field variables are 0. At the grain boundary position of two adjacent grains, the orientation field variable is continuously changing between 1 and 0. In actual materials, the number of orientations of grains is disordered, but in the simulation process, the number of orientation fields is limited and must be determined. The free energy function can be constructed by the orientation field variable [45,46,47]:
F = V f η 1 , η 2 , , η p + i = 1 p κ i 2 η i 2 d V
where k i is a constant greater than zero, to ensure that the gradient term always provides a positive contribution. f is the local free energy density, and the structure of its specific form is the key to the realization of this method. Since η p r represents the different orientations of the grains, the free energy density function f is required to have a potential well of equal depth at the n 1 , n 2 , , n p = ± 1 , 0 , , 0 , 0 , ± 1 , , 0 , , 0 , 0 , , ± 1 , this ensures that each orientation is spatially equivalent, and each point in space belongs to only one orientation. Therefore, Fan and Chen et al. proposed a specific expression of local free energy density function f [47]:
f = i = 1 p a 2 η i 2 + b 4 η i 4 + γ i = 1 p j i p φ j 2 κ i 2 φ j ,
In the formula, a , b , γ all are positive constants. To optimize the evolution process of the system, r > β / 2 is required. Since the method needs to satisfy multiple iso-depth potential wells and complex forms when constructing the free energy function, the selection of parameters in the early simulations is phenomenological, and it is difficult to combine with the real physical parameters of the material. Moelans et al. [48] extended the continuous phase-field model and proposed a method to determine the ratio between phase-field parameters and material properties under the conditions of anisotropy and isotropy of interface energy. In conclusion, due to the complexity of constructing the free energy function of the continuous phase-field, this method is currently still limited to the field of grain growth in polycrystalline systems.
Both the continuous phase-field method and the multi-phase-field method need to introduce a set of order parameters to represent different grain orientations, while the orientation field method is to introduce a new physical field: the orientation field to represent the orientation angle θ of the grains, and coupling the orientation field dynamics equation to realize the evolution of the orientation field. This method was first proposed by Kobayashi [49,50] et al. The energy contribution of grain orientation difference in polycrystalline system is described by adding orientation energy f o r i , which related to orientation angle θ into the free energy function. The energy of a polycrystalline system depends only on the relative difference of orientation angles Δ θ between grains. It does not depend on the value of grain orientation in an artificially given coordinate system, that is, the orientation energy is proportional to Δ θ . Assuming that two infinite grains are in contact and collide with each other, and the interface at the grain boundary is assumed to be a flat interface, their orientation energy can be expressed as [49,50]:
f o r i = 0 l H Δ θ n d x Δ θ n
In the above formula, l is the interface thickness, H is an intermediate variable. When the index n > 1 , the orientation energy will decrease with the increase of the interface thickness, and at the same time, the free energy of the whole system will also decrease with the increase of the interface thickness, which is obviously inconsistent with the actual situation. Therefore, in order to obtain a stable interface of finite thickness, n can only take a value of 1. Since the orientations of the two grains are different, the orientation field variable θ takes different values inside the two grains and jumps at the interface, this requires H x to have a minimum value at the interface position. Therefore, in general, H is expressed as a function of the phase-field variable φ , and the function is constructed in relation to the model, different phase-field models have different forms. In addition to the phase-field dynamics equation and diffusion equation, the orientation field evolution dynamics equation is also obtained by free energy functional variation [51]:
F = V d Γ ε φ 2 2 φ 2 + f φ + m φ H θ + h φ ε 0 2 2 θ 2 ,
θ t = M φ δ F δ θ ,
where ε φ , ε θ are positive constants. Both m φ ,   h φ are interpolation functions, which requires a value of 1 in the liquid phase. The concept of the above-mentioned orientation field was first used to describe the different orientations of grains in the solid phase. Gránásy et al. [52,53] took the lead in introducing the orientation field from the solid-phase grains into the solidification, assuming that the orientation field is randomly distributed in the liquid phase with disordered orientation, when solidification occurs, the orientation field changes, transitioning to different values within different grains. Subsequently, based on the orientation field, Gránásy et al. [54] conducted a comprehensive review of the polycrystalline growth modes in polycrystalline solidification, the CET phenomenon, and the effects of external fields and particle additives on polycrystalline properties.
In solid-state phase transformation, the mismatch between the atoms on the interface between the variant and the matrix is inevitable. These lattice mismatches will produce elastic strain energy E e l , which is one of the main driving forces to control the morphology of secondary phase particles. The elastic strain energy term is usually described according to Khachaturyan’s microelasticity theory [55], and the stress distribution around the precipitates can be reflected by the stress field E . The system of the total free energy form [55], is as follows:
F = V f 0 + i = 1 p κ φ 2 φ i 2 + j = 1 p κ c 2 c j 2 d V + E e l ,
E e l = 1 2 p , q = 1 d 3 g 2 π 3 B p , q n φ p g φ p g * ,
B p , q n = C i j k l ε i j 0 p ε k l 0 q n i σ i j 0 p Ω j k n σ k l 0 q n l ,                   g 0       C i j k l ε i j 0 p ε k l 0 q                                                                                                                               g = 0         ,
where κ φ and κ c is the gradient energy coefficient, n = g / | g | is a unit vector in reciprocal space and φ p g denotes the complex conjugate of   φ p g * . C i j k l is the elastic modulus tensor, ε i j 0 and σ i j 0 are the local stress-free transformation strain and steer respectively, Ω j k 1 = C i j k l n k n l .
Other expressions for elastic strain energy are as follows:
E e l = 1 2 C i j k l ε i j e l ε k l e l ,
where ε i j e l = ε ¯ i j + δ ε i j ε i j 0 is the elastic strain tensor, ε ¯ i j is the homogeneous strain, δ ε i j is the heterogeneous strain and ε i j 0 is the eigen-strain.
Twinning is a complex plastic deformation mechanism, and the stress-induced twinning generally has a lens-like shape. This is related to the uneven distribution of stress during twinning and the anisotropy of twinning interface energy. Due to its unique advantages in simulating microstructure evolution, the phase-field method is used by more and more scholars to the simulate twinning. In the twinning phase-field model, the meaning of the order parameter φ is different from that of solidification, φ = 1 indicates that the material point is a twin, φ   = 1 indicates that the material point is the parent or matrix, 0 < φ < 1 indicates that the point is located at the twin interface. Clayton et al. [56] pioneered the establishment of a phase-field model for single-twin systems, the free energy expression for this model is as follows [56]:
F = 1 2 Ω E E : 𝕔 φ : E E d Ω + Ω A φ 2 1 φ 2 + κ : φ φ d Ω ,
In the formula, E E : 𝕔 φ : E E is the elastic strain energy term in the total free energy of the system. 𝕔 is the average elastic stiffness matrix of material points defined on the intermediate configuration. E E is the elastic green strain tensor, E E = 1 / 2 C E 1 , C E is the elastic deformation tensor. f = A φ 2 1 φ 2 is interpolation functions, A is a non-negative constant, which is related to the equilibrium energy per unit area and the thickness of the unstressed interface. κ : φ φ is the twin interface energy term in the total free energy of the system, and κ is a second-order symmetric tensor describing the anisotropic energy at the twin interface, in crystal coordinates, it has the following expression [56]:
κ = κ 11 0 0 κ 22 ,
κ 11 , κ 22 are related to the twin tip interface and the lateral twin interface, respectively. In the isotropic case, κ 11 = κ 22 , in the case of anisotropy, κ 11 / 2 = 2 κ 22 .
Controlling the solidification structure or solidification process to obtain ideal alloys is the ultimate goal of countless materials workers. Microstructures with different morphologies have different physical properties; however, the solidification structure is not only controlled by the solidification conditions, but is also affected by the inherent characteristics of the system. An important manifestation of the intrinsic properties of the system is the anisotropy of the solidification interface. Previous researchers’ experiments on directional solidification [57,58] have shown that the interfacial dynamics are significantly anisotropic. Provatas [59] also pointed out that the nature of dendrite growth is strongly controlled by the effect of surface tension, and the dendritic morphology cannot exist without anisotropy, which occurs both in the surface tension at low supercooling, and also appears in the interfacial dynamics at high supercooling. Young et al. [60] pointed out that in the process of dendrite growth, the anisotropic interface will affect the growth rate and morphology of dendrites, and the mobile growth rate of the interface is more seriously affected by the anisotropic interface kinetic parameters. Therefore, it is necessary to introduce the anisotropy of dendrite growth into the phase-field model. For anisotropic materials, the correction term of the thermodynamic state function due to the change of the phase-field cannot be expressed by an isotropic function, but must be described by an anisotropic function that depends on the normal direction of the phase interface. Different anisotropic materials have different anisotropy functions. During solidification, the interfacial energy is a function of crystallographic orientation. Therefore, considering the anisotropy of the interfacial energy [59,61,62]:
W θ = W 0 a s n = W 0 1 + γ c o s k θ θ 0 ,
W 0 is the interface thickness, a s n = 1 + γ c o s k θ θ 0 is anisotropic function which is dependent on the normal direction of the phase interface. γ is the anisotropic intensity coefficient, k is the symmetry of the crystal, for magnesium alloys, the general value is 6. θ is the angle between the principal axis of crystal growth and the normal direction of the interface, θ 0 is the angle between the preferred grain orientation and the 𝑥 axis. Considering the anisotropy of the interface dynamics parameters, for the interface dynamics coefficient τ , can get the following formula [59,61,62]:
τ θ = τ 0 a s 2 n = τ 0 1 + γ c o s k θ θ 0 ,
In the formula, τ 0 is relaxation time. The above formula can be applied to 2D phase-field model, but it is useless for 3D simulation. For three-dimensional anisotropy functions, Bottger and Eiken et al. [43,63,64] did a lot of work, a general form of the anisotropy function with equal strength of anisotropy in the basal and in normal direction is presented [43]:
d h e x n = 1 + δ h e x n x 6 15 n x 4 n y 2 + 15 n x 2 n y 4 n y 6 + 5 n z 4 5 n z 2 + 6 n z 6 ,
Here, δ h e x is anisotropy coefficient, n being a unit vector normal to the interface transformed into the local grain coordinate system. In the same year, Sun et al. [65,66] also proposed a linear interpolation function based on harmonic form for molecular dynamics simulation of pure magnesium, the form is as follows [65,66]:
r θ , φ = r 0 1 + ϵ 20 y 20 θ , φ + ϵ 40 y 40 θ , φ + ϵ 60 y 60 θ , φ + ϵ 66 y 66 θ , φ + ,
y 20 θ , φ = 5 16 π 3 c o s 2 θ 1 ,
y 40 θ , φ = 3 16 π 35 c o s 4 θ 30 c o s 2 θ + 3
y 60 θ , φ = 13 32 π 231 c o s 6 θ 315 c o s 4 θ + 105 c o s 2 θ 5
y 66 θ , φ = 6006 64 π 1 c o s 2 θ 3 c o s 6 φ
In the above formula, r 0 is anisotropy coefficient, ϵ 20 , ϵ 40 , ϵ 60 are the crystal preferred orientation anisotropy parameters. The above two 3D anisotropy equations have been widely applied to dendrite 3D simulations. However, recently, Du et al. [67] pointed out that the above two equations can perfectly describe the 6-fold symmetry of the α -Mg dendrite at the basal plane, but it could not characterize the dendritic pattern at the nonbasal planes, and the dendrite growth pattern obtained from the simulation of the above two equations deviated significantly from the experimental results [68,69]. Based on this, Du et al. proposed a new anisotropic function model from experiment, combining the spherical harmonic function with density functional theory (DFT), whose expressions are shown below [67,70]:
A n = γ 0 · 1 + ε 1 3 n z 2 1 2 + ε 2 n x 3 3 n x · n y 2 2 × 9 n z 2 1 + ε 3 2
where, γ 0 is the average surface energy, ε i , i = 1 , 2 , 3 are the anisotropic strength for describing the dendritic growth tendency along different crystallographic directions, and ε 1 , ε 2 and ε 3 are determined from the anisotropic surface energy obtained via the DFT-based calculations. By coupling the phase field dynamics equation with the above equation, two-dimensional or three-dimensional phase-field simulation with interface anisotropy can be realized.
Table 1. Summary of phase-field models.
Model/Theory NameApplication FieldsCharacteristic
WBM Phase-field model [23,24,25]Single-phase monocrystalline solidificationFirst phase field model for alloy solidification, non-quantitative and limited in computational efficiency and scale.
Karma Phase-field model [26,27,28,29]Single-phase monocrystalline solidificationQuantitative phase field model, but limited to dilute binary solution alloys.
KKS Phase-field model [32]Single-phase monocrystalline solidificationMulti-component quantitative phase field model that can be coupled with thermodynamic databases, but is computationally intensive.
Multi-phase-field model [34]Eutectic and peritectic solidificationPioneering the idea of multiphase fields, widely used in the multiphase solidification of multi-component alloys.
Continuous phase-field theory [45,46,47]Polycrystalline solidification, grain growth and recrystallizationThe phase field parameters are phenomenological and the free energy functional form is complex to construct and currently limited to the field of grain growth.
Multi-phase-field theory [42,43,44]Polycrystalline solidification, grain growth, recrystallization, solid-state phase transformation and grain coarseningThe method is widely applicable and can be coupled with the computational phase diagram CALPHAD, but the mathematical derivation and solution are very tedious and complex, requiring very large computational effort when solving multi-component systems.
Orientation field theory [49,50,51]Polycrystalline solidificationThis method is computationally small and efficient, but does not accurately describe the interactions between dendrites in polycrystalline systems.
Khachaturyan solid-state phase transitions theory [55]Solid-state phase transitionsA detailed discussion of solid-state phase change theory, which has contributed significantly to the development of solid-state phase change phase field models.
Clayton twin Phase-field model [56]Deformation twinningFirst phase field model for a single twin system.

3. Progress in the Simulation of Solidification Structure of Mg Alloys

3.1. Simulation of Equiaxed Dendrite Growth

Phase-field methods simulation of Mg alloys started relatively late, mainly because the anisotropy function of Mg alloys is completely different from that of cubic alloys due to their typical hexagonal structure. To simulate the dendrite growth of Mg alloys more realistically, the anisotropic function suitable for hexagonal structure must be established. Until 2006, Böttger et al. [43,44] firstly developed a multiphase-field model incorporating the anisotropic function of the hexagonal structure, and successfully combined the CALPHAD thermodynamic database with the phase-field model to reproduce the dendrite morphology of AZ31 alloy under different solute concentration, grain density, and heat extraction rate, which promoted the development of phase-field simulation of microstructure of Mg alloys. Subsequently, on the basis of the MICRESS software, Minamoto et al. [71] combined the multiphase-field method with the CALPHAD thermodynamic database, simulated the solidification structure of Mg-Zn-Y alloys, and the interface migration during multiphase precipitation was analyzed. In addition, Zaeem et al. [72] applied Kobayashi’s pure substance model to couple with the finite element method, and simulated dendrite morphology of AZ91 during solidification. The simulation results using phase-field method and cellular automata (CA) method were compared. It is found that the CA method could not easily simulate dendrites with arbitrary orientation, while the phase-field method can handle single and multiple dendrites with arbitrary orientation.
Compared with foreign studies, domestic studies started relatively late to simulate the solidification structure of Mg alloys using phase-field model. Until 2008, Liu et al. [73] simulated the morphology evolution of 2D single dendrite of Mg alloys by Karma’s phase-field method coupled with thermal noise and analyzed the influence of different parameters on dendritic morphology of Mg alloys. It was found that both the larger the undercooling and phase-field coupling constant, the finer primary dendrite arm, the more developed the growth of the secondary dendrite arms, while the influence of temperature diffusion coefficient on dendrite morphology is opposite to that of undercooling and phase-field coupling constant. Recently, Tian et al. [74] similarly investigated the effect of undercooling and coupling constant on the dendrite morphology of magnesium alloys based on a parallel-adaptive mesh refinement algorithm, the result is shown in Figure 2. It is found that the dendrites show similar morphology when a large undercooling and a small coupling constant, or a small undercooling and a large coupling constant are used together, as seen in Figure 2m and Figure 2h. This indicates that the dendrite morphology is not only controlled by the solidification conditions, but also by intrinsic conditions, such as the coupling constant, which is determined by the physical parameters of the alloy.
In addition to the temperature field parameters, the concentration also affects the dendrite morphology. For this purpose, based on the KKS model, Yao et al. [75] performed a more quantitative investigation about the effects of solute diffusion on the dendrite growth in AZ91D alloys. The simulation results found that the larger the undercooling is, the higher the concentration in front of the dendrite tip and the axis center of dendrite arm is, the smaller the boundary thickness of concentration in front of the dendrite tip is and the severer the micro segregation is. Other factors may also influence the dendrite shape. According to Duan et al. [76] simulation results, with the increase of the interfacial energy anisotropy, the instability of the primary dendrite arm increases, which leads to the growth of many side branches, the growth rate of the dendrite tip increases, and the tip radius decreases, which is consistent with the microscopic solvable theory. Meanwhile, Duan et al. [76] also revealed the effects of different supersaturation on the morphology of dendrites. It is found that as the supersaturation increases, the dendrite changes from snowflake-like to circle-like morphologies. The applied pressure is also associated with the morphology of the dendrites. To study the effect of pressure on the dendritic growth during solidification of Mg alloys, Shang et al. [77] developed a phase-field model coupled with thermodynamic calculation. The results showed that the pressure could not only refine the grain, improve the growth rate of dendrite, and make the secondary dendrite arm more developed, but also affect the micro segregation of solute, as shown in Figure 3. For instance, the effects of pressure on the segregation of Al and Sn are totally different in a ternary Mg-Al-Sn alloy. With the increase of pressure, the micro segregation of Al increases significantly, while that of Sn remains almost unchanged.
Although some growth rules of dendrites were obtained in the above studies, most of them ignored the interaction between dendrites and could not accurately describe the growth of dendrites. Compared with single dendrite, there are soft impact and hard impact effects in the growth of multi-dendrites, which have a significant impact on the dendrite morphology. Pan’s [78] study showed that with the increase of pressure, the number of dendrite nucleation increased in the same space, and the grain refinement was obvious. However, due to the impact effect of dendrite, the dendrite morphology changed to hexagonal asymmetric structure. The forced convection is another factor that also influences the dendrite shape. Yuan et al. [79] applied the WBM model to study the effect of forced flow on the multi-dendrites’ morphology of AZ91D during non-isothermal solidified. It was found that the forced convection seriously destroys the six-fold symmetrical structure of the dendrite, and the size of the dendrite arm in the downstream is obviously smaller than that in the upstream. The reason for the formation of asymmetric dendrite morphology is explained, that is, the convection washes the heat and solute in the upstream to the downstream, promotes the dendrite growth in the upstream, inhibits the dendrite growth in the downstream, and finally forms the asymmetric dendrite morphology. Subsequently, Yao et al. [80,81] also obtained similar results based on the KKS model, and the results are shown in Figure 4. Besides, as the solidification proceeds, the solid phase rates under pure diffusion and forced convection conditions grow as a quadratic function. At the same moment, the solid phase rate in the forced convection case is always greater than that in pure diffusion, which indicates that forced convection eventually plays a role in promoting dendrite growth. Moreover, the growth rate of upstream dendrites with convection is larger than that without convection, and the rate always reaches a maximum at the beginning of solidification and decreases gradually with solidification proceeds.
Gas porosity is one of the most common defects in the casting process. Recently, Zhang et al. [82] developed a solid-liquid-gas multi-phase-field lattice-Boltzmann model based on the multi-phase-field idea of I. Steinbach et al. This model can reproduce the interaction between bubble and dendrites during the solidification of magnesium alloys under the effect of convection. Figure 5 shows the interaction between polycrystalline and bubbles during the solidification of Mg-6Gd alloy, where the first and second rows show the results without and with natural convection, respectively. The bubble without convection undergoes less deformation before being entrapped by dendrites, and the bubble radius changes from the initial value 12.8 units of W 0 to the final 23.489 units of W 0 . When convection acts, the bubbles rise under buoyancy and undergoes shape and size change significantly with the solidification process. The natural convection makes the rejected alloy solute move downwards and causes local solute enrichment, this results in the lower side branches being less developed than the upper, such as the upward dendrite arms circled by A are more developed than those circled by B in Figure 5h. At the same time, the natural convection also changed the growth direction of the side branches, and the growth direction of the side branches surrounded by C and D changed by nearly 90 degrees, as shown in Figure 5d,h.
In addition, the presence of bubbles has little effect on the solid phase volume fraction, which is slightly smaller under convection than in the absence of convection, while the gas phase volume fraction is much larger than in the absence of convection. When convection is activated, part of the solute is carried away by convection and thus into the liquid, and it is known from phase diagram theory that solute enrichment will lower the local melting point, resulting in a lower undercooling, leading to slow growth and lower volume fraction of the solid phase. However, for bubbles, convection can change the position and morphology of the bubbles, make the bubble absorb more gas rather than being trapped by the solid phase, and resulting in a higher gas volume fraction, the results are shown in Figure 6.
All of the above is about the simulation of the growth of 2D dendrite. In some cases, the 2D dendrite morphology cannot truly represent the growth and evolution characteristics of dendrite; therefore, the research on 3D dendrite morphology is particularly critical. In the phase-field simulation of solidification structure, because the existence of elastic strain is ignored, the interface anisotropy becomes the key factor affecting the morphology of dendrite. Therefore, to establish a phase-field model suitable for hexagonal structure, the anisotropic function of hexagonal material needs to be obtained first. To accurately reproduce the 3D dendrite morphology, Wang et al. [83,84,85] modified the anisotropy function based on the spherical harmonics [65], and studied the effects of anisotropy and growth orientation on the dendrite morphology. It was found that when the preferred orientation changed from < 11 2 ¯ 0 > to < 0001 >, the dendrite thickness increased. If there was no preferred orientation, i.e., the anisotropy was uniform in all directions, the dendrite had a tendence to a seaweed-type morphology. However, they simplified the model and ignored the solute diffusion during solidification. Subsequently, Yang et al. [68,86] studied the effect of different solute additions on 3D dendrite morphology of Mg alloys using synchrotron X-ray tomography and phase-field modeling. The results showed that when the added solute is cubic structure (such as Sn, Gd, Al, Ba and Ca), the dendrite exhibited a typical 18-branch morphology with preferred growth orientations along <11 2 ¯ 0> and <11 2 ¯ 3>. The addition of these solutes only affects the growth orientation and growth speed of dendrites, and does not affect the 18-branch structure of dendrites. However, if Zn is added, the 18-branch structure of dendrites would change to 12 branch structure. Subsequent the phase-field simulations show that the variation of the anisotropy parameters can accurately describe this transition, as shown in Figure 7. Moreover, different concentrations of Zn element will lead to the change of preferred orientation of dendrites.

3.2. Simulation of Columnar Dendrite

The growth of columnar dendrite is controlled by the temperature gradient, cooling rate, and orientation angle. Eiken et al. [64] studied the competitive growth mechanism of columnar dendrites in 2D and 3D using the MICRESS phase-field simulation software. They found that for directional solidification the unfavorably oriented dendrites were also able to overgrow the favorably oriented dendrites, which led to the suppression of the best-aligned grain by the misaligned one. This phenomenon is called unusual overgrowth, which is completely different from the phenomenon described by Walton Chalmers model. Subsequently, based on the KKS model, Montiel et al. [87] described the transformation of AZ31 alloys from columnar crystal to equiaxed crystal during resistance spot welding by considering a probabilistic nucleation mechanism and further studied the influence of welding temperature on dendrite morphology. They revealed that the size and shape of columnar and equiaxed growth regions depend on the cooling rate and inoculant particles. Specifically, the larger the heterogeneous nucleation factor is more favorable for the growth of columnar crystals, while the lower the cooling rate, the favorable the growth of columnar dendrites, which is consistent with the results obtained by the GTK model. Amoorezaei et al. [88] adopted Karma’s quantitative model and simplified the anisotropy parameters of Mg alloy in 2D, and quantitatively simulated the dendrite evolution and orientation selection. The results pointed out that the competition between external anisotropy and inherent anisotropy resulted in a continuous transition from columnar dendrites to seaweed and fractal-like structures. Gurevich et al. [89] analyzed the effect of cooling rate on the dendrite arm spacing and the second phase by Fourier transformation, and found both the dendrite arm spacing and the second phase distance decrease with the increase of cooling rate, and the second phase size is finer microstructures. Chen et al. [90] presented a phase-field model that coupled with finite element method to predict the effects of different anisotropies and solute segregation on the columnar dendritic growth. It was found that with the increase of anisotropy, the radius of dendrite tip decreases, which leads to more uniform and dense columnar dendrites. Meanwhile, the solute enrichment in the dendritic spacing due to the solute diffusion rate is generally several orders of magnitude smaller than dendrite growth, which inhibited the formation of secondary dendrite arms. Recently, Du et al. [91] investigated the evolution rules of columnar dendrites with two different preferred orientations parallel to the temperature gradient and determined the anisotropy strength by density functional theory (DFT). Figure 8a,b shows the simulated growth pattern of the columnar multi-dendrites with a temperature gradient completely parallel to <11 2 ¯ 0> and <11 2 ¯ 3>, respectively. The results demonstrated that only the dendrites growing along the preferred orientation can keep growing, and the columnar dendritic growth along the <11 2 ¯ 0> basal direction is slower than that along the <11 2 ¯ 3> nonbasal direction, and the maximum value of the concentration occurs at the solid-liquid interface. In the 2D view, single dendrite arms can be clearly identified, and the growth trend of dendrites along the non-basal direction is greater than the growth trend along the basal direction. Phase-field simulation results are in good consistency with previous experiments, which verifies the validity of the 3D phase-field model.
In the process of directional solidification, original angle of dendritic growth is an important issue. By coupling synchrotron X-ray characterization technology and phase-field method, Wang et al. [92] studied the effect of low cooling rate on the directional solidification of Mg-Gd alloys under a fixed temperature gradient. When the cooling rate is low at R = 0.033 K/s, as shown in Figure 9a1, the growth direction of dendrites prefers the crystal direction <11 2 ¯ 0>, the angle between primary dendrites is α 1 = α 2 = θ 1 π / 3 , and θ 0 = π / 6 . Due to the competition between the crystal anisotropy and thermal gradient, as the cooling rate increases, the thermal release becomes increasingly dominant, and the original angle of dendritic growth gradually rotates from θ 0 = π / 6 (the preferred crystal direction) to θ 0 = π / 36 (close to the temperature gradient direction), as shown in Figure 9a2,a3. This indicates that the selection of original angle of the dendrites is related to the cooling rate and temperature gradient. Subsequent the phase-field simulations shows that the lower cooling rates lead to the large misorientation angle of dendrite morphology, which represents the stronger competitions among dendrites, will finally decrease the amount of dendrites per unit area and increase the primary dendrite arm spacing. Meanwhile, the interface tips have high tendency to collide with each other under the lower cooling rate, which could block the interface movement.
On the basis of this investigation, they further interpreted the influence of multiple factors such as anisotropy, cooling rate, temperature gradient, and orientation angle on the growth of columnar crystals [93]. The simulation results show that the increase of anisotropy, cooling rate, and temperature gradient, can accelerate the growth rate of columnar dendrites. In contrast, the growth rate of columnar dendrite slows down with the increase of the orientation angle. Meanwhile, the primary dendrite spacing decreases with the increase of cooling rates and temperature gradient, while the primary dendrite spacing increases with the increase of anisotropy and orientation angle.
Gas tungsten arc welding (GTAW) is one of the most widely used welding processes for joining magnesium alloys. However, coarse columnar grains tend to form in magnesium alloy welds, which is detrimental to the mechanical properties of the welds. Recent studies have shown that the application of transverse arc oscillation during GTAW welding can result in significant grain refinement of the weld [94,95], which provides a promising technique for joining magnesium alloys. Recently, Chen et al. [96] studied the effect of oscillation frequency on the solidification morphology of Mg-4wtAl% magnesium alloy during arc oscillation welding based on a 2D phase-field model. Their study shows that reheating caused by transverse oscillation of the arc causes dendrite fragmentation by remelting/pinch-off of side branches, which promotes weld grain refinement, while the oscillation frequency significantly affects the reheating time. Chen et al. quantified the oscillation frequency as the reheating time Δ t R , and Figure 10 shows the dendrite morphology at different oscillation frequencies (reheating time). The results showed that the critical time of dendrite fragment was Δ t R 0.05 , the shorter the Δ t R , the shorter the available time for pinching, so pinch-off is not likely to happen to produce dendrite fragments. With the increase of reheating time, the side branch remelting and pinch-off phenomena were aggravated and the grain refinement was significant. Based on the simulation results, it is predicted that pinch-off tends to occur between 1 Hz and 5 Hz, indicating that 1–5 Hz is the optimal frequency range for grain refinement. The predicted frequency range is in good agreement with previous experimental results.

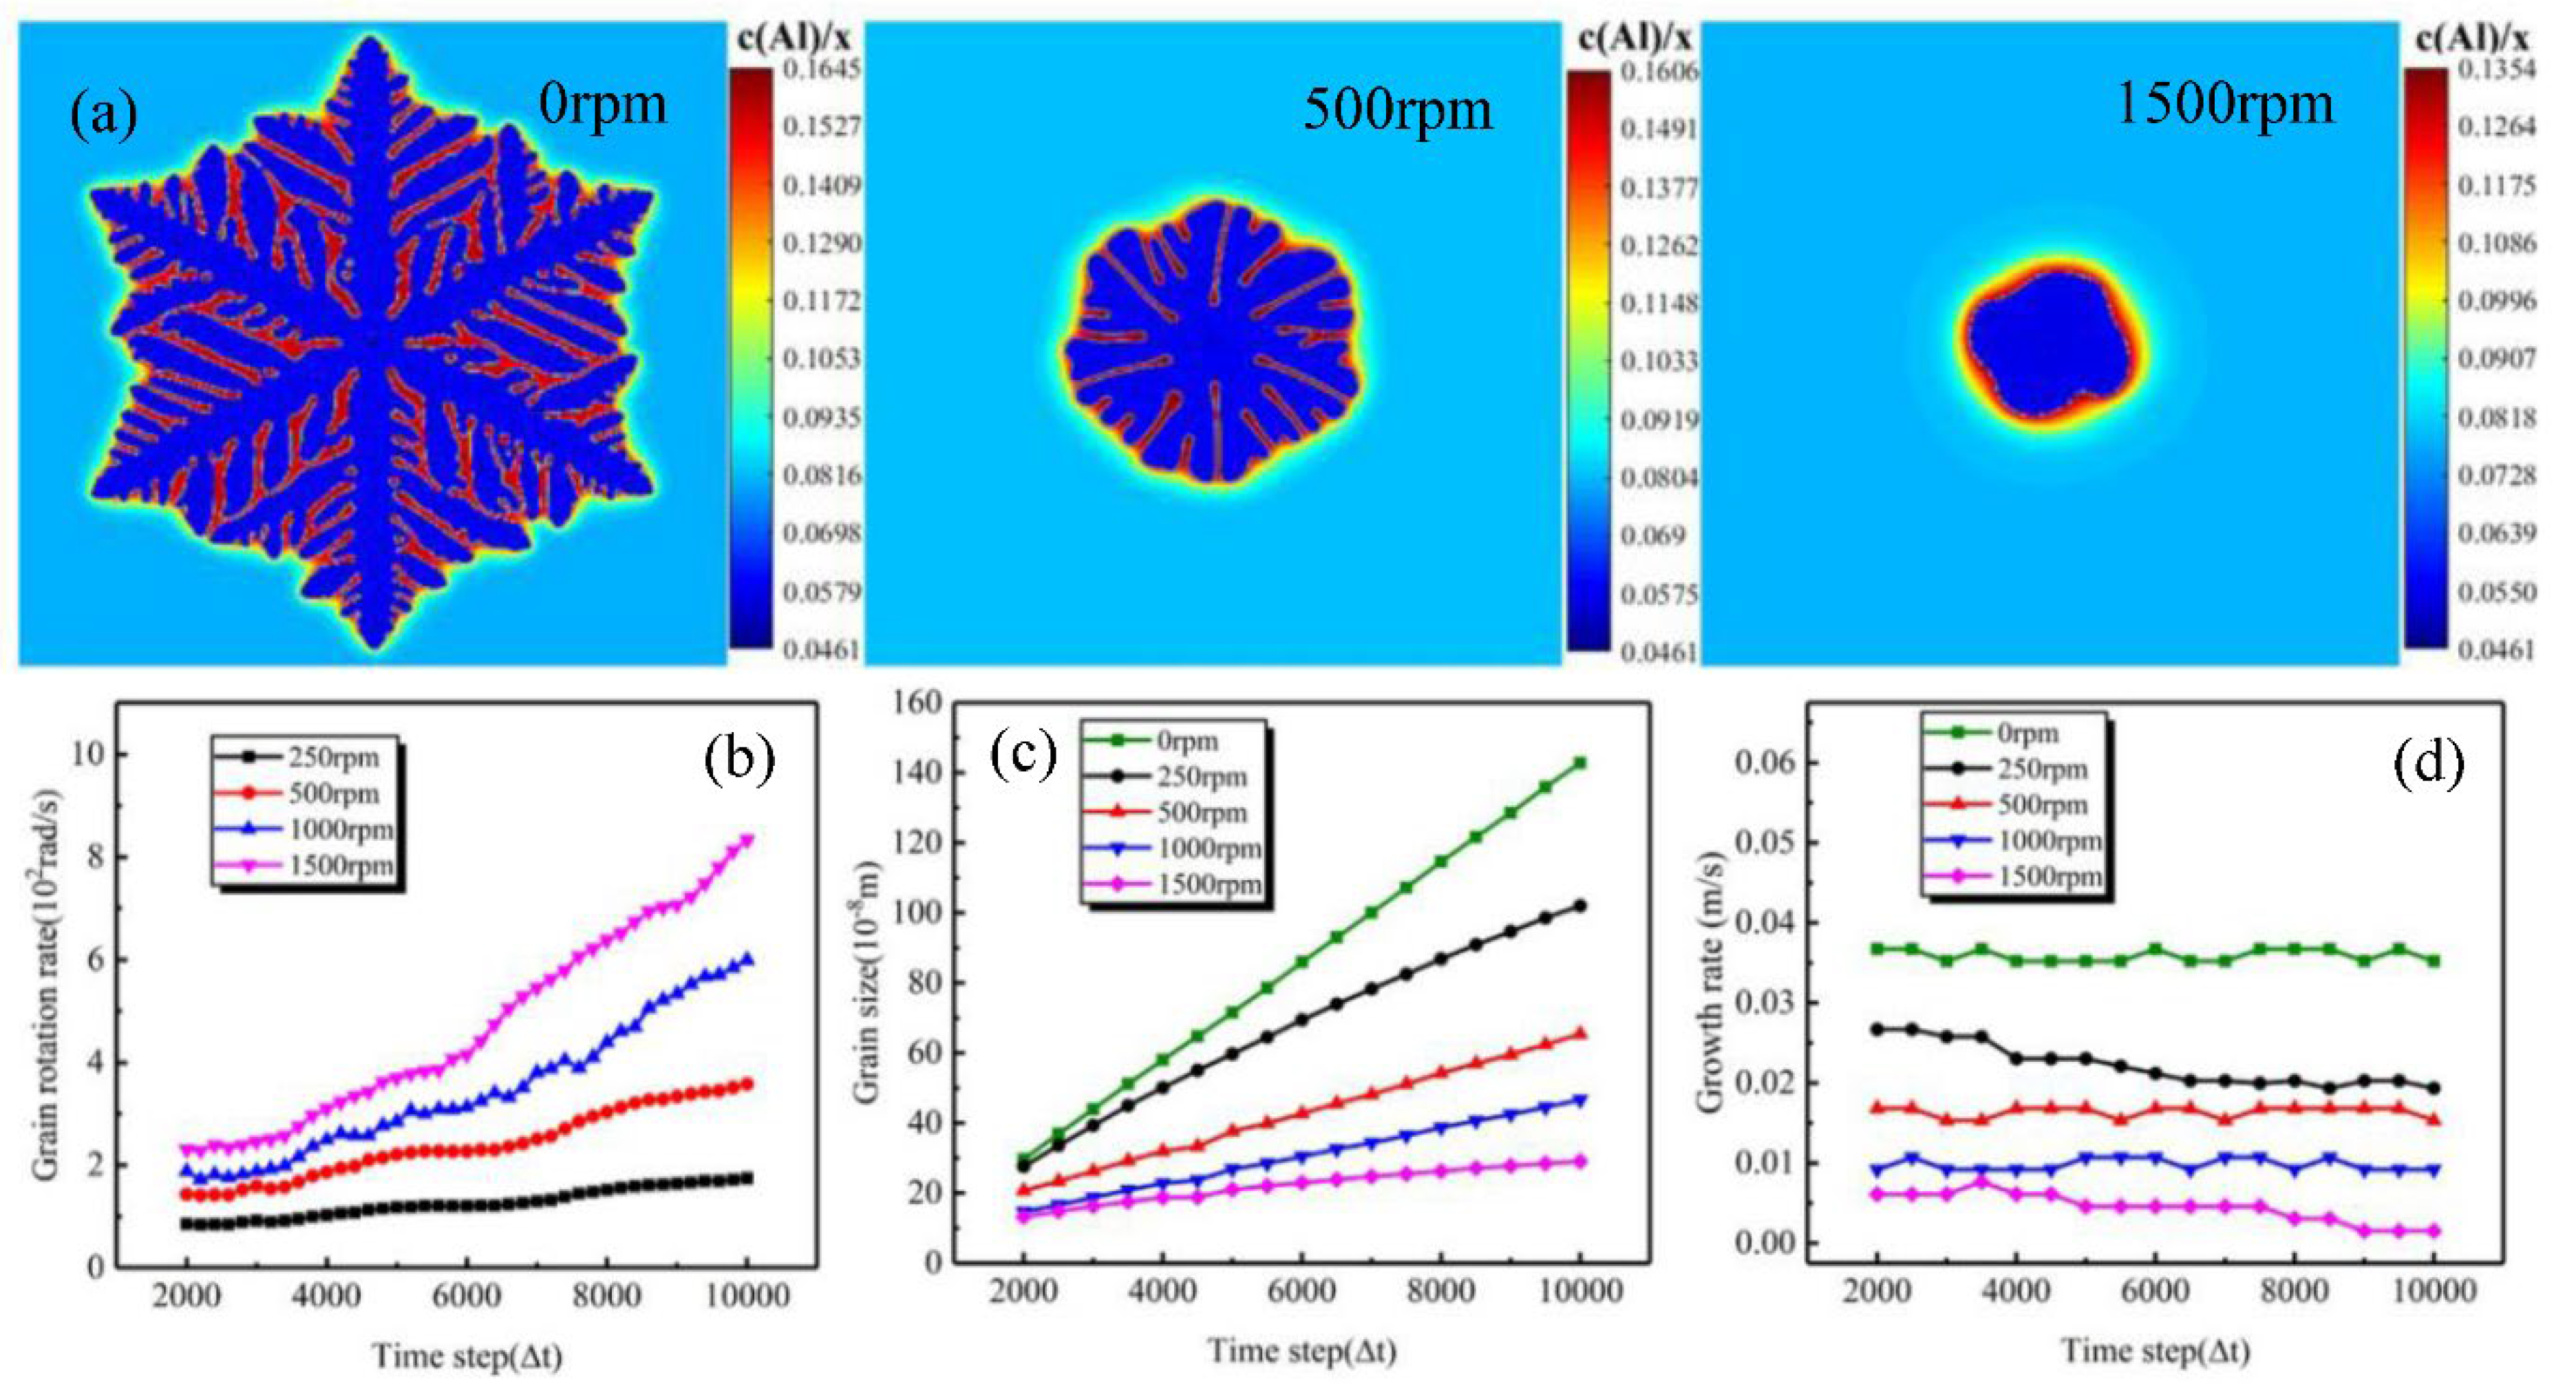
3.3. Simulation of Non-Dendrite Structure

To produce better castings, researchers often use the semi-solid forming technology to break the dendrite structure formed during the solidification, and thus obtaining a more uniform and refined non-dendrite structure. Recently, Yu et al. [97] simulated the nondendritic structure formation in Mg alloy under oscillation and ultrasonic vibration, and found that higher oscillation amplitudes and acoustic streaming made the microstructures change from dendritic to non-dendritic, and produced finer and rounder semi-solid slurry in the a-Mg primary phases. Recently, Zhang et al. [98] studied the effect of stirring rate on the semi-solid structure of Mg-Al alloy, and systematically analyzed the grain morphology, grain growth rate, and grain rotation, under different stirring rates, as shown in Figure 11. The results indicated that as the stirring rate increases from 0 rpm to 1500 rpm, the forced convection effect increases, which leads to an increase in the grain rotation rate. In addition, the forced convection has also induced low flow regions around the grain, and then causes the solute concentration in this region, and hence the growth of the grain will be inhibited, which leads the grain morphology to approximate the spherical shape.

3.4. Simulation of Mutliple Phase Solidification

The evolution and control of solidification microstructure have always been the focus of solidification scientific research. Eutectic solidification, as a typical solidification type, widely exists in the liquid-solid phase transformation of alloys. For magnesium alloys, the most widely used element in magnesium alloys is Al, such as AZ91, AZ50, and AZ31, and so on. There are two main microstructures of Mg-Al alloys: the Mg-rich α phase; and a near stoichiometric Mg 17 Al 12   β phase. On the basis of the multi-phase-field model, Monas et al. [99] using the open-source database OpenPhase and a linearized phase diagram based on the Thermocalc TCS 4.0 database TCBIN to simulate the nucleation and growth of different phases on the two-dimensional and three-dimensional scales. Meanwhile, the dual-scale approach is adopted to reproduce the divorced eutectic mode of the interdendritic melt. The results show that β phase has a tendency to rapidly cover primary α phase, which is consistent with the experiment. In a short period of time, the α phase has a atendency to again nucleation because the primary α phase is completely shielded. Borukhovich et al. [100] gave researchers a new perspective of full field simulation based on the multi-phase-field model: simulation from solidification to fracture. Borukhovich performed mechanical simulations similar to tensile tests after simulating eutectic solidification of Mg-Al alloy, both were based on the phase-field method. The simulation results show that at a given strain condition, the damage is not limited to grain boundaries due to anisotropy of the material. Once there is a maximally damaged material, the damaged region develops in an almost spherical manner. Kang et al. [101] conducted in-depth research on the grain evolution of different phases and the growth of divorced eutectic structure in Mg-Al alloys by means of experimental characterization and phase-field simulation. The study found that with the increase of Al content, the grain refinement phenomenon became more obvious, and the addition of Al promoted the formation of the primary α phase interdendritic eutectic α , β phase. The morphology of the eutectic undergoes a significant transformation from isolated spherical particles to interconnected network structures. Numerous experiments [102,103] have shown that intermetallic compounds have a significant effect on the strength, hardness, corrosion resistance, and wear resistance of the alloy. Increasing the Al content leads to the precipitation of more Mg 17 Al 12 phase, which is more resistant to corrosion and wear than the α -Mg matrix phase. In order to further study the nucleation and growth of the divorced eutectic structure of the residual liquid phase of the primary α phase interdendritic melt, Kang performed phase-field simulations. Phase-field simulations show that when the driving force is able to overcome the nucleation barrier, β phase will be the first to nucleate, due to solute segregation, β phase grows preferentially along the perimeter of the primary α -liquid interface; this is also one of the main reasons for the corrosion resistance of Mg-Al alloys, and the actual nucleation of the eutectic α phase begins when β phase completely covers the α -liquid surface, forming a β phase halo on the primary α phase and divorced eutectic divorced eutectic structure, as shown in Figure 12.

4. Phase-Field Simulation of Recrystallization and Grain Growth

Mg alloys have an H.C.P crystal structure with relatively poor plastic deformation ability. As an important grain refinement mechanism, recrystallization can effectively control the alloy structure and improve the plastic properties of Mg alloys. With the development and application of the phase-field approach, the recrystallization process can be understood and studied in much more detail, which is helpful to optimize the microstructure and improve the material properties.

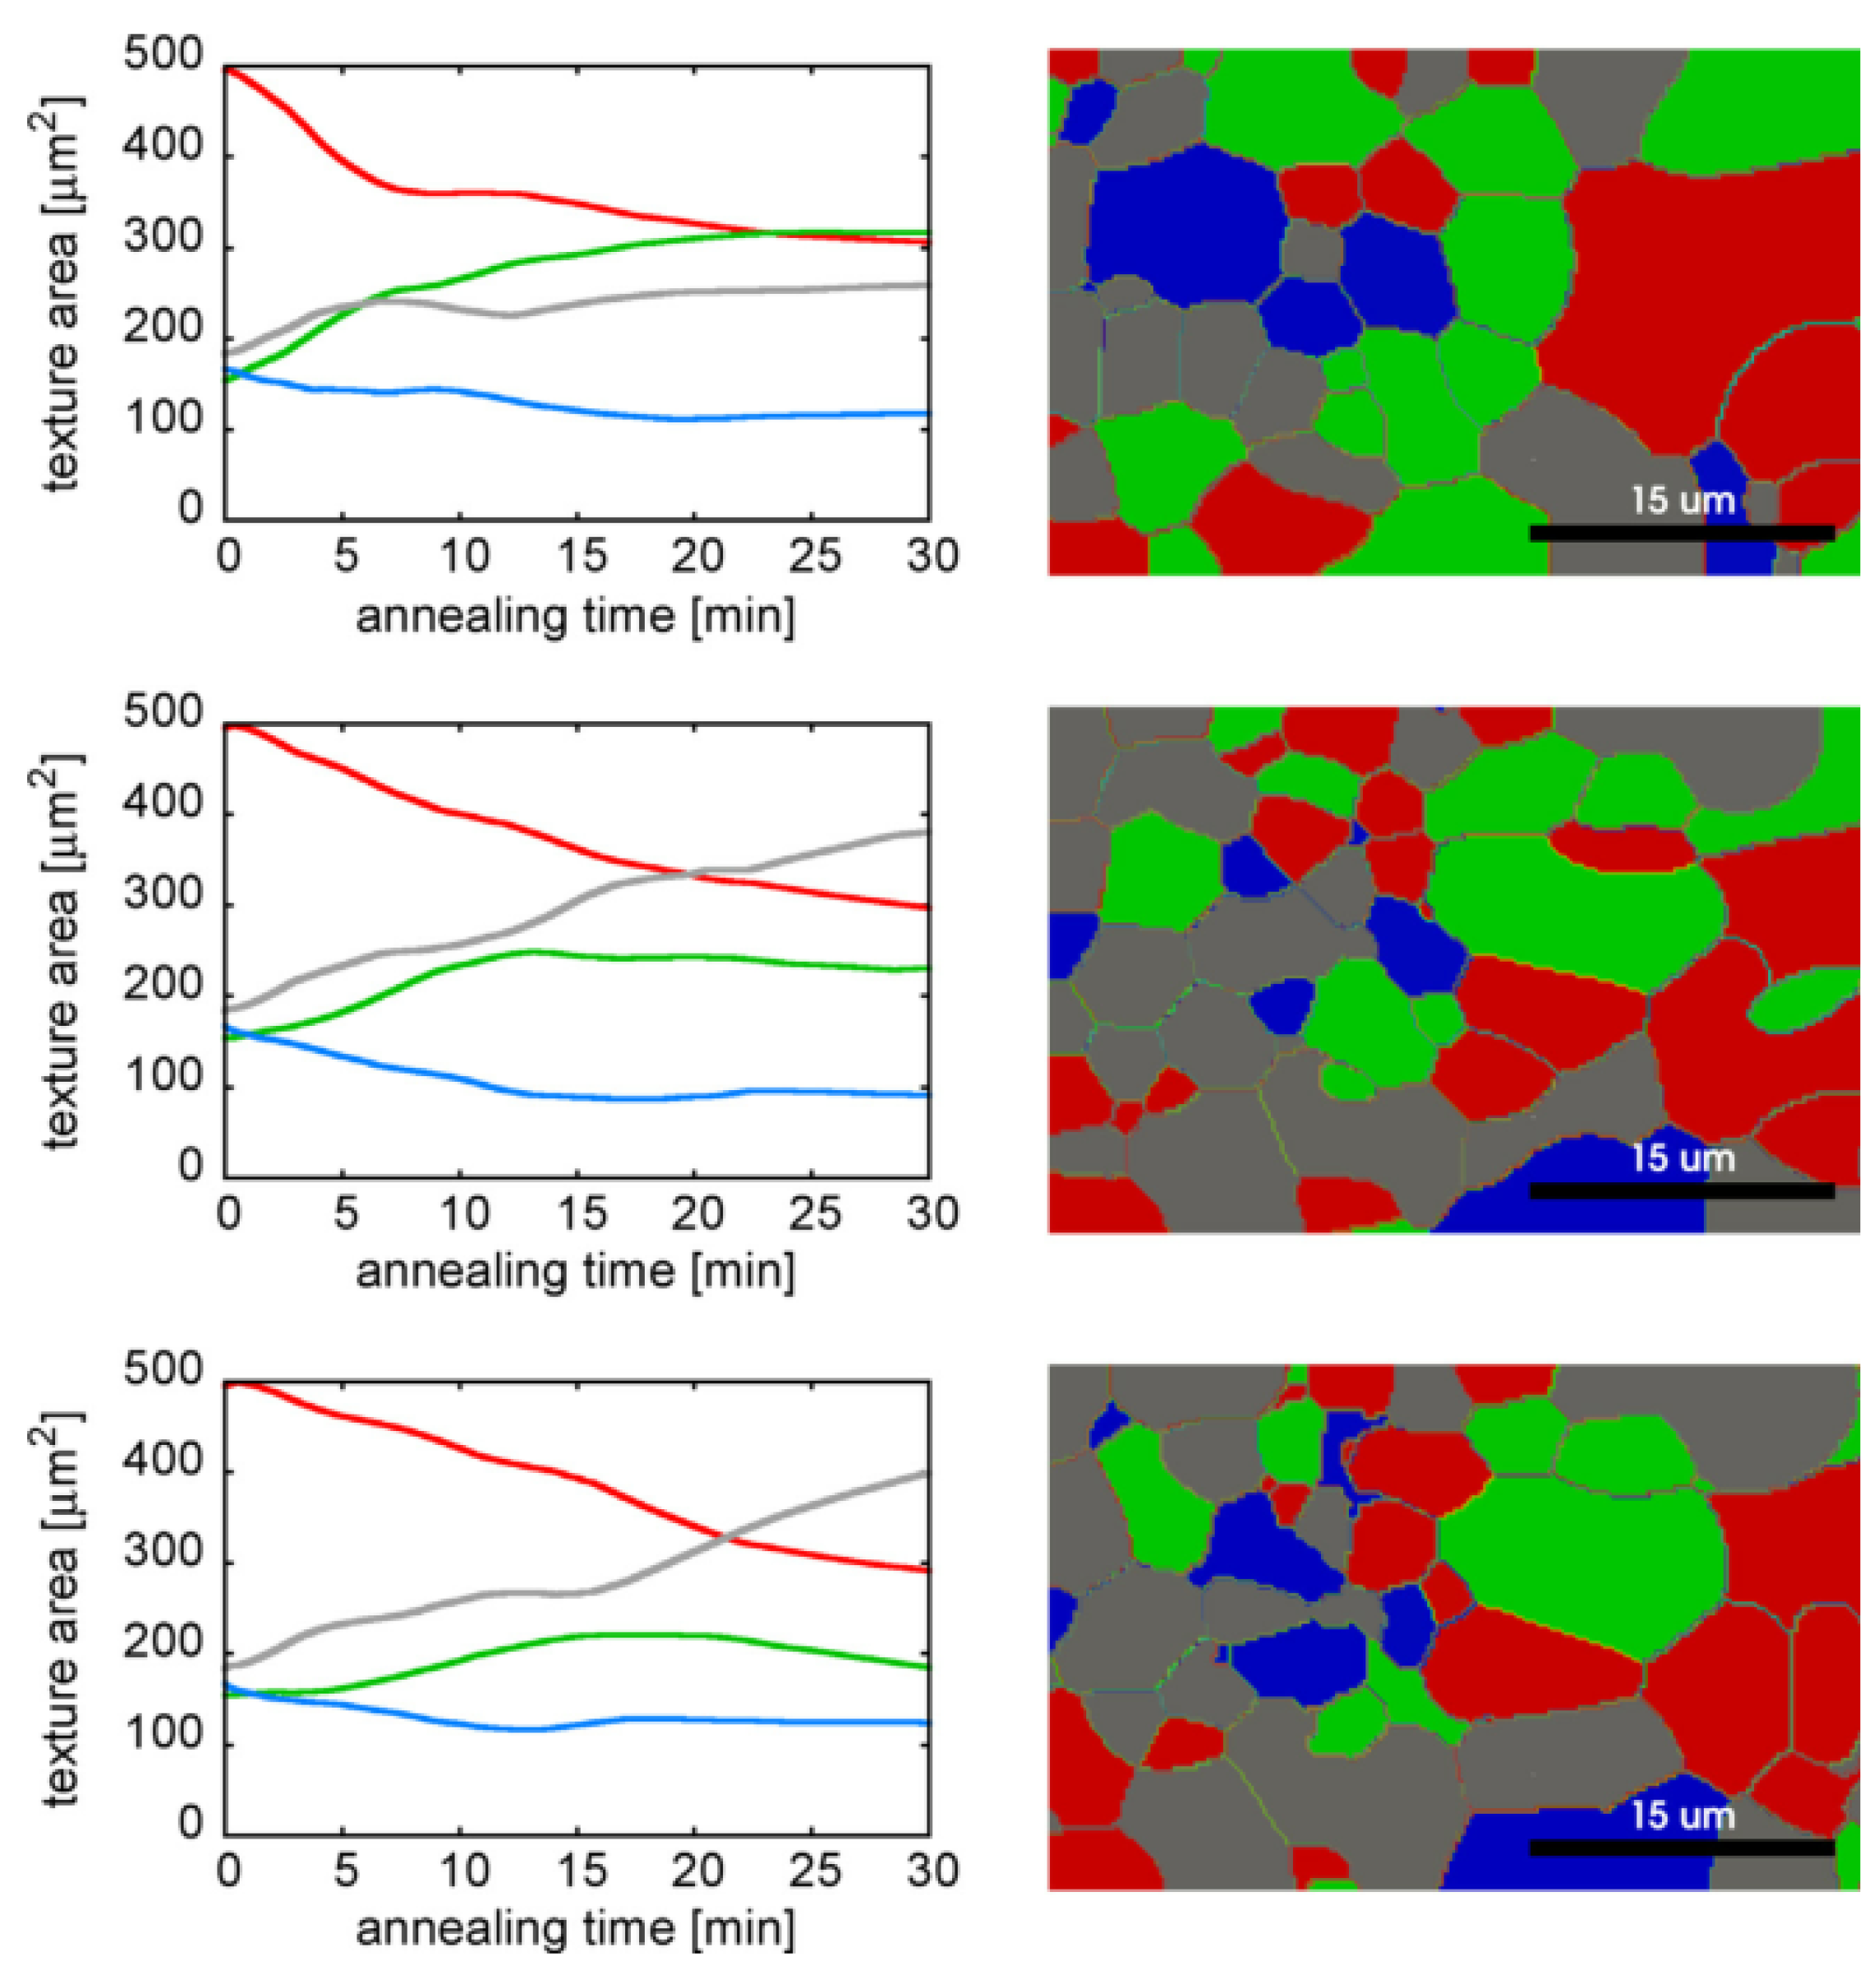
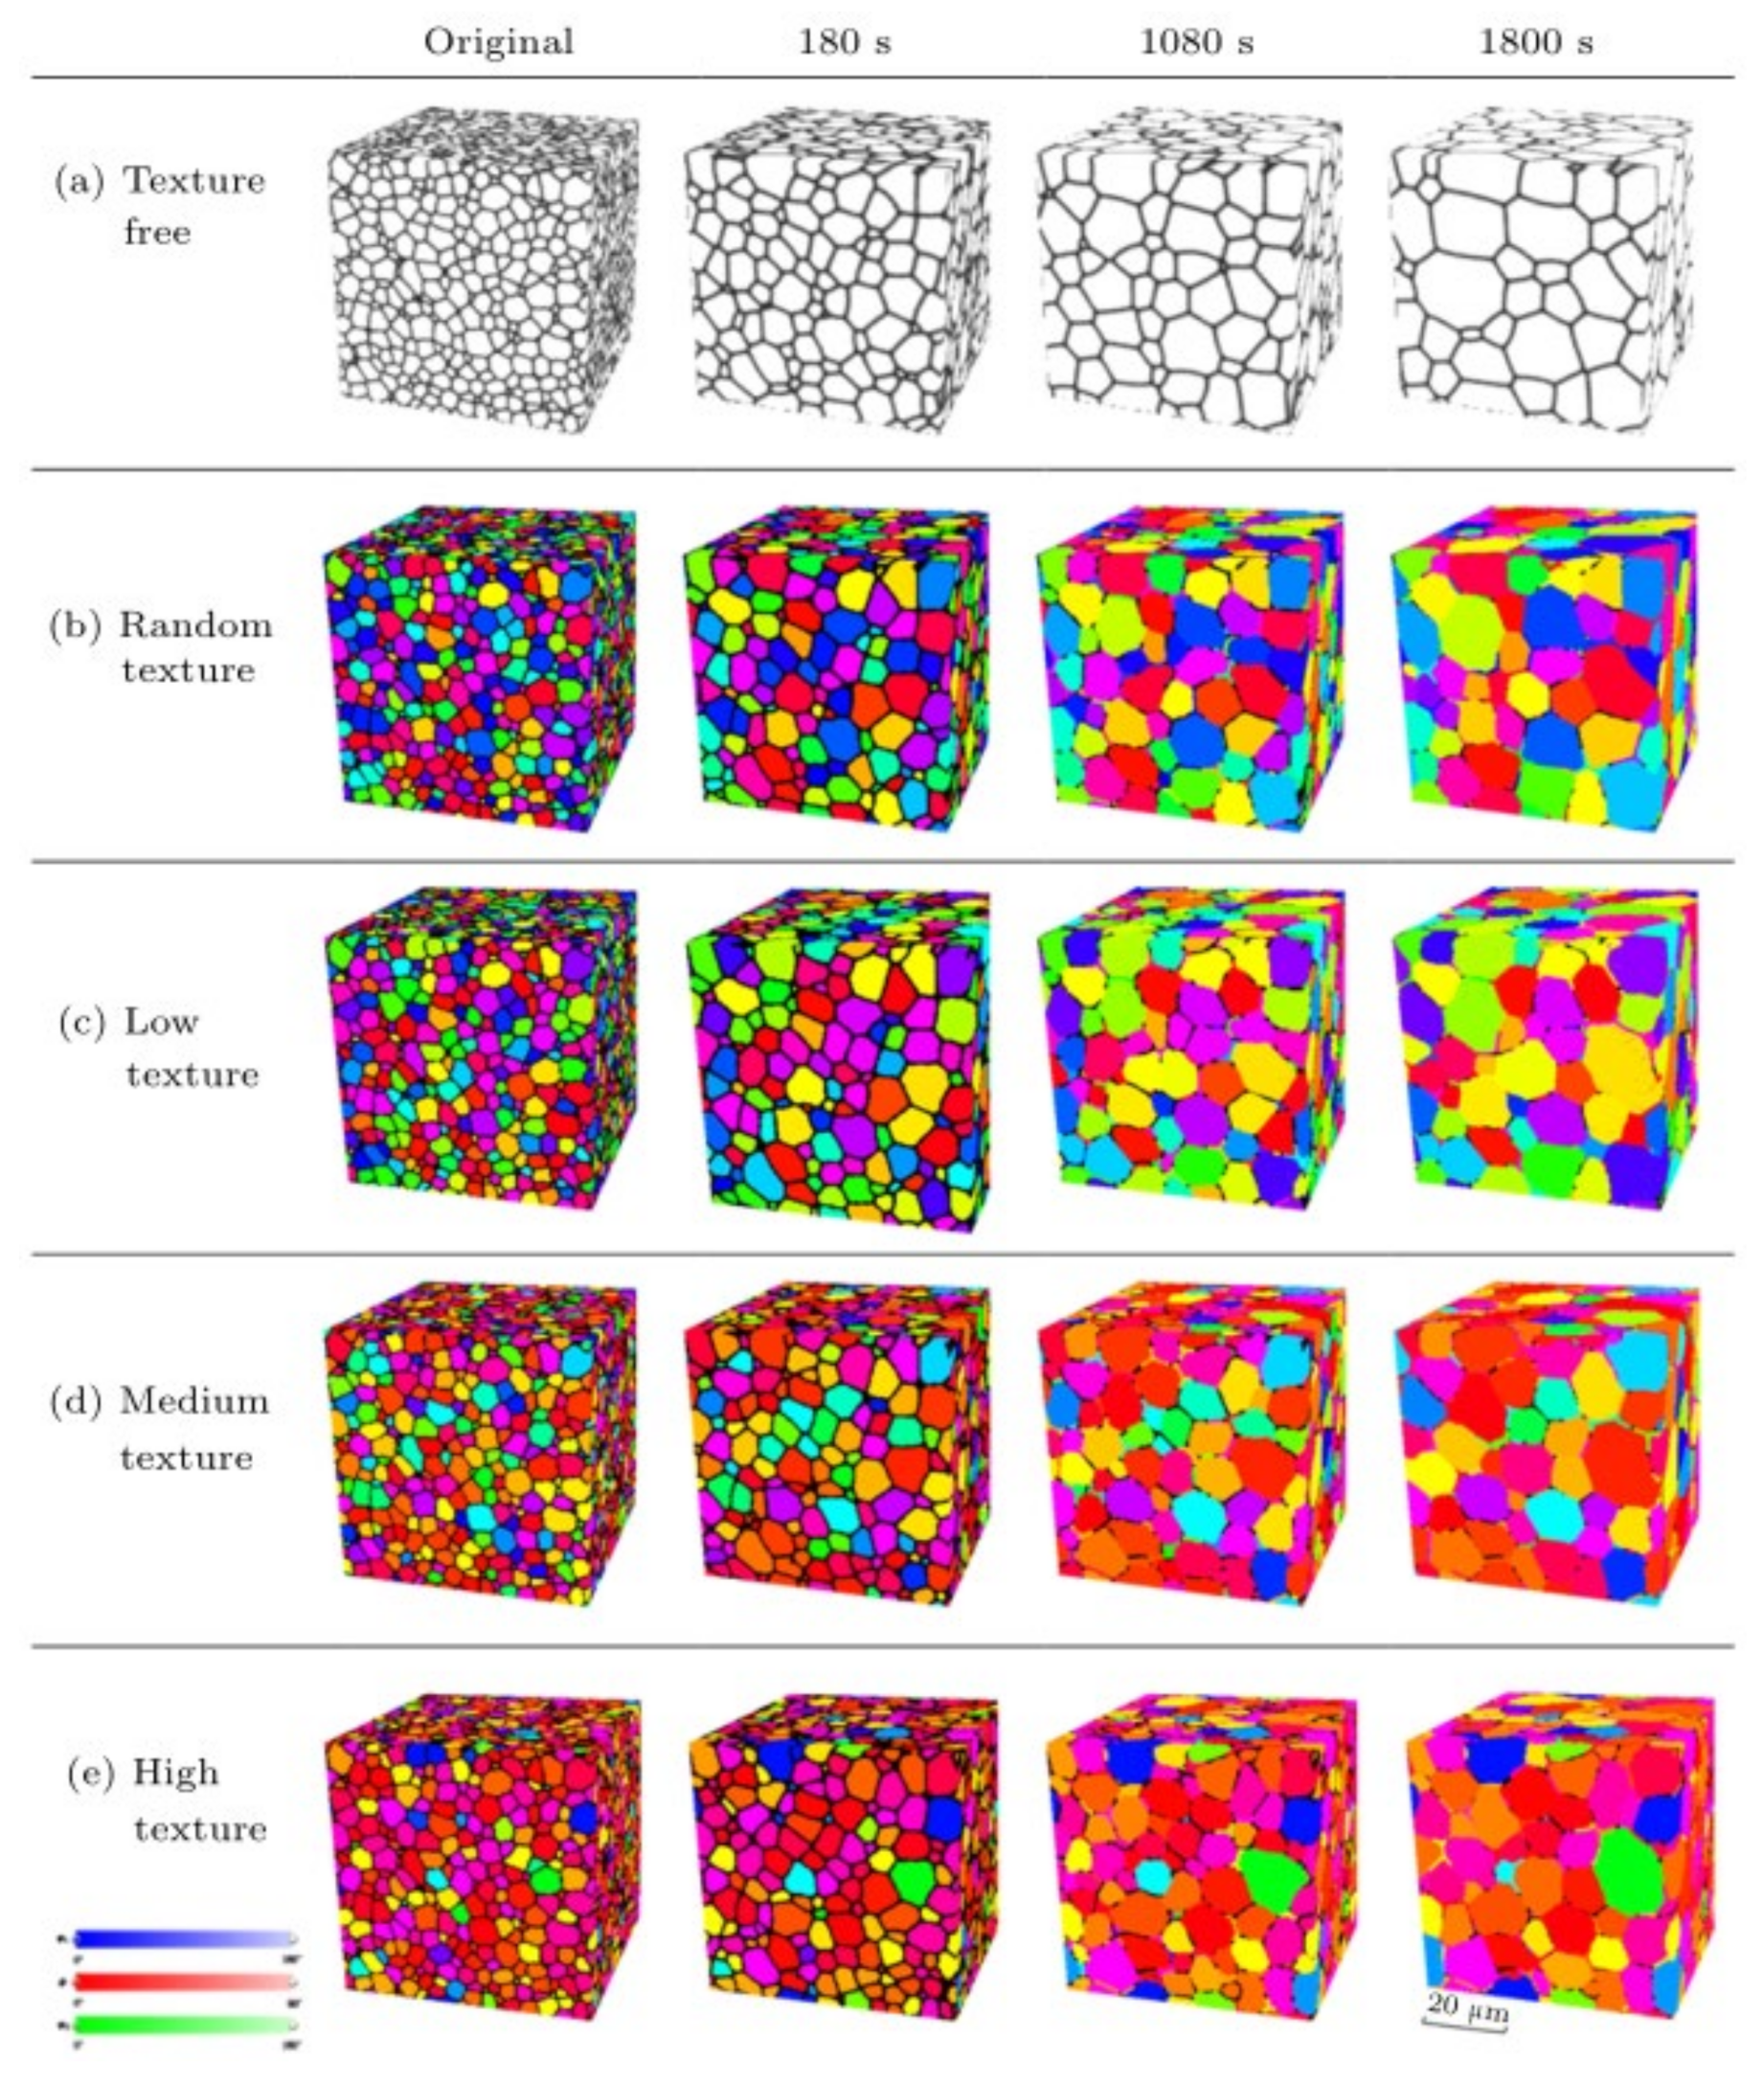
4.1. Simulation of Recrystallization under Aging and Energy Changes

Zong et al. [104] and Wang et al. [105,106] proposed a new concept of boundary range to reproduce realistic spatio-temporal microstructure evolution of Mg alloys during recrystallization, and investigated the influence of different aging temperature and aging time on the recrystallization process by phase-field method. They found that at lower temperatures, the recrystallized grains were more finely and evenly distributed, and the recrystallized grains grow up fast, and grain size distribution moves to larger scale and to be homogeneous at high temperature and longer time. In addition, when the temperature is too high or too low, it will cause the abnormal grain growth phenomenon.
The energy changes in microstructure are also the key to the success of recrystallization. The microstructure evolution of recrystallization of Mg alloy in different deformation regions was studied by Gao et al. [107,108] and Luo et al. [109]. The simulation results indicated that the inhomogeneous stored energy distribution leads to the different growth rate of grain, which makes the inhomogeneous distribution of grain size, and finally, the mixed grain structure. Moreover, recrystallization nucleation sites preferentially occur in the area with high stored energy, e.g., around grain boundaries, where the subgrains are very fine, and grow up by merging and swallowing, while subgrains in the area with low storage energy is relatively larger, more uniform and grow up more slowly. However, the above study ignored the thermal growth of grains. In order to effectively distinguish the recrystallization and thermal growth of grains, Zhang et al. [110] proposed a stored energy release model, simulated the influence mechanism of cold deformation on subgrain size and stored energy, and found that with the increase of cold deformation, grain size decreased and stored energy increased, which are the two factors controlling the peak value of grain size. Kamachali et al. [111] performed the EBSD analysis and phase-field simulations to investigate the mechanisms of texture evolution in deformed AZ31 magnesium sheets. The results suggest that at the beginning of annealing, the residual-stresses induced by in-plane compression are the main driving force for recrystallization and grain growth. Untwinned grains with basal texture will be quickly consumed by twinned grains, which are at the lowest stress state. However, grains continue to expand by curvature-driven normal grain growth in the later stages of the annealing. Moreover, at the presence of low-mobility twin boundaries, the twinned grains evolve slowly, and other non-basal textures are still in a relatively low stress state, growing at the expense of initial basal texture, as shown in Figure 13. The recrystallization of nanocrystalline is quite different from that of micron crystal. Wu et al. [112,113] found that the boundary energy of the nanocrystalline was about a half than that in micron scale crystalline, and the solute segregation at the nanocrystalline boundary was more serious, which was the main reason for the low grain growth rate at nanoscale. Meanwhile, the mixed degree of grains size is more significant in nano-sized grains than that in micron-sized grains. In addition, they also pointed out that the restored energy, interface energy, and interface mobility, are the main factors controlling the abnormal growth of grains within the nanostructure [114]. The grains with certain orientations in the microstructure with locally high restored energy, local low boundary energy, or local high boundary mobility, would induce secondary recrystallization after annealing treatment.
The above phase-field models all simulate the recrystallization evolution process in 2-D, while He et al. [115,116] established a 3D phase-field model to simulate the recrystallization process of AZ31 Mg alloy under external stress during high-temperature annealing. By comparing the recrystallization grain growth process of AZ31 Mg alloy with and without applied stress, it is found that the grain growth will be accelerated with the increase of applied stress, and abnormal grain growth will occur when the applied stress reaches a certain value. Song et al. [117] studied the effect of grain boundary energy anisotropy on grain growth in ZK60 alloy using a 3D phase-field modeling, and found that most of grains in the high textured system are smaller than the grains obtained under other conditions, while the grain size in the texture-free system is the largest, as shown in Figure 14. This is because adjacent grains have closer orientations in a higher textured system, which means more low-angle grain boundary and thus a slower average grain boundary movement.

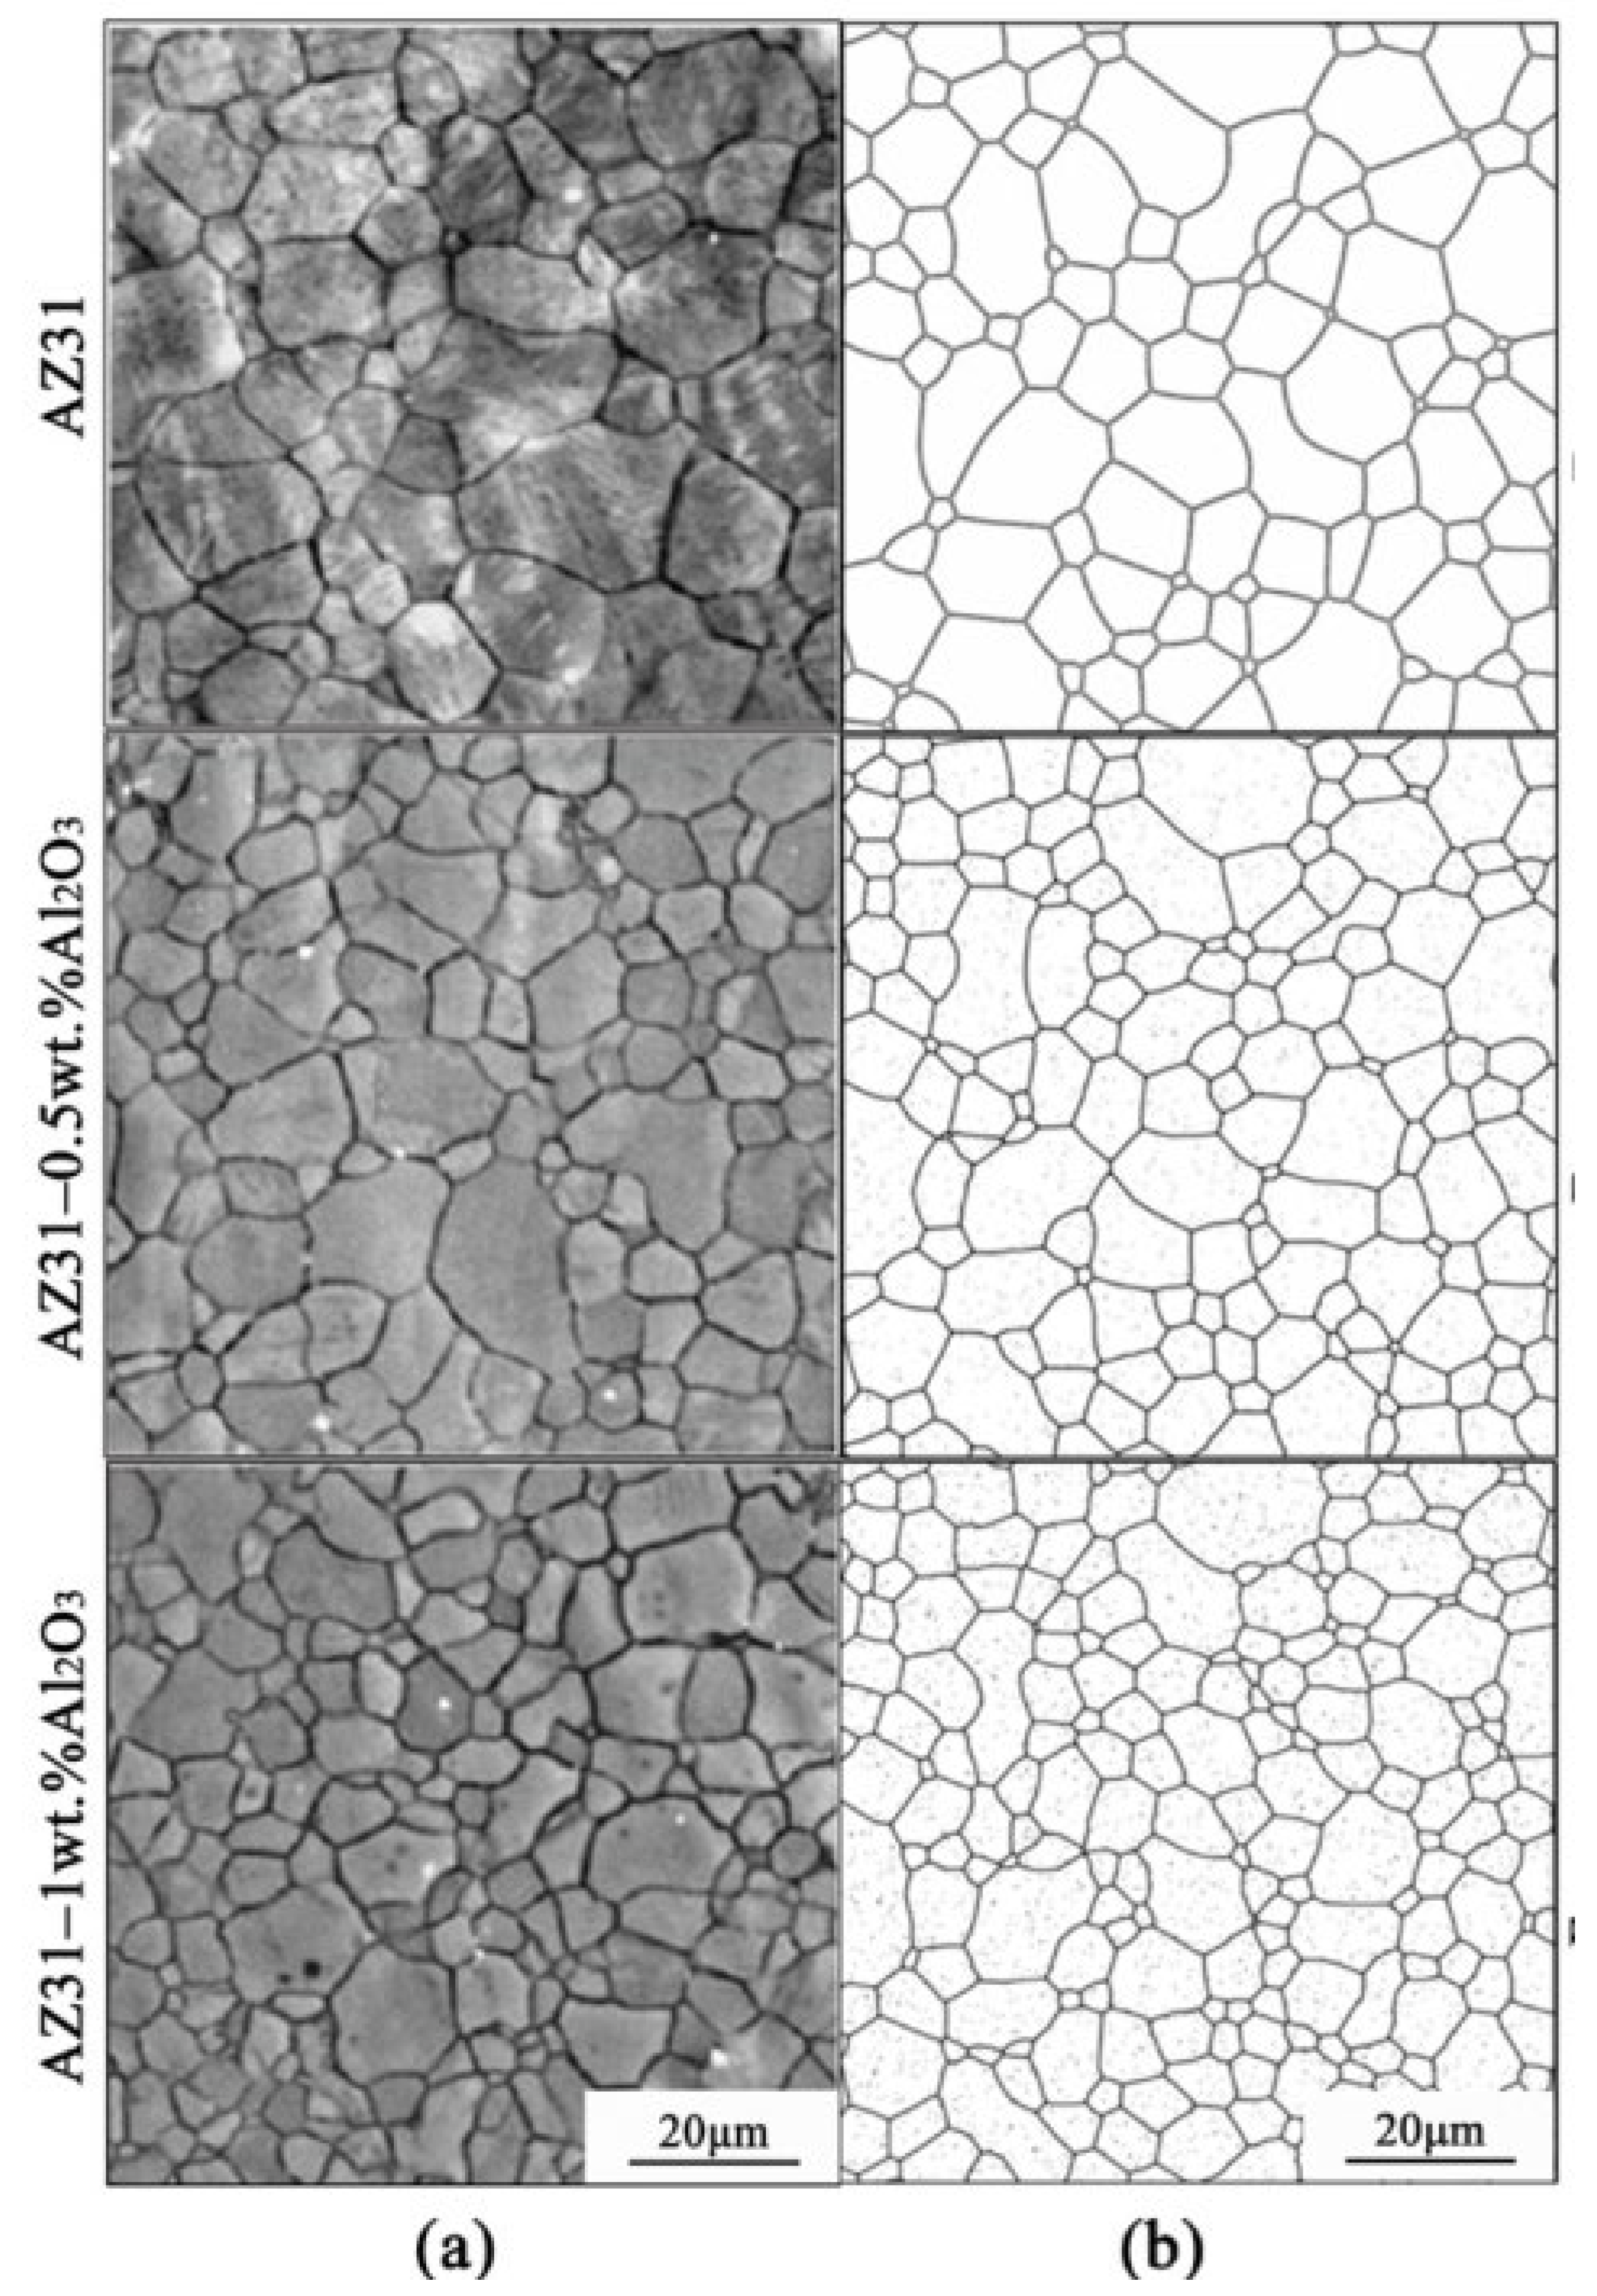
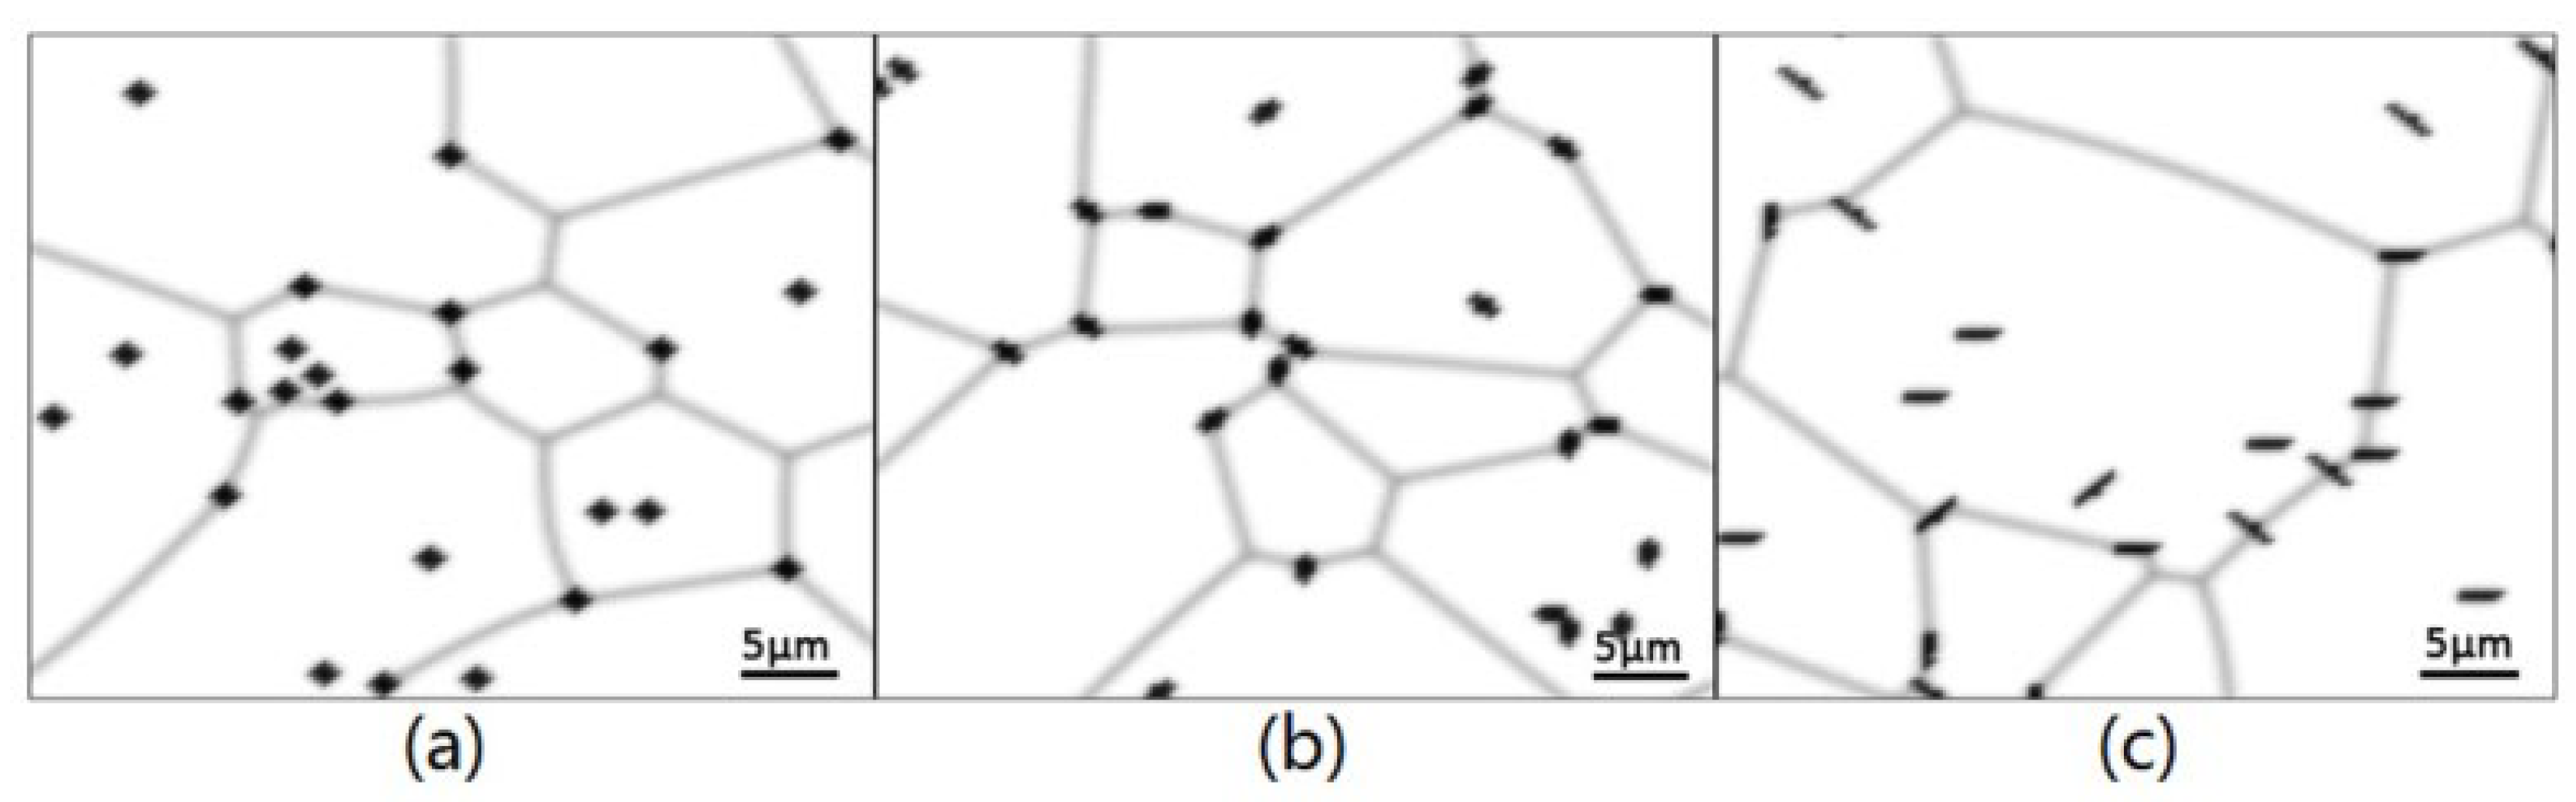
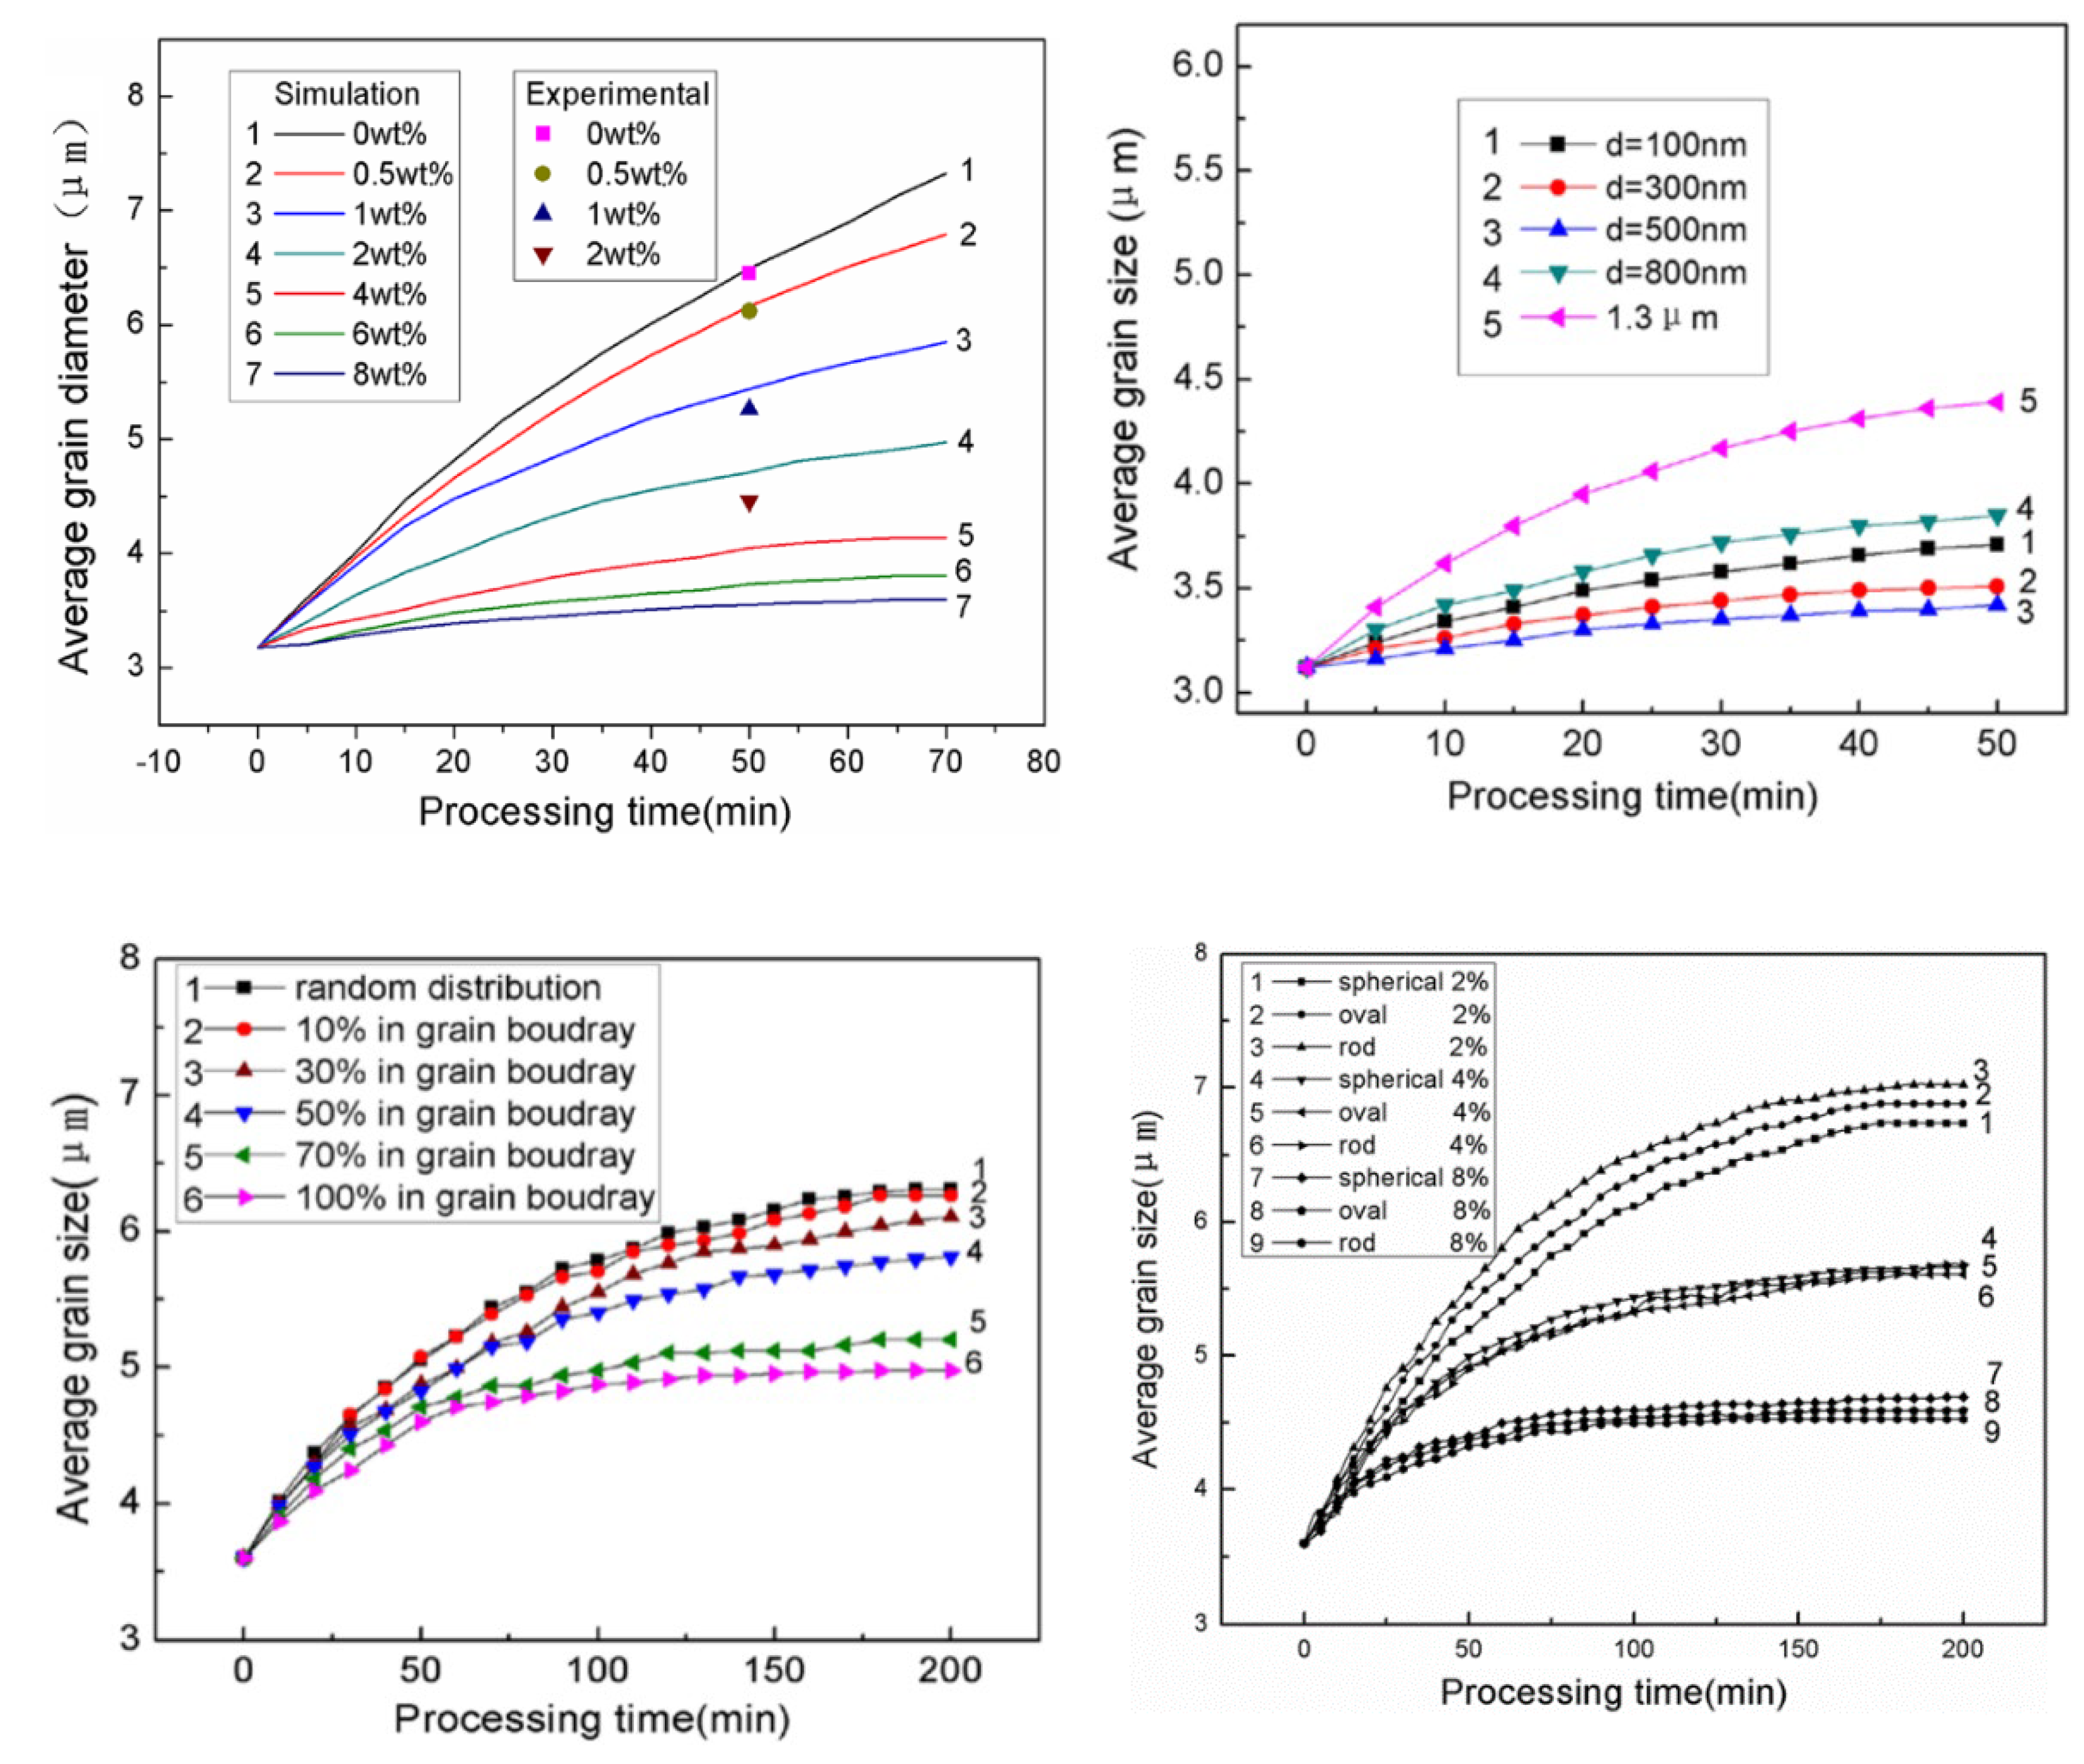
4.2. Effect of Second Phase Particles on Recrystallization

The second phase particle is an important means to refine grains. By the phase-field method, He et al. [118] studied the influence of the volume fraction, size, distribution, and shape, of the second phase particles on the grain growth of Mg alloy. The simulation results showed that with the increase of volume fraction, the pinning effect of the second phase particles on the grain boundary is stronger. There is a critical value for the size of the second phase particle. When the added particle size is smaller than the critical size (0.5–0.8 μm), particles will strongly hinder grain growth. Compared with random distribution, when the particles are distributed in the grain boundary, the effect of grain refinement is the best. The influence of the shape of the second phase particles on the grain growth is related to the volume fraction. When the volume fraction is small, the pinning effect of the spherical particles on the grain growth is the strongest, followed by the ellipsoid particles and rod particles. If the volume fraction is more than 8%, the grain growth inhibition of rod-shaped particles is the best, while that of spherical particles is the worst, as shown in Figure 15, Figure 16 and Figure 17. Wu et al. [119] investigated the effect of spherical second phase particles with different sizes and volume fractions on the grain growth of nanostructured Mg alloy. The simulation results showed that in the nanostructure, the critical value of the second phase particle size decreases with the increase of particle volume fraction; on the other hand, the larger the volume fraction is, the larger the effect of grain boundary pinning is, the smaller the average grain size is.

5. Simulation of Solid State Phase Transformations in Mg Alloys

Precipitation hardening is an important way to improve the mechanical properties of Mg alloy. Previous experiments [102,120] have shown that the distribution and shape of precipitation of alloys such as Mg-RE, Mg-Al, Mg-Si, and Mg-Zn, have a significant effect on their mechanical properties. Nowadays, the phase field method is becoming the main method to study the distribution and properties of the precipitation.

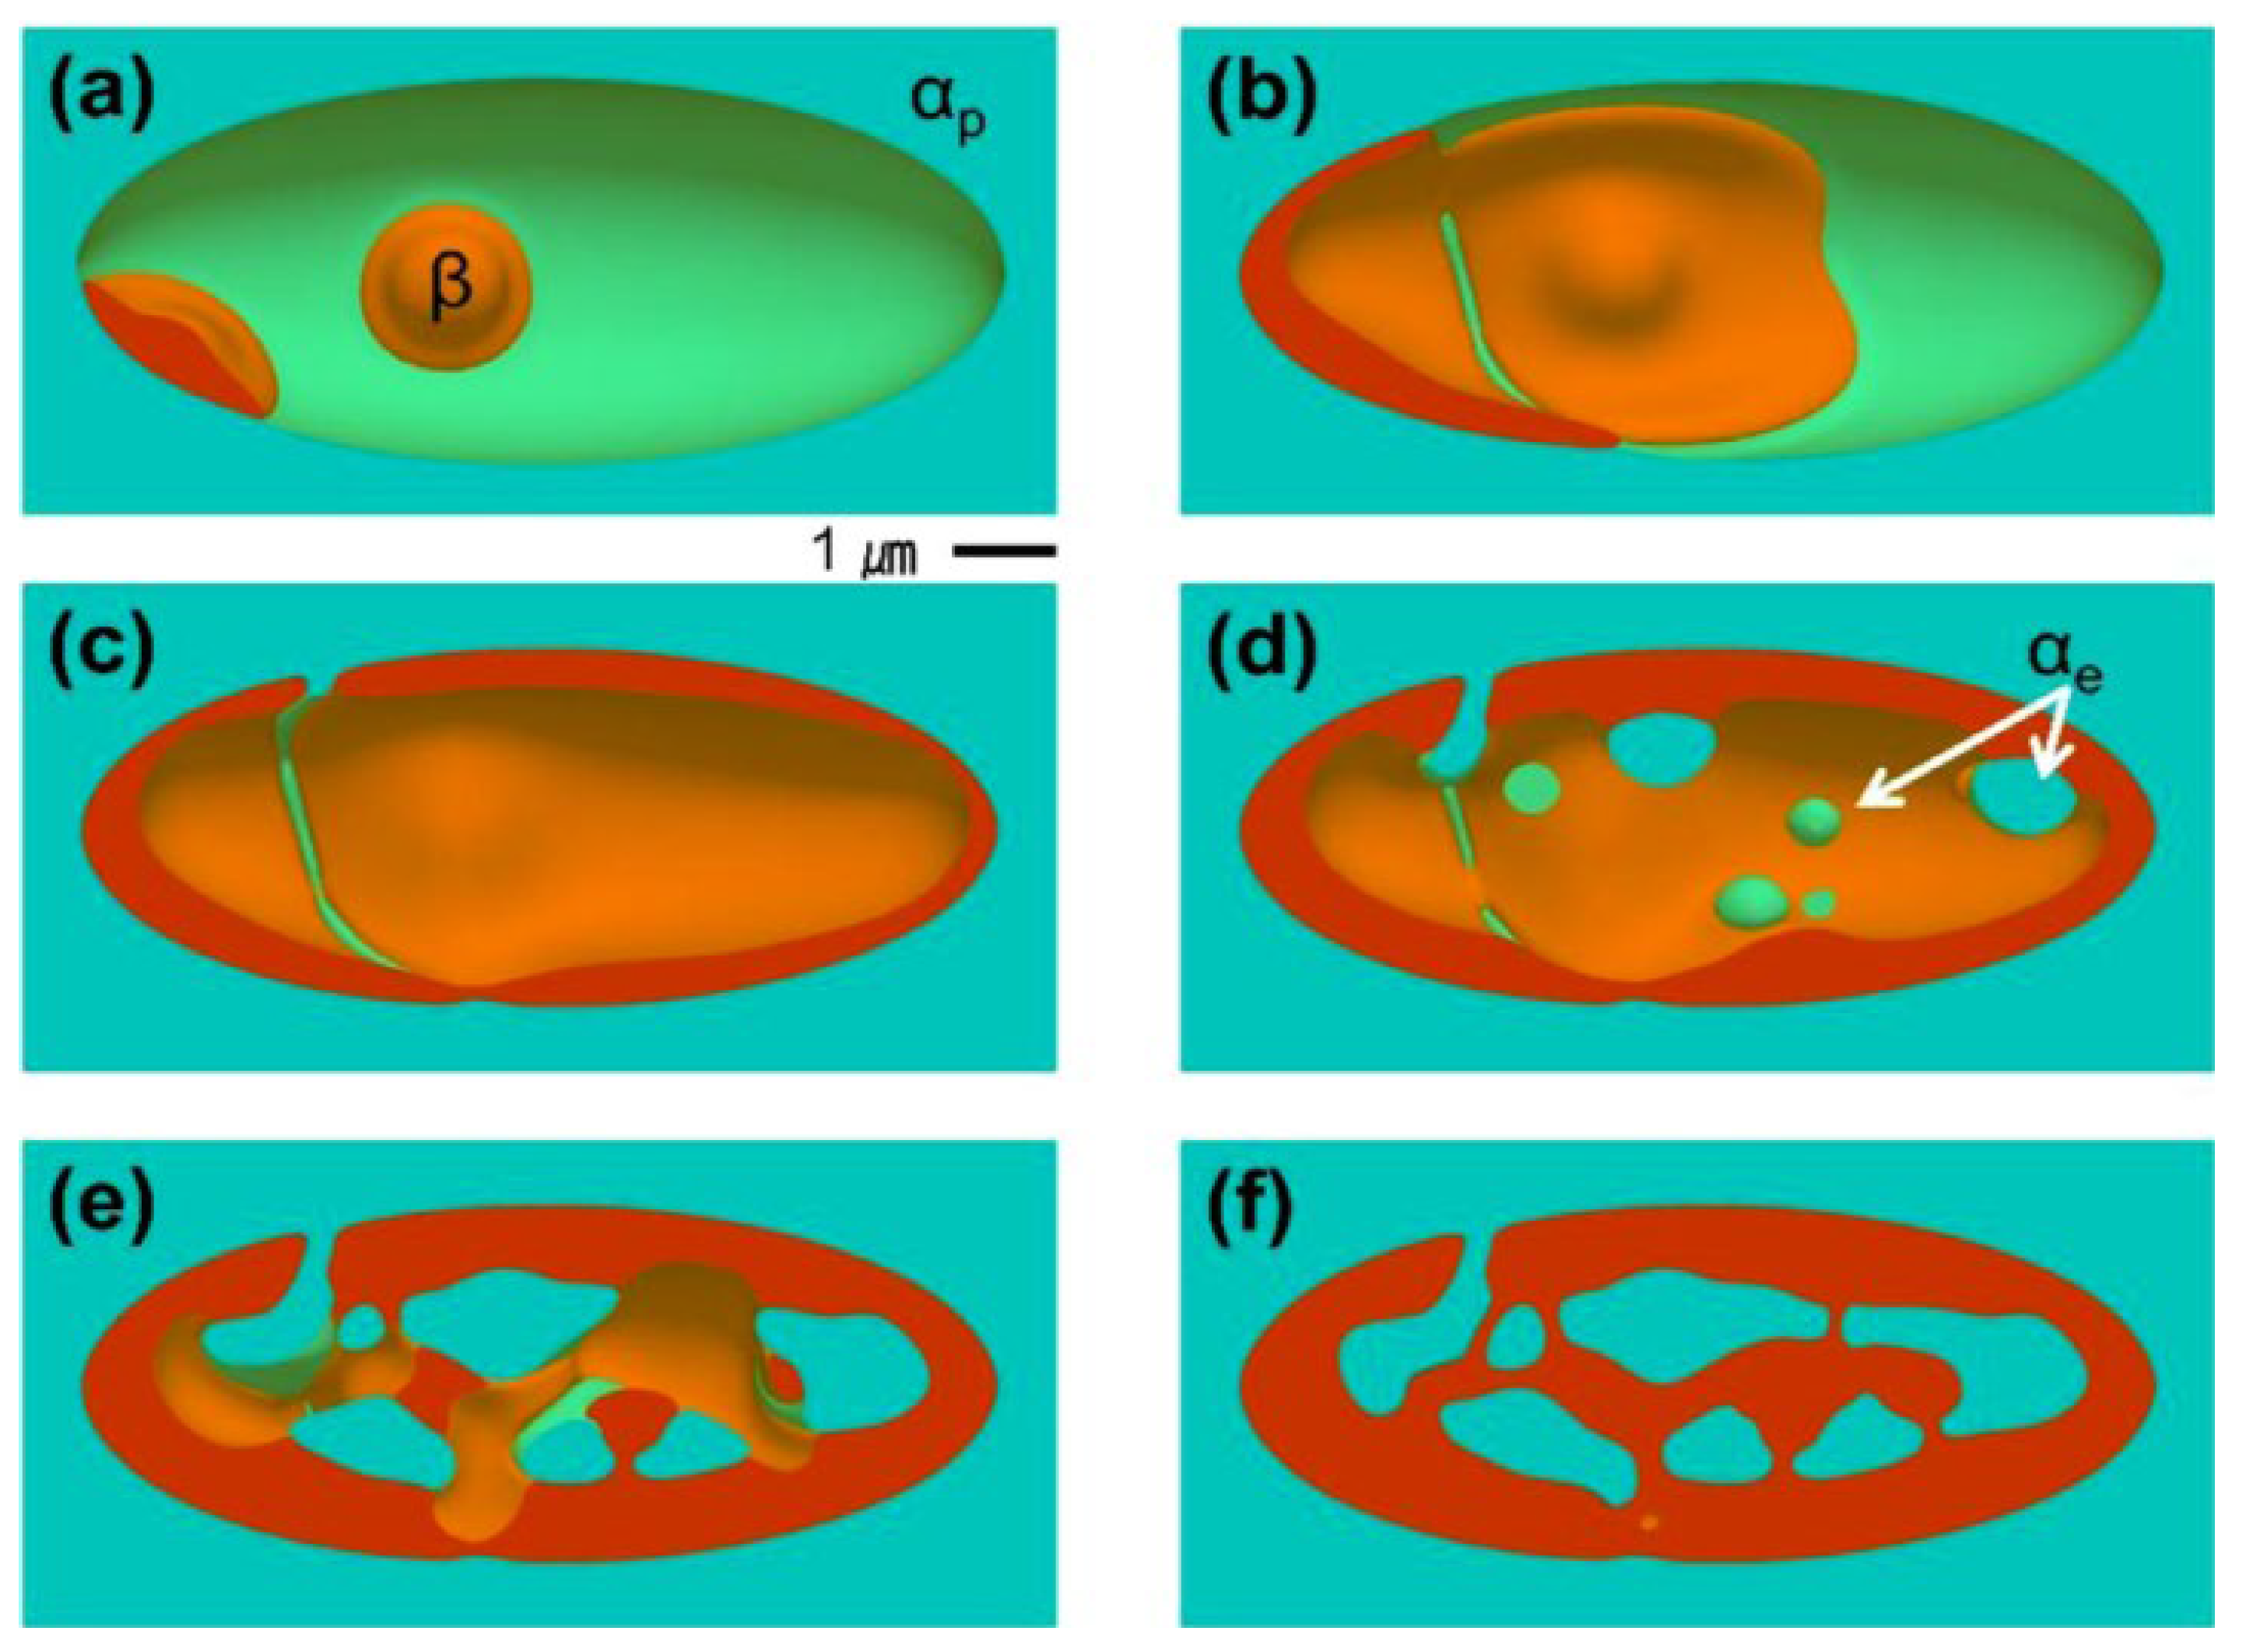
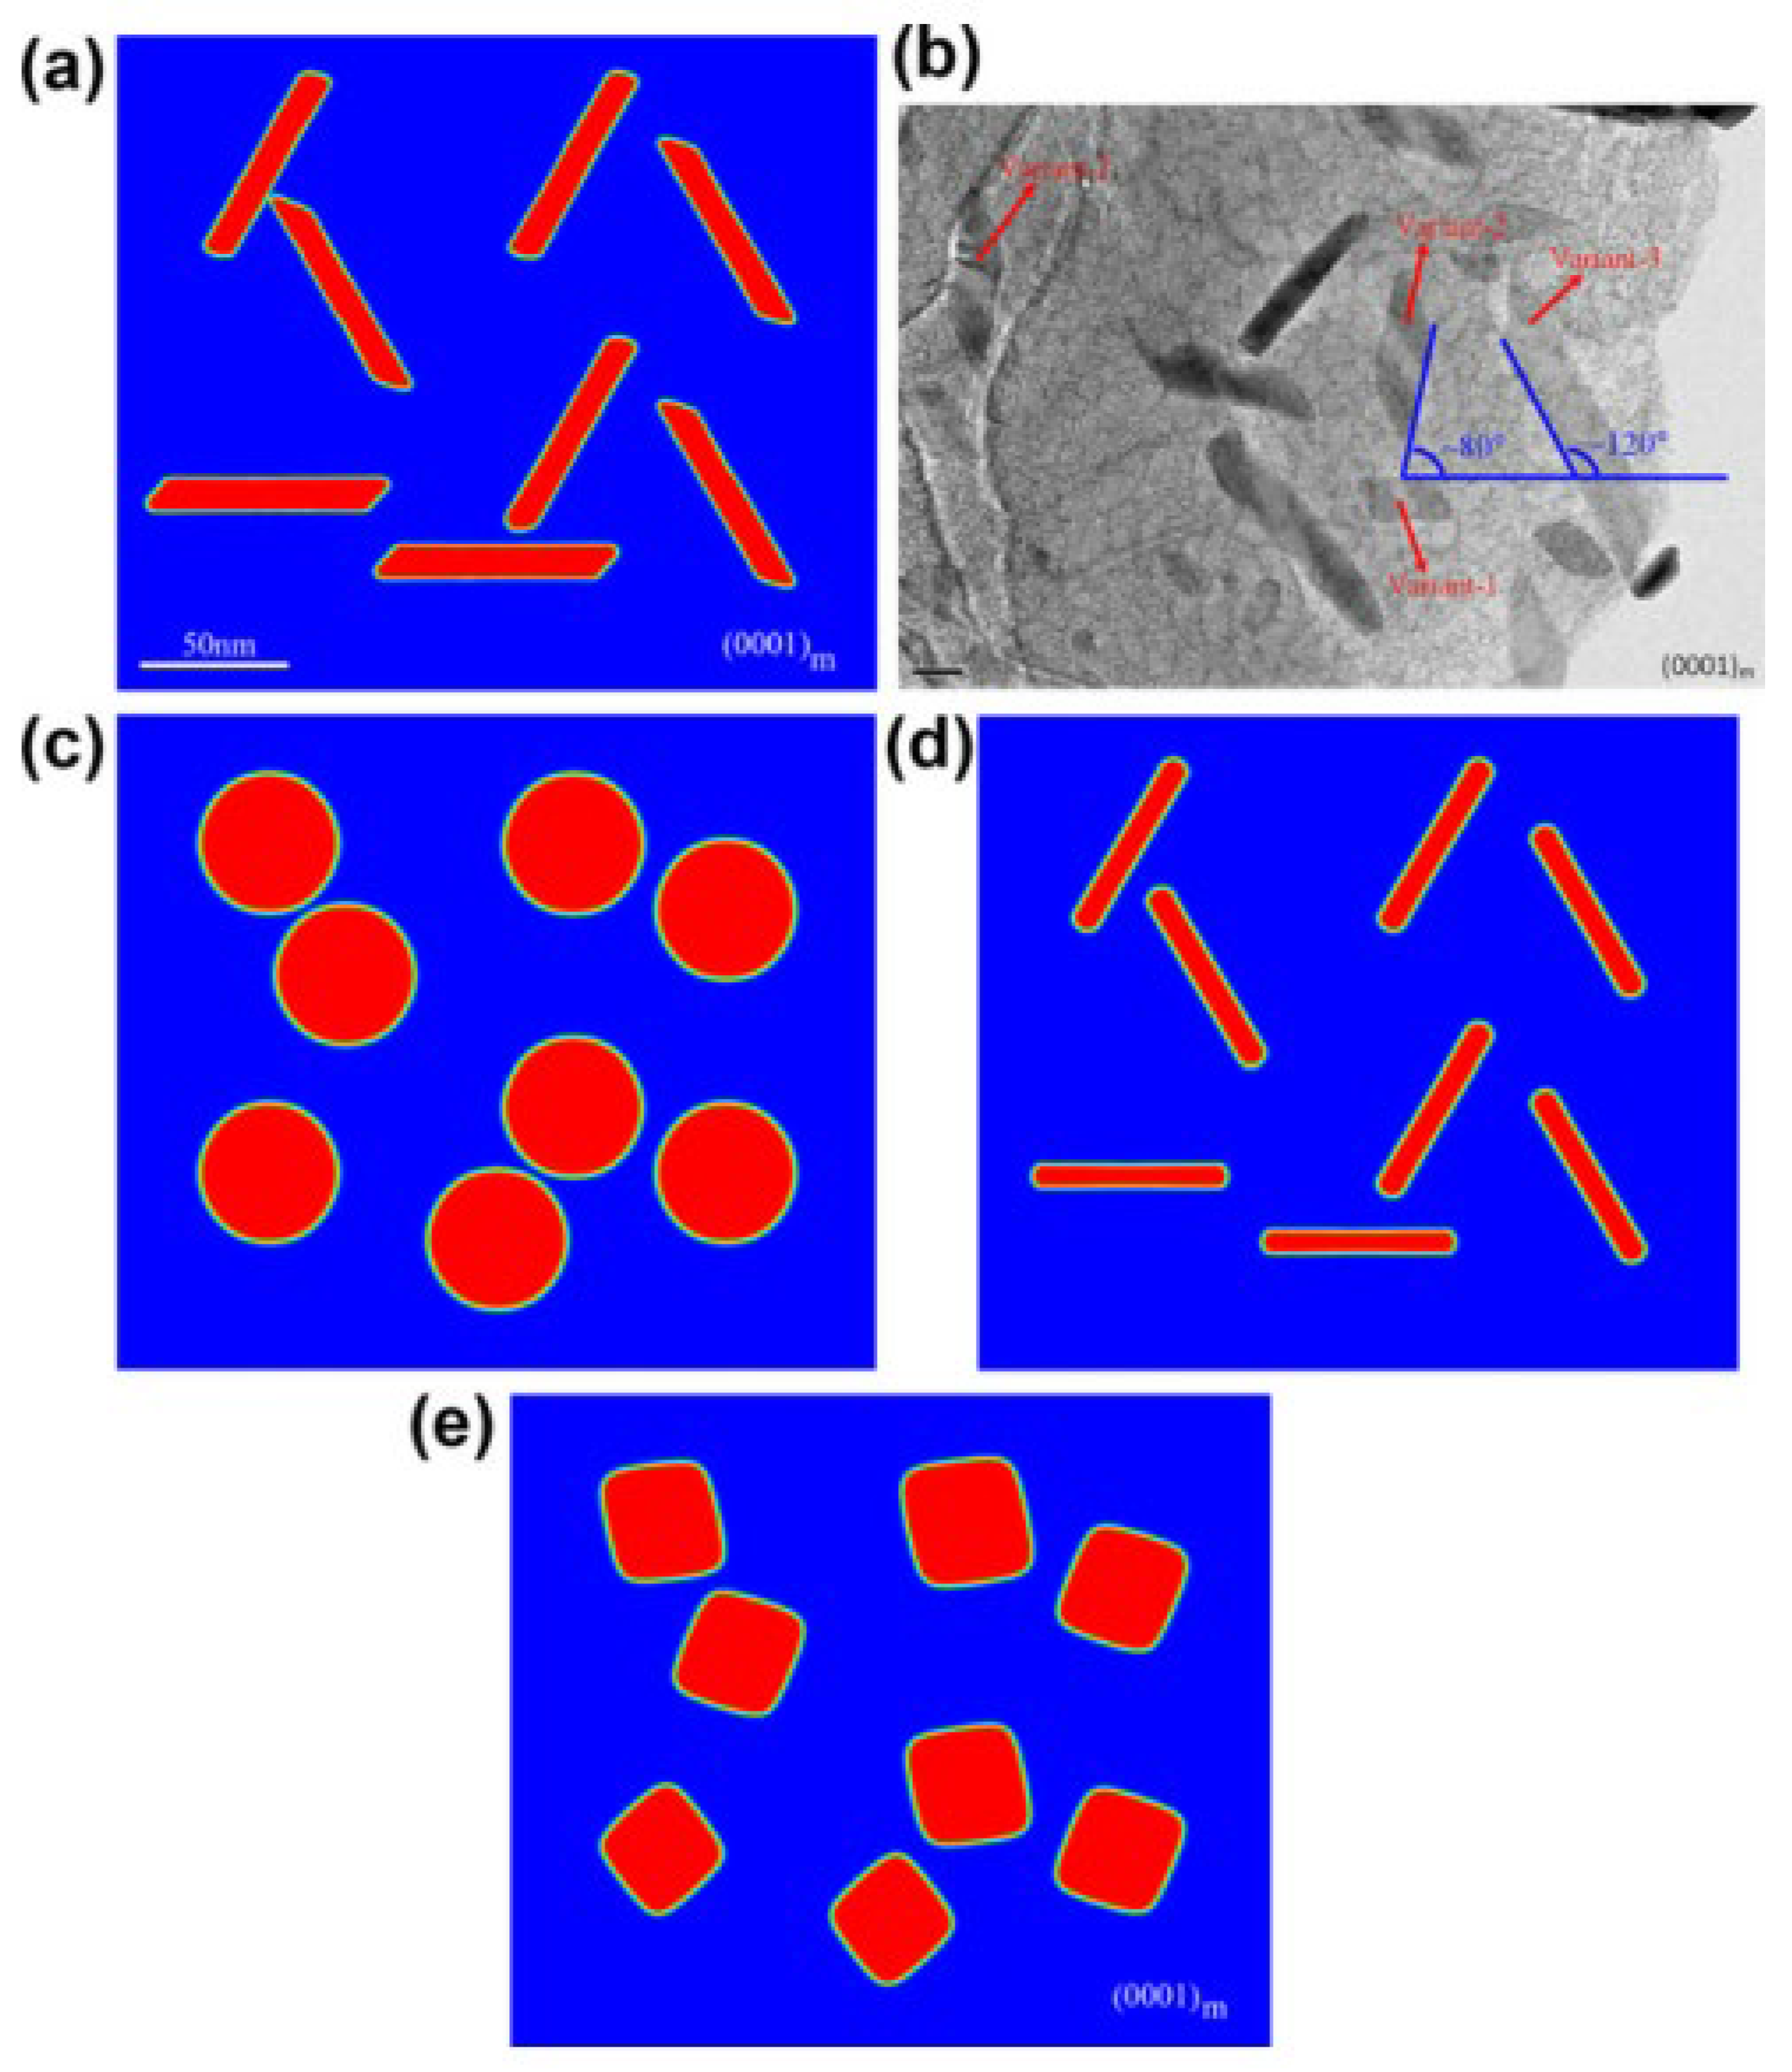
5.1. Simulation of Morphology Evolution of Precipitates

The evolution of the precipitates is closely related to the mechanical properties of Mg alloys. By using the phase-field method, Gao et al. [121] studied the precipitation process of β1 phase in Mg-Y-Nd alloy. The simulation results showed that under the interaction between the elastic strain energy and the interfacial energy, the precipitates are a dish-like shape with slightly distorted two tips. Its habit plane is {1 1 ¯ 00}α, which differs from basal habit planes usually observed for precipitates in Mg alloys. Since the study was carried out under the premise of isotropic interface energy, the morphology of precipitate was mainly controlled by elastic strain energy. On this basis, Liu et al. [122] studied the 2D morphology of β′-Mg7Y and β′-Mg7Gd precipitates under the cooperation of anisotropic interfacial energy and elastic strain energy. The simulation results demonstrated that when only the interfacial energy anisotropy was introduced, β′ phase has an ellipse shape with a { 1 ¯ 100}α habit plane. If only the anisotropic elastic strain energy was taken into account, the precipitate prefers to have a plate shape with a {11 2 ¯ 0}α habit plane. When both the anisotropic interfacial energy and the elastic strain energy were considered in the simulation, the habit plane of β′gradually varies from { 1 ¯ 100}α to {11 2 ¯ 0}α. Due to the different lattice parameters of β′-Mg7Y and β′-Mg7Gd, the morphology of the two precipitates is different, which are nearly equiaxed and truncated lenticular shape, respectively. Later, Han et al. [123,124] and Ji et al. [125] employed a similar method to study the influence of elastic strain energy and anisotropic interface energy on the morphology of precipitates, which further confirmed that the morphology of precipitate is jointly controlled by both energies, as shown in Figure 18. Recently, Zhang et al. [126] developed a phase-field model to simulate the competitive growth of Mg2Sn phases with different orientations in Mg-2.2Sn-0.1Zn alloy. The simulation results showed that the competition between chemical free energy and strain energy can provide the phase transformation driving forces and can result in a variation of habit plane from {0001}α to {11 2 ¯ 0}α, which makes the discs-like precipitates along basal plane gradually develop into a thick rods-shaped on the pyramidal plane. Furthermore, they also point out that the random distribution of Sn promoted the formation of the pyramidal Mg2Sn precipitates. At the same time, these investigations also indicated that the aspect ratio is an important parameter to reflect the evolution of the morphology of the precipitates directly [121,122,123,124,125]. The tensile strength and yield strength of Mg alloys can be improved by controlling the aspect ratio of the precipitates. The simulation results showed that the aspect ratio of precipitates could be increased by increasing the elastic strain energy or decreasing the anisotropic interface energy.
Other factors may also influence the precipitates’ shape, such as A, B, and C. The simulation [127] showed that the Si precipitates in Mg2Si alloy grow along the stress direction under the tensile stress, and with the increase of tensile stress, the growth rate of precipitate is accelerated, the aspect ratio is reduced, and the lath structure is observed. Under compressive stress, faster growth rate and smaller aspect ratio can be obtained than those under tensile stress. Composition is another factor that also influences the precipitates shape. In Mg-Nd alloys, β′ phase is a common precipitate, but DeWitt et al. [128] pointed out that the composition of β′ phase observed in experiments is often higher than that of the common β′ phase. They called the precipitate β′′′, and studied the morphology and concentration range of β′′′. It found that a single β′′′ phase is an equiaxed lenticular structure with a (100) habit plane. However, under the interaction of two adjacent β′′′ phases, the growth along the [010] direction is inhibited, so that the β′′′ phase can only grow along the [001] direction. The predicted Nd composition of β′′′ phase presence was 14.1–14.6%, which was higher than 12.5% in β′ phase, so it was preferentially precipitated.

5.2. Simulation of Precipitate Distribution

The essence of precipitation strengthening of Mg alloy is that the precipitates can effectively block dislocation glide and improve its strength when it is under forced deformation. However, when the Mg alloy is deformed, it will produce stress concentration, which will greatly reduce the mechanical properties of the material. In order to reduce the stress concentration, the precipitates will interact with each other and form a variety of distributions to counteract the stress concentration. Gao et al. [121] studied the effect of β1 on the precipitation process of β′ phase in Mg-Y-Nd alloy and verified the distribution characteristics of β1 and β′ phase observed by electron microscopy.
The coexisting configurations can significantly reduce the stress concentration at the tips of β1 and distinguish different β1 variants by the attachment sites of the β′ precipitates. In addition, the interaction between different β1 variants can also generate a number of multi-variant configurations to reduce the stress concentration effect. These configurations include triadic structure, zigzag shape, and flying bird shape. The stress field distribution of triadic structure is studied emphatically and found that the stress value in the central region of the structure is less than that in the free ends, which is more conducive to the energetically favored. Subsequently, Zhu et al. [129] studied the formation mechanism of bamboo structure in Mg-Nd alloy. They found that the bamboo structure is made up of two alternating segments of β1 and β2 in which β1 phases are the bamboo trunk and the bamboo leaf, while the connecting structure β2 phase does not form alone, it always forms in connection points of two β1 phase of the same variant or of different variants but having opposite shears. The optimal nucleation sites of β1 phase of bamboo leaves are at the connection points between the different β1 variants with opposite shear stresses. Later, Liu et al. [130] focused on simulating the structure of β F   phase in Mg-Nd alloy and its influence on the precipitation process of β1 phase. They pointed out that β′ precipitate is less stable than β F   . However, the stability of β F   is not as good as that of β1, which is usually attached to the end of β1 to reduce the stress field around the ends of β1, as shown in Figure 19. Besides, the structure of β F   is similar to that of β1, which can be transformed under certain conditions. However, the formation energies of β F   and β′ in Mg-Gd alloy are almost identical, so their stability is similar, and they can coexist simultaneously [131]. The β F   and β′ precipitates form linear chains along [1 1 ¯ 00]α and within each chain, they have an alternate distribution, which can reduce the elastic strain energy of the two type precipitates and the Mg matrix around them. Meanwhile, the structure can effectively reduce the tensile/compressive stress around the β′. Moreover, the elastic strain energy around the pre-existing precipitates also has an effect on the nucleation of the precipitates. Han’s [132] study shows that the interaction of the anisotropic elastic energy can have a significant impact on the subsequent nucleation position and promote the formation of new nuclei near the diamond end of the pre-existing precipitates. This will enhance the corrosion and wear resistance of the metal to some extent as more new nuclei are formed.
The precipitates can not only regulate the stress field but also play an important role in controlling dislocation slip. For example, in Mg-Y-Nd alloy under the applied external stress, some parts of the dislocation lines are bowed because of the blockage of β1 to the screw dislocation [131]. At this time, the dislocation type becomes a mixed dislocation, and the dislocation loops are formed finally around β1. In order to fully understand the effect of precipitation on dislocation, Liu et al. [133] applied the phase-field model to simulate the nucleation of β1 precipitates on various a-type dislocations in Mg-Nd alloy. It is found that the metastable β1 precipitates form as ultra-thin long plates with abnormally large aspect ratios under the influence of the stress fields of screw dislocations. Near the edge dislocations, the morphology of β1 is a zigzag line. At mixed dislocations, the β1 precipitates form into a variety of arrays, most of which are distributed along dislocation lines and composed of the same orientation variants of β1. In addition, the heterogeneous nucleation of β1 phase also affects the more complex honeycomb dislocation consisting of the triadic structure of β1 precipitates in Mg-Nd and Mg-Y-Nd alloys [134]. Two β1 phases with opposite shear direction nucleate continuously along the upper and lower sides of each segment in the honeycomb grid and form honeycomb shape with the growth and impact of these precipitates, as shown in Figure 20. Recently, Liu et al. [135] further studied the formation mechanism of the chain structure of β′ phase in Mg-Gd-Zr alloy under the interaction of external force and dislocation. It is found that the applied stress can promote the preferred growth of the variants, and the dislocation line provides the nucleation site for the variants, which makes the precipitates form a straight chain structure.

5.3. Simulation of Twin Formation

Twinning is a common deformation mechanism in Mg alloys due to the fewer slip systems of the H.C.P. Mg. The mechanical properties of Mg-alloys are significantly affected by twinning. To understand the formation and evolution mechanisms of deformation twins in Mg alloys, the first successful phase-field model coupled with the finite element method for studying the nucleation of homogeneous twins in Mg single crystals was proposed by Clayton et al. [56]. The critical shear strain of twin nucleation and the effect of surface energy anisotropy on twin shape were analyzed. Results demonstrated that the equilibrium shape of twin sensitive to surface energy anisotropy. Kondo et al. [136] proposed a phase-field model to study twinning and detwinning in Mg alloys. In this model, they successfully reproduced the macroscopic stress-strain response and the development of the microscopic twin morphology and to investigate the stress distribution in the vicinity of twin bands. In 2016, Pi et al. [137] applied a continuum phase-field model to investigate the transverse propagation of deformation twinning for Mg alloys. Their simulation results demonstrated that the model was able to predict the equilibrium shape of tensile twins and the kinetics of the twin front. More recently, Liu et al. [138] constructed a phase-field model and applied this model to simulate the formation and autocatalytic nucleation of deformation twins in polycrystalline Mg alloys. It is found that the stress concentration at the grain boundary is the main reason for the formation of twins, which leads to the inhomogeneous distribution of the interaction energy within the grains, and makes the twins form early in the grains with the largest negative interaction energy. The autocatalytic nucleation of a twin is related to the stress field near its tip of the incoming twin. Before autocatalytic nucleation, twins are usually lenticular in shape. When twins nucleate in adjacent grains, the incoming and outgoing twins evolve at the same time, and the shape of twins gradually changes from lenticular to parallel-sided plate. During the same period, Liu et al. [139] studied the nucleation, propagation, and growth of twins in Mg alloy. The simulation results show that the twins nucleate at the grain boundary, and expand into the grain driven by the interface energy and elastic strain energy, and gradually thicken. At this time, the stress concentration near the twin tip will promote its propagation and inhibit its thickening. At the same time, a large number of dislocations will occur near the twin boundary to adjust the local strain. Recently, Hu et al. [140] established a phase-field model for investigating the effect of grain boundaries on the nucleation and variant selection behaviors of the co-zone {10 1 ¯ 2} deformation twins in Mg alloys, as shown in Figure 21. Phase-field simulations demonstrated that twin transmission across a grain boundary into a neighboring grain leads to grain boundary migration towards the neighboring grain with a reduced grain boundary width. Twin transmission also can induce lower elastic interaction energy in the interface, which favors the twin formation. In addition, a rotation-angle-related twin variant selection rule was established for the twin transmission, and the range of the nucleation angles of different variants also was determined.

6. The Main Problems and Development Trends in This Field

The phase-field method is an effective method to simulate the microstructure evolution in Mg alloys. It does not need to explicitly track the interface positions because it naturally contains a set of continuous phase-field variables across the interface without any significant loss of computational efficiency. The phase-field method can obtain important information that is difficult to find in the experimental observation, and the simulation results are in good agreement with the experimental results. Accordingly, it provides important information for understanding the formation mechanism and influencing factors of microstructures evolution. Although many achievements have been made in the simulation of microstructure evolution of Mg alloys by the phase-field method, some existing problems of the phase-field method have been exposed in these studies. The main problems are as follows:
(1)
At present, most existing phase-field simulations mainly focuses on the binary Mg alloys, while the simulation of ternary and multicomponent Mg alloys still needs further attention.
(2)
The current phase-field method is mainly used for research on the coupling of phase-field, temperature field, and concentration field. However, little work has been done to simulate the microstructures of Mg alloys under other external fields such as electric field, ultrasonic field, and magnetic field.
(3)
The combination of phase-field method and synchrotron X-ray tomography technique is mainly used to study the formation of solidified structure, while there are few studies on the solid phase transitions such as precipitation phase, dislocation slip, and twin formation.
(4)
Due to the limitation of the computer’s data processing ability, most of the phase-field simulations are only applied for the local microstructure in the 2D plane and the specified microstructure features of interest rather than simulating the microstructure features at different length scales altogether in a unified model.
(5)
The simulation results of the phase-field method are in good agreement with the experimental results. However, the actual micro-evolution process is also disturbed by many external conditions, and more factors need to be considered when the simulation results are directly applied to the actual manufacturing, processing, and service, of the Mg alloys.
Due to the complexity of the microstructure evolution of Mg alloys, there are still technical challenges for applying the phase-field model to realistic manufacturing, processing, and service, of Mg alloys. With the rapid development of big data and cloud computing, the improvement of computational accuracy and the establishment of the multi-dimensional, multi-domain, multi-phase, and multi-scale model, is the focus of future research. At the same time, the phase-field method can be combined with 4D synchrotron tomography [69] and EBSD techniques to obtain realistic 3D experimental results. Phase-field simulation technology will usher in unprecedented opportunities in the field of Mg alloy microstructure simulation.

Author Contributions

Conceptualization, Y.W. (Yongbiao Wang) and Y.Z.; methodology, Y.W. (Yongbiao Wang) and Y.Z.; validation, J.W. and X.X.; writing—original draft preparation, Y.W. (Yongbiao Wang) and Y.Z.; writing—review and editing, Y.W. (Yongbiao Wang), Y.Z., J.W., X.X., J.J., J.L., Y.W. (Yujuan Wu), S.D., and H.L.; project administration, Y.W. (Yongbiao Wang), X.L., L.P., H.L., and Y.Z. All authors have read and agreed to the published version of the manuscript.

Funding

This research was funded by the National Natural Science Foundation-Youth Science Foundation Project (51901208), Henan University Key Scientific Research Project (20B430020), the Key scientific and technological projects in Henan Province (202102210016, 202102210272), the Major Innovation Project of Zhengzhou City (23101000010), and Zhengzhou University of Light Technology Doctoral Research Initiation Fund (JDG20190098).

Institutional Review Board Statement

Not applicable.

Informed Consent Statement

Not applicable.

Data Availability Statement

Not applicable.

Conflicts of Interest

The authors declare no conflict of interest.

References

  1. Sezer, N.; Evis, Z.; Kayhan, S.M.; Tahmasebifar, A.; Koç, M. Review of magnesium-based biomaterials and their applications. J. Magnes. Alloys 2018, 6, 23–43. [Google Scholar] [CrossRef]
  2. Agnew, S.R.; Nie, J.F. Preface to the viewpoint set on: The current state of magnesium alloy science and technology. Scr. Mater. 2010, 63, 671–673. [Google Scholar] [CrossRef]
  3. Zhang, J.; Liu, S.; Wu, R.; Hou, L.; Zhang, M. Recent developments in high-strength Mg-RE-based alloys: Focusing on Mg-Gd and Mg-Y systems. J. Magnes. Alloys 2018, 6, 277–291. [Google Scholar] [CrossRef]
  4. Xu, T.; Yang, Y.; Peng, X.; Song, J.; Pan, F. Overview of advancement and development trend on magnesium alloy. J. Magnes. Alloys 2019, 7, 536–544. [Google Scholar] [CrossRef]
  5. Elen, L.; Cicek, B.; Koc, E.; Turen, Y.; Sun, Y.; Ahlatci, H. Effects of alloying element and cooling rate on properties of AM60 Mg alloy. Mater. Res. Express 2019, 6, 096511. [Google Scholar] [CrossRef]
  6. Song, J.; She, J.; Chen, D.; Pan, F. Latest research advances on magnesium and magnesium alloys worldwide. J. Magnes. Alloys 2020, 8, 1–41. [Google Scholar] [CrossRef]
  7. Jing, T.; Shuai, S.; Wang, M.; Zheng, Q. Research progress on 3D dentrite Morpho-Logy and orientation selection during the solidification of Mg alloys: 3D experimental characterization and phase filed modeling. Acta Metall. Sin. 2016, 52, 1279–1296. [Google Scholar] [CrossRef]
  8. Dong, X.; Xing, H.; Weng, K.; Zhao, H. Current development in quantitative phase-field modeling of solidification. J. Iron Steel Res. Int. 2017, 24, 865–878. [Google Scholar] [CrossRef]
  9. Kurz, W.; Giovanola, B.; Trivedi, R. Theory of microstructural development during rapid solidification. Acta Metall. 1986, 34, 823–830. [Google Scholar] [CrossRef]
  10. Trivedi, R.; Magnin, P.; Kurz, W. Theory of eutectic growth under rapid solidification conditions. Acta Metall. 1987, 35, 971–980. [Google Scholar] [CrossRef]
  11. Anderson, M.; Srolovitz, D.; Grest, G.; Sahni, P. Computer simulation of grain growth—I. Kinetics. Acta Metall. 1984, 32, 783–791. [Google Scholar] [CrossRef]
  12. Wolfram, S. Statistical Mechanics of Cellular Automata. Rev. Mod. Phys. 1983, 55, 601–644. [Google Scholar] [CrossRef]
  13. Chen, L. Phase-Field Models for Microstructure Evolution. Annu. Rev. Mater. Res. 2002, 32, 113–140. [Google Scholar] [CrossRef]
  14. Moelans, N.; Blanpain, B.; Wollants, P. An introduction to phase-field modeling of microstructure evolution. Calphad 2008, 32, 268–294. [Google Scholar] [CrossRef]
  15. Boettinger, W.J.; Warren, J.A.; Beckermann, C.; Karma, A. Phase-Field Simulation of Solidification. Annu. Rev. Mater. Res. 2002, 32, 163–194. [Google Scholar] [CrossRef]
  16. Steinbach, I. Phase-Field Model for Microstructure Evolution at the Mesoscopic Scale. Annu. Rev. Mater. Res. 2013, 43, 89–107. [Google Scholar] [CrossRef]
  17. Wang, J.; Wang, B.; Chen, L. Understanding, Predicting, and Designing Ferroelectric Domain Structures and Switching Guided by the Phase-Field Method. Annu. Rev. Mater. Sci. 2019, 49, 127–152. [Google Scholar] [CrossRef]
  18. Hong, Z.; Viswanathan, V. Open-Sourcing Phase-Field Simulations for Accelerating Energy Materials Design and Optimization. ACS Energy Lett. 2020, 5, 3254–3259. [Google Scholar] [CrossRef]
  19. Cahn, J.; Hilliard, J. Free Energy of a Non-Uniform System I. Interfacial Free Energy. J. Chem. Phys. 1958, 28, 258–267. [Google Scholar] [CrossRef]
  20. Cahn, J. On spinodal decompositionSur la decomposition spinodaleÜber die umsetzung an der spinodalen. Acta Metall. 1961, 9, 795–801. [Google Scholar] [CrossRef]
  21. Allen, S.; Cahn, J. Ground state structures in ordered binary alloys with second neighbor interactions. Acta Metall. 1972, 20, 423–433. [Google Scholar] [CrossRef]
  22. Allen, S.; Cahn, J. A correction to the ground state of FCC binary ordered alloys with first and second neighbor pairwise interactions. Scr. Metall. 1973, 7, 1261–1264. [Google Scholar] [CrossRef]
  23. Wheeler, A.; Boettinger, W.; McFadden, G. Phase-field model for isothermal phase transitions in binary alloys. Phys. Rev. A 1992, 45, 7424–7439. [Google Scholar] [CrossRef]
  24. Wheeler, A.; Boettinger, W.; McFadden, G. Phase-field model of solute trapping during solidification. Phys. Rev. E 1993, 47, 1893–1909. [Google Scholar] [CrossRef]
  25. McFadden, G.; Wheeler, A.; Braun, R.; Coriell, S.; Sekerka, R. Phase-field models for anisotropic interfaces. Phys. Rev. E 1993, 48, 2016–2024. [Google Scholar] [CrossRef]
  26. Karma, A.; Rappel, W. Phase-field method for computationally efficient modeling of solidification with arbitrary interface kinetics. Phys. Rev. E 1996, 53, R3017–R3020. [Google Scholar] [CrossRef]
  27. Karma, A.; Rappel, W. Numerical Simulation of Three-Dimensional Dendritic Growth. Phys. Rev. Lett. 1996, 77, 4050–4053. [Google Scholar] [CrossRef]
  28. Karma, A.; Rappel, W. Quantitative phase-field modeling of dendritic growth in two and three dimensions. Phys. Rev. E 1998, 57, 4323–4349. [Google Scholar] [CrossRef]
  29. Karma, A. Phase-Field Formulation for Quantitative Modeling of Alloy Solidification. Phys. Rev. Lett. 2001, 87, 115701. [Google Scholar] [CrossRef]
  30. Kim, S.; Kim, W.; Suzuki, T. Phase-field model for binary alloys. Phys. Rev. E 1999, 60, 7186–7197. [Google Scholar] [CrossRef]
  31. Kim, S.; Kim, W.; Suzuki, T. Interfacial compositions of solid and liquid in a phase-field model with finite interface thickness for isothermal solidification in binary alloys. Phys. Rev. E 1998, 58, 3316–3323. [Google Scholar] [CrossRef]
  32. Kim, S. A phase-field model with antitrapping current for multicomponent alloys with arbitrary thermodynamic properties. Acta Mater. 2007, 55, 4391–4399. [Google Scholar] [CrossRef]
  33. Almgren, R. Second-Order Phase Field Asymptotics for Unequal Conductivities. SIAM J. Appl Math. 1999, 59, 2086–2107. [Google Scholar] [CrossRef]
  34. Steinbach, I.; Pezzolla, F.; Nestler, B.; Seeßelberg, M.; Prieler, R.; Schmitz, G.; Rezende, J. A phase field concept for multiphase systems. Phys. D 1996, 94, 135–147. [Google Scholar] [CrossRef]
  35. Nestler, B.; Wheeler, A.A. A multi-phase-field model of eutectic and peritectic alloys: Numerical simulation of growth structures. Phys. D 2000, 138, 114–133. [Google Scholar] [CrossRef]
  36. Kim, S.; Kim, W.; Suzuki, T.; Ode, M. Phase-field modeling of eutectic solidification. J. Cryst. Growth 2004, 261, 135–158. [Google Scholar] [CrossRef]
  37. Moelans, N. A quantitative and thermodynamically consistent phase-field interpolation function for multi-phase systems. Acta Mater. 2011, 59, 1077–1086. [Google Scholar] [CrossRef]
  38. Folch, R.; Plapp, M. Towards a quantitative phase-field model of two-phase solidification. Phys. Rev. E 2003, 68, 010602. [Google Scholar] [CrossRef]
  39. Echebarria, B.; Folch, R.; Karma, A.; Plapp, M. Quantitative phase-field model of alloy solidification. Phys. Rev. E 2004, 70, 061604. [Google Scholar] [CrossRef]
  40. Folch, R.; Plapp, M. Quantitative phase-field modeling of two-phase growth. Phys. Rev. E 2005, 72, 011602. [Google Scholar] [CrossRef] [Green Version]
  41. Böttger, B.; Eiken, J.; Apel, M. Multi-ternary extrapolation scheme for efficient coupling of thermodynamic data to a multi-phase-field model. Comput. Mater. Sci. 2015, 108, 283–292. [Google Scholar] [CrossRef]
  42. Eiken, J.; Böttger, B.; Steinbach, I. Multiphase-field approach for multicomponent alloys with extrapolation scheme for numerical application. Phys. Rev. E 2006, 73, 066122. [Google Scholar] [CrossRef]
  43. Bottger, B.; Eiken, J.; Steinbach, I. Phase field simulation of equiaxed solidification in technical alloys. Acta Mater. 2006, 54, 2697–2704. [Google Scholar] [CrossRef]
  44. Fries, S.; Boettger, B.; Eiken, J.; Steinbach, I. Upgrading CALPHAD to microstructure simulation: The phase-field method. Int. J. Mater. Res. 2009, 100, 128–134. [Google Scholar] [CrossRef]
  45. Chen, L.; Yang, W. Computer simulation of the domain dynamics of a quenched system with a large number of nonconserved order parameters: The grain-growth kinetics. Phys. Rev. B 1994, 50, 15752–15756. [Google Scholar] [CrossRef]
  46. Fan, D.; Chen, L. Computer simulation of grain growth using a continuum field model. Acta Mater. 1997, 45, 611–622. [Google Scholar] [CrossRef]
  47. Fan, D.; Geng, C.; Chen, L. Computer simulation of topological evolution in 2-D grain growth using a continuum diffuse-interface field model. Acta Mater. 1997, 45, 1115–1126. [Google Scholar] [CrossRef]
  48. Moelans, N.; Blanpain, B.; Wollants, P. Quantitative Phase-Field Approach for Simulating Grain Growth in Anisotropic Systems with Arbitrary Inclination and Misorientation Dependence. Phys. Rev. Lett. 2008, 101, 025502. [Google Scholar] [CrossRef]
  49. Kobayashi, R.; Warren, J.; Carter, W. Vector Valued Phase Field Model for Crystallization and Grain Boundary Formation. Phys. D 1998, 119, 415–423. [Google Scholar] [CrossRef]
  50. Kobayashi, R.; Warren, J.; Carter, W. A continuum model of grain boundaries. Phys. D 2000, 140, 141–150. [Google Scholar] [CrossRef]
  51. Warren, J.; Kobayashi, R.; Lobkovsky, A.; Carter, W. Extending phase field models of solidification to polycrystalline materials. Acta Mater. 2003, 51, 6035–6058. [Google Scholar] [CrossRef]
  52. Gránásy, L.; Börzsönyi, T.; Pusztai, T. Nucleation and Bulk Crystallization in Binary Phase Field Theory. Phys. Rev. Lett. 2002, 88, 206105. [Google Scholar] [CrossRef] [PubMed]
  53. Gránásy, L.; Pusztai, T.; Börzsönyi, T.; Warren, J.; Douglas, J. A general mechanism of polycrystalline growth. Nat. Mater. 2004, 3, 645–650. [Google Scholar] [CrossRef] [PubMed]
  54. Gránásy, L.; Rátkai, L.; Szállás, A.; Korbuly, B.; Tóth, G.; Környei, L.; Pusztai, T. Phase-Field Modeling of Polycrystalline Solidification: From Needle Crystals to Spherulites—A Review. Metall. Trans. A 2014, 45, 1694–1719. [Google Scholar] [CrossRef]
  55. Khachaturyan, A. The Theory of Structural Transformations in Solids; Wiley: New York, NY, USA, 1983. [Google Scholar]
  56. Clayton, J.; Knap, J. A phase field model of deformation twinning: Nonlinear theory and numerical simulations. Phys. D 2011, 240, 841–858. [Google Scholar] [CrossRef]
  57. Kurz, W. Fundamentals of Solidification; Trans Tech Publication: Zurich, Switzerland, 1998; pp. 71–92. [Google Scholar]
  58. Trivedi, R.; Mason, J.; Verhoeven, J.; Kurz, W. Eutectic spacing selection in lead-based alloy systems. Metall. Trans. A 1991, 22, 2523–2533. [Google Scholar] [CrossRef]
  59. Provatas, N.; Elder, K. Phase-Field Methods in Materials Science and Engineering; Wiley-VCH: Weinheim, Germany, 2010; pp. 63–68. [Google Scholar] [CrossRef]
  60. Young, G.; Davis, S.; Brattkus, K. Anisotropic interface kinetics and tilted cells in unidirectional solidification. J. Cryst. Growth 1987, 83, 560–571. [Google Scholar] [CrossRef]
  61. Utter, B.; Bodenschatz, E. Dynamics of low anisotropy morphologies in directional solidification. Phys. Rev. E 2002, 66, 051604. [Google Scholar] [CrossRef]
  62. Deschamps, J.; Georgelin, M.; Pocheau, A. Crystal anisotropy and growth directions in directional solidification. Europhys. Lett. 2006, 76, 291–297. [Google Scholar] [CrossRef]
  63. Böttger, B.; Eiken, J.; Ohno, M.; Klaus, G.; Fehlbier, M.; Schmid-Fetzer, R.; Steinbach, I.; Bührig-Polaczek, A. Controlling Microstructure in Magnesium Alloys: A Combined Thermodynamic, Experimental and Simulation Approach. Adv. Eng. Mater. 2006, 8, 241–247. [Google Scholar] [CrossRef]
  64. Eiken, J. Dendritic growth texture evolution in Mg-based alloys investigated by phase-field simulation. Int. Cast Met. Res. 2009, 22, 86–89. [Google Scholar] [CrossRef]
  65. Sun, D.; Mendelev, M.; Becker, C.; Kudin, K.; Haxhimali, T.; Asta, M.; Hoyt, J.; Karma, A.; Srolovitz, D. Crystal-melt interfacial free energies in hcp metals: A molecular dynamics study of Mg. Phys. Rev. B 2006, 73, 024116. [Google Scholar] [CrossRef]
  66. Xia, Z.; Sun, D.; Asta, M.; Hoyt, J. Molecular dynamics calculations of the crystal-melt interfacial mobility for hexagonal close-packed Mg. Phys. Rev. B 2007, 75, 012103. [Google Scholar] [CrossRef]
  67. Du, J.; Zhang, A.; Guo, Z.; Yang, M.; Li, M.; Xiong, S. Atomistic Determination of Anisotropic Surface Energy-Associated Growth Patterns of Magnesium Alloy Dendrites. ACS Omega 2017, 2, 8803–8809. [Google Scholar] [CrossRef] [PubMed]
  68. Yang, M.; Xiong, S.; Guo, Z. Characterisation of the 3-D dendrite morphology of magnesium alloys using synchrotron X-ray tomography and 3-D phase-field modelling. Acta Mater. 2015, 92, 8–17. [Google Scholar] [CrossRef]
  69. Guo, E.; Phillion, A.; Cai, B.; Shuai, S.; Kazantsev, D.; Jing, T.; Lee, P. Dendritic evolution during coarsening of Mg-Zn alloys via 4D synchrotron tomography. Acta Mater. 2017, 123, 373–382. [Google Scholar] [CrossRef]
  70. Du, J.; Zhang, A.; Guo, Z.; Yang, M.; Li, M.; Xiong, S. Mechanism of the growth pattern formation and three-dimensional morphological transition of hcp magnesium alloy dendrite. Phys. Rev. Mater. 2018, 2, 083402. [Google Scholar] [CrossRef]
  71. Minamoto, S.; Nomoto, S.; Hamaya, A.; Horiuchi, T.; Miura, S. Microstructure Simulation for Solidification of Magnesium–Zinc–Yttrium Alloy by Multi-phase-field Method Coupled with CALPHAD Database. ISIJ Int. 2010, 50, 1914–1919. [Google Scholar] [CrossRef]
  72. Zaeem, M.; Yin, H.; Felicelli, S. Comparison of Cellular Automaton and Phase Field Models to Simulate Dendrite Growth in Hexagonal Crystals. J. Mater. Sci. Technol. 2012, 28, 137–146. [Google Scholar] [CrossRef]
  73. Liu, B. Numerical Simulation of Dendritic Morphology of Magnesium Alloys Using Phase Field Method. Acta Metall. Sin. 2008, 44, 483–488. [Google Scholar]
  74. Tian, B.; Wu, M.; Zhang, A.; Guo, Z.; Xiong, S. Phase-field modeling of dendritic growth of magnesium alloys with a parallel-adaptive mesh refinement algorithm. China Foundry 2021, 18, 541–549. [Google Scholar] [CrossRef]
  75. Yao, J.; Li, X.; Long, W.; Zhang, L.; Wang, F.; Li, W. Numerical simulation of microsegregation of magnesium alloys quantitatively using phase-field method. Trans. Nonferr. Met. Soc. 2014, 24, 36–42. [Google Scholar] [CrossRef]
  76. Duan, P.; Xing, H.; Chen, Z.; Hao, G.; Wang, B.; Jin, K. Phase-field modeling of free dendritic growth of magnesium based alloy. Acta Phys. Sin. 2015, 64, 060201. [Google Scholar] [CrossRef]
  77. Shang, S.; Han, Z.; Sun, W.; Luo, A. A phase field model coupled with pressure-effect-embedded thermodynamic modeling for describing microstructure and microsegregation in pressurized solidification of a ternary magnesium alloy. Comp. Mater. Sci. 2017, 136, 264–270. [Google Scholar] [CrossRef]
  78. Pan, H.; Han, Z.; Liu, B. Study on Dendritic Growth in Pressurized Solidification of Mg-Al Alloy Using Phase Field Simulation. J. Mater. Sci. Technol. 2016, 32, 68–75. [Google Scholar] [CrossRef]
  79. Yuan, X.; Ding, Y.; Guo, Y.; Hu, Y. Numerical simulation of dendritic growth of magnesium alloys using phase-field method under forced flow. Trans. Nonferr. Met. Soc. 2010, 20, 1474–1480. [Google Scholar] [CrossRef]
  80. Yao, J.; Li, x.; Long, W.; Zhang, L. Numerical Simulation of Dendritic Growth of Magnesium Alloys under Forced Flow Using KKS Phase-Field Model. Rare Met. Mater. Eng. 2014, 43, 97–102. [Google Scholar] [CrossRef]
  81. Yao, J.; Li, x.; Long, W.; Zhang, L. Numerical simulation of multiple grains with different preferred growth orientation of magnesium alloys using phase-field method. Trans. Nonferr. Met. Soc. 2014, 24, 302–309. [Google Scholar] [CrossRef]
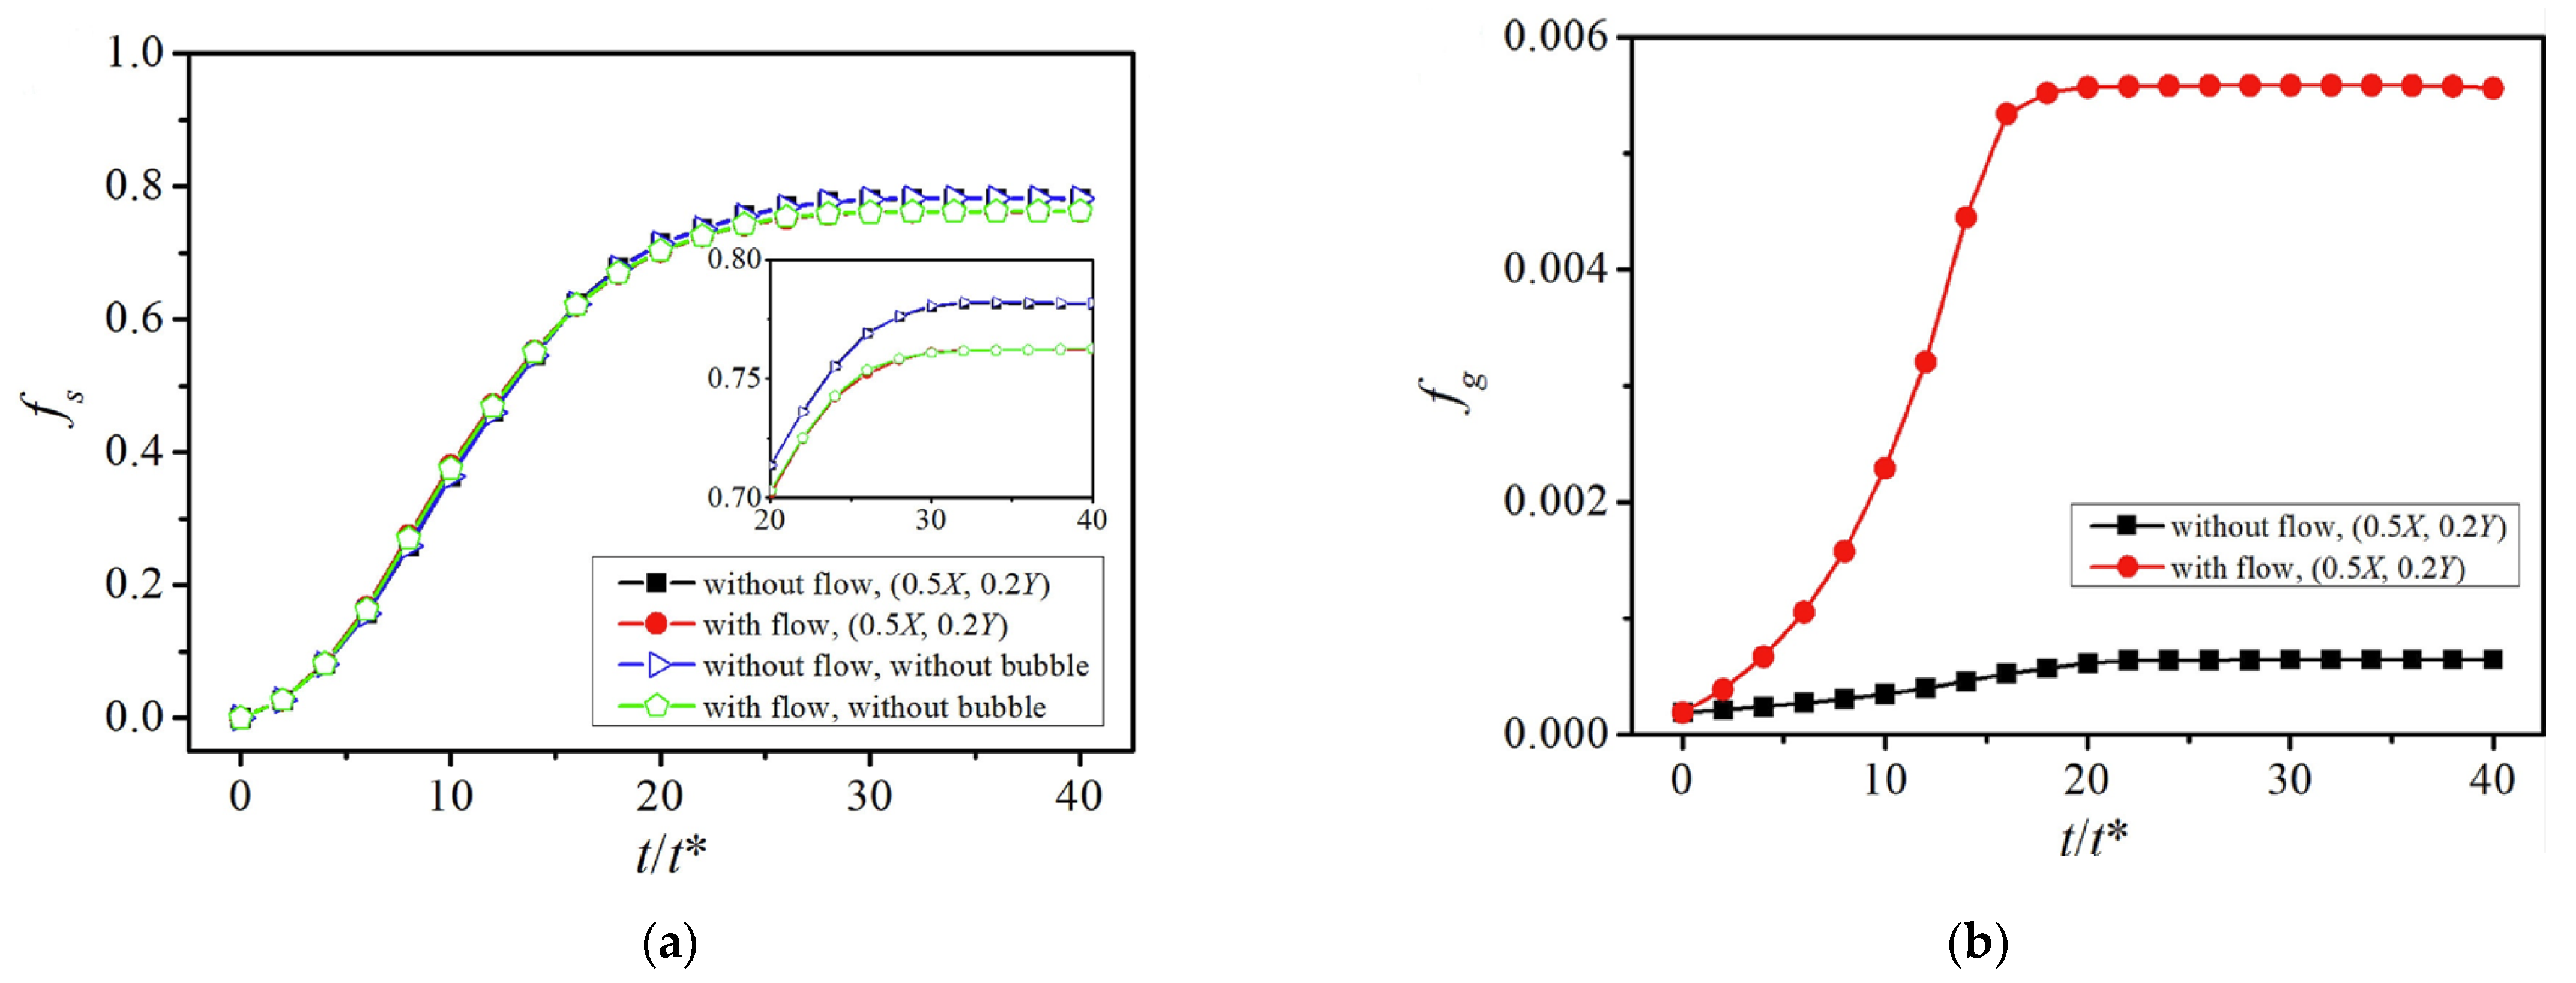
  82. Zhang, A.; Guo, Z.; Jiang, B.; Du, J.; Wang, C.; Huang, G.; Zhang, D.; Liu, F.; Xiong, S.; Pan, F. Multiphase and multiphysics modeling of dendrite growth and gas porosity evolution during solidification. Acta Mater. 2021, 214, 117005. [Google Scholar] [CrossRef]
  83. Wang, M.; Jing, T.; Liu, B. Phase-field simulations of dendrite morphologies and selected evolution of primary α-Mg phases during the solidification of Mg-rich Mg–Al-based alloys. Scr. Mater. 2009, 61, 777–780. [Google Scholar] [CrossRef]
  84. Wang, M.; Williams, J.; Jiang, L.; Carlo, F.; Jing, T.; Chawla, N. Dendritic morphology of α-Mg during the solidification of Mg-based alloys: 3D experimental characterization by X-ray synchrotron tomography and phase-field simulations. Scr. Mater. 2011, 65, 855–858. [Google Scholar] [CrossRef]
  85. Wang, M.; Xu, Y.; Zheng, Q.; Wu, S.; Jing, T.; Chawla, N. Dendritic Growth in Mg-Based Alloys: Phase-Field Simulations and Experimental Verification by X-ray Synchrotron Tomography. Mater. Trans. A 2014, 45, 2562–2574. [Google Scholar] [CrossRef]
  86. Yang, M.; Xiong, S.; Guo, Z. Effect of different solute additions on dendrite morphology and orientation selection in cast binary magnesium alloys. Acta Mater. 2016, 112, 261–272. [Google Scholar] [CrossRef]
  87. Montiel, D.; Liu, L.; Xiao, L.; Zhou, Y.; Provatas, N. Microstructure analysis of AZ31 magnesium alloy welds using phase-field models. Acta Mater. 2012, 60, 5925–5932. [Google Scholar] [CrossRef]
  88. Amoorezaei, M.; Gurevich, S.; Provatas, N. Orientation selection in solidification patterning. Acta Mater. 2012, 60, 657–663. [Google Scholar] [CrossRef]
  89. Gurevich, S.; Amoorezaei, M.; Montiel, D.; Provatas, N. Evolution of microstructural length scales during solidification of magnesium alloys. Acta Mater. 2012, 60, 3287–3295. [Google Scholar] [CrossRef]
  90. Chen, M.; Hu, X.; Ju, D.; Zhao, H. The microstructure prediction of magnesium alloy crystal growth in directional solidification. Comp. Mater. Sci. 2013, 79, 684–690. [Google Scholar] [CrossRef]
  91. Du, J.; Zhang, A.; Guo, Z.; Yang, M.; Li, M.; Liu, F.; Xiong, S. Atomistic underpinnings for growth direction and pattern formation of hcp magnesium alloy dendrite. Acta Mater. 2018, 161, 35–46. [Google Scholar] [CrossRef]
  92. Wang, Y.; Jia, S.; Wei, M.; Peng, L.; Wu, Y.; Ji, Y.; Chen, L.; Liu, X. Coupling in situ synchrotron X-ray radiography and phase-field simulation to study the effect of low cooling rates on dendrite morphology during directional solidification in Mg–Gd alloys. J. Alloy Compd. 2020, 815, 152385. [Google Scholar] [CrossRef]
  93. Wang, Y.; Wei, M.; Liu, X.; Chen, C.; Wu, Y.; Peng, L.; Chen, L. Phase-field study of the effects of the multi-controlling parameters on columnar dendrite during directional solidification in hexagonal materials. Eur. Phys. J. E 2020, 43, 41. [Google Scholar] [CrossRef]
  94. Yuan, T.; Luo, Z.; Kou, S. Grain refining of magnesium welds by arc oscillation. Acta Mater. 2016, 116, 166–176. [Google Scholar] [CrossRef]
  95. Geng, S.; Jiang, P.; Shao, X.; Guo, L.; Mi, G.; Wu, H.; Wang, C.; Han, C.; Gao, S. Identification of nucleation mechanism in laser welds of aluminum alloy. Appl. Phys. A 2019, 125, 396. [Google Scholar] [CrossRef]
  96. Yue, C.; Geng, S.; Guo, L.; Han, C.; Jiang, P. Dendrite remelting during arc oscillation welding of magnesium alloys: A phase-field study. Appl. Phys. A 2022, 128, 437. [Google Scholar] [CrossRef]
  97. Yu, A.; Yang, X.; Guo, H.; Yu, K.; Sun, X.; Li, Z. Numerical Simulation and Experimental Validation of Nondendritic Structure Formation in Magnesium Alloy Under Oscillation and Ultrasonic Vibration. Metall. Mater. Trans. B 2019, 50, 2319–2333. [Google Scholar] [CrossRef]
  98. Zhang, X.; Wang, Y.; Liu, D.; Ji, Z.; Xu, H.; Hu, M.; Cui, P. Effect of stirring rate on grain morphology of Mg-Al alloy semi-solid structure by phase field lattice Boltzmann simulation. J. Cryst. Growth 2020, 543, 125704. [Google Scholar] [CrossRef]
  99. Monas, A.; Shchyglo, O.; Kim, S.; Yim, C.; Höche, D.; Steinbach, I. Divorced Eutectic Solidification of Mg-Al Alloys. Jom 2015, 67, 1805–1811. [Google Scholar] [CrossRef]
  100. Borukhovich, E.; Boeff, M.; Monas, A.; Tegeler, M.; Kim, S.; Oh, C.; Steinbach, I. Full-field simulation of solidification and forming of polycrystals. MATEC Web Conf. 2016, 80, 6. [Google Scholar] [CrossRef]
  101. Kang, J.; Park, J.; Song, K.; Oh, C.; Shchyglo, O.; Steinbach, I. Microstructure analyses and phase-field simulation of partially divorced eutectic solidification in hypoeutectic Mg-Al Alloys. J. Magnes. Alloys 2022, 10, 1672–1679. [Google Scholar] [CrossRef]
  102. Çiçek, B.; Ahlatçı, H.; Sun, Y. Wear behaviours of Pb added Mg–Al–Si composites reinforced with in situ Mg2Si particles. Mater. Des. 2013, 50, 929–935. [Google Scholar] [CrossRef]
  103. Akyüz, B. Comparison of the machinability and wear properties of magnesium alloys. Int. J. Adv. Manuf. Technol. 2014, 75, 1735–1742. [Google Scholar] [CrossRef]
  104. Zong, Y.; Wang, M.; Guo, W. Phase field simulation on recrystallization and secondary phase precipitation under strain field. Acta Phys. Sin. 2009, 58, S161–S168. [Google Scholar] [CrossRef]
  105. Wang, M.; Zong, B.; Wang, G. Grain growth in AZ31 Mg alloy during recrystallization at different temperatures by phase field simulation. Comp. Mater. Sci. 2009, 45, 217–222. [Google Scholar] [CrossRef]
  106. Wang, M.; Zong, Y.; Wang, G. Simulation of grain growth of AZ31Mg alloy during recrystallization by phase field model. Trans. Nonferr. Met. Soc. 2009, 19, 1555–1562. [Google Scholar] [CrossRef]
  107. Gao, Y.; Luo, Z.; Hu, X.; Huang, C. Phase field simulation of static recrystallization for AZ31 Mg alloy. Acta Metall. Sin. 2011, 46, 1161–1172. [Google Scholar] [CrossRef]
  108. Gao, Y.; Luo, Z.; Huang, L.; Hu, X. Phase field model for mircrostructure evolution of subgrain in deformtion alloy. Acta Metall. Sin. 2012, 48, 1215–1222. [Google Scholar] [CrossRef]
  109. Luo, Z.; Gao, Y.; Zhu, T.; Lu, Q.; Lin, K. Phase field model for grain distribution of deformation magnesium alloy. Trans. Nonferr. Met. Soc. 2013, 23, 1496–1506. [Google Scholar] [CrossRef]
  110. Zhang, X.; Zong, Y.; Wu, Y. A model for releasing of stored energy and microstructure evolution during recrystallization by phase-field simulation. Acta Phys. Sin. 2012, 61, 088104. [Google Scholar] [CrossRef]
  111. Kamachali, R.; Kim, S.; Steinbach, I. Texture evolution in deformed AZ31 magnesium sheets: Experiments and phase-field study. Comp. Mater. Sci. 2015, 104, 193–199. [Google Scholar] [CrossRef]
  112. Wu, Y.; Zong, Y.; Zhang, X. Microstructure evolution of nanocrystalline AZ31 magnesium alloy by phase field simulation. Acta Metall. Sin. 2013, 49, 789–796. [Google Scholar] [CrossRef]
  113. Wu, Y.; Zong, Y.; Jin, J.; Zhang, X. Simulation of Magnesium nanoalloy with introduced independent large-size grains. J. Mater. Sci. Eng. 2013, 31, 682–686. [Google Scholar] [CrossRef]
  114. Wu, Y.; Luo, Q.; Qin, E. Influencing factors of abnormal grain growth in Mg alloy by phase field method. Mater. Today Commun. 2020, 22, 100790. [Google Scholar] [CrossRef]
  115. He, R.; Wang, M.; Jin, J.; Zong, Y. Effect of elastic strain energy on grain growth and texture in AZ31 magnesium alloy by phase-field simulation. Chin. Phys. B 2017, 26, 128201. [Google Scholar] [CrossRef]
  116. He, R.; Wang, M.; Jin, J.; Zong, Y. Effect of applied stress on grain growth and texture in AZ31 magnesium alloy by phase-field simulation. Trans. Nonferr. Met. Soc. 2018, 28, 1083–1091. [Google Scholar] [CrossRef]
  117. Song, Y.; Wang, M.; Ni, J.; Jin, J.; Zong, Y. Effect of grain boundary energy anisotropy on grain growth in ZK60 alloy using a 3D phase-field modeling. Chin. Phys. B 2020, 29, 128201. [Google Scholar] [CrossRef]
  118. He, R.; Wang, M.; Zhang, X.; Zong, B. Influence of second-phase particles on grain growth in AZ31 magnesium alloy during equal channel angular pressing by phase field simulation. Model. Simul. Mater. Sci. Eng. 2016, 24, 055017. [Google Scholar] [CrossRef]
  119. Wu, Y.; Zong, Y.; Jin, J. Grain growth in a nanostructured AZ31 Mg alloy containing second phase particles studied by phase field simulations. Sci. China Mater. 2016, 59, 355–362. [Google Scholar] [CrossRef]
  120. Fang, X.; Song, M.; Li, K.; Du, Y.; Zhao, D.; Jiang, C.; Zhang, H. Effects of Cu and Al on the crystal structure and composition of η (MgZn2) phase in over-aged Al–Zn–Mg–Cu alloys. J. Mater. Sci. 2012, 47, 5419–5427. [Google Scholar] [CrossRef]
  121. Gao, Y.; Liu, H.; Shi, R.; Zhou, N.; Xu, Z.; Zhu, Y.M.; Nie, J.; Wang, Y. Simulation study of precipitation in an Mg–Y–Nd alloy. Acta Mater. 2012, 60, 4819–4832. [Google Scholar] [CrossRef]
  122. Liu, H.; Gao, Y.; Liu, J.; Zhu, Y.; Wang, Y.; Nie, J. A simulation study of the shape of β′ precipitates in Mg–Y and Mg–Gd alloys. Acta Mater. 2013, 61, 453–466. [Google Scholar] [CrossRef]
  123. Han, G.; Han, Z.; Luo, A.; Sachdev, A.; Liu, B. A phase field model for simulating the precipitation of multi-variant β-Mg17Al12 in Mg–Al-based alloys. Scr. Mater. 2013, 68, 691–694. [Google Scholar] [CrossRef]
  124. Han, Z.; Han, G.; Luo, A.A.; Liu, B. Large-scale three-dimensional phase-field simulation of multi-variant β-Mg17Al12 in Mg–Al-based alloys. Comp. Mater. Sci. 2015, 101, 248–254. [Google Scholar] [CrossRef]
  125. Ji, Y.; Issa, A.; Heo, T.; Saal, J.; Wolverton, C.; Chen, L. Predicting β′ precipitate morphology and evolution in Mg–RE alloys using a combination of first-principles calculations and phase-field modeling. Acta Mater. 2014, 76, 259–271. [Google Scholar] [CrossRef]
  126. Zhang, X.; Wang, M.; He, R.; Li, W.; Zong, B. A phase field model to simulate competitive precipitation of Mg2Sn along the basal or pyramidal habit planes in Mg-2.2Sn-0.1Zn alloy. Comp. Mater. Sci. 2017, 127, 261–269. [Google Scholar] [CrossRef]
  127. Liu, B.; Keda, T.; Sasajima, Y. Phase-field simulation of the Si precipitation process in Mg2Si under an applied stress. Mater. Sci. Eng. B 2018, 229, 65–69. [Google Scholar] [CrossRef]
  128. DeWitt, S.; Solomon, E.; Natarajan, A.; Araullo-Peters, V.; Rudraraju, S.; Aagesen, L.; Puchala, B.; Marquis, E.; Van der Ven, A.; Thornton, K.; et al. Misfit-driven β′′′ precipitate composition and morphology in Mg-Nd alloys. Acta Mater. 2017, 136, 378–389. [Google Scholar] [CrossRef]
  129. Zhu, Y.; Liu, H.; Xu, Z.; Wang, Y.; Nie, J. Linear-chain configuration of precipitates in Mg–Nd alloys. Acta Mater. 2015, 83, 239–247. [Google Scholar] [CrossRef]
  130. Liu, H.; Zhu, Y.; Wilson, N.; Nie, J. On the structure and role of βF′ in β1 precipitation in Mg–Nd alloys. Acta Mater. 2017, 133, 408–426. [Google Scholar] [CrossRef]
  131. Liu, H.; Xu, W.; Wilson, N.; Peng, L.; Nie, J. Formation of and interaction between β′F and β′ phases in a Mg–Gd alloy. J. Alloys Compd. 2017, 712, 334–344. [Google Scholar] [CrossRef]
  132. Han, G.; Han, Z.; Luo, A.; Liu, B. Three-Dimensional Phase-Field Simulation and Experimental Validation of β-Mg17Al12 Phase Precipitation in Mg-Al-Based Alloys. Metall. Mater. Trans. A 2015, 46, 948–962. [Google Scholar] [CrossRef]
  133. Liu, H.; Gao, Y.; Zhu, Y.; Wang, Y.; Nie, J. A simulation study of β1 precipitation on dislocations in an Mg-rare earth alloy. Acta Mater. 2014, 77, 133–150. [Google Scholar] [CrossRef]
  134. Liu, H.; Gao, Z.; Xu, Z.; Zhu, Y.; Wang, Y.; Nie, J. Guided Self-Assembly of Nano-Precipitates into Mesocrystals. Sci. Rep. UK 2015, 5, 1–8. [Google Scholar] [CrossRef]
  135. Liu, H.; Xu, W.; Peng, L.; Ding, W.; Nie, J. A simulation study of the distribution of β′ precipitates in a crept Mg-Gd-Zr alloy. Comp. Mater. Sci. 2017, 130, 152–164. [Google Scholar] [CrossRef]
  136. Kondo, R.; Tadano, Y.; Shizawa, K. A phase-field model of twinning and detwinning coupled with dislocation-based crystal plasticity for HCP metals. Comp. Mater. Sci. 2014, 95, 672–683. [Google Scholar] [CrossRef]
  137. Pi, Z.; Fang, Q.; Liu, B.; Feng, H.; Liu, Y.; Liu, Y.; Wen, P. A phase field study focuses on the transverse propagation of deformation twinning for hexagonal-closed packed crystals. Int. J. Plast. 2016, 76, 130–146. [Google Scholar] [CrossRef]
  138. Liu, H.; Lin, F.; Zhao, R.; Moelans, N.; Wang, Y.; Nie, J. Formation and autocatalytic nucleation of co-zone {1012} deformation twins in polycrystalline Mg: A phase field simulation study. Acta Mater. 2018, 153, 86–107. [Google Scholar] [CrossRef]
  139. Liu, C.; Shanthraj, P.; Diehl, M.; Roters, F.; Dong, S.; Dong, J.; Ding, W.; Raabe, D. An integrated crystal plasticity–phase field model for spatially resolved twin nucleation, propagation, and growth in hexagonal materials. Int. J. Plast. 2018, 106, 203–227. [Google Scholar] [CrossRef]
  140. Hu, X.; Ji, Y.; Heo, T.; Chen, L.; Cui, X. Phase-field model of deformation twin-grain boundary interactions in hexagonal systems. Acta Mater. 2020, 200, 821–834. [Google Scholar] [CrossRef]
Figure 1. Graphical abstract.
Crystals 12 01305 g001
Figure 2. Effect of undercooling ( θ ) and coupling constant ( λ ) on dendrite morphology of magnesium alloy. (ap): dendrite morphology under different undercooling ( θ ) and coupling constant ( λ ) combinations [74].
Crystals 12 01305 g002
Figure 3. (a) the solute distribution of Al and Sn under ambient pressure P0 and applied pressure P, and (b) the evolution of micro segregation ratio under P0 and P [77].
Crystals 12 01305 g003
Figure 4. Distributions of solute for multiple grains growth: (a) without forced convection, and (b) with forced convection [81].
Crystals 12 01305 g004
Figure 5. Evolution of polycrystalline and hydrogen bubble. (ad) are the simulation results without flow, and (eh) are the simulation results with flow. The time of these snapshots is 27.32, 81.78, 136.25, and 217.95 units of τ 0 from left to right [82].
Crystals 12 01305 g005
Figure 6. Phase fractions versus time under the two configurations corresponding to Figure 5: (a) solid fraction f s versus time, and (b) gas fraction f g versus time. Where t * = 10 5 d t , d t is the time step [82].
Crystals 12 01305 g006
Figure 7. Effects of different Zn contents on dendrite morphology. (aj): 3D and 2D dendrite morphology under different anisotropy parameters ε 2 and ε 3 combinations [86].
Crystals 12 01305 g007
Figure 8. The 3D dendritic morphology evolution at the time step of (a1,b1) 2000, (a2,b2) 24,000, and (a3,b3) 60,000. The 3D growth pattern at the 56,000 time step viewed from <0001>, <10 1 ¯ 0> and <10 1 1> is shown in (a4,b4), (a5,b5) and (a6,b6), while the relevant 2D dendritic pattern projected in the xoy section is shown in (a7,b7). (a8,b8,a9,b9) are the solute concentration fields [91].
Crystals 12 01305 g008
Figure 9. The dendritic morphology of Mg-6 wt.% Gd alloy of under three different cooling rates R = 0.033 K/s, R = 0.1 K/s and R = 0.25 K/s in directional solidification from the top to bottom, respectively: experimental results (a1a3), and simulated results (b1b3) [92].
Crystals 12 01305 g009
Figure 10. Effects of ΔtR on the solidification morphologies during reheating, black arrows are markings for pinching-off and remelting [96].
Crystals 12 01305 g010
Figure 11. (a) the solute distribution of grain with different stirring rates. The effect of stirring rate on, (b) grain rotation rate, (c) grain size, and (d) grain growth rate, respectively [98].
Crystals 12 01305 g011
Figure 12. The eutectic α and β phase nucleated and grew in the interdendritic melt. α p : primary α phase, α e : eutectic α phase. β : eutectic β phase: (ac): β phase nucleates randomly in the liquid but preferentially grows along the perimeter of the α -liquid interface and cover it entirely, (df): eutectic α phase nucleation and growth until complete solidification [101].
Crystals 12 01305 g012
Figure 13. Texture evolutions by recrystallization for different limited mobility of twin boundaries. From top: the twin mobility is reduced by a factor 0.5, 0.1, and 0.001 [111].
Crystals 12 01305 g013
Figure 14. Microstructure evolution with time under different conditions: (a) texture free, (b) random texture, (c) low texture, (d) medium texture, and (e) high texture [117].
Crystals 12 01305 g014
Figure 15. Effect of different Al2O3 particles content on grain size: (a) experimental observation; (b) phase-field simulation [118].
Crystals 12 01305 g015
Figure 16. Simulated microstructures of AZ31 Mg alloy particles with different shape at 623K: (a) spherical particles, (b) ellipsoid particles; and (c) rod-shaped particles [118].
Crystals 12 01305 g016
Figure 17. Simulated changes in the average grain size of AZ31 alloy versus processing time for different fraction, size, distribution, and shape of second-phase particles at 623 K [118].
Crystals 12 01305 g017
Figure 18. Simulation and TEM observation of multi-variant precipitation: (a) considering the interface anisotropy and the elastic strain energy, (b) TEM bright-field image of the precipitates for AZ91 aged at 441K for 16 h, (c) without considering the interface anisotropy and the elastic strain energy, (d) considering only the interface anisotropy, and (e) considering only the elastic strain energy [123].
Crystals 12 01305 g018
Figure 19. Stress fields around a 4.0 nm thick β′ precipitate without (a,c,e) and with (b,d,f) attached β F   particle on (0001) α [130].
Crystals 12 01305 g019
Figure 20. Morphology of honeycomb dislocation, the red circle part represents the triadic structure [134].
Crystals 12 01305 g020
Figure 21. (a) the blue line represents the grain boundary thickness and the green line represents the relative movement of the grain boundary, (b) the preferred nucleation location in the neighboring grain (left), and distribution of the elastic interaction energy before the nucleation (right), (c) variant selection map for each twin variant, under different grain rotation angles: (left) Variant 1, (right) Variant 2 [140].
Crystals 12 01305 g021
Publisher’s Note: MDPI stays neutral with regard to jurisdictional claims in published maps and institutional affiliations.

