Article

Rate-Controlling Microplastic Processes during Plastic Flow in FCC Metals: Origin of the Variation of Strain Rate Sensitivity in Aluminum from 78 to 300 K

1
Department of Mechanical and Materials Engineering, Queen’s University, Nicol Hall, 60 Union Street, Kingston, ON K7L 3N6, Canada
2
Department of Materials Science and Engineering, McMaster University, 1280 Main Street West, Hamilton, ON L8S 4M1, Canada
*
Author to whom correspondence should be addressed.
Crystals 2022, 12(12), 1811; https://doi.org/10.3390/cryst12121811
Submission received: 8 November 2022 / Revised: 1 December 2022 / Accepted: 8 December 2022 / Published: 12 December 2022

Abstract

:
The thermodynamic response of dislocation intersections with forest dislocations and other deformation products is recorded using the Eyring rate relation wherein the application of shear stress increases the probability of activation at a given strain rate and temperature. The inverse activation volume, 1/ν, can be directly determined by instantaneous strain-rate change and its dependence on flow stress, τ, defines the strain-rate sensitivity, S, through the Haasen plot slope. A linear slope over a large strain interval is observed even for a heterogeneous distribution of obstacles that could be of more than one type of obstacles encountered by the gliding dislocation. It was deduced that ν and τ at each activation site are coordinated by the internal stress resulting in constant activation work (k/S). The stress changes from down-rate changes become larger than that from up-rate changes due to the formation of weaker obstacles, resulting in a composite S, whereas only forest dislocations are detected by the up-change. The additivity of 1/ν was used to separate obstacle species in specially prepared AA1100 and super-pure aluminum from 78 to 300 K. The deduction that repulsive intersection is the rate-controlling process and creates vacancies at each intersection site depending on temperature was validated by observing the pinning and depinning of dislocations via pipe diffusion above 125 K. A new method to separate S for dislocation-dislocation intersections from the intersections with other obstacles and their temperature dependence is presented and validated.

1. Introduction

1.1. Background to Microplastic Processes for Metal Formability

The plasticity of crystals is due to the glide of dislocations on slip planes which encompass coplanar dislocations to comply with the imposed strain tensor and others that intersect such dislocations causing work-hardening as the densities increase with straining. The intersection of dislocations of different slip systems in face centred cubic (fcc) metals can be categorized to show which pairs produce sessile jogs, which can produce vacancies and those which can conservatively glide [1]. The issue is that in the strain tensor analyses of polycrystalline metals by Taylor [2,3], each crystallite is assumed to undergo the same strain as the bulk that gives rise to ambiguity in selecting which specific set of 5 independent slip systems are operative to conform to the imposed strain tensor. Asaro and Needleman [4] proposed a way to resolve this issue by introducing strain rate sensitivity S into determining the operative slip systems required to satisfy the strain condition. This approach has been widely used and is known as crystal plasticity finite element method (CPFEM) and illustrations using several conventional constitutive relations were examined by Inal and coworkers [5]. One new functional constitutive relation by Saimoto and Van Houtte (S-VH) [6] was found to be applicable beyond onset of diffuse necking. Its derivation assumed that the expended work due to the creation of dislocation to form slip patches can be equated to that of stored dislocation density by using an annihilation factor A, that is Wexp = A Wstor. The result was that any stress–strain (σ − ε) diagram can be replicated by two power law loci of β1 and β2 using shear stress, τ, and shear strain, γ, wherein τ = (σ − σ0final)/M with M being the Taylor factor. The friction stress, σ0final, at high strain is determined by back-extrapolation during the optimum fitting process [6] to separate the yield phenomenon from the work-hardening mechanism at strain beyond yield point elongation (YPE). The intersection of the two loci is designated as τ3 and γ3 and was correlated to the initiation of cross-slip. Moreover, the proportionality constants to these relations were functions of strain rate such that the functional form can be re-expressed as
τ = K S - VH γ ˙ m γ 1 / ( 2 + β )
wherein KS-VH has units of MPa. Hence, Equation (1) is in a form of advanced Hollomon relation, and it is widely used for modelling plastic flow. In Appendix A, it is demonstrated that the microplastic basis of Equation (1) is the activation work. Note that the conventional engineering method to determine m is to plot the log stress at a given strain versus log strain rate and typically, m varies with the chosen strain. In the current formulation, it was shown that m is constant with strain over each β strain range. CPFEM is basically a geometric analysis identifying the active slip systems for the imposed strain tensor and strain rate to model shape change. The evolving microstructure is inherent in the constitutive relation which is used [5]. The ambient temperature strain rate sensitivity, m, of aluminum (Al) and its alloys is relatively low (compared to other fcc metals) but non-zero, and is temperature and strain rate dependent, so any change in m can dramatically affect formability limits. Hence, to optimize formability of metal sheet, the microplastic bases of strain rate sensitivity, that is the contributions from the evolving microstructure need to be delineated, which is the objective of this study.

1.2. Theoretical Basis of Thermodynamic Strain Rate Sensitivity

The theoretical basis for the current work is based on the seminal work of thermodynamic response during plastic flow entitled, Thermally activated glide of face-centred cubic metals and its application to the theory of strain hardening. In this study, Basinski [7] defined strain rate sensitivity, S, in thermodynamic terms as S = 1 T ln τ ln γ ˙ | T = m/T whereby the inverse activation volume is given as 1 ν = 1 kT τ ln γ ˙ | T in which kT is the thermal energy with k being the Boltzmann constant. His data analyses led to the concept of force-distance profile incurred in intersecting and shearing the obstacle by gliding dislocations. Other contemporary work led to the plot of k/ν versus τ and is designated the Haasen plot [8]. Aside from the assumption of the Eyring rate equation, the measured S is model-free and directly relates to the thermodynamic response during dislocation-obstacle intersection. Thus, the constancy of S as determined from the linear slope of the Haasen plot show that the activation work, τν = kT/m, is thermodynamically analogous to the gas law PV = nRT. In the past, this parallelism may have been realized but the scatter of the data points was too large to be convincing. The advent of precision strain rate sensitivity (PSRS) [8] by nullifying the transients caused by the elastic response of the drive-train components, that is the effective elastic modulus becomes infinite, showed that 1/ν can be accurately measured in both the up- change in strain rate and down- change in strain rate conditions. The result section clearly shows that the Haasen slope is linear over the β1 range and the β2 one with Sβ2 > Sβ1. However, an issue remains since S for each specific obstacle must be identified. In the Haasen plot, 1/ν for up-change can be attributed to forest intersection, but to determine the slope, the abscissa τ may encompass contribution from secondary obstacles τk as well as τfor. If the intersections of these obstacles are athermal, it would not contribute to ν. Furthermore, if these stresses are proportional to τ, S is constant but the sum τ > τfor. Hence, the true Sfor > Sup and a procedure to differentiate the two is proposed in Section 2.4.
The situation is more complicated because in the presence of only one type of obstacle such as forest dislocations, the up- and down-change should be the same. However, Figure 1 shows an asymmetry occurs at high strains indicating the presence of more than one, thermally activatable, obstacle-type. This observation is related to the fact that for weak obstacle strength, α, such as Al solute atoms in a nickel (Ni) matrix [9] the activation distance is shorter compared to the core of a dislocation. As demonstrated in Appendix B, to change the activation energy ∆G by the same magnitude for each obstacle type, the stress change for the weak obstacles needs to be larger than that of strong ones. Hence, on the up-change, the required increase in stress to achieve thermal activation of the strong obstacles is reached prior to the weak ones, resulting in activation of only the strong obstacles. On the other hand, on down-change the initiation for activation of strong species at the reduced strain rate is reached prior to the equilibrium one for the weak ones which means the weak ones are operating at a faster rate than required at the reduced rate leading to dynamic thermal recovery. To eliminate this transient effect, the applied stress needs to be lowered. That is for the down-change, the 1/ν for both species are additive whereas for the up-change only the strong is registered. This conclusion implies that small undulations in the linear Haasen plot indicate creation of defects which are mobile depending on the test temperature.
As previously reported for Al [10], the normalized activation work (τ ν/k) was constant up to TC = 69 K and then started to increase according to 1/S = {442.2/(T − 45)} × 10−5 K−1}−1 [11]. For Al, the activation energy for constriction (EC) was derived to be 0.58 eV [10] at TC and below it and in Figure 7 from that study [10] suggested that the increase in τν with temperature could be correlated with energy required for the formation of vacancies. It was deduced that as the thermal energy increased, vacancies formed in the lattice of the dislocation core to offset the compressive energy and only repulsive intersections can give rise to this observation indicating that it is the rate controlling process. It must be kept in mind that in the Haasen plot, the measured 1/ν during the up-change is due to only the repulsive intersection but the stress axis may encompass contributions from other athermal defect species. The issue that arises is that if the flow stress is due to only the repulsive intersections, the dislocation density calculations from τ = αμbρ1/2 neglects the attractive intersection dislocations which is expected to occur in equal amounts. This dilemma was resolved [12] by realizing that forward glide dislocations confronting repulsive forest dislocations also interact with attractive ones that act as weak obstacles, but for dislocations gliding in the opposite direction, the attractive become repulsive in nature. Hence, the flow stress represents both the repulsive and attractive forest densities; that is τrep = α μ b ρrep1/2 simultaneously apply to both positive and negative Burgers vectors. Thus the total density is equal to 2 ρrep. The new assimilated model of work hardening has shown that 1/A corresponds to (ρrep + ρatt) and the ratio of total density ρtotal to ρrep was found to be 2.0 as predicted by the model [12].
In this study, the microplastic origin of S is identified by examining the temperature dependence of activation work, τ ν = k/S for different purities of Al. Before the temperature dependence of defect species can be examined, a method to separate the S for each species from the forest is required. The paper is organized as follows. Firstly, a detailed modus operandi describes the main contributing factors to S and how to separate them from the composite S. Section 3 describes the preparation and testing of the Al specimens. Section 4 presents the results, followed by detail discussion in Section 5 and conclusions.

2. Modus Operandi

2.1. Thermodynamic Bases for the Temperature (T) Dependence of Activation Work (τν = k/S)

The rigorous derivation of the free energy of activation under constant pressure as discussed by Li [13] was given as ΔG =ΔH − TΔS*. The accompanying activation enthalpy was Δ H = bA * ( τ / T ) | γ ˙ whereby A* is the activation area, ℓd, and activation entropy Δ S * = ( Δ G / T ) | τ . Note that S* denotes entropy not to be confused with S, the thermodynamic strain rate sensitivity. Additionally, note that ΔG = (ΔG0 − τ ν) and ΔH = (ΔH0 − τ ν). Using Maxwell’s relations regarding partial differentiation, Li derived that (∂A*/∂T)|τ = (1/b) (∂ΔS*/∂τ)|T. From these relations, it follows that (1/b) (∂ΔS*/∂τ)|T = ℓ(∂d/∂T)|τ. Re-expressing (∂d/∂T)|τ as (k/αµb2) (∂(1/S)/ ∂T)|τ = −{(k/αµb2)/S2}(∂S/∂T)|τ. It is evident that S = m/T decreases with increase in T and d increase with T; that is A* and activation work (τ ν) increase with temperature. Although (∂S/∂T)|τ must be negative, its magnitude would depend on the obstacle type.
Returning to the kinetic relation, (ΔG0 − τν)/(kT) = {(ΔH0 − τν) − TΔS*}/(kT) or N, a constant of about 20. Rewriting, (ΔG0 + TΔS* − τν) = {ΔH0 − τν} = NkT + TΔS* indicating that ΔG0 = N k T + τν. Since τν is constant at constant T and strain rate, ΔG0 varies with temperature. However, as T decrease, at TC, S becomes constant with T and τν becomes equal to the energy for constriction, EC, because (∂d/∂T)|τ = 0 and becomes the constant enthalpic part to which the entropic part contributes as a function of T. Hence, a possible solution is τν = {EC + (T − TC) ΔS*}. Additionally, ΔG0 = {N k (T-TC) + τν} in accord with experimental data of Figure 7 in ref. [10]. If such is the case, {EC + (T − TC) ΔS*}/T = k/(ST) = k/m which is constant at constant T and strain rate, and independent of strain. The prediction is that at the onset of dynamic recovery due to vacancy mobility, the coordinated entropy contribution will change resulting in a change in m. It is noted that m in Stage III (β2 range) is larger than in Stage II (β1 range). Nevertheless, future studies are required to elucidate this deduction. A second approach is to examine Δ H = bA * ( τ / T ) | γ ˙ which means that it increases with increase in T because A* increases with T in agreement with negative ( τ / T ) | γ ˙ . The implication is that ΔH0 increase is compensated by the increase in entropy and hence will affect force-distance diagrams at T > TC which requires experimental validation. In Li’s study of thermal activation [13], the role of internal stress could not be unambiguously addressed and will be deduced to be a self-cancelling factor in fcc metals in the next section.

2.2. The Role of Internal Stress in Stress-Aided Thermal Activation

The stress-aided thermal activation to overcome obstacles by intersecting dislocations is based on the local shear stress, τj, and the local segment length, ℓj, contributing to the activation volume, νj, given as ℓj d b, wherein d is the activation distance that do not change with strain if the obstacles that is being created remains the same, and b is the magnitude of the Burgers vector of the slip-generating dislocation. The issue is that τj encompass the local internal stress, τμ j, which is indeterminable. However, if it is assumed that it is proportional to the shear flow stress, τ, then it becomes τj = (1 + κj) τ and that ℓj = ℓ/(1 + κj) whereby κj is the local concentration factor. The length parameter ℓ is the mean obstacle spacing defined as (αμb)/τ, whereby α is the strength of obstacle resisting intersection, and μ is the shear modulus, usually taken to be that for a mixed dislocation. Thus, the magnitude of the mean activation work τν = α (μb3) (d/b) remains the same as that at every activation site, τjνj, indicating that the evolving internal stress acts as a homogenizing factor. For tests at constant strain rate, γ ˙ , and temperature, τν is observed to be constant with strain. This criterion is equivalent to the Cottrell-Stokes relation [14] for the constancy of the flow stress ratio with strain upon temperature-change cycles. This relation for intersection of dispersed obstacles of the same type was derived from basic thermal activation theory by Nabarro [15] and shown to be independent of obstacle density, that is strain. Furthermore, from the mean values of τ = αμb/ℓ, the microstructure parameters can be correlated to experiment using k/(μb3S) = α (d/b). The main deduction being that since d is constant with strain for single obstacle case, α is constant with strain. This work-hardening state is disrupted upon creation of debris due to cross-slip.

2.3. Forensic Summaries of Temperature and Strain-Rate Change Experiments

The thermodynamic bases for determining the Gibbs free energy of activation requires the simultaneous values of the differential temperature and strain-rate dependence of stress. Hence, early studies proposed that a mechanical equation of state may exist analogous to the chemical one. The law predicts that flow stress at a given strain at T1 upon abrupt change to T2 would become the same stress as that from continuously tested at T2. Dorn et al. [16] showed that this rule did not hold for deformation of fcc metals. Subsequently cyclic temperature change tests of Al crystals by Cottrell and Stokes [14] discovered that the ratio of the flow stress before and after temperature change were relatively constant as a function of strain. Adams and Cottrell [17] performed similar tests for copper (Cu) crystals at lower temperature range and found a step-change occurred in the trend of temperature dependence ratio that occurred near 155 K. Seeger [18] hypothesized that this observation was due to the initiation of thermally activated vacancy creation upon dragging of jogs. Makin [19] performed similar tests with Cu crystals to confirm the prior observation but found a detectably smaller step. On the other hand, Basinski [7] did not find such a step in Cu crystals for his tests. However, scrutiny of the crystal orientations show that the Adams-Cottrell crystals were near [100] and that of Makin near the {100} plane such that the second most stressed slip system was the critical one and the primary-critical intersections gives rise to vacancy creating jogs. The crystal orientations of Basinski were primarily that of primary-conjugate which gives rise to Lomer-Cottrell locks. Saimoto [1,20] tested [100], [111] and polycrystalline Cu and found that the temperature dependence of [100] was lower than that of [111] below 162 K but at 273 K all three specimens resulted in a common locus. It is noted that the active slip systems in [111] deformation do not include the primary-critical systems, mostly primary-conjugate pairs [1].
The rule for partial differentiation is that aside from the one parameter to be considered, all others remain constant; a procedure which cannot be fulfilled during temperature change because instant change is not physically possible. On the other hand, strain-rate change was presumed to encompass fewer transient effects. Figure 1 shows that the mechanical equation of state does not hold for strain-rate change as in the case of temperature change. All the deficiencies due to strain transients during rate-change tests were resolved by PSRS tests [8] by nullifying the elastic relaxation in the drive train. Using this improved method, Saimoto and Sang (S&S) [11] tested [100] crystals of Al below 200 K since localized slip clusters starts to occur above this temperature during Stage III due to vacancy generation [20]. The S&S data points coincided with the Basinski ones and an empirical relation, S = {442.2/(T − 45)} × 10−5 K−1} [11], was established. Fortuitously, due to uncertainly of recovery during down-changes, Basinski used up-changes, that is determination of Sfor, and his data has stood the test of time. Furthermore, S&S showed that the flow stress τ was proportional to 1/ν, that is the activation work was constant with strain. Subsequently Nabarro [15] theoretically derived that τν is independent of dislocation density, that is with strain. The occurrence of defects other than dislocations was found as shown in Figure 2. PSRS tests of Cu crystals deformed into Stage III range showed transients upon down-rate change whereas upon recovery by annealing out the dipoles, the transient did not occur until continued strain created new dipoles [21]. The cause of transient upon down-change is explained in Appendix B.

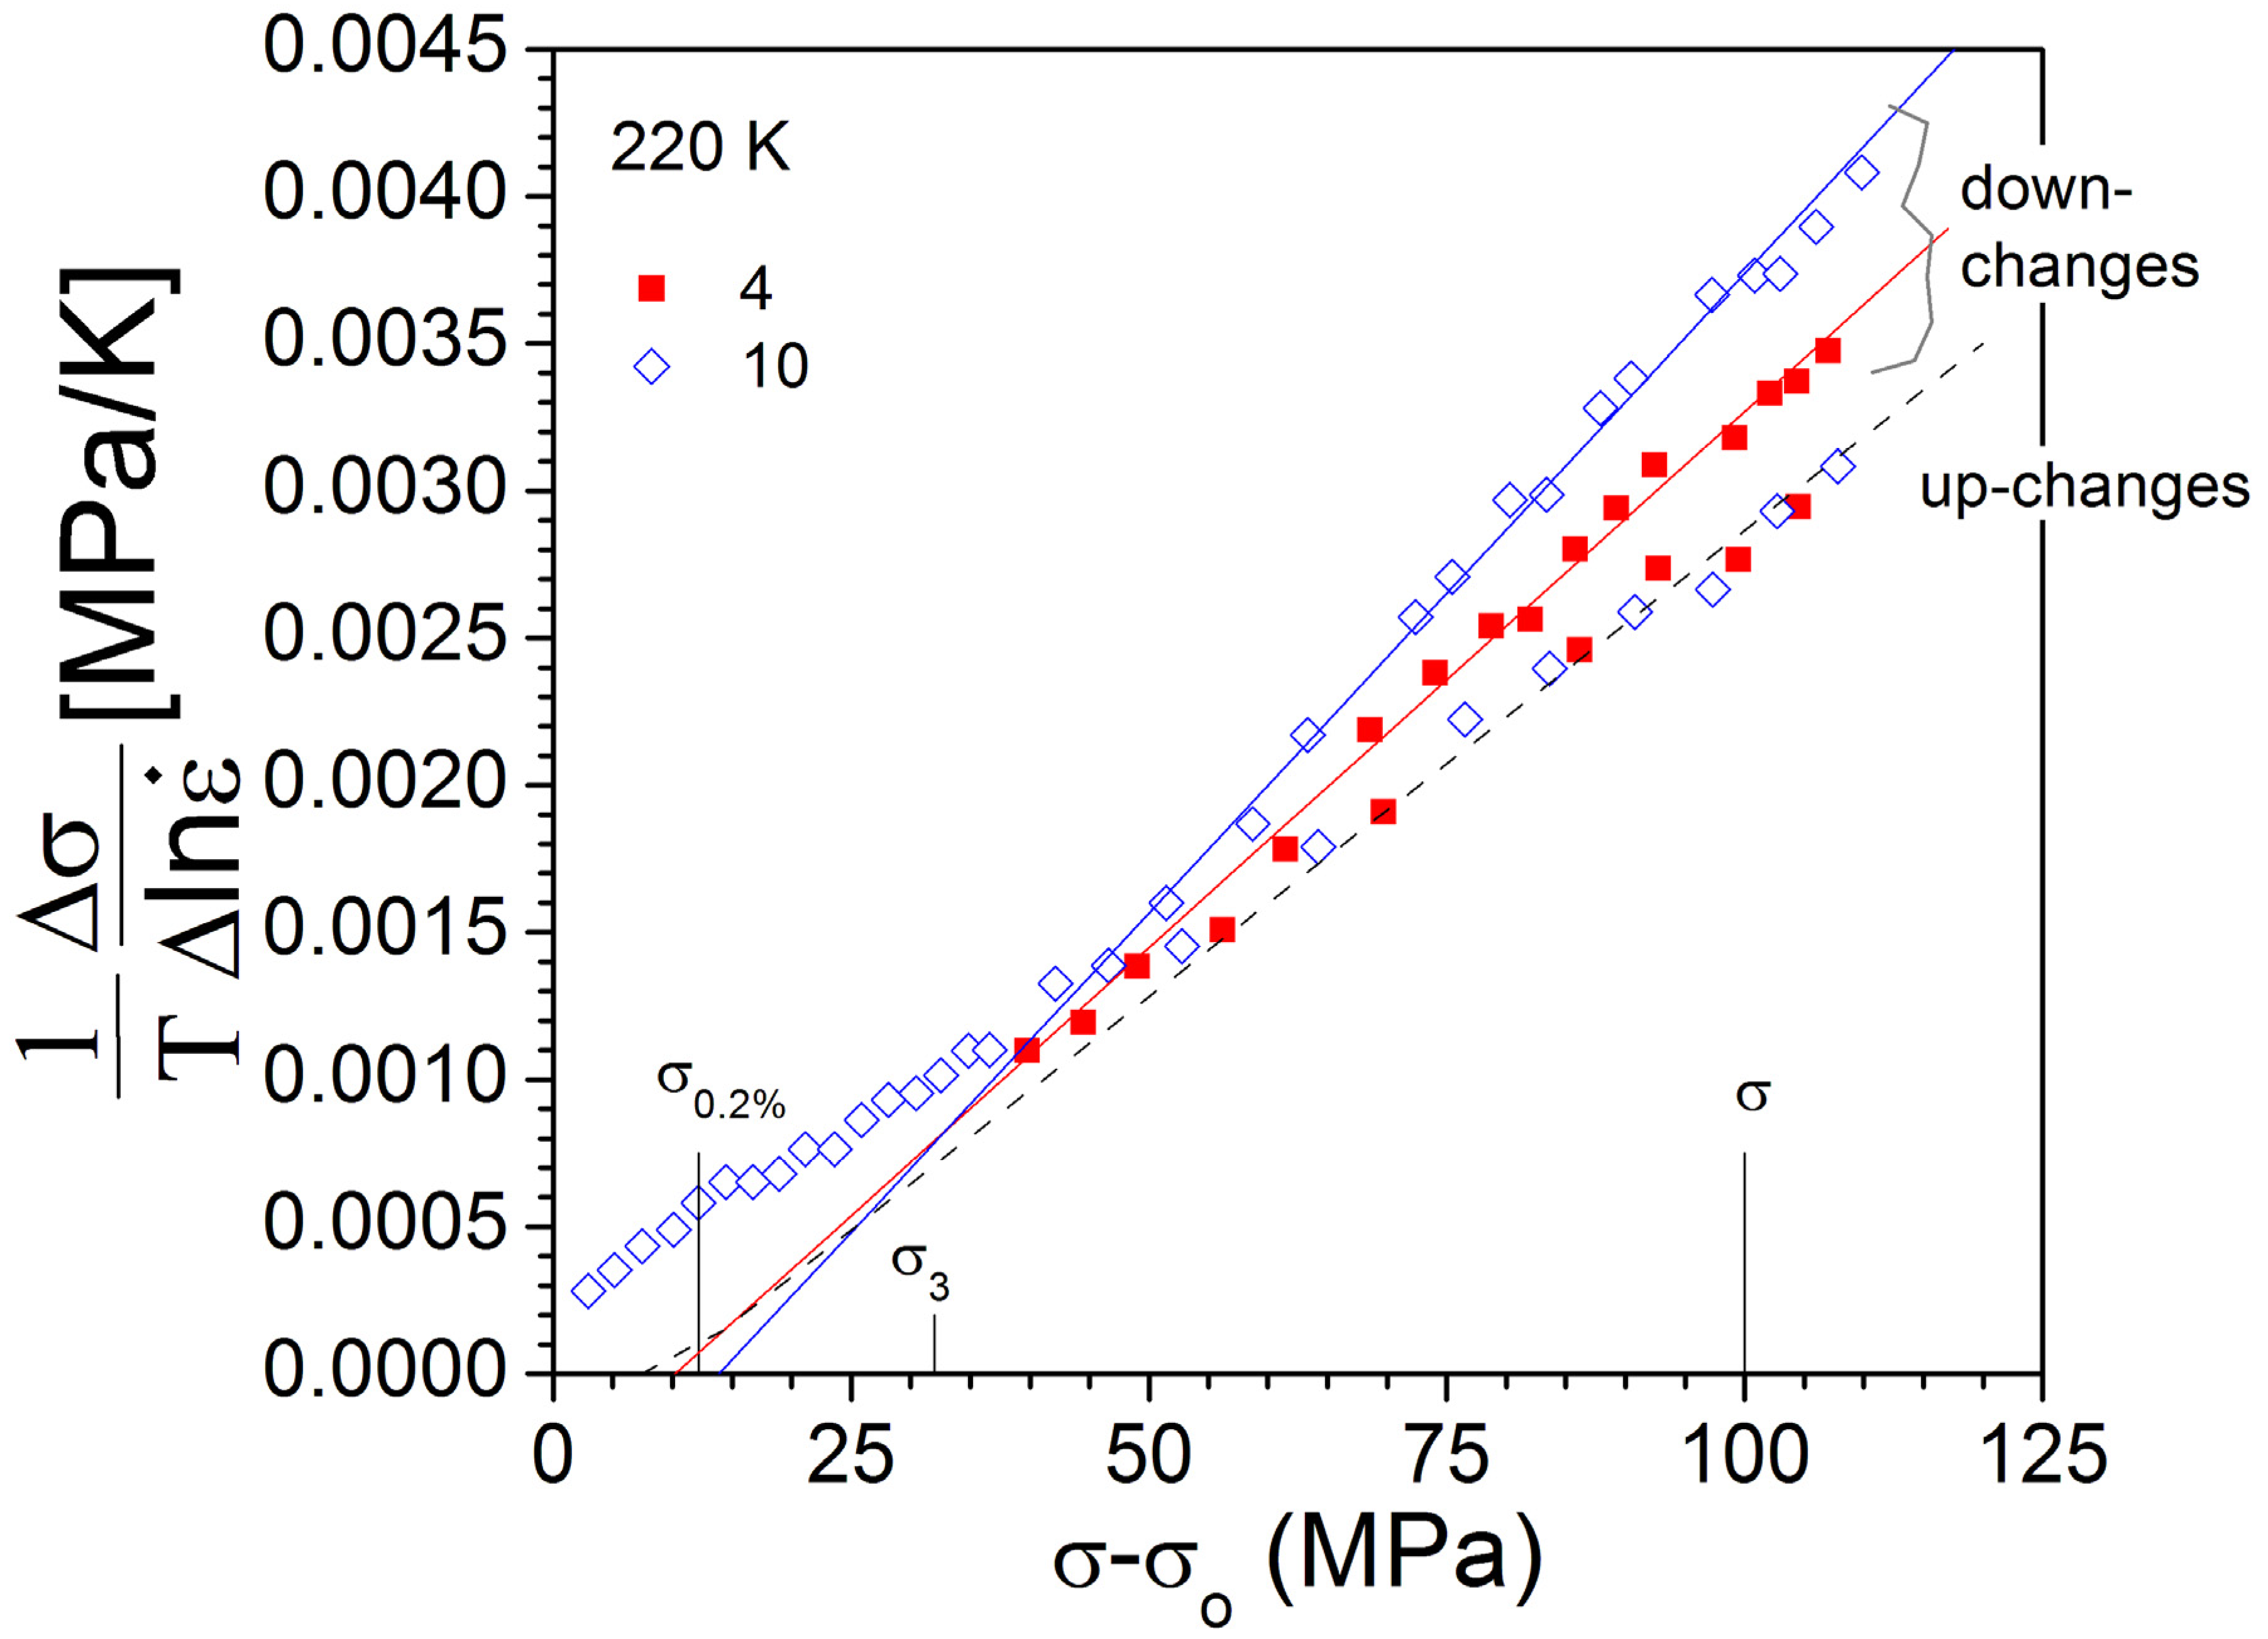
2.4. Schematic Analyses of the Haasen Plot Using Additivity of 1/ν

As previously discussed [22], the percolation in the pre-strain regime is highly dependent on the start microstructure and taken to start at the proportional limit, σ0, defined to occur at 0.02% ε. Nevertheless, for pure metals at 0.2% ε proof stress, it was assumed that the mean slip distance equals the inter-obstacle distance (λ = ℓ), and therefore becomes the origin for dislocation density increase and start of Sfor as indicated at the intersection of the dashed line with the vertical line at 0.2% ε (see schematic Haasen plot of Figure 3). The σ(ε) notation rather than τ(γ) is used such that the reference to the measured data is obvious keeping in mind that 1 T ln τ ln γ ˙ | T = 1 T ln σ ln ε ˙ | T . The solid line of lower slope Sup represents the data from the up-change and that of higher slope Sdown represents the composite S determined from the down-change. For obstacles of constant density, such as solute atoms and nano-precipitates, 1/νparticle remains constant after percolation process is completed. The creation of new obstacles of the same type result in νdebris that continuously decrease to give rise to its characterizing slope S. If two obstacles of different strengths are simultaneously created, both species contribute to ν and τ. The Foreman-Makin model [23,24] showed that if one obstacle is strong (forest) to give rise to τfor and the other weak (debris), τdebris, then τ = τfor + τdebris and upon differentiation as 1 kT τ ln γ ˙ | T , 1/ν becomes 1/νfor + 1/νdebris, which is the basis for the applied additive rule. At a chosen test point, (σ − σ0) is assumed to be comprised of the contribution from σfor and the deformation debris Δσ. The horizontal lines show intersections on the ordinate axis such that {(k/ν)down − (k/ν)up}/Δσ = Sdebris.
To determine σfor and Δσ, the construction needs Sfor to be derived. The underlying premise of the model is that the rate-controlling process is that of repulsive intersection. Hence, the controlling forest dislocation are those resulting in repulsive intersection such that Srep ≡ Sfor. As previously deduced for Al [10], Srep can be assigned as that at 69 K, that is k/Sfor = 0.58 eV, the constriction energy, EC. Hence, it was conjectured that the increase in 1/S above TC is due to number of vacancies created, NV, at each activation site and can be estimated by {k/Sup − 0.58} eV divided by the formation energy of a vacancy, Evf = 0.65 eV. The predicted k/Sfor at a given temperature T becomes {(NV × 0.65) + energy to intersect repulsive dislocation}, taken to be 0.58 eV = EC, independent of temperature. Using NV = 0 and 5 for 78 and 195 K, respectively, for super-pure Al, results in Sfor = 14.86 × 10⁻⁵ K−1 compared to Sup = 12.9 × 10⁻⁵ K−1 at 78 K, and 2.25 × 10⁻⁵ K−1 to 2.03 × 10⁻⁵ K−1 at 195 K. The model requires that Sfor > Sup. This method to separate the contributing defects that comprise the composite S was applied to the case for nano-sized alumina dispersed in high conductivity Cu and the controlling mechanisms and debris generated were identified in a self-consistent manner [22]. One issue that arises is that ∂S/∂T|τ must be negative, whereas to calculate the modelled Sfor, EC was kept constant. Fortuitously, ∂EC/∂T is negative, because it would be proportional to ∂μ/∂T that is negative, and hence the thermodynamic condition is effectively satisfied. The following data analyses indicates that the deduced change in activation work for forest only (without inclusion of the vacancies) ranges from 0.58 eV at 78 K to 0.75 eV with an estimated minimum of 0.6 eV at 295 K, that is ∂(τν)/∂T is positive for the dislocation core intersection as required from thermodynamic principles.
Note that σ3 corresponding to τ3 indicates the point wherein the down-change line intersects the up-change one. Scrutiny along the k/ν3 line shows the possible existence of a smaller Δσ. The implication is that this component is due to contribution from the athermal obstacles such as attractive intersection compared to repulsive one if αatt < αrep. In the following for super-pure Al at 78 K, the Δσ is detectable but appears to be less that 1/10 of the controlling intersection. This observation reinforces the deduction that the rate controlling process is that of repulsive intersection and is the basis of the following analyses.

3. Experimental Methods

To fully understand the contributions of various defect spices to S requires a well-controlled metal matrix purity. Both AA1100 and super-pure Al were used in this study and prepared as follows.
In refined, high-purity Cu, the resistivity ratio between room temperature and 4.2 K is about 3000. Dissolution of small amounts of oxygen at near melting temperature in a partially evacuated silica tubing followed by slow cooling increased this ratio to 28,000 [25]. It was presumed that Fe impurities were precipitated out such that at 4.2 K the resistivity of dislocation was directly measurable because the residual resistance was much reduced. A similar procedure was developed for Al wherein Fe solutes were removed by precipitation of Al6Fe, the kinetics of which were previously reported [26]. The specimens of sealed grain boundaries (sealed-GB), for which grain boundaries are prevented from acting as vacancy sinks, and free-GB, for which grain boundaries can act as sinks, were prepared from experimental strip-cast AA1100 alloy of 13.68 mm thickness received from Novelis Inc (Kingston, Ontario, K7L 4Z5 Canada). After homogenization at 873 K (600 °C) for 18 h, it was cold rolled by 20% reduction prior to intermediate annealing at 548 K (275 °C) for 24 h, followed by rolling to 7.52 mm and recrystallized at 573 K (300 °C). Upon subsequent rolling to 1.1 mm and intermediate recovery at 453 K (180 °C) for 15 min, it was recrystallized at 528 K (255 °C) for 1 h to attain a grain size of 25 µm resulting in the free-GB specimens. The sealed-GB were prepared by annealing the free-GB specimens at 638 K (365 °C) for 3 min. Prior studies had shown that Al6Fe can age with longer time at 528 K (255 °C) [27] but dissolves above 598 K (325 °C) [28]. The gauge sections of the test specimens were 40 mm × 2 mm × 1 mm and prepared prior to the final recrystallization treatment. Both down- and up-rate change test of 1/10 and 1/4 were performed with the base rate being 6 × 10⁻⁵ s−1, using the screw-driven apparatus capable of nullifying the strain rate transient, referred to as PSRS testing [8]. The down- and up-changes were separated by about 0.5% tensile strain. The corrected stress axis refers to (σ − σ0) to account for the proportional limit defined at 0.02% and facilitates conversion to shear flow stress, τ as (σ − σ0)/M. The designated slopes in the figures were all determined by least square fits of the pertinent data points.
Super-pure refers to the purity level higher than 99.999%. A milled rectangular piece of 12.4 mm thickness was first etched in a saturated sodium hydroxide solution to remove any iron contamination from the milling tool prior to annealing for 2 h at 823 K (550 °C) in a salt bath and water quenched. This slab was cooled in liquid nitrogen before and after each pass of three down to 3.94 mm. Following 1 h recrystallization anneal at 373 K (100 °C), it was again cold rolled after pre-cooling the slab to 78 K before each pass and reduced in three passes to 1.70 mm. Since the rolls were not pre-cooled, the exit temperature of the sheet was about 240 K. Previously, Heller et al. [29] showed that high purity (99.999%) Al can recover at room temperature and after rolling; it recrystallized in few minutes at 359 K (86 °C). Our material was observed to recrystallize on the surface at room temperature after metallographic polishing.
Tensile specimens with gauge section of about 40 mm × 1.7 mm × 1.3 mm were prepared prior to annealing at 353 K (80 °C) for 2 h to result in elongated grains of 300 µm by 100 µm. These specimens manifested parabolic hardening due to the presence of stacking fault tetrahedra (SFT) because SFT do not completely anneal out till 393 K (120 °C) [30]. After annealing at 393 K (120 °C), pseudo-easy glide effects were observed. The PSRS testing [8] was performed at test temperatures from 78 to 300 K by immersion in liquid nitrogen (78 K) or in ethanol/dry ice mixtures to achieve 195 K and higher temperatures.

4. Results

The premise of separating Sdebris from Sfor is based on the supposition that the increase in activation work with temperature is primarily due to creation of vacancies. The physical basis as defined by the force-distance curve is that as the activation distance decreases with increase in stress, at a given thermal energy vacancies can form at a unique activation work value, resulting in constant τν at a given temperature and strain rate. The implication as described in Section 2.1 is that the creation of vacancies reduces the enthalpy and in turn the activation work. The theoretical analysis of such a process is beyond the scope of the current study. Nevertheless, the systematic application of the current procedure to decode the Haasen plot was pursued to assess if a self-consistent analyses result. In this procedure, the constriction energy of dislocation is assumed to be constant with temperature. Hence, initial results examine the forensic evidence that dislocation intersection result in vacancy formation at repulsive intersections as presented in Section 4.1 and Section 4.2. Following the validation, the results of the construction as described in Section 2.3 is applied by defining Sfor and its separation from Sup to derive Sdebris from Sdown. These results are tabulated from which the activation work of debris can be determined and related to specific obstacles. The key recovery process that distinctly separates 78 K and 195 K deformation is the initiation of pipe diffusion with the largest recovery rate occurring at Tpipe = 125 K with Epipe = 0.28 eV [31].

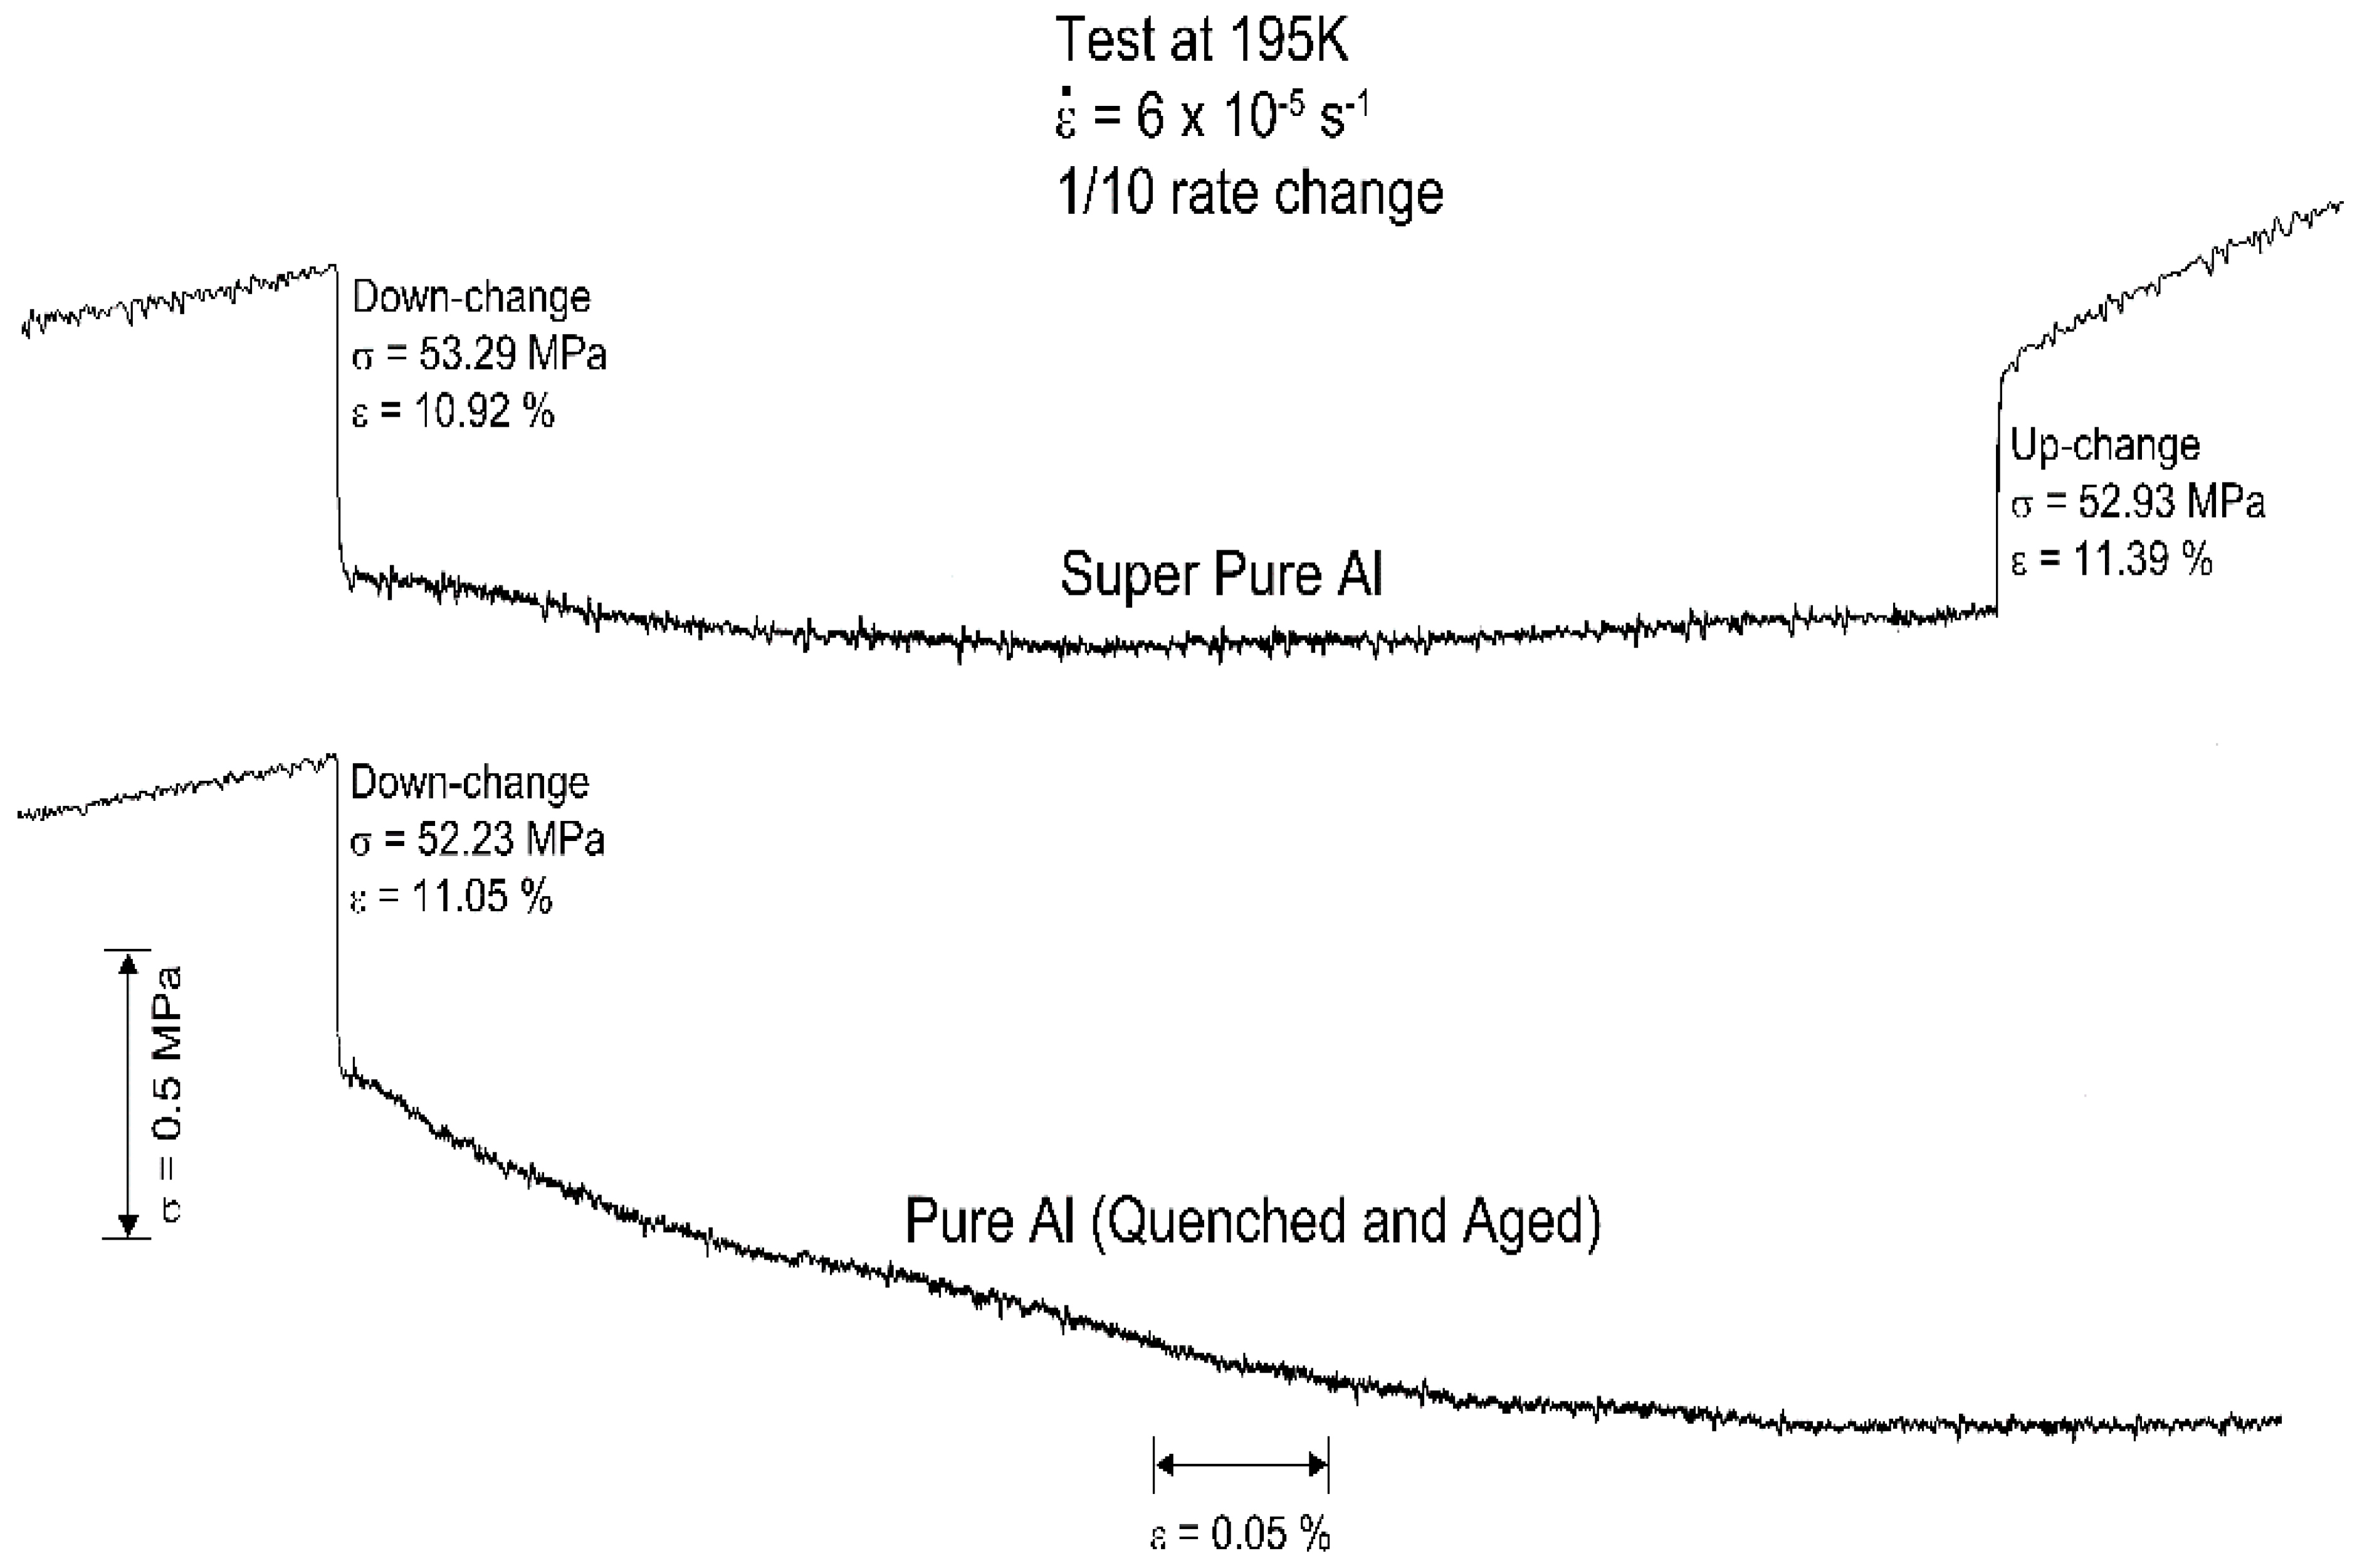
4.1. Migration of Deformation-Produced Vacancies to Various Sinks at 195 K

Figure 4 illustrates the down-change of strain rate in sealed-GB Al at 195 K, which causes a super-saturation of vacancies that are attracted to nearby dislocations by the Cottrell-Bilby effect causing unquestionable pinning in the sealed-GB specimen compared to that of free-GB [32,33]. The reduced effect for free-GB one indicates that pipe diffusion is transporting the vacancies produced at the site of dislocation intersections to sinks in the grain boundaries. Recent realization that heat-flow generated upon plastic flow is due to dynamic dislocation annihilation from coplanar slip [12] suggests that vacancies created near the dislocation cores at intersection sites are stranded upon dislocation line annihilation, which can then migrate to or are swept up by dislocations. This effect will be enhanced if there were no sinks for vacancies and will become distributed in the matrix to increase super-saturation. This newly realized process is in addition to vacancy creation by jog dragging. These processes will noticeably enhance recovery with increase in temperature as di-vacancies and vacancies become mobile.
On the other hand, similar tests were performed at 195 K on specimens which contain 5–6 nm nano-voids obtained from rapid quenching and ageing at 282 K for 10 h [35]. Figure 5 compares the down strain-rate change for super-pure Al to that for Al with nano-voids at the same strain and flow stress levels. Scrutiny shows the occurrence of two stage work-softening in specimen with nano-voids: the initial stage is due to vacancy annihilation at nano-voids, and the second stage is attributed to image forces present at dislocation termination at voids, the modelling of which by Crone et al. [36] was shown to reduce the flow stress. Moreover, dislocations terminating at free surfaces tend to re-orient into screw dislocations, the jogs at which can form cross-slip nuclei athermally leading to softening [37]. The inference is that the excess vacancies are being swept into the nano-voids because pipe-diffusion is active at 195 K. The removal of vacancy and growth of nano-voids with strain were validated by small angle X-ray scattering (SAXS) and transmission electron microscopy (TEM) [35] studies.
Figure 6 compares Haasen plots for specimen with nano-voids to that of super-pure Al at 195 K showing that up-changes on the super-pure Al has linear data points over the strain range whereas an upward break occurs for the down-change indicating the formation of debris. On the other hand, the down-change for the nano-void containing specimen shows a slightly undulating line without a distinct break whereby the data points weave between the up- and down-change ones; that is, the pre-existing nano-voids act as sinks upon yielding, affecting debris formation. Although very subtle, the initial slope of the up-change for the nano-void specimen is slightly lower than that of super-pure one suggesting that the activation work is slightly higher. The inference being that pipe diffusion transport to nano-voids reduces the vacancy supersaturation, and in turn, the NV at intersections tends to increase. These observations suggest that at 195 K, the growth of dipoles/loops are reduced since the excess vacancies annihilate at the nano-voids. On the other hand, in the absence of nearby sinks, excess vacancies form Frank loops which could convert into SFT.
The Haasen plots for sealed-GB and free-GB specimens at 195 K are compared in Figure 7. The small hump which occurs just beyond 0.2% strain for the free-GB specimen disappears as the dislocation density increases but it is undetectable for the sealed-GB one. This difference must occur due to continuous pinning when sinks are unavailable compared to the free-GB case, wherein vacancies are drained off as the forest density increases. At 267 K in Figure 8, the hump becomes almost non-detectable supporting the argument that pipe diffusion is responsible for the hump at 195 K that was not observed at 78 K. Moreover, although the Sup ratio of the sealed-GB to free-GB cases are near unity, 1.04 at 195 K, the ratio increases to 5.44/3.75 = 1.45 at 267 K in Figure 8, suggesting that as T increases, the supersaturation increased in sealed-GB and reduced the activation work of dislocation intersection. As will be presented in Section 4.3, vacancy generation increase according to γ2 or equivalently τ2(2+β) [38] such that supersaturation will increase many times more for the sealed-GB compared to free-GB specimens.

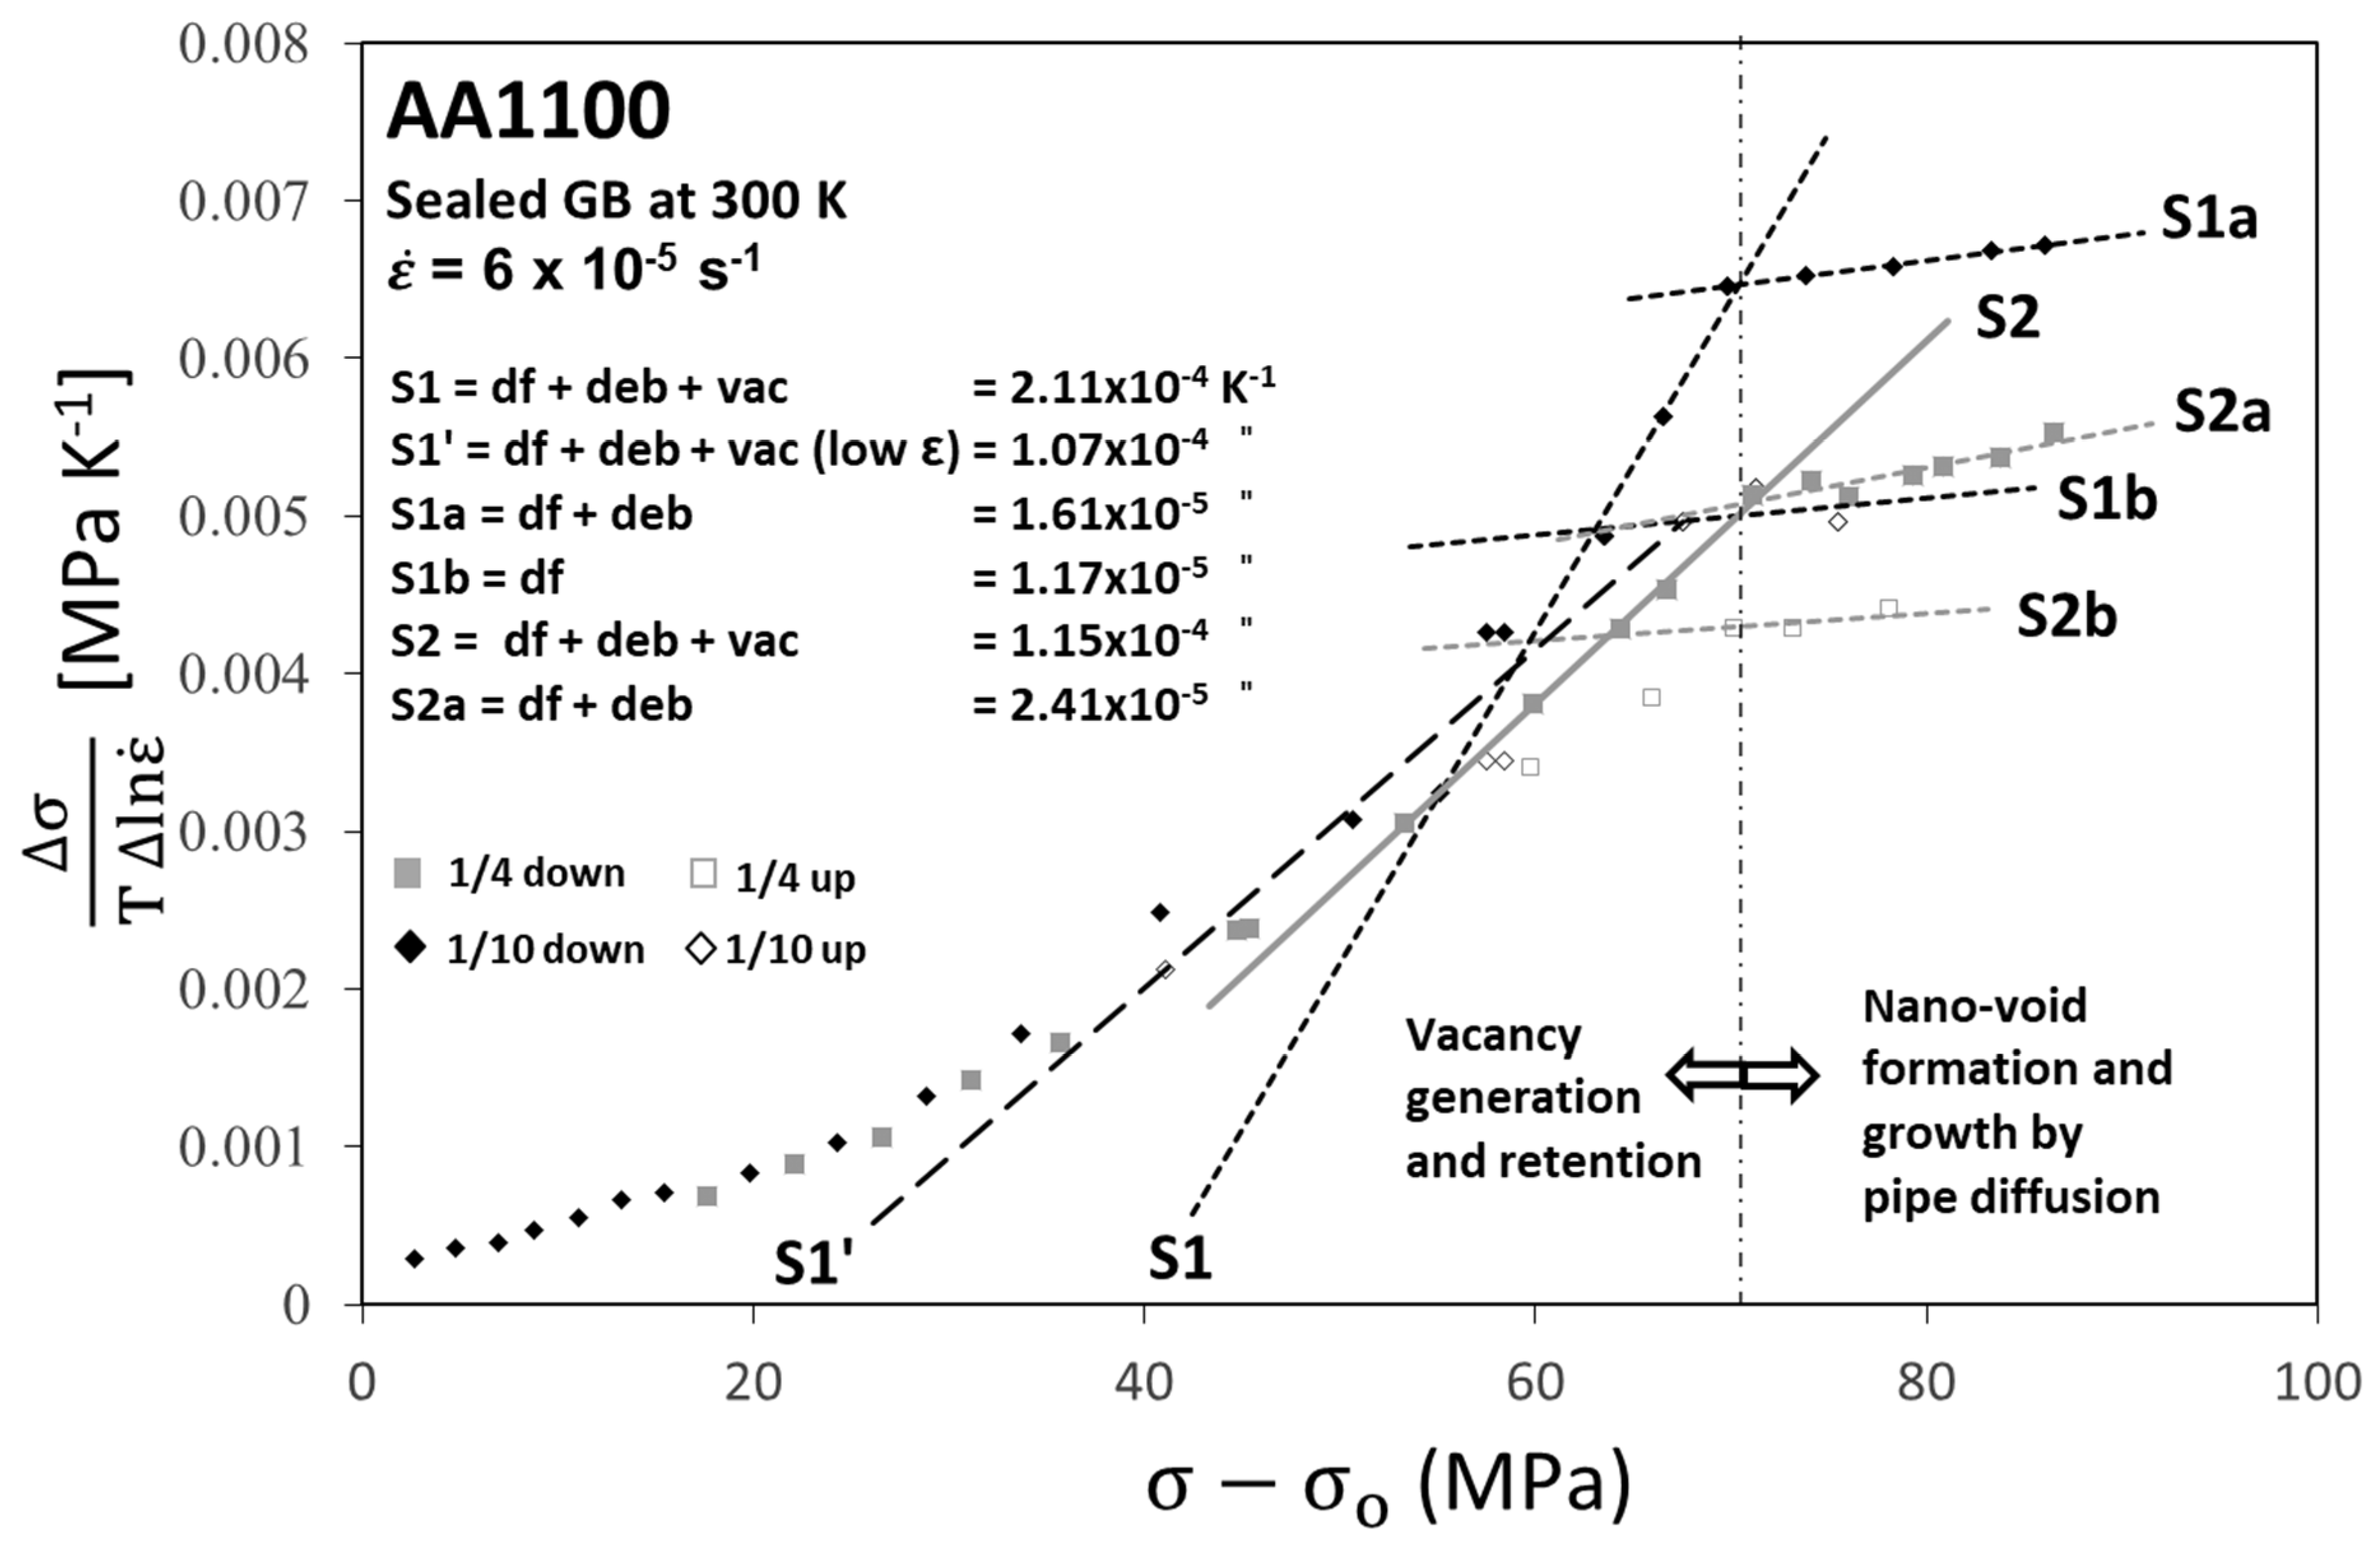
4.2. Dynamic Formation of Nano-Voids Enhanced by Vacancy Creation at Dislocation Intersections

Wenner et al. [39] showed that vacancies tend to migrate to coherent and semi-coherent precipitates, like Al6Fe particles, which can nucleate nano-voids. In the absence of these precipitates, solute Fe tend to capture vacancies as next nearest neighbours [40] such that Fe solutes can also act as nano-void nucleation sites. Thus, when di-vacancies at 200 K and mono-vacancies at 250 K become mobile [41,42], nano-void formation is expected as observed by SAXS studies of cold rolled sealed-GB specimens [35]. At 267 K, Figure 8 show that for the sealed-GB specimen both the down- and up-change tangent increases with stress (strain), that is S is not constant, and it abruptly starts to plateau indicating that the decrease in slope of 1/ν is due to reduced supersaturation which in turn increases the activation work, The Sdown for sealed-GB shows a drop in magnitude of 1/ν, suggesting that the effect is due to pinning that decrease with the decrease in supersaturation. For Sup, the largest slope prior to the leveling off was 8.22 × 10⁻⁵ K−1 equivalent to 1.05 eV in activation work. The inference being that as supersaturation in the dislocation core increase, the activation work for intersection decrease. However, upon formation of new vacancy sinks, the reduction in supersaturation means vacancy creation at the intersection site need to increase to the required NV. The deduction is that after nucleation, nano-voids start to grow assisted by sweeping and pipe diffusion and the activation work increases. On the other hand, for the free-GB case, the creation and annihilation of vacancies to sinks appear to reach a steady state whereby debris creation remains proportional to forest dislocation density with strain. This observation implies that contribution of vacancies is not detectable in Sdown compared to the sealed-GB case.
The in situ nano-void formation phenomenon is greatly enhanced at 300 K for the sealed-GB case, as shown in Figure 9 using 1/4 change, with the up-change, S2, increasing to 11.5 × 10⁻⁵ K−1 equivalent to 0.75 eV. Due to overlap of data points, the estimate for 1/10 up-change is 14.3 × 10⁻⁵ K−1 equivalent to 0.6 eV, approaching 0.58 eV for constriction only. Upon nano-void formation, the slope for up-change S1b becomes 1.17 × 10⁻⁵ K−1 (7.36 eV), approaching the creation of 10 vacancies because the vacancy formation energy, Evf = 0.65 eV. These magnitudes correlate with 0.6 × 10⁻⁵ K−1 for Al single crystal [7]. The construction in Section 2.4 assumed that the activation work for forest cutting was due to constriction of the dislocation core independent of temperature at 0.58 eV. The above deduction indicates that it is below 0.75 eV near 0.6 eV at 295 K. Thus the (∂S/∂T)|τ is negative and parallels the modulus decrease with temperature as noted in Section 2.1. This low change for activation work of repulsive intersection with temperature must be valid since a larger change will entail Sfor to approach Sup and then Sdebris will approach infinity.
The effect of nano-void formation and reduction of supersaturation for the sealed-GB specimens is graphically summarized in Figure 10 as function of temperature. This activation work plot, using the largest slopes from the up-change at 195 K to 295 K, shows the rapid drop in the activation work as the temperature approaches that of initiation of mono-vacancy migration with peak recovery rate occurring at 250 K and Evm = 0.62 eV. The initial deduction would be to consider the role of increased vacancy mobility assisting vacancies to sinks. However, as described in the next section, because NV increase with temperature, the cause may be that the increased vacancy formation can be distributed more uniformly as stranded vacancy density increases with greater dislocation annihilation. Furthermore, the nanovoid formation would be reduced for sealed-GB compared to free-GB since Al6Fe were dissolved in its preparation process eliminating that as nuclei sites. The case of vacancy creation by plastic deformation without availability of sinks was assessed and related to vacancy supersaturation in the following Section 4.3.

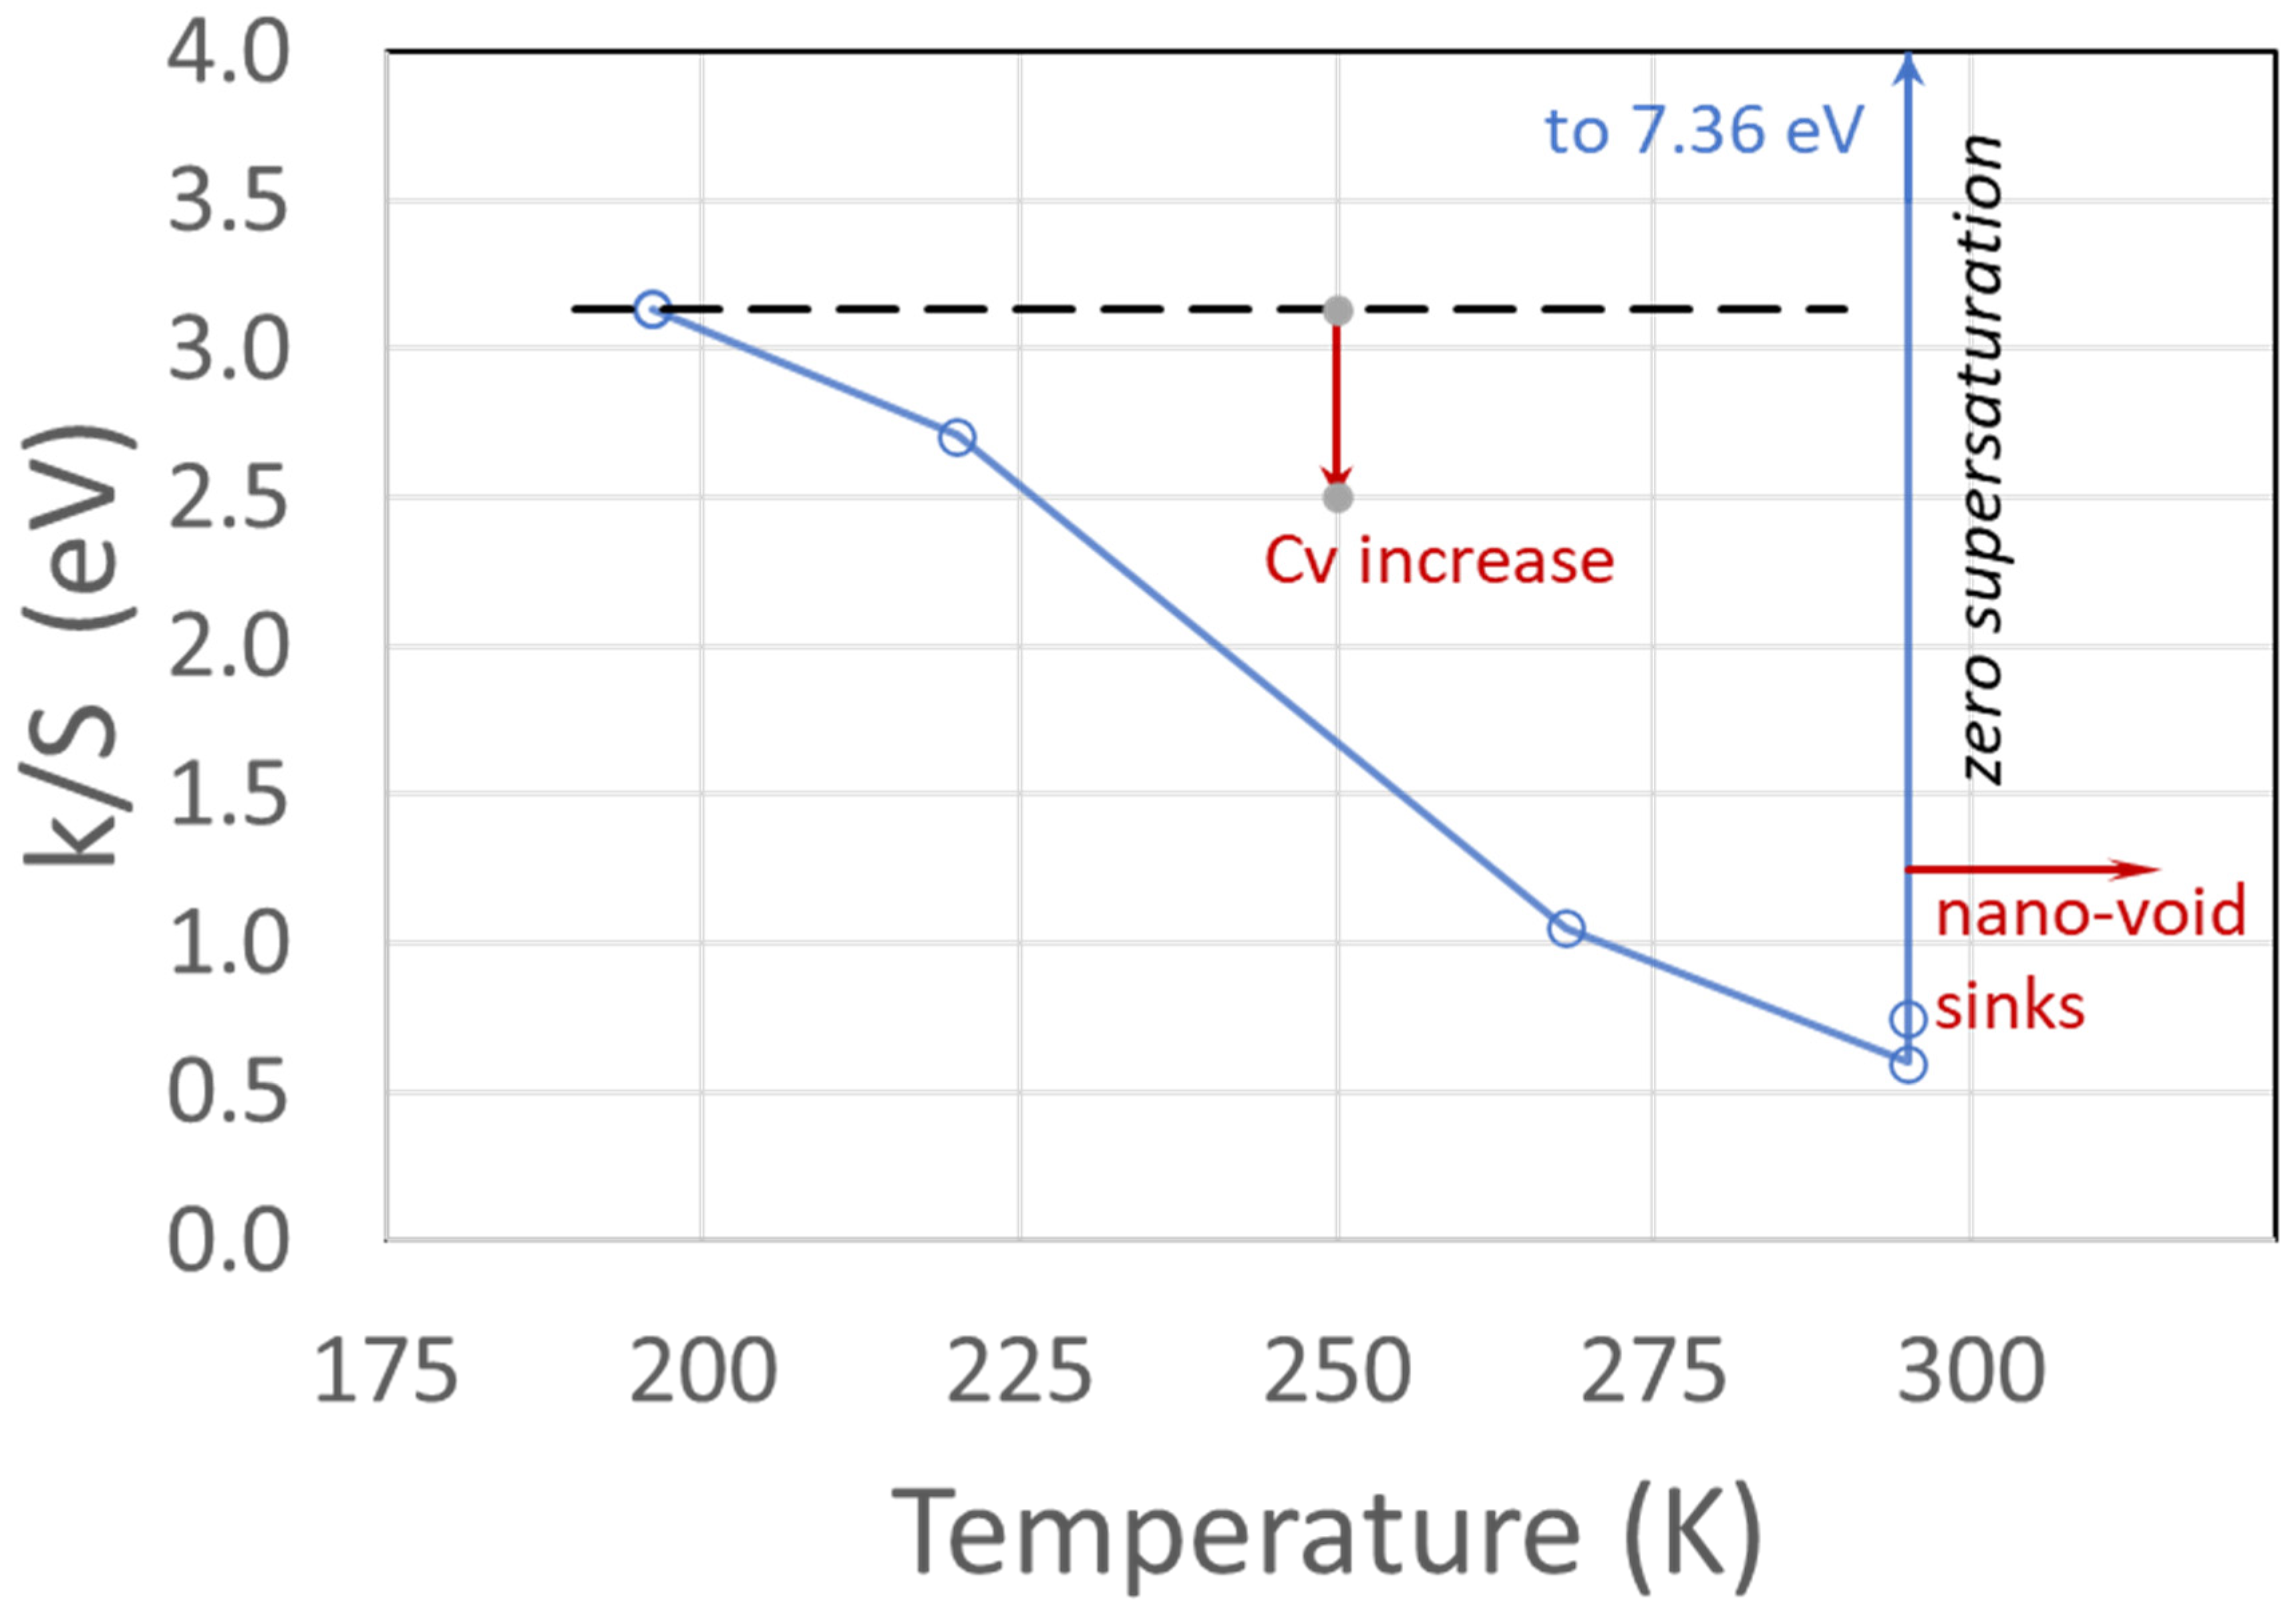
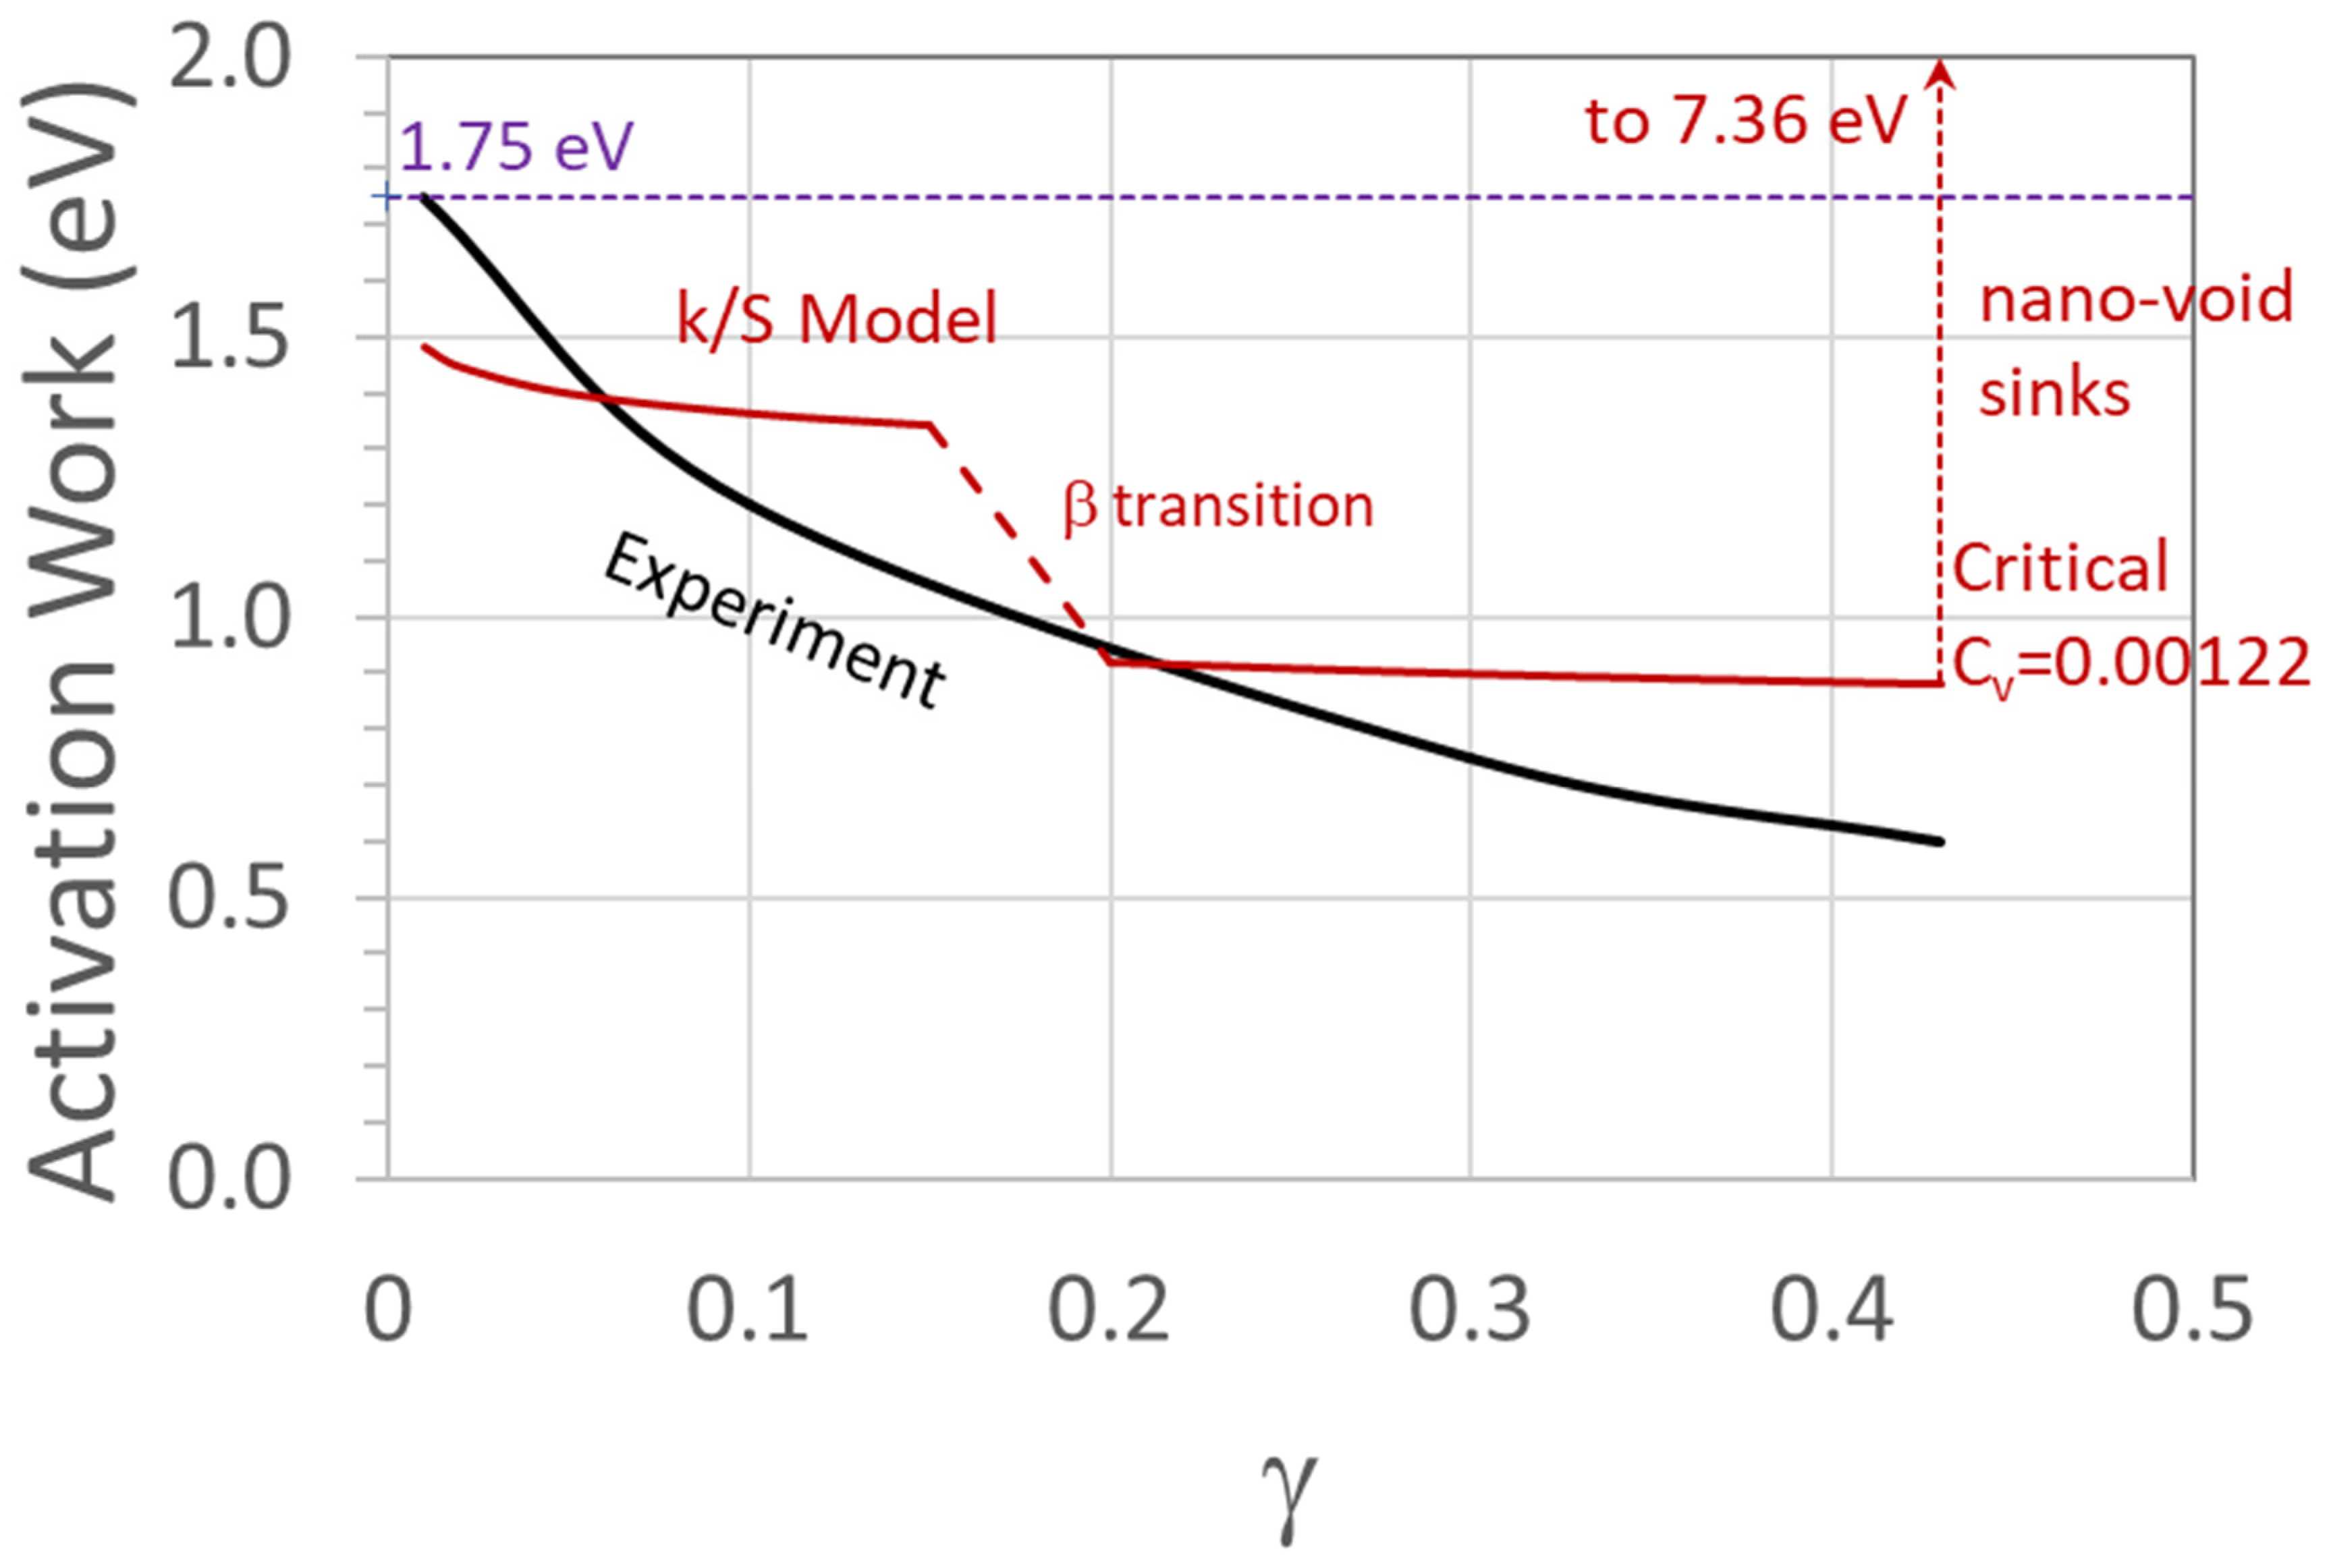
4.3. Correlation of Vacancy Supersaturation to Activation Work

Vacancy supersaturation can be expressed as Gosmotic= kT ln(CV/C0) in eV, according to Andersen, Hirth and Lothe [43]. During plastic deformation, CV can be derived as
C V = ( X N 0   b 3 ) ( P 4 A )   ( 2 + β ) ( γ 2 2 )
whereby X is taken to be 0.3 and is the fraction of the total number of dislocation intersections that can create vacancies and N0 for Al = 6.026 × 1028 is the number of atoms per m3 [38]. The CRA parameters from continuous tests for the sealed-GB specimen are P/A = 0.09373, β1 = −0.531, β2 = 1.0308 and γ3 = 0.15. Note that the CV relation changes for the strain range of 0 to γ3, β1 region, to that of γ3 to γUTS, β2 region; that is CV becomes {CV at γ3 + CV using (γ2 − γ32)}. The thermodynamic basis for the decrease of effective activation work in the presence of vacancy supersaturation CV can be deduced in the following way. For the intersection of the glide dislocation with forest dislocation with only the applied shear stress, ∆G = ∆G0 − τν. On the other hand, if vacancy supersaturation exists in the bulk lattice, the additional chemical potential [43] results in ∆G = (∆G0 + Gosmotic) − τν. This relation can be re-expressed as
Δ G = Δ G 0 { ( τ ν kTln ( C V C 0 ) ) }
which indicates that the effective activation work decreases with increase in CV. Note that C0 is taken at 300 K with Evf = 0.65 eV and that the osmotic force is compressive [43].
In Figure 9, for the sealed-GB specimens at 300 K, the Haasen slope tangent is not constant and increases with strain. By taking the tangent at intermittent strains, k/Sup were estimated from Figure 9 using 1/10 up-change tangent with corresponding γ to the τ values and plotted in Figure 11. The estimated largest supersaturation value near γ = 0.02 was 1.75 eV. Thus, Figure 11 also plots Equation (3) as (1.75 eV − Gosmotic). The only ambiguous factor in the CV calculation is the X-factor which was taken to be 0.3 whereas other data indicate it may be as large as 0.5 [44]. The quantitative correlation of the osmotic energy with the derived CV may not be precise because this model assumed that all created vacancies were retained, and none were eliminated at possible vacancy sinks. Nevertheless, the correlation with the experimental k/S is good considering the many assumptions encompassed in this deduction.
The role of CV is evident in both Figure 10 and Figure 11 and is unique to the sealed-GB specimens and not found in free-GB ones since in the latter, the build up of vacancies are much reduced due to annihilation at grain boundary sinks and nano-void formation at nanoparticles. Hence, the question arises to what difference in microstructure can account for this observation. To prepare sealed-GB from free-GB material, the specimens were annealed at 365 °C for 3 min which dissolved all the meta-phase Al6Fe and sealed the grain boundaries with Fe solutes. Correspondingly the matrix was left with Fe solute clusters which are not as efficient nano-void nuclei as the semi-coherent intermetallic phase. The conjectured result is that at a critical CV nano-voids abruptly forms at the Fe clusters resulting in reduction of S as indicated in Figure 9. Although future studies are required to confirm this hypothesis, the above correlation predicts that the T-dependence of m for Al can be estimated using the relation, τν − kT ln (CV/C0) = kT/m wherein τν can be determined from k/S = k {442.2/(T − 45)} × 10−5 K−1} [11]. The appropriate CV needs to be determined by experiment using CRA. To illustrate the relation of the decrease in energy due to vacancy supersaturation with deformation the horizontal line represents 1.75 eV for the start microstructure from which Gosmatic is subtracted, (1.75 eV − Gosmotic).

4.4. Derived Sfor and Determination of Sdebris from the Constant Haasen Slopes of Sup and Sdown

The evaluation of Sfor and Sdebris were preformed graphically using an enlarged plot and hence these plots are not presented but the derived values are tabulated and if required, the reader can reproduce them using the presented data points. For clarity the results of the super-pure Al are presented first followed by the free-GB specimens. The procedure how this construction was performed is described and correlated to the schematic plot of Figure 3.

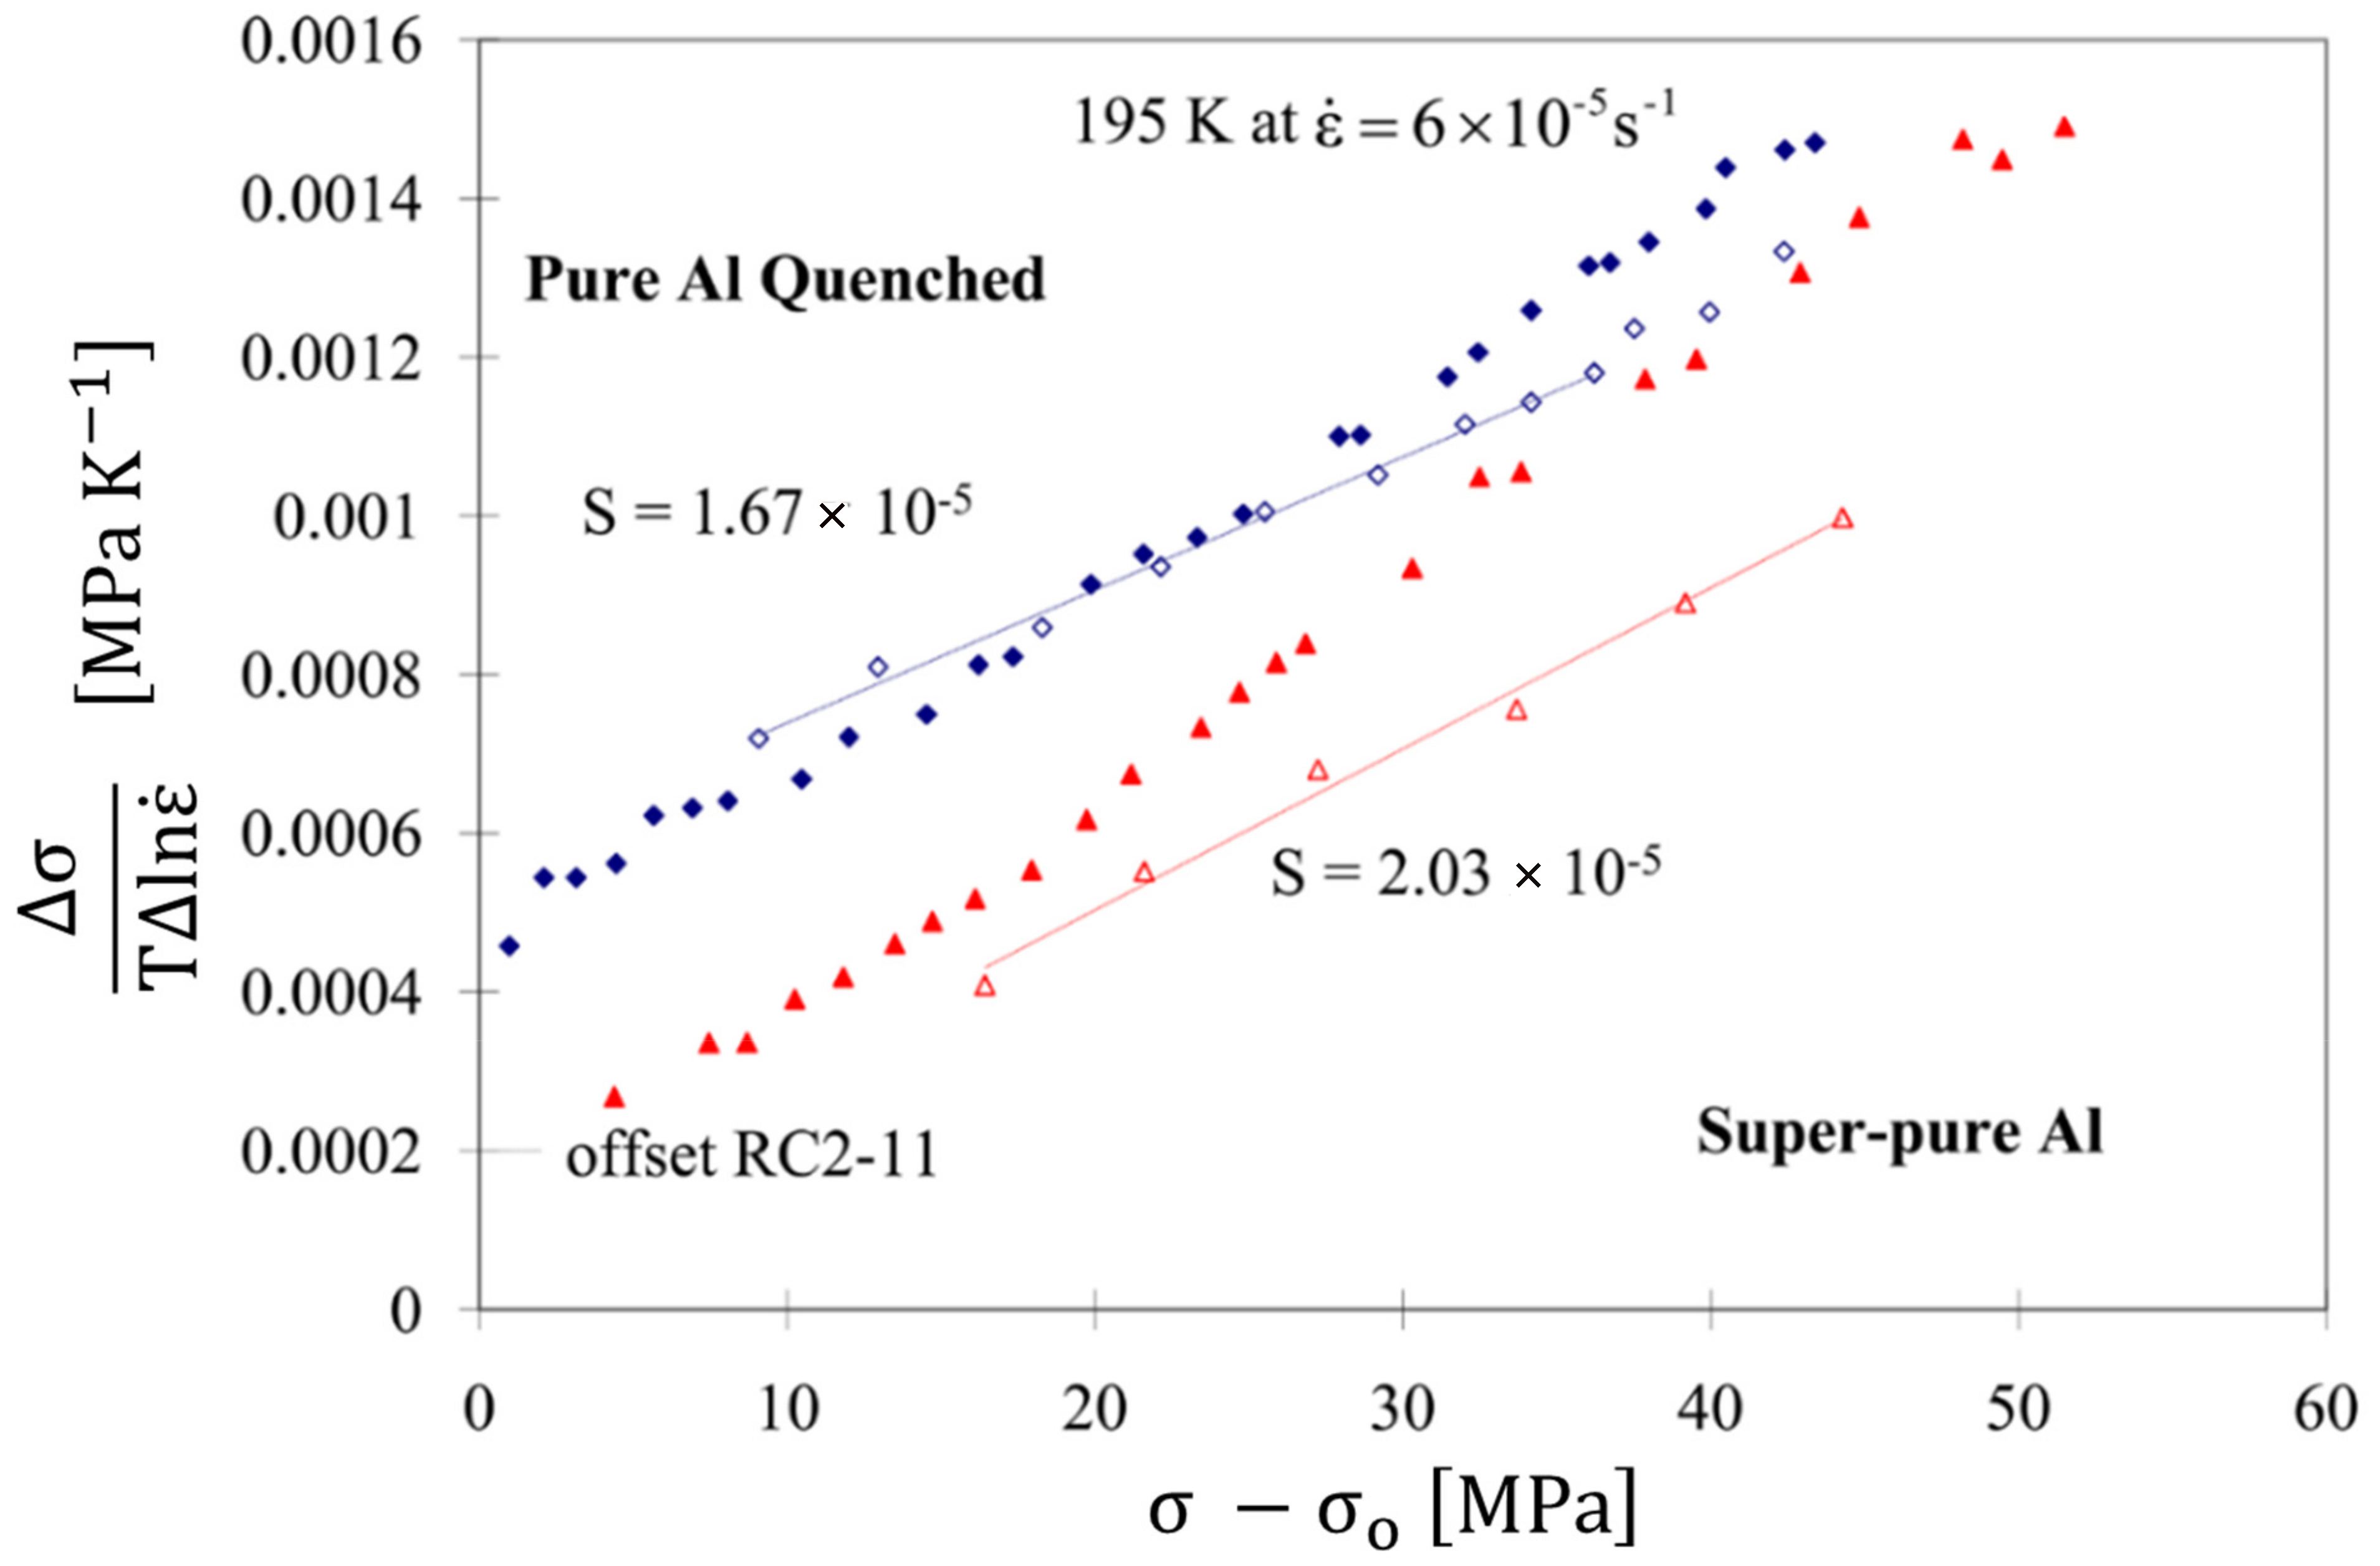
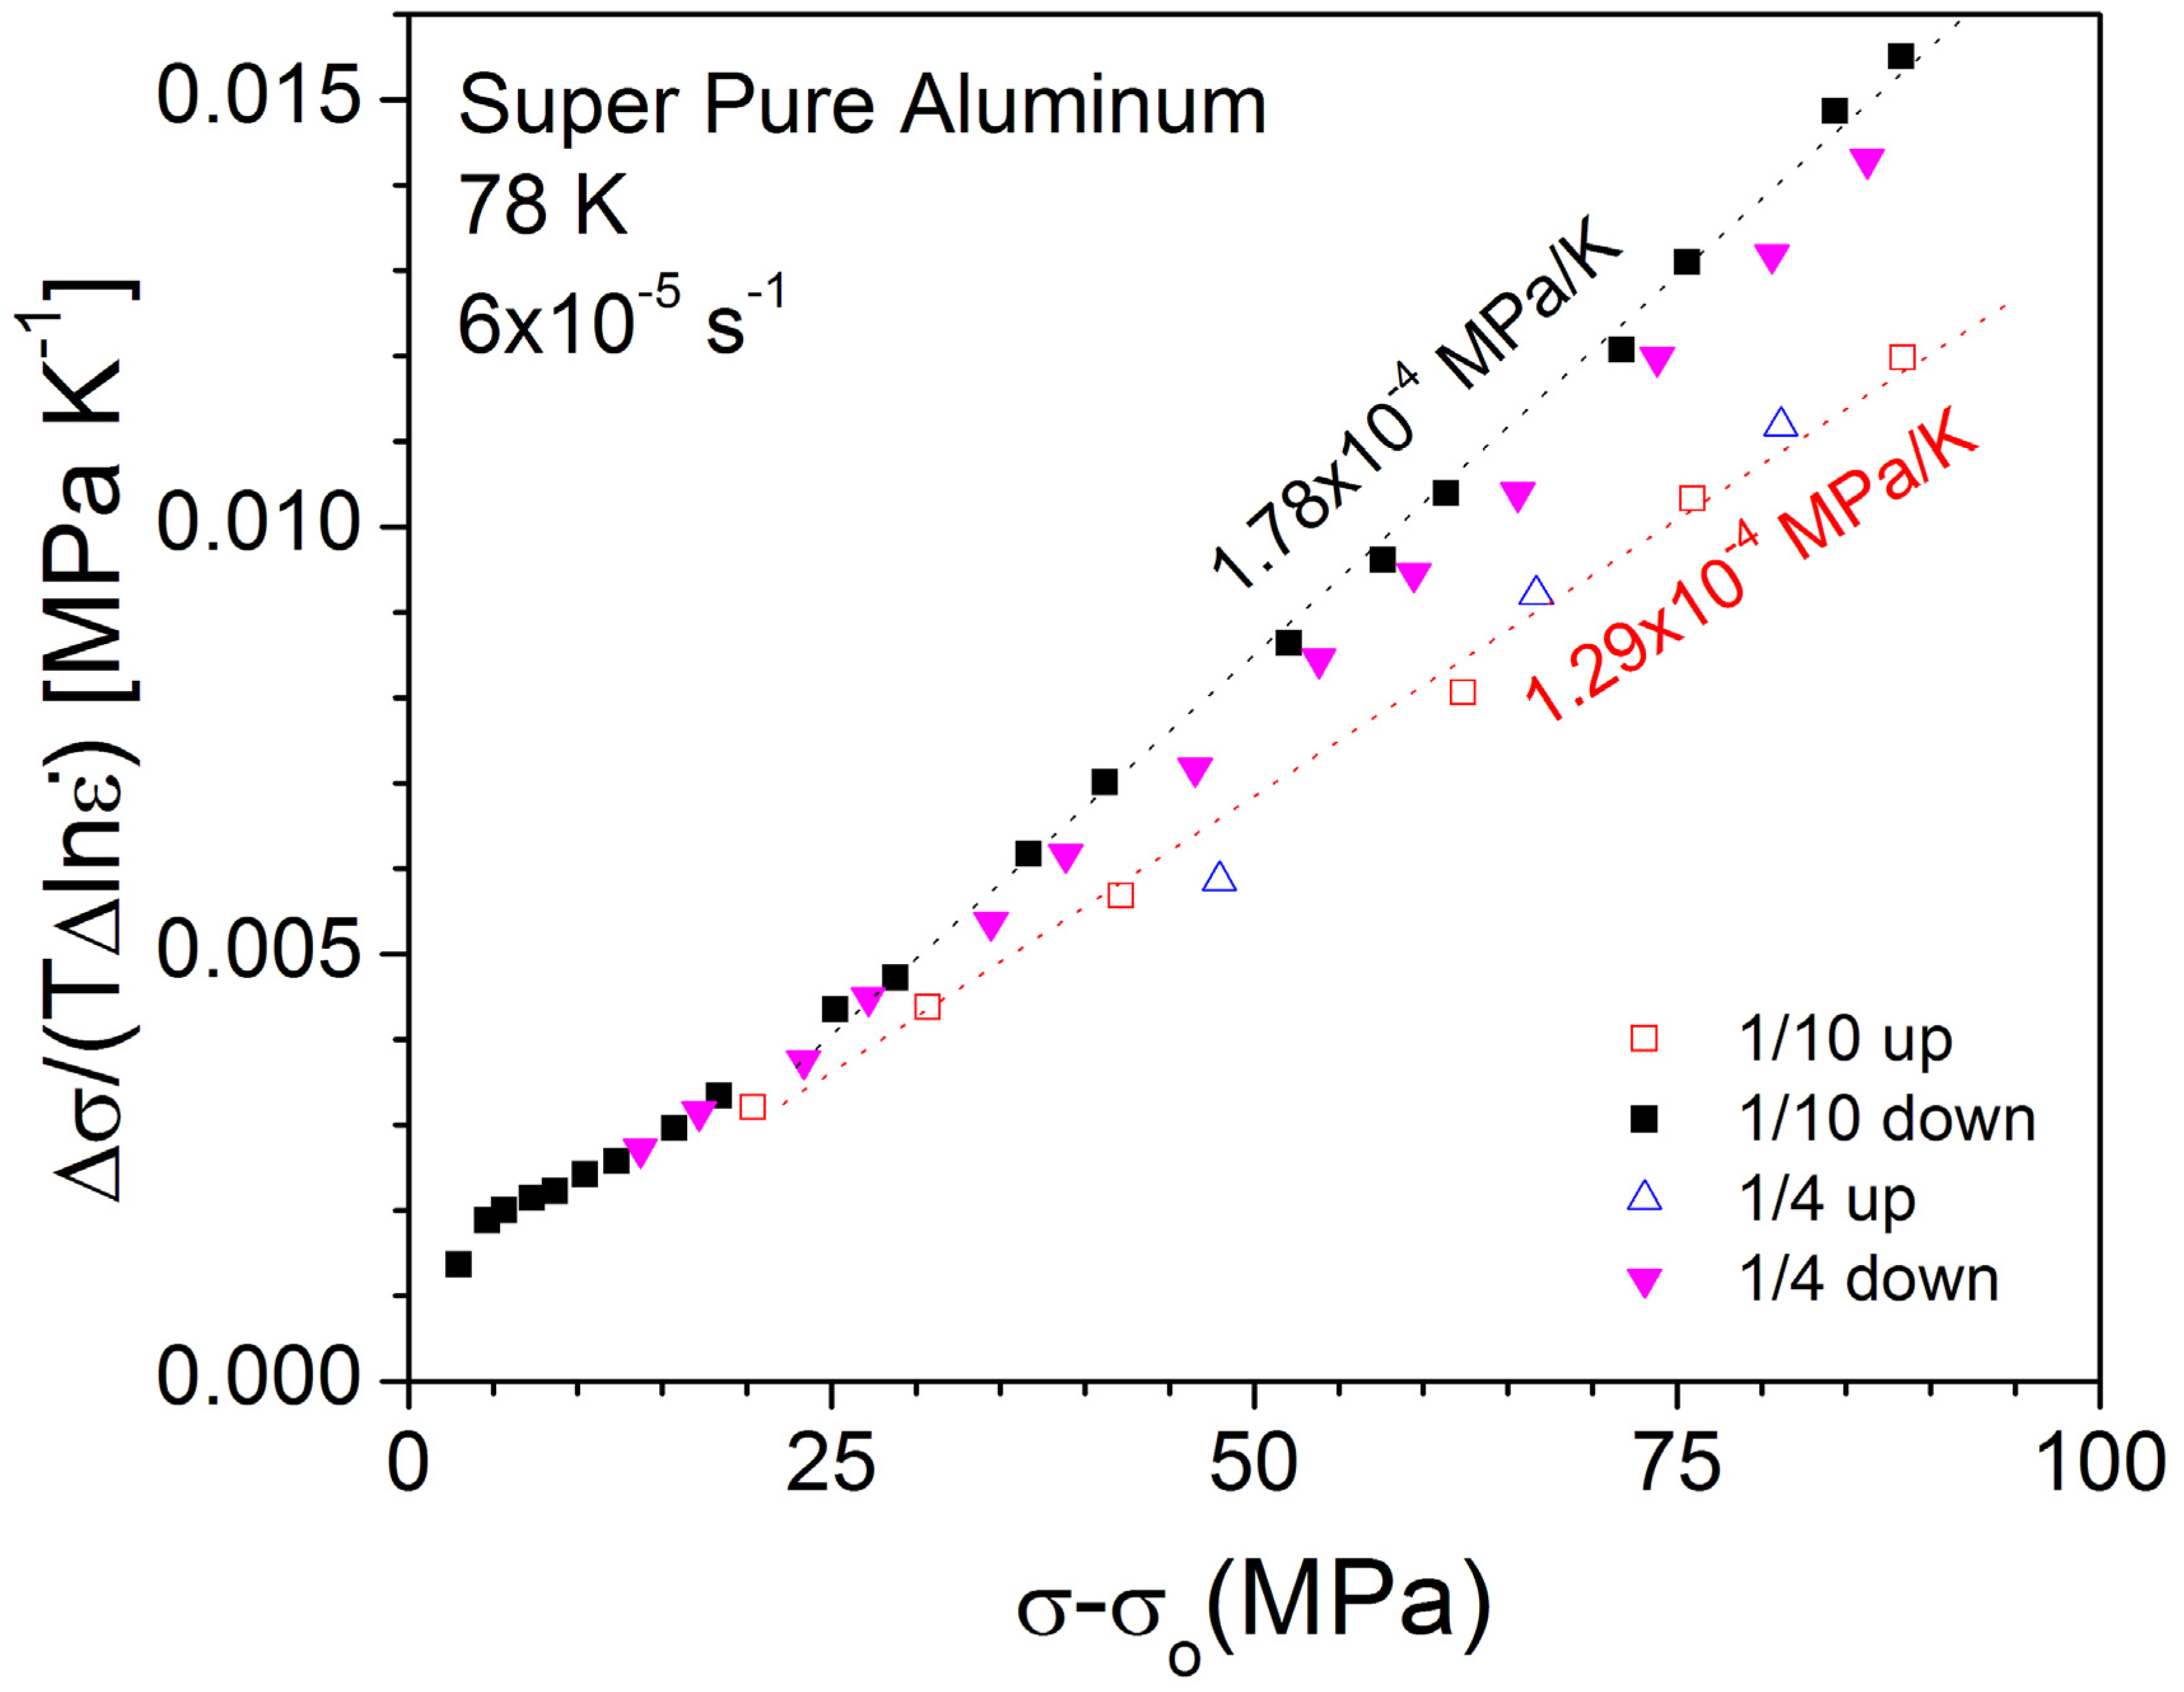
4.4.1. Haasen Plot for Super-Pure Al

The difficulties of decoding the Haasen plot arise due to the inhomogeneous nature of the starting microstructure as illustrated in the plot for super-pure Al at 78 K in Figure 12. It is evident that in the high stress (high strain) region the data points delineating the slopes are well defined using the PSRS methodology. However, upon yielding and during yield point elongation, the effect of the starting microstructure is evident due to the presence of SFT (Section 3). The definable parameters are the intersections of the up-change slope with the yield stress and with that of the down-change slope, defining σ3, the start of debris generation. The procedure for the geometrical construction was illustrated in the schematic of Figure 3 depicting the locations of σ0.2% yield, k/νyield, σ3 and σ, the latter being the flow stress at which k/νdown and k/νup were determined. The initial structure is not a random array of dislocations, but multiple slip occurs due to the presence of SFT following the preparation of the specimen. The interval between σyield and σ3 defines the Stage II region whereby ideally Sfor = Sup but the few available data points indicate that Sfor > Sup. Using the prescribed method of Figure 3, the magnitudes of the derived Sfor and Sdebris, and the accompanying parameters are listed in Table 1. The analyses presume that (σ − σ0) = σfor + Δσ, and that σfor is due only to repulsive intersections and Δσ is due only to debris. The linearity of the composite locus suggests that the debris is primarily that of one type. Note that in Figure 12, the horizontal axis is the flow stress, and beyond YPE, the slope increases as dislocation density increase with strain becoming Sfor in Stage II. In this rapid hardening region, up-change tests are experimentally difficult to perform. Because initiation of debris formation at σ3 infers that flow stress starts to include its contribution, σ = σfor + Δσ for σ > σ3 with Δσ being proportional to (σ − σ3). However, the contribution of Δσ to the vertical axis is not included in the up-change, Sup, unlike that for the down-change, Sdown. The prediction is that Sfor beyond σ3 will be larger than Sup. Figure 3 schematically summarized this procedure to derive Sfor and Sdebris and the magnitudes are listed in Table 1.
Although an ambiguity may result in the selection of the start point of Sfor locus, it was taken to be at the intersection of the Sup with σ0.2%. This procedure effectively subtracts the k/νSFT due to SFT found in the start material. If this locus now passes through the intersection point of Sup and Sdown at σ3, it implies that other effects such as the contribution of attractive intersection is small. Graphically the intersection of Sfor with k/νup defines a horizontal line at (80 − Δσ). Reforming Sfor = {k/νup − k/νyield}/(80 − 5 − Δσ), Δσ was determined. It follows then {k/νdown − k/νup}/ Δσ = Sdebris. Furthermore, the fraction of flow stress due to the contribution of debris, fdebris, was defined as {Δσ/(σ − σ3)} because the creation of debris begins at σ3. Note that a similar intersection of k/νup with σ3 and Sfor gives rise to a small Δσ that is attributed to attractive intersection, but scrutiny of Figure 12 indicate it is less than 10% of that for repulsive one.
The above construction is based on the principle that 1/ν = 1/νfor + 1/νdebris that follows from the stress additivity assumption that τ = τfor + τdebris, and its differentiation results in the derived Sdown = 1 T ln τ ln γ ˙ | T = (1-fdebris) 1 T ln τ for ln γ ˙ | T + fdebris  1 T ln τ debris ln γ ˙ | T whereby fdebris = (τdebris/τ) = Δσ /(σ − σ3). Thus, if the difference in the derived Sdown to the experimental Sdown is small the contribution from attractive intersections is assessed to be small. Thus, the agreement of derived and experimental values is taken to indicate that the deduced analyses is reliable. Note that conversion of Haasen plot to shear stress to determine S is not necessary since both axes are proportional to the Taylor factor M using (σ − σ0) = Mτ.
Table 1 compiles the parameters from the graphical determinations showing that Sfor can be derived by assuming that the activation work is 0.58 eV plus the energy to create an integral number of vacancies, NV. To assess the consistency of the procedure, the derived Sdown is compared to the experimental Sdown as shown in bold print. The agreement for specimens at 78 K of NV = 0 and at 195 K, 5.0 is reasonable. A second check was to deform super-pure Al specimen to 14% strain and recover at 298 K for 22 h. The resulting recovered flow stress at 78K was about 20% lower than that prior to annealing [45]. Because thermal recovery encompasses not only the removal of debris but also some rearrangement of the forest array, the reduction in flow stress is expected to be larger than the predicted fdebris of 12.2% at 78 K and 11.5% at 195 K. Nevertheless, considering the assumptions used, the agreement is good, indicating that the proposed k/Sfor for repulsive intersection is equivalent to the sum of constriction and vacancy-creation energies. Future experiments would require larger specimen size to improve the precision of 1/ν determinations at low stresses.

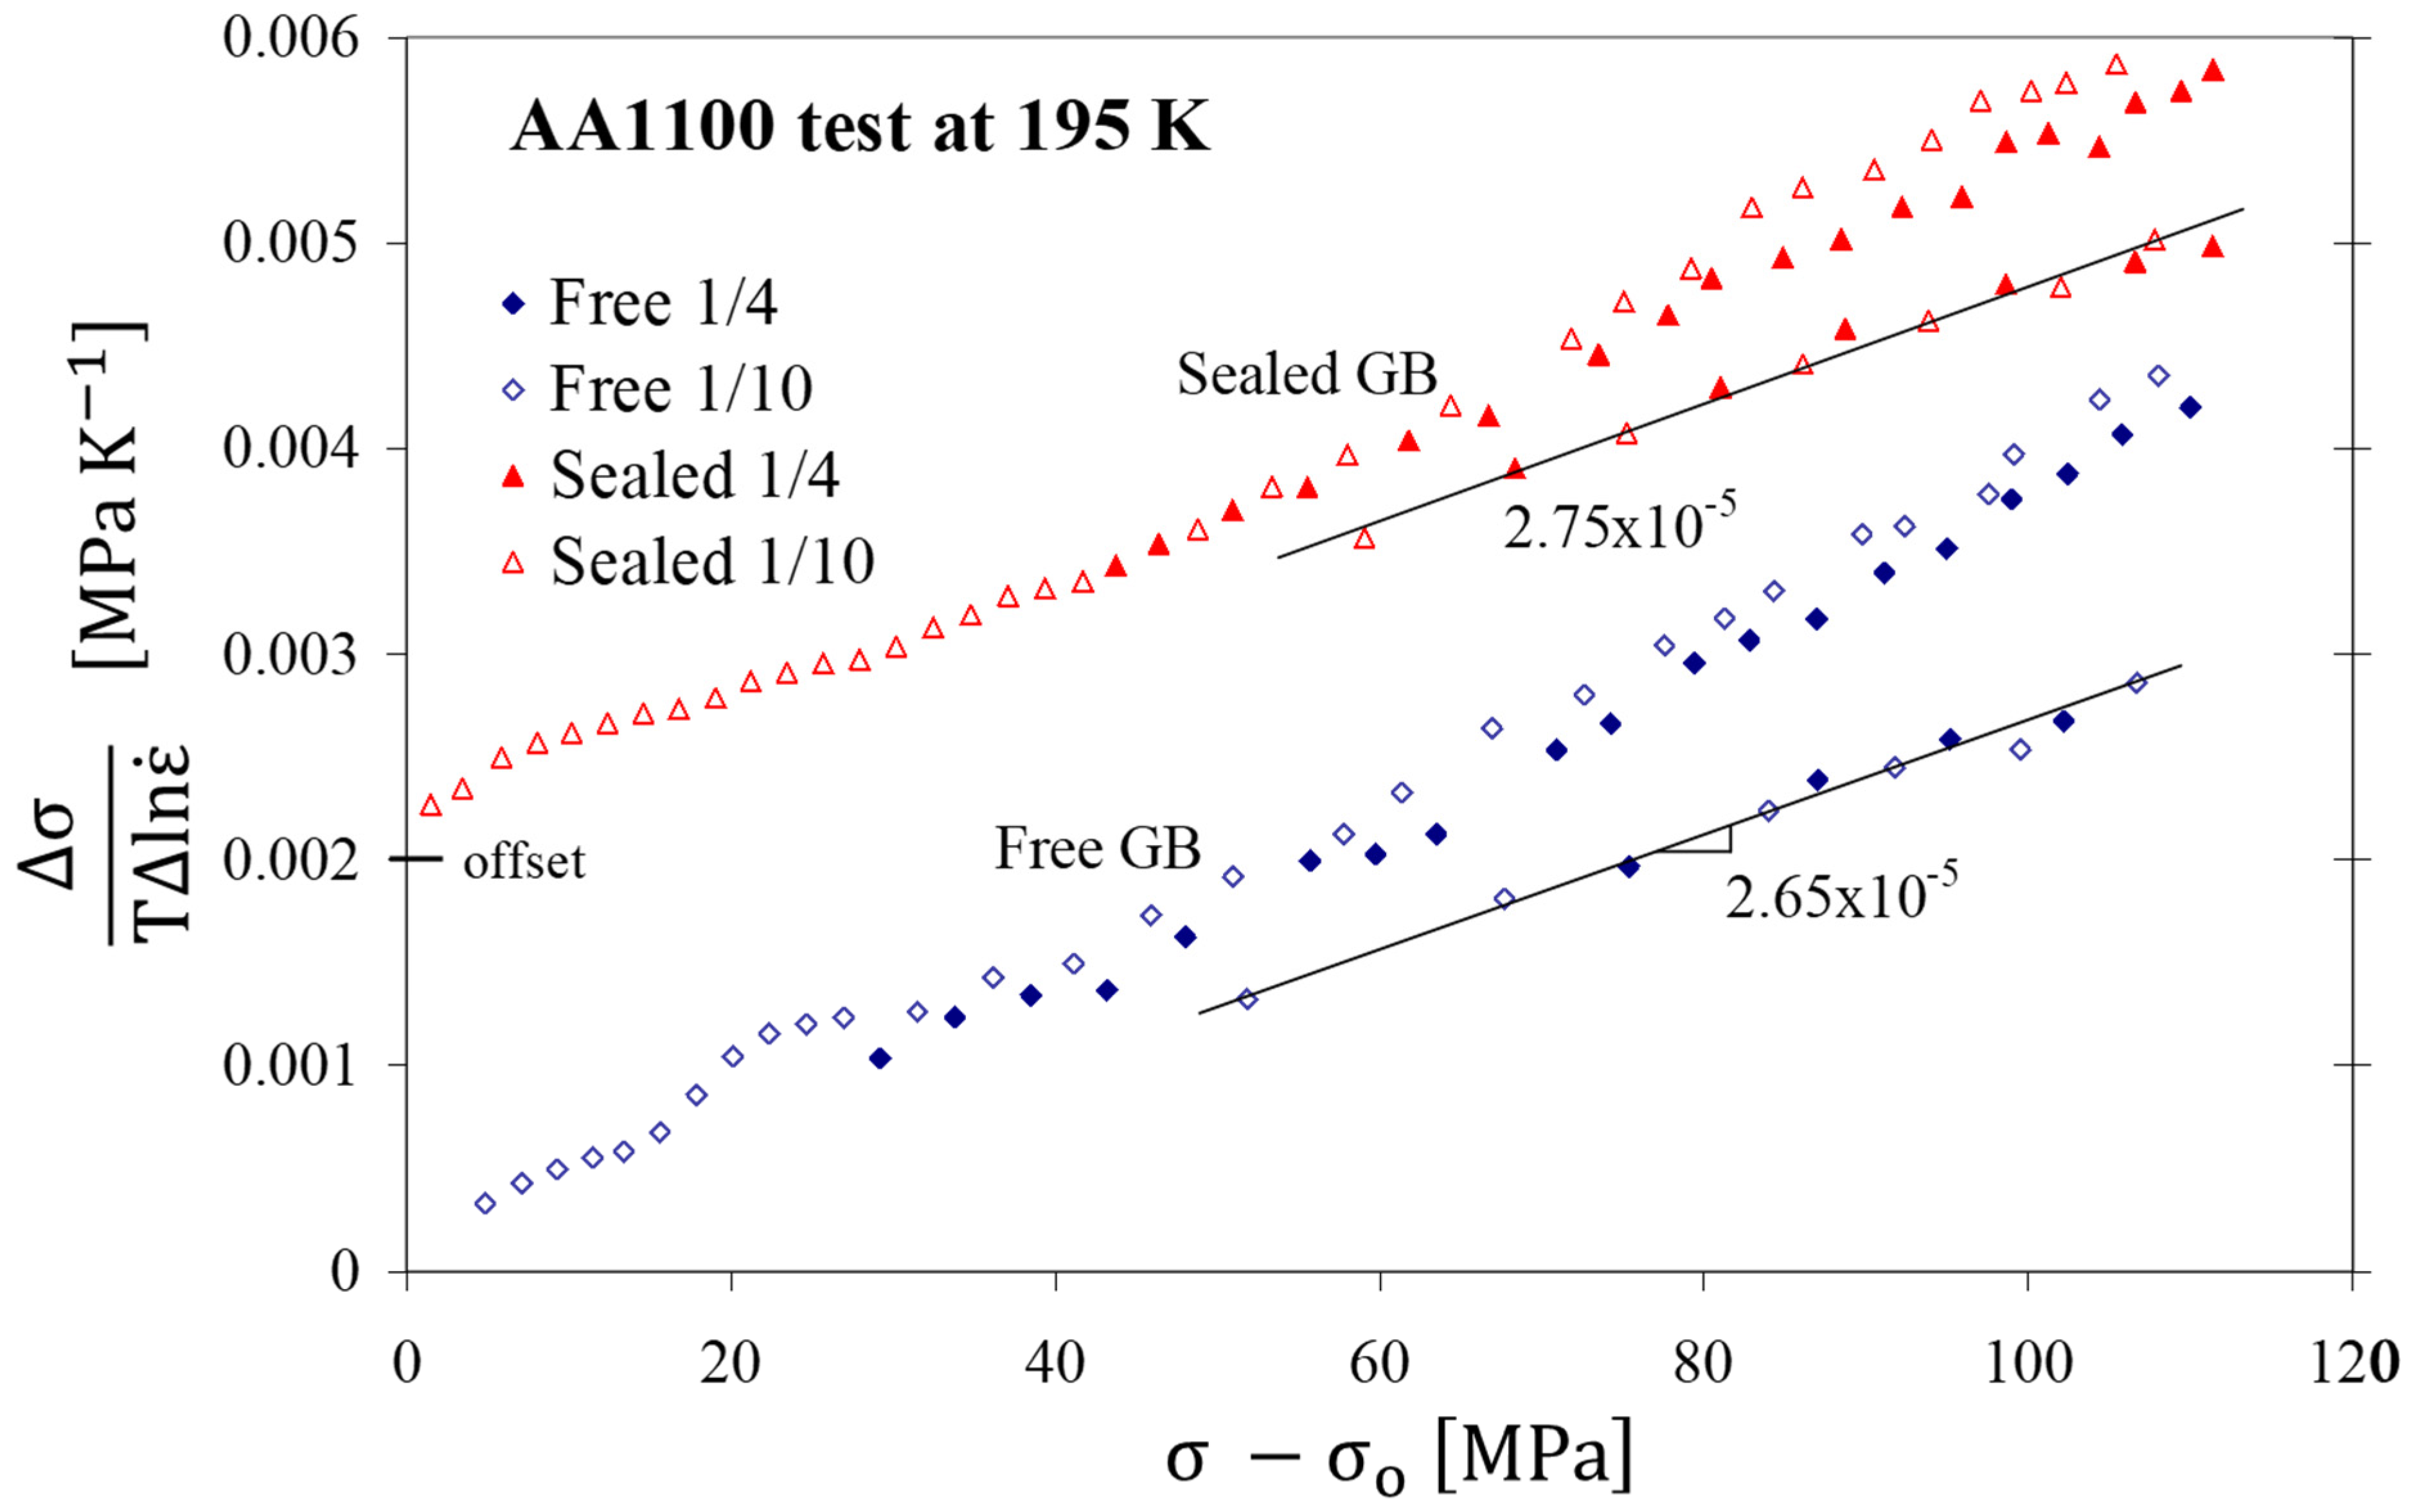
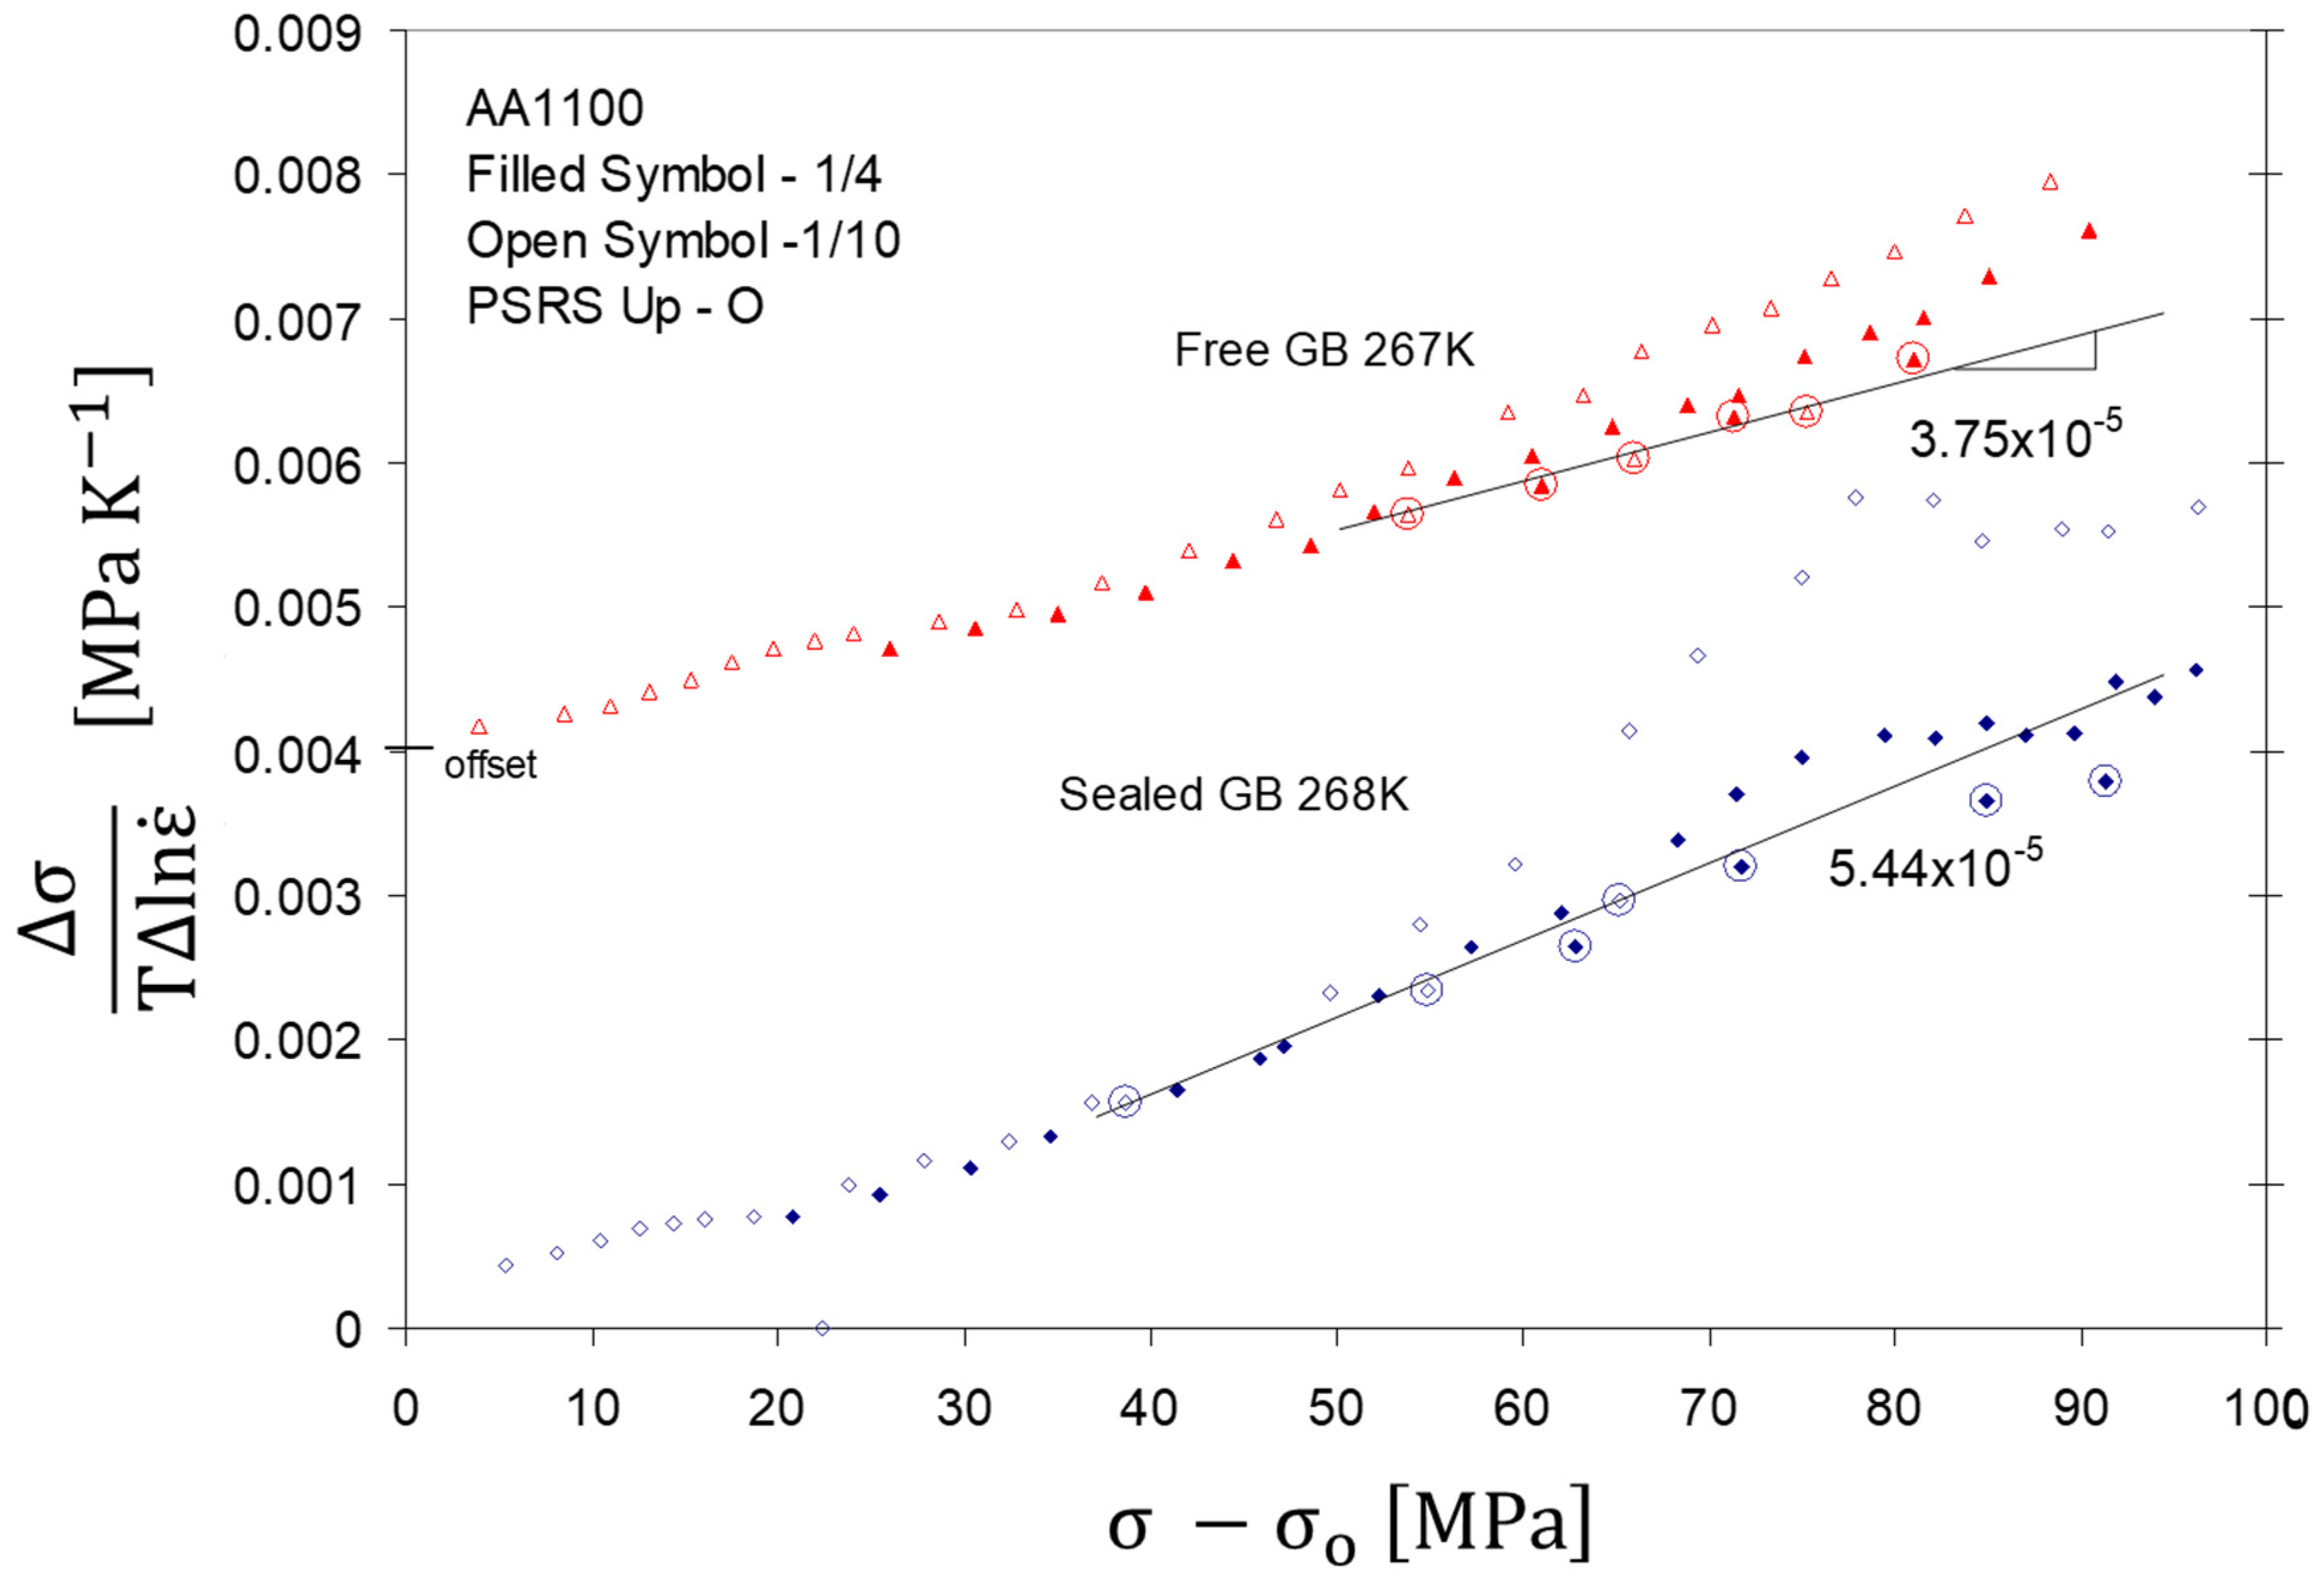
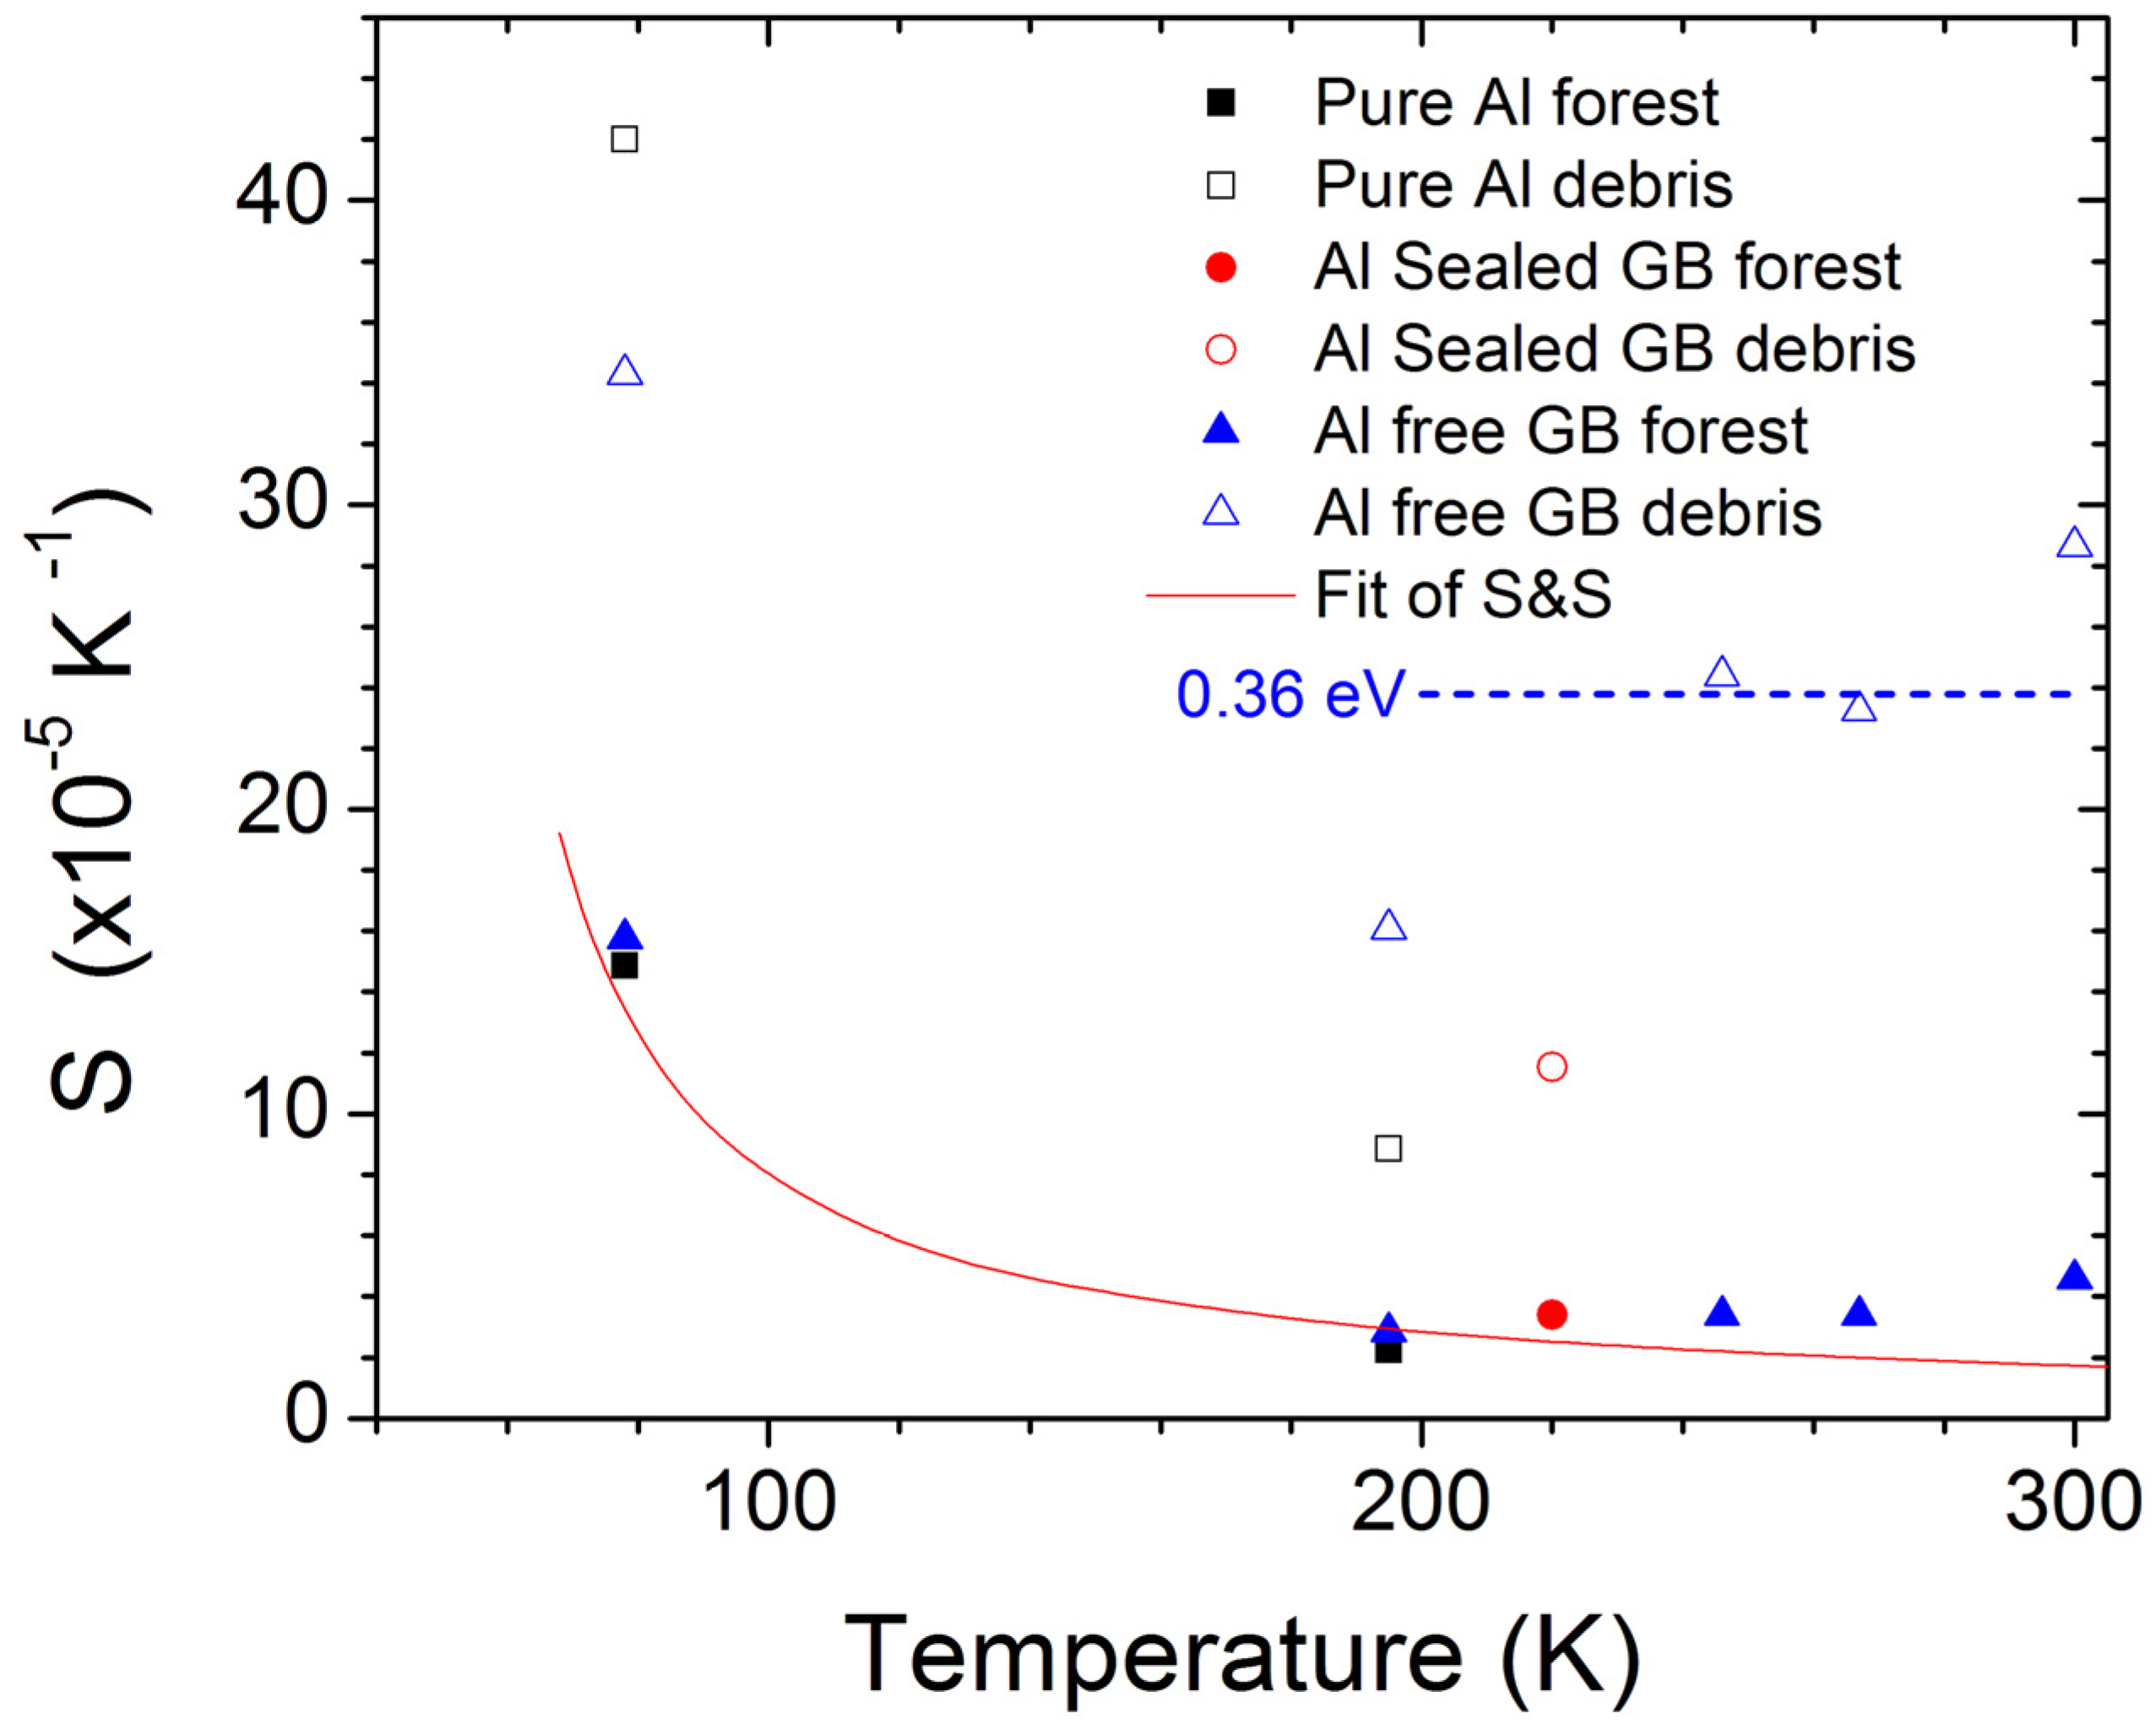
4.4.2. Derivation of Sfor and Sdebris for Free-GB Aluminum

The analyses for the free-GB specimens gives rise to difficulties of the proposed construction because of the large contribution to k/ν from nano-precipitates of Al6Fe in the pre-strain and YPE especially at 78 K and 195 K. This effect causes a vertical elevation of Sdown and the problem is to identify σ3. Towards this end, the knowledge of microstructure evolution suggests that the stress at which debris begins to form can be related to the abrupt upturn of down-rate change k/ν data locus towards Sdown. These determinations of σ3 are recorded in Table 2. Taking the origin of the construction as the intersection of Sup at σ0.2% and vertically moving Sdown locus to intersect Sup to define σ3, this reduced plot becomes identical to the construction outlined in Figure 3. The implication is that 1/ν is a sum of contributions but those due to nanoparticles can be subtracted since its density does not change with strain resulting in 1/ν − 1/νparticle = 1/νfor + 1/νdebris.
On the other hand, at 246 K, 267 K and 300 K for which the nano-particle effect is reduced, the location of the Sdown and Sup loci seems to be affected by the pipe-diffusion of continuous transport of vacancies [31]. The problem is that whenever the scale of Δσ construction becomes small, the determination of Sdebris becomes imprecise. One way to avoid this difficulty is to fix Δσ by using a known fdebris. Fortuitously, this evaluation of fdebris can be done by using the data from sealed-GB at 220 K shown in Figure 13 wherein the dissolution of Al6Fe had reduced the YPE effect. A precise value for this factor can be determined because the sealing of the vacancy sinks prevent the dynamic vacancy annihilation until nano-void formation occurs as shown in Figure 9. Analyses of the 220 K data set at σ = 100 MPa are listed in Table 3 and the resulting agreement of derived Sdown with experimental Sdown is better than 2%. Additionally, fdebris was found to be 0.10 and is in good accord with super-pure Al. Based on this finding, a constant fdebris of 0.10 was used for all of the free-GB data and the derived parameters in Table 2 conform with each other.
The measured Sup and Sdown values are plotted in Figure 14 and are compared with those of the super-pure Al from current work and that of Al single crystals [7,11], and AA1100 from prior study [46]. In the temperature range 78 K to 195 K, all the available data points for very pure Al cluster together including the fit- locus derived from S = {442.2/(T − 45)} × 10−5 K−1 [11]. The most notable aspect is that the plot shows an abrupt change of kinetics above 195 K, attributed to inception of di-vacancy and vacancy mobility in combination with pipe-diffusion. This effect becomes exaggerated as summarized in Figure 10 for the sealed-GB specimens. The fit-locus in Figure 14 is continuously decreasing whereas the Sup values trend upwards. However, at 300 K, the Sup from Al single crystal and super-pure [47] closely matches that from the fit-locus. Moreover, Sup for the sealed-GB case become similar to the single crystal one (Figure 14), after formation of nano-voids that act as efficient vacancy sinks (1.17 × 10⁻⁵ K−1 in Figure 9). These observations strongly indicate that changes in degree of vacancy super-saturation affect the strain-rate sensitivity. Scrutinizing Figure 14, Sdown for free-GB is slightly larger than those from prior studies [46], SS&M(oc) at 10−4 s−1 and SS&M(os) at 10−3 s−1 which were determined at high strains wherein nano-voids had formed. Another observation is that the data of less pure SS&M [46] lies above the purer Al specimens below 220 K but is nearly the same at 78 K whereby vacancies at intersection sites were not created, which suggest that vacancy formation at intersection is affected by impurity content. The bulk manifestation of the role of CV was described earlier by observing that at 4.2 K no vacancies are created at the intersection site whereas up to 10 is possible at 295 K (Section 4.2) resulting in an increase of X from 0.1 to 0.3. This phenomenon is understood to contribute to nano-void growth leading to ductile failure as previously modelled [48]. Hence, decrease of the processing temperature results in deferred ductile failure by void coalescence.
The derived values of Sfor and Sdebris are presented in Figure 15. The Sfor for super-pure is very similar in value to those of less pure free-GB cases whereas for Sdebris the data points diverge. Keeping in mind that vacancies are not created at intersection sites at 78 K, the noticeably larger difference occurs at 195 K and higher temperatures. This effect must be due to the role of Fe impurities in the process of debris formation, that is the activation work in an impure Al matrix is less than in the super-pure case. The Sfor data points correlate well with the fit-locus, suggesting that the controlling obstacles are forest dislocations and the continuous negative ∂Sfor/∂T indicate vacancy creation at intersection occurs reaching a limiting value. Note at 300 K, Sfor for free-GB was 4.58 × 10⁻⁵ K−1 compared to 1.73 × 10⁻⁵ K−1 for the fit-locus and 1.17 × 10⁻⁵ K−1 for Sup of sealed-GB after nano-void formation inferring that vacancy supersaturation in free-GB is not zero as for one with nano-voids. The creation of vacancies was calculated according to (k/S − EC)/Evf which results in NV of 1.9 (free-GB); 6.0 to 7.0 (sealed-GB); 5.0 (fit-locus) which indicate that the specimen with the least supersaturation of vacancies after formation of nano-voids results in the largest NV. However, in the case of free-GB at high strains in the neck region, nano-void formation is expected to form and hence the increasing NV will affect the fracture strain. It remains below to discuss the temperature dependent activation energy determinations from the strain rate sensitivity asymmetries so to explain the dynamic effect of dislocation-obstacle interaction on the evolution of deformation-caused species that affect work hardening and ultimately ductility.

5. Discussion

The discussion is organized into eight sub-sections as follows. Firstly, the understood temperature dependent behaviour of vacancy creation in aluminum is summarized. Section 5.2 focuses on specific experimental strain rate sensitivity, S, results over the same temperature range. Section 5.3 describes how to categorize deformation debris from S for lattice defect identification. Section 5.4 and Section 5.5 characterize the activation work for the super-pure and free-GB Al. Section 5.6 confirms the role of jog dragging due to repulsive and attractive forest intersections from the data analysis. Section 5.7 describes the role repulsive intersections would have on nano-void formation and recovery, and Section 5.8 deals with the role of attractive junctions in work-hardening.

5.1. Synopsis of Forensic Survey of Vacancy Creation at Dislocation Intersections in Aluminum

<78 K: Vacancies in Al are formed by jog dragging at temperatures below 78 K with tendency at high strains to transform to faulted dipole loops [49].
>78 K: Repulsive forest-intersections create vacancies, the number of which depends on the test temperature and increase the activation work, a new concept [10].
125–195 K: Tpipe = 125 K and at 195 K pipe diffusion occurs to re-distribute the vacancies created at the intersection sites. If pipe diffusion mobility can keep pace with the dislocation movement or dislocation line become stationary upon intersection, vacancies are stranded upon coplanar dislocation annihilation [12,37]. This mechanism is the main source of vacancy super-saturation in fcc metals since jog-dragging primarily results in faulted loops rather than vacancies.
>200 K: di-vacancies and mono-vacancies become mobile, and the vacancy super-saturation causes dynamic pinning as manifested when the strain rate is abruptly decreased [33]. Figure 14 shows this phenomenon starts about 220 K.
250 K: At high strains starting, initiation of mono-vacancy mobility leads to nano-void formation which in turn become vacancy sinks and reduce the super-saturation resulting in an increase of activation work and creation of more vacancies. At some point, vacancy creation at intersection sites and annihilation at nano-voids reach a steady-state condition until pre-emptive void coalescence occurs and ductile failure results [48].

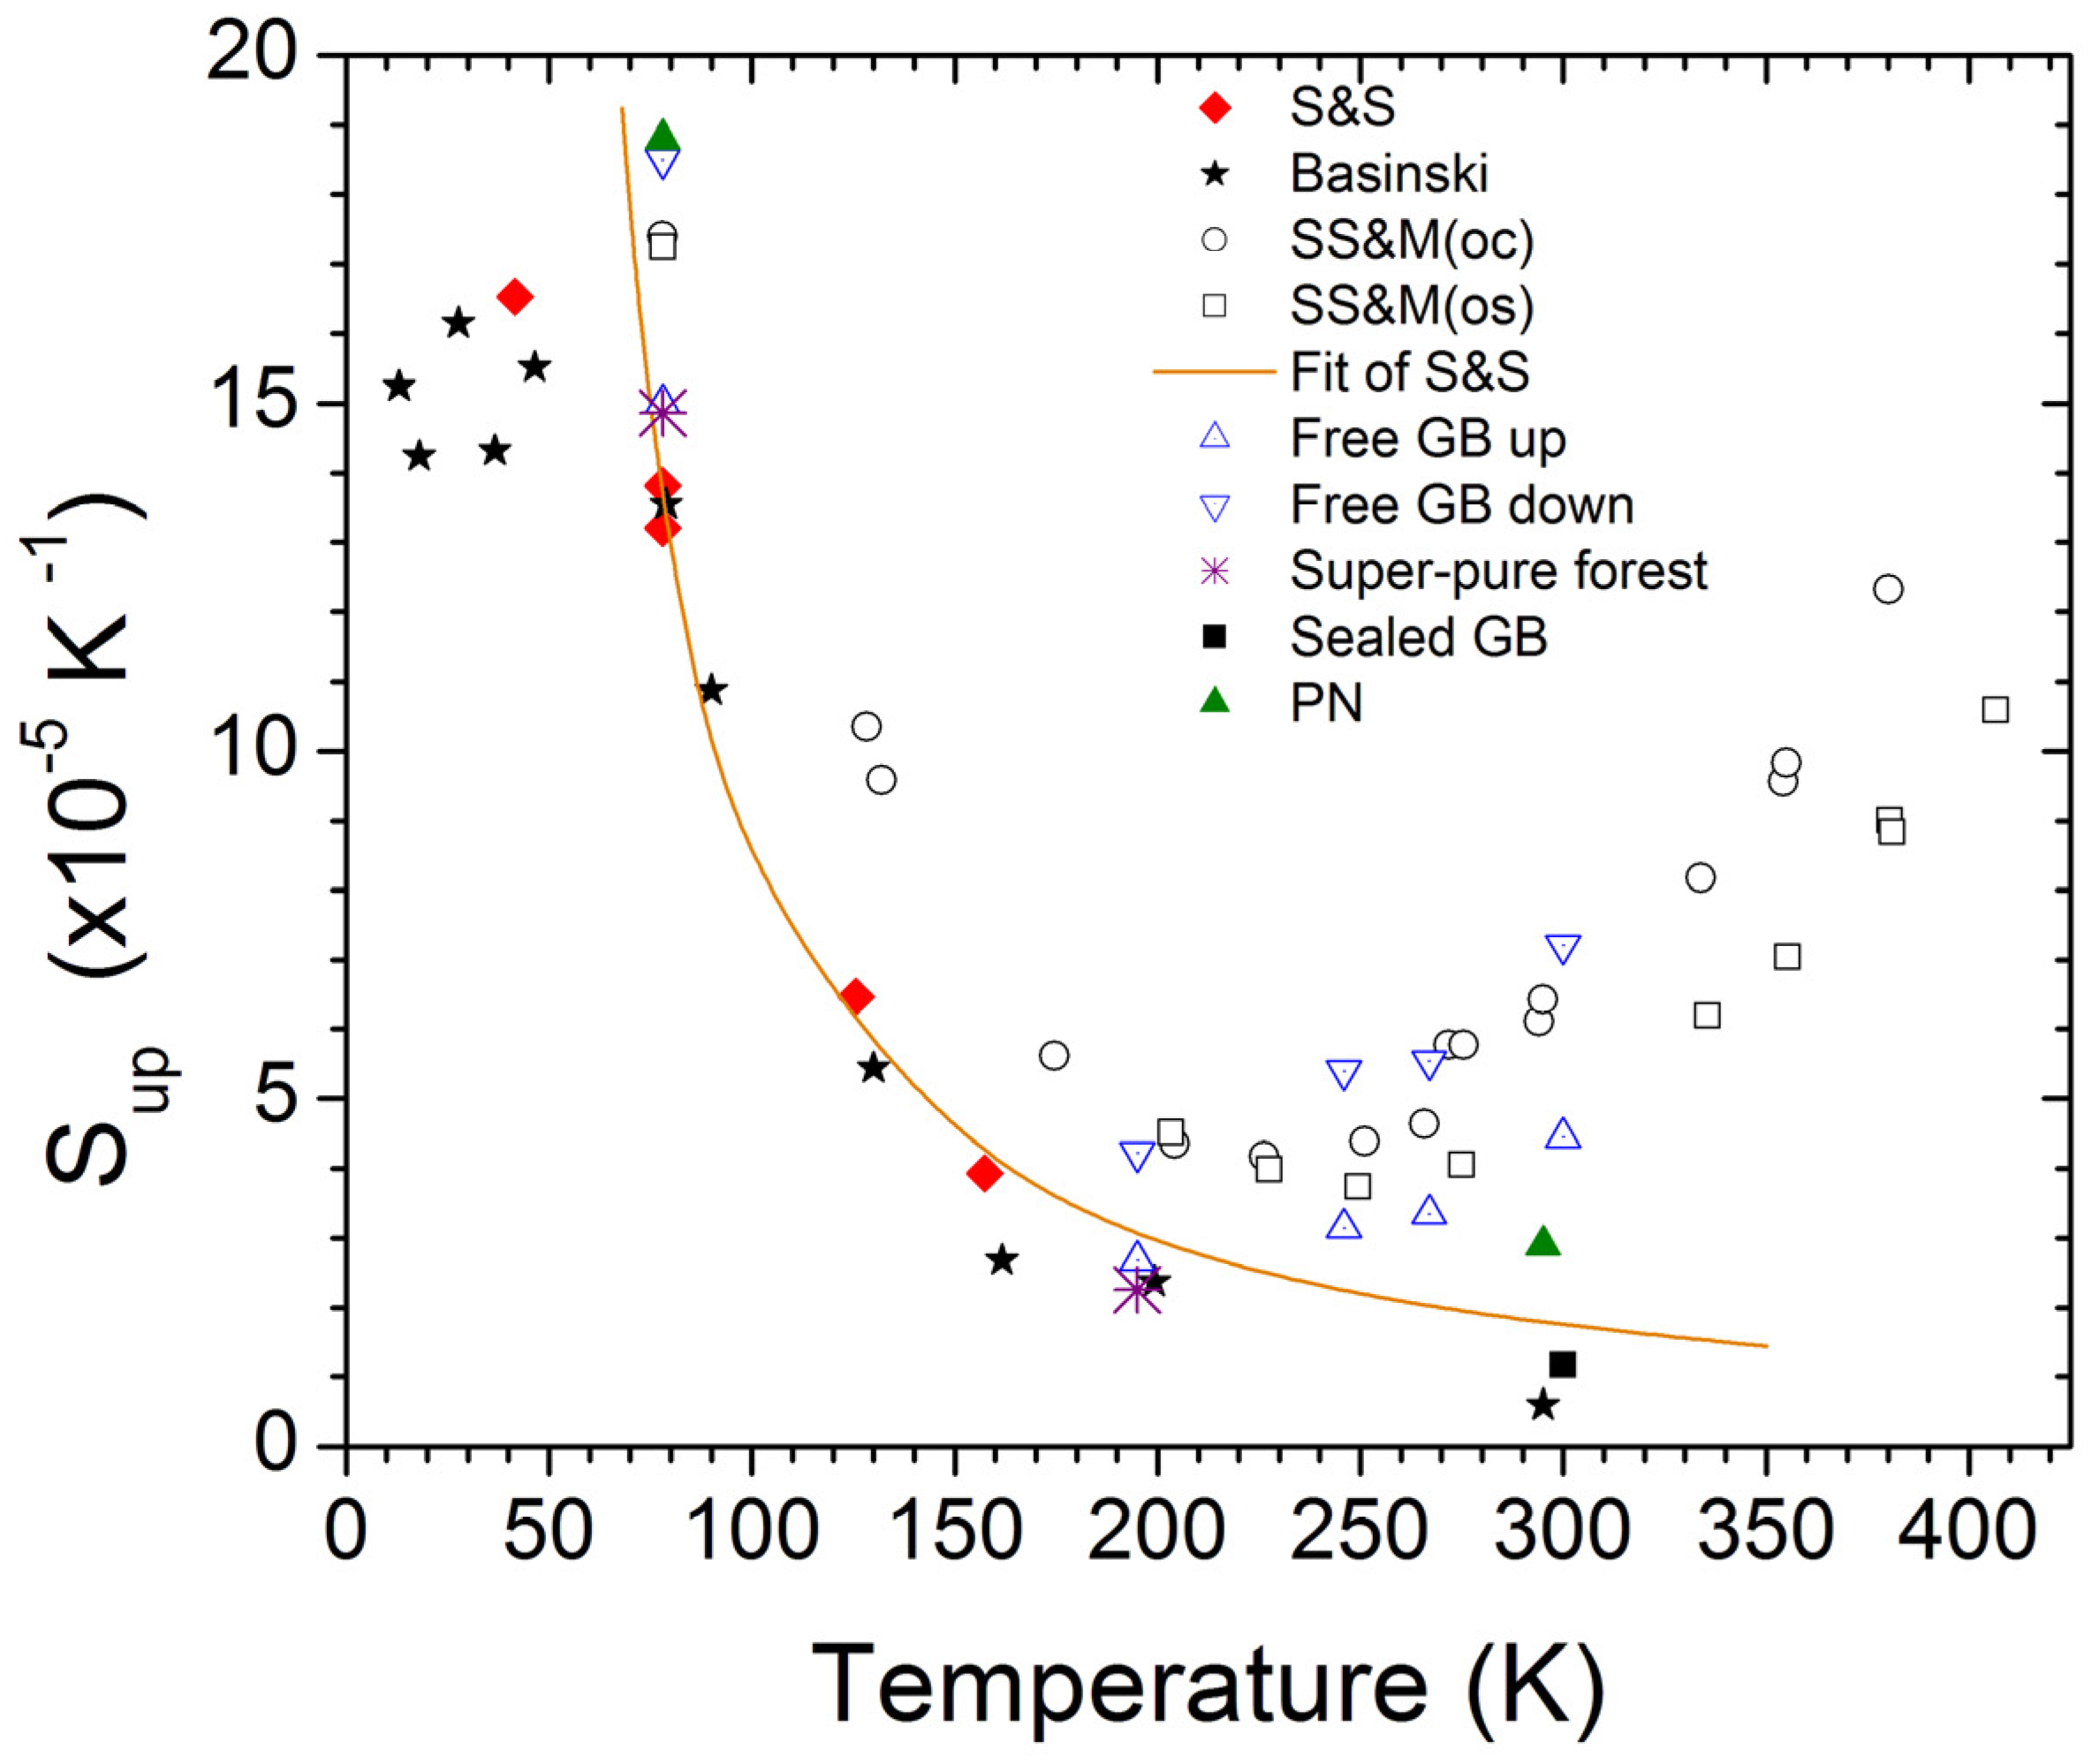
5.2. Overview Listing of Current Strain Rate Sensitivity (S) Results

1. Sfor was derived from the sum of constriction energy, EC, and the formation energy of vacancies, Evf, created at intersection based on entropic conditions. The difference in stress at constant k/ν between derived Sfor and Sup is attributed to the stress contribution from debris. Because the slopes, Sdown and Sup, are both linear, the creation of debris must be proportional to that of the forest dislocation. However, if the grain boundaries are sealed, the supersaturation continuously increases with strain and results in non-constant S, till nano-voids are formed. Thus, only the case of free-GB with constant Sdown will be discussed because this is the typical condition of stock fcc metals.
2. The geometrical analyses described in Section 2.3 resulted in derived Sdown to be within 2% of the measured Sdown indicating that the derived values of Sdebris are good estimates.
3. The character of the debris due to jog dragging depends on its height and hence on the mechanism which created the jog. Initiation of Stage III due to stress activated cross-slip results in double cross-slip and the formation of wide loops which primarily make up the debris. On the other hand, jogs formed at repulsive and attractive intersections tend to be unitary or short jogs to form vacancies and/or narrow interstitial or vacancy dipoles. Thus, the kinetics of intersection of these products will vary depending on its precise geometry. At 195 K, the activation work for debris of super-pure Al is 0.97 eV compared to 0.54 eV for the less pure free-GB specimen indicating that purity of the matrix becomes a factor above 78 K. This phenomenon was evident in Figure 14 whereby the prior work with less pure Al exhibit larger S below 220 K, that is lower activation work. The ambiguity in quantitative analyses results because the efficiency of GB sinks must depend not only on available Fe solutes but on the specifics of the GB structure, that is the texture of the crystalline aggregate.
4. Near 300 K, Figure 14 shows that super-pure Al exhibits a lower S than the less pure cases, but it is larger than that for sealed-GB after formation of nano-voids. On-going study suggests that this effect is real and is due to the formation of SFT in super-pure Al at 300 K.
5. The derived Sfor and Sdebris are tabulated in Table 4 and plotted as function of T in Figure 15. At 220 K, the Sfor value for sealed-GB are similar to that for free-GB. However, Sdebris for sealed-GB is less than that for the free-GB case indicating that impurities affect the activation work of debris intersection more severely than that for forest dislocation. The observation of Sfor versus T supplemented with that of Sup for sealed-GB (Figure 14) after formation of nano-voids indicate that ∂Sfor/∂T is negative in accord with the thermodynamic analyses in Section 2.2.
6. The role of vacancy supersaturation was demonstrated using Figure 11 whereby the initial retention of vacancies due to non-existence of sinks gives rise to increasing supersaturation with strain. However, at a critical CV, new sinks form at other than at semi-coherent particles, such as Fe solute clusters, and S abruptly decrease. Thus, for high-strain modelling purposes, m beyond γ3 should be used.

5.3. Categorization of Debris for Lattice Defect Identification

The creation of defect species during fcc crystal deformation has been directly observed from in situ deformation studies [30] and quasi-static observation by TEM and such observations have been summarized by Niewczas [50]. The analysis is a function of the size of debris which is dependent on its creation process. Dipoles can be separated into two categories of narrow and wide; narrow implies that the dipole height, hdipole, is below the critical one wherein the core of the dipole arms become indistinguishable, and the minimum would be a row of vacancies or interstitials. In contrast, wide dipoles imply that each arm can be independently intersected. Wang et al. [51] have examined annihilation of narrow edge dislocation dipoles in Al by nucleating small SFT near or above Tpipe and their subsequent growth as vacancies become available. On the other hand, SFT can be created by dislocation interaction [52], and according to Osetsky et al. [53], it is the prime source in deformed structures. These authors examined by molecular dynamic simulation the intersection of SFT by a total dislocation and found basically two types; first, wherein the SFT was sheared with or without atomic ledges with no change in the glide dislocation or second, SFT with stable ledges and jog-like changes in the glide dislocation. Thermal activation during these intersections were not discussed, but the study of Niewczas and Hoagland [54] have found that the interaction of the leading Shockley partial with the edge stair-rod dislocation (δγ) of the SFT is compressive suggesting that the activation distance is directly related to the Burgers vector of the stair rod. Moreover, such intersection would be insensitive to the size of the SFT and constancy of S maybe maintained. For these reasons in the foregoing only the simple model of shearing of SFT will be considered wherein before and after scenario are similar except the glide dislocation is now located on the opposite side of the SFT [53]. Constancy of Sdebris with strain being 42.0 ×10⁻⁵ K−1 for super-pure and 34.3 × 10⁻⁵ K−1 for free-GB at 78 K suggests a geometric simple intersection.
At 78 K whereby vacancy movement is not expected, the ratio of Sdebris/Sfor is about 2.8 (Table 1) which implies that the activation work for the debris is less than that for forest. The question arises whether this condition is true if the debris were SFT. To examine this notion, S of the super-pure Al in the pre-strain range prior to 0.2% yield stress was examined and although the data points were few, it was about 40 × 10−5 K−1 for the 80 °C annealed specimen (Section 3) and about 32 × 10−5 K−1 for the 60 °C one. These magnitudes are in good agreement with the Sdebris values. Note during percolation, the number of dislocation-SFT intersections per unit length increase due to decrease in the Friedel length resulting in constant SSFT. Thus, it can be concluded that SFT exhibit SSFT > Sfor.

5.4. Characterization of Activation Work for Super-Pure Al at 78 K and 195 K

The relation, α (d/b) = τ ν/(µb3) from Section 2.1 was used to characterize the defects from the measured activation work and are listed in Table 4. At 78 K, τν for debris was 0.205 eV compared to 0.58 eV for forest dislocation. Thus, for the forest calculation τν/(µb3) = 0.108 and d/b was taken as the constriction limit of 0.25 to result in αfor = 0.108/0.25 = 0.43, very close to 0.40 used in prior study [10]. Thus, the forest value for α of Al was fixed at 0.4 in the foregoing. In the debris case, the presumption is that debris is a product of plastic flow either by jog dragging leading to narrow dipoles or by double cross-slip process leading to wide dipoles or loops during Stage III [37]. The intersection of dipoles by a gliding dislocation can be two-fold. First narrow dipoles can convert to faulted dipole structures which simulation showed to be a sequence of ultra small SFT’s [51]. In such structures, the activation distance will be different from that of forest intersections due to the change in Burgers vectors. Molecular dynamics simulation studies of interaction between faulted dipoles lying on parallel planes to the gliding dislocations resulted in dipole drag [55] and that of intersection with SFT by Osetsky et al. [53] lead to shearing as will be described in Section 5.3.
For the sake of clarity, the intersection of dipoles with heights hdipole many times larger than the dislocation width will be discussed first. Such a case is that of dislocation intersecting prismatic circular loops lying on the {110} planes along the diameter to produce two jogs of opposite signs as examined by Foreman and Makin [23,24]. They found that the controlling barrier was the formation of jogs and not the resistance of strain field leading up to intersection. The derived α-value was 0.33 and independent of the loop size or whether it was vacancy or interstitial type. The strength was very sensitive to the intersection location on the loop; that is 0.33 was the upper limit. It is noted that for elongated loops or dipoles found during work-hardening as in the current work, the geometric issue is minor. Because Foreman and Makin showed that jog formation is the basis for strength of dipoles, the formation of jogs in loops, debris and faulted dipoles were considered.
Although no vacancies were created by the repulsive intersections at 78 K, jog formation and subsequent dragging would have occurred, and wide dipoles would be formed in Stage III [37]. The structure of wide dipoles is approximated as shearing two dislocation cores of unit length. Based on geometrical construction [56], the dislocation core is about 1/3 vacancy and hence an upper formation energy limit is 2/3 × 0.65 eV = 0.43 eV < 0.58 eV (EC). The controlling barrier strength would depend on the dipole height because if hdipole is a few b’s, the dislocation cores lose its identity and the intersection barrier will be larger than that of a single identifiable dislocation core, that is 0.43/2 = 0.22 eV. For wide dipole, by inputting α = 0.33 [23,24] into α (d/b) = 0.0383, d/b becomes 0.116, lower than that for constriction of 0.25. On the other hand, by reversing the process, intersection would be similar to that of two parallel forest dislocations of opposite signs and using the lower limit d/b = 0.25, the maximum α for wide dipoles becomes 0.15, compared to α = 0.4 for forest. If a lower α of 0.10 is used, d/b = 0.383. Subsequent calculation based on compatibility with flow stress criterion will show that the lower α or larger d/b is indicated. Intersection of dipoles geometrically means that the gliding dislocation encounters first the repulsive arm of the dipole at which the limiting d/b = 0.25 at 78 K, but the stress to overcome this barrier is assisted by the attractive force of the second arm, resulting in the reduced α. For the reverse situation a similar effect is envisaged whereby upon intersection of the attractive arm, the glide dislocation is opposed by the second arm of the dipole.
Noting that d/b at its athermal limit is geometrical, for faulted dipoles, the partial dislocations being intersected would tend to be of stair-rod type. In Table 4 of Saimoto [10], Burgers vectors (b1) for stair-rod dislocations were listed. According to Andersen, Hirth and Lothe [43] the 1/6 <123> with b1 = 0.815 b is unstable and the largest stable b1 = 0.745 b, whereby b is the Burgers vector of ordinary dislocation in fcc matrix. The central question is to deduce the activation distance, d. Taking an analogous notion from total dislocation that minimum d is b/4, the analogous dstair would be b1/4b as was assumed earlier [10]. However, as noted in Section 5.3, shearing of SFT are complex and to define the activation distance dstair one needs to keep in mind that stair-rod dislocation exists to accommodate misfit whenever two stacking faults meet. If the energy barrier is symmetric then the minimum dδγ would be ½ the stair-rod Burgers vector, b1. The smallest b1 is that for δγ type at 0.333 b. Thus using ½ (0.333b), αδγ = 0.0383/(0.333/2) = 0.23. On the other hand, using ½ (0.745) results in α = 0.10. The ambiguity results because d can be b1, the outer limit, rather than ½ b1 and if so, the α would be ½ of the above values. Hence, as will be discussed, if the experimental derived value is 0.1 or less, then b1 > d > 0.5 b1. Experimental SFT observation show that geometrical structure comprise of a tetrahedra bounded by δγ type stair rods and if d = bδγ, then αδγ = 0.0383/(0.333) = 0.11. Thus, the above evaluations indicate that for wide dipoles α is <0.15 and for SFT < 0.11, suggesting that identification of debris type from Sdebris may not be possible without further studies using molecular dynamics to calculate the energy barriers. Hence, although existence of wide dipoles is experimentally validated, its obstacle strength can only be indirectly assessed using in situ observations. On the other hand, SFT are not readily observable without using high resolution TEM and making density measurements. Both these experiments are very challenging. However, it is noted that Sdown from which Sdebris is derived is constant with strain suggesting that the defect type do not change with strain except when the sinks are sealed, and an equilibrium supersaturation of vacancies may not be achieved.
Comparative values at 195 K were found to be τ ν = 3.83 eV for forest versus 0.973 eV for debris wherein for repulsive intersection d/b increases with temperature. Thus, the intersection of the repulsive arm of the dipole d/b will be larger than at 78 K. For the debris using α (d/b) = 0.194, the lower bound for d/b = 0.194/0.4 = 0.485. Assuming that α is insensitive to temperature, from those determined at 78 K, using 0.15 would result in d/b = 0.194/0.15 =1.29 which is lower than d/b = 1.91 for forest dislocation at 195 K. To calculate the minimum α for debris, the use of forest d/b =1.91 results in the lower bound for α of 0.10 which is the same as derived for faulted loops. Therefore, the obstacle strength ranges between 0.4 > 0.15 > αdebris > 0.10. These calculations indicate that wide dipoles and faulted dipoles result in similar α values. In order to determine obstacles strength independent of the Haasen plot data, we invoke the basic flow stress relation.
The procedure to evaluate the operational αdebris follows the model of Foreman and Makin [23,24] in which the calculations were made assuming random distribution of two obstacles assuming the density ρ = ρfor + ρdebris and the flow stresses were also additive with the flow stress ratio τdebris/τ = fdebris. Hence, from the flow stress relation,
α√ρ = αfor √ρfor + αdebris √ρdebris
and using αdebris √ρdebris = fdebris α√ρ and αfor √ρfor = (1 − fdebris) α√ρ,
(√ρdebris /√ρfor) = (αfordebris) {fdebris /(1 − fdebris}.
From the above relations the operational α can be derived using the values for 78 K of αfor = 0.40; fdebris = 0.122 and selection of αdebris = 0.10 results in αderive = 0.398 with relative density of 23.6% in accord with the model whereby small amounts of weak obstacles do not measurably reduce the flow stress. From Figure 4 of ref. [23,24], to reduce the flow stress by 10% requires a relative density decrease of about 30%. Hence, it is concluded that the evaluation is reasonable for either wide dipoles or SFT. However, debris formation occurs at σ3 which suggests that the primary contribution is due to wide dipoles formed during Stage III with αdebris = 0.10 at 78 K for super-pure Al. Moreover, growth of SFT would be limited until Tpipe is attained [51].

5.5. Characterization of Activation Work for Free-GB Al at 78, 195, 246, 267 and 300 K

At 78 K, the activation work of 0.55 eV for forest and 0.25 eV for debris correspond well with those for super-pure Al as indicated in Table 4. However, at 195 K, (τν)debris for the less-pure Al is 0.54 eV compared to 0.97 eV for super-pure Al. This difference has been attributed to the role of Fe solute during pipe diffusion. The conjecture is that with the presence of Fe solutes, the atomic motion within the core is more restricted than without solutes and NV in the activation process is reduced to 4 from 5. However, it will be presumed that α is not very sensitive to this effect. The other notable aspect is that Sfor appears to become constant between 220 K and 267 K implying that d/b lies between 1.5 and 1.3 using α = 0.4. On the other hand, Sdebris average for 246 K and 267 K is 23.8 × 10⁻⁵ K−1 corresponding to 0.362 eV resulting in α d/b = 0.0771. Thus, using α = 0.1, d/b = 0.771 which is about half of that for forest. In Table 3, the ratio τνfor/τνdebris for 246 to 300 K is near constant at 6.8 indicating that the debris type does not change over this range. It is noted that inception of di-vacancy (200 K) and vacancy (250 K) mobility can contribute to vacancy dipole transformation into faulted loops [51] that offer more resistance than rows of vacancies, but the magnitude of α is below 0.1 [49]. A second consideration is that fdebris was kept constant at 0.10 and hence the flow stress criterion examined above would apply which suggests that αdebris selection would be 0.10 or lower. The deduction is that both wide dipoles and SFT are present, but their obstacle strengths are similar and hence differentiation between the two are currently not possible.
The precision of the activation work is dependent on the accuracy of 1/ν which may vary by +/−5% and would not affect the above deduction. Hence, within these limits, if activation work is constant over a temperature range, activation work becomes equal to the activation energy; that is about 0.36 eV to overcome the debris barrier. To demonstrate that the derived energy value is reasonable, the core energy for a total dislocation can be estimated. Using average µ = 32,574 MPa, the energy for unit length of dislocation is ½ (µb3) = 2.39 eV wherein if the energy of the core is about 1/10 of the total, the core energy is about 0.24 eV, wherein for a wide dipole it will be 2 × 0.24 = 0.48 eV. Thus, considering the approximations invoked, the energy magnitudes of the measured ones with the presumed model from theory are comparable. The above analyses assume that Sdebris is due to dipoles acting as obstacles whereas the kinetics may be due to dislocation drag. One such case is vacancy jog dragging whereby d/b = 0.5 in which case at 246–267 K range, α = 0.0771/0.5 = 0.154 which is larger than 0.1 suggesting its presence can be discounted. Another reason for this mechanism not being operable is that debris generation initiates at σ3, whereas jog dragging would occur beyond yielding. Hence, dipole formation due to double cross-slip is concluded to be the dominant mechanism with contribution from SFT. As noted in Section 3, SFT can form during rolling below 240 K and subsequently age at 300 K. For the purpose of modelling mechanical property predictions, these quite different mechanisms may not be an issue except in predicting ductile failure wherein the number count of vacancies generated becomes a prime factor.

5.6. Jog Dragging Due to Repulsive and Attractive Forest Intersections

The possible types of defects formed due to dislocation intersections have been categorized for all possible intersections [1] but for the current purpose depending on the crystal orientation there are two basic types based on the Burgers vectors, 60–120° and 90° ones. The latter are primary-critical slip system intersection whereby screw-screw intersection result in vacancy-creating jog in each dislocation. This jog dragging effect was discounted in the above discussion. Cottrell [57] surmised that under dynamic situations there will be more interstitial producing repulsive intersection than attractive ones. However, under a stationary forest model this criterion need not apply, and attractive and repulsive intersections are equally likely. For Al above TC = 69 K [10], the activation work for repulsive junctions increases with temperature due to vacancy creation whereas this geometrical condition does not apply for attractive ones implying reduced strength and smaller contribution to the flow stress. This observation indicates that contribution of attractive junctions to the flow stress is best assessed at 78 K wherein from Stage II estimate, it is less than 10% of the repulsive intersection. Hence, at equal density, the unzipping force of attractive junctions is much less than that of repulsive intersection. This deduction implies that α derived from dislocation density experiments will underestimate the controlling α because the observed density will not be limited to repulsive intersections. In prior work, it was discussed that α for work-hardening in Cu should be near 0.6 rather than 0.4 [20]. Hence, future work needs to consider this prediction. For these reasons, it is concluded that the flow stress is mainly due to forest of repulsive junctions supplemented by debris at stresses higher than σ3. The calculation of CV [38] is based on the number of possible dislocation intersections, a fraction X of which produces vacancies. Thus, it encompasses both jog dragging and repulsive junction creation of vacancies. The cause for vacancy creation at repulsive interaction is attributed to reduction of enthalpy in the high elastic compressed zone by the formation of vacancies to increase local entropy. Hence, the number created is a function of temperature.
Jog dragging can produce either vacancies or interstitials and it reverses if the shear stress is reversed. Thus, equal number of both types exists upon deformation. The geometrical arrays were reviewed by Andersen, Hirth and Lothe [43]. The issue is to relate these ideal geometries to the real situation. Since energy for interstitial formation is many times larger than that for vacancies, rather than create interstitials, interstitial dipoles may result together with vacancy ones. Nabarro and Brown [58] suggested that occurrence of sets of interstitial and vacancy dipoles in close proximity could interact to convert interstitial ones into vacancy type. Such mechanisms imply that the debris encountered by glide dislocations are primarily vacancy dipoles. Since debris formation is found in Stage III whereby double cross-slip become initiated, dipole height hdipole [37] are many multiples of b. However, since at 78 K the activation work is about 0.2 eV, 1/3 that for forest dislocation, jog dragging may produce dipoles with only a few b’s in height. At 4.2 K, it was surmised that narrow vacancy dipoles can convert to faulted dipoles and/or SFT as modelled by Wang et al. [51]. Although similar conversions may occur at 78 K, the above examinations indicate that the rate-sensitive debris are wide dipoles formed during Stage III because SFT growth, if possible, will be limited.
On the other hand, at 195 K, cross-slip occurs when the slip-plane spacings are larger such that dipole formation from double cross-slip [37] would result in geometric identifiable dislocation pairs to form the dipole. At 247 K to 267 K in the free-GB specimens, the activation work for intersection of debris becomes nearly constant at about 0.36 eV, suggesting that the activation energy for jog formation in wide dipoles is 0.36 eV. A second source of debris was proposed by Fugita [59] based on in situ observations of dipoles and loops formed by double cross-slip mechanism in thin-foil deformation of Al. The envisioned mechanism is similar to that proposed recently [37] whereby double cross-slip generates long jogs. According to the Fujita model, two multi-jogged dislocations on the same slip plane with opposite signed Burgers vectors annihilate as observed at 300K. Thus, the coplanar annihilation mechanism proposed to account for dynamic energy loss [37] means that aside from stranded vacancy population, loops become widely distributed as debris. Fujita suggested that loop clustering leads to cell wall formation. The present statistical results are in accord with the mechanisms indicated by the in situ TEM evidence. A subtle point should be noted however, with increasing T, growth of SFT occurs inferring that if d changes with SFT size then its proportional contribution to total Sdebris will change resulting in its increase from 267 K to 300 K as indicated in Figure 15.
The above deductions are supported by recent results based on normalized activation work as illustrated in Figure 7 of ref. [10], that suggests that primary source of work-hardening is due to repulsive intersection that entail vacancy creation at each site. Attractive intersections, on the other hand, do not entail large volumes of high elastic energy since short locks can form. Such locks can be unzipped to produce jogs and hence the energy is that of jog formation. In the case of Cu with a much lower γSF than that for Al (45 versus 166 mJ m−2) the jog energy is about 0.86 eV [60]. Accounting for the differences in γSF and µ, the derived jog energy for Al becomes 0.13 eV. This estimate is only about 1/3 of the measured value of 0.36 eV suggesting formation of two jogs, that is 0.26 eV, one for the forest and the second one the gliding dislocation. If the core energy is about 0.1 of the total energy, it becomes 0.27 eV and smaller than EC of 0.58 eV. According to Hirth and Lothe [52], the activation distance, d, for vacancy creation at a jog is constant at 0.5 b. The deduction is that whereas the repulsive activation work increases with temperature due to increase in d, for jog dragging d remains constant and hence activation work becomes constant. The constant S at T < TC was 14.9 × 10⁻⁵ K−1 and previously it was determined that d/b = 0.25 for constriction using α =0.4. If, on the other hand, it is assumed that S is due to vacancy jog dragging wherein d/b = 0.5 [52] then α for attractive jogs will be about 0.21. Another estimate is that at 0 K, the activation work for vacancy creation, τν = 0.65 eV = Evf. Hence, α is about 0.24 and less than 0.4 attributed to repulsive intersection. These deductions infer that a self-consistency exists in the PSRS data analyses of Al supporting the conclusion that flow stress is primarily due to repulsive forests supplemented by about 10% due to debris formation at higher strains. These deductive calculations for Al indicate that the obstacle strength of attractive intersections is less than that for repulsive and that for dipoles/loops, αdebris, is about 1/4 that for repulsive forest, αfor, as presumed in Table 4.

5.7. Role of Repulsive Intersection on Nano-Void Formation and Recovery

The S versus T plot in Figure 14 clearly shows that recovery in various forms take place between 200 K and 300 K. The recovery after decrease in strain rate were described in detail elsewhere with the derived activation energies [33]. To illustrate the effect of dynamic recovery during continuous deformation, as reported previously [45], the plots of the ratio λ/ℓ, mean slip distance λ divided by inter-forest spacing ℓ, versus shear strain γ are shown in Figure 16. The notable aspect of this parameter is that it is independent of α. For these tests, standard ASTM (E8M-04) specimens were prepared from as-received sheet of AA1100 and specially heat-treated to result in “free-GB” state and tensile tests were performed in an Instron screw-driven machine at 0.0002, 0.002, 0.02 and 0.2 s−1. The plots manifest drag peaks due to deformation-debris at 296 K. Aside from the observed anomaly at 0.0002 s−1 that is attributed to a change in drag mechanism, the peak strains tend to increase with strain rate. At the highest strain rate, the peak is absent, indicating that the mean slip velocity λ ˙ is beyond the drag profile zone. Such tests as a function of temperature indicated that the derived activation energies correlated with vacancy and di-vacancy migration energies [42]. Because formation of nano-voids is complete beyond γ = 0.3 at 300 K, nano-void growth occurs at an accelerated rate due to creation of about 10 vacancies at each intersection site. However, the number per unit volume of nano-voids is determined by the start microstructure and is constant such that as the forest spacing decrease below this scale, dynamic pinning can start to operate as evident from Figure 16. Nevertheless, these micro-plastic kinetic reactions are encompassed in the constitutive relation if the temperature and strain rate are constant [6,10] such that the fit parameters can be used to identify the microstructural effects. The present study has demonstrated that bulk properties are direct manifestations of microplastic kinetics. Thus, the increase in S or m above 300 K as shown in Figure 14 must relate to ease of creation of vacancies as T increase reducing the required NV number and in turn the activation work. One such mechanism is dislocation climb acting as vacancy sinks which were not detected at lower temperatures [31].

5.8. Role of Attractive Junctions in Work-Hardening

A new assimilated model of work-hardening of fcc metals mainly based on continuous tensile test results of super-pure copper was recently proposed by Saimoto et al. [12,37]. The parameters to replicate the measured stress–strain response are dynamic in nature and results in a constitutive relation characterized by two power-law fitting curves the intersections of which were designated by τ3 and γ3, τ3 correlate to (σ3/M). The initiation of τ3 was attributed to the formation of cross-slip nuclei in screw dislocations at jogs formed by attractive intersection. The new aspect of this model was that dynamic dislocation annihilation took place by coplanar annihilation since slip takes place by patches of λ2 leading to stranded vacancy density if vacancies were created at every intersection site. During initial strain hardening of Stage II, only mono-pole dislocations are generated on various slip planes which did not connect with each other till the spacing became sufficiently short to initiate the cross-slip mechanism which is stress-temperature activated; the nuclei of which occurs upon attractive intersection of screw dislocations [37]. During Stage II, the increase in forest density is due to slip on second and third slip planes intersecting the primary one. The initiation of cross-slip permits double cross-slip which allows interaction between slip planes and permits extended expansion of dislocation lengths enabling multiple slip on any given plane leading to a change in dislocation array from that of random to a cellular structure. It has to be kept in mind that attractive junctions become repulsive to negative Burgers vectors and their presence is a prerequisite for Stage III deformation. On the other hand, if thermal energy is too low to activate cross-slip nuclei from attractive intersection, at sufficiently high stresses at cryogenic temperatures, athermal cross-slip can occur at jogs in screw dislocations formed by repulsive intersections [37]. The conjecture is that local availability of a vacancy prevents the formation of athermal cross-slip nuclei; a condition which vanishes when NV becomes zero and athermal cross-slip initiates, as found for Al at 4.2 K [10]. The constant Haasen slope S in Stage III indicates that the obstacle types being generated do not change with strain; that is the operative α remains near constant with strain. The correlation of micro-plasticity revealed by PSRS and macro-plasticity parameters from constitutive relations analyses suggest that this method can be used to decode/diagnose the stress–strain diagram in other fcc metals and alloys.

6. Conclusions

1. The rate controlling process as characterized by strain rate sensitivity creates vacancies at each activation site once the activation work attains {EC + NV Efv} and NV increases with test temperature. It is concluded that the intersection of repulsive dislocations can result in this observation wherein the activation volume is large compared to that of attractive processes that completes the intersection by unzipping. However, a model of dislocations with opposite signs shows that the repulsive ones will become attractive if the reverse flow of dislocations with negative Burgers vector is considered [12]. Thus, the total dislocation density would comprise of equal amounts of repulsive and attractive intersection as geometrically required and experimentally validated [12].
2. The core-core intersection with forest dislocation is dependent only on the constriction energy and relatively insensitive to temperature except through the temperature dependence of the shear modulus. Thus, as found by Foreman and Makin in their modelling intersection of prismatic loops, the energy of intersection is governed by the formation of jogs rather than the elastic interaction of the dislocation cores prior to intersection as usually assumed [61]. However, the creation of vacancies is not considered in the assessment of force distance curves for fcc metals leading to greater complexity of such calculations.
3. The role of vacancy supersaturation was amplified by using specimens in which the sinks in the grain boundaries were sealed such that transport by pipe diffusion could not occur and the supersaturation magnified such that constant S was not observed and its increase correlated to the decrease of activation work till the supersaturation reduced to near equilibrium by the formation of nano-voids whereby NV at that temperature was re-established. However, the vacancy supersaturation was highly compromised by the presence of Fe solutes which can retard pipe diffusion or act as clustering points for vacancies reducing the supersaturation or presence of Al6Fe in the start material to act as nano-void nuclei. Hence, the effect of Fe solutes would vary from one coil of stock sheet to another. The inference was that vacancy supersaturation acts as a compressive stress to effectively reduce the applied stress and hence results in decreased activation work. The implication for modelling purposes is to use the m determined at strains wherein nano-voids had formed to maintain m constant.
4. The method to separate the Sfor from Sdebris was validated by showing that the derived Sdown agreed with the measured Sdown at all test temperatures. Hence, the constant Sdebris over the range 220 to 280 K suggests that the activation energy for debris intersection is 0.36 eV. Moreover, the constant Sdown suggests that the prime defect specie that comprise the debris are dipoles formed during cross-slip. However, these dipoles may become faulted as vacancy supersaturation increases. Dipole drag [55] is possible at higher strains leading to drag peaks in Figure 16. At 78 K, the debris activation energy was 0.20 eV for super-pure Al and 0.25 eV for free-GB specimen which means that the dipoles are narrower than at higher temperatures since τ3 for cross-slip are larger.
5. Jog dragging results in narrow dipoles which may convert to faulted defects like SFT that can grow depending on temperature. The ratio of dipole loops formed from double cross-slip to that of SFT as function of temperature could not be assessed in this work. Nevertheless, TEM evidence [50] suggests that the density of wide dipoles is comparable to that of forest dislocations and would be the prime contributor to debris strengthening, that is about 10% of the flow stress. A second source of loop formation is by coplanar annihilation of jogged dislocations. Since annihilation accounts for over 90% of expended work, debris formation from this mechanism would be large and correlates to initiation of Sdebris at σ3 in the Haasen plot.
6. In this study the role of vacancy supersaturation in recovery and its effect on strain rate sensitivity and formation and growth of nano-voids was demonstrated. Depending on the specific Al alloy, the degree of supersaturation will become highly variable around 300 K, where typical laboratory measurements are made. The decrease of activation work (increase in S) as T increase above 300 K in Al suggests that either vacancy supersaturation is increasing, or the constriction energy EC begins to decrease. PSRS experiments needs to be extended to cover this T range to delineate the possible causes.

Author Contributions

Conceptualization, S.S.; formal analysis, S.S. and B.J.D.; resources, S.S., B.J.D. and M.N.; data curation, S.S. and B.J.D.; writing—original draft preparation, S.S. and B.J.D.; writing—review and editing, S.S., B.J.D. and M.N.; funding acquisition, B.J.D. All authors have read and agreed to the published version of the manuscript.

Funding

B.J.D. acknowledges support from NSERC Discovery Grant.

Institutional Review Board Statement

Not applicable.

Informed Consent Statement

Not applicable.

Data Availability Statement

Data is available upon request.

Acknowledgments

The authors thank the Natural Sciences and Engineering Research Council of Canada for many decades of support to elucidate the basic crystal plasticity mechanisms to result in structure-strength-ductility relations. This work is dedicated to the memory of Z. S. Basinski who was our mentor for precision strain rate sensitivity technology (S.S.) and for dislocation intersection simulations (M.N.). The current study would not have been possible without the advent of PSRS (S.S. & B.J.D.) and the SAXS analyses developed by Marsha A. Singh of Queen’s University to validate the formation and growth of nano-voids during plastic flow. These statistical methods supplemented by vast quasi-static TEM observations (M.N.), high resolution TEM to image nano-voids by Graham Carpenter of CANMET and more recent molecular dynamics studies have elucidated the direct relation between micro-plasticity and bulk deformation processes.

Conflicts of Interest

The authors declare no conflict of interest.

Appendix A. Activation Work-Based Derivation of Flow Stress as Function of Strain-Rate

The rate of doing work was re-expressed as a function of τν to show that constitutive relation of thermally activated plastic flow during continuous generation of identical obstacles results in a power law form. Differentiating τν with time, t, using running derivatives [20],
W ˙ t = t ( τ V ) γ ˙ v
and the resultant double differential
W ¨ = γ ˙ v ( τ v ) t + τ v γ ˙ / v t = τ γ ˙ λ ˙ λ β 1 + 1 m = W ˙ λ ˙ λ β 1 + 1 m
suggests that the solution to W ˙ is in exponential form. One solution is
W ˙ = λ ˙ 0 exp 1 + 1 / m β ln λ = λ ˙ 0 · λ 1 + 1 m / β = τ γ ˙
where λ ˙ 0 is an integration constant. Using λ = C1τβ,
τ = 1 λ ˙ 0 m 1 C 1 ( m + 1 ) / β γ ˙ m
whereby it becomes identical to Equation (A1) by using
1 λ ˙ 0 m = K S VH C 1 m + 1 β γ 1 2 + β
Hence, Equation (1) can be reformed into an advanced form of the Hollomon relation as
σ = σ 0 + H S VH ε ˙ m ε n
In this form, all the fit parameters can be determined from the CRA of the tensile data and m from the Haasen plot.

Appendix B. Thermodynamic Description of Instantaneous Strain-Rate Change

The activation work, τ ν = (αμb/ℓ) (bℓd), may be expressed as force times activation distance, (τbℓ) × d. This relation is kinematically represented in Figure A1(a). The magnitudes of the plot are arbitrary except that the shaded areas, the available thermal energy at the given strain rate for strong obstacle type 1 and weak obstacle type 2, are equal at the equilibrium flow shear stress τ wherein τ = τ1 + τ2, at constant strain rate and temperature. For this demonstration, τ1 = 0.9 τ and τ2 = 0.1 τ such that a change in flow stress by ∆τ follows the same rule. The force is a function of α hence a unit force change on type 1 obstacle results in (α12) (0.1/0.9) on type 2.
In Figure A1(b), the ∆τ increase on type 1 decreases the available thermal energy that in turn increases the probability of activation to accommodate the increase in strain rate. Simultaneously a change occurs on type 2 as shown but the increase is insufficient to attain τ2yield and intersection of weak obstacles are not registered till the flow stress increases. Hence, S of only strong one is measured. For the reverse case whereby the strain rate is decreased to result in −∆τ on type 1 obstacle as shown in Figure A1(c), the accompanying decrease on type 2 obstacle is insufficient to reduce the activation rate to that required at the new down-strain rate. In order to reach that state, -∆τ needs to be increased resulting in Sdown > Sup, as observed.
In the real case, the shape of the force distance profile will be not geometric simple as used in this illustration. Although the precise values of (α12) and (τ21) are indeterminate, this demonstration shows the thermodynamic rationale for the difference in strain rate sensitivity of fcc metals due to up-rate change and down-rate change.
Figure A1. (a) Kinematic representation of force-distance energy diagram at flow stress τeq. (b) Same as (a) with increase of flow stress by ∆τ. (c) Same as (a) with decrease of flow stress by ∆τ.
Crystals 12 01811 g0a1aCrystals 12 01811 g0a1b

References

  1. Saimoto, S. Determination of Different Combinations of Slip Systems in Face-Centred Cubic Lattice, in Appendix IV of Low Temperature Deformation of Copper Single Crystals Oriented for Multiple Slip. Ph.D. Thesis, Massachusetts Institute of Technology, Cambridge, MA, USA, 1964. [Google Scholar]
  2. Taylor, G.I. Plastic strain in metals. J. Inst. Metals 1938, LXII, 307–324. [Google Scholar]
  3. Taylor, G.I. Analysis of plastic strain in a cubic crystal. In Stephen Timoshenko 60th Anniversary Volume; Macmillan Co.: New York, NY, USA, 1938; pp. 218–224. [Google Scholar]
  4. Asaro, R.J.; Needleman, A. Overview 42. Texture development and strain-hardening in rate dependant polycrystals. Acta Mater. 1985, 33, 923–953. [Google Scholar] [CrossRef]
  5. Brahme, A.P.; Inal, K.; Mishra, R.K.; Saimoto, S. A new stain hardening model for rate dependent crystal plasticity. Comput. Mater. Sci. 2011, 49, 2898–2908. [Google Scholar] [CrossRef]
  6. Saimoto, S.; Van Houtte, P. Constitutive relation based on Taylor slip analysis to replicate work-hardening evolution. Acta Mater. 2011, 59, 602–612. [Google Scholar] [CrossRef]
  7. Basinski, Z.S. Thermally activated glide in FCC metals and its application to the theory of strain hardening. Philos. Mag. 1959, 4, 393–432. [Google Scholar] [CrossRef]
  8. Diak, B.; Upadhyaya, K.; Saimoto, S. Characterization of thermodynamic response by materials testing. Prog. Mater. Sci. 1998, 43, 223–363. [Google Scholar] [CrossRef]
  9. Proville, L.; Rodney, D.; Brechet, Y.; Martin, G. Atomic-scale study of dislocation glide in a model solid solution. Philos. Mag. 2006, 86, 3893–3920. [Google Scholar] [CrossRef] [Green Version]
  10. Saimoto, S. Deformation kinetics and constitutive relation analyses of bifurcation in work-hardening of face-centred cubic metals at cryogenic temperatures. Acta Mater. 2019, 174, 43–52. [Google Scholar] [CrossRef]
  11. Saimoto, S.; Sang, H. A re-examination of the cottrell-stokes relation based on precision measurements of the activation volume. Acta Met. 1983, 31, 1873–1881. [Google Scholar] [CrossRef]
  12. Saimoto, S.; Diak, B.J.; Kula, A.; Niewczas, M. Assimilated model of work-hardening for FCC metals and its application to devolution of stored work. Mater. Today Commun. 2022, 105115. [Google Scholar] [CrossRef]
  13. Li, J.C.M. Kinetics and dynamics in dislocation plasticity. In Dislocation Dynamics; Rosenfield, A.R., Hahn, G.T., Bement, A.l., Jr., Jaffee, R.I., Eds.; McGraw-Hill Co.: New York, NY, USA, 1967; pp. 87–116. [Google Scholar]
  14. Cottrell, A.H.; Stokes, R.J. Effects of temperature on the plastic properties of aluminum crystals. Proc. R. Soc. Lond. A 1955, 17–34. [Google Scholar]
  15. Nabarro, F. Cottrell-stokes law and activation theory. Acta Met. Mater. 1990, 38, 161–164. [Google Scholar] [CrossRef]
  16. Dorn, J.E.; Goldberg, A.; Tietz, T.E. The effect of thermal-mechanical history on the strain hardening of metals. Trans. AIME 1949, 180, 205–224. [Google Scholar]
  17. Adams, M.A.; Cottrell, A.H. Effect of temperature on the flow stress of work-hardened copper crystals. Philos. Mag. 1955, 46, 1187–1193. [Google Scholar] [CrossRef]
  18. Seeger, A. The generation of lattice defects by moving dislocations and its application to the temperature dependence of the flow stress of FCC crystals. Philos. Mag. A 1955, 46, 1521–1546. [Google Scholar] [CrossRef]
  19. Makin, M.J. The temperature dependence of the flow stress in copper single crystals. Philos. Mag. 1958, 309–311. [Google Scholar] [CrossRef]
  20. Saimoto, S. Dynamic dislocation-defect analysis. Philos. Mag. 2006, 87, 4213–4233. [Google Scholar] [CrossRef]
  21. Basinski, Z.S.; Sahoo, M.; Saimoto, S. Resistivity change with deformation of high purity Cu crystals and its subsequent recovery. Acta Metall. 1977, 25, 657–665. [Google Scholar] [CrossRef]
  22. Saimoto, S.; Diak, B.J. Advanced method for the structure-strength-ductility assessment of dispersion-strengthened FCC metals using activation work, mean slip distance and constitutive relation analyses. Mater. Sci. Eng. A 2021, 828, 142119. [Google Scholar] [CrossRef]
  23. Foreman, A.J.E.; Makin, M.J. Dislocation movement through random arrays of obstacles. Philos. Mag. 1966, 14, 911–924. [Google Scholar] [CrossRef]
  24. Foreman, A.J.E.; Makin, M.J. Dislocation movement through random arrays of obstacles. Can. J. Phys. 1967, 45, 511–517. [Google Scholar] [CrossRef]
  25. Basinski, Z.S.; Saimoto, S. Resistivity of deformed crystals. Can. J. Phys. 1967, 45, 1161–1176. [Google Scholar] [CrossRef]
  26. Saimoto, S.; Jin, H.O. Effects of Solubility Limit and the Presence of Ultra-Fine Al6Fe on the Kinetics of Grain Growth in Dilute Al-Fe Alloys. Mater. Sci. Forum 2007, 550, 339–344. [Google Scholar] [CrossRef]
  27. Saimoto, S. Detection of nano-particles by dynamic dislocation-defect analysis. J. Phys. Conf. Ser. 2010, 240, 012031. [Google Scholar] [CrossRef]
  28. Langelaan, G.; Saimoto, S. Thermal expansion measurement of pure aluminum using a very low thermal expansion heating stage for X-ray diffraction experiments. Rev. Sci. Instrum. 1999, 70, 3413–3417. [Google Scholar] [CrossRef]
  29. Heller, H.; Stakhorst, J.; Verbraak, T. The development of rolling and recrystallization textures in high purity aluminum. Z. Metallk. 1977, 68, 31–37. [Google Scholar]
  30. Mukouda, I.; Shimomura, Y.; Kiritani, M. Cryo-transfer TEM study of vacancy cluster formation in thin foils of aluminum and copper elongated at low temperature. Mater. Sci. A 2003, 350, 37–43. [Google Scholar] [CrossRef]
  31. Ogi, H.; Tsujimoto, A.; Nishimura, S.; Hirao, M. Acoustic study of kinetics of vacancy diffusion toward dislocations in aluminum. Acta Mater. 2005, 53, 513–517. [Google Scholar] [CrossRef]
  32. Brotzen, F.; Seeger, A. Diffusion near dislocations, dislocation arrays and tensile cracks. Acta Met. 1989, 37, 2985–2992. [Google Scholar] [CrossRef]
  33. Saimoto, S.; Cooley, J.; Larsen, H.; Scholler, C. Kinetic analysis of dynamic defect pinning in aluminum initiated by strain-rate changes. Philos. Mag. 2009, 87, 853–868. [Google Scholar] [CrossRef]
  34. Saimoto, S. Dynamic manifestation of point defects on flow stress and the role of grain boundaries as vacancy sinks. Mater. Sci. Eng. A 2008, 67–70, 483–484. [Google Scholar] [CrossRef]
  35. Westfall, L.; Diak, B.J.; Singh, M.A.; Saimoto, S. Some observations of nano-voids in aluminum alloys by dynamic dislocation defect analysis and SAXS. J. Eng. Mater. Technol. 2008, 130, 201. [Google Scholar] [CrossRef]
  36. Crone, J.C.; Munday, L.B.; Knap, J. Capturing the effects of free surface on void strengthening with dislocation dynamics. Acta Mater. 2015, 101, 40–47. [Google Scholar] [CrossRef] [Green Version]
  37. Saimoto, S.; Diak, B.J.; Kula, A.; Niewczas, M. Forensic analyses of microstructure evolution of stage II & III: New assimilated model for work-hardening in FCC metals. Acta Mater. 2020, 198, 168–177. [Google Scholar]
  38. Saimoto, S.; Diak, B.J. Point defect generation, nano-void formation and growth: 1. Validation. Philos. Mag. 2012, 92, 1890–1914. [Google Scholar] [CrossRef]
  39. Wenner, S.; Marioara, C.D.; Nishimura, K.; Matsuda, K.; Lee, S.; Namiki, T.; Watanabe, I.; Matsuzaki, T.; Holmestad, R. Muon spin relaxation study of solute-vacancy interactions during natural ageing of Al-Mg-Si-Cu alloys. Metall. Mater. Trans A 2019, 50A, 3446–3451. [Google Scholar] [CrossRef]
  40. Wolverton, C. Solute-vacancy binding in aluminum. Acta Mater. 2007, 55, 5867–5872. [Google Scholar] [CrossRef] [Green Version]
  41. Balluffi, R.W. Vacancy defect mobilities and binding energies obtained from annealing studies. J. Nucl. Mater. 1978, 69–70, 240–263. [Google Scholar] [CrossRef]
  42. Saimoto, S.; Lloyd, D.J. A new analysis of yielding and work hardening in AA1100 and AA5754 at low temperatures. Acta Mater. 2012, 60, 6352–6361. [Google Scholar] [CrossRef]
  43. Andersen, P.M.; Hirth, J.P.; Lothe, J. Theory of Dislocations, 3rd ed.; Cambridge Press: Cambridge, UK, 2017. [Google Scholar]
  44. Singh, M.A.; Saimoto, S.; Langille, M.R.; Levesque, J.; Inal, K.; Woll, A.R. Small-angle X-ray scattering investigation of deformation-induced nano-voids in AA6063 aluminum alloy. Philos. Mag. 2017, 97, 2496–2513. [Google Scholar] [CrossRef]
  45. Saimoto, S.; Cooley, J.I.; Diak, B.J.; Jin, H.; Mishra, R.K. Recovery studies of cold-rolled aluminum sheet using X-ray line broadening and activation volume determinations. Acta Mater. 2009, 57, 4822–4834. [Google Scholar] [CrossRef]
  46. Saimoto, S.; Sang, H.; Morris, L.R. Microplastic bases for constitutive relations found tensile testing. Acta Metall. 1981, 29, 215–228. [Google Scholar] [CrossRef]
  47. Park, D.-Y.; Niewczas, M. Plastic deformation of Al and AA5754 between 4.2 K and 295 K. Mater. Sci. Eng. A 2008, A491, 88–102. [Google Scholar] [CrossRef]
  48. Saimoto, S.; Diak, B.J.; Lloyd, D.J. Point defect generation, nano-void formation and growth: II. Criterion for ductile failure. Philos. Mag. 2012, 92, 1915–1936. [Google Scholar] [CrossRef]
  49. Saimoto, S.; Niewczas, M.; Langille, M.; Diak, B.J. Specific resistivity of dislocations and vacancies for super-pure aluminum at 4.2 K determined in-situ and post-recovery deformation and correlated to flow stress. Philos. Mag. 2019, 99, 2770–2788. [Google Scholar] [CrossRef]
  50. Niewczas, M. Intermittent plastic flow of single crystals: Central problems in plasticity: A review. Mater. Sci. Technol. 2014, 739–757. [Google Scholar] [CrossRef]
  51. Wang, H.; Xu, D.S.; Yang, R.; Veyssiere, P. The formation of stacking fault tetrahedra in Al and Cu I. dipole annihilation and the nucleation stage. II. SFT growth by successive absorption of vacancies generated by dipole annihilation. Acta Mater. 2011, 59, 1–9, 10–18. [Google Scholar] [CrossRef]
  52. Hirth, J.P.; Lothe, J. Glide of jogged dislocations. Can. J. Phys. 1967, 45, 809–826. [Google Scholar] [CrossRef]
  53. Osetsky, Y.N.; Rodney, D.; Bacon, D.J. Atomic-scale study of dislocation–stacking fault tetrahedron interactions. Part I: Mechanisms. Philos. Mag. 2006, 16, 2295–2313. [Google Scholar] [CrossRef]
  54. Niewczas, M.; Hoagland, R.G. Molecular dynamic studies of the interaction of a/6 <112> Shockley dislocations with stacking fault tetrahedra in copper. Part 1. Intersection of SFT by an isolated Shockley. Philos. Mag. 2009, 89, 623–640. [Google Scholar] [CrossRef]
  55. Wang, H.; Xu, D.; Veyssière, P.; Yang, R. Interstitial loop strengthening upon deformation in aluminum via molecular dynamics simulations. Acta Mater. 2013, 61, 3499–3508. [Google Scholar] [CrossRef]
  56. Hirsch, P.B. Extended jogs in dislocations in face-centred cubic metals. Philos. Mag. 1962, 7, 67–93. [Google Scholar] [CrossRef]
  57. Cottrell, A.H. The intersection of gliding screw dislocations. In Dislocations and Mechanical Properties of Crystals; Fisher, J.C., Johnston, W.G., Thomson, R., Vreeland, T., Jr., Eds.; John Wiley: London, UK, 1957; pp. 509–512. [Google Scholar]
  58. Nabarro, F.R.N.; Brown, L.M. The enumeration and transformation of dislocation dipoles: 1. The dipole strengths of closed and open dislocation arrays. Philos. Mag. 2004, 84, 429–439. [Google Scholar] [CrossRef]
  59. Fujita, H. Continuous observation of dynamic behaviour of dislocations in aluminum. J. Phys. Soc. Jpn. 1967, 23, 1349–1361. [Google Scholar] [CrossRef]
  60. Bonneville, J.; Escaig, B.; Martin, J. A study of cross-slip activation parameters in pure copper. Acta Met. 1988, 36, 1989–2002. [Google Scholar] [CrossRef]
  61. Davies, C.K.L.; Sagar, V.; Stevens, R.N. Thermally activated dislocation intersection in face-centred cubic metals. Phys. Stat. Sol. 1973, 20, 201–210. [Google Scholar] [CrossRef]
Figure 1. PSRS strain-rate change at 300 K in tension for Al-0.5% Fe alloy after rolling pre-strain to ε = 1.45 and testing at constant strain rates of 4 × 10⁻³, 4 × 10⁻⁴ and 4 ×10⁻⁵ s−1, the intermediate rate with strain rate changes at ~0.13 strain. Note ∆σup < ∆σdown and the mechanical equation of state is not satisfied.
Crystals 12 01811 g001
Figure 2. Traces of load drops which accompany a down-strain rate change at 298 K in Cu crystal. The tangent slope line is back extrapolated to show the existence of transients. After ref. [21].
Crystals 12 01811 g002
Figure 3. Schematic Haasen plot showing the contributions from various obstacle types (forest, debris) to the flow stress detectable by instantaneous up- or down-changes in the strain rate. Note that the extension of k/ν3 intersects Sfor resulting in a smaller ∆σ that is attributed to the contribution of attractive intersection, estimated to be less than 10% of repulsive one at 78 K and negligible at higher temperature.
Crystals 12 01811 g003
Figure 4. Load–displacement responses compare the down- and up-changes for free-GB (top) and sealed-GB (bottom) of AA1100 tested at 195 K. The red dots indicate the stress from which the down- and up-rate change is made. The sealed-GB response with greater super-saturation give rise to larger pinning effect. The initial almost flat region on the up-change gives the thermodynamic response expected followed by depinning (yield point) due to insufficient density of mobile dislocation sources to maintain the increased strain rate [34].
Crystals 12 01811 g004
Figure 5. Comparison of load–displacement response of pure Al of similar large grain sizes but with one (bottom) containing nano-voids which manifests a decrease in flow stress [35]. The presence of nano-voids shows large initial recovery due to vacancy annihilation and a second stage due to image forces at a free surface which leads to work-softening [36].
Crystals 12 01811 g005
Figure 6. Haasen plot comparing down-change (filled symbols using 1/10 change) with up-change (open symbols) [35]. The slope for the quenched and aged to form nano-void specimen, RC2-11, is lower than that for the super-pure one. Note the origin offset for RC2-11.
Crystals 12 01811 g006
Figure 7. Comparison of Haasen plots at 195 K. Note that beyond yielding a small hump is observed for the free-GB but not for the sealed-GB. The denoted slopes from up-change (Sup) are similar and in both cases the ¼ and 1/10 changes fall on the common line.
Crystals 12 01811 g007
Figure 8. Comparison of Haasen plots for free-GB and sealed-GB specimens tested at 267 K. The slopes for the up-change are denoted. The hump observed at 195 K for the free-GB case in the initial strain range is much reduced. For sealed-GB down-change plot at high strains, the slope abruptly decreases to about 1.0 × 10⁻⁵ K−1, suggesting nano-void formation.
Crystals 12 01811 g008
Figure 9. Comparison of the Haasen plots at 300 K with lines drawn through the linear ranges. Unlike the up-change data points the down-ones tend to curve upwards till it abruptly becomes nearly horizontal indicating the formation of nano-voids to act as vacancy sinks. The text “df” stands for dislocation-forest intersection.
Crystals 12 01811 g009
Figure 10. Activation work (k/S) versus temperature for sealed GB specimens determined at the largest Sup prior to reduction due to vacancy sink formation.
Crystals 12 01811 g010
Figure 11. Activation work versus shear strain determined from the Haasen plot tangent (“Experiment”) to demonstrate the data trend compared to the “k/S Model” values obtained by subtracting Gosmotic= kT ln (CV/C0) from 1.75 eV. The abrupt increase in activation work to 7.36 eV occurs at CV = 1.22 × 10⁻³.
Crystals 12 01811 g011
Figure 12. Haasen plot of 300 µm grain-sized super pure Al tested at 78 K. The data points for the up- and down- rate changes are separated. The ¼ and 1/10 changes tend to diverge for the down- but not for the up-change, indicating that the composite locus encompass more than one weak species. For these reasons the analyses are based primarily on 1/10 rate change data.
Crystals 12 01811 g012
Figure 13. Haasen plot of sealed-GB specimen tested at 220 K where up- and down-rate changes are shown for factors of 4 and 10. Due to the clear separation of the yield phenomenon from the higher strain region, the separation of the debris contribution from that of the forest can be performed.
Crystals 12 01811 g013
Figure 14. S versus T plot for Sup and Sdown for current super-pure Al and that of PN [47] and free-GB specimens together with those from Al single crystals by Basinski [7] and S&S [11] and prior work on polycrystalline Al by SS&M [46]. Note the change in temperature dependence of S for free-GB after 200 K and the bifurcation between up and down data points.
Crystals 12 01811 g014
Figure 15. Plot of derived Sfor and Sdebris versus temperature. Dislocation-forest interaction is insensitive to purity whereas dislocation-debris is more sensitive. Note that Sfor data tend towards the fit-locus but it is larger inferring vacancy supersaturation is not zero.
Crystals 12 01811 g015
Figure 16. Mean slip distance to obstacle spacing ratio as a function of shear strain for various indicated strain rates (reported in s−1). The denoted γ3 correspond to strain at σ3. For kinetic analyses, the shear stresses and mean slip velocities at the peak locations are used to obtain activation energies which correspond to vacancy migration energy [40].
Crystals 12 01811 g016
Table 1. Parameters to characterize linearized Haasen plot for super-pure Al and predictions.
Super-Pure Al
Temp. Kσ
MPa
σ0
MPa
σ0.2%
MPa
σ3 MPak/νYield × 10−4
MPa K−1
k/νUp × 10−4
MPa K−1
k/νDown × 10−4
MPa K−1
SDown × 10−5 K−1SUp ×10−5
K−1
7880.015.020.018.010.0108.6140.417.812.9
19550.013.717.08.21.7111.1415.433.072.03
Temp. KDerived SFor
× 10−5 K−1
Derived SDebris × 10−5
K−1
Δσ
MPa
fDebrisDerived SDown × 10−5 K−1Expt. SDown × 10−5 K−1τνFor
= k/S eV
τνdebris = k/S eVτνFor/τνdebris
ratio
7814.8642..07.560.12218.217.80.580.2052.83
1952.258.864.840.1153.013.073.830.9733.95
NV = 5
Table 2. Parameters to characterize linearized Haasen plot for Free-GB Al and predictions.
Free-GB
Temp.
K
σ
MPa
σ0
MPa
σ0.2%
MPa
σ3
MPa
k/νYield × 10−4 MPa/Kk/νUp × 10−4 MPa/Kk/νDown × 10−4 MPa/KSDown × 10−5 K−1SUp × 10−5
K−1
78160.031.747.472.524.192.222.18.5015.00
195100.025.839.231.03.125.836.94.232.68
2468024.631.033.73.224.635.95.43.15
26780.015.018.937.03.25.234.85.543.35
3007020.534.034.24.329.740.07.214.45
Temp.
K
Derived SFor × 10−5
K−1
Derived SDebris × 10−5 K−1Δσ
MPa
fDebrisDerived SDown × 10−5 K−1Expt. SDown
× 10−5
K−1
τνFor
= k/S
eV
τνdebris
= k/S
eV
τνFor/τνdebris
ratio
7815.7634.38.750.1 *17.618.50.550.252.2
NV = 0
1952.8516.086.90.1 *4.174.233.020.545.6
NV = 4
2463.4024.44.630.10 *5.505.42.580.3537.3
NV = 3
2673.4023.254.30.10 *5.535.542.530.376.83
NV = 3
3004.58328.653.580.10 *7.007.211.880.306.26
NV = 2
* Fixed fdebris value from Table 3.
Table 3. Parameters to characterize linearized Haasen plot for Sealed-GB Al and predictions.
Sealed-GB
Temp.
K
σ
MPa
σ0
MPa
σ0.2%
MPa
σ3
MPa
k/νYield
× 10−4 MPa/K
k/νUp
× 10−4 MPa/K
k/νDown
× 10−4
MPa/K
SDown
× 10−5
K−1
SUp
× 10−5
K−1
22010018.130.332.01.528.836.74.263.11
Temp.
K
Derived SFor × 10−5
K−1
Derived SDebris × 10−5
K−1
Δσ
MPa
fDebrisDerived SDown × 10−5
K−1
Expt. SDown 10−5τνFor
= k/S
eV
τνdebris
= k/S
eV
τνFor/τνdebris
ratio
2203.40611.536.850.104.224.262.530.7473.38
NV = 3
Table 4. Derived d/b from α (d/b) using αfor = 0.4 and αdebris = 0.1.
Super-Pure Al
Temp.
K
µ
MPa
Derived
Sfor × 10−5
K−1
α (d/b) = τ ν/(µb3)d/b if
α = 0.4
Derived
Sdebris × 10−5
K−1
α (d/b) = τ ν/(µb3)d/b if
α = 0.1
7836,52214.860.1080.2742.00.03830.383
19534,1252.250.7661.918.860.1941.94
Free-GB
Temp.
K
µ
MPa
Derived
Sfor × 10−5
K−1
α (d/b) = τ ν/(µb3)d/b if
α = 0.4
Derived
Sdebris × 10−5
K−1
α (d/b) = τ ν/(µb3)d/b if
α = 0.1
7836,52215.760.1020.25534.30.04690.469
19534,1252.850.6051.51216.080.10721.072
24633,1063.400.5221.30524.40.07280.728
26732,6493.400.5351.33723.250.07820.782
30031.9684.580.4011.00228.650.06420.642
Publisher’s Note: MDPI stays neutral with regard to jurisdictional claims in published maps and institutional affiliations.

