Article

Image Measurement of Crystal Size Growth during Cooling Crystallization Using High-Speed Imaging and a U-Net Network

College of Information Engineering, Shenyang University, Shenyang 110044, China
*
Author to whom correspondence should be addressed.
Crystals 2022, 12(12), 1690; https://doi.org/10.3390/cryst12121690
Submission received: 4 November 2022 / Revised: 19 November 2022 / Accepted: 20 November 2022 / Published: 22 November 2022
(This article belongs to the Special Issue Crystallization Process and Simulation Calculation)

Abstract

:
In this paper, an image measurement method using a high-speed imaging system is proposed for the evolution of crystal population sizes during cooling crystallization processes. Firstly, to resist the negative effect from solution stirring and particle motion during crystallization, a U-net network-based image processing method is established to efficiently detect sufficiently clear crystals from the online captured microscopic images. Accordingly, the crystal size distribution model is analyzed in terms of the counted probability densities of these crystal images. Subsequently, a measurement method of size growth rate based on crystal population distribution is proposed to estimate the growth condition. An experimental case on a crystallization process of β-form LGA is used to show the effectiveness of the proposed strategy.

1. Introduction

Crystallization is an important process to obtain crystalline solids from mixed solutions in pharmaceutical and chemical industries [1]. The cooling crystallization process usually includes the formation of a supersaturated solution, nucleation and crystal growth, etc. Crystal size distribution (CSD) is one of key indicators to evaluate the crystallization production quality [2,3]. It is necessary to measure the growth parameters of the crystal population for process optimization and feedback control [4,5,6]. In recent years, researchers have made significant advances in process analytical technology (PAT) for monitoring crystallization processes, e.g., ATR-FTIR spectroscopy, Raman spectroscopy, focused beam reflectance measurement (FBRM), ultrasound spectroscopy, etc.
With the development of optical imaging sensors, crystallization process detection strategies using image measurement have been promoted for crystal defects, sizes, and shapes [7,8,9,10,11,12]. Larsen et al. [13] analyzed the high concentration crystal image effectively and processed the needle crystal, making a detailed analysis of various characteristics of the crystal from different application values, striving to achieve a comprehensive description of the crystal. Zhou et al. [14] proposed some parameter optimization approaches for image processing applied to extract useful information from microscopy images regarding the distribution monitoring of particle shape and size. Lins et al. [15] developed a detection method of crystal defects, including crystal contour detection and defect quantification for evaluating and optimizing crystallization processes. For the measurement of crystal agglomeration, Ferreira et al. [16] proposed a novel image analysis technique which combined discriminant factorial analysis to assess the agglomeration of crystals. Lu et al. [17] developed a valid crystal segmentation approach based on background difference and local threshold to overcome the negative effect of particle shadow. In previous work [10], an online image measuring method was presented to analyze two-dimension (2D) crystal sizes during cooling crystallization. Gao et al. [18] developed a valid image analysis technology based on deep learning to detect crystals and measure their sizes. Ma et al. [19] applied a novel online image monitoring system to measure the growth rate for mean crystal size during LGA crystallization processes. Traditionally, the growth rate was measured based on the mean sizes for β-form L-glutamic acid [20,21,22,23], but the changes of the crystal population size distribution were not quantized and estimated roundly in the previous literature.
In this work, in order to eliminate the influence of continuous motion in a stirred reactor, an effective strategy is presented for the growth of crystal population sizes using the imaging measurement method based on a deep learning model. Firstly, for the online crystal images influenced by solution turbulence, uneven illumination, and noise, image preprocessing is used. Secondly, the valid crystals are extracted by an effective image segmentation method using a U-net network model. Thirdly, the CSDs are computed with the measured 2D sizes and probability density function. An indicator for describing the growth of crystal 2D size distribution is estimated with a statics method. Experimental results for the case of the cooling crystallization of β-form L-glutamic acid (LGA) show the effectiveness of the proposed imaging measurement method.
The article is organized as follows. Section 2 introduces the basic algorithms. The Section 3 is dedicated to the experimental set-up. Section 4 demonstrates in detail the method of image measurement based on the U-net network. The experimental case is made for the validity of the method in the Section 5. Finally, conclusions are given in the Section 6.

2. Preliminaries

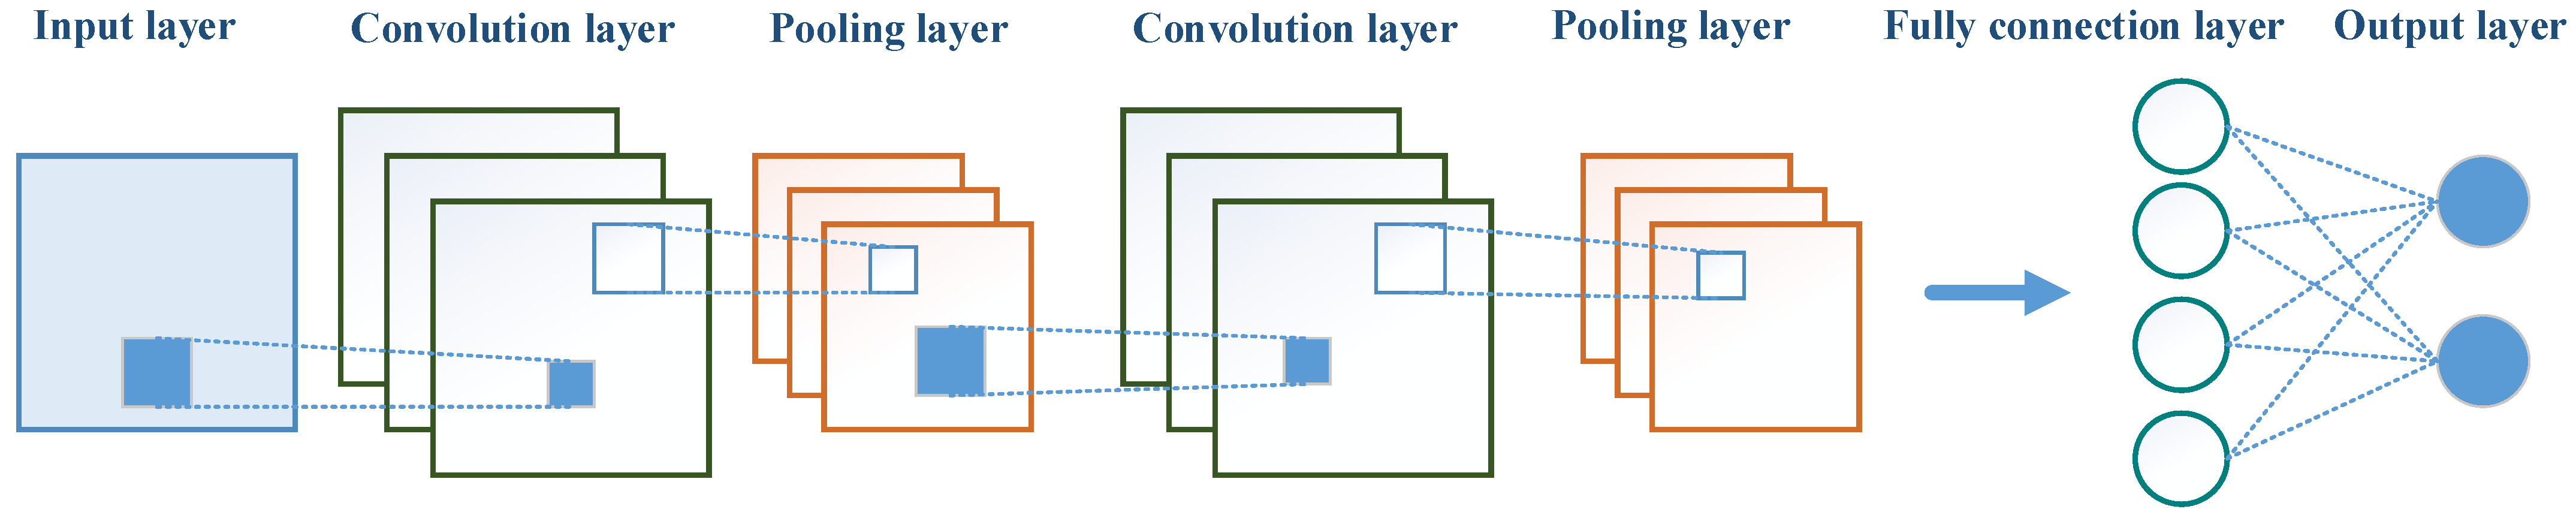
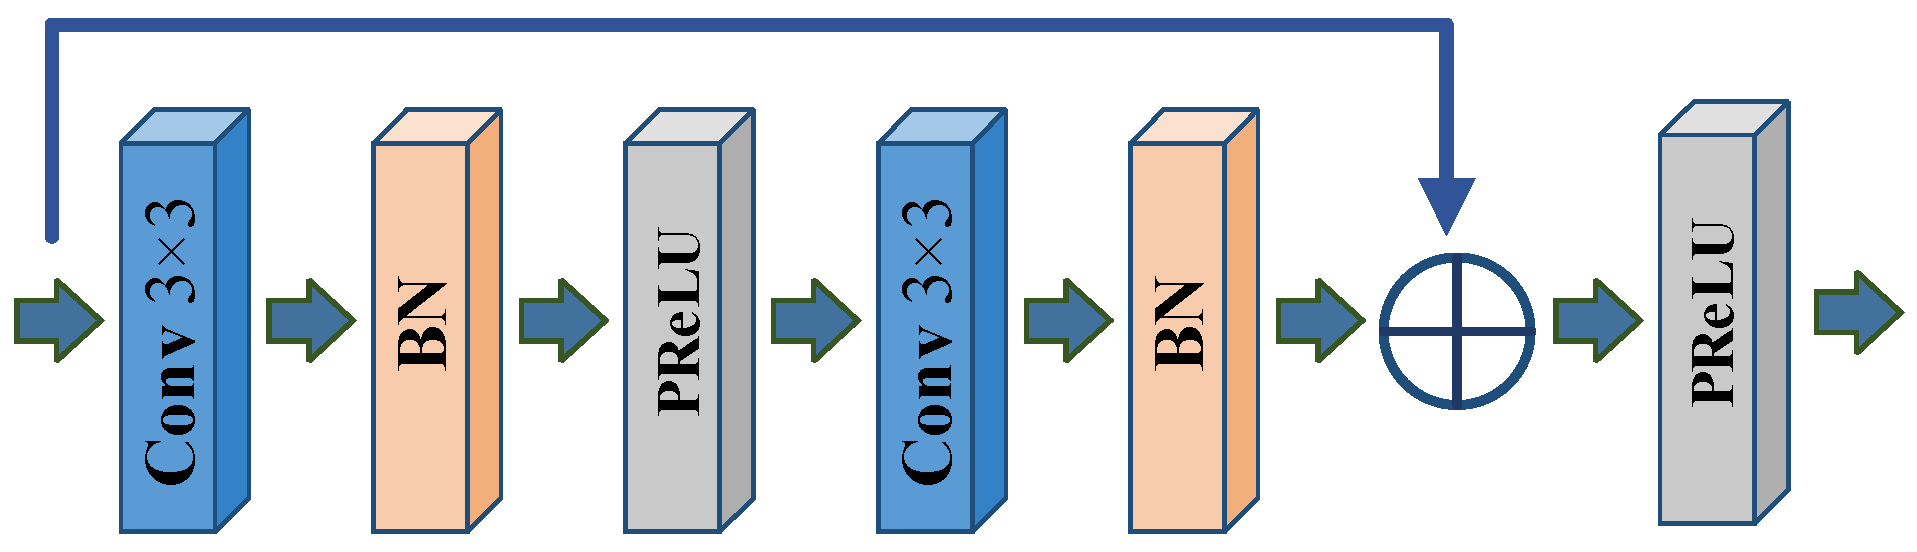
2.1. Classical Convolution Neural Network
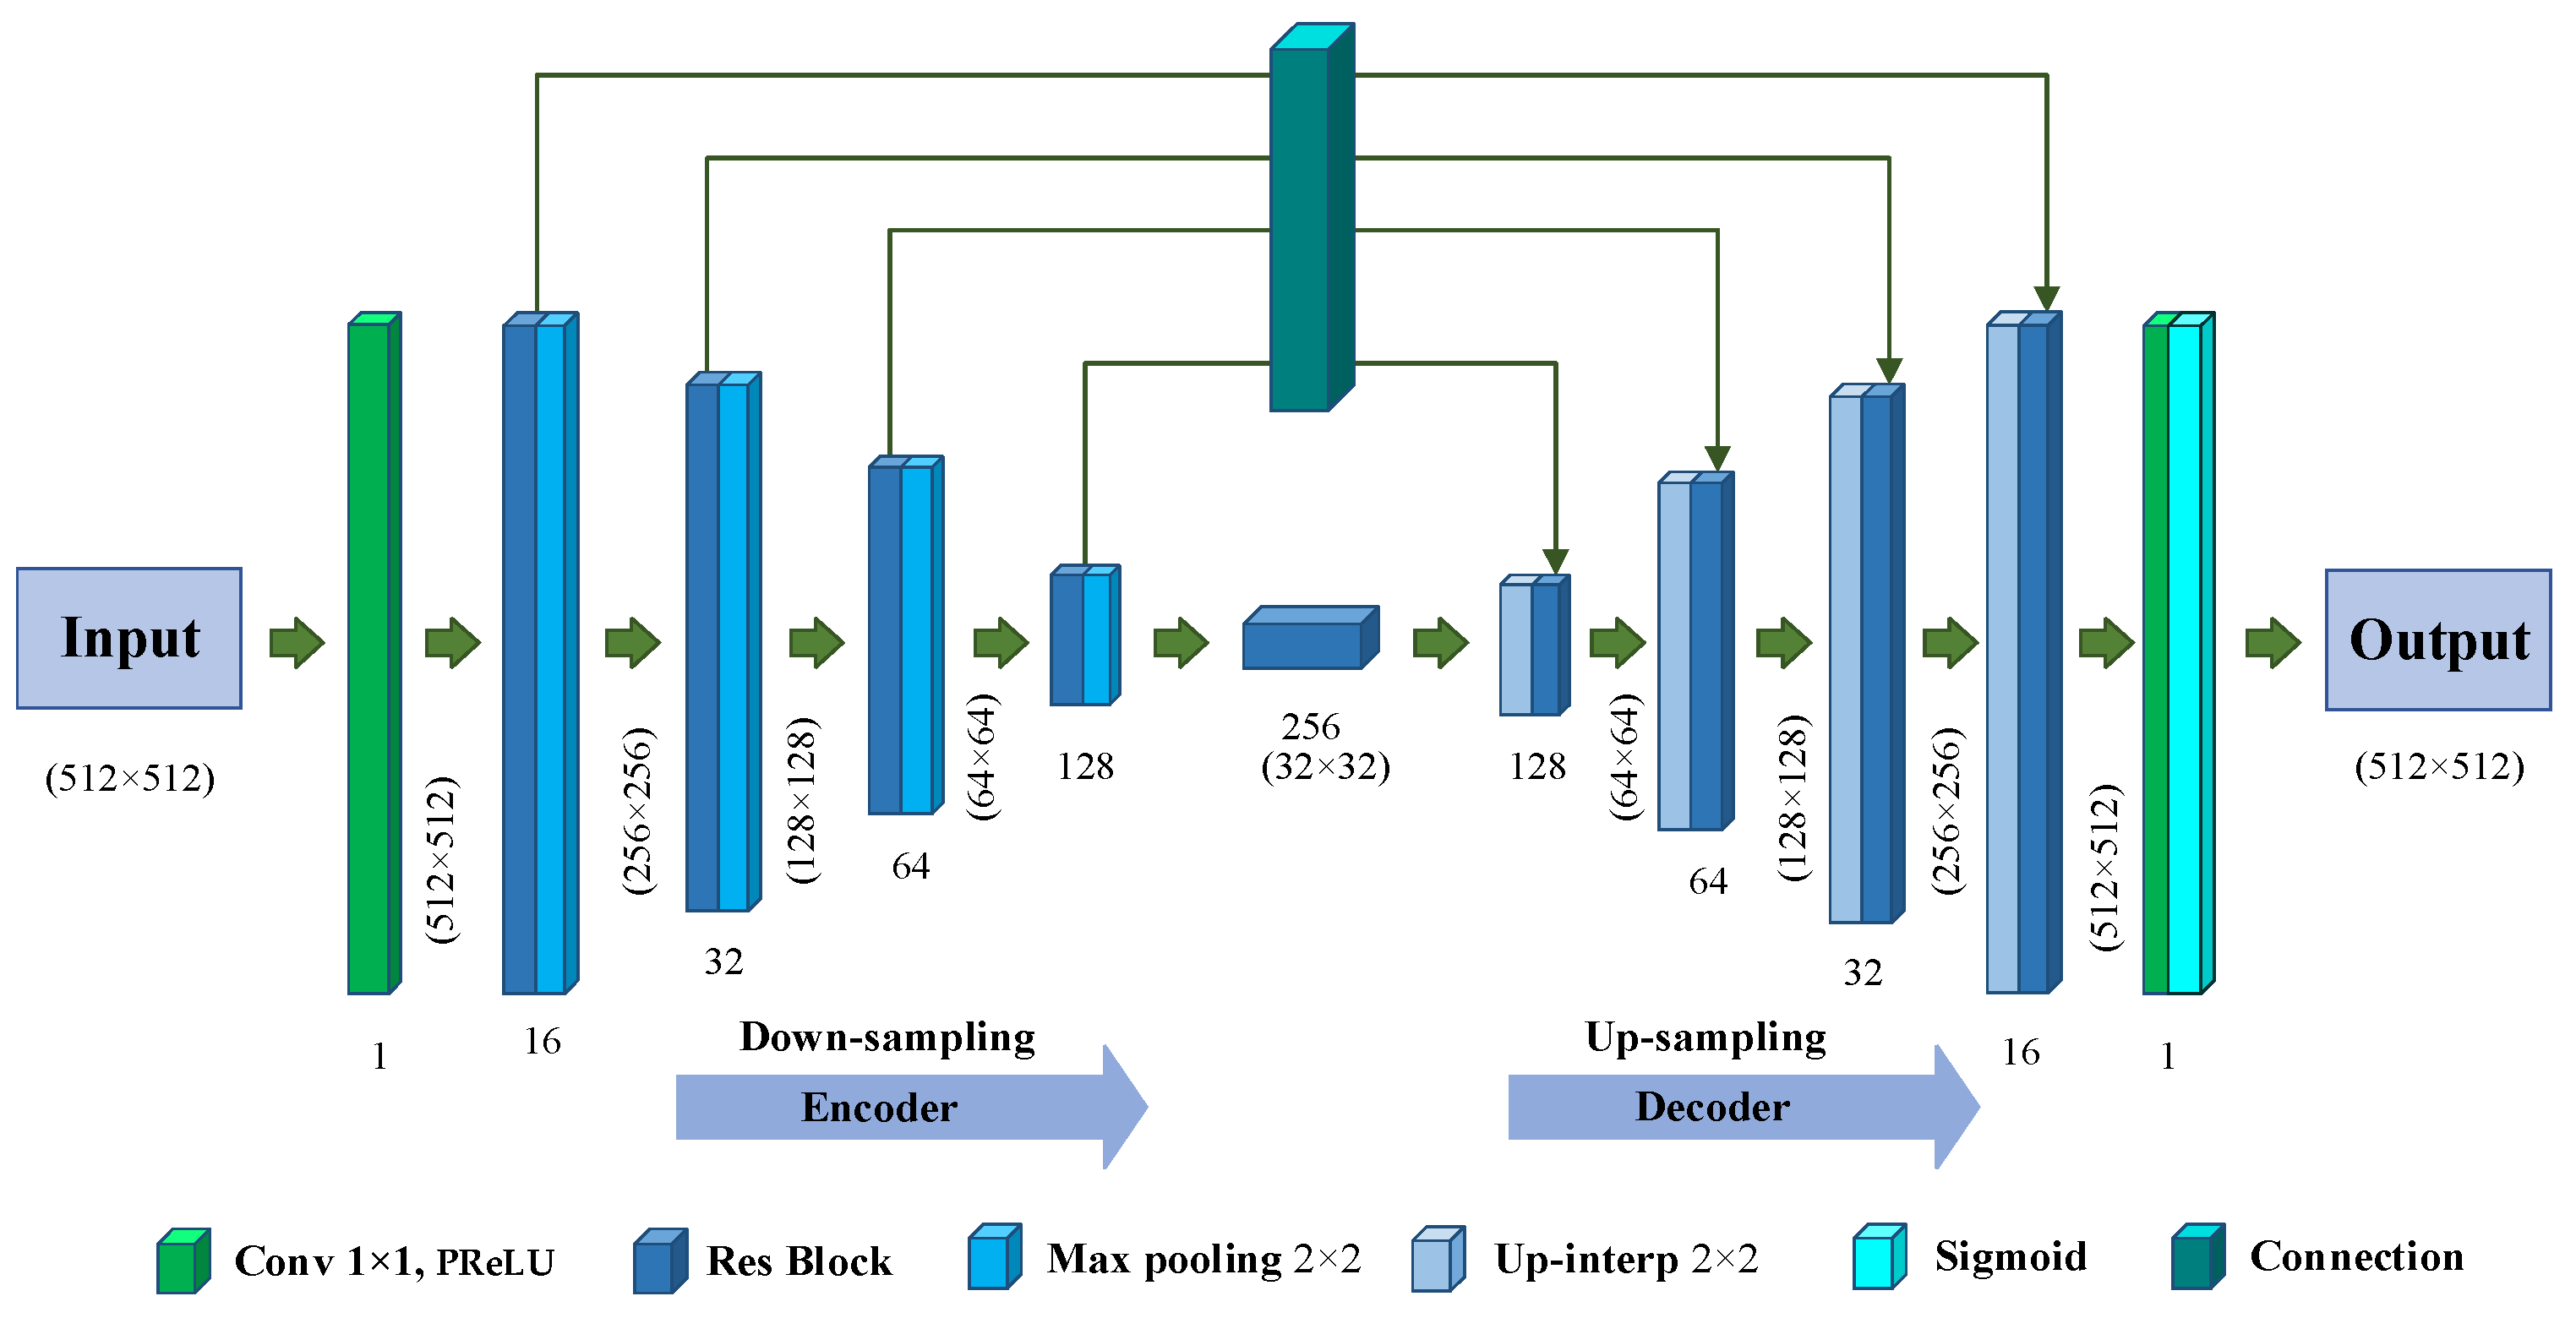
Convolutional neural network (CNN) is a basic deep neural network with a convolution structure. In 1998, Lecun et al. [24] designed and trained a CNN model (called LeNet-5), which is a classical CNN structure. The basic structure of CNN is composed of an input layer, a convolution layer, a pooling layer, a full connection layer and an output layer, as shown in Figure 1. Generally, a convolution layer is connected with a pooling layer, and the last few layers near the output layer are usually fully connected networks. The training process of CNN is to learn the convolution kernel parameters of convolution layer and the connection weight between layers. In image recognition, the prediction process is mainly based on the input image and network parameters to calculate the category label.

2.2. U-Net Network

U-net network [25] is a full convolutional network improved based on fully convolutional networks (FCN) [25], which is similar to U-type. Compared with other convolutional neural networks, this network requires smaller training set size and has higher segmentation accuracy. A basic U-net network structure consists of a down-sampling path (encoder) and an up-sampling path (decoder). The down-sampling path is used to obtain the context information, and the up-sampling path is used to pinpoint the location. The down-sampling path is in the left of the network, which consists of 3 × 3 convolution layers and 2 × 2 max pool layers. The activation function f ( x ) uses ReLU [26], which is defined with τ > 0 as
f ( x ) = x ,                                         x > 0 τ ( e x 1 ) ,             x 0
The up-sampling path is in the right of the network. The deconvolution is used to halve the number of channels, then the deconvolution result is spliced with the corresponding feature map, and the spliced feature map is then convolved with a 3 × 3 kernal. The last layer uses a 1 × 1 convolution to map each 2-bit feature vector to the output layer of the network.

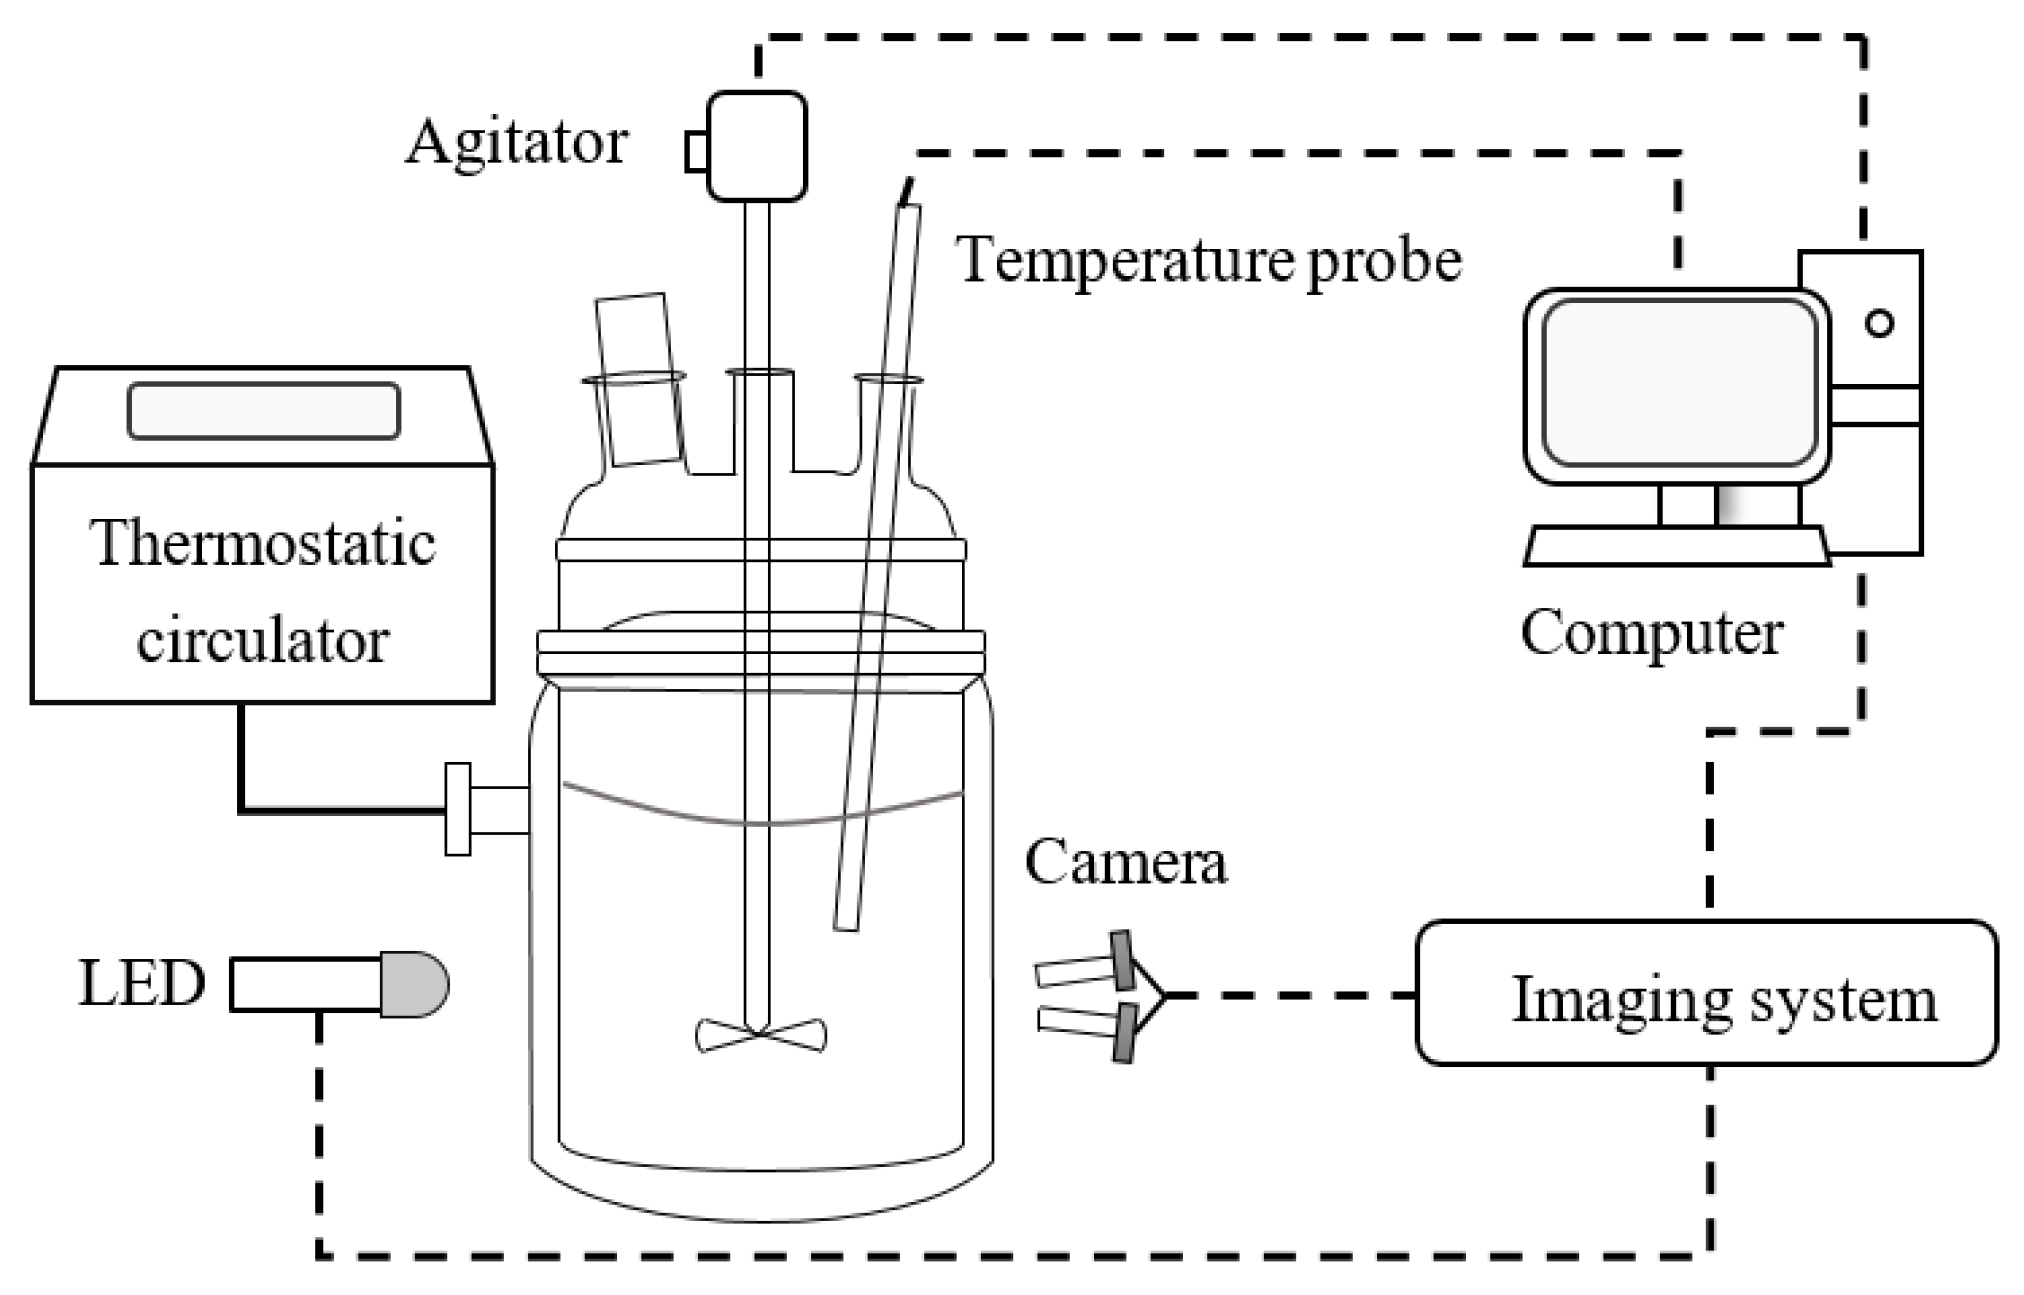
3. Experimental Set-Up

The experimental setup with an imaging system for measuring crystal size distribution is shown in Figure 2. Experiments were carried out with a crystallizer including a 1 L glass jacketed reactor and a PTFE four-paddle agitator. The temperature control device used a Julabo-CF41 thermostatic circulator (JULABO, Seelbach, Germany). A Pt100 temperature probe was used to measure the solution temperature. A camera device (UI-2280SEC-HQ, IDS, Obersulm, Germany) was adopted to record online crystallization images in cooling crystallization processes. The imaging system includes the following functions: image acquisition, image storage, image compression, image output, etc., which was connected to an industrial personal computer. An LED light and controller (Gardasoft -RT260-20, Gardasoft Vision, Cambridge, UK) were employed to provide illumination.
The material used in this experiment was L-glutamic acid (LGA) (Sigma Chemicals, St Louis, MO, USA), which has two forms, the α form and β form. This experiment mainly focused on the study of needle-like β-form LGA. The growth of β-form crystals is statistically analyzed by image analysis in the reactor. The stirring rate was maintained at 200 rpm. Firstly, 0.6 L LGA solution with a concentration of 30 g/L was used in the reactor. The solution was heated to 70 °C and then cooled to 30 °C after 1 h of constant temperature. When the temperature dropped to 55 °C, β-form seeds were added into the reactor, and the online crystal images were recorded with the imaging system.

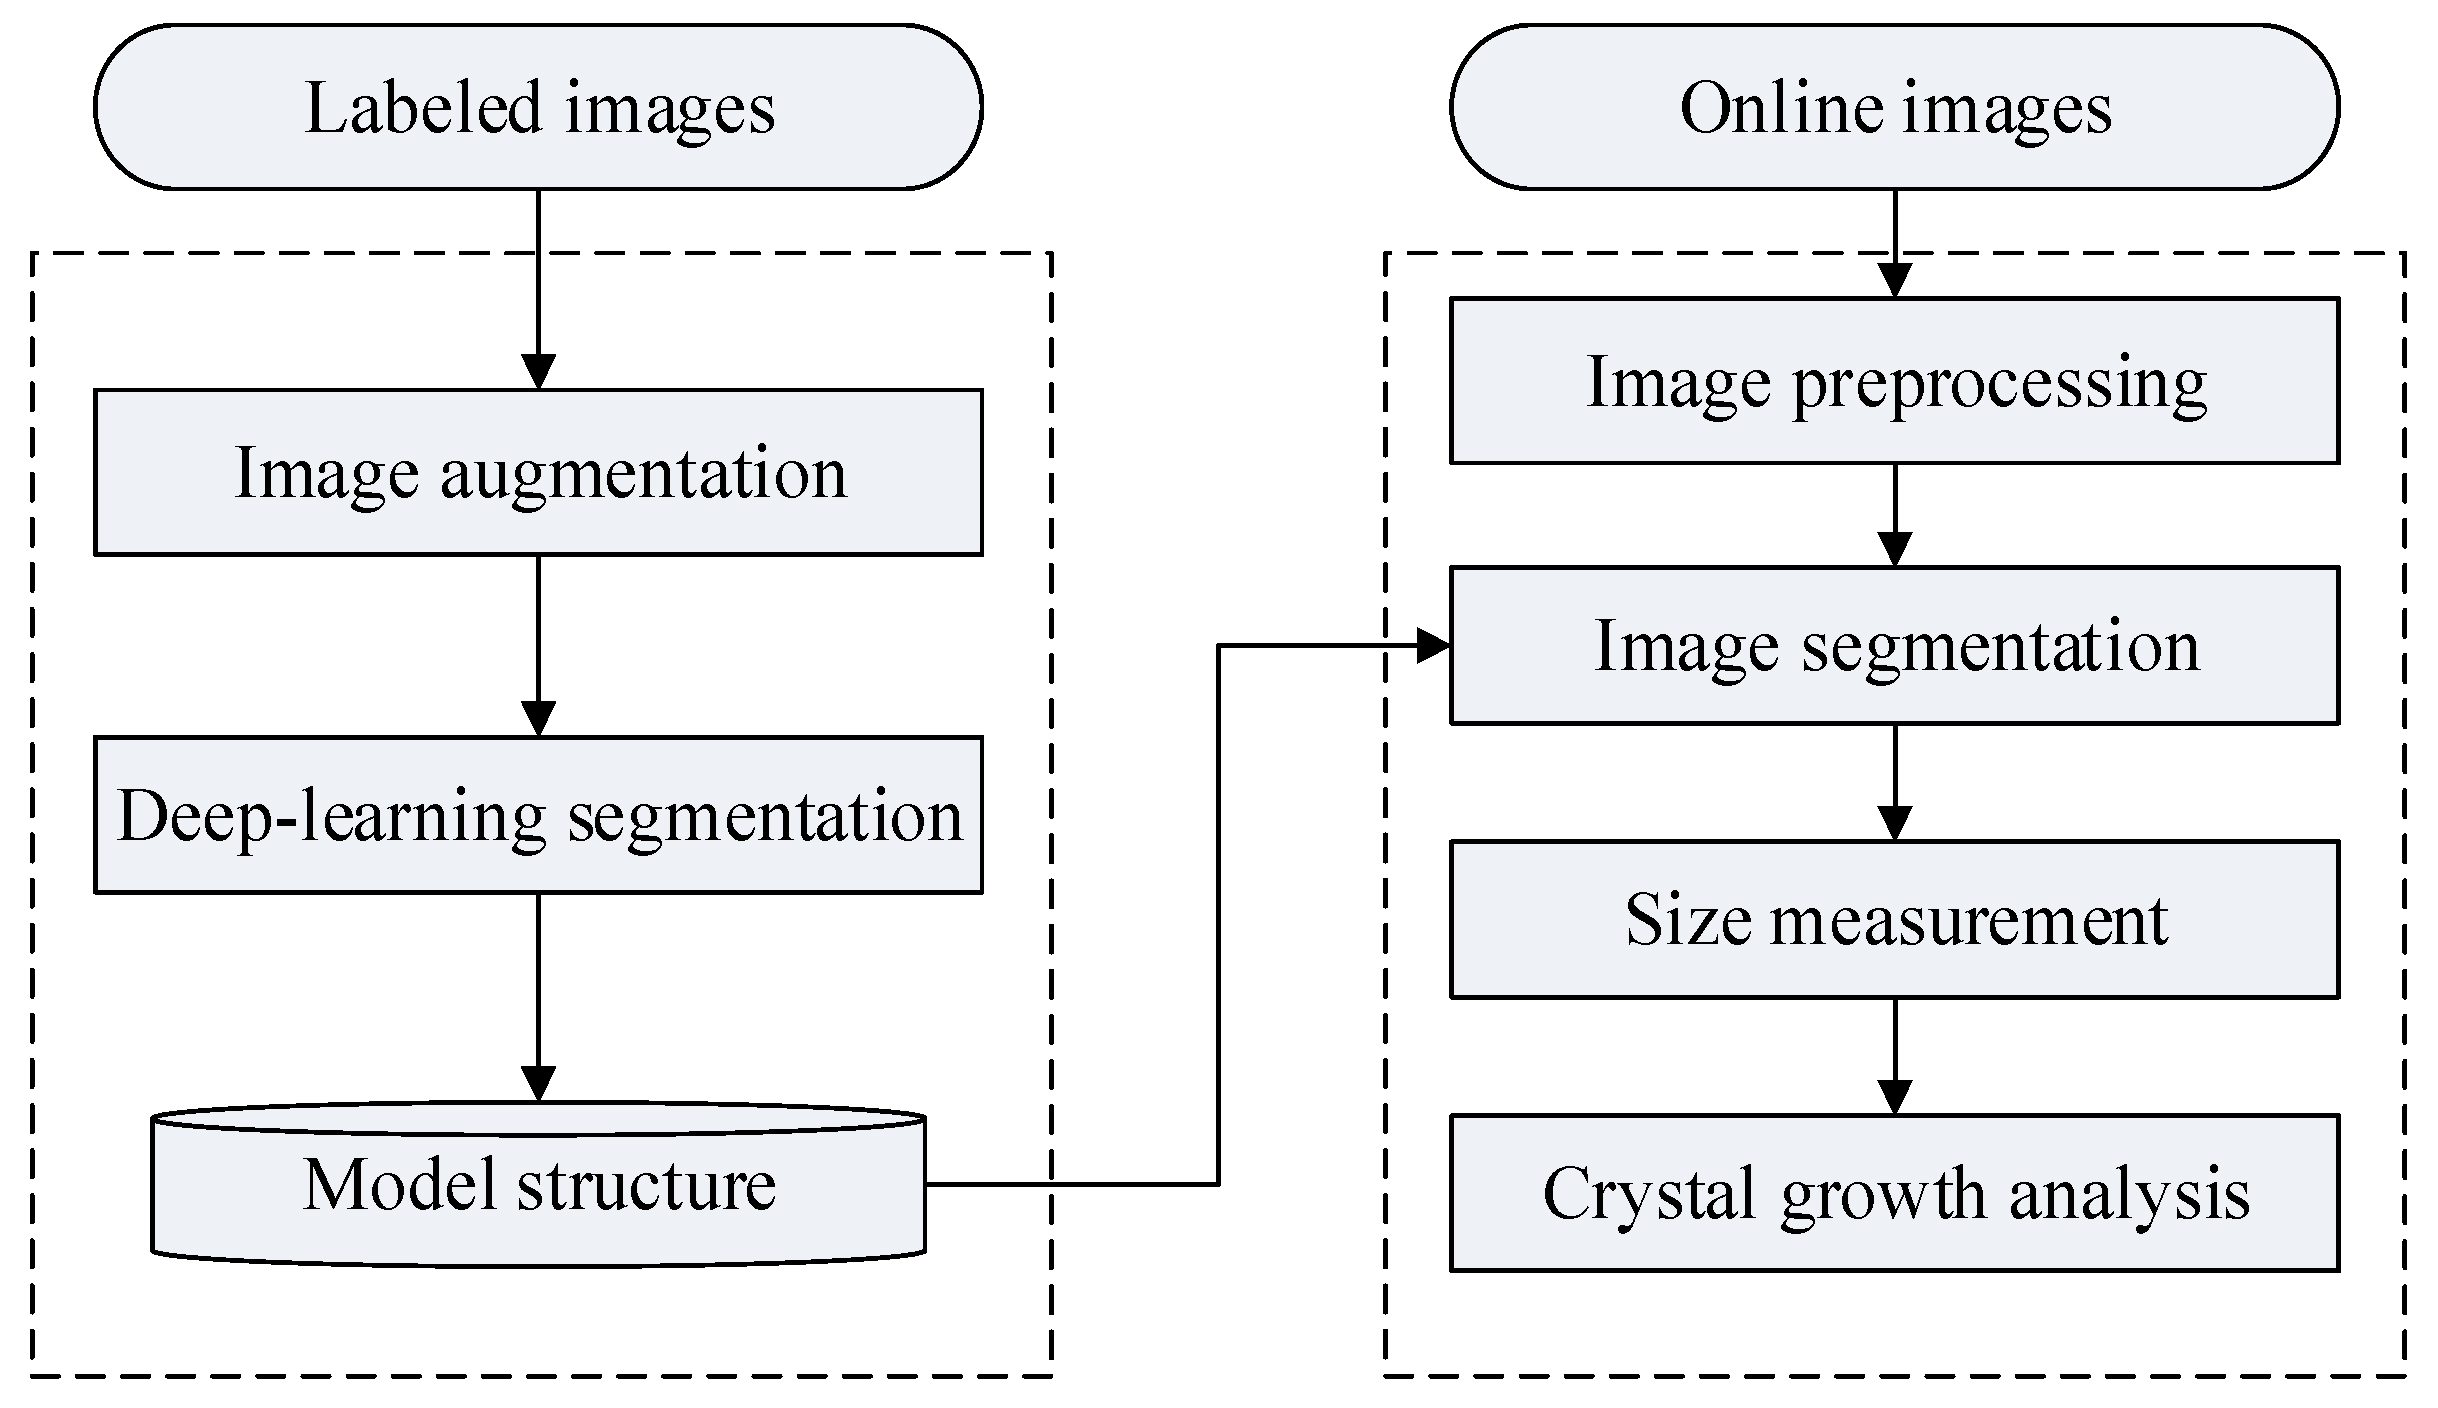
4. Crystallization Measurement Method

The process of the proposed image measurement method is presented in Figure 3. The detailed steps are described in the following subsections.

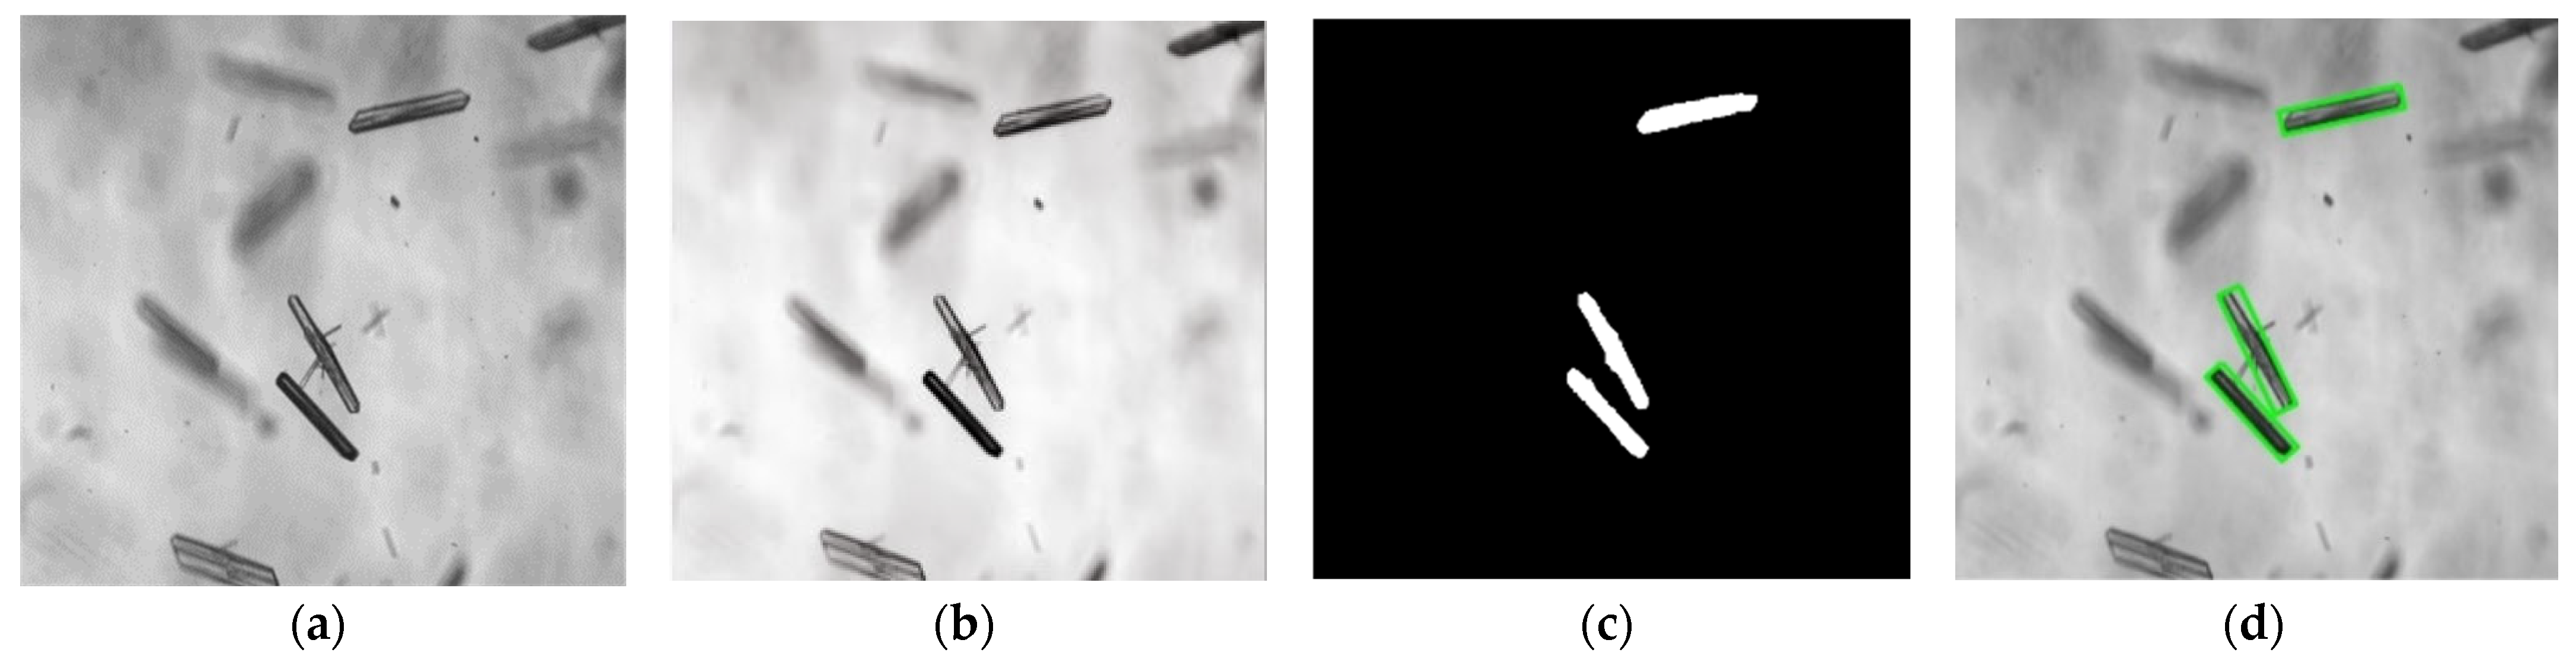
4.1. Crystal Image Preprocessing

Due to the disturbance of noise and blur, the quality of crystal images is mostly degraded during online image acquisition. Therefore, guided filtering [27] can be taken as a denoising method. The guided filtering function is considered as an edge-preserving filter, guaranteeing good information preservation around the image edges. Supposing that the pixel of the input image is m i and the pixel of the output image is q i , which are defined by
q i = 1 | ω | i ω k α k m i + β k
where k is the index of the local square window ω k which is taken as 31 × 31 in the input image, ( α k , β k ) are the constants in ω k which can be obtained by
( α k , β k ) = arg min α k ,     β k       i ω k ( α k m i + β k m i ) 2 + ε α k 2
where ε is the regularization parameter.

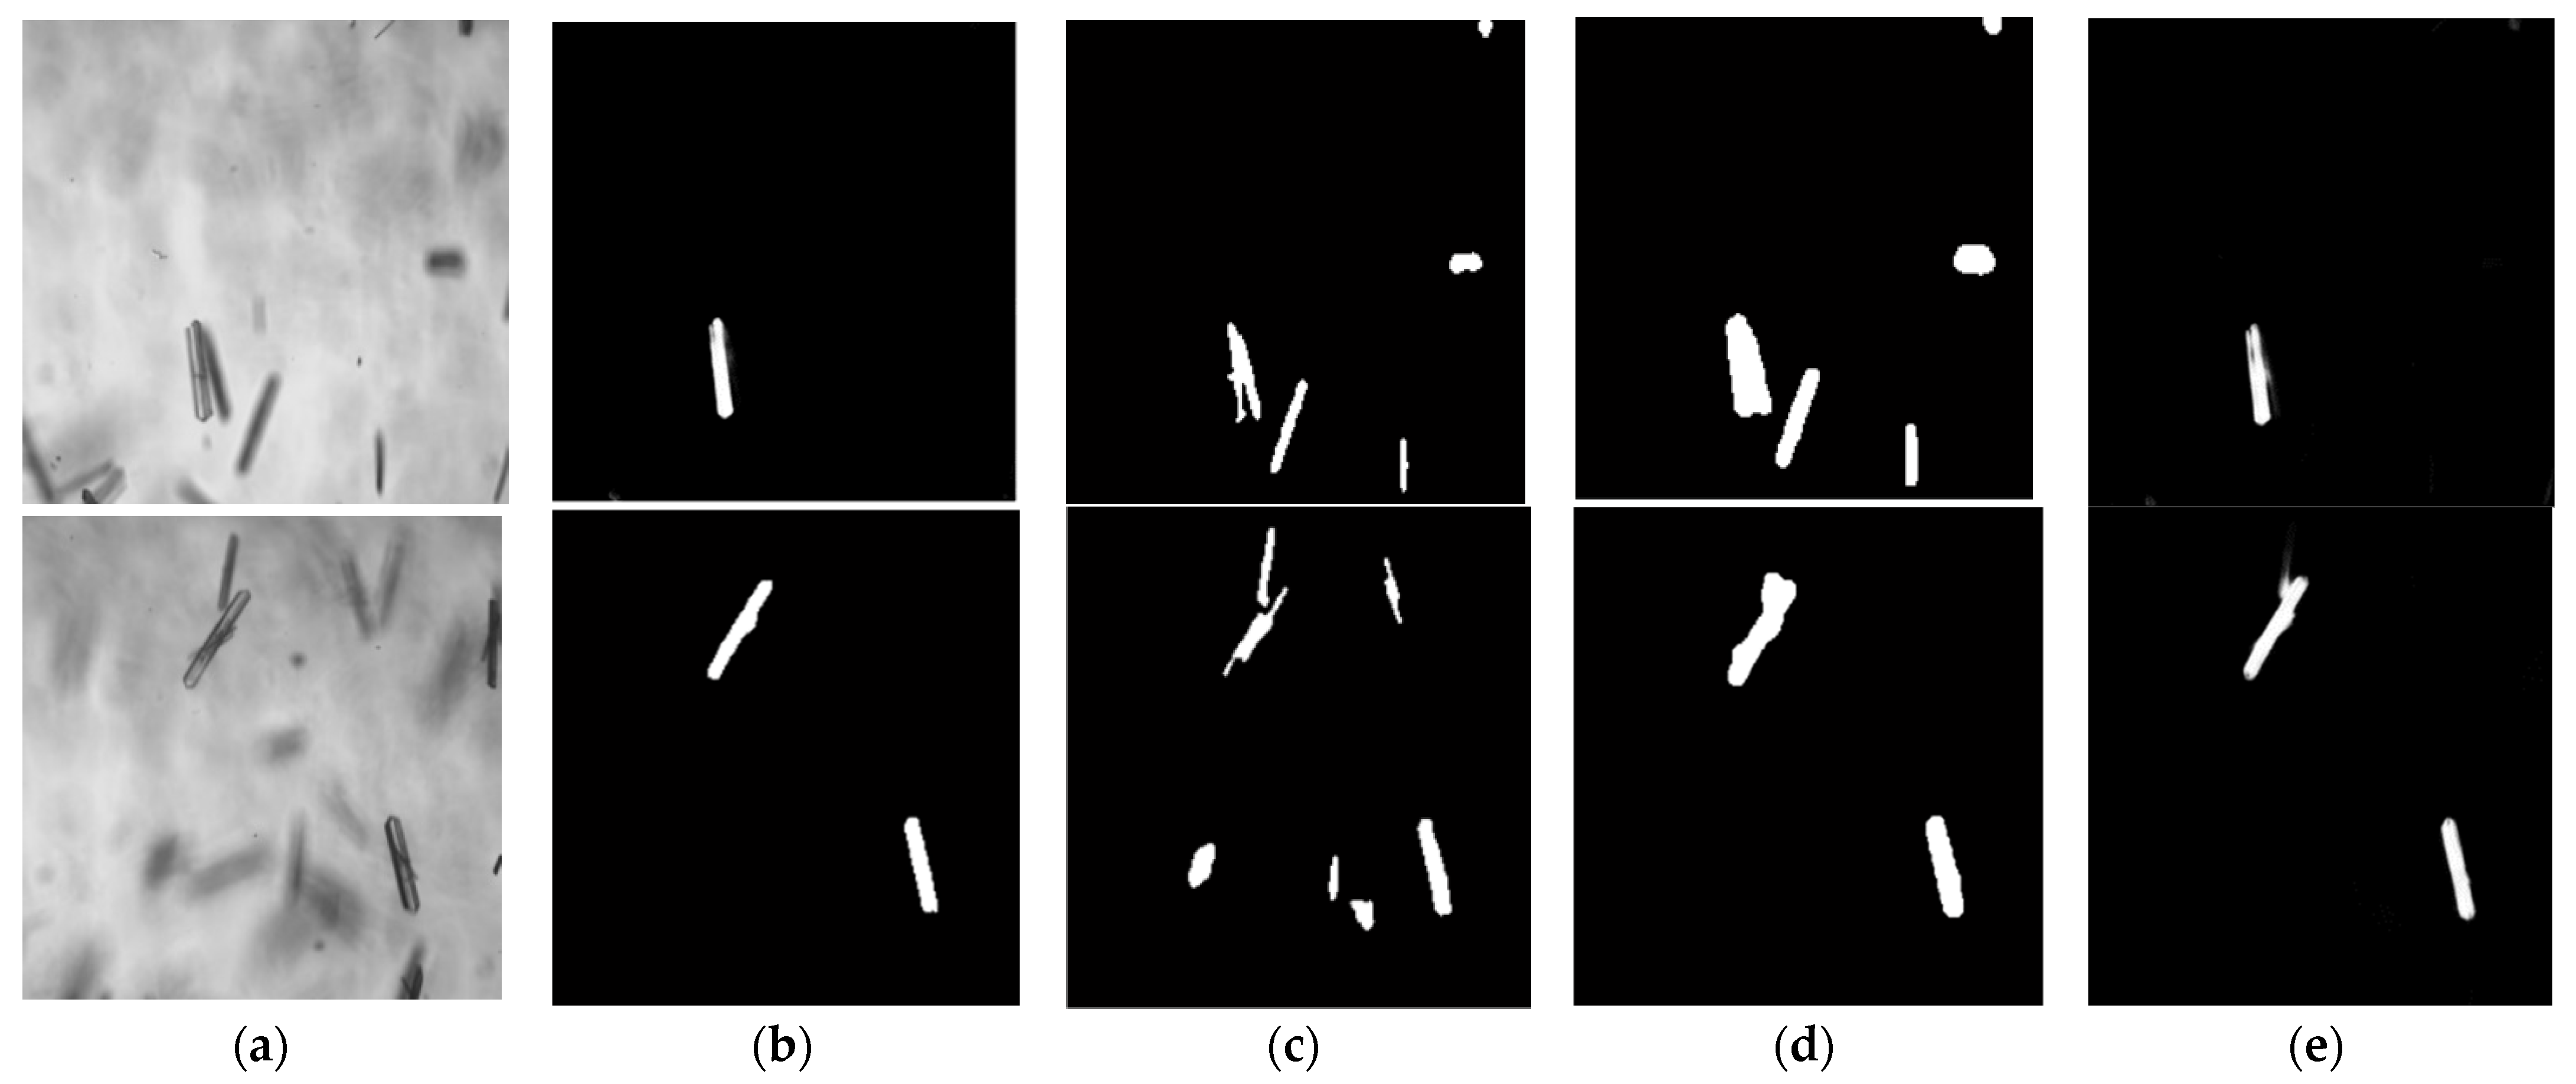
4.2. Crystal Image Segmentation

Since the calibration method uses clear images to compute pixel equivalent, only clear crystals are able to provide accurate size information. In this work, the U-net network model is improved for online crystal images, being also composed of down-sampling path (encoder) and up-sampling path (decoder) [28], as shown in Figure 4. The improved network consists of 11 layer groups. A parametric rectified linear unit (PReLU) [29] is adopted as the activation function to improve the fitting ability. Each Res Block with two 3 × 3 convolutions in the up-sampling path is connected with the corresponding Res Block of the down-sampling path, as shown in Figure 4. The first convolution layer uses a 1 × 1 convolution kernel to extract the features of the input crystal image. Then the designed layer of Res Block is used to further extract image features and deepen the network processing, as shown in Figure 5, which includes the use of two convolutional operations, batch normalization modules and ELU activation functions. After the Res Block in the down-sample path, a 2 × 2 max pooling layer is used to down-sample the feature map, so that the resolution of the feature map decreases to half of the original one. In the up-sampling path, a bilinear interpolation method is used in an up-interpolation block, and the feature map obtained is splicing by layer hopping connection, so that the network can fully fuse the shallow features and deep semantic information. Following the final 1 × 1 convolution layer, the Sigmoid activation function is employed in the last layer to map the response values to (0, 1) pixel by pixel.
To solve the imbalance of positive and negative pixels in the image, the loss function [30] is defined as
J loss = C loss + D loss
where C loss is the cross-entropy loss and D loss is the Dice coefficient loss.
Image augmentation is used to increase the training sample size and strengthen the network generalization ability. Random rotation, scale, and translation are used to enhance the image diversity, and the brightness and contrast of the image are adjusted to reduce the influence of uneven lighting and highlight the edge features.

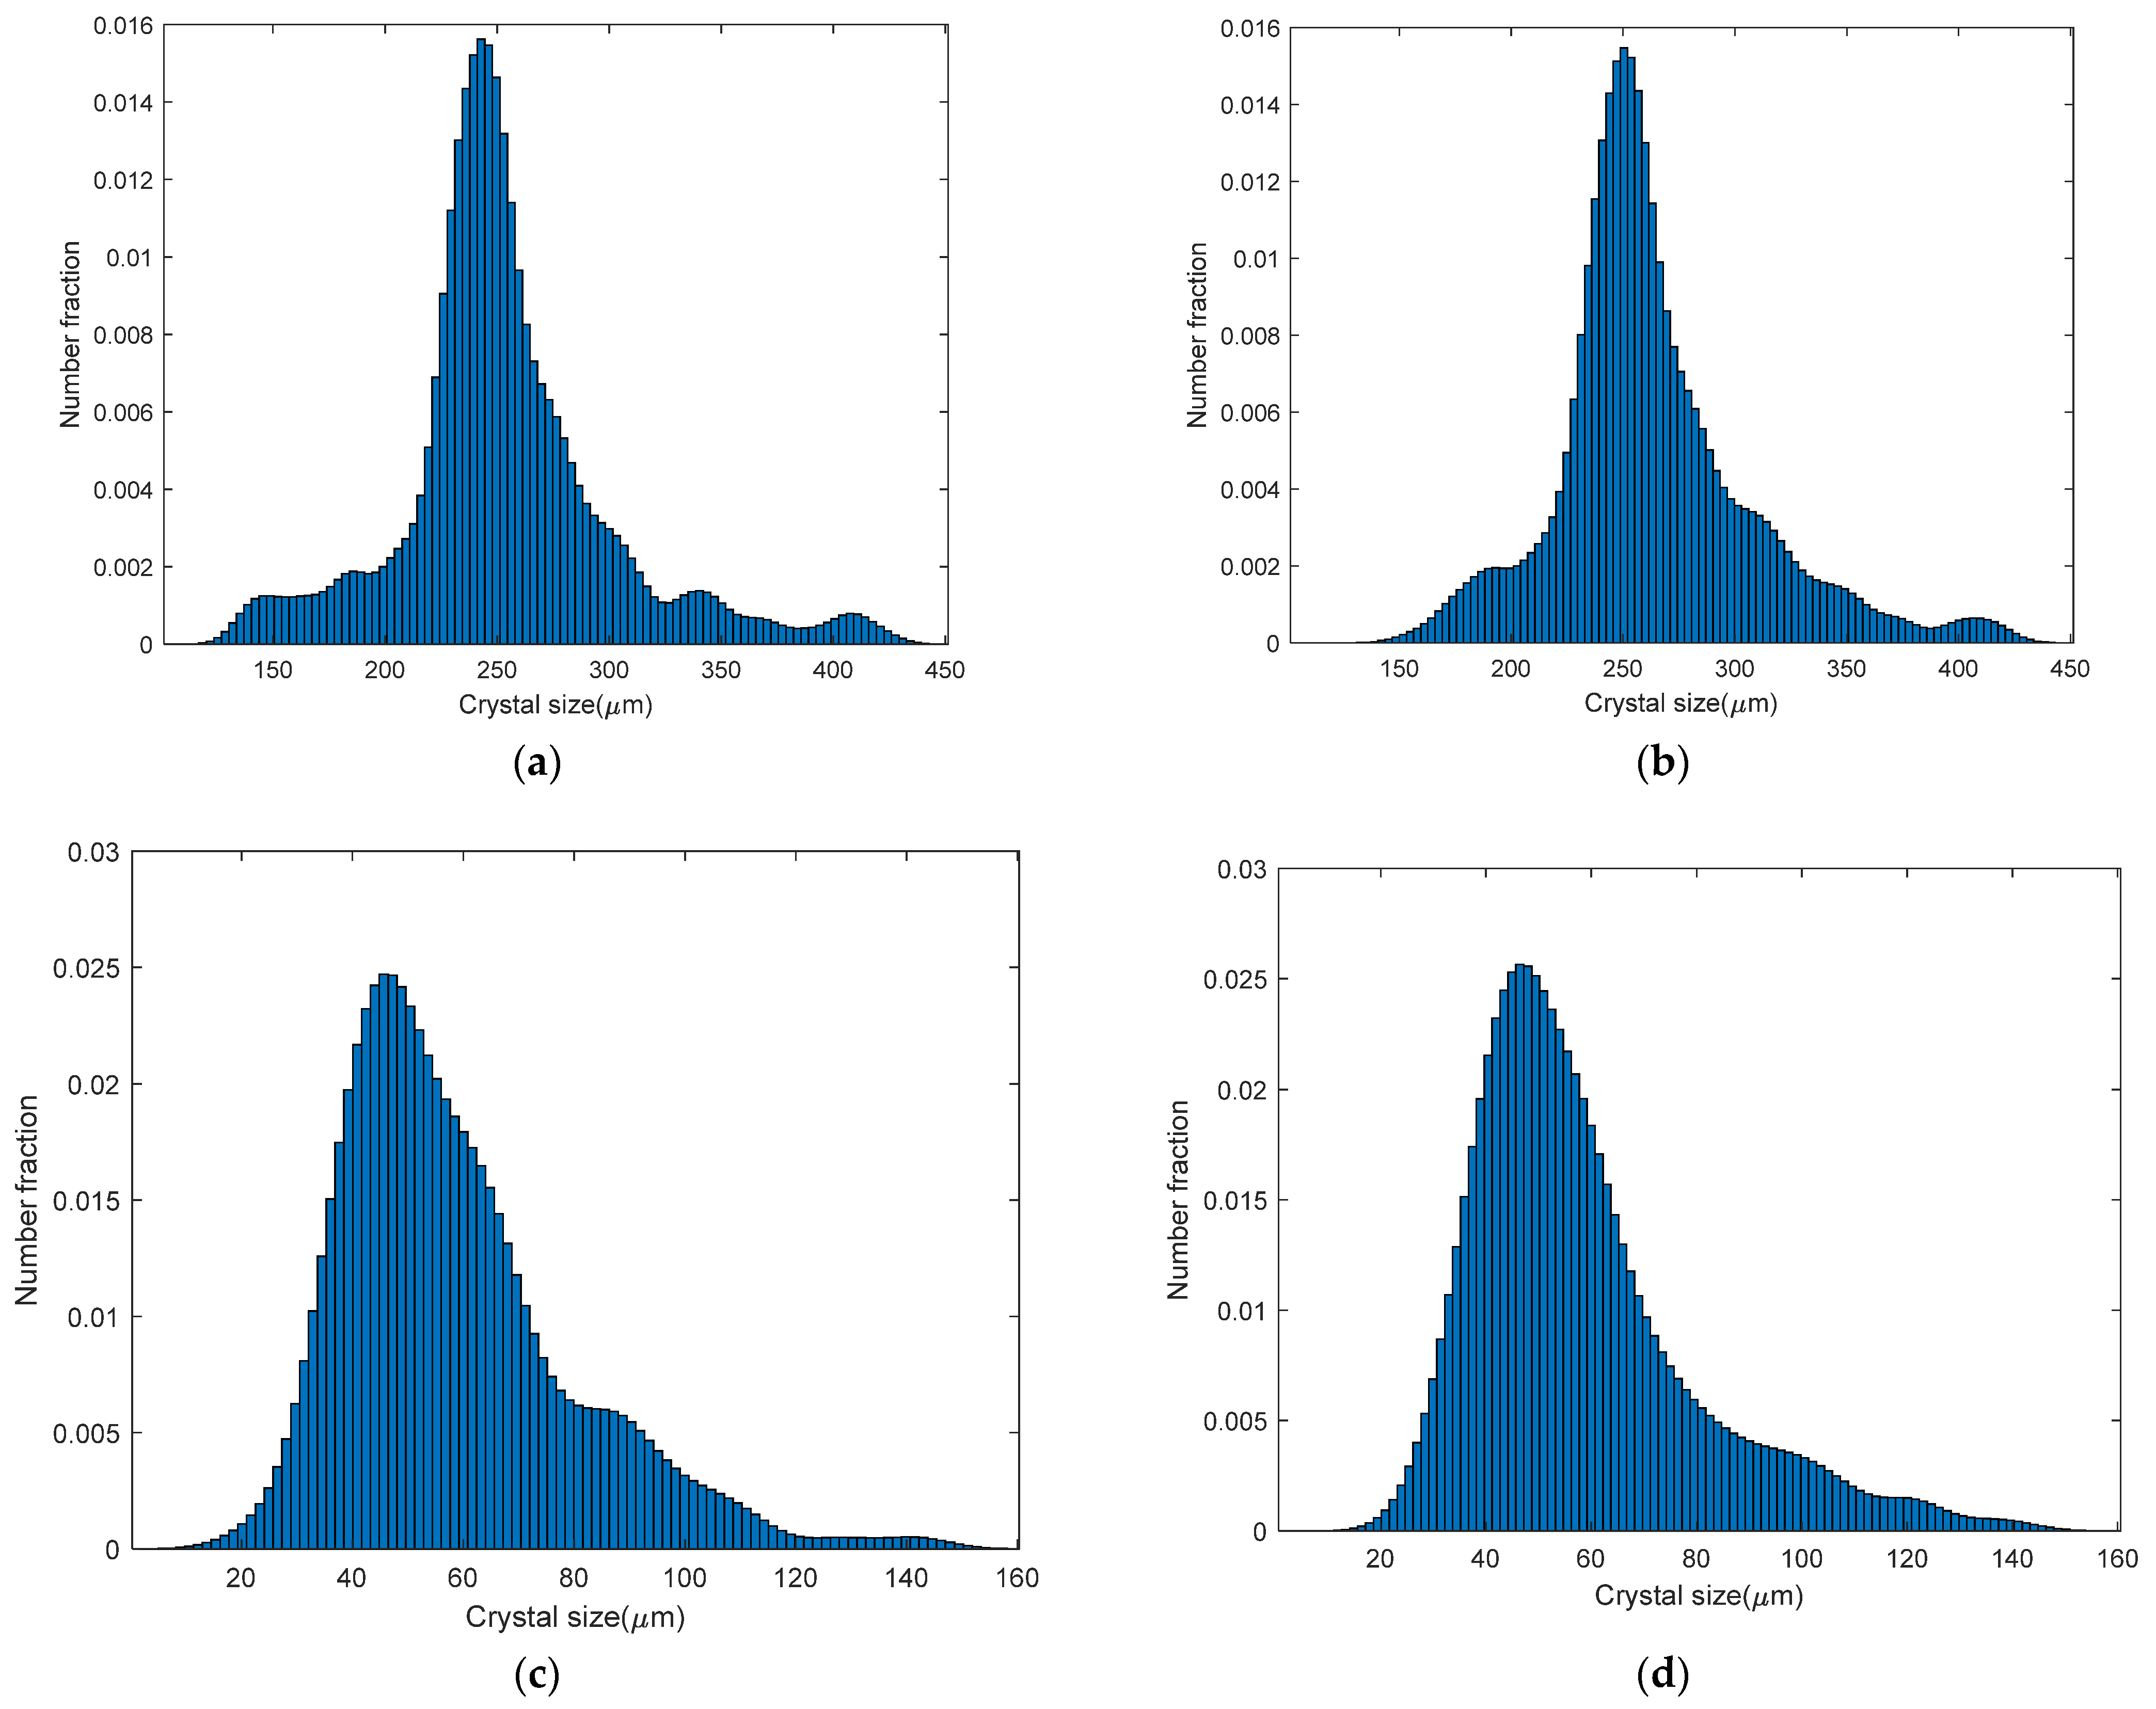
4.3. Crystal Growth Measurement

The two-dimensional sizes (i.e., length and width) of β-form LGA crystals are measured based on the length and width of the minimum enclosing rectangle [31] for crystal imaging, respectively. If l a is the pixel number of length and w a is the pixel number of width, the pixel equivalent γ e is obtained with the calibration method [10]. The physical length x l and the physical width x w are given by
x l = γ e l a x w = γ e w a
Based on Equation (5), the 2D crystal sizes can be obtained to produce CSD. For a crystal population with a large number of particles showing statistical characteristics, it is meaningful to estimate their size distribution. Generally, the probability density estimation of a log-normal distribution function can be used to smooth the CSD [32] to represent the current size condition of the crystal population.
For length, conforming to the log-normal distribution LN ( μ l , σ l 2 ) , the likelihood function with length variable x l is defined as
L ( μ l , σ l 2 ) = Π i = 1 n 1 2 π σ l x l ( i ) exp ( ln x l ( i ) μ l ) 2 2 σ l 2
The likelihood equations are:
ln L ( μ l , σ l 2 ) μ l = 1 σ l 2 i = 1 n l n x l ( i ) μ l = 0 ln L ( μ l , σ l 2 ) σ l 2 = n 2 σ l 2 + 1 2 σ l 4 i = 1 n l n x l ( i ) μ l 2 = 0
By solving Equation (7), the parameters ( μ l , σ l 2 ) are estimated as
μ ^ l = 1 n i = 1 n ln x l ( i )
σ ^ l 2 = 1 n i = 1 n ln x l ( i ) 1 n i = 1 n ln x l ( i ) 2
Then LN ( μ ^ l , σ ^ l 2 ) can be computed for denoting the length size distribution of the crystal population by using online images in a predefined time window [8].
The growth parameter of crystal population size is an important factor for crystallization detection. Traditionally, the growth rate in the mean size may not denote the size distribution evolution well, due to the noise of size extremes. Then, x l max in the maximum distribution of P ( x l ) is computed as
x l max = arg     max x l   P ( x l )
The growth rate of length R l is defined as
R l = Diff ( x l , t 1 max , x l , t 2 max ) T P 1 P 2
where Diff is the difference function between x l , t 1 max of P t 1 and x l , t 2 max of P t 2 , and T P 1 P 2 is the time interval between point t 1 and point t 2 .
Similar to length, the width size distribution LN ( μ w , σ w 2 ) and the growth rate of width R w are obtained as mentioned above.

5. Experiment Results

5.1. Deep-Learning Crystal Extraction

The experimental case on the crystallization process of β-form LGA was carried out. Compared with traditional methods [8,10,11,33,34], the method of deep-learning crystal extraction did not require too many tedious procedures (e.g., image preprocessing steps or clear crystal identification, etc.). A typically captured image is demonstrated in Figure 6a. Figure 6b displays the result of image preprocessing. In Figure 6c, the crystals are extracted with the deep leaning-based image processing method applied to the image of Figure 6b. It is seen that the minimum enclosing rectangles of the crystals are obtained in Figure 6d. The 2D sizes were obtained from the fitting rectangles. In the experiment, 40 real-time LGA images were employed as the original training set, which uses image augmentation. Flips, translation and rotation were used for variety, and the brightness and contrast were adjusted to reduce the influence of uneven lighting. Finally, noise interference was added to the training set to further improve the generalization ability of the model.
In addition, to represent the superiority of the proposed image processing method, the Ostu segmentation method and the Canny method, which are always used in the image processing of crystals [8,10,11,33,34], were performed for the two crystal images in Figure 7a. Figure 7b demonstrates the results with an improved U-net. Figure 7b,c show the results of image preprocessing using the Ostu and Canny segmentation methods, respectively. It can be seen that clear crystals are detected with an improved U-net, whereas the fuzzy crystals may affect the size measurement. Figure 7 shows that the clear crystals are effectively segmented with the proposed online analysis method, while the other two methods make several segmentation mistakes (e.g., overlapping, fuzziness, etc.). Figure 7e shows that the results of the original U-net model are less accurate than the improved one.

5.2. Crystal Size Measurement

CSD information is important for production. For crystallization quality control, it is necessary that the information feedback of crystal sizes is provided timely and effectively. In the experiment, an offline measurement method using an electric microscope was utilized to verify the accuracy of the CSD measurement with the proposed method. For the same batch of crystals, the comparison study was made between the proposed online method and the offline method by measuring 2D sizes (i.e., length and width), as shown in Figure 8. It is presented that the measured results between the two methods are very similar. It is noted the online images should be captured immediately after the crystals are added into the reactor to avoid the changes of crystal sizes and shapes.
In this experiment, the measured CSDs were fitted by the probability density estimation with the lognormal distribution function. In Figure 9, the CSDs are computed with about 200 crystals collected at time points of 0 min, 20 min, 40 min, and 60 min. The predefined time window was set as 30 s. Figure 9 shows that the crystal population size increases with time, but the range of the crystal size distribution becomes much wider. The needle-like crystals may be easier to be broken by the stirring agitator, resulting in small sizes, whereas the LGA crystals are likely to agglomerate, leading to large sizes. Therefore, the size distribution can become wider at the end of LGA crystallization.
Traditionally, the measurement of growth rate has been used with mean crystal size. However, the growth rate with mean size may not denote the size distribution evolution well, due to the noise of size extremes. It is significant for characterizing the growth rate of crystal size distribution to crystallization control. The evolution of the β-form LGA crystal population size distribution is exemplified in Table 1. At the three intervals of sample times (i.e., 0, 20, 40, and 60 min), the growth rates R l and R w were computed by Equation (11) for crystal size distribution. It is observed that the growth rate gradually increases over time, because solution supersaturation is a main driving force for crystal growth in the cooling crystallization. It is also manifested that the growth rates of β-form LGA population length were much larger than those of β-form LGA population width in Table 1. The growth in length is involved in the growth face (101), and the width is related to the faces (010) and (021) [35]. The behavior of length and width growth rates may be in relation to supersaturation, temperature, etc. It is noted that the growth data for length and width are identified more accurately by increasing the number of sampling time points.

6. Conclusions

In this work, an imaging measurement method based on a U-net network was developed to estimate crystal size evolution for β-form LGA using an online non-invasive imaging system. To improve image quality, guided filtering was used for removing the image noise. The deep-learning model with an improved U-net was effectively improved to segment the crystals from the online images. The 2D crystal sizes were measured by using the probability density function. Experimental results showed that the proposed method based on deep learning was effective in obtaining the growth rate of crystal population sizes. The agglomeration condition led to the wrong determination of the crystal sizes. Hence, future work will involve the measurement of crystal agglomeration.

Author Contributions

Conceptualization, Y.H.; methodology, B.T.; writing—original draft preparation, Y.H.; writing—review and editing, X.L.; project administration, Y.H. All authors have read and agreed to the published version of the manuscript.

Funding

This research was funded by the China Postdoctoral Science Foundation, grant number 2020M680979, and the Doctoral Start-up Foundation of Liaoning Province of China, grant numbers 2021-BS-281 and 2020-BS-263.

Institutional Review Board Statement

Not applicable.

Informed Consent Statement

Not applicable.

Data Availability Statement

Not applicable.

Conflicts of Interest

The authors declare no conflict of interest. The funders had no role in the design of the study; in the collection, analyses, or interpretation of data; in the writing of the manuscript, or in the decision to publish the results.

References

  1. Wang, X.; Li, K.; Qin, X.; Li, M.; Liu, Y.; An, Y.; Yang, W.; Chen, M.; Ouyang, J.; Gong, J. Research on mesoscale nucleation and growth processes in solution crystallization: A review. Crystals 2022, 12, 1234. [Google Scholar] [CrossRef]
  2. Wang, X.Z.; Roberts, K.J.; Ma, C. Crystal growth measurement using 2d and 3d imaging and the perspectives for shape control. Chem. Eng. Sci. 2008, 63, 1173–1184. [Google Scholar] [CrossRef]
  3. Cardona, J.; Ferreira, C.; Mcginty, J.; Hamilton, A.; Agimelen, O.S.; Cleary, A.; Atkinson, R.; Michie, C.; Marshall, S.; Chen, Y.C. Image analysis framework with focus evaluation for in situ characterisation of particle size and shape attributes. Chem. Eng. Sci. 2018, 191, 208–231. [Google Scholar] [CrossRef]
  4. Borsos, Á.; Szilágyi, B.; Agachi, P.Ş.; Nagy, Z.K. Real-time image processing based online feedback control system for cooling batch crystallization. Org. Process Res. Dev. 2017, 21, 511–519. [Google Scholar] [CrossRef] [Green Version]
  5. Gan, C.; Wang, L.; Xiao, S.; Zhu, Y. Feedback control of crystal size distribution for cooling batch crystallization using deep learning-based image analysis. Crystals 2022, 12, 570. [Google Scholar] [CrossRef]
  6. Wu, Y.; Gao, Z.; Rohani, S. Deep learning-based oriented object detection for in situ image monitoring and analysis: A process analytical technology (pat) application for taurine crystallization. Chem. Eng. Res. Des. 2021, 170, 444–455. [Google Scholar] [CrossRef]
  7. Liao, C.W.; Yu, J.H.; Tarng, Y.S. On-line full scan inspection of particle size and shape using digital image processing. Particuology 2010, 8, 286–292. [Google Scholar] [CrossRef]
  8. Ma, C.Y.; Liu, J.J.; Wang, X.Z. Measurement, modelling, and closed-loop control of crystal shape distribution: Literature review and future perspectives. Particuology 2016, 26, 1–18. [Google Scholar] [CrossRef]
  9. Huo, Y.; Guan, D.; Li, X. In situ measurement method based on edge detection and superpixel for crystallization imaging at high-solid concentrations. Crystals 2022, 12, 730. [Google Scholar] [CrossRef]
  10. Huo, Y.; Liu, T.; Liu, H.; Ma, C.Y.; Wang, X.Z. In-situ crystal morphology identification using imaging analysis with application to the l-glutamic acid crystallization. Chem. Eng. Sci. 2016, 148, 126–139. [Google Scholar] [CrossRef]
  11. Zhang, R.; Ma, C.Y.; Liu, J.J.; Wang, X.Z. On-line measurement of the real size and shape of crystals in stirred tank crystalliser using non-invasive stereo vision imaging. Chem. Eng. Sci. 2015, 137, 9–21. [Google Scholar] [CrossRef]
  12. Li, M.; Zhang, C.; Li, M.; Liu, F.; Zhou, L.; Gao, Z.; Sun, J.; Han, D.; Gong, J. Growth defects of organic crystals: A review. Chem. Eng. J. 2022, 429, 132450. [Google Scholar] [CrossRef]
  13. Larsen, P.; Rawlings, J.; Ferrier, N. An algorithm for analyzing noisy, in situ images of high-aspect-ratio crystals to monitor particle size distribution. Chem. Eng. Sci. 2006, 61, 5236–5248. [Google Scholar] [CrossRef]
  14. Zhou, Y.; Lakshminarayanan, S.; Srinivasan, R. Optimization of image processing parameters for large sets of in-process video microscopy images acquired from batch crystallization processes: Integration of uniform design and simplex search. Chemom. Intell. Lab. Syst. 2011, 107, 290–302. [Google Scholar] [CrossRef]
  15. Lins, J.; Heisel, S.; Wohlgemuth, K. Quantification of internal crystal defects using image analysis. Powder Technol. 2021, 377, 733–738. [Google Scholar] [CrossRef]
  16. Ferreira, A.; Faria, N.; Rocha, F.; Teixeira, J. Using an online image analysis technique to characterize sucrose crystal morphology during a crystallization run. Ind. Eng. Chem. Res. 2011, 50, 6990–7002. [Google Scholar] [CrossRef] [Green Version]
  17. Lu, Z.M.; Zhu, F.C.; Gao, X.Y.; Chen, B.C.; Liu, T.; Gao, Z.G. In-situ particle segmentation approach based on average background modeling and graph-cut for the monitoring of l -glutamic acid crystallization. Chemom. Intell. Lab. Syst. 2018, 178, 11–23. [Google Scholar] [CrossRef]
  18. Gao, Z.; Wu, Y.; Bao, Y.; Gong, J.; Wang, J.; Rohani, S. Image analysis for in-line measurement of multidimensional size, shape, and polymorphic transformation of l-glutamic acid using deep learning-based image segmentation and classification. Cryst. Growth Des. 2018, 18, 4275–4281. [Google Scholar] [CrossRef]
  19. Ma, C.Y.; Wang, X.Z. Model identification of crystal facet growth kinetics in morphological population balance modeling of l -glutamic acid crystallization and experimental validation. Chem. Eng. Sci. 2012, 70, 22–30. [Google Scholar] [CrossRef]
  20. Kitamura, M.; Onuma, K. In situ observation of growth process of alpha-l-glutamic acid with atomic force microscopy. J. Colloid Interface Sci. 2000, 224, 311–316. [Google Scholar] [CrossRef]
  21. Ma, C.Y.; Wang, X.Z.; Roberts, K.J. Multi-dimensional population balance modeling of the growth of rod-like l-glutamic acid crystals using growth rates estimated from in-process imaging. Adv. Powder Technol. 2007, 18, 707–723. [Google Scholar] [CrossRef]
  22. Hermanto, M.W.; Kee, N.C.; Tan, R.B.H.; Chiu, M.S.; Braatz, R.D. Robust bayesian estimation of kinetics for the polymorphic transformation of l-glutamic acid crystals. Aiche J. 2010, 54, 3248–3259. [Google Scholar] [CrossRef]
  23. Ochsenbein, D.R.; Schorsch, S.; Vetter, T.; Mazzotti, M.; Morari, M. Growth rate estimation of β l-glutamic acid from online measurements of multidimensional particle size distributions. Ind. Eng. Chem. Res. 2014, 53, 9136–9148. [Google Scholar] [CrossRef]
  24. Lecun, Y.; Bottou, L. Gradient-based learning applied to document recognition. Proc. IEEE 1998, 86, 2278–2324. [Google Scholar] [CrossRef] [Green Version]
  25. Long, J.; Shelhamer, E.; Darrell, T. Fully convolutional networks for semantic segmentation. IEEE Trans. Pattern Anal. Mach. Intell. 2015, 39, 640–651. [Google Scholar]
  26. Clevert, D.-A.; Unterthiner, T.; Hochreiter, S. Fast and accurate deep network learning by exponential linear units (elus). arXiv 2015, arXiv:1511.07289. [Google Scholar]
  27. He, K.; Sun, J.; Tang, X. Guided image filtering. IEEE Trans. Pattern Anal. Mach. Intell. 2013, 35, 1397–1409. [Google Scholar] [CrossRef]
  28. Ronneberger, O.; Fischer, P.; Brox, T. U-net: Convolutional networks for biomedical image segmentation. In Proceedings of the International Conference on Medical image computing and computer-assisted intervention, Munich, Germany, 5–9 October 2015. [Google Scholar]
  29. He, K.; Zhang, X.; Ren, S.; Sun, J. Delving deep into rectifiers: Surpassing human-level performance on imagenet classification. In Proceedings of the 15th IEEE International Conference on Computer Vision, ICCV 2015, Santiago, Chile, 11–18 December 2015; Institute of Electrical and Electronics Engineers Inc.: Santiago, Chile, 2015; pp. 1026–1034. [Google Scholar]
  30. Huo, Y.; Liu, T.; Jiang, Z.; Fan, J. U-net based deep-learning image monitoring of crystal size distribution during l-glutamic acid crystallization. In Proceedings of the 40th Chinese Control Conference, CCC 2021, Shanghai, China, 26–28 July 2021; IEEE Computer Society: Shanghai, China, 2021; pp. 2555–2560. [Google Scholar]
  31. Wang, W. Image analysis of particles by modified ferret method—Best-fit rectangle. Powder Technol. 2006, 165, 1–10. [Google Scholar] [CrossRef]
  32. Zhang, B.; Willis, R.; Romagnoli, J.A.; Fois, C.; Tronci, S.; Baratti, R. Image-based multiresolution-ann approach for online particle size characterization. Ind. Eng. Chem. Res. 2014, 53, 7008–7018. [Google Scholar] [CrossRef]
  33. Calderon De Anda, J.; Wang, X.Z.; Roberts, K.J. Multi-scale segmentation image analysis for the in-process monitoring of particle shape with batch crystallisers. Chem. Eng. Sci. 2005, 60, 1053–1065. [Google Scholar] [CrossRef]
  34. Wilkinson, M.; Jennings, K.; Hardy, M. Non-invasive video imaging for interrogating pharmaceutical crystallization processes. Microsc. Microanal. 2000, 6, 996–997. [Google Scholar] [CrossRef]
  35. Wang, X.Z.; Anda, J.; Roberts, K.J. Real-time measurement of the growth rates of individual crystal facets using imaging and image analysis: A feasibility study on needle-shaped crystals of l-glutamic acid. Chem. Eng. Res. Des. 2007, 85, 921–927. [Google Scholar] [CrossRef]
Figure 1. Architecture of convolutional neural network.
Crystals 12 01690 g001
Figure 2. Schematic drawing of the experimental setup.
Crystals 12 01690 g002
Figure 3. Flow chart of the proposed image measurement.
Crystals 12 01690 g003
Figure 4. Improved U-net network structure.
Crystals 12 01690 g004
Figure 5. Res Block.
Crystals 12 01690 g005
Figure 6. Segmentation and measurement results of the LGA image: (a) captured image; (b) image preprocessing; (c) segmented image with an improved U-net; (d) rectangle fitting.
Crystals 12 01690 g006
Figure 7. Segmentation comparison results of two LGA images: (a) captured images; (b) improved segmentation results; (c) threshold segmentation results; (d) edge detection results; (e) original U-net results.
Crystals 12 01690 g007
Figure 8. Comparisons between online and offline results of LGA crystal products: (a) histogram with the online measurement for LGA length; (b) histogram with the offline measurement for LGA length; (c) histogram with the online measurement for LGA width; (d) histogram with offline measurement for LGA width.
Crystals 12 01690 g008
Figure 9. Evolution of β-form LGA crystal size distribution at four time points with a log-normal distributed model: (a) probability density of crystal length sizes; (b) probability density of crystal width sizes.
Crystals 12 01690 g009
Table 1. Measured growth rates for 2D crystal population sizes.
Time (min) R l (μm/min) R w (μm/min)
20 (0–20)1.690.40
20 (20–40)2.580.54
20 (40–60)3.261.11
Publisher’s Note: MDPI stays neutral with regard to jurisdictional claims in published maps and institutional affiliations.

