
Observation of Pattern Formation during Electromagnetic Levitation Using High-Speed Thermography

Abstract
:1. Introduction
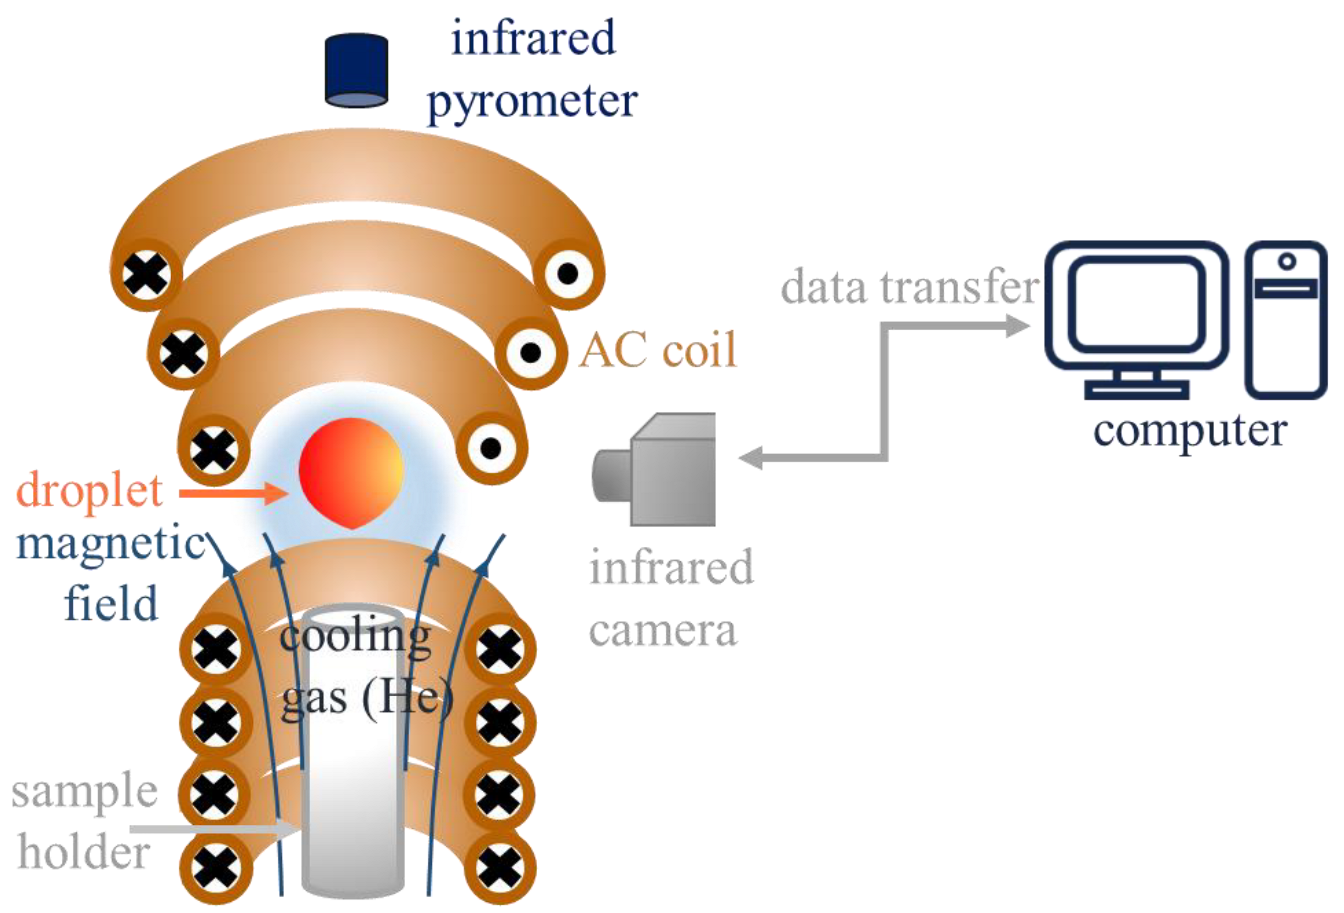
2. Experiment
- -
- a gas pumping system to reach the vacuum within the levitation camera deep enough to prevent the oxidation of the sample surface as much as possible;
- -
- a conical or cylindrical coil, inside which the alternating electric current produces the electromagnetic field directed in the side opposite to the direction of the gravitational field;
- -
- a droplet which may levitate if the balance between electromagnetic and gravitational fields is reached within the coil and strong enough to pick up the droplet from the initial holder;
- -
- a pump or gas ejector to let in cooling gas (hydrogen-helium mixture or argon) to cool down the melted droplet (after its heating due to electric current flowing in the droplet from the induced alternating electromagnetic field);
- -
- a triggering needle to initiate the process of crystallization (the needle should be made from the same material/alloy as the droplet itself).
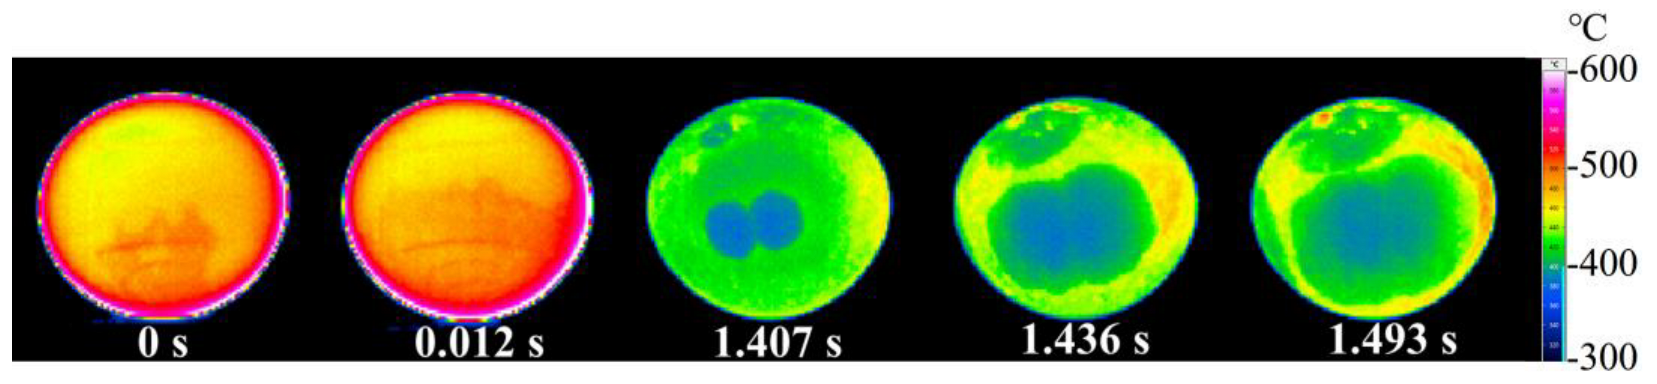
3. Results
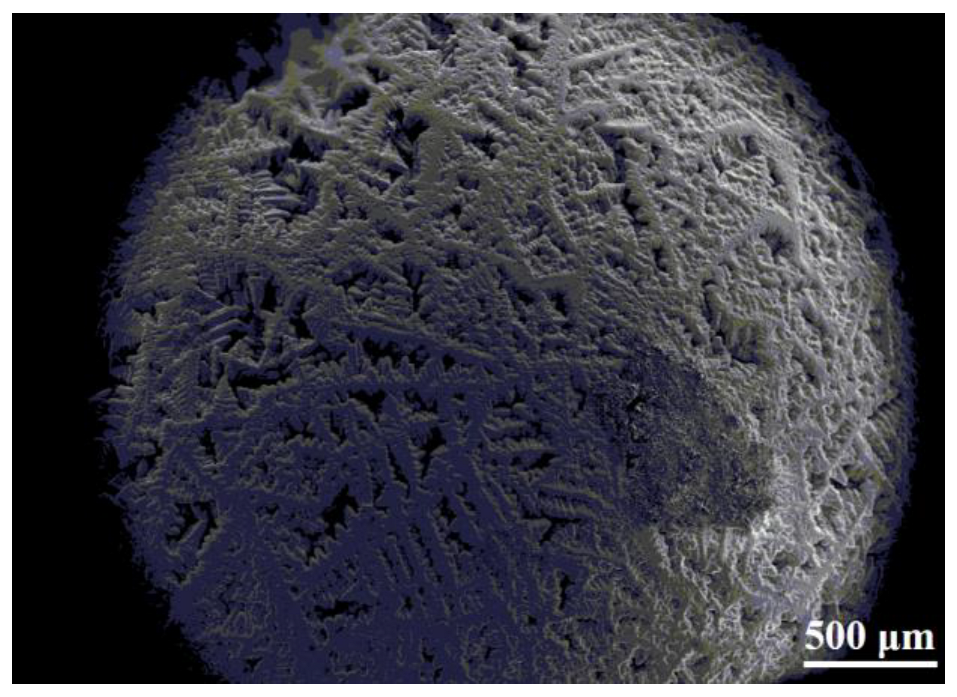
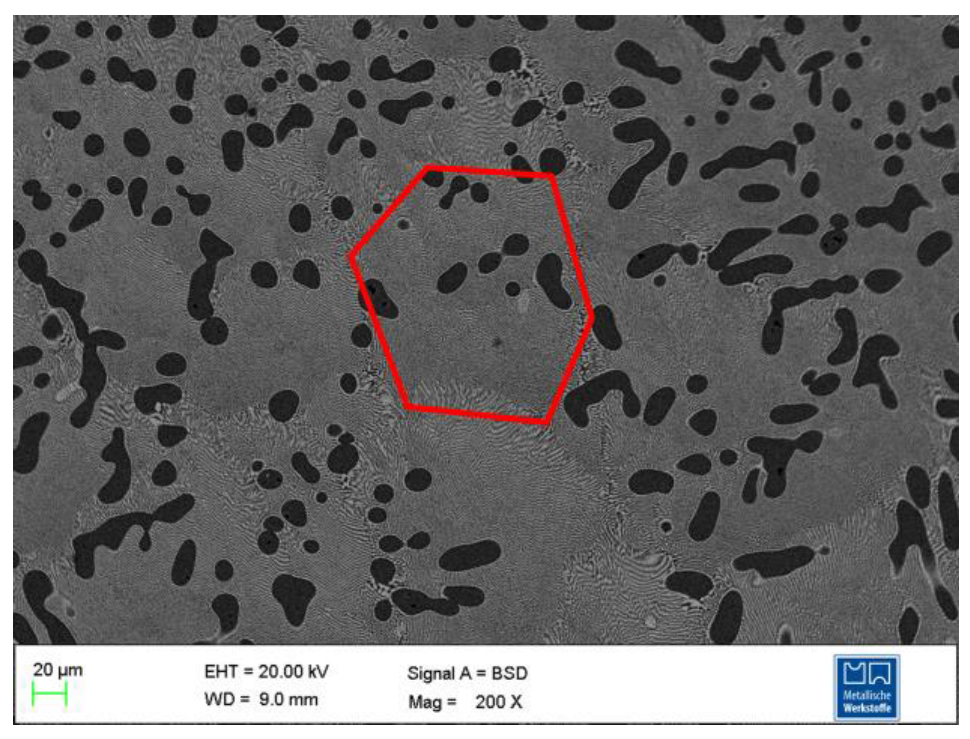
3.1. In-Situ Observation of Pattern Formation and Micrographs of Al–30.6 wt.% Cu Alloy
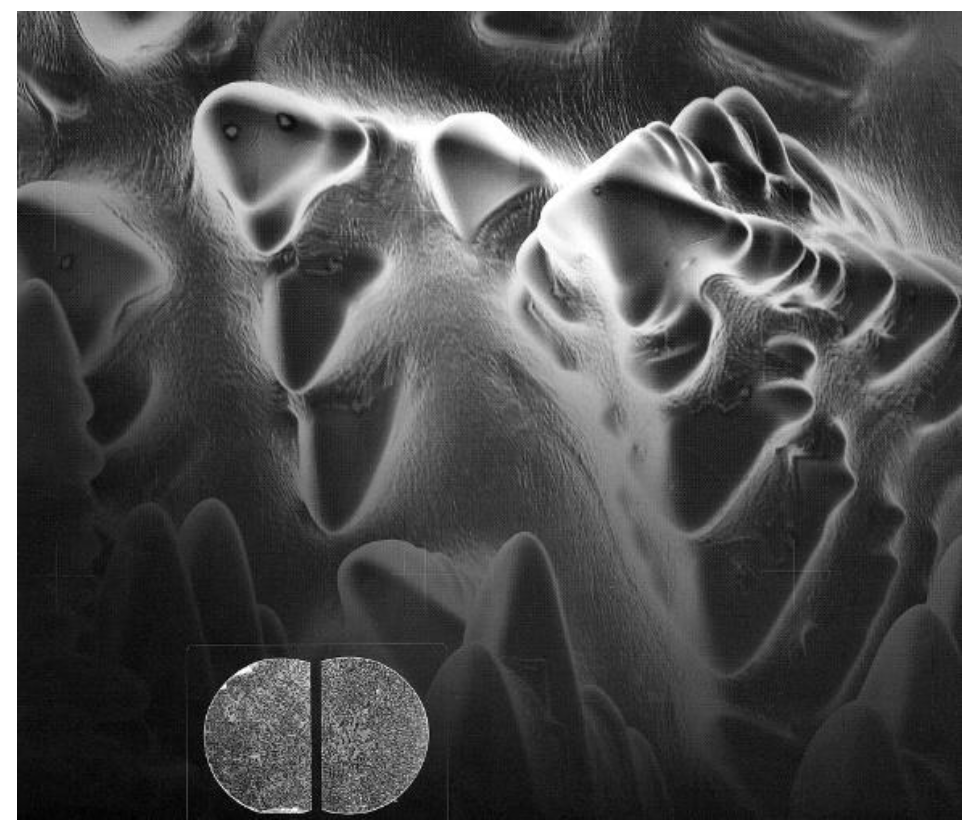
3.2. In-Situ Observation of Pattern Formation and Micrographs of Al–6 wt.% Ni Alloy
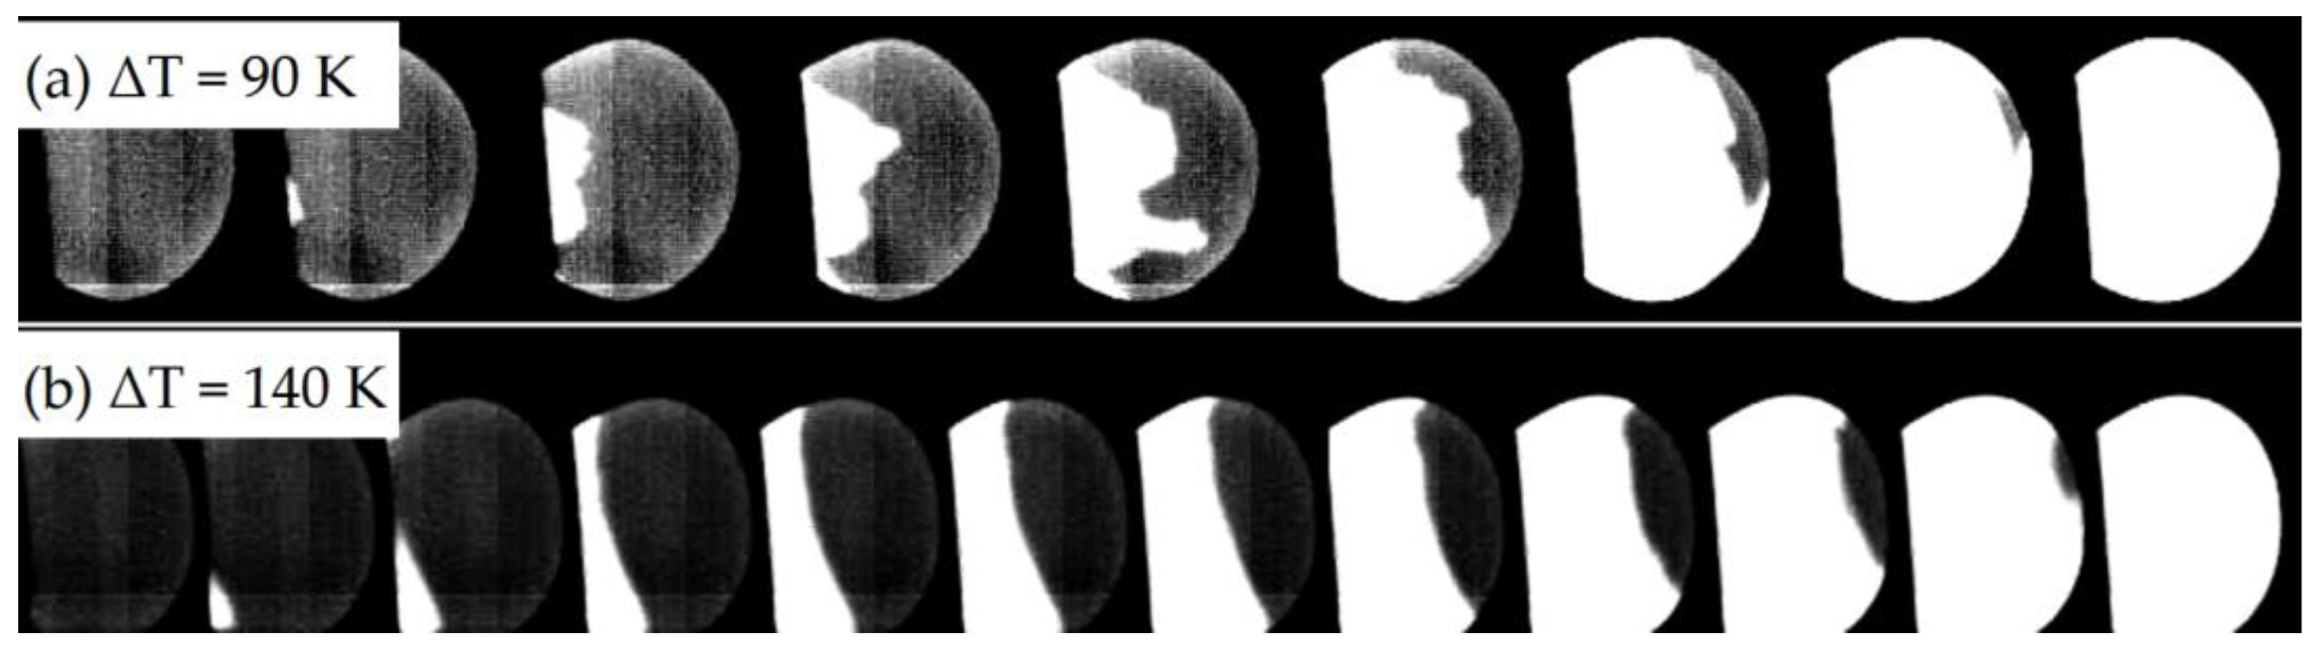
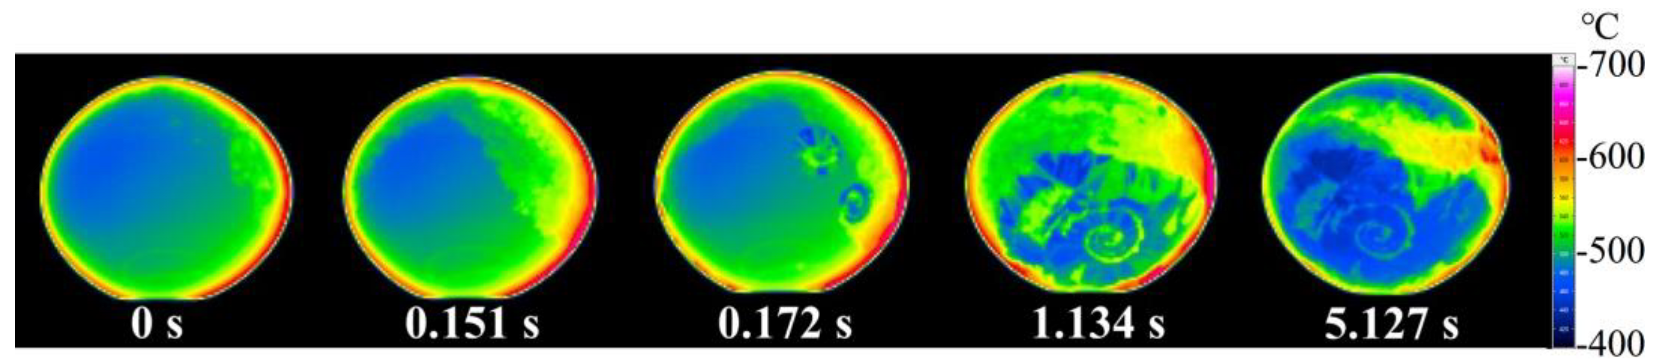
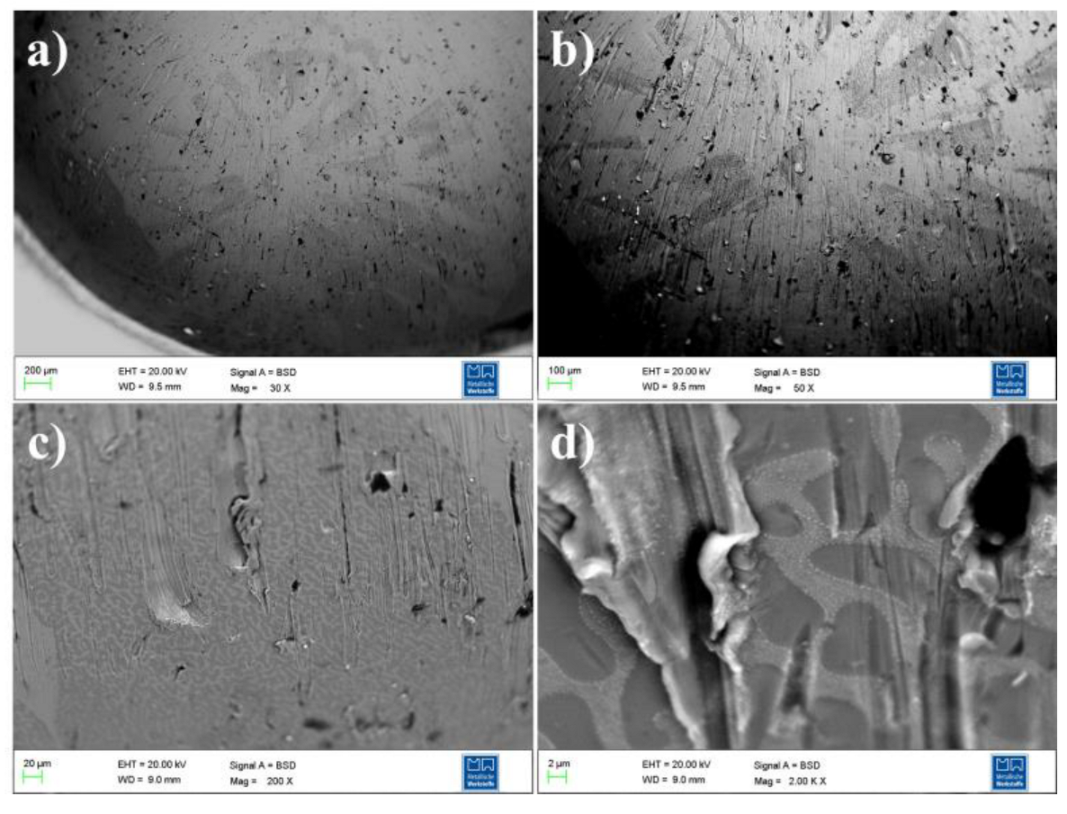
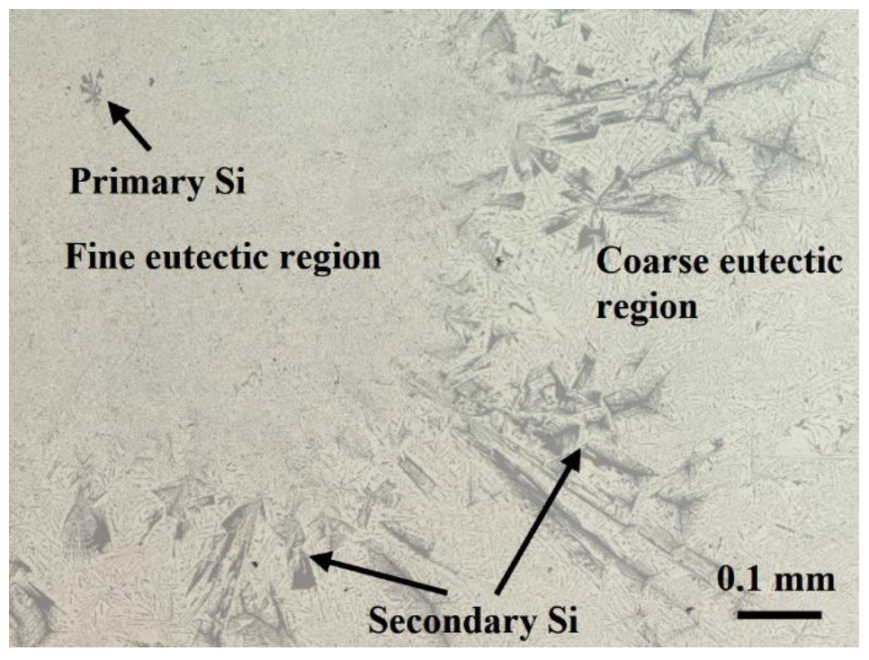
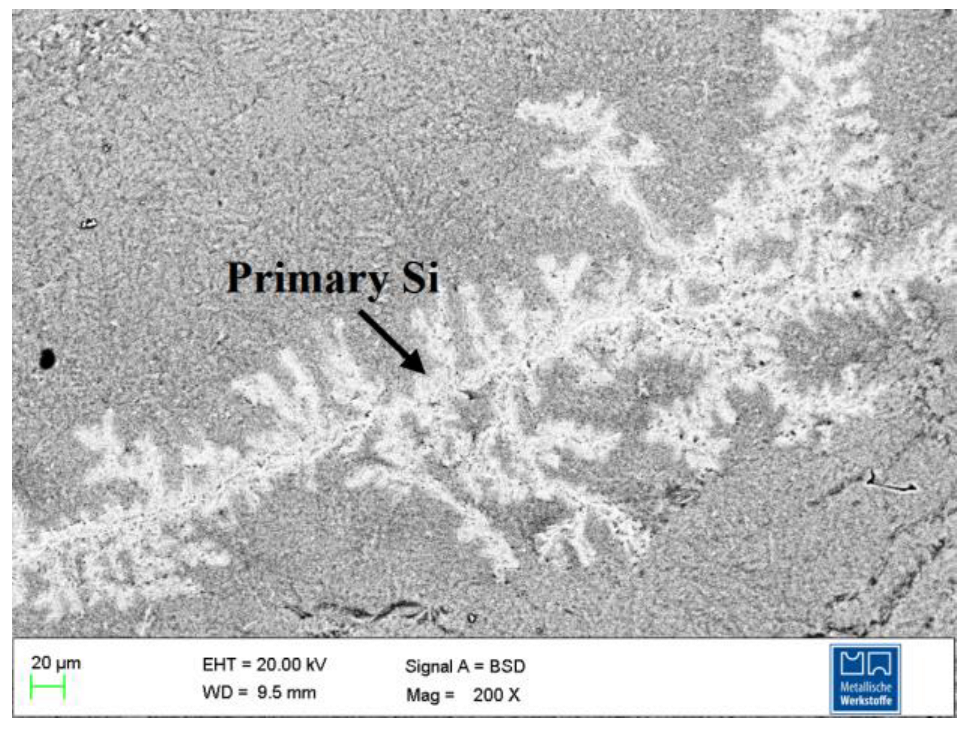
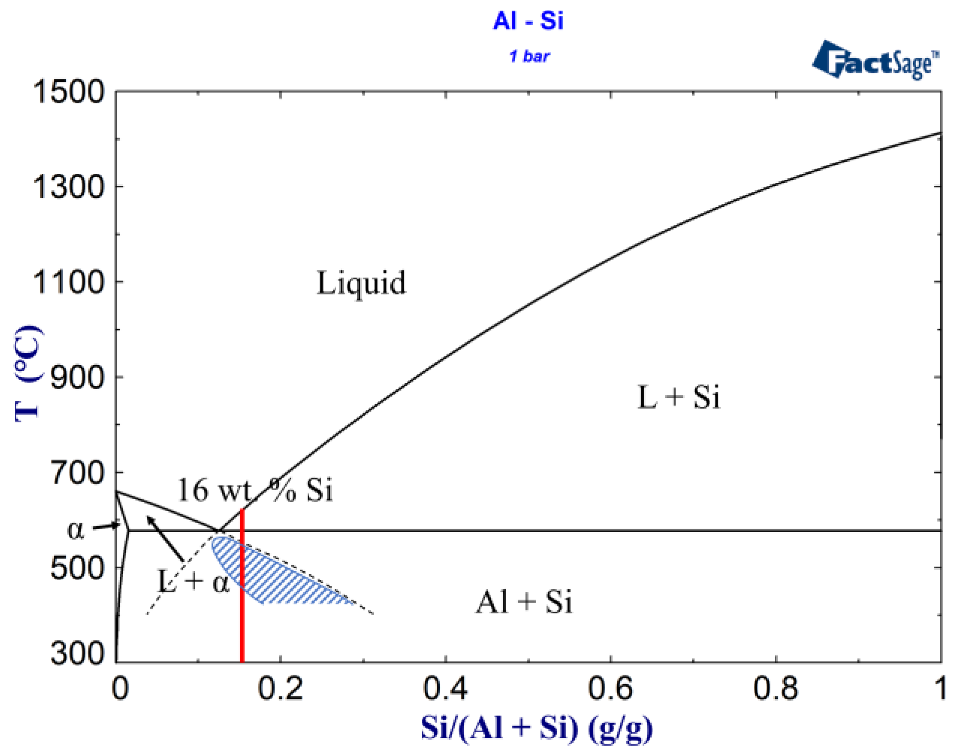
3.3. In-Situ Observation of Pattern Formation and Micrographs of Al-16 wt.% Si Alloy
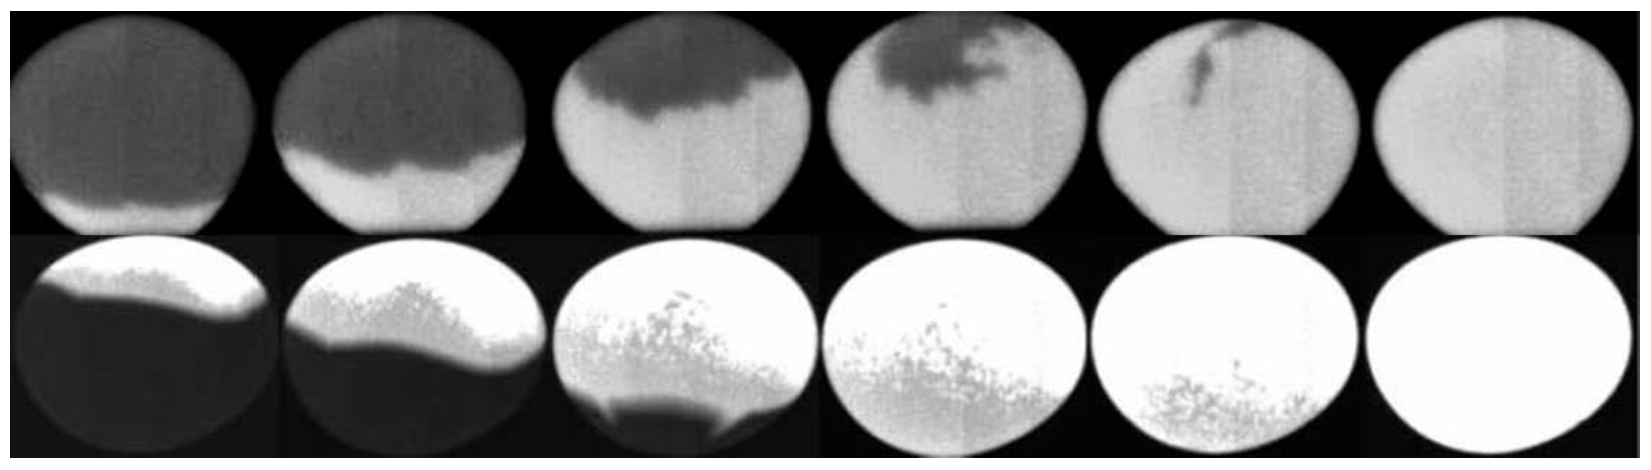
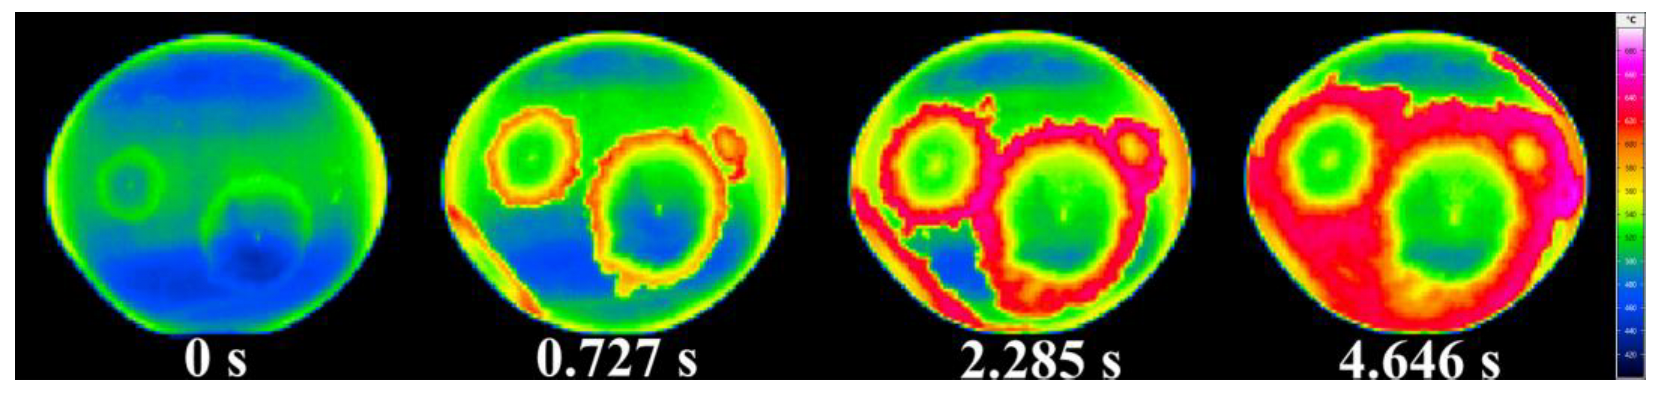
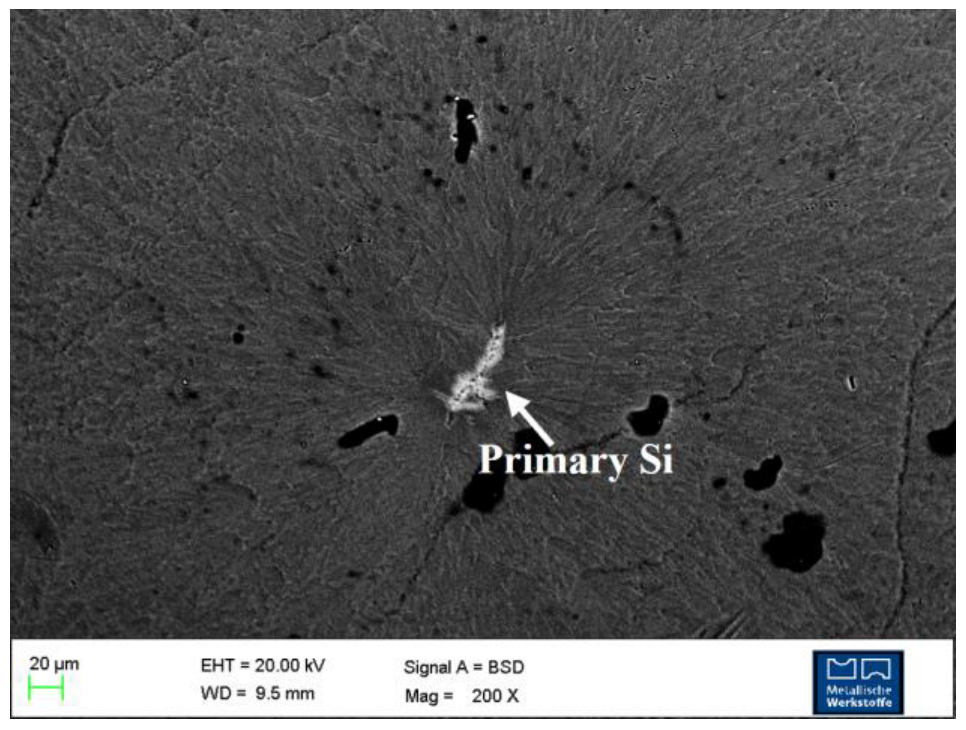
3.4. In-Situ Observation of Pattern Formation and Micrographs of Al–20 wt.% Si Alloy
4. Discussion
5. Conclusions
Author Contributions
Funding
Institutional Review Board Statement
Data Availability Statement
Acknowledgments
Conflicts of Interest
References
- Herlach, D.M. Containerless Undercooling and Solidification of Pure Metals. Annu. Rev. Mater. Sci. 1991, 21, 23–44. [Google Scholar] [CrossRef]
- Sayavur, I.; Bakhtiyarov, D.A.S. Electromagnetic Levitation Part I: Theoretical and Experimental Considerations. Fluid Dyn. Mater. Process. 2008, 4, 99–112. [Google Scholar] [CrossRef]
- Sayavur, I.; Bakhtiyarov, D.A.S. Electromagnetic Levitation Part II: Thermophysical Property Measurements in Terrestrial Conditions. Fluid Dyn. Mater. Process. 2008, 4, 163–184. [Google Scholar] [CrossRef]
- Jones, H. Rapid Solidification of Metals and Alloys; The Institution of Metallurgists: London, UK, 1982. [Google Scholar]
- Herlach, D.M.; Galenko, P.K.; Holland-Moritz, D. Metastable solids from undercooled melts. In Pergamon Materials Series; Elsevier: Amsterdam, The Netherlands, 2007. [Google Scholar]
- Sayavur, I.; Bakhtiyarov, D.A.S. Electromagnetic Levitation Part III: Thermophysical Property Measurements in Microgravity. Fluid Dyn. Mater. Process. 2009, 5, 1–22. [Google Scholar] [CrossRef]
- Schleip, E.; Willnecker, R.; Herlach, D.M.; Görler, G.P. Measurements of ultrarapid solidification rates in greatly undercooled bulk melts with a high speed photosensing device. Mater. Sci. Eng. 1988, 98, 39–42. [Google Scholar] [CrossRef]
- Willnecker, R.; Herlach, D.M.; Feuerbacher, B. Evidence of nonequilibrium processes in rapid solidification of undercooled metals. Phys. Rev. Lett. 1989, 62, 2707–2710. [Google Scholar] [CrossRef] [PubMed]
- Eckler, K.; Kratz, M.; Egry, I. New technique of measuring dendrite growth velocities in undercooled metallic melts. Rev. Sci. Instrum. 1993, 64, 2639–2642. [Google Scholar] [CrossRef]
- Eckler, K.; Herlach, D.M. Measurements of dendrite growth velocities in undercooled pure Ni-melts—Some new results. Mater. Sci. Eng. A 1994, 178, 159–162. [Google Scholar] [CrossRef]
- Matson, D.M. The measurement of dendrite tip propagation velocity during growth into undercooled metallic melts. In Solidification; Chun, J.H., Marsh, S.P., Dantzig, J.A., Trivedi, R., Hofmeister, W., Chu, M.G., Lavernia, E.J., Eds.; TMS: Warrendale, PA, USA, 1998; pp. 233–241. [Google Scholar]
- Funke, O.; Phanikumar, G.; Galenko, P.K.; Chernova, L.; Reutzel, S.; Kolbe, M.; Herlach, D.M. Dendrite growth velocity in levitated undercooled nickel melts. J. Cryst. Growth 2006, 297, 211–222. [Google Scholar] [CrossRef] [Green Version]
- Hartmann, H.; Galenko, P.K.; Holland-Moritz, D.; Kolbe, M.; Herlach, D.M.; Shuleshova, O. Nonequilibrium solidification in undercooled Ti45Al55 melts. J. Appl. Phys. 2008, 103, 073509. [Google Scholar] [CrossRef]
- Gao, J.; Kao, A.; Bojarevics, V.; Pericleous, K.; Galenko, P.K.; Alexandrov, D.V. Modeling of convection, temperature distribution and dendritic growth in glass-fluxed nickel melts. J. Cryst. Growth 2017, 471, 66–72. [Google Scholar] [CrossRef]
- Draper, J.W. On the Production of Light by Heat. Lond. Edinb. Dublin Philos. Mag. J. Sci. 1847, 302, 345–359. [Google Scholar] [CrossRef] [Green Version]
- Karrasch, C. Solidification Kinetics in Undercooled Pure Iron and Iron-Boron Alloys under Different Fluid Flow Conditions. Doctoral Dissertation, Ruhr University Bochum, Bochum, Germany, 2016. [Google Scholar]
- ImageIR® 8300 hs Serizes. Available online: https://www.infratec.eu/thermography/infrared-camera/imageir-8300-hs/ (accessed on 29 September 2022).
- Zhang, J.; Zhang, F.; Luo, X.; Zhou, Q.; Wang, H. Rapid solidification of a FeSi intermetallic compound in undercooled melts: Dendrite growth and microstructure transitions. J. Mater. Sci. 2019, 55, 4094–4112. [Google Scholar] [CrossRef]
- Fang, Y.; Galenko, P.K.; Liu, D.; Hack, K.; Rettenmayr, M.; Lippmann, S. Thermodynamic description of metastable fcc/liquid phase equilibria and solidification kinetics in Al-Cu alloys. Philos. Trans. R. Soc. A Math Phys. Eng. Sci. 2022, 380, 20200327. [Google Scholar] [CrossRef]
- Nagashio, K.; Nozaki, K.; Kuribayashi, K.; Katayama, Y. Dynamic process of dendrite fragmentation in solidification from undercooled Si melt using time-resolved x-ray diffraction. Appl. Phys. Lett. 2007, 91, 061916. [Google Scholar] [CrossRef]
- Gangopadhyay, A.K.; Lee, G.W.; Kelton, K.F.; Rogers, J.R.; Goldman, A.I.; Robinson, D.S.; Rathz, T.J.; Hyers, R.W. Beamline electrostatic levitator forin situhigh energy x-ray diffraction studies of levitated solids and liquids. Rev. Sci. Instrum. 2005, 76, 073901. [Google Scholar] [CrossRef] [Green Version]
- Witteveen, J.P.; van Gastel, R.; van Houselt, A.; Zandvliet, H.J.W. 3D modeling of electromagnetic levitation coils. Curr. Appl. Phys. 2021, 32, 45–49. [Google Scholar] [CrossRef]
- Galenko, P.K.; Jou, D. Rapid solidification as non-ergodic phenomenon. Phys. Rep. 2019, 818, 1–70. [Google Scholar] [CrossRef]
- Wert, C.; Zener, C. Interference of Growing Spherical Precipitate Particles. J. Appl. Phys. 1950, 21, 5–8. [Google Scholar] [CrossRef]
- Raj, S.V.; Salem, J.A.; Locci, I.E.; Pawlik, R.J. Effect of directionally solidified microstructures on the room-temperature fracture-toughness properties of Ni-33(at. pct)Al-33Cr-1Mo and Ni-33(at. pct)Al-31Cr-3Mo eutectic alloys grown at different solidification rates. Metall. Mater. Trans. A 2002, 33, 597–612. [Google Scholar] [CrossRef]
- Gangopadhyay, A.K.; Sellers, M.E.; Bracker, G.P.; Holland-Moritz, D.; Van Hoesen, D.C.; Koch, S.; Galenko, P.K.; Pauls, A.K.; Hyers, R.W.; Kelton, K.F. Demonstration of the effect of stirring on nucleation from experiments on the International Space Station using the ISS-EML facility. NPJ Microgravity 2021, 7, 31. [Google Scholar] [CrossRef] [PubMed]
- Kurtuldu, G.; Loffler, J.F. Multistep Crystallization and Melting Pathways in the Free-Energy Landscape of a Au-Si Eutectic Alloy. Adv. Sci. (Weinh.) 2020, 7, 1903544. [Google Scholar] [CrossRef] [PubMed]
- Barrirero, J. Eutectic Modification of Al-Si Casting Alloys. Ph.D. Thesis, Linköpings University, Linköping, Sweden, 2019. [Google Scholar]
- Narayan Prabhu, K. Review of Microstructure Evolution in Hypereutectic Al–Si Alloys and its Effect on Wear Properties. Trans. Indian Inst. Met. 2013, 67, 1–18. [Google Scholar] [CrossRef]


Publisher’s Note: MDPI stays neutral with regard to jurisdictional claims in published maps and institutional affiliations. |
© 2022 by the authors. Licensee MDPI, Basel, Switzerland. This article is an open access article distributed under the terms and conditions of the Creative Commons Attribution (CC BY) license (https://creativecommons.org/licenses/by/4.0/).
Share and Cite
Fang, Y.; Liu, D.; Zhu, Y.; Galenko, P.K.; Lippmann, S. Observation of Pattern Formation during Electromagnetic Levitation Using High-Speed Thermography. Crystals 2022, 12, 1691. https://doi.org/10.3390/cryst12121691
Fang Y, Liu D, Zhu Y, Galenko PK, Lippmann S. Observation of Pattern Formation during Electromagnetic Levitation Using High-Speed Thermography. Crystals. 2022; 12(12):1691. https://doi.org/10.3390/cryst12121691
Chicago/Turabian StyleFang, Yindong, Dongmei Liu, Yongfu Zhu, Peter K. Galenko, and Stephanie Lippmann. 2022. "Observation of Pattern Formation during Electromagnetic Levitation Using High-Speed Thermography" Crystals 12, no. 12: 1691. https://doi.org/10.3390/cryst12121691