Article

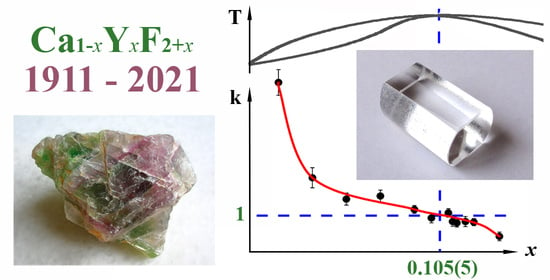
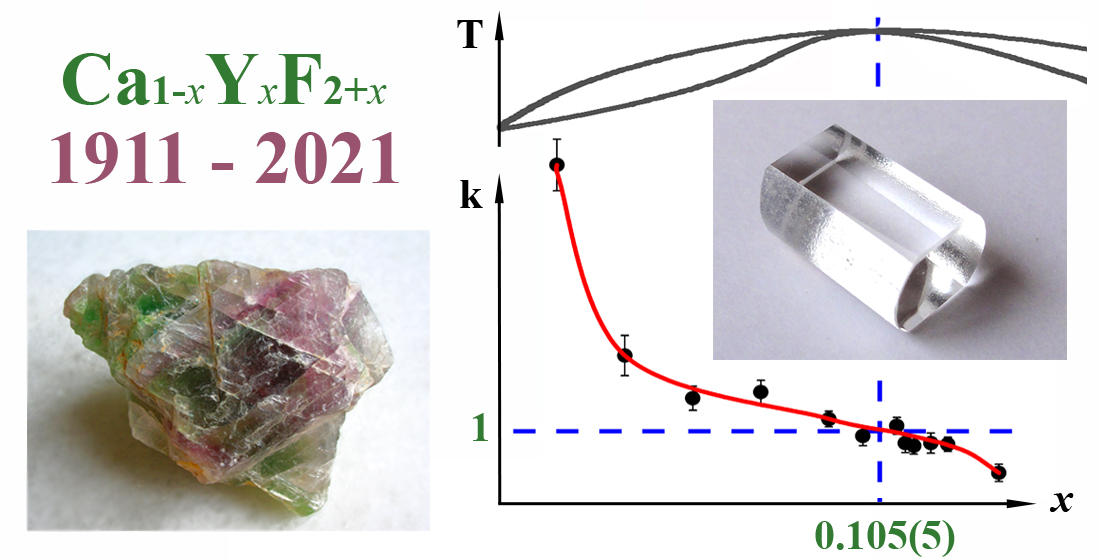
Refinement of the Congruently Melting Composition of Nonstoichiometric Fluorite Crystals Ca1-xYxF2x (x = 0.01–0.14) †

Federal Scientific Research Centre “Crystallography and Photonics”, Shubnikov Institute of Crystallography, Russian Academy of Sciences, 119333 Moscow, Russia
*
Author to whom correspondence should be addressed.
dedicated to the 110th anniversary of the mineral yttrofluorite discovery.
Crystals 2021, 11(6), 696; https://doi.org/10.3390/cryst11060696
Submission received: 27 May 2021 / Revised: 10 June 2021 / Accepted: 15 June 2021 / Published: 17 June 2021
(This article belongs to the Special Issue Functional Materials Based on Rare-Earth Elements)

Abstract

:
The concentration series of nonstoichiometric crystals Ca1xYxF2+x (x = 0.01–0.14) was obtained from a melt by directional crystallization to refine the composition of the temperature maximum on the melting curves. A precision (±9 × 10⁻⁵ Å) determination of lattice parameters of the Ca1xYxF2+x crystals with the structure of fluorite (sp. gr. Fm-3m) was performed, and a linear equation of their concentration dependence was calculated: a(x) = 5.46385(5) + 0.1999(4) x. The distribution of yttrium along the crystals Ca1xYxF2+x, the content of which is determined by the precision lattice parameters, is studied. The congruently melting composition x = 0.105(5) of the Ca1xYxF2+x phase is refined by the method of directional crystallization.

Graphical Abstract

1. Introduction

Modern photonics devices require crystal materials operating in the UV and vacuum UV spectral ranges. The performance characteristics of single-component fluoride crystals (CaF2, BaF2) do not meet the requirements of new applications, especially for extreme conditions (low operating temperatures and their fluctuations, vacuum, high mechanical loadings). The need for new materials that are transparent in the short-wavelength range of a spectrum can be met by obtaining crystals of complex composition with improved properties. Such materials include crystals of strongly nonstoichiometric phases with the structure of fluorite - Ca1–xYxF2+x (x < 0.38) solid solutions.
Ca1–xYxF2+x crystals were discovered 110 years ago by T. Vogt as the mineral yttrofluorite (Figure 1a) [1]. This work is dedicated to the anniversary of this discovery, which was followed by the epoch-making development of nonstoichiometry in inorganic fluorides of alkaline earth and rare earth elements (then called «mixed crystals») and fluoride materials science.
The scientific basis for the search for new multicomponent fluoride materials was the study of phase diagrams of more than 200 systems of the MFmRFn (M, R −27 metals; m, n ≤ 4) in order to search for new phases. The results of the study of phase diagrams are summarized in [2]. The most promising applications have the crystals of 48 fluorite nonstoichiometric phases M1–xRxF2+x (M = Ca, Sr, Ba; R = Y, La-Lu).
Despite the prospects of M1–xRxF2+x crystals as an alternative, if necessary, to single-component MF2 fluorides, the latter have been and remain the only optical structural materials for the VUV, UV, and mid-IR spectral ranges. In addition to technological tradition, this is largely determined by the lack of necessary characteristics of new materials that prove their preference for specific tasks over traditional MF2. The prospects of some crystals of multicomponent nonstoichiometric fluorides as optical materials for the VUV spectral range were considered in [3].
Of all the MF2RF3 systems in which congruently melting fluorite phases M1–xRxF2+x are formed, it was the Ca1–xYxF2+x crystals in the CaF2–YF3 system that were the first to be obtained by spontaneous crystallization of a melt [4]. They should still be recognized as the most promising optical fluoride multicomponent material with improved properties compared to commercially produced CaF2 optical crystals (Figure 1b). The isomorphic introduction of yttrium into CaF2 is accompanied by a several-fold increase in hardness compared to CaF2, which makes it possible to engrave a CaF2 crystal with Ca1–xYxF2+x (Figure 1c).
The Ca1–xYxF2+x crystals as active media for lasers were first proposed [5] in 1965, and today, interest in them still remains [6]. The spectroscopic properties of Nd3+ [7,8], Tm3+ [9] and Yb3+ [10] doped Ca1–xYxF2+x solid solution crystals were studied.
In a process of finishing of optical products (lenses, prisms, etc.) of complex shapes from fluorite crystals, chips occur along the characteristic planes (111) of perfect cleavage (Figure 2a). This reduces the yield of products and, accordingly, leads to an increase in the cost of the final product. Ca1–xYxF2+x crystals lose their perfect fluorite cleavage and acquire a conchoidal fracture (Figure 2b,c). The deterioration of cleavage significantly simplifies the process of manufacturing of structural optical elements.
The production of optical materials of multicomponent composition is generally limited by the incongruent crystallization of melts of complex composition. The structural defectiveness of nonstoichiometric fluorite crystals M1–xRxF2+x often manifests itself in an anomaly—the temperature maximum on the melting curves [11]. The compositions corresponding to the maxima melt congruently, ensuring a uniform distribution of components over the bulk of a crystal boule. This is the crucial property of an optical material—optical perfection. However, most of the temperature maxima have a smooth shape, which makes it difficult to find the exact composition with congruent behavior of a melt via the usual method of differential thermal analysis (DTA).
The nonstoichiometric Ca1–xYxF2+x fluorite phase has a smooth maximum. Attempts to determine it using the DTA method [4,12] showed insufficient accuracy of the method in relation to the flat shape of the melting curves for Ca1–xYxF2+x crystals.
The phase diagram of the CaF2–YF3 system (Figure 3) was investigated and published in [13]. The temperature dependence of the solubility of YF3 in CaF2 from 1123 K to the eutectic temperature of 1393 K is practically absent. The ultimate solubility of YF3 in CaF2 is defined as x = 0.38. The coordinates of the maximum on the melting curves of Ca1–xYxF2+x, found by the DTA are x = 0.11 ± 0.02 and 1695 ± 5 K [14].
The accuracy of the DTA (±10 K) is not sufficient to solve the question of congruence of the Ca1–xYxF2+x phase melting, since the pure component of CaF2 melts at 1691 (±5 K). In [13], an autoradiographic method for estimating the maximum coordinate was used, which is more accurate than DTA. It is shown that when growing a crystal from a charge of composition x = 0.10, the final section of a crystal is yttrium depleted. Thus, for this composition, the distribution coefficient of YF3 k > 1 and the temperature maximum on the melting curves are at a concentration of x > 0.10.
For the first time, the composition of the Ca1–xYxF2+x solid solution with a congruent melting was determined as x = 0.12 in 1914 by the discoverer of yttrofluorite T. Vogt. He used a very inaccurate method of visual polythermal analysis [4].
There are studies where both a significantly higher concentration of YF3x = 0.33 (Tm = 1716 K, grown in a platinum crucible) [15] and a twice lower concentration of x = 0.05 (Tm = 1711 K, grown in HF current) were obtained for the composition of the maximum [16]. In both cases, the maximum was determined by the melting temperature (Tm), which was measured with an accuracy of ±10 K. In [15], the melting temperature was measured only for three compositions with a step of Δx = 0.10, and in [16], only for two compositions—x = 0.053 and 0.11. These data are not sufficient to determine the maximum position with a smooth bend of melting curves.
The error of the DTA method is superimposed on the inaccuracy of determining the composition. For the analysis of a composition, it is common to use a concentration dependence of lattice parameters. In the previous studies of the composition of the maximum, inaccuracies in finding the lattice parameter were significant.
The directional crystallization of the two-component CaF2-YF3 melt in the area of homogeneity of the Ca1–xYxF2+x phase with deviations from the congruent composition leads to a non-uniform distribution of yttrium along the crystal length. Therefore, using the effect of component differentiation in combination with the precision determination of the dependence of lattice parameters on a composition, it is possible to refine the congruently melting composition of Ca1–xYxF2+x crystals.
The aim of the work is to obtain single crystals of Ca1–xYxF2+x (x = 0–0.14) by directional crystallization of a melt and to determine the concentration dependence of the precision lattice parameters to clarify the composition of the phase with a congruent melting.

2. Materials and Methods
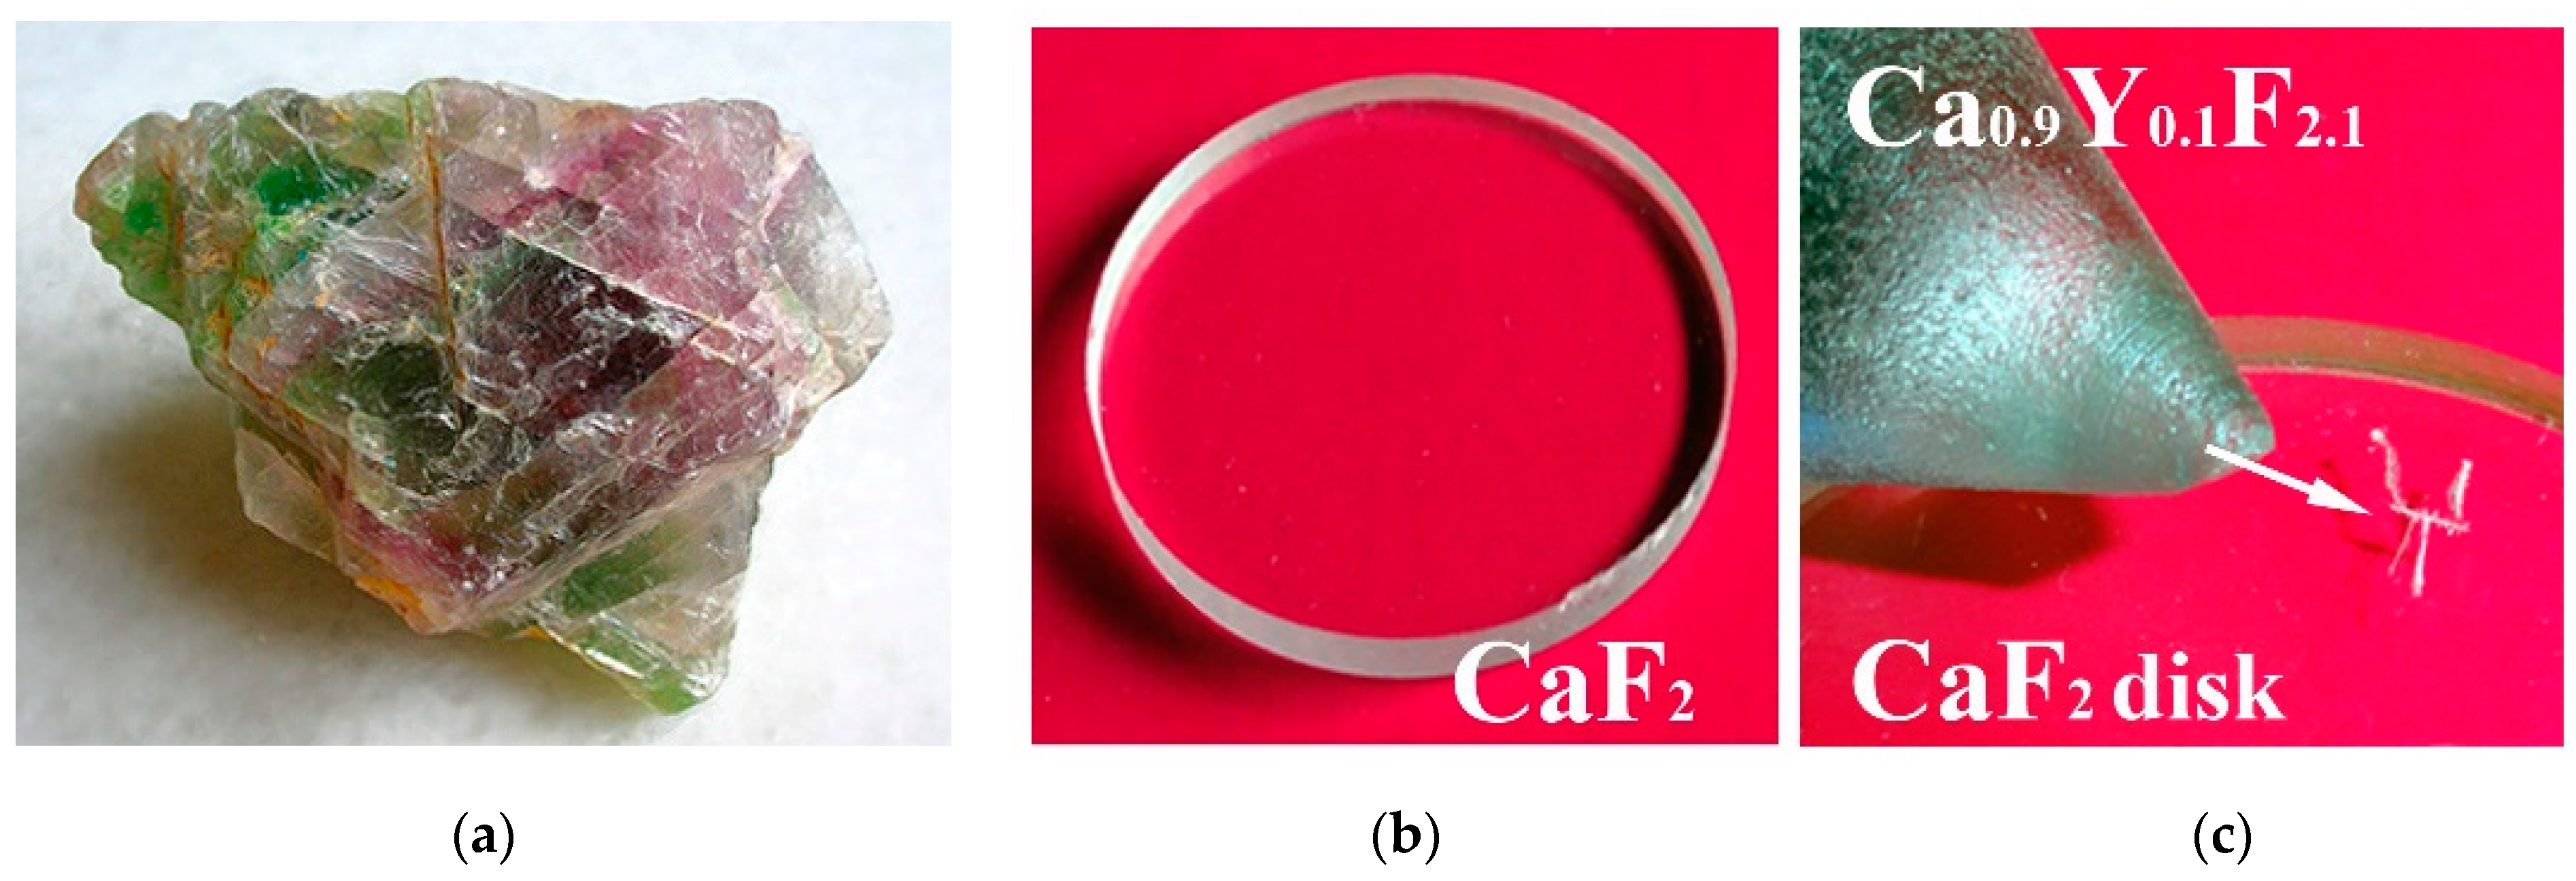
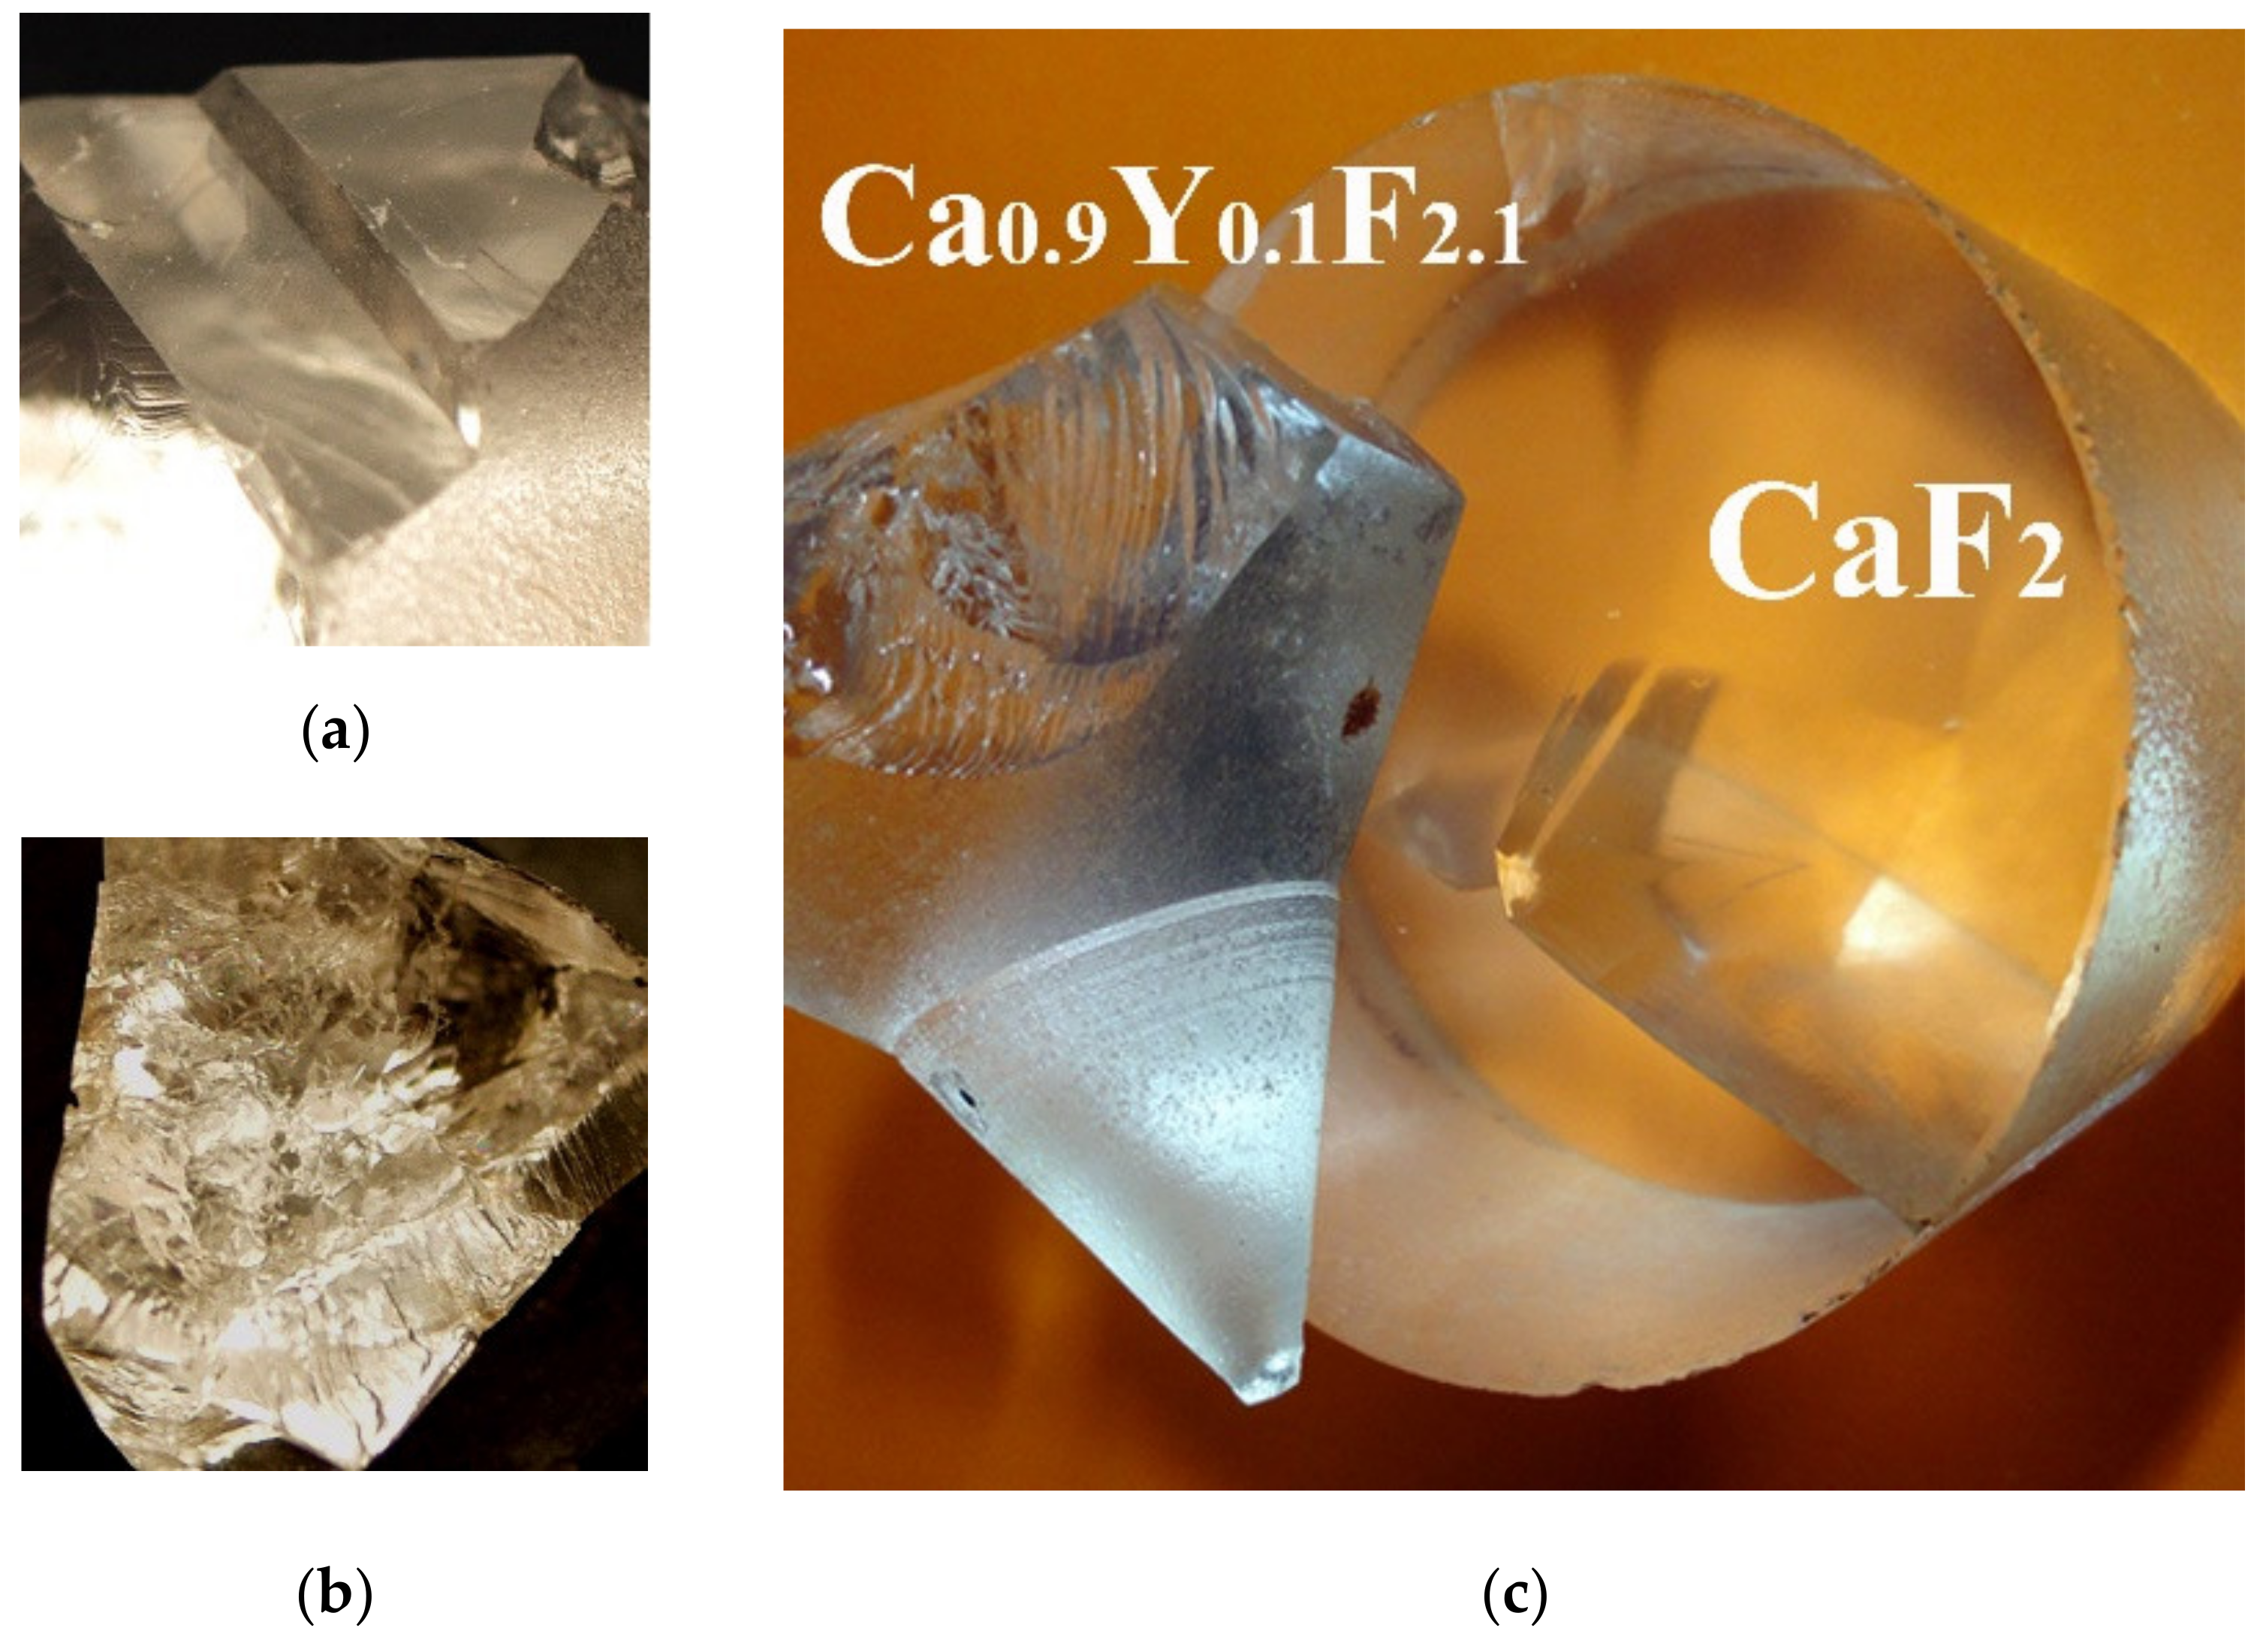
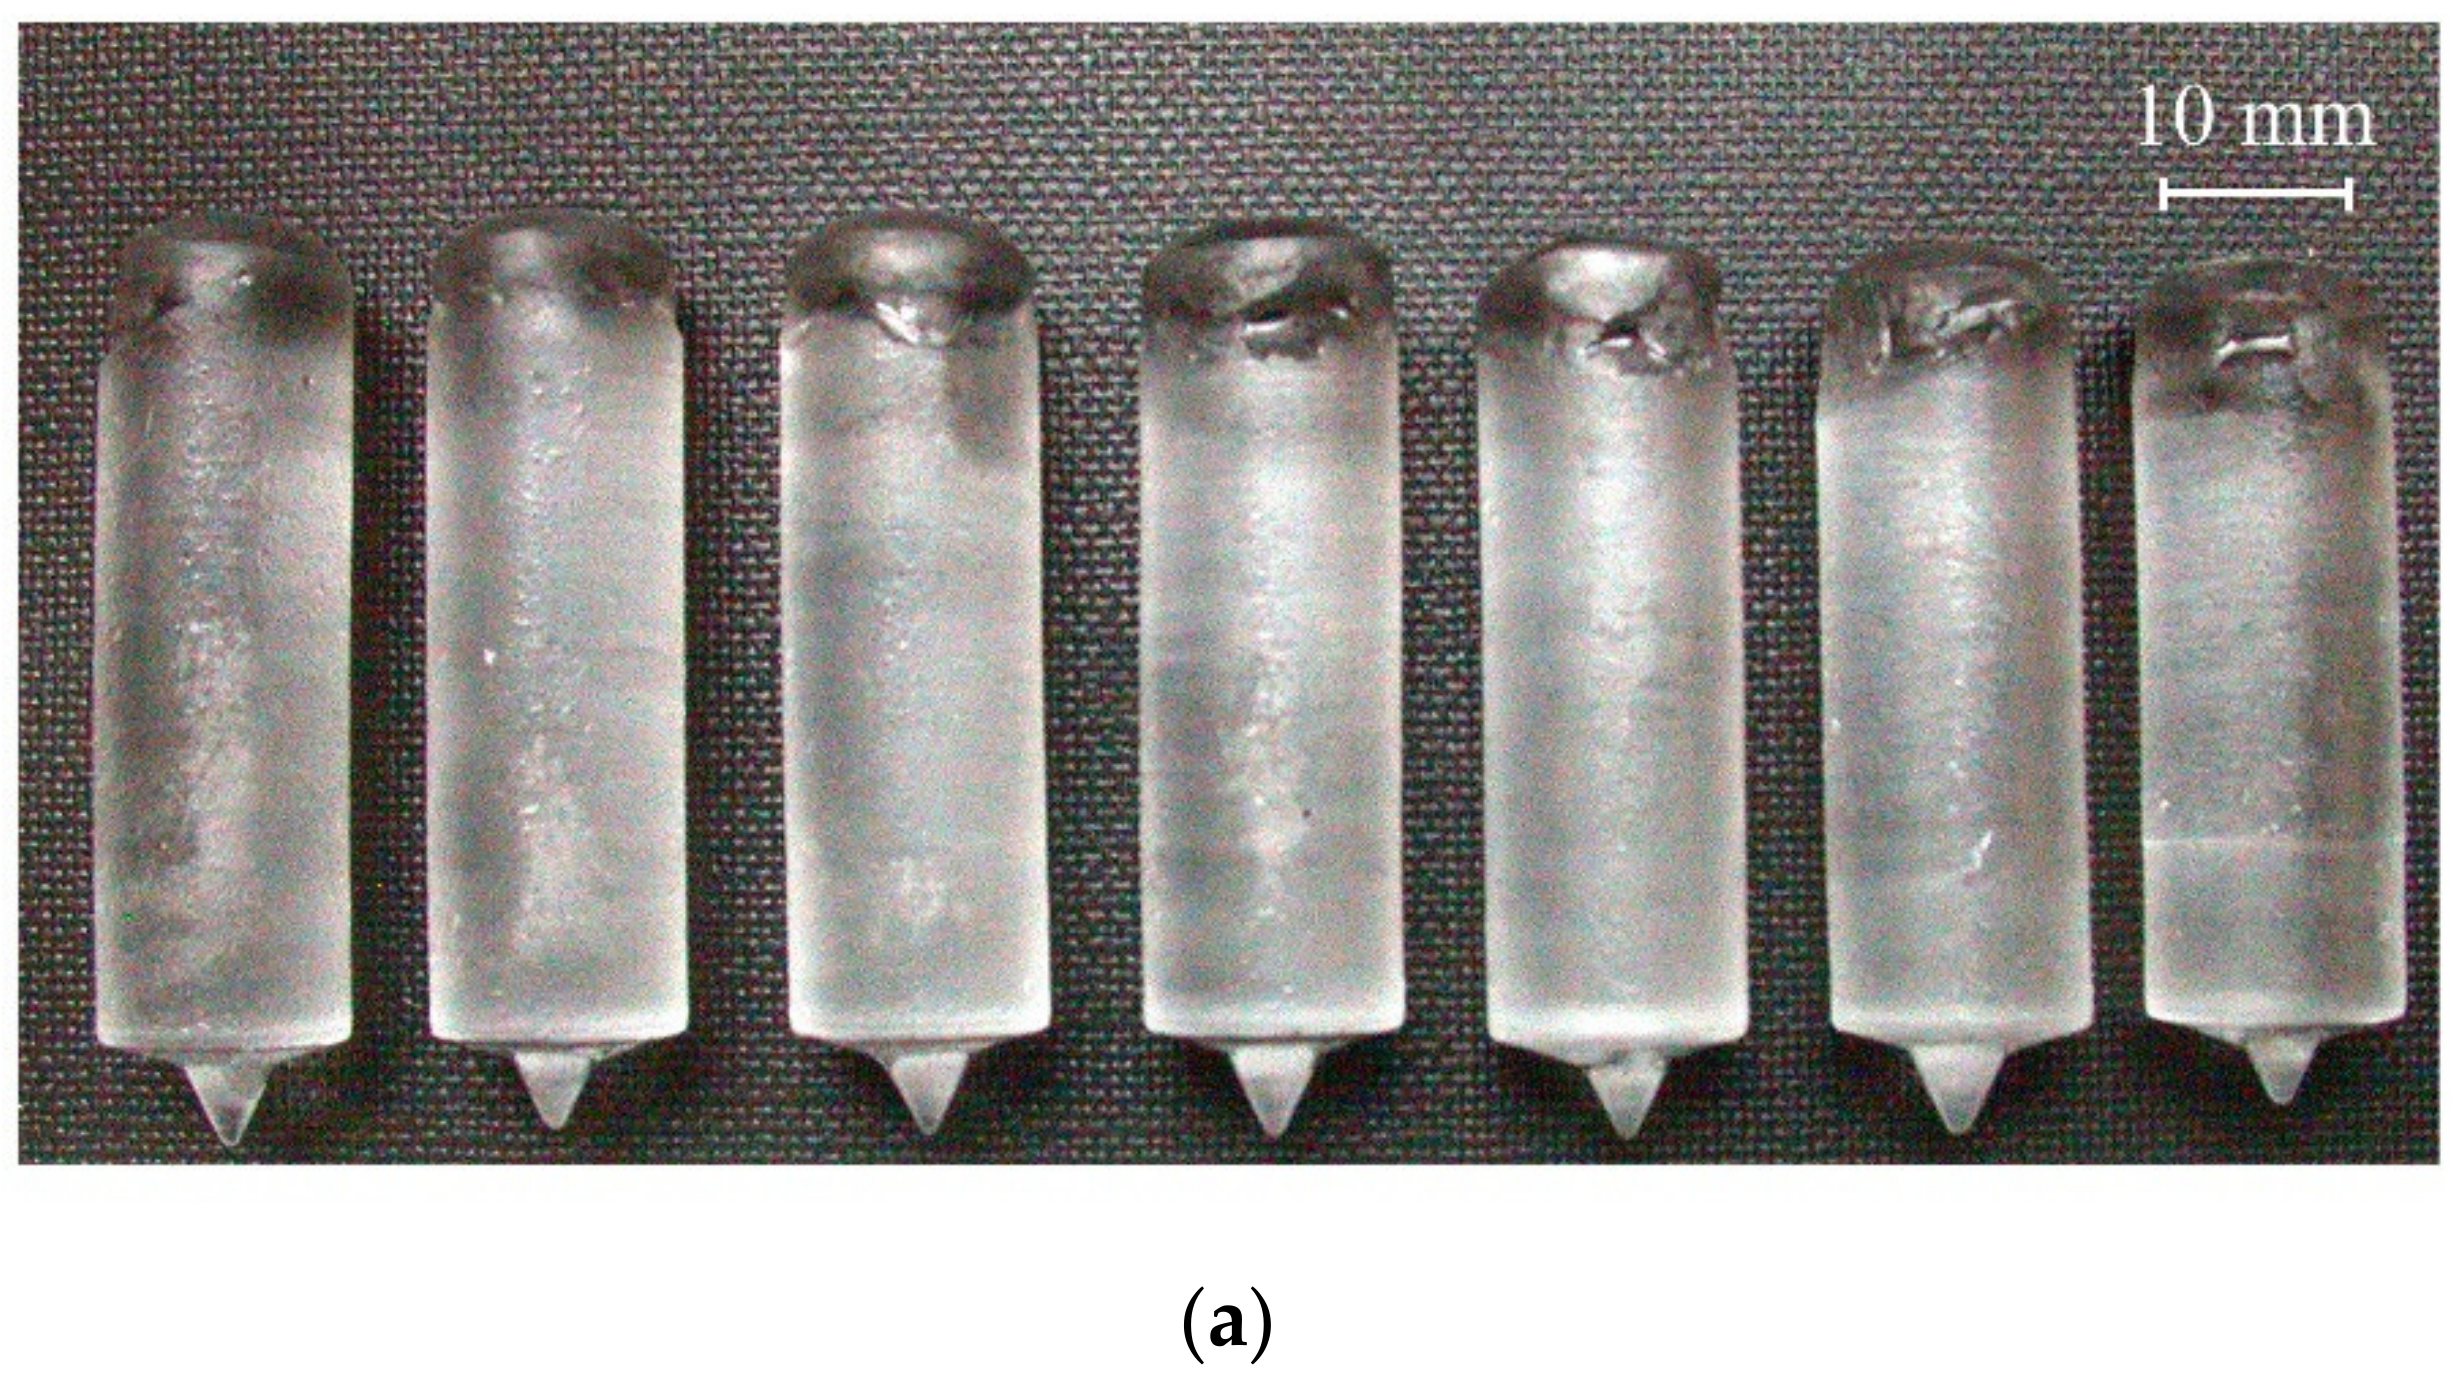
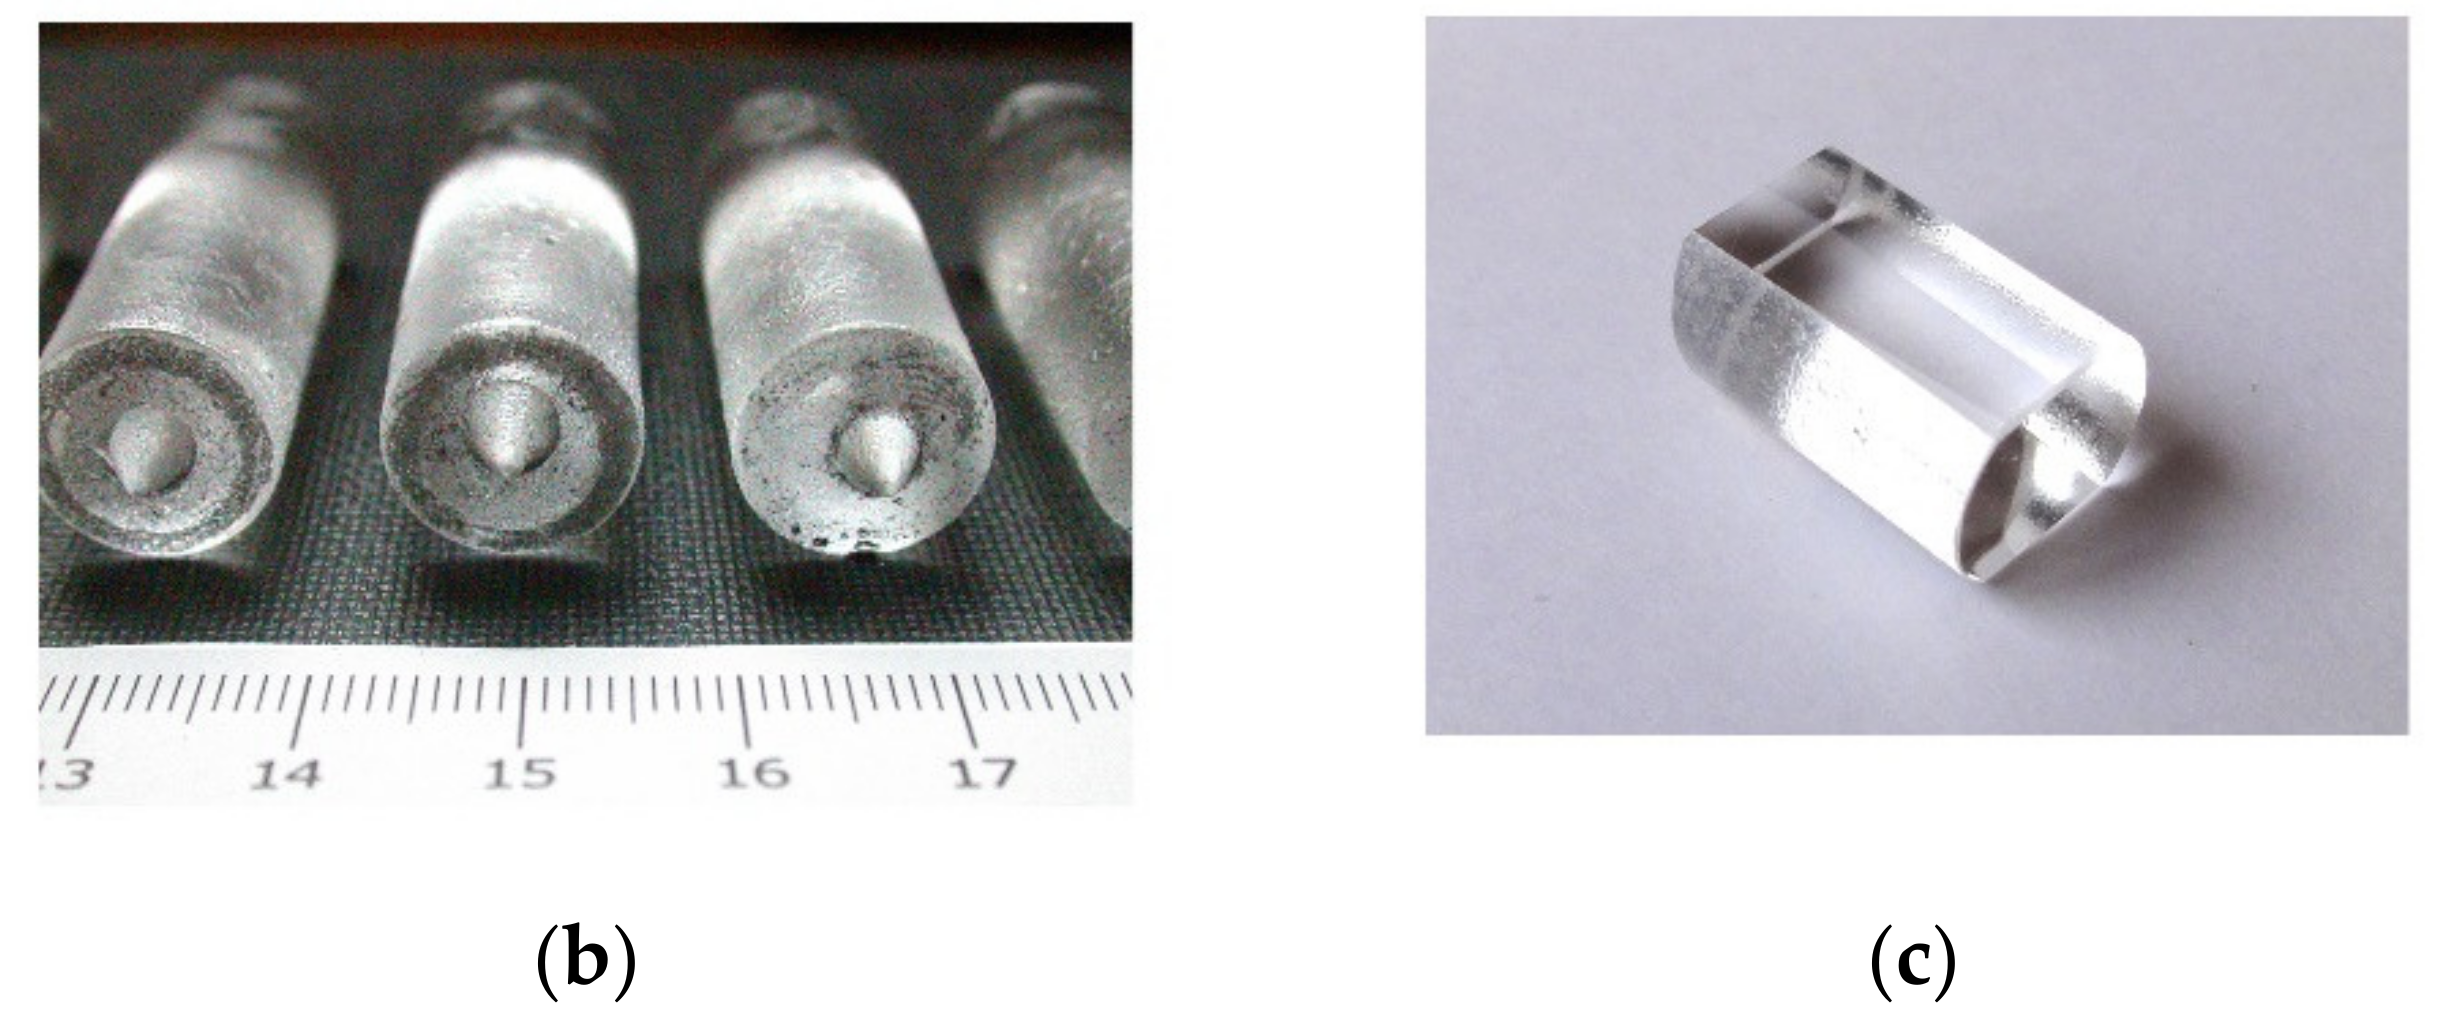
2.1. Crystal Growth

Crystals of fluorides of alkaline earth and rare earth elements are produced by various methods of directional crystallization: Bridgman–Stockbarger, Czochralski, Kiropoulos, zone melting. The Bridgman–Stockbarger method remains the most widespread in laboratory practice.
We used the Bridgman–Stockbarger method, which was structurally implemented in the form of a two-zone resistive apparatus with graphite heaters, screens and crucibles. As initial reagents, we used a mixture of CaF2 optical crystals (IR-grade, manufactured by Vavilov State Institute of Optics, Saint Petersburg, Russia) and YF3 powder (99.99%, Lanhit Ltd., Moscow, Russia). For purification from the acid impurity, the initial reagents were pre-melted in a fluorinating atmosphere, and the superheated melt was kept for 3 to 5 h. The crystallization volume of the chamber was filled with high-purity helium. Polytetrafluoroethylene pyrolysis products were used as a fluorinating agent. The growth rate was set by the lowering rate of the crucible, which was 2.5–3 mm/h. The typical temperature gradient at the crystallization front was 70 K/cm.
To refine the composition of the temperature maximum on the melting curves, Ca1–xYxF2+x (0 < x ≤ 0.14) crystals with a diameter of 12–15 mm and a length of 50–55 mm were grown (Figure 4).
To determine the concentration dependence of the lattice parameter, a series of 16 crystals of Ca1–xYxF2+x (0 < x ≤ 0.36) was obtained. The multicellular graphite crucible was loaded with 0.5 g charge (weighing accuracy ±0.001 g). The melt was homogenized for 2 h at a temperature of 1773 K and then abruptly cooled to room temperature. Evaporation losses did not exceed 0.2 wt. %.

2.2. X-ray Diffraction Analysis

To ensure the greatest possible accuracy of determining the coordinate of the maximum on the melting curves, it is necessary to have a concentration dependence of a lattice parameter measured with high accuracy. In previous studies, this dependence was calculated on the basis of the lattice parameters measured for Ca1–xYxF2+x with an accuracy of ±3 × 10⁻⁴ [17,18] and ±3 × 10⁻³ [14].
With a high relative accuracy of determining the parameters [17,18], such factors as uncontrolled impurity composition and thermal conditions of sample processing become significant. In [17,18], the impurity composition was not determined. The samples were fluorinated in powdered form and were not melted. The difference in the measurements [14,17,18] could be related to the impurity composition, the conditions of production and fluorination. The samples were thermally processed below the melting point and were powders at all stages of preparation and study.
In order to maintain the same impurity composition, fluorination conditions, and to obtain crystals and samples for X-ray phase analysis, we conducted the entire cycle of their production on the same charges and fluorinated all samples in a melt. This ensures the internal consistency of the calibration line parameters and the measurement of parameters on single crystals.
X-ray powder diffraction analysis of the crystallization products was performed on X’Pert PRO MPD X-ray powder diffractometer (PANalytical, Eindhoven, The Netherlands) in the Bragg–Brentano geometry with a LaB6 reference sample (NIST no. 660). The temperature inside the chamber was maintained at 293 K during measurements. The lattice parameters of the Ca1-xYxF2+x samples were calculated with the DICVOL14 program [19]. The precision of determination of the lattice constant was ±9 × 10⁵ Å.

3. Results

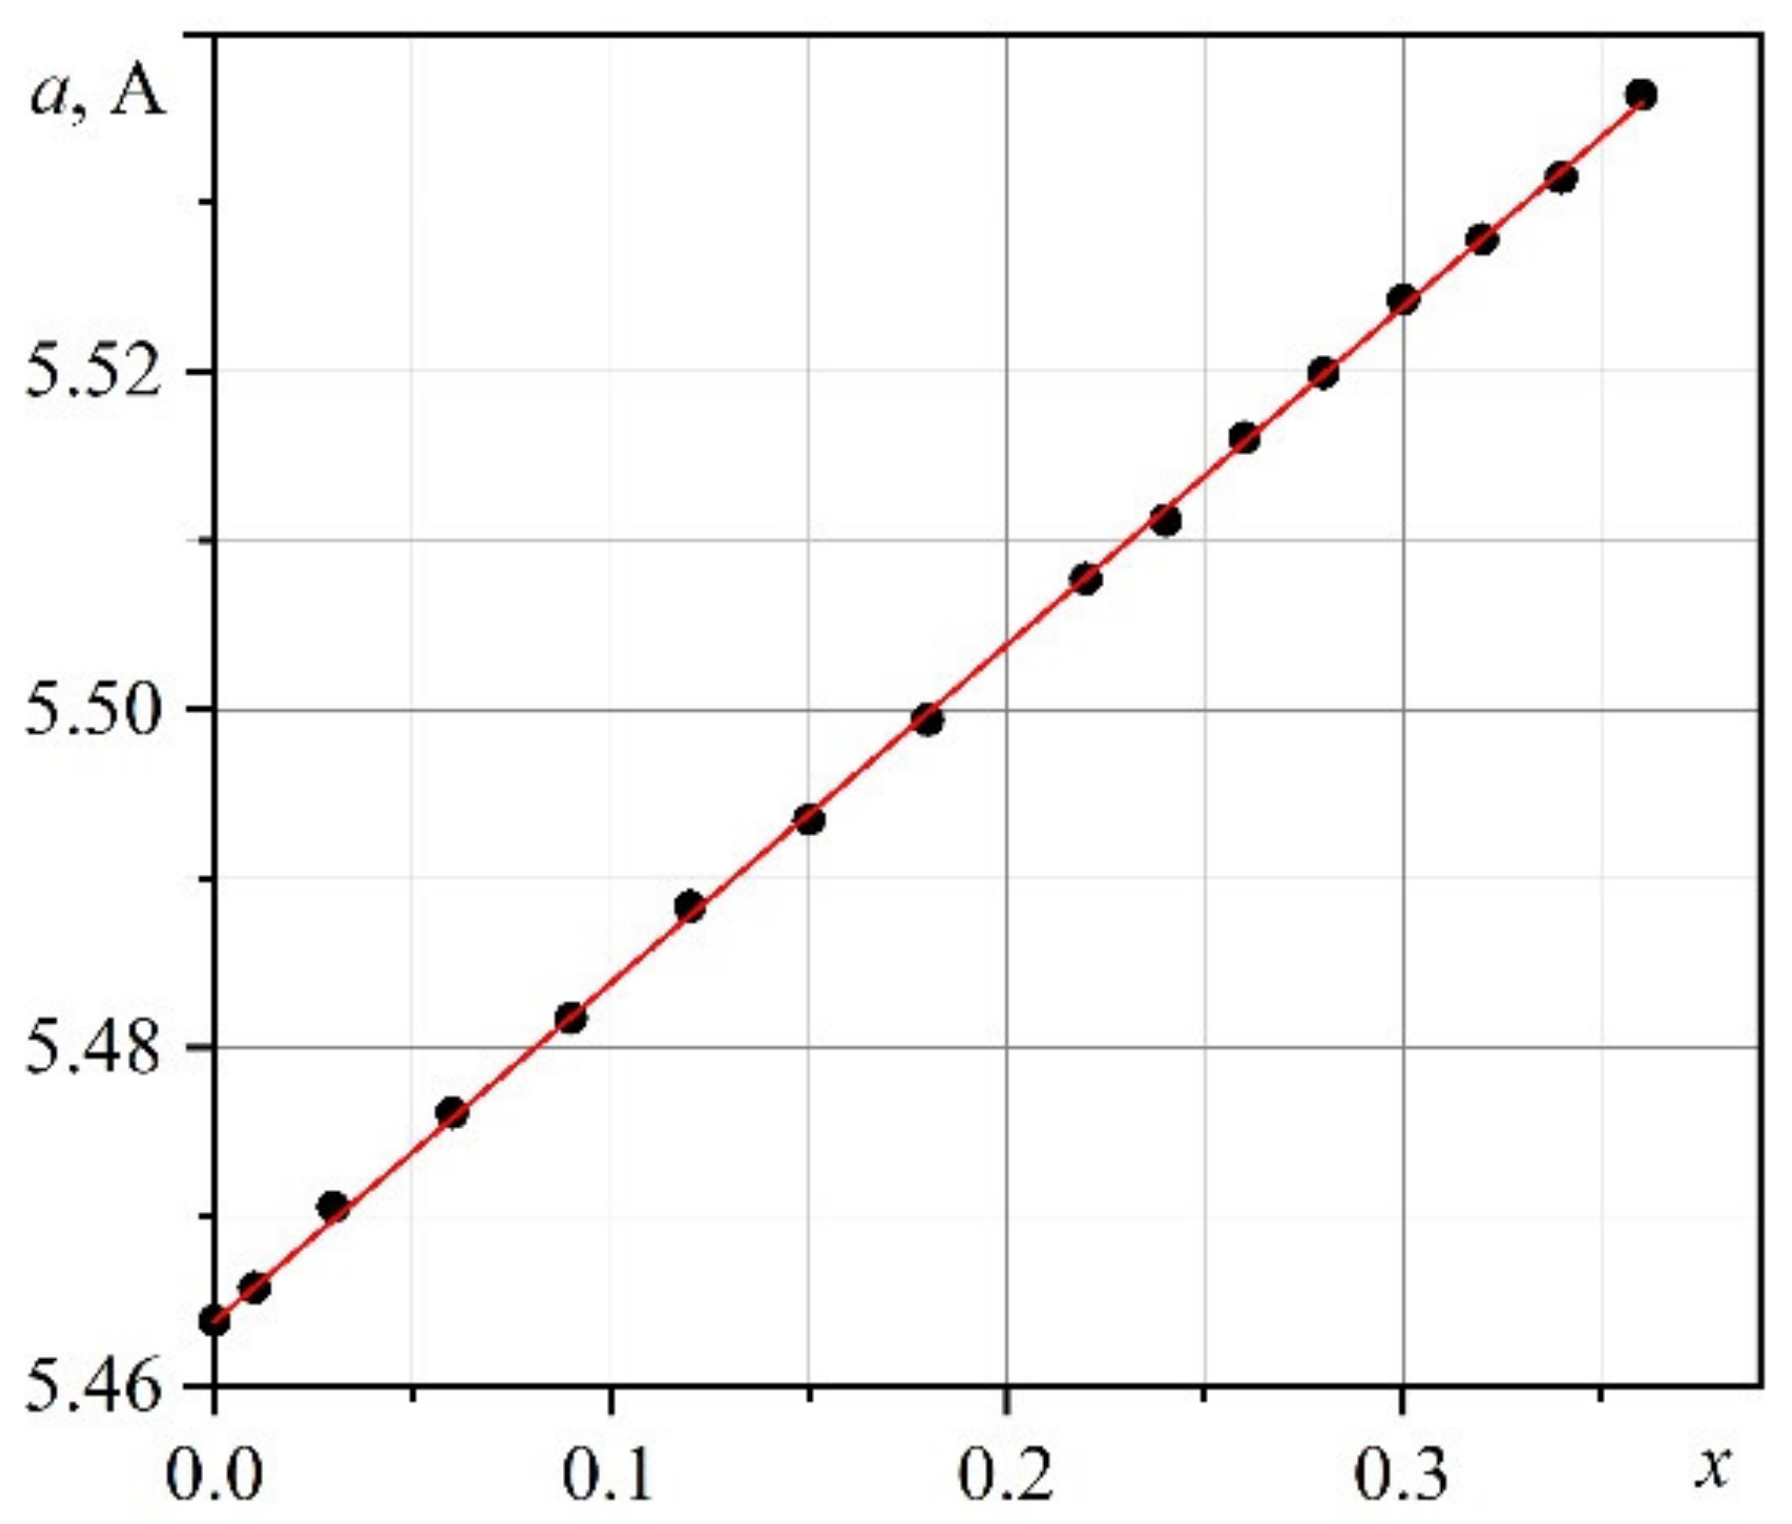
3.1. The Concentration Dependence of the Lattice Parameter

The concentration dependence of the lattice parameter of the Ca1–xYxF2+x solid solutions is present in Table 1 and plotted in Figure 5. It is calculated on the basis of the lattice parameter of undoped CaF2 (5.46385(5) Å) used as a charge for crystal growth. In [17,18], a commercial (Merk, Darmstadt) CaF2 reagent with a parameter of 5.4630(2) Å was used as a charge. In [14], the parameter 5.46295(10) Å from [20] was used to calculate the dependence.
The concentration dependence of the lattice parameter has the form: a(x) = ao + kx, where ao = 5.46385(5), k = 0.1999(4). The refinement by the least-squares method was performed with the fixed intercept value ao. RSS was 2.31 × 10⁻⁶.
The concentration dependence of the lattice parameter obtained obeys Vegard’s law for the entire range of the studied concentrations up to x < 0.37. Table 2 shows the precision (δ) of the determination of the unit cell parameter and the coefficients of the Vegard equation obtained in this work and in the previous ones [14,17,18].
The improved precision of the lattice parameter measurement improved the precision of the calculation of the Vegard equation coefficients, which is necessary for calculating concentrations when determining the position of the maximum on the melting curves.

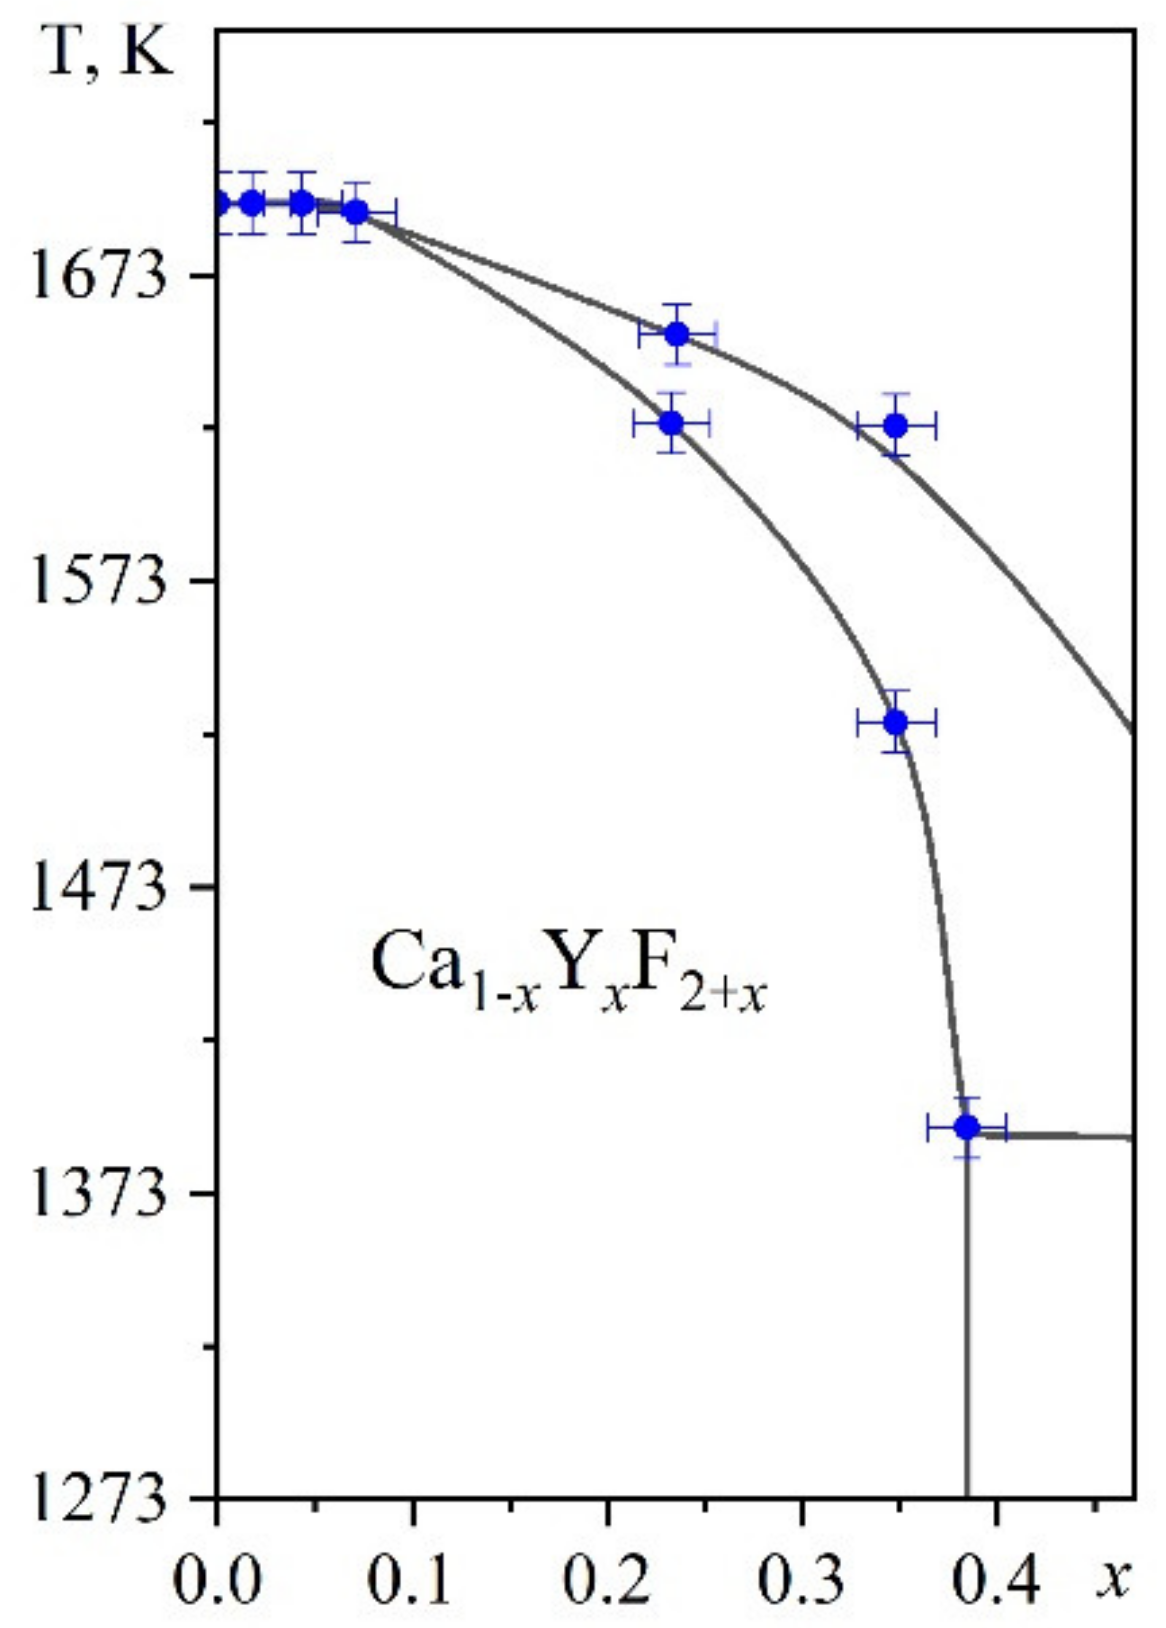
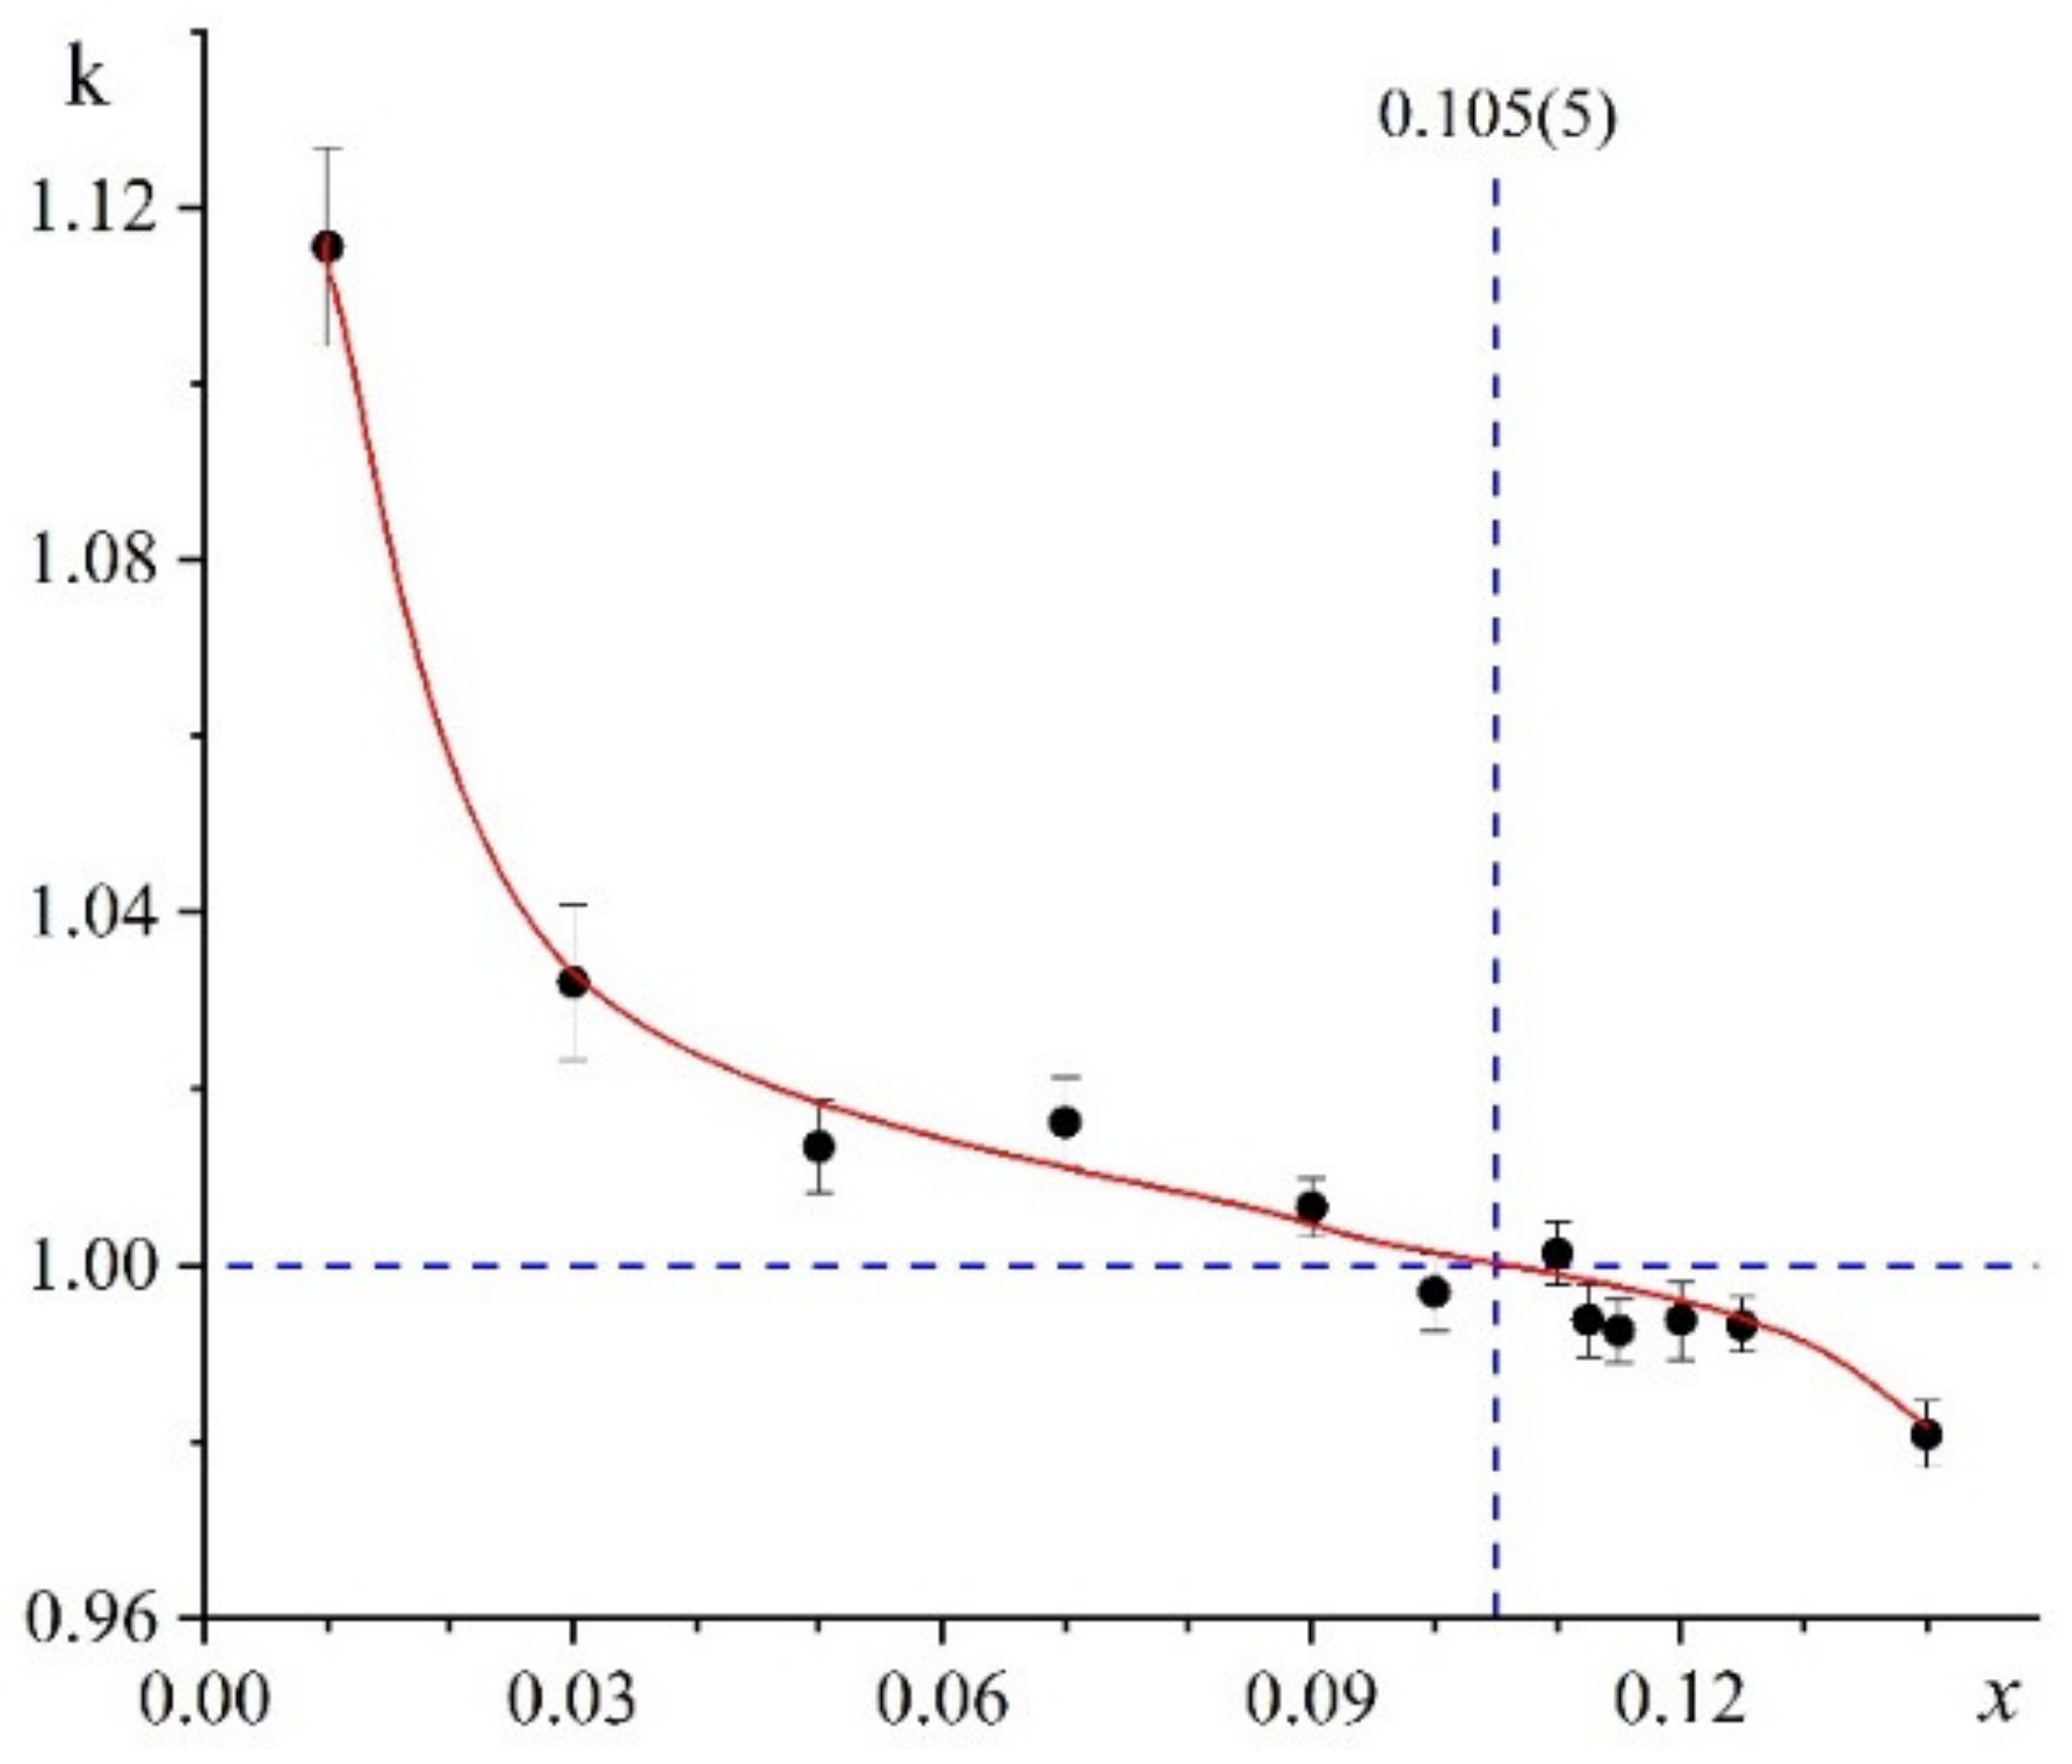
3.2. Refinement of the Composition of the Maximum on the Melting Curves

In the CaF2-YF3 system, a small difference in the melting temperature of the component and the temperature of the maximum (from 5 to 10 K) is present. The most accurate information about the composition of such a smooth (tangential) maximum can be provided by the method of directional crystallization with the study of the distribution of an impurity component, which is distributed along the length of a crystal as it grows.
The only attempt to clarify the composition of the maximum on the melting curves for Ca1–xYxF2+x by directional crystallization was made [13] for Ca0. 9Y0.1F2.1 crystal obtained by the Bridgman method from a melt. The 90Y isotope was used. The observed decrease in the concentration of yttrium in the final portion of the crystal boule is small, and one can assume that this composition is close to the composition of the maximum.
Despite numerous studies of the phase diagram and the behavior of yttrium during directional crystallization, the question of the composition corresponding to the maximum on the melting curves of the Ca1–xYxF2+x fluorite phase remains open.
Finding the equilibrium distribution coefficient (ko) for an impurity by the method of directional crystallization of a melt is a complex task, which requires knowledge of a number of characteristics of a melt and the behavior of an impurity component in it.
To clarify the position of the maximum on the melting curves of the Ca1–xYxF2+x solid solution, it is sufficient to find the effective coefficient (kef) for two compositions (x1 and x2), for which the kef will be greater than 1 and less than 1, correspondingly. With a small difference in the composition of the melts and the same crystallization conditions (growing in a multicellular crucible), the impurity behavior for these compositions is comparable, which eliminates the need to find ko. This will correspond to a decrease and an increase in the content of the impurity component (yttrium) from the initial to the final portion of the crystal, respectively.
To solve this problem, it is sufficient to build the dependence of k = x′/xo on the content of YF3 in a charge, where xo and x′ are the concentrations of yttrium in a charge and in the seed cone of a crystal (at the starting point), correspondingly. The passage of k through 1 corresponds to the composition with congruent melting and the value of kef = 1.
The crystal compositions were determined by the lattice parameter using the established (Table 1) dependence of the unit cell parameter of Ca1−xYxF2+x on the composition: a(x) = 5.46385 + 0.1999x. Table 3 shows the concentration of Y in a charge, in the region of the seed cone, and the effective distribution coefficient (k) of Y in Ca1–xYxF2+x. The concentration dependence of k is shown in Figure 6.
According to the reference data, the concentration range within which the congruently melting composition can be found is indicated within a very large interval: Δx~0.28.
The accuracy of the method of directional crystallization allowed us to narrow this interval to a value of Δx~0.01 (1 mol.% of YF3). The congruent composition corresponds to the middle of this interval, and the accuracy of its determination is equal to its half (x = 0.005 or 0.5 mol. % of YF3). Thus, the composition of the maximum on the melting curves determined by this method is x = 0.105(5).
The check of the impurity distribution along the crystal length for compositions with x = 0.10 and 0.11 showed that the deviation of yttrium concentration in the crystals from its content in the charge is within the accuracy of the method.

4. Conclusions

The analysis of the reference data on the phase diagram of the CaF2–YF3 system in the region of the formation of the Ca1–xYxF2+x (x < 0.38) fluorite phase and the composition of the temperature maximum on the melting curves is carried out. A large difference in the compositions found by different authors is shown (x = 0.05–0.33), and the conclusion that the previous definitions of congruent composition were not sufficiently accurate for growing crystals of high optical quality was made.
The Ca1–xYxF2+x crystals with x < 0.37 were obtained by the directional crystallization of a melt for the precise (±9 × 10⁻⁵ Å) determination of the concentration dependence of the lattice parameter a(x) and to refine the position of the maximum on the melting curves.
It is established that the concentration dependence of the lattice parameter of the Ca1–xYxF2+x fluorite crystals obeys Vegard’s law a(x) = 5.46385(5) + 0.1999(4) x.
The congruently melting composition of the Ca1–xYxF2+x phase, which is x = 0.105(5), was determined by the method of directional crystallization.

Author Contributions

D.N.K. grew crystals and wrote the manuscript. E.A.S. conducted X-ray diffraction analysis and wrote the manuscript. B.P.S. studied the phase diagram of the CaF2–YF3 system and melting of the Ca1−xYxF2+x phase by thermal analysis and revised the manuscript. All authors have read and agreed to the published version of the manuscript.

Funding

This research was supported by the by the Ministry of Science and Higher Education of the Russian Federation within the State assignments of the Federal Scientific Research Centre «Crystallography and Photonics» of the Russian Academy of Sciences using the equipment of the Shared Research Center (project RFMEFI62119X0035).

Institutional Review Board Statement

Not applicable.

Informed Consent Statement

Not applicable.

Data Availability Statement

Not applicable.

Conflicts of Interest

The authors declare no conflict of interest. The funders had no role in the design of the study; in the collection, analyses, or interpretation of data; in the writing of the manuscript, or in the decision to publish the results.

References

  1. Vogt, T. Vorlaufige Mitteilung über Yttrofluorit, eine neue Mineralspezies aus dem nördlichen Norwegen. Cent. F. Min. Etc. 1911, 12, 373–377. [Google Scholar]
  2. Sobolev, B.P. Part 1, the high temperature chemistry of the rare earth trifluorides. In The Rare Earth Trifluorides; Institutd’ Estudis: Barcelona, Catalans, Spain, 2000; p. 520. [Google Scholar]
  3. Karimov, D.N.; Krivandina, E.A.; Zhmurova, Z.I.; Sobolev, B.P.; Bezhanov, V.A.; Chernov, S.P.; Shapochkin, G.M. Investigation of Multicomponent Fluoride Optical Materials in the UV Spectral Region. I. Single Crystals of Ca1–xRxF2+x (R = Sc, Y, La, Yb, Lu) Solid Solutions. Crystallogr. Rep. 2006, 51, 1009–1015. [Google Scholar] [CrossRef]
  4. Vogt, T. Uber Die Flusspat—Yttriumfluoritgruppe. Neues Jahrb. Miner. 1914, 2, 9–15. [Google Scholar]
  5. Bagdasarov, K.S.; Voronko, Y.K.; Kaminskii, A.A.; Krotova, L.V.; Osiko, V.V. Modification of the Optical Properties of CaF2–TR3+ Crystals by Yttrium Impurities. Phys. Status Solidi. B 1965, 12, 905–912. [Google Scholar] [CrossRef]
  6. Jiang, D.; Zhan, Y.Y.; Zhang, Q.; Ma, F.; Su, L.; Tang, F.; Qian, X.; Xu, J. Nd,Y:CaF2 laser crystal: Novel spectra properties and laser performances from controlled local structure. CrystEngComm 2015, 17, 7398–7405. [Google Scholar] [CrossRef]
  7. Basiev, T.T.; Voronko, Y.K.; Karasik, A.Y.; Osiko, V.V.; Shcherbakov, I.A. Spectral migration of electronic excitation along Nd3+ ions in CaF2-YF3 crystal on selective laser excitation. Sov. Phys. JETP 1978, 48, 32–36. [Google Scholar]
  8. Iparraguirre, I.; Azkargorta, J.; Fernández, J.; Balda, R.; Oleaga, A.; Kaminskii, A.A. Laser Spectral Dynamics of Nd3+ in CaF2–YF3 Crystals. J. Opt. Soc. Am. B 1999, 16, 1439–1446. [Google Scholar] [CrossRef]
  9. Doroshenko, M.E.; Pierpoint, K.A.; Alimov, O.K.; Papashvili, A.G.; Konyushkin, V.A.; Nakladov, A.N. Formation of Tm-Y Centers in CaF2–YF3: Tm3+ Solid-Solution Crystals. J. Lumin. 2019, 208, 475–478. [Google Scholar] [CrossRef]
  10. Wu, Y.; Su, L.; Wang, Q.; Li, H.; Zhan, Y.; Jang, D.; Qian, X.; Wang, C.; Zheng, L.; Chen, H.; et al. Spectroscopic Properties of Yb-doped CaF2–YF3 Solid-Solution Laser Crystal. Laser Phys. 2013, 23, 105805. [Google Scholar] [CrossRef]
  11. Fedorov, P.P.; Sobolev, B.P. Conditions for the formation of maxima on the fusion curves of solid solutions in salt systems. Russ. J. Inorg. Chem. 1979, 24, 574–575. [Google Scholar]
  12. Recker, K.; Wallrafen, F. Untersuchung von Zweistoffsystemen MeF2–LnF3 Me = Ca, Ba; Ln = Seltene Erden, Y, U. In Züchtung, Kristallchemie und -Physik von Laser- und Halbleiter-Einkristallen, Forschungsberichte des Landes Nordrhein-Westfalen; VS Verlag für Sozialwissenschaften: Wiesbaden, Germany, 1974; Volume 2469. [Google Scholar] [CrossRef]
  13. Seiranian, K.B.; Fedorov, P.P.; Garashina, L.S.; Molev, G.V.; Karelin, V.V.; Sobolev, B.P. Phase diagram of the system CaF2−YF3. J. Cryst. Growth. 1974, 26, 61–64. [Google Scholar] [CrossRef]
  14. Sobolev, B.P.; Fedorov, P.P. Phase diagrams of the CaF2- (Y, Ln) F3 systems I. Experimental. J. Less Common Met. 1978, 60, 33–46. [Google Scholar] [CrossRef]
  15. Short, J.; Roy, R. Confirmation of Deffect Character in Calcium Fluoride—Yttrium Fluoride Crystalline Solutions. J. Phys. Chem. 1963, 67, 1860–1861. [Google Scholar] [CrossRef]
  16. Pastor, R.C.; Robinson, M.; Hastings, A.G. Congruently-melting compounds of CaF2–rcRF3. Mat. Res. Bull. 1974, 9, 781–786. [Google Scholar] [CrossRef]
  17. Greis, O.; Kieser, M. Darstellung und Eigenschaften der festen Losungen (Ca,SE) F2.33 mit SE = Y, La, Ln und der korrespondierenden Ordnungsphasen Ca2SEF7 mit SE = Er–Lu und Y. Z. Anorgan. Allgem. Chem. 1981, 479, 165–170. [Google Scholar] [CrossRef]
  18. Gettman, W.; Greis, O. Uber fluorit- und tysonitverwandte Ordnungsphasen im System CaF2–YF3. J. Solid State Chem. 1978, 26, 255–263. [Google Scholar] [CrossRef]
  19. Louër, D.; Boultif, A. Some further considerations in powder diffraction pattern indexing with the dichotomy method. Powder Diffr. 2014, 29, 7–12. [Google Scholar] [CrossRef]
  20. Allen, R.D. Variations in the chemical and physical properties of fluorite. Am. Mineral. 1952, 37, 910–930. [Google Scholar]
Figure 1. Yttrofluorite mineral (a), artificial CaF2 (b) and engraving on CaF2 with Ca1–xYxF2+x (c).
Crystals 11 00696 g001
Figure 2. Chip along the cleavage plane in the CaF2 crystal (a); a conchoidal fracture in Ca0.9Y0.1F2.1 (b). A cleavage crack in CaF2 and a conchoidal fracture in Ca0.9Y0.1F2.1 (on the left) (c).
Crystals 11 00696 g002
Figure 3. The part of the phase diagram of the CaF2–YF3 system in the field of formation of the Ca1–xYxF2+x fluorite phases.
Crystals 11 00696 g003
Figure 4. Appearance of the grown Ca1–xYxF2+x crystals: top (a) and side (b) view; fabricated Ca0.9Y0.1F2.1 optical element (c).
Crystals 11 00696 g004aCrystals 11 00696 g004b
Figure 5. Concentration dependence of the lattice parameter of Ca1–xYxF2+x.
Crystals 11 00696 g005
Figure 6. The effective distribution coefficient (k) of Y in the Ca1−xYxF2+x (x = 0.01–0.14).
Crystals 11 00696 g006
Table 1. Concentration dependence of the lattice parameter of Ca1–xYxF2+x.
x, By Chargea, ÅLosses, Mas. %
05.46385(5)0
0.015.46581(1)0.2
0.035.47059(3)0
0.065.47613(5)0.2
0.095.48175(4)0.2
0.125.48833(8)0
0.155.49348(2)0.2
0.185.49941(6)0
0.225.50773(3)0.2
0.245.51116(9)0.2
0.265.51609(7)0.2
0.285.51989(4)0.2
0.305.52424(9)0.2
0.325.52780(3)0.2
0.345.53141(7)0
0.365.53632(3)0
Table 2. Precision (±δ) of the lattice parameter measurement and the coefficients of the Vegard equation a(x) = ao + kx for Ca1–xYxF2+x.
δ, ÅaokRef.
9 × 1055.46385(5)0.1999(4)present work
3 × 10−45.4630(2)0.20030 [17,18]
3 × 10−35.46295(10) [20]0.191 [14]
Table 3. The concentration of Y in a charge (xo), in the region of the seed cone (x′), and the effective distribution coefficient (k) of Y in Ca1−xYxF2+x.
xoxka, Å
0.0100.011(9)1.116(11)5.46608(2)
0.0300.031(9)1.032(9)5.47004(4)
0.0500.051(5)1.014(5)5.47398(3)
0.0700.071(5)1.016(5)5.47807(4)
0.0900.091(3)1.007(3)5.48196(2)
0.1000.100(4)0.997(4)5.48378(4)
0.1100.110(3)1.001(4)5.48587(4)
0.1130.112(4)0.994(4)5.48620(4)
0.1150.114(4)0.993(4)5.48667(3)
0.1200.119(4)0.994(4)5.48769(5)
0.1250.124(3)0.993(3)5.48867(2)
0.1400.137(4)0.981(4)5.49130(4)
Publisher’s Note: MDPI stays neutral with regard to jurisdictional claims in published maps and institutional affiliations.

