
Influence of Polyvinyl Alcohol Powder on the Mechanical Performance and Volume Stability of Sulfoaluminate–Portland Cement Composite

Abstract
:1. Introduction
2. Materials
2.1. Cement Materials
2.1.1. Raw Material and Mix Ratio
2.1.2. Preparation of Specimens
2.2. Methods
2.2.1. Strength
2.2.2. Volumetric Stability
2.2.3. Impact Resistance
2.2.4. Hydration Heat
2.2.5. Hydrates Assemblages
2.2.6. Microstructure Characterization
3. Results and Discussion
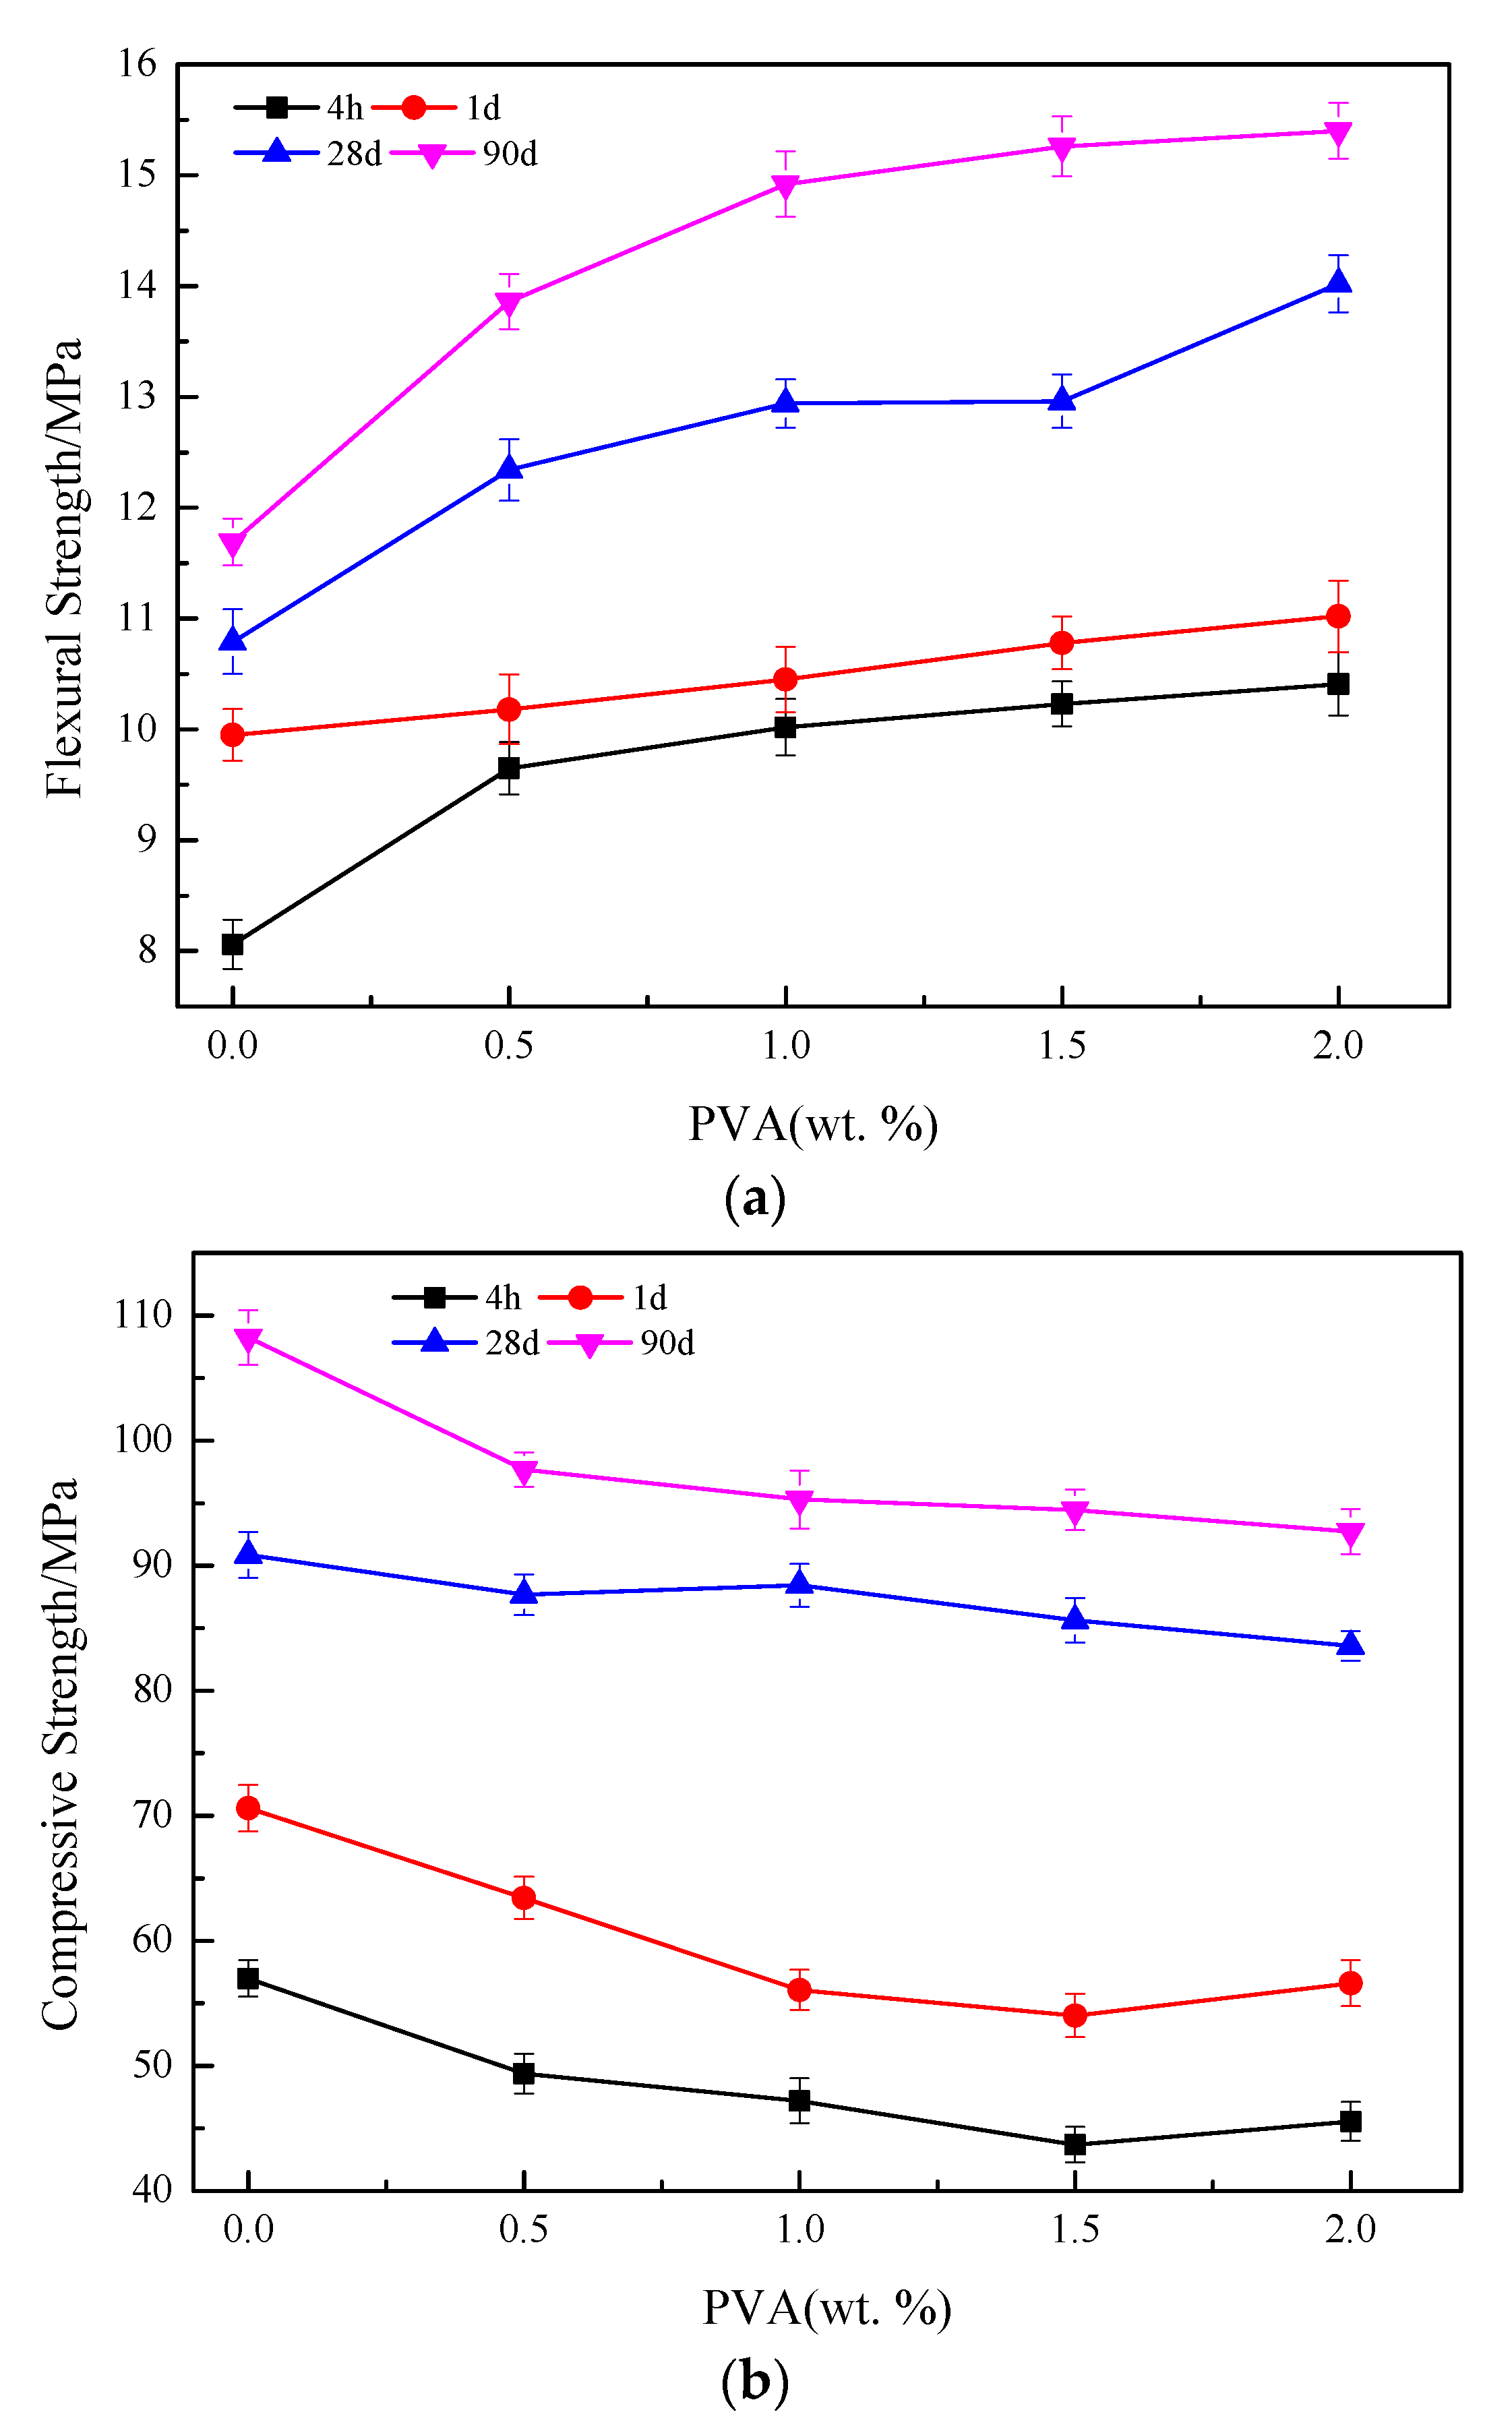
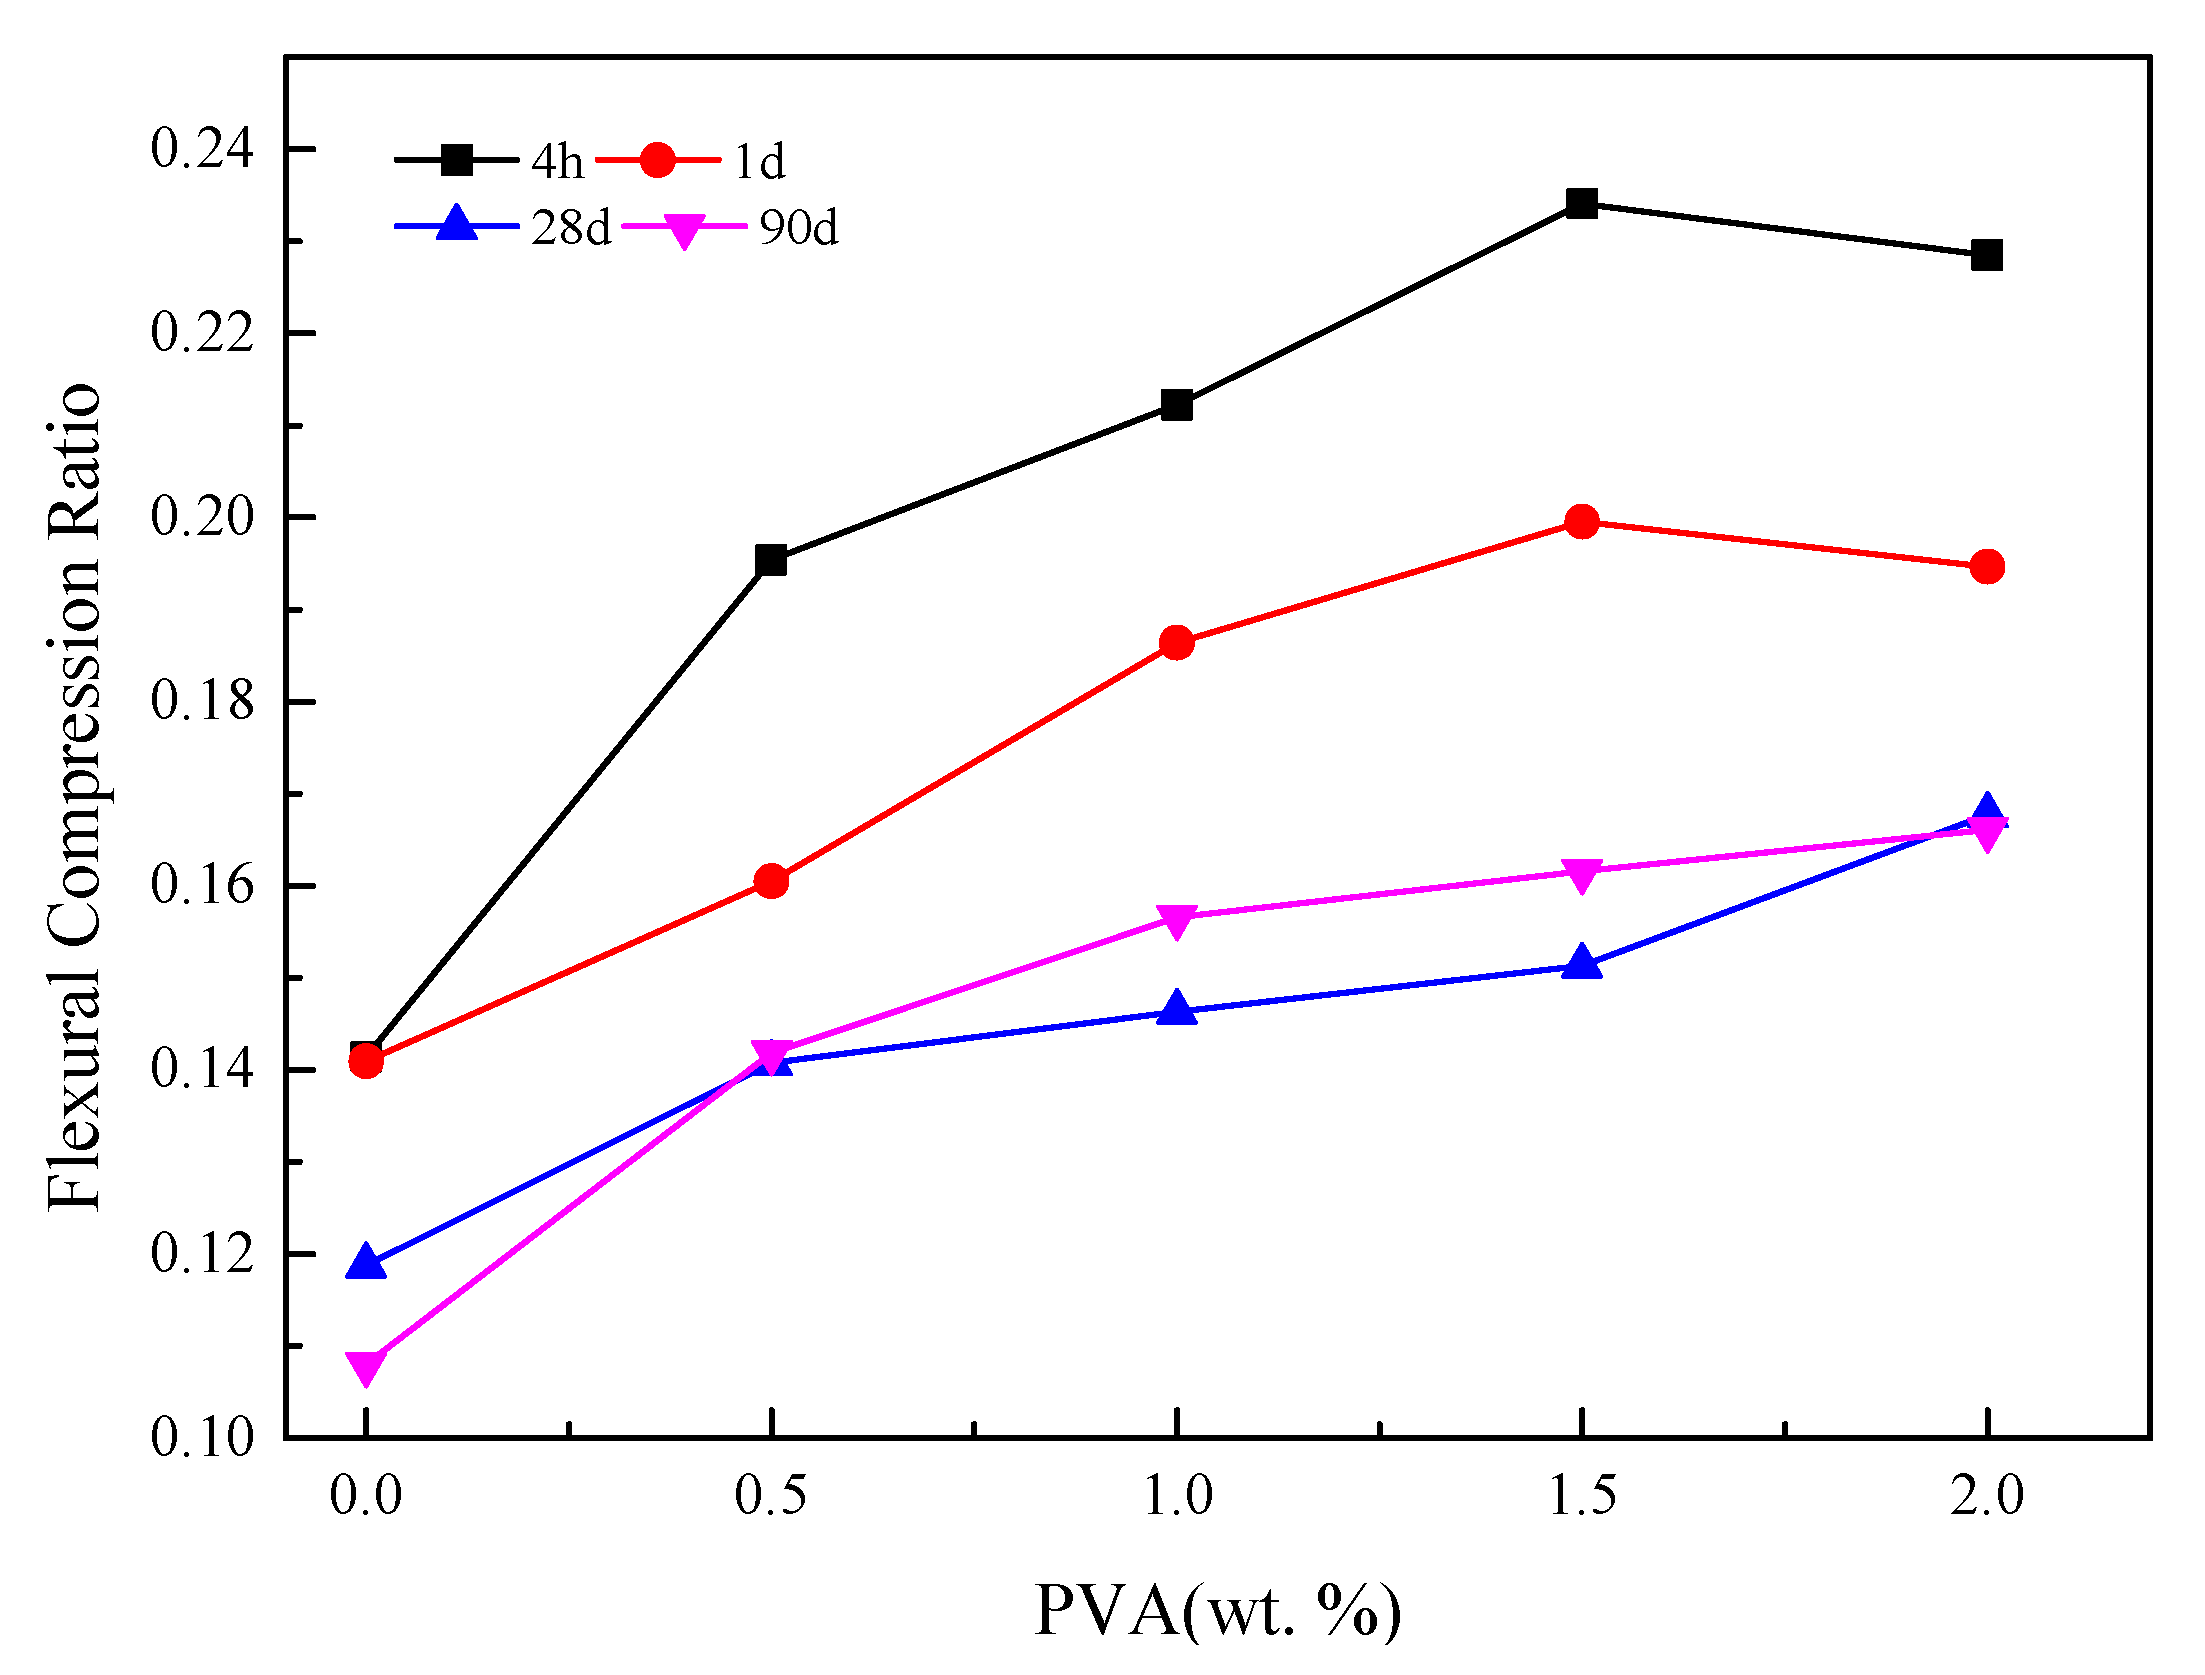
3.1. Flexural and Compressive Properties and Flexural Compressive Ratio
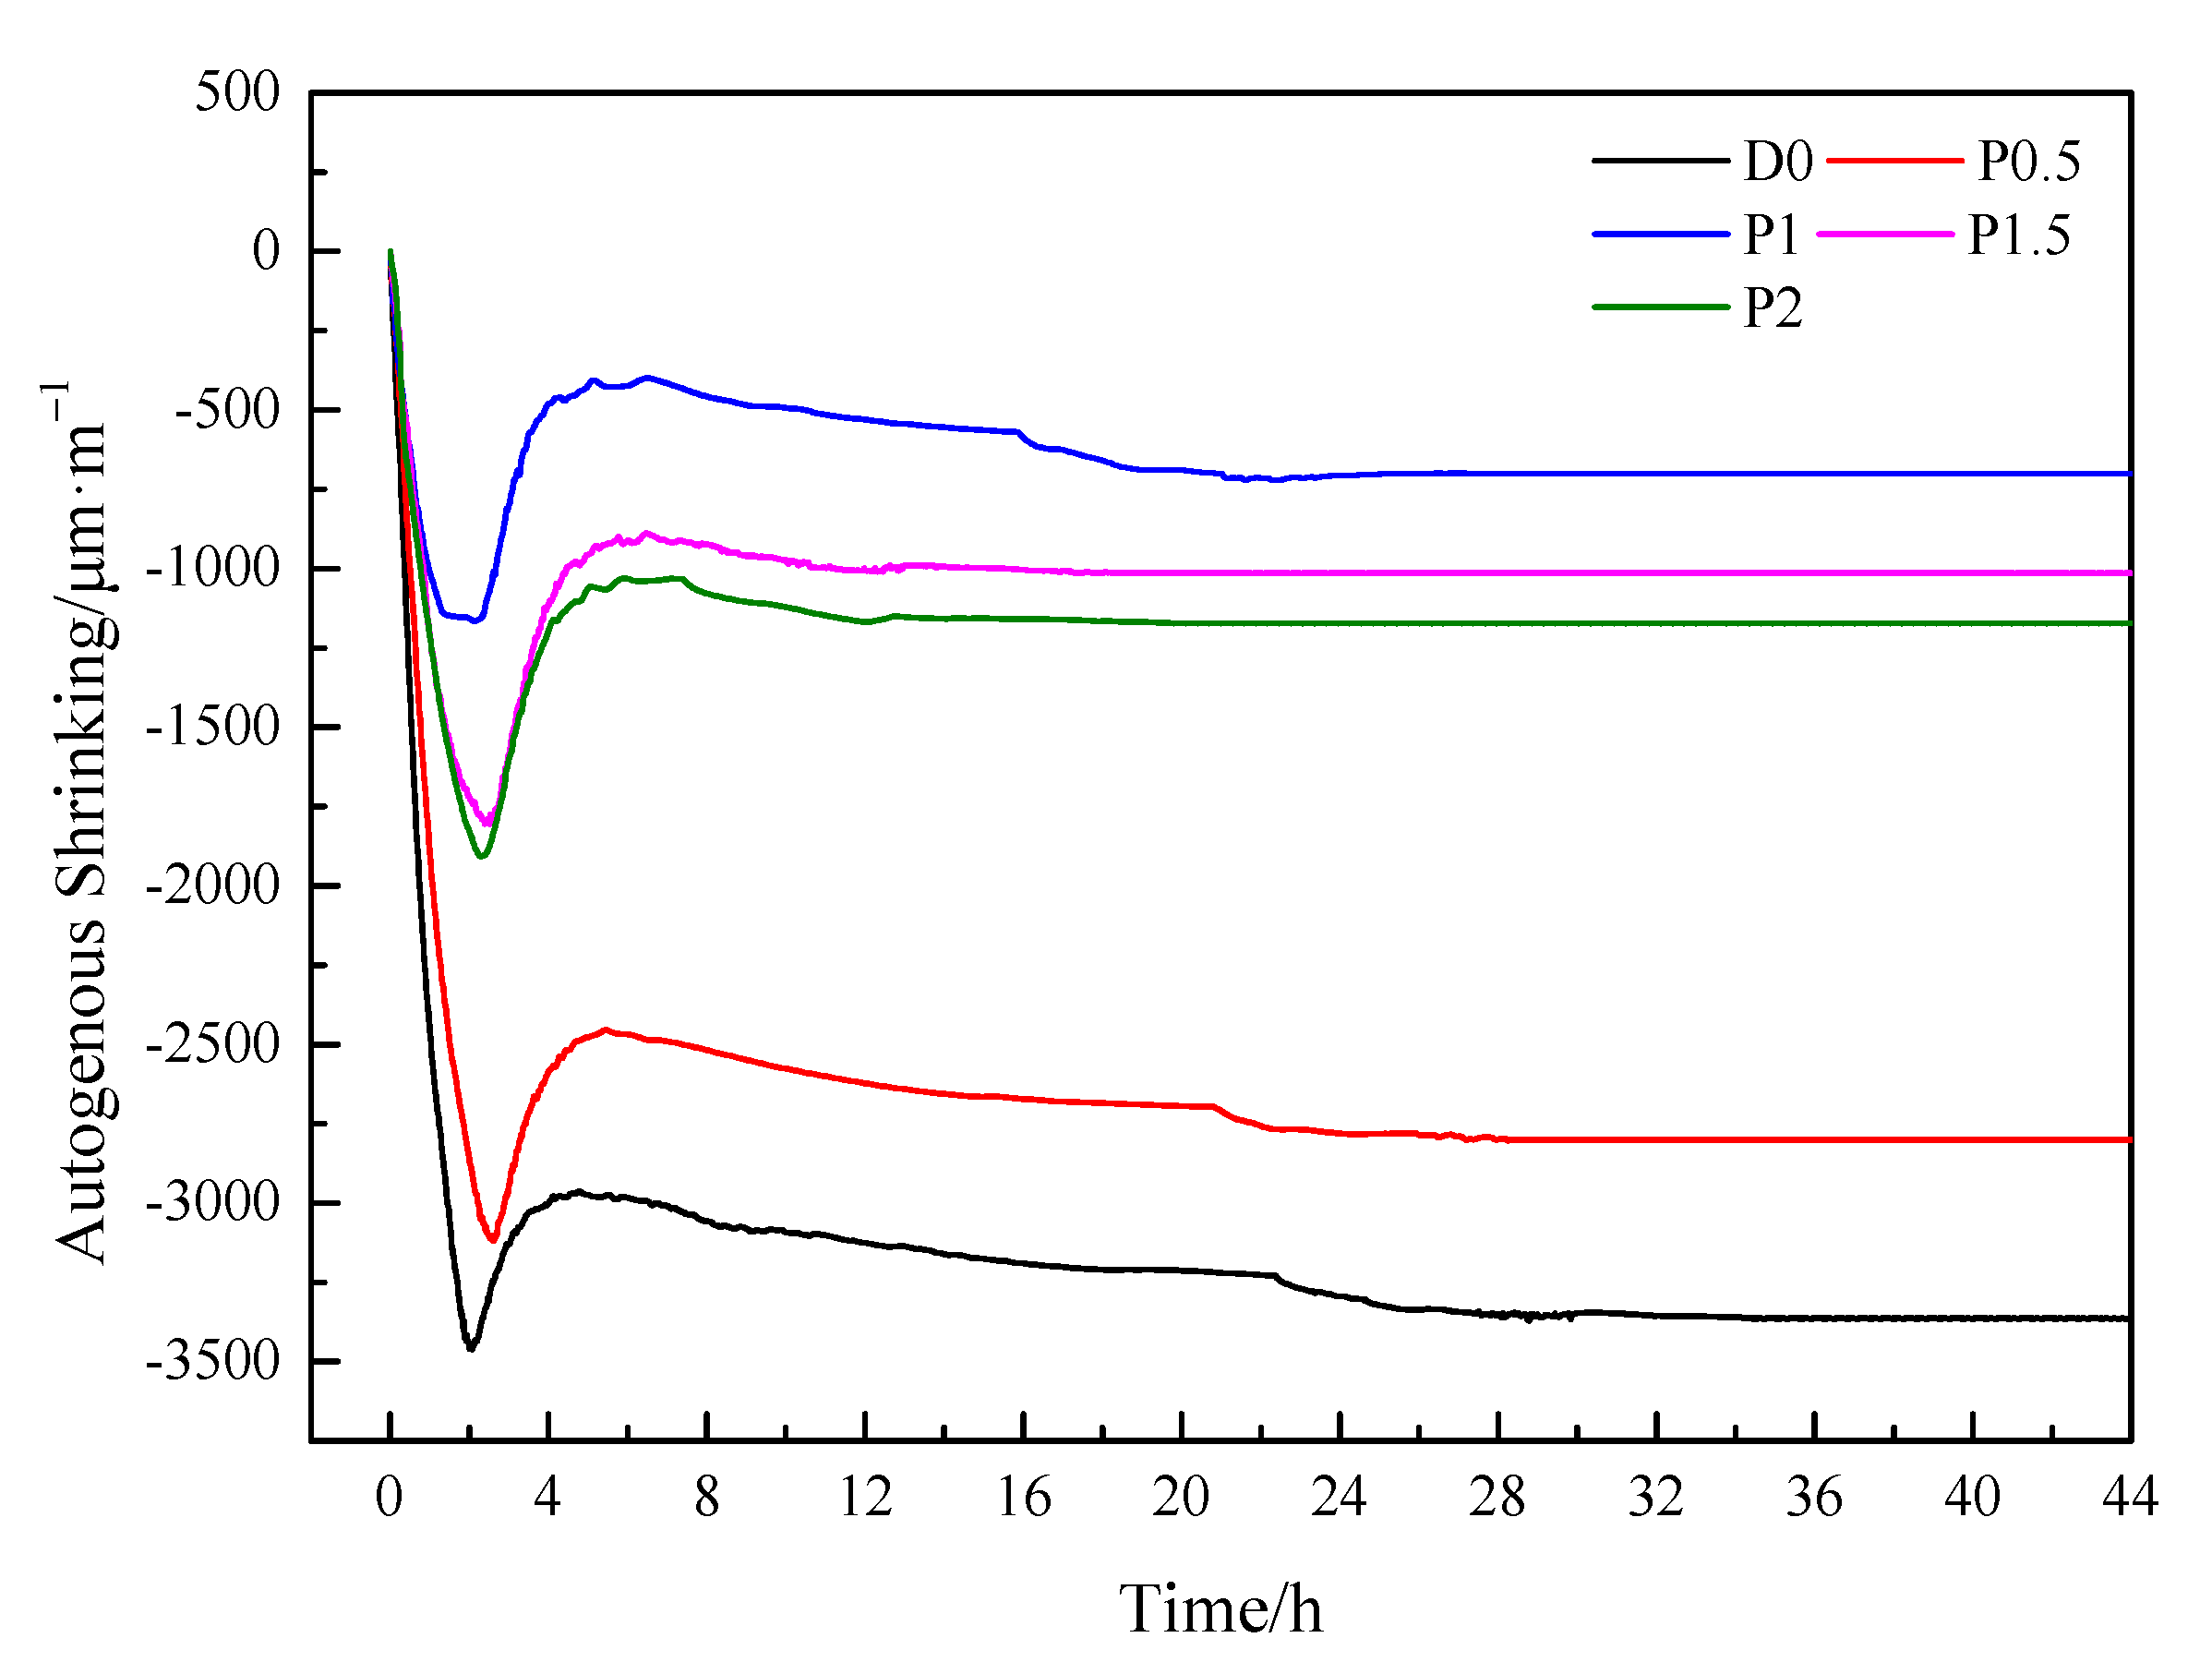
3.2. Volume Deformation and Fluidity
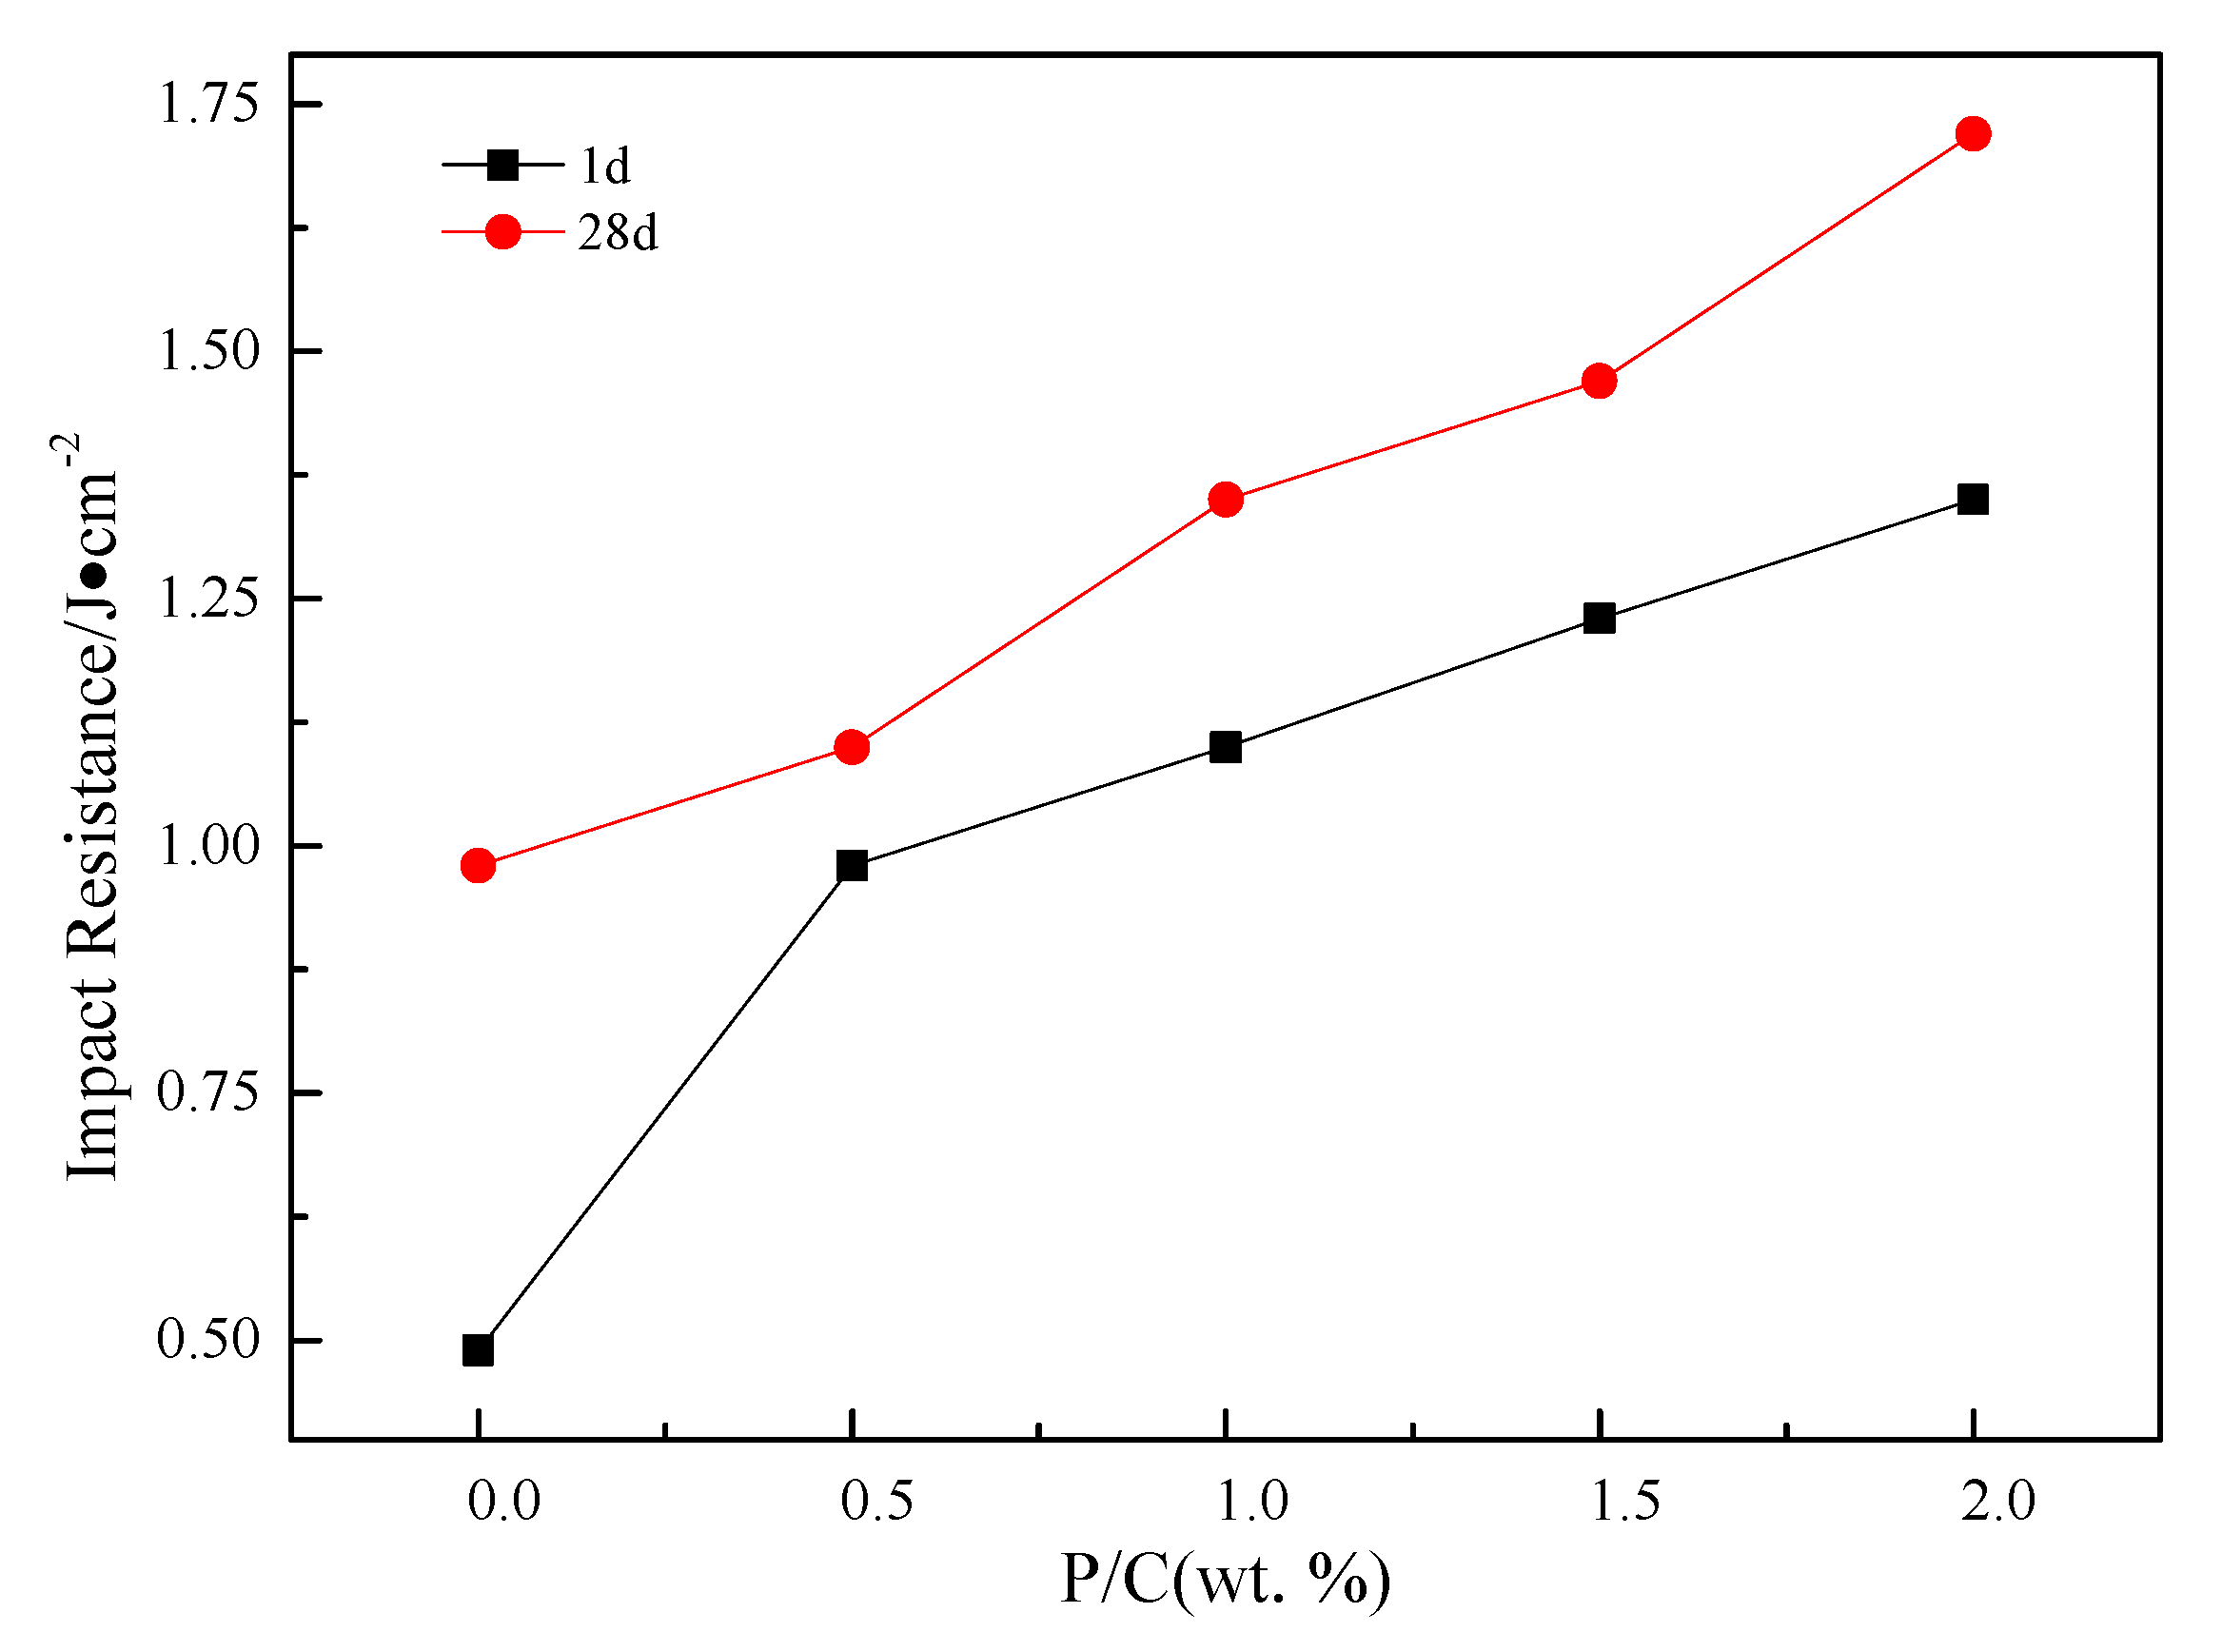
3.3. Impact Resistance
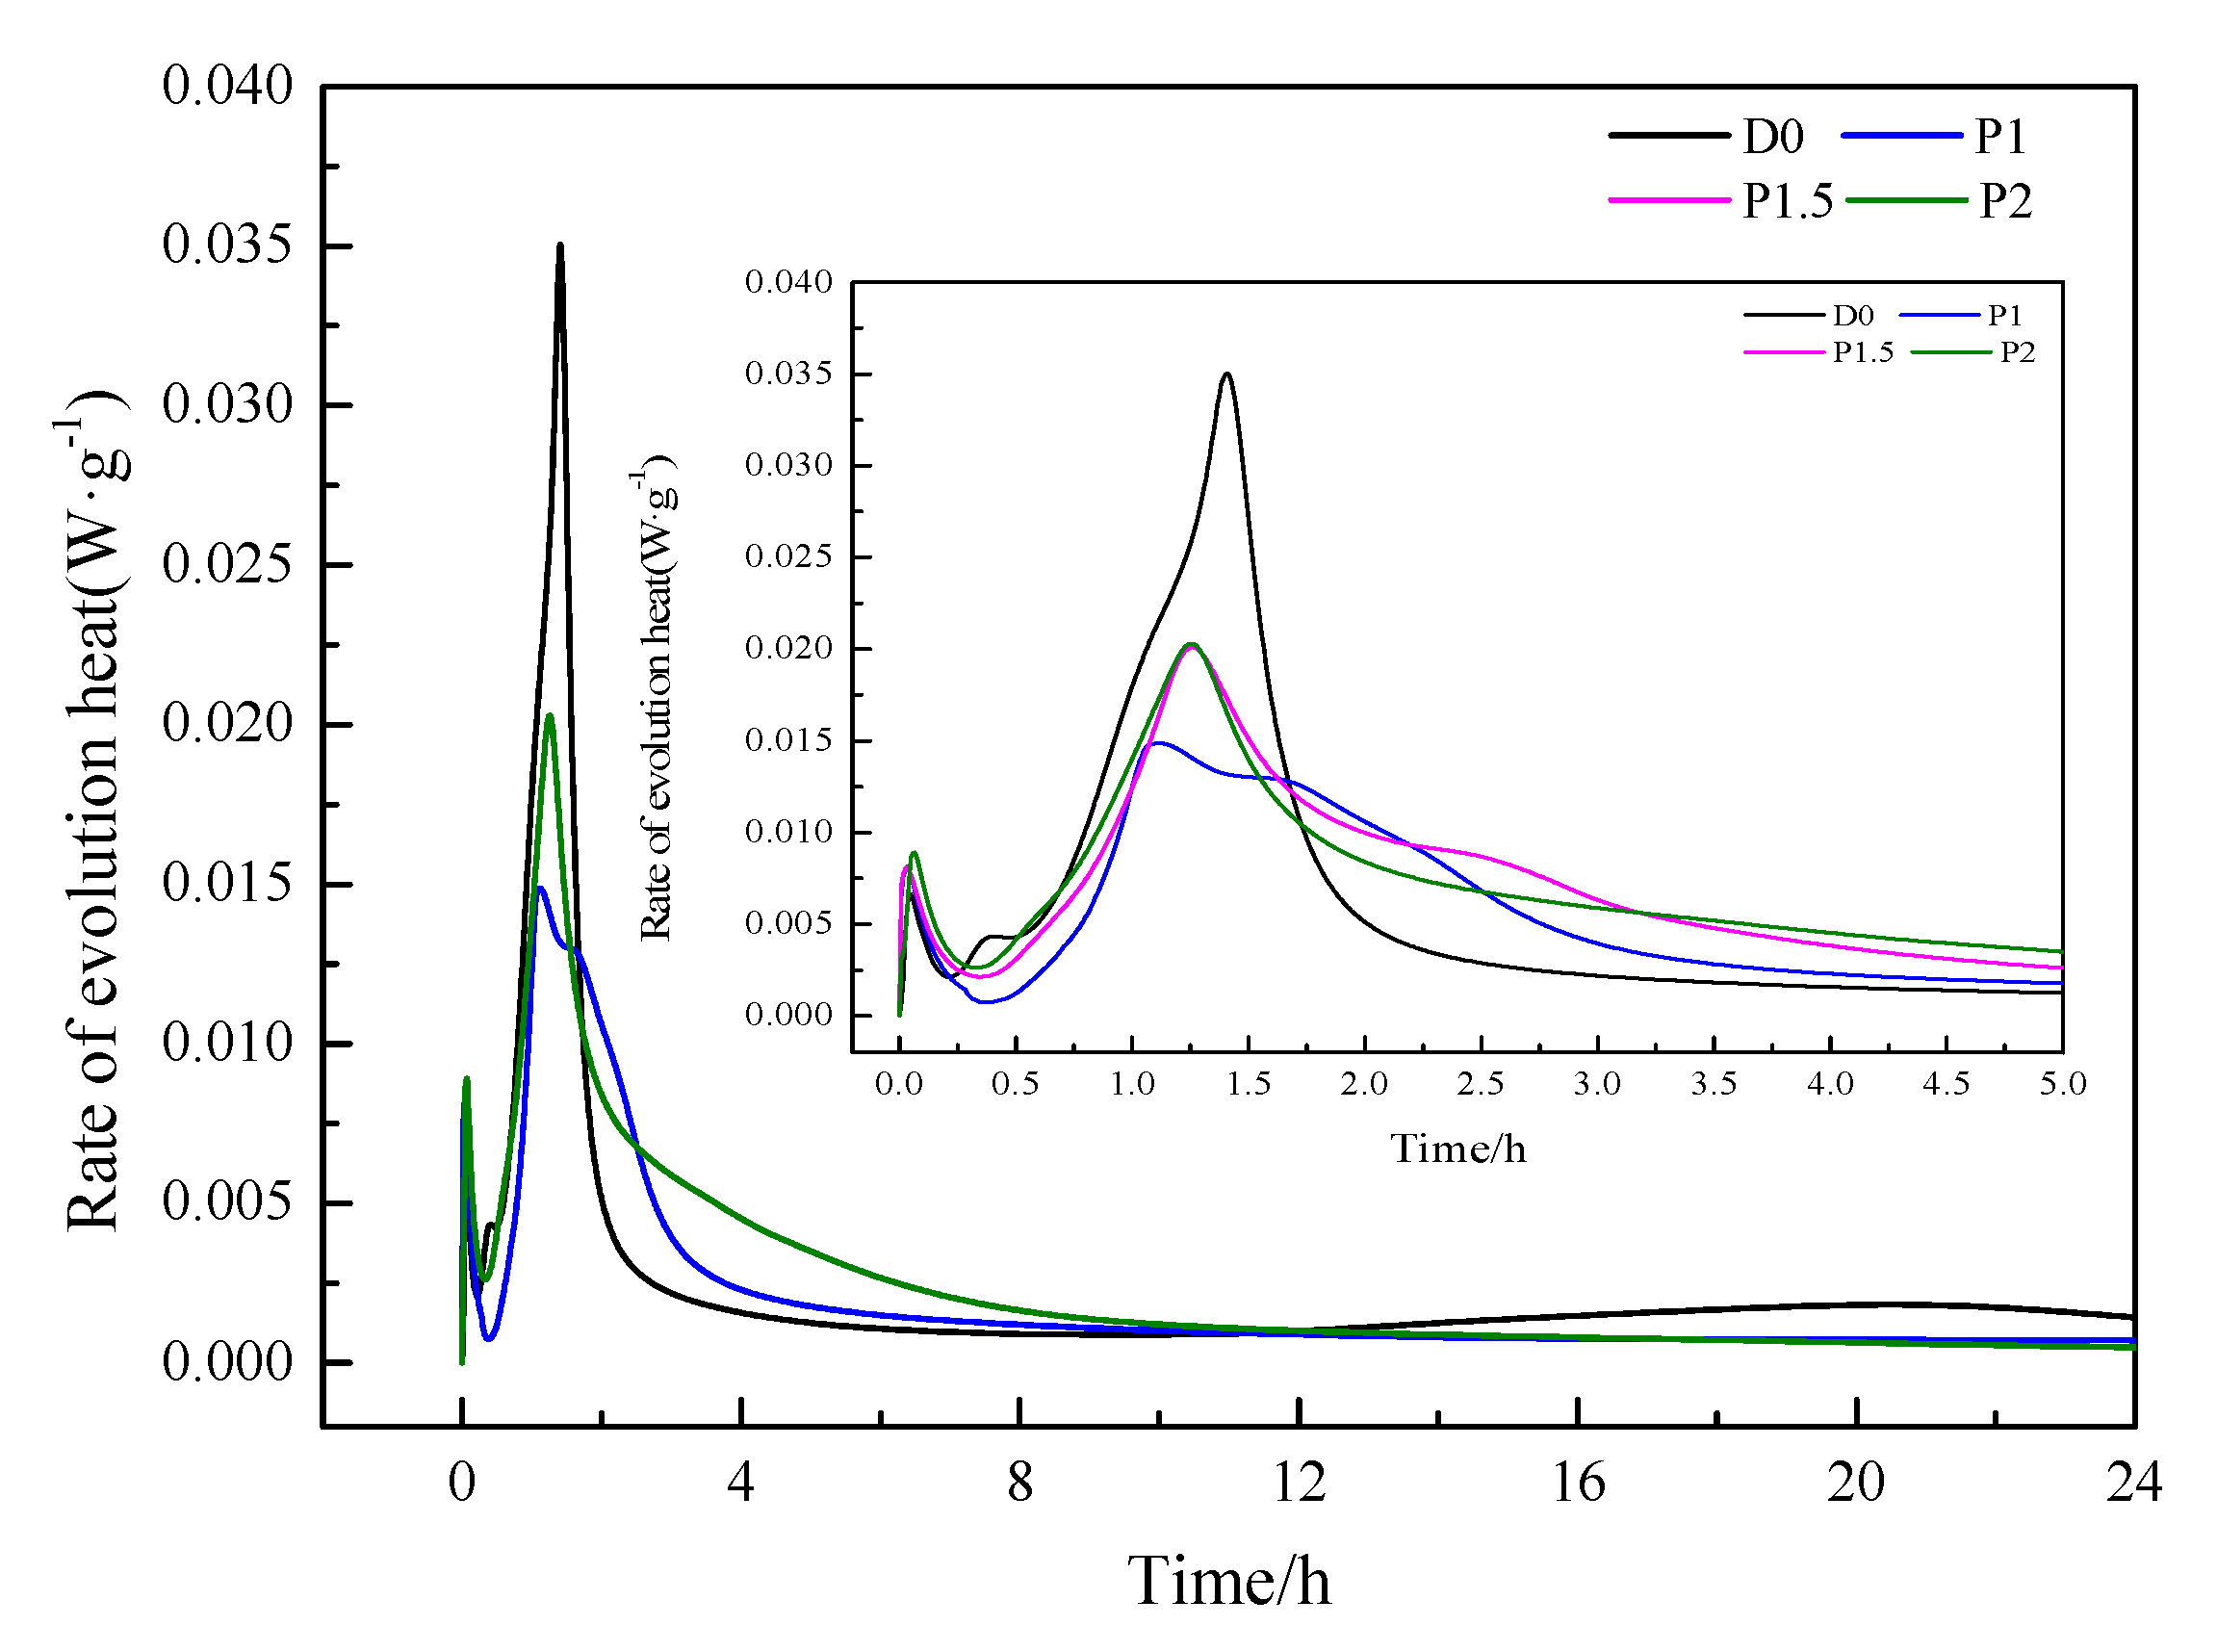
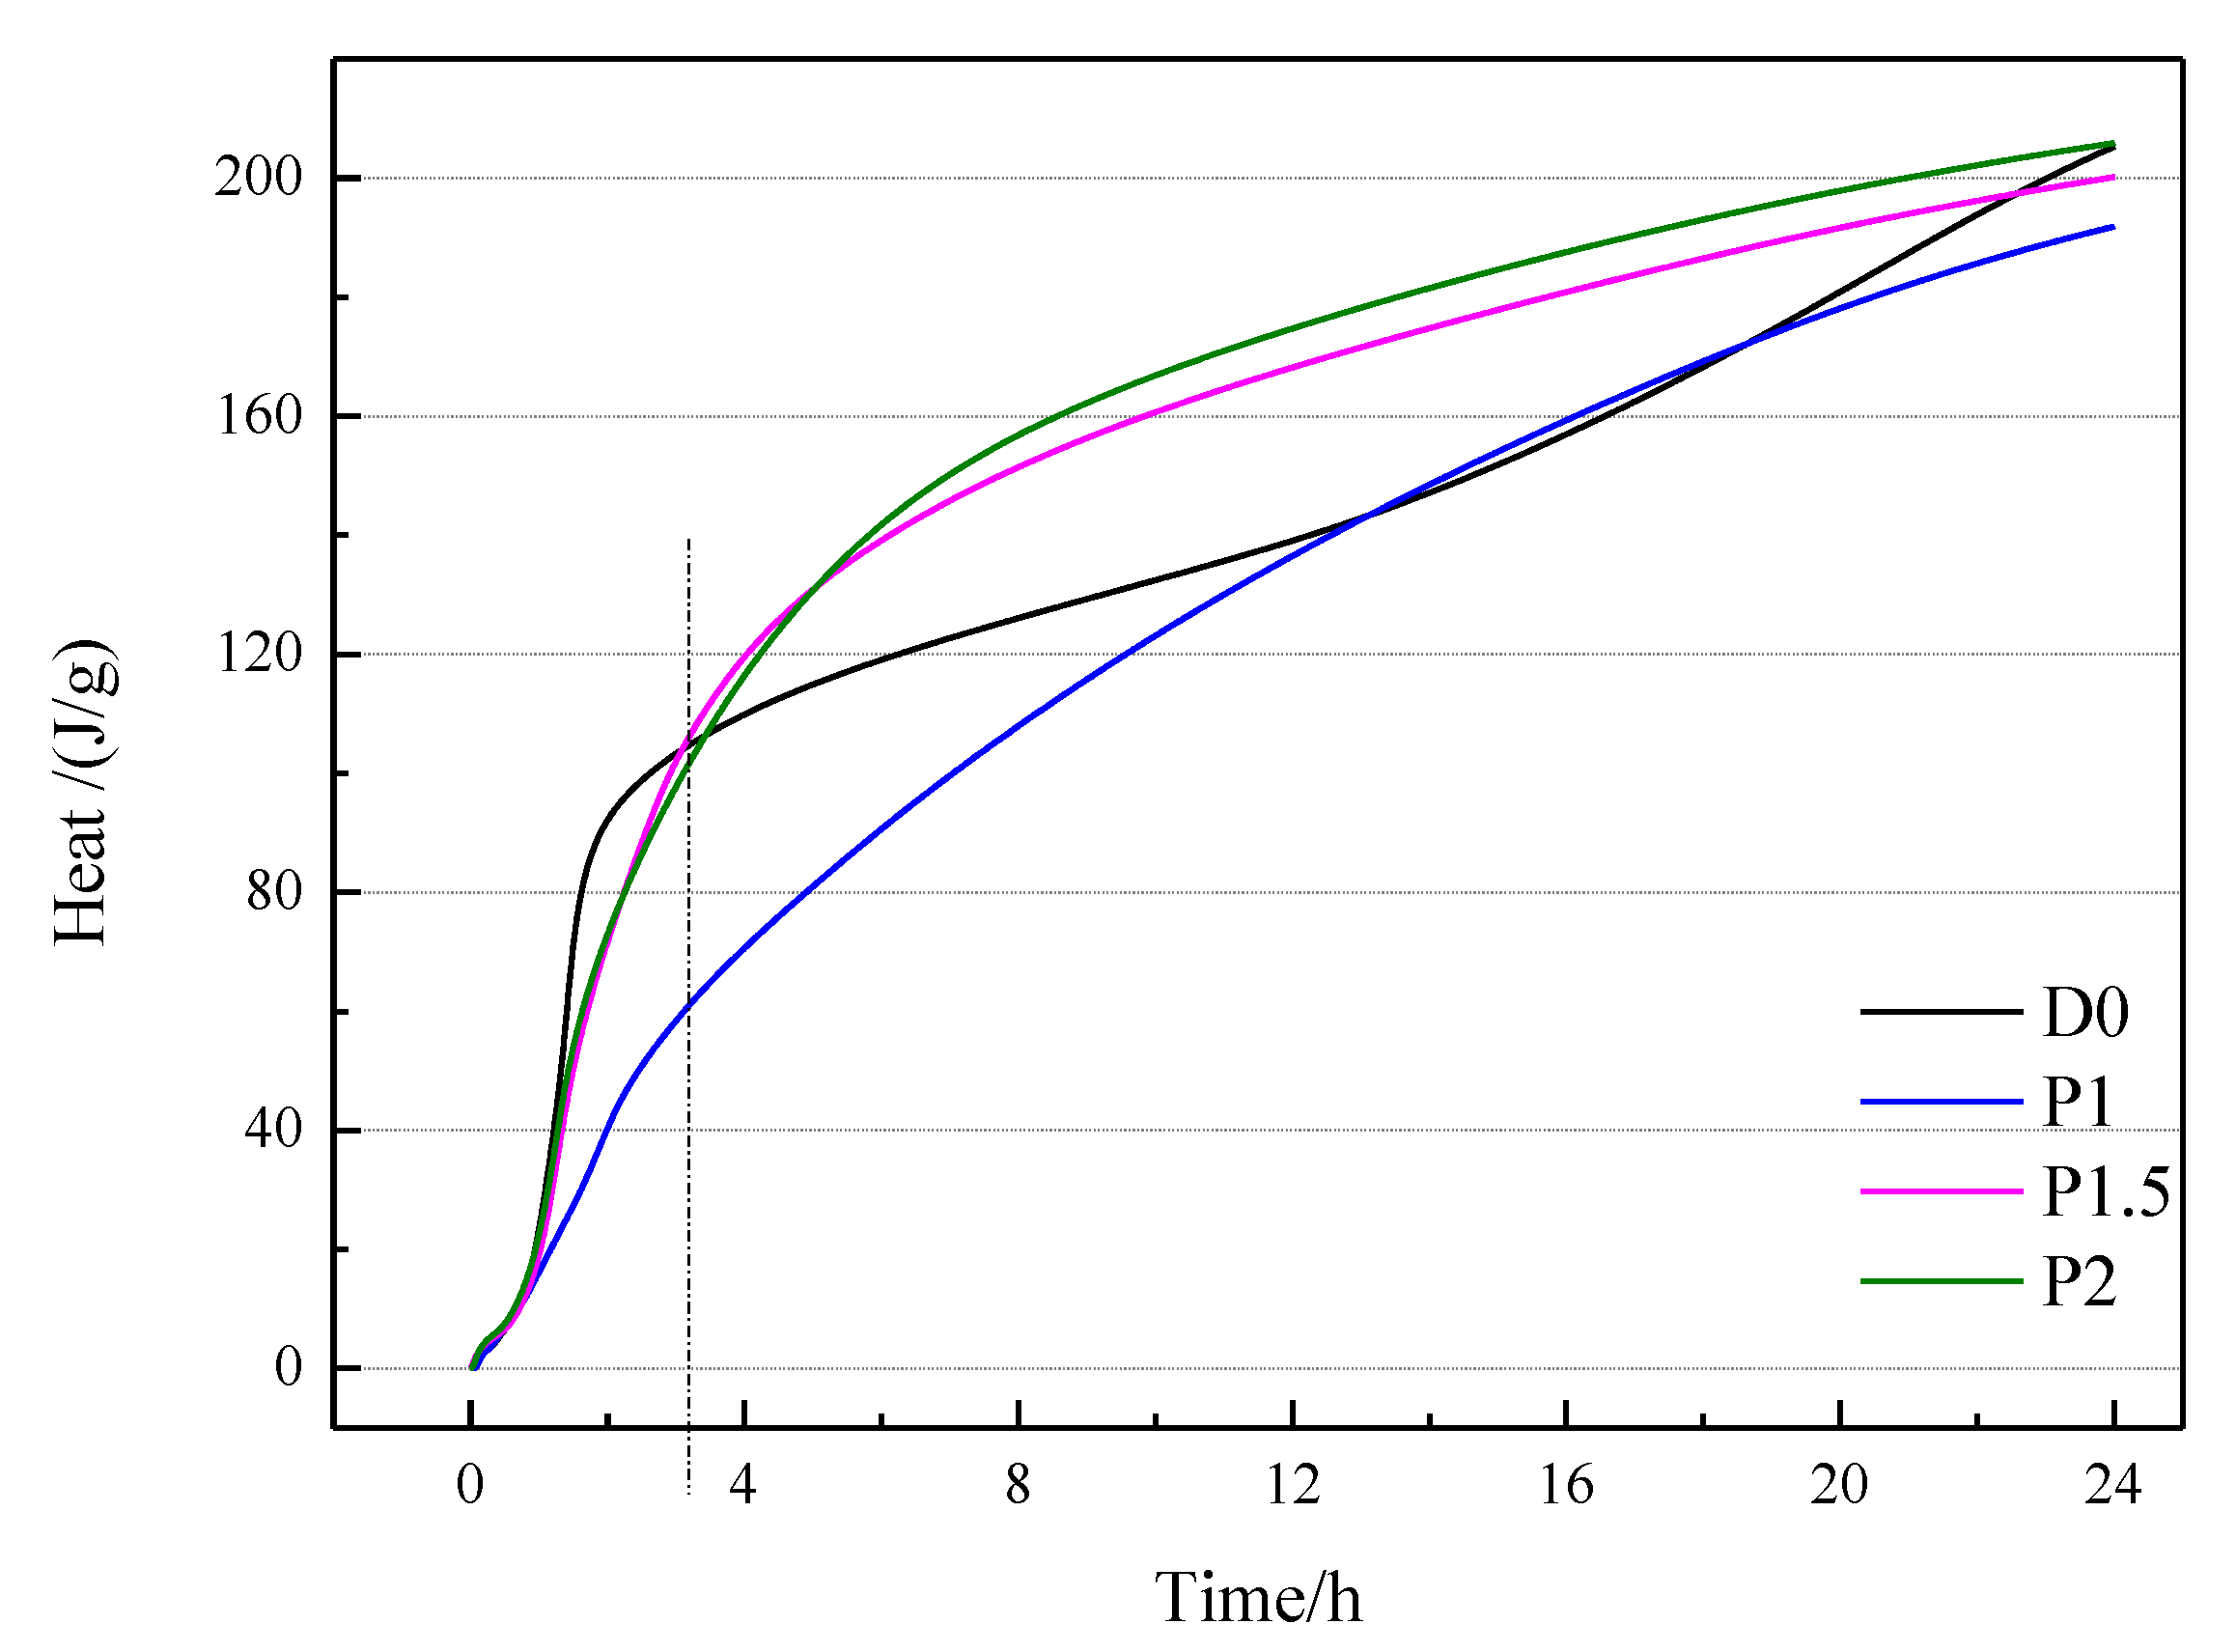
3.4. Hydration Heat of Composite Cement
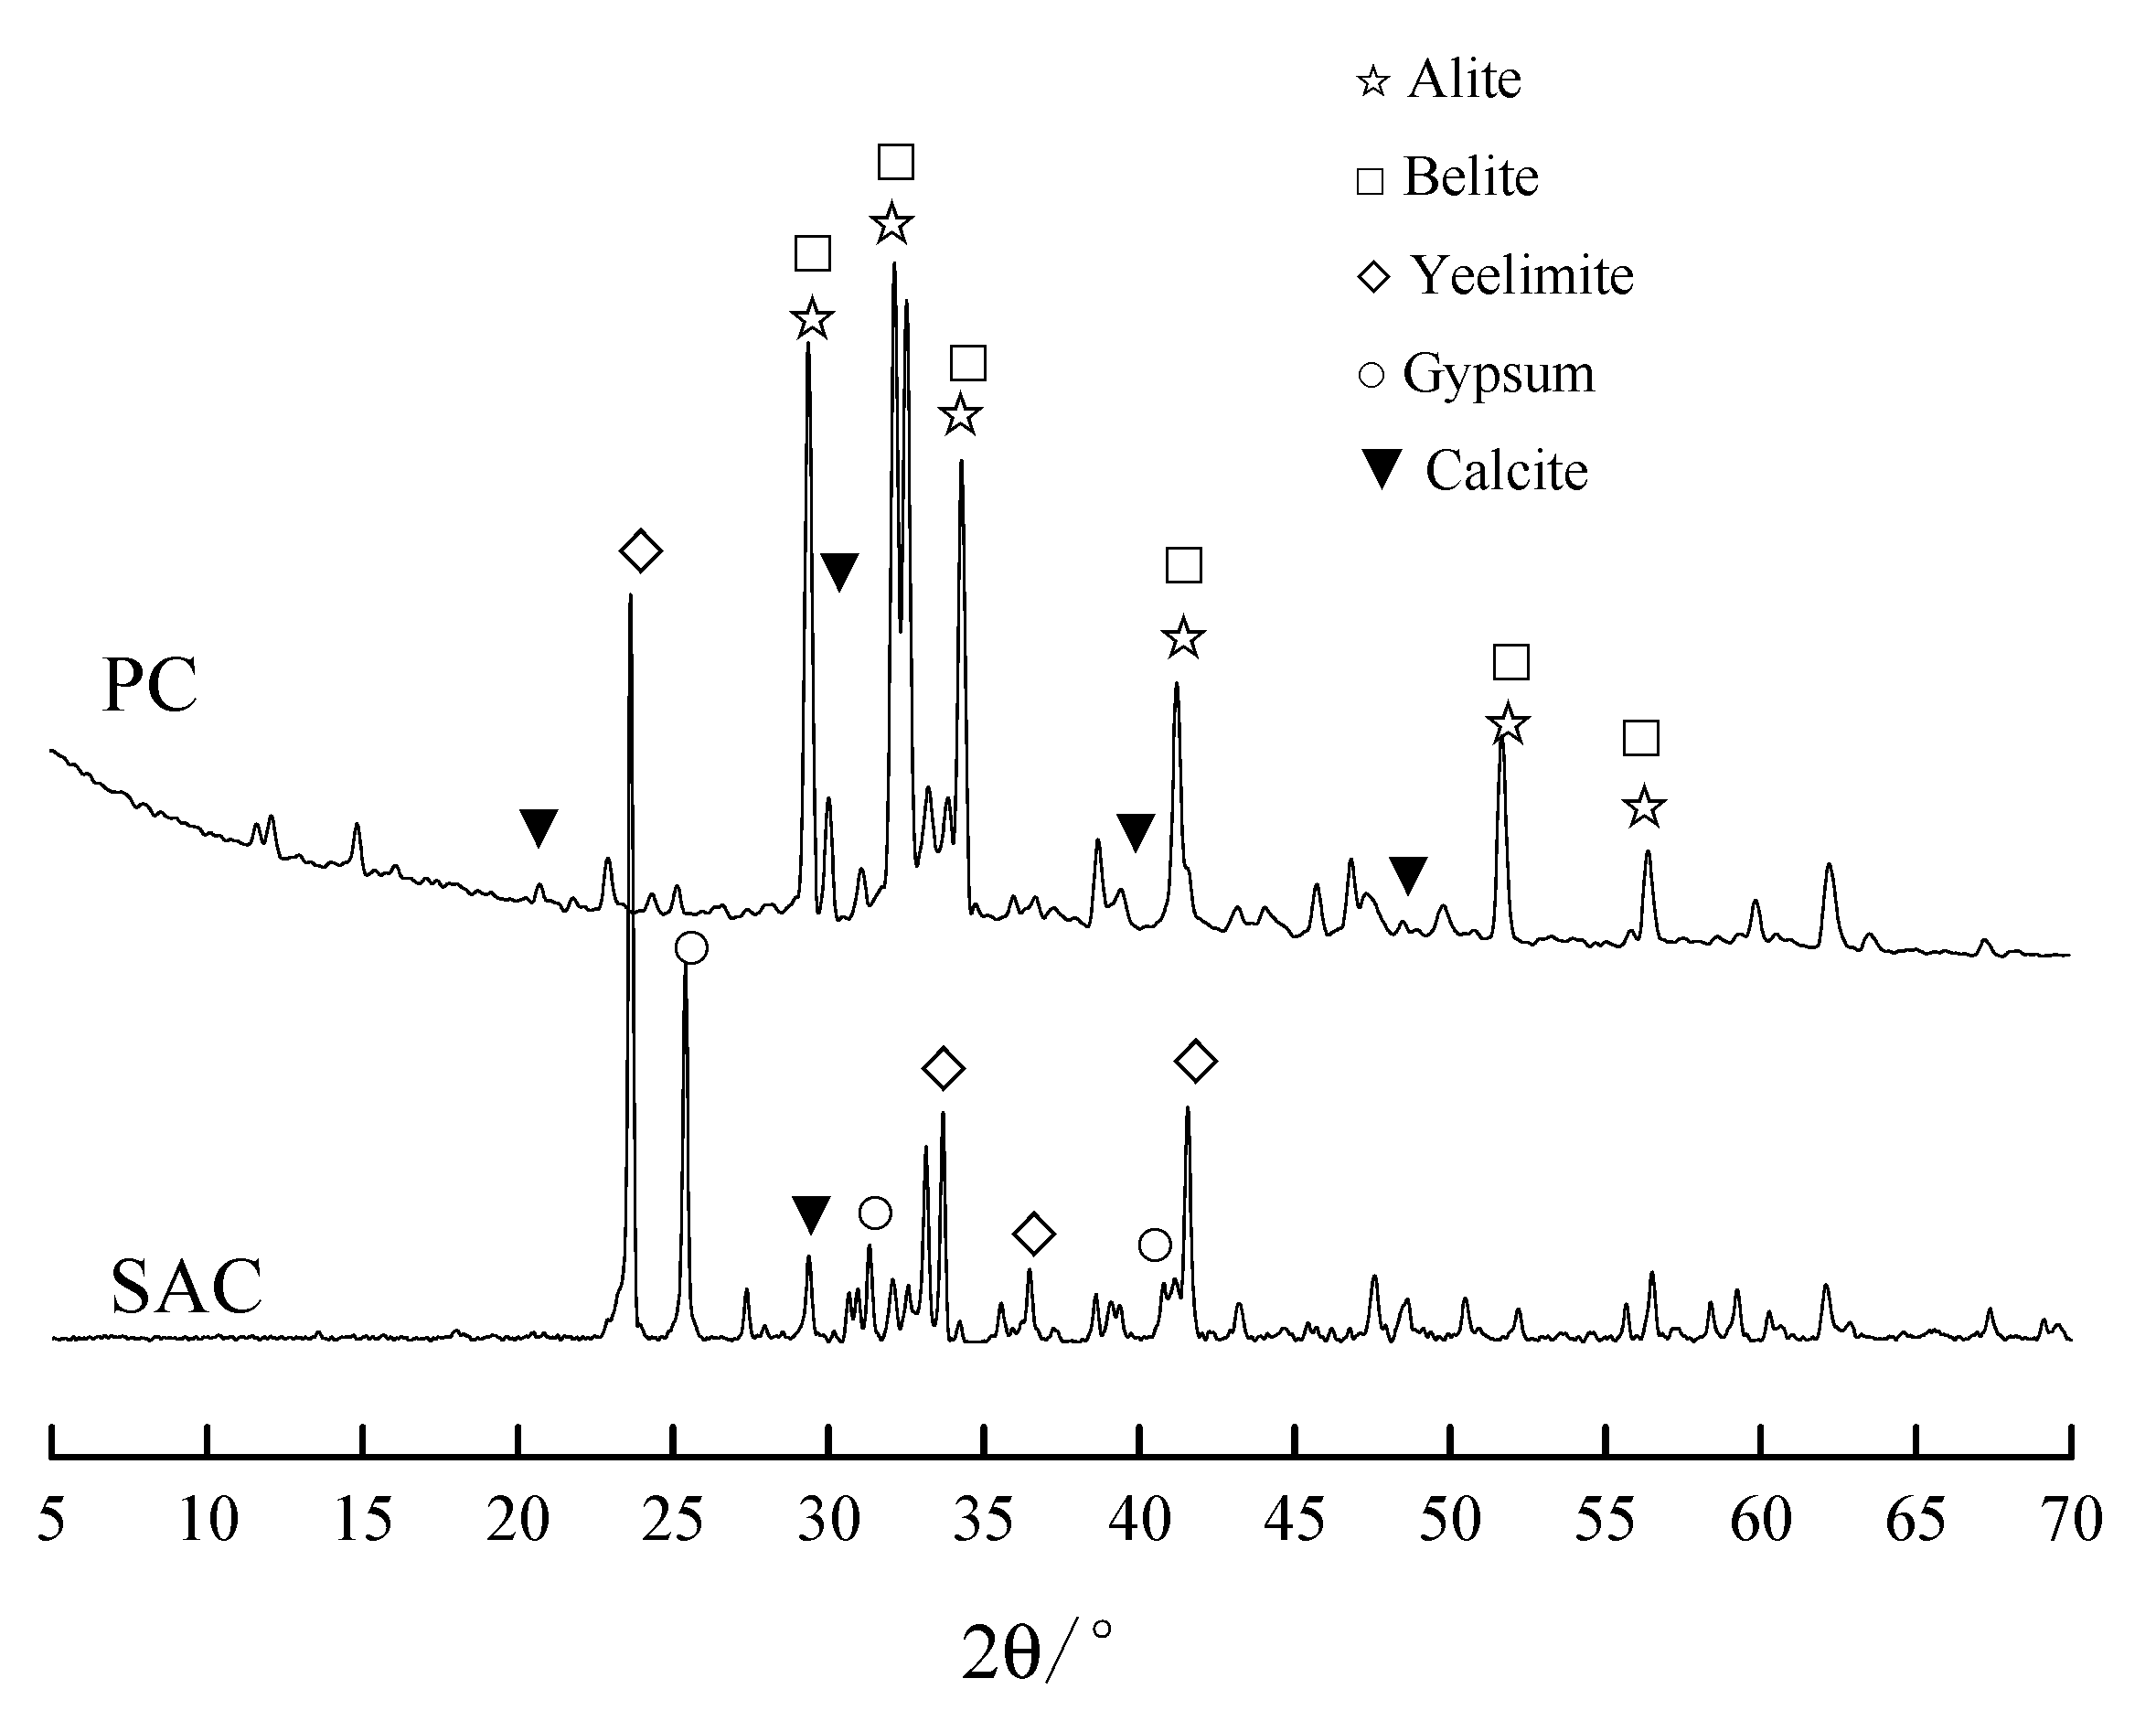
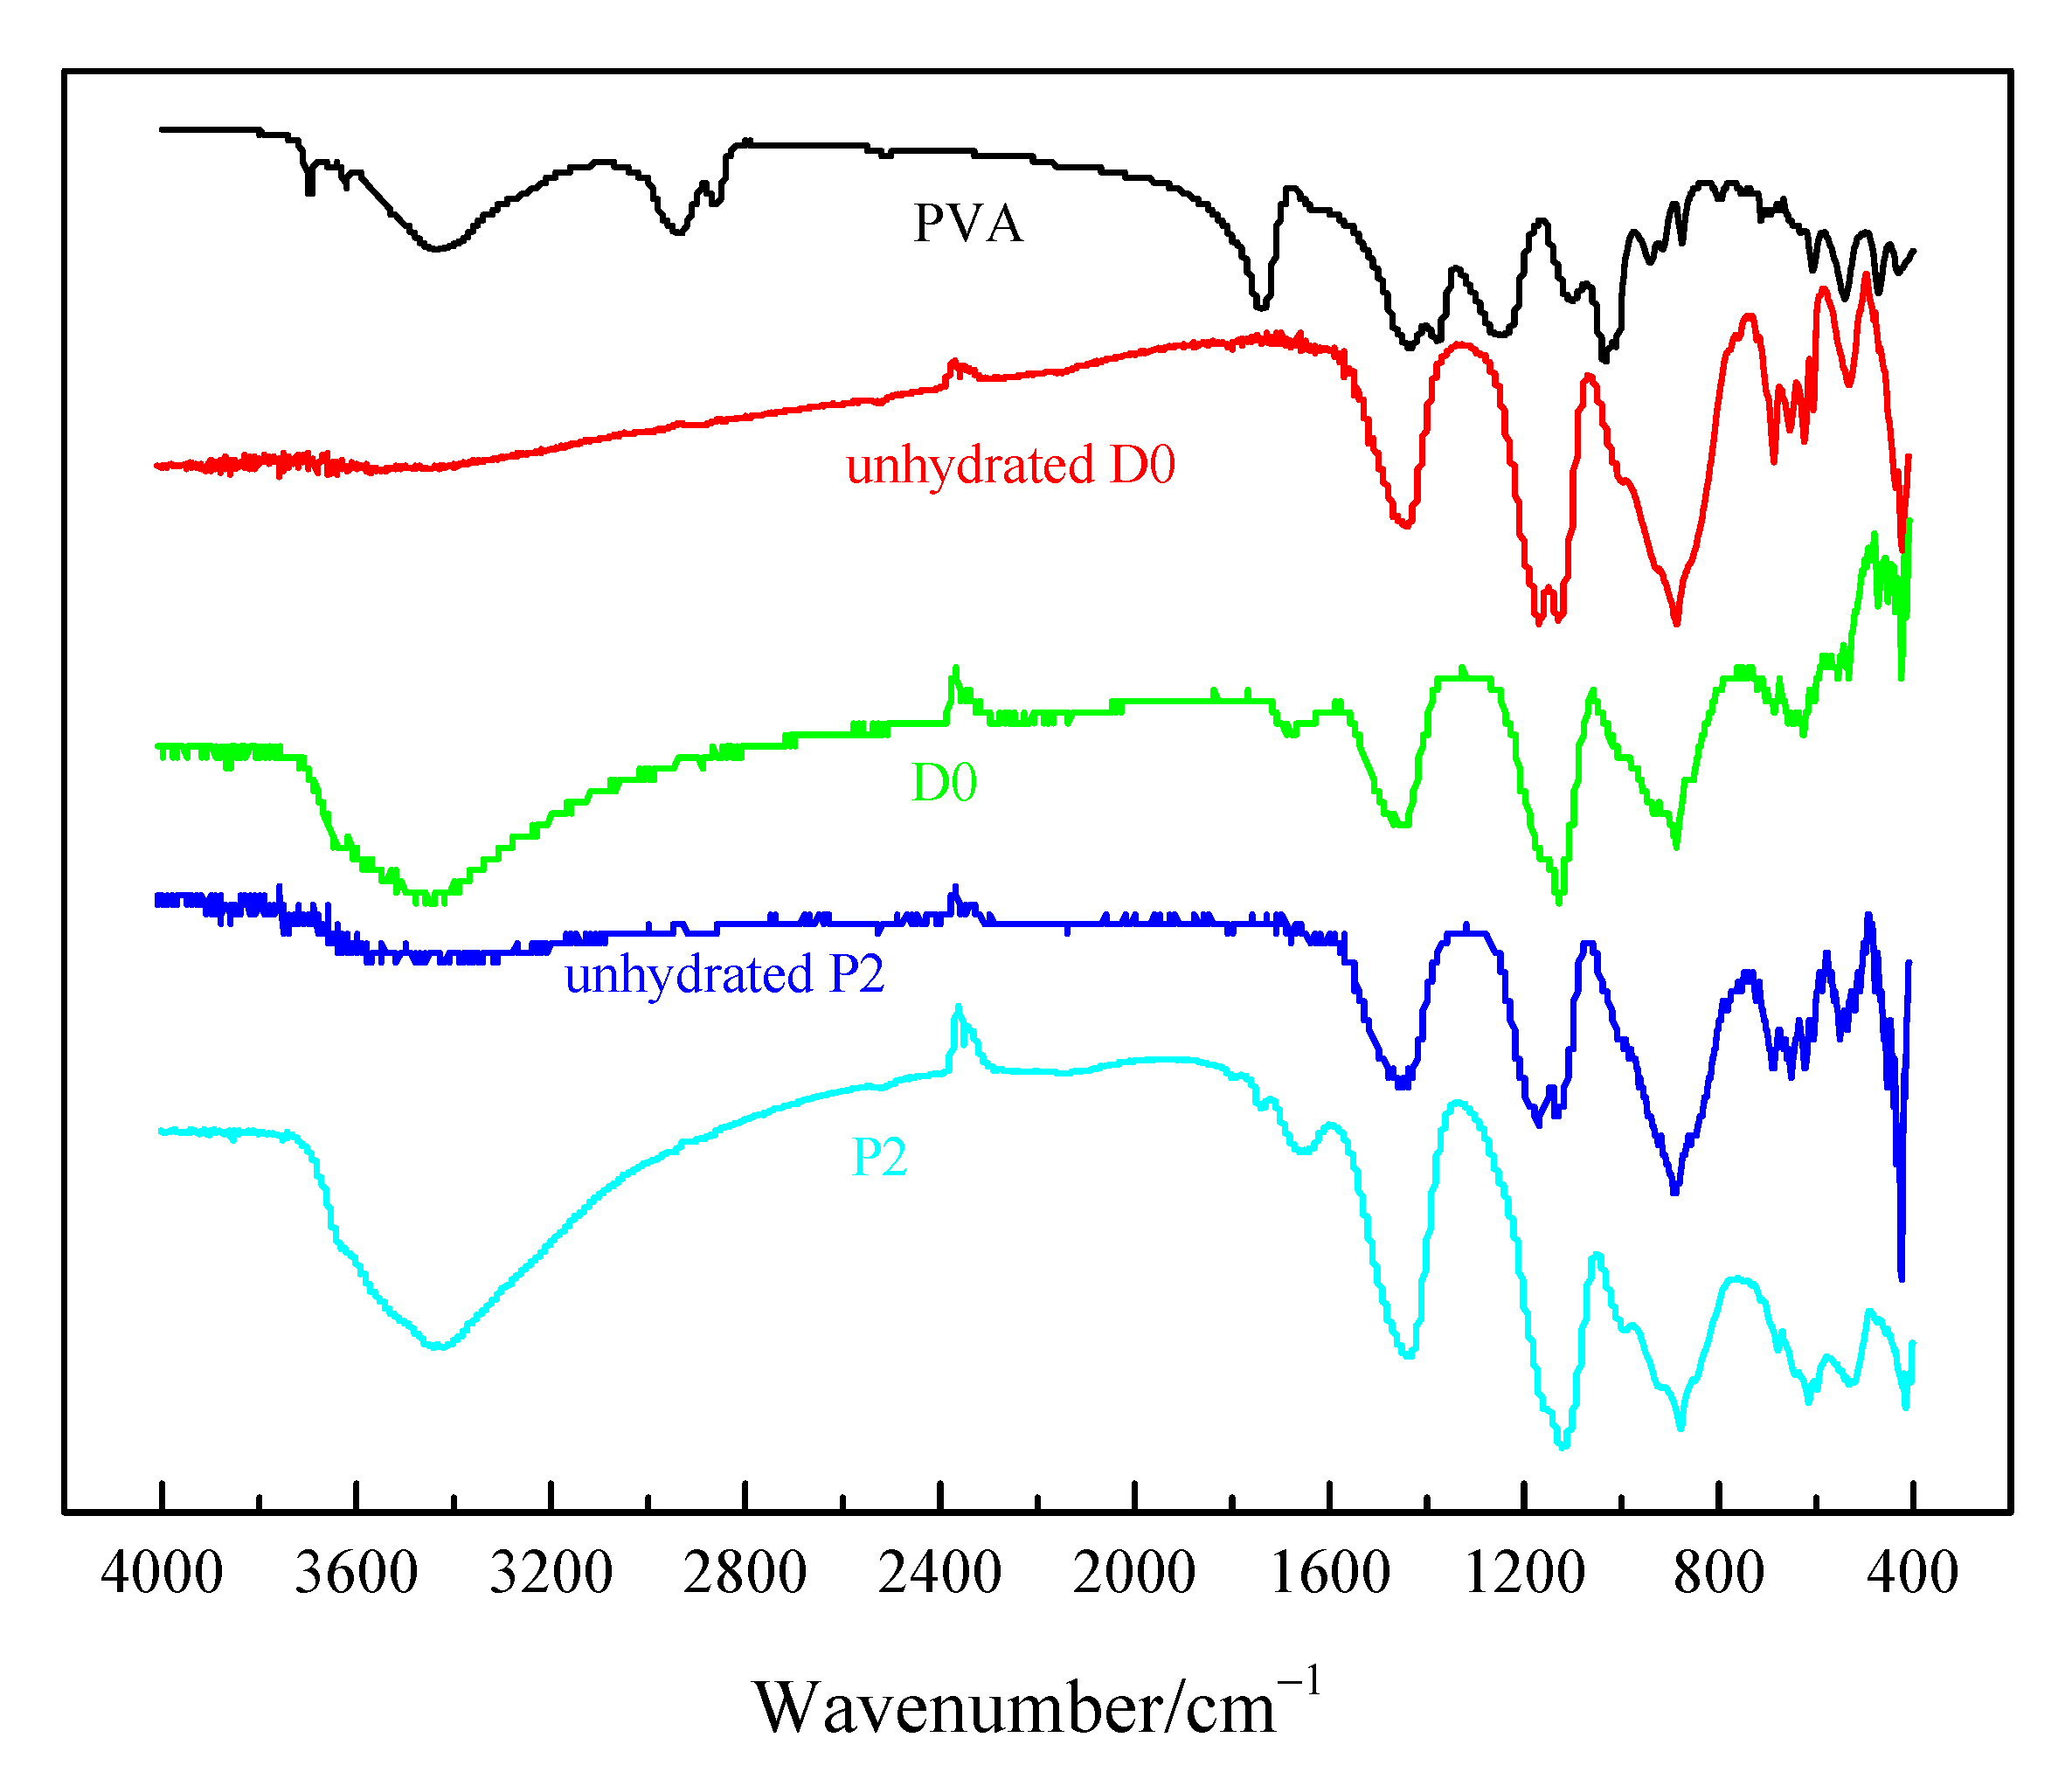
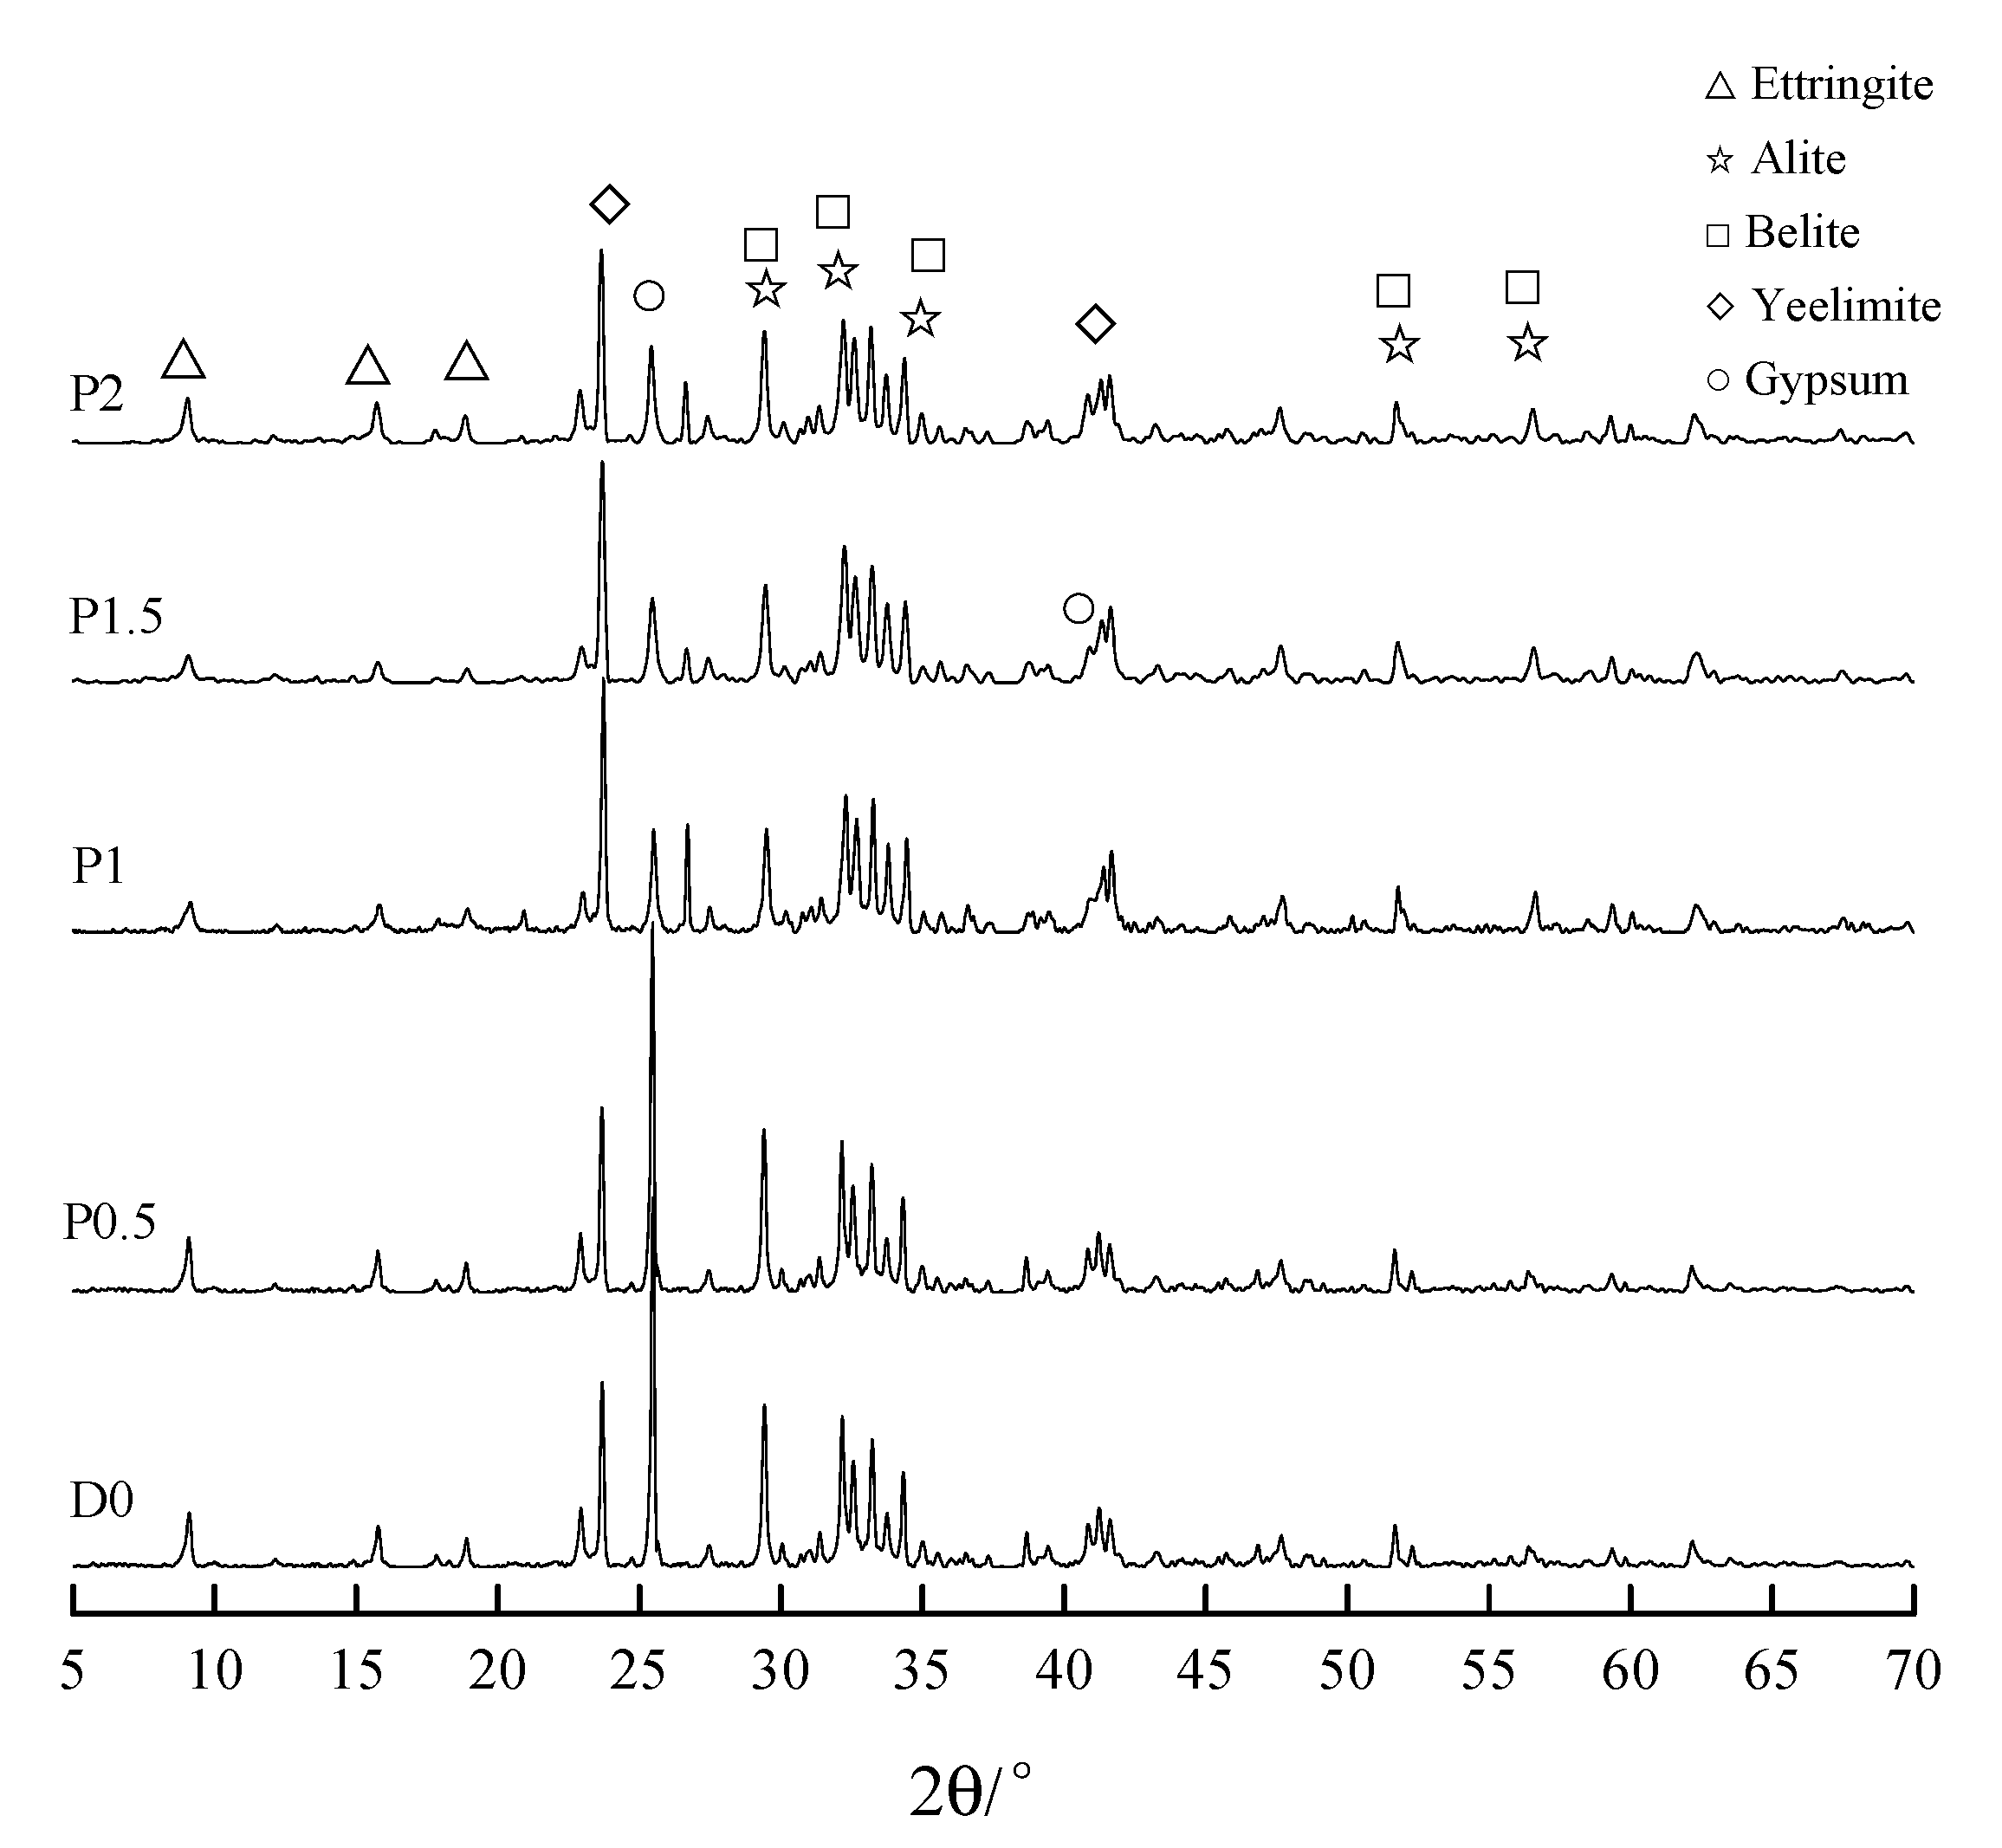
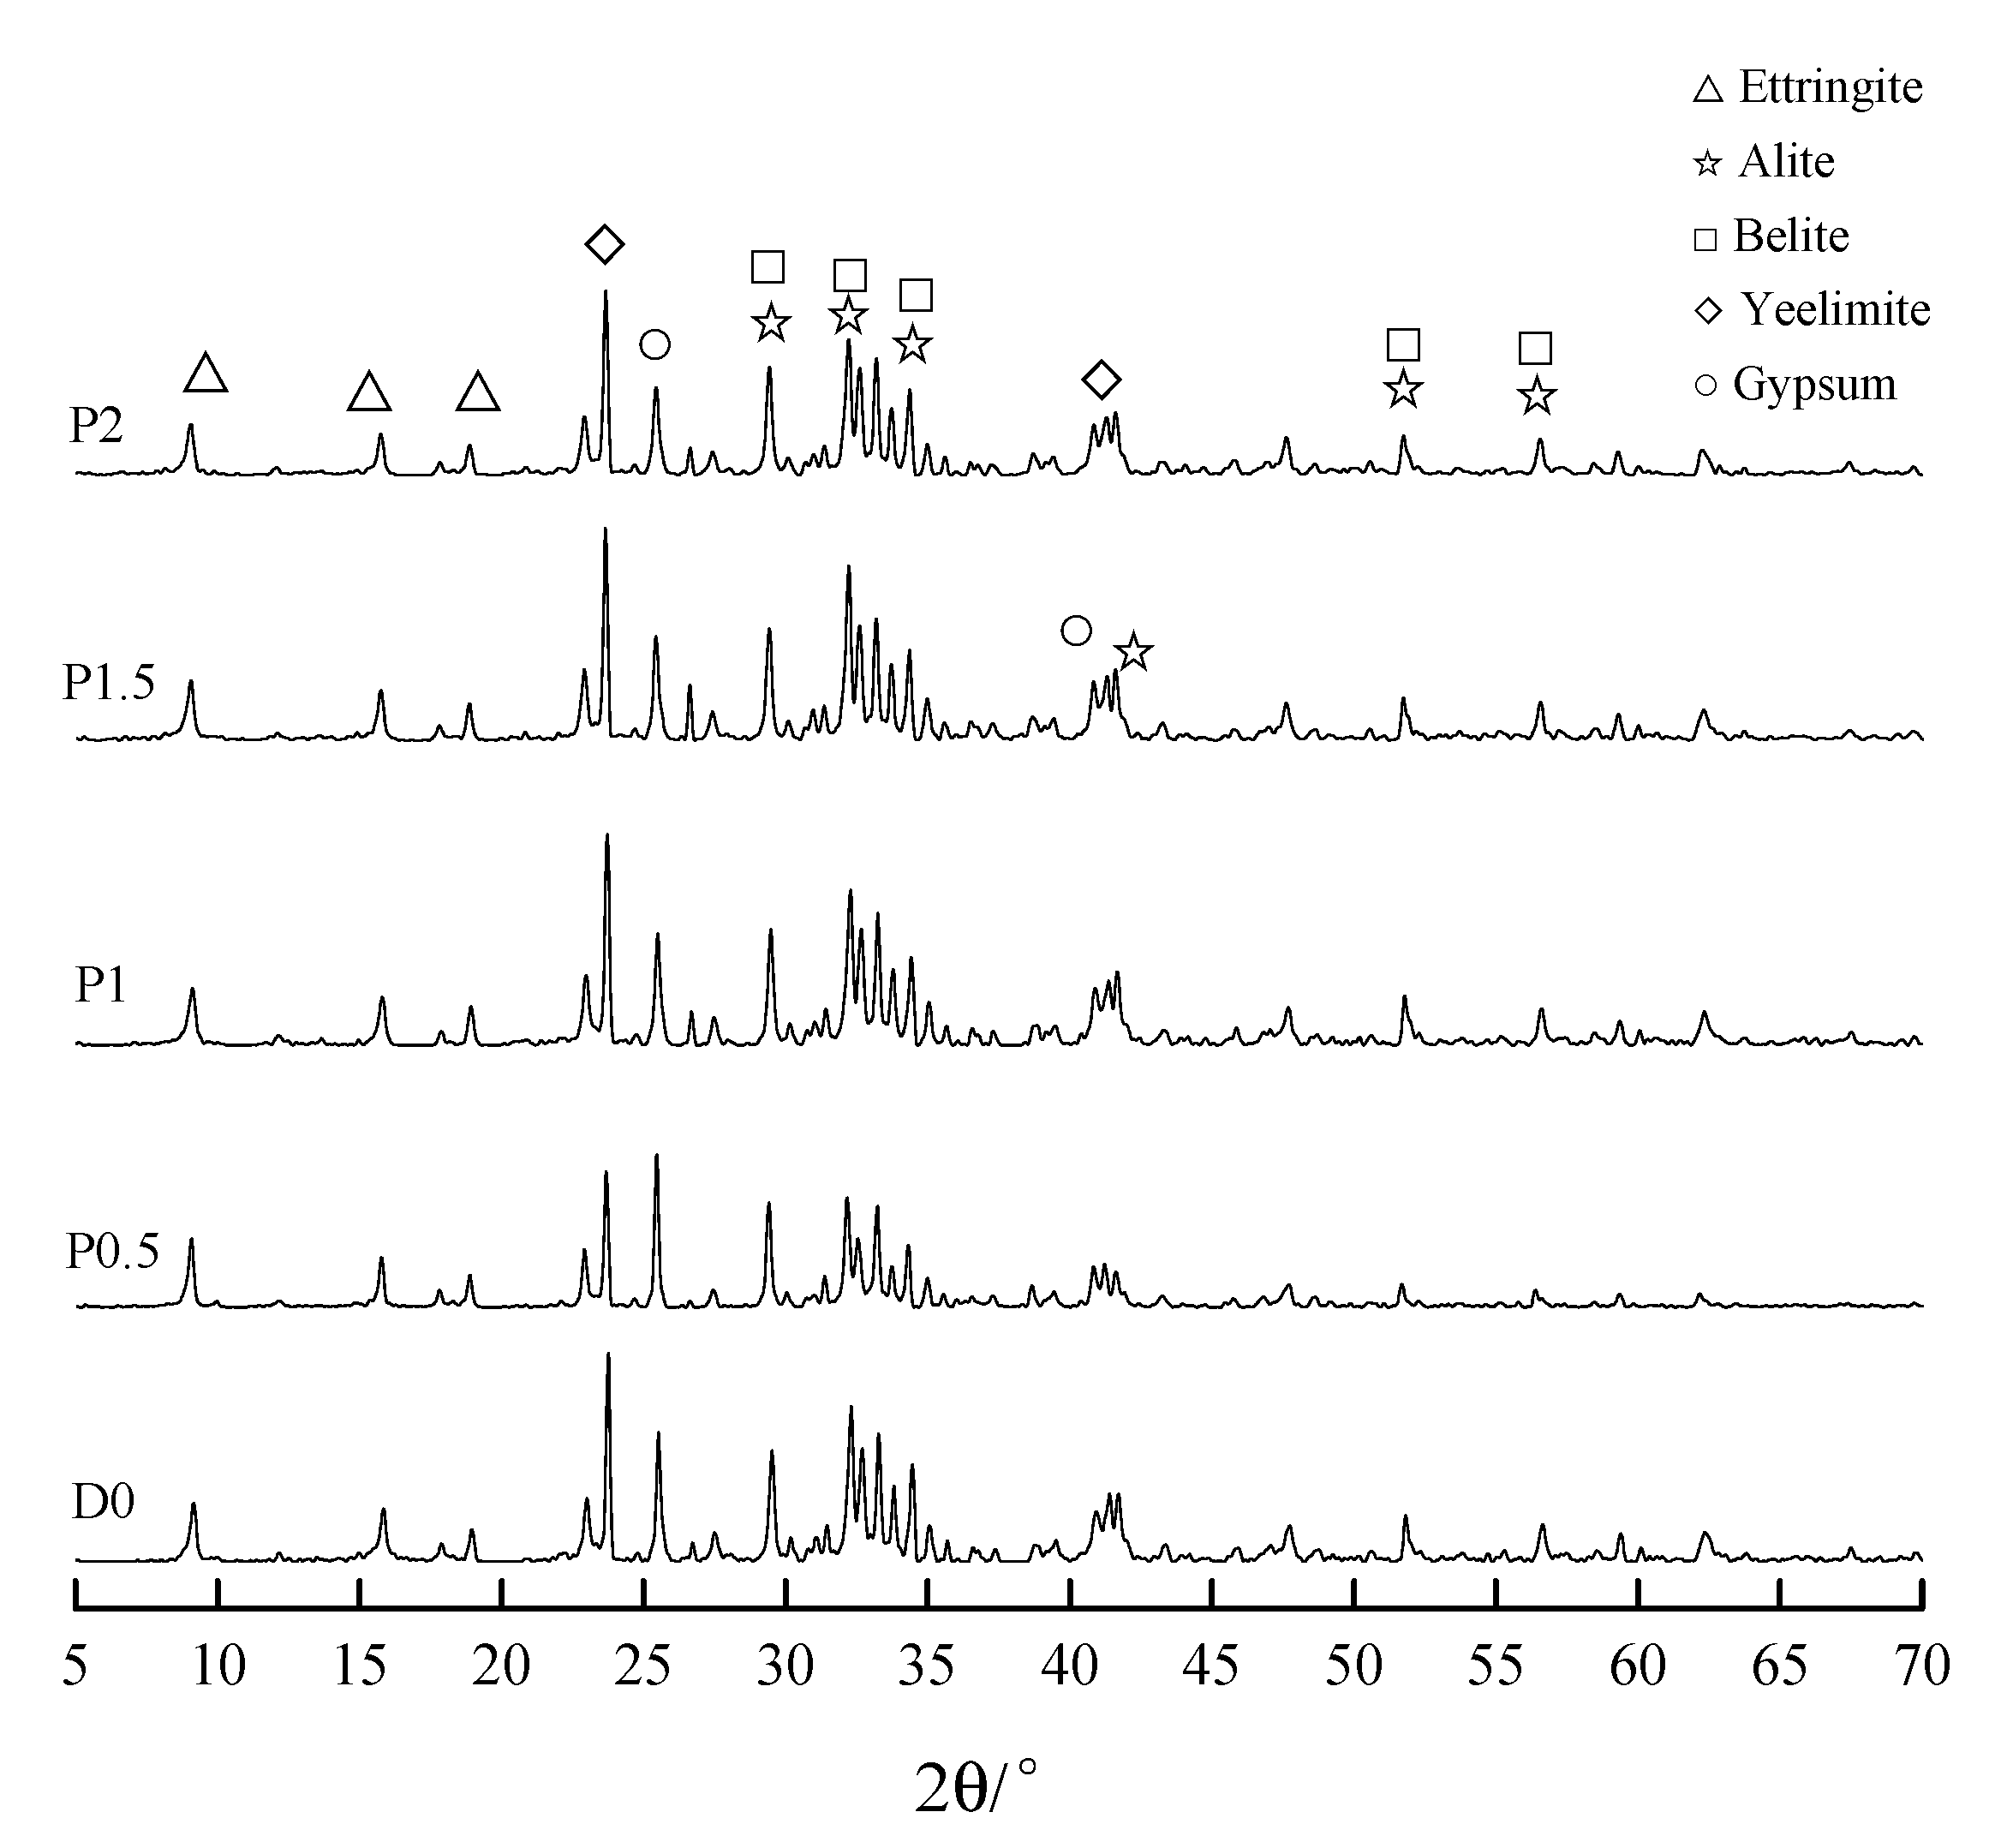
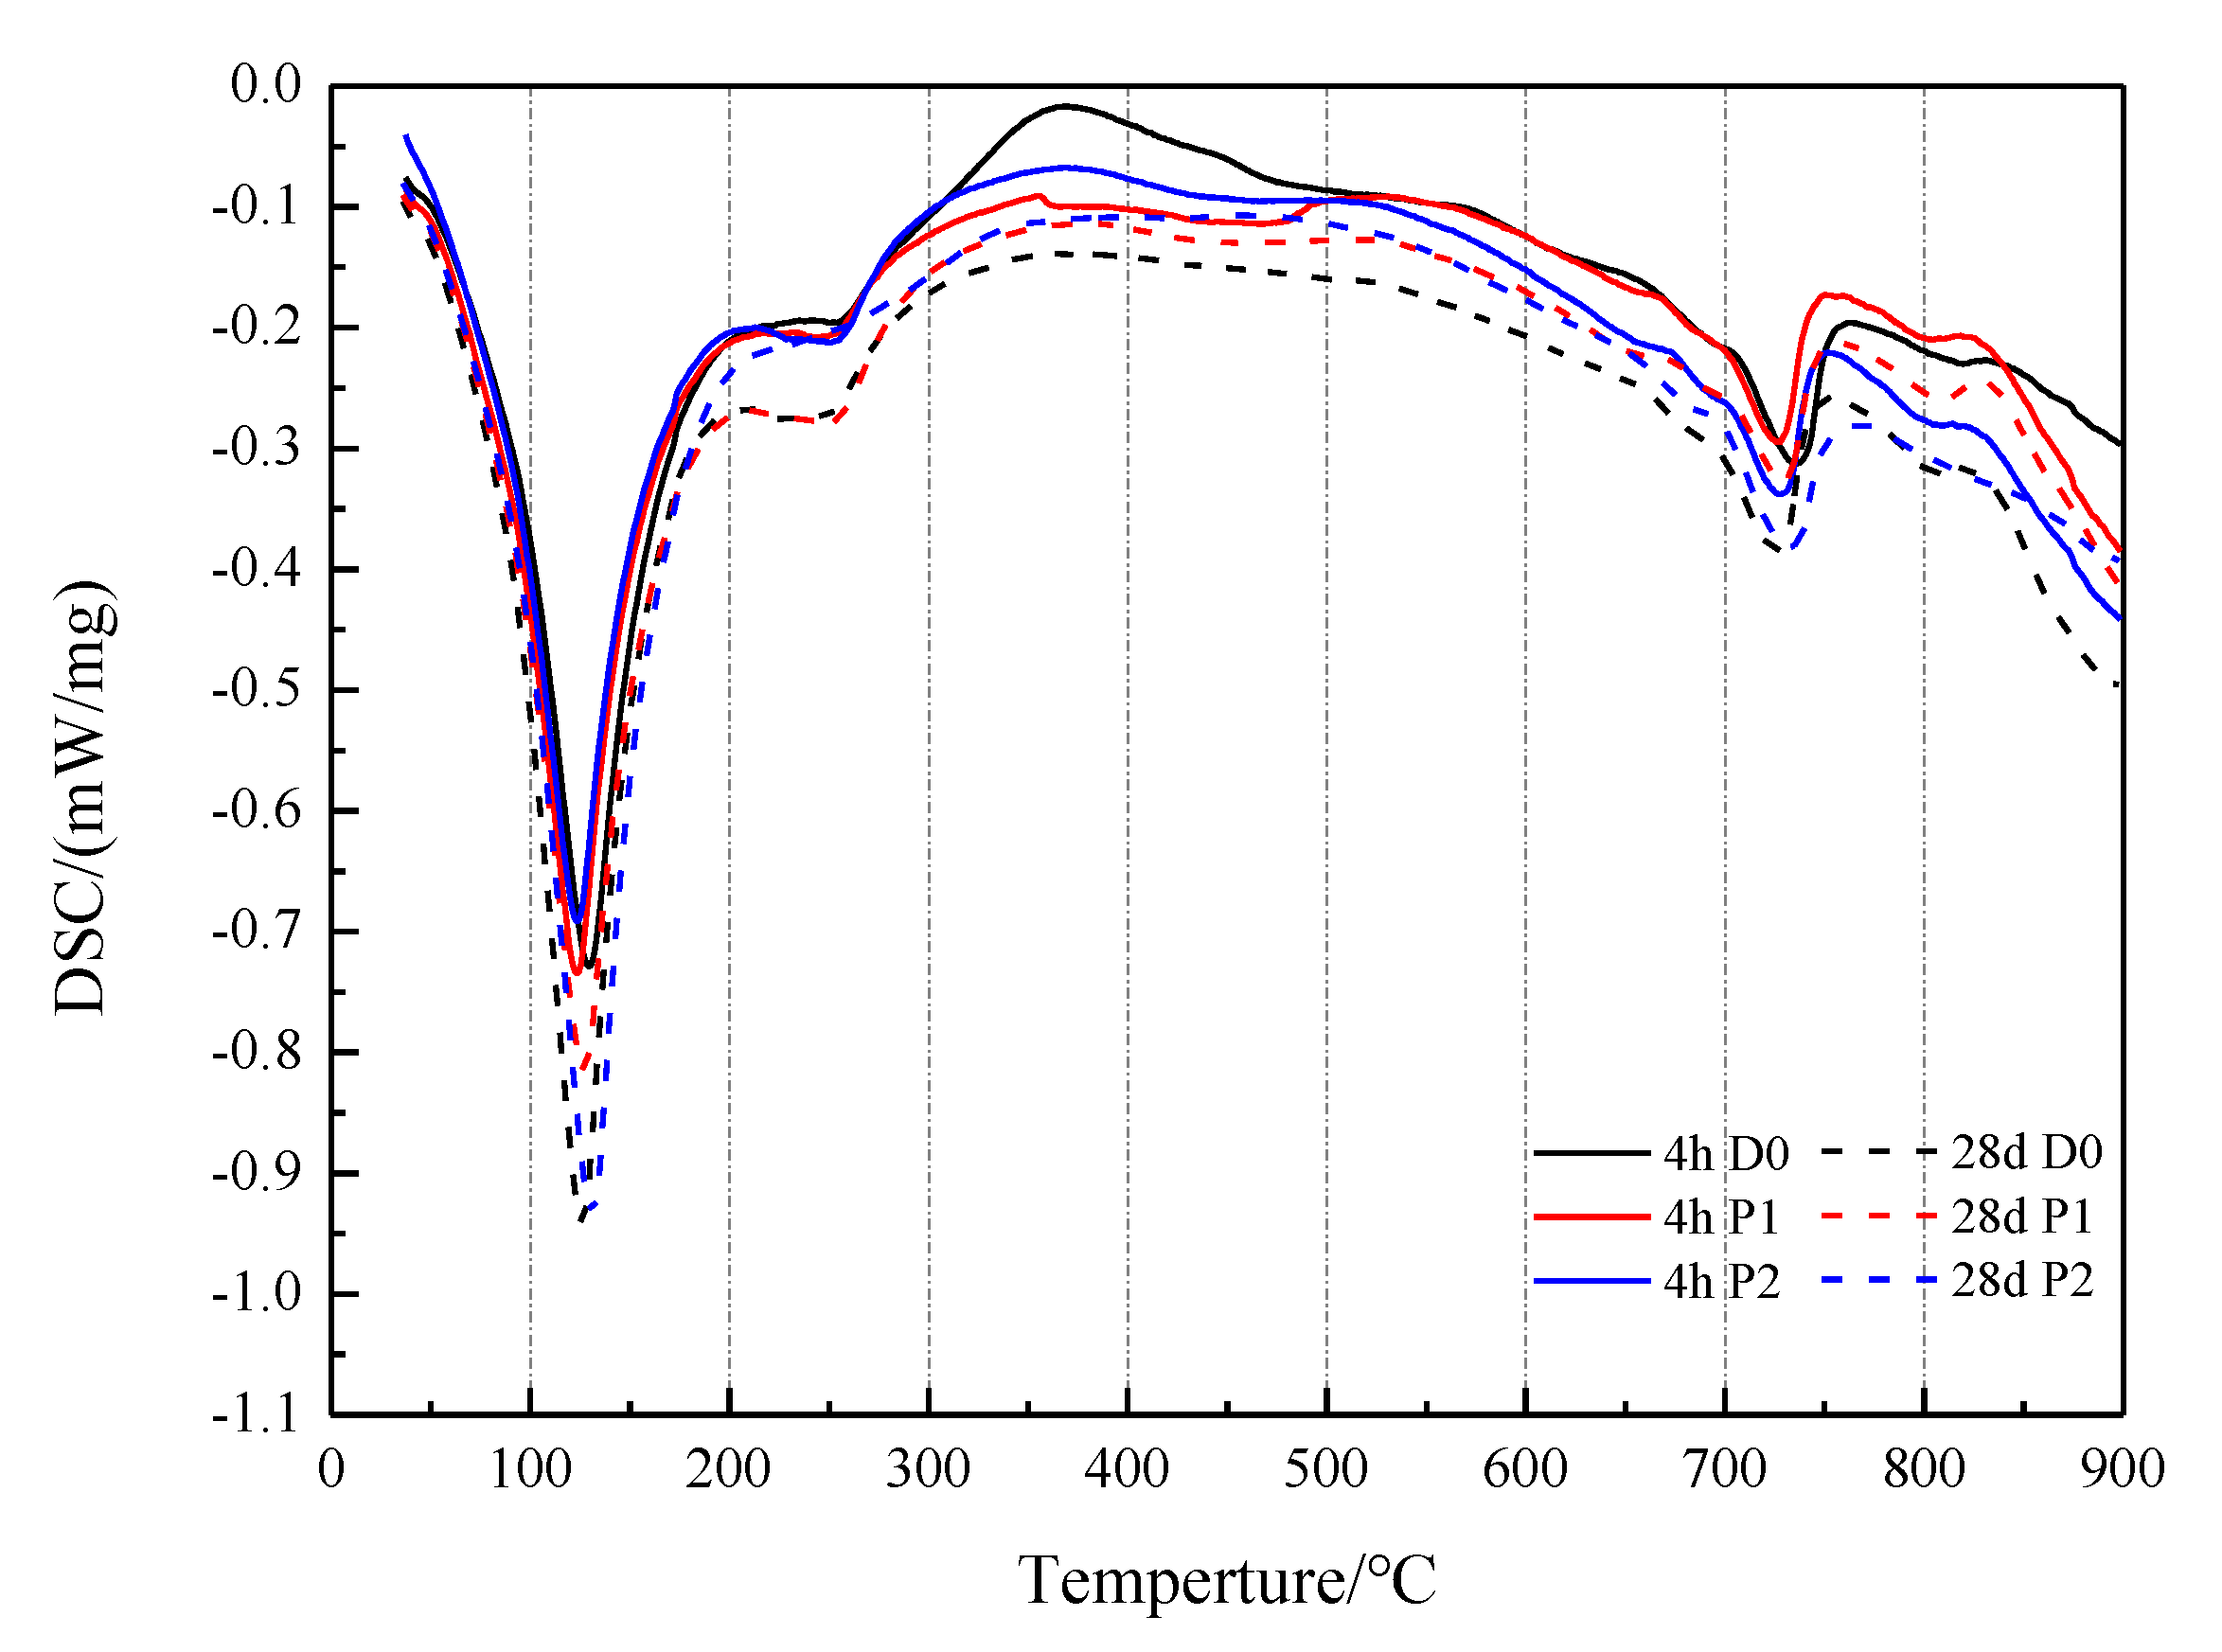
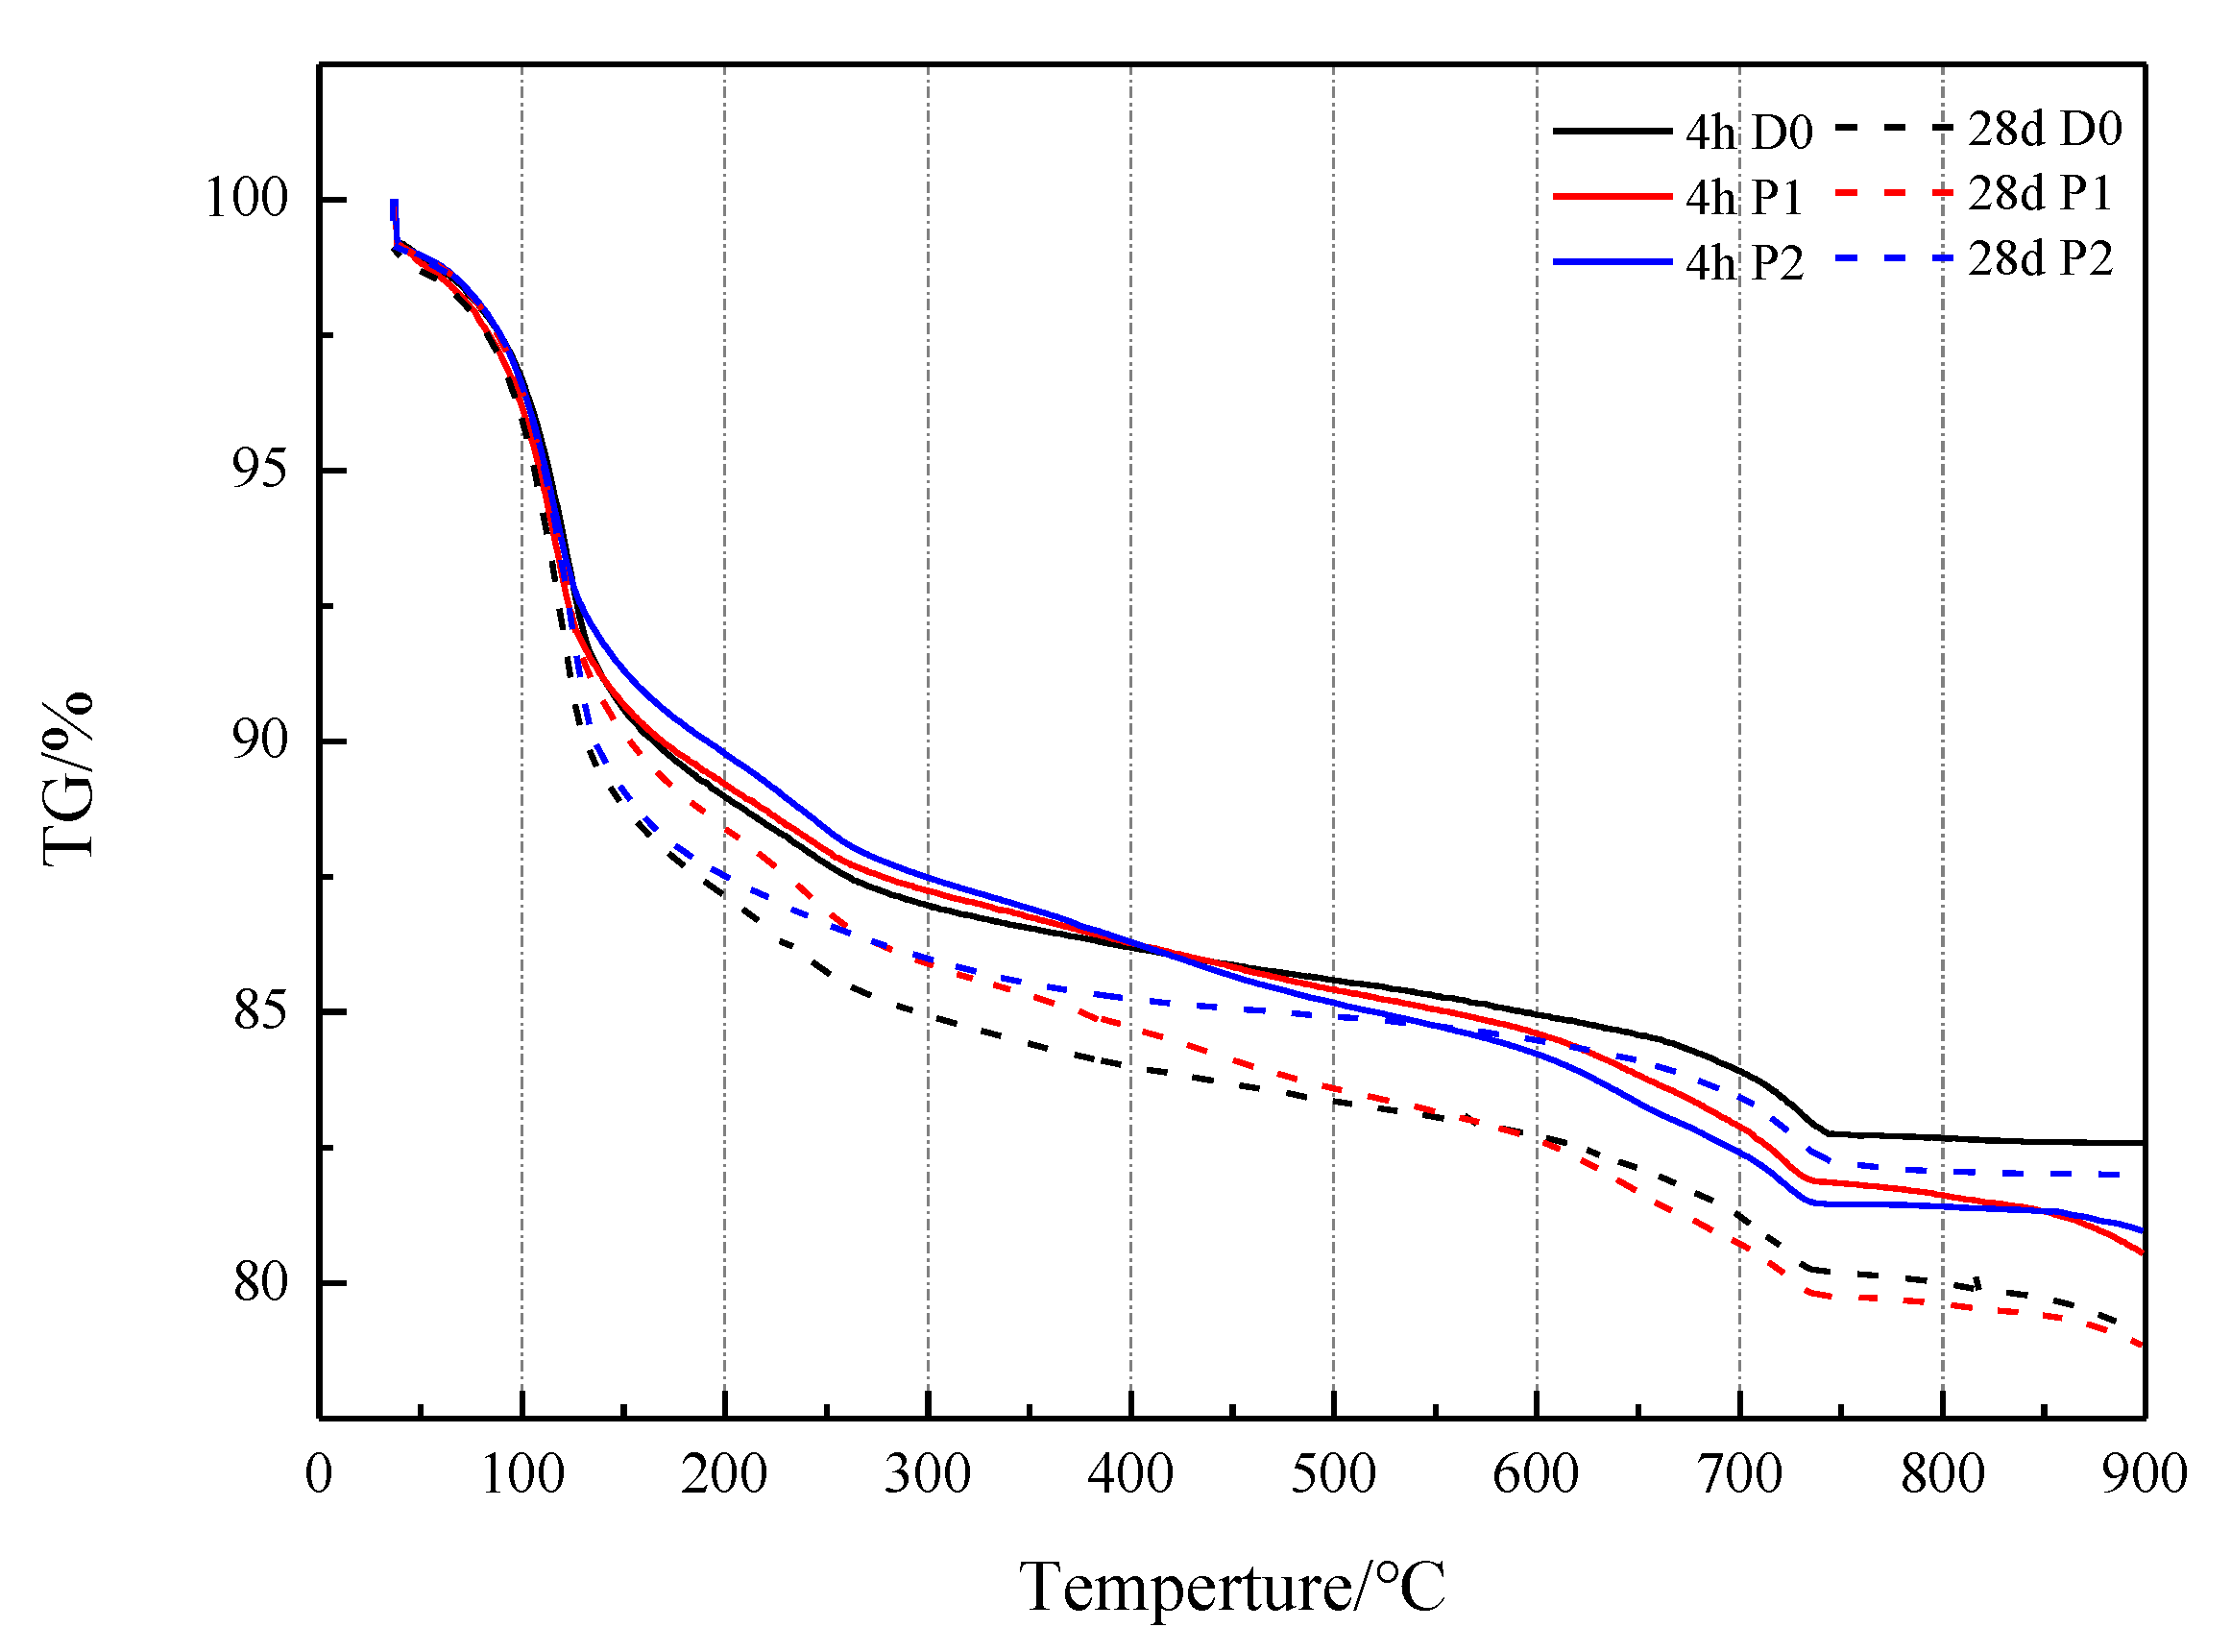
3.5. Hydrates Analysis
3.6. Discussion
4. Conclusions
Author Contributions
Funding
Institutional Review Board Statement
Informed Consent Statement
Data Availability Statement
Acknowledgments
Conflicts of Interest
References
- Marzouki, A.; Lecomte, A. Properties of Concrete Mixed with Portland-Limestone Cement of Different Grinding Qualities. J. Mater. Civ. Eng. 2016, 29, 1–9. [Google Scholar] [CrossRef]
- Jie, Q. Research on Mechanism of Action and Applied Technology of Super Early Strength Repairing Material. Master’s Thesis, Chang’an University, Chang’an, China, 2011. [Google Scholar]
- Qiao, F.; Chau, C.K.; Li, Z. Property evaluation of magnesium phosphate cement mortar as patch repair material. Constr. Build. Mater. 2010, 24, 695–700. [Google Scholar] [CrossRef]
- Lahalle, H.; Patapy, C.; Glid, M.; Renaudin, G.; Cyr, M. Microstructural evolution/durability of magnesium phosphate cement paste over time in neutral and basic environments. Cem. Concr. Res. 2019, 122, 42–58. [Google Scholar] [CrossRef]
- Yuan, G. Study on crack resistance of sulphoaluminate cement and ordinary Portland cement concrete. Concrete 2020, 372, 30–33. [Google Scholar] [CrossRef]
- Coumes, C.C.D.; Courtois, S.; Peysson, S.; Ambroise, J.; Pera, J. Calcium sulfoaluminate cement blended with OPC: A potential binder to encapsulate low-level radioactive slurries of complex chemistry. Cem. Concr. Res. 2009, 39, 740–747. [Google Scholar] [CrossRef]
- Juenger, M.; Winnefeld, F.; Provis, J.L.; Ideker, J.H. Advances in alternative cementitious binders. Cem. Concr. Res. 2011, 41, 1232–1243. [Google Scholar] [CrossRef]
- Jin, Y.; Suhua, M.; Weifeng, L.; Dashun, G.; Guofang, T.; Xiaodong, S. Influence of sulphoaluminate cement on the hydration and performance of Portland cement. Concrete 2016, 4, 86–90. [Google Scholar] [CrossRef]
- Le Saoût, G.; Lothenbach, B.; Hori, A.; Higuchi, T.; Winnefeld, F. Hydration of Portland cement with additions of calcium sulfoaluminates. Cem. Concr. Res. 2013, 43, 81–94. [Google Scholar] [CrossRef]
- Suping, C. Investigation on the Silicate-Sulphoaluminate Compound System Cement. Ph.D. Thesis, Beijing University of Technology, Beijing, China, 2005. [Google Scholar]
- Chunyan, F. Preparation and Properties of Portland Cement-Sulphoaluminate Cement-Gypsum Symstem Polymer Cement Waterproof Mortar. Master’s Thesis, South China University of Technology, Guangzhou, China, 2012. [Google Scholar]
- Baohong, L. The Research on the Materials Used to Repair the Concrete Driveway with Local Flaw. Master’s Thesis, Hunan University, Changsha, China, 2005. [Google Scholar]
- Yi, L. Study on Polymer Modified Cement-Based Material Used for the Rapid-Repair of the Cement Concrete Pavement. Master’s Thesis, Hunan University, Changsha, China, 2014. [Google Scholar]
- Ohama, Y. Polymer concrete. Dev. Formul. Reinf. Concr. 2008, 90, 256–269. [Google Scholar] [CrossRef]
- Wang, M.; Wang, R.; Yao, H.; Farhan, S.; Zheng, S.; Wang, Z.; Du, C.; Jiang, H. Research on the mechanism of polymer latex modified cement. Constr. Build. Mater. 2016, 111, 710–718. [Google Scholar] [CrossRef]
- Frigione, M. 16–Concrete with polymers. Eco-Effic. Concr. 2013, 1, 386–436. [Google Scholar] [CrossRef]
- Gemert, D.V.; Czarnecki, L.; Maultzsch, M.; Schorn, H.; Beeldens, A.; Ukowski, P.; Knapen, E. Cement concrete and concrete-polymer composites: Two merging worlds. A report from 11th ICPIC Congress in Berlin, 2004. Cem. Concr. Res. 2005, 27, 926–933. [Google Scholar] [CrossRef] [Green Version]
- Reches, Y. Nanoparticles as concrete additives: Review and perspectives—ScienceDirect. Constr. Build. Mater. 2018, 175, 483–495. [Google Scholar] [CrossRef]
- Ohama, Y. Recent progress in concrete-polymer composites. Adv. Cem. Based Mater. 1997, 5, 31–40. [Google Scholar] [CrossRef]
- Toufigh, V.; Hosseinali, M.; Shirkhorshidi, S.M. Experimental study and constitutive modeling of polymer concrete’s behavior in compression. Constr. Build. Mater. 2016, 112, 183–190. [Google Scholar] [CrossRef]
- Knapen, E.; Gemert, D.V. Polymer film formation in cement mortars modified with water-soluble polymers. Constr. Build. Mater. 2015, 58, 23–28. [Google Scholar] [CrossRef]
- Peng, L.; Jianping, Z.; Rong, N.; Huifeng, L. Investigation on the early stage hydration of Portland cement using environment scanning electron microscopy. J. Chin. Ceram. Soc. 2004, 32, 530–536. [Google Scholar] [CrossRef]
- Saija, L.M. Waterproofing of portland cement mortars with a specially designed polyacrylic latex. Cem. Concr. Res. 1995, 25, 503–509. [Google Scholar] [CrossRef]
- Ohama, Y.; Ramachandran, V.S. Handbook of Polymer-Modified Concrete and Mortars; Noyes Publications: Fukushima, Japan, 1995; pp. 154–196. [Google Scholar]
- Grosskurth, K.P.; Konietzko, A. Structure and mechanical behaviour of polymer modified cement concrete. Int. Congr. Polym. Concr. 1987, 5, 171–174. [Google Scholar]
- Rashid, K.; Ueda, T.; Zhang, D.; Miyaguchi, K.; Nakai, H. Experimental and analytical investigations on the behavior of interface between concrete and polymer cement mortar under hygrothermal conditions. Constr. Build. Mater. 2015, 94, 414–425. [Google Scholar] [CrossRef]
- Ribeiro, M.; Branco, A. Styrene-butadiene polymer action on compressive and tensile strengths of cement mortars. Mater. Struct. 2008, 41, 1263–1273. [Google Scholar] [CrossRef]
- Daou, Y.; Assaad, J. Behavior of structural polymer-modified concrete containing recycled aggregates. J. Adhes. Sci. Technol. Int. J. Basic Aspects Adhes. Sci. Its Appl. All Areas Technol. 2017, 31, 874–896. [Google Scholar] [CrossRef]
- Ru, W.; Wang, P.M.; Li, X.G. Physical and mechanical properties of styrene–butadiene rubber emulsion modified cement mortars. Cem. Concr. Res. 2005, 35, 900–906. [Google Scholar] [CrossRef]
- Wang, R.; Lackner, R.; Wang, P.M. Effect of Styrene–Butadiene Rubber Latex on Mechanical Properties of Cementitious Materials Highlighted by Means of Nanoindentation. Strain 2011, 47, 117–126. [Google Scholar] [CrossRef] [Green Version]
- Ru, W.; Peiming, W.; Yu, P. Comparison of Three Characterization Methods for Flexibility of SBR Latex-Modified Cement Mortar. J. Build. Mater. 2010, 390–394. [Google Scholar] [CrossRef]
- Jenni, A.; Zurbriggen, R.; Holzer, L.; Herwegh, M. Changes in microstructures and physical properties of polymer-modified mortars during wet storage. Cem. Concr. Res. 2006, 36, 79–90. [Google Scholar] [CrossRef]
- Ma, H.; Tiarr, Y.; Lr, Z. Interactions between Organic and Inorganic Phases in PA- and PU/PA-Modified-Cement-Based Materials. J. Mater. Civ. Eng. 2011, 23, 1412–1421. [Google Scholar] [CrossRef]
- Tian, Y.; Jin, X.Y.; Jin, N.G.; Zhao, R.; Li, Z.J.; Ma, H.Y. Research on the microstructure formation of polyacrylate latex modified mortars. Constr. Build. Mater. 2013, 47, 1381–1394. [Google Scholar] [CrossRef] [Green Version]
- Xu, L.; Wu, K.; Rößler, C.; Wang, P.; Ludwig, H.M. Influence of curing temperatures on the hydration of calcium aluminate cement/Portland cement/calcium sulfate blends. Cem. Concr. Compos. 2017, 80, 298–306. [Google Scholar] [CrossRef]
- Xu, L.; Wang, P.; Zhang, G. Formation of ettringite in Portland cement/calcium aluminate cement/calcium sulfate ternary system hydrates at lower temperatures. Constr. Build. Mater. 2012, 31, 347–352. [Google Scholar] [CrossRef]
- Zhang, J.; Li, G.; Ye, W.; Chang, Y.; Song, Z. Effects of ordinary Portland cement on the early properties and hydration of calcium sulfoaluminate cement. Constr. Build. Mater. 2018, 186, 1144–1153. [Google Scholar] [CrossRef]
- Qoku, E.; Bier, T.A.; Westphal, T. Phase assemblage in ettringite-forming cement pastes: A X-ray diffraction and thermal analysis characterization. J. Build. Eng. 2017, 12, 37–50. [Google Scholar] [CrossRef]
- Lei, W.; Mj, A.; Yw, A.; Yz, D.; St, E. Hydration, shrinkage, pore structure and fractal dimension of silica fume modified low heat Portland cement-based materials. Constr. Build. Mater. 2021, 272, 121–952. [Google Scholar] [CrossRef]
- Deboodt, T.; Fu, T.; Ideker, J.H. Evaluation of FLWA and SRAs on autogenous deformation and long-term drying shrinkage of high performance concrete. Constr. Build. Mater. 2016, 119, 53–60. [Google Scholar] [CrossRef]


| Code | CaO | Al2O3 | SO3 | SiO2 | Fe2O3 | MgO | Na2O | K2O | LOI | Total |
|---|---|---|---|---|---|---|---|---|---|---|
| SAC | 41.12 | 20.65 | 14.02 | 9.59 | 6.79 | 1.84 | 0.20 | 0.13 | 4.02 | 98.36 |
| PC | 64.06 | 5.07 | 1.88 | 19.92 | 2.87 | 1.22 | 0.35 | 0.23 | 4.4 | 100 |
| Code | SAC | PC | Anhydrite | Water | PVA |
|---|---|---|---|---|---|
| D0 | 65 | 30 | 5 | 230 | 0 |
| P0.5 | 65 | 30 | 5 | 230 | 0.5 |
| P1 | 65 | 30 | 5 | 230 | 1 |
| P1.5 | 65 | 30 | 5 | 230 | 1.5 |
| P2 | 65 | 30 | 5 | 230 | 2 |
| Age | Sample | Total AFt/% |
|---|---|---|
| 4 h | D0 | 17.02 |
| P1 | 16.15 | |
| P2 | 15.48 | |
| 28 d | D0 | 20.31 |
| P1 | 18.11 | |
| P2 | 20.57 |
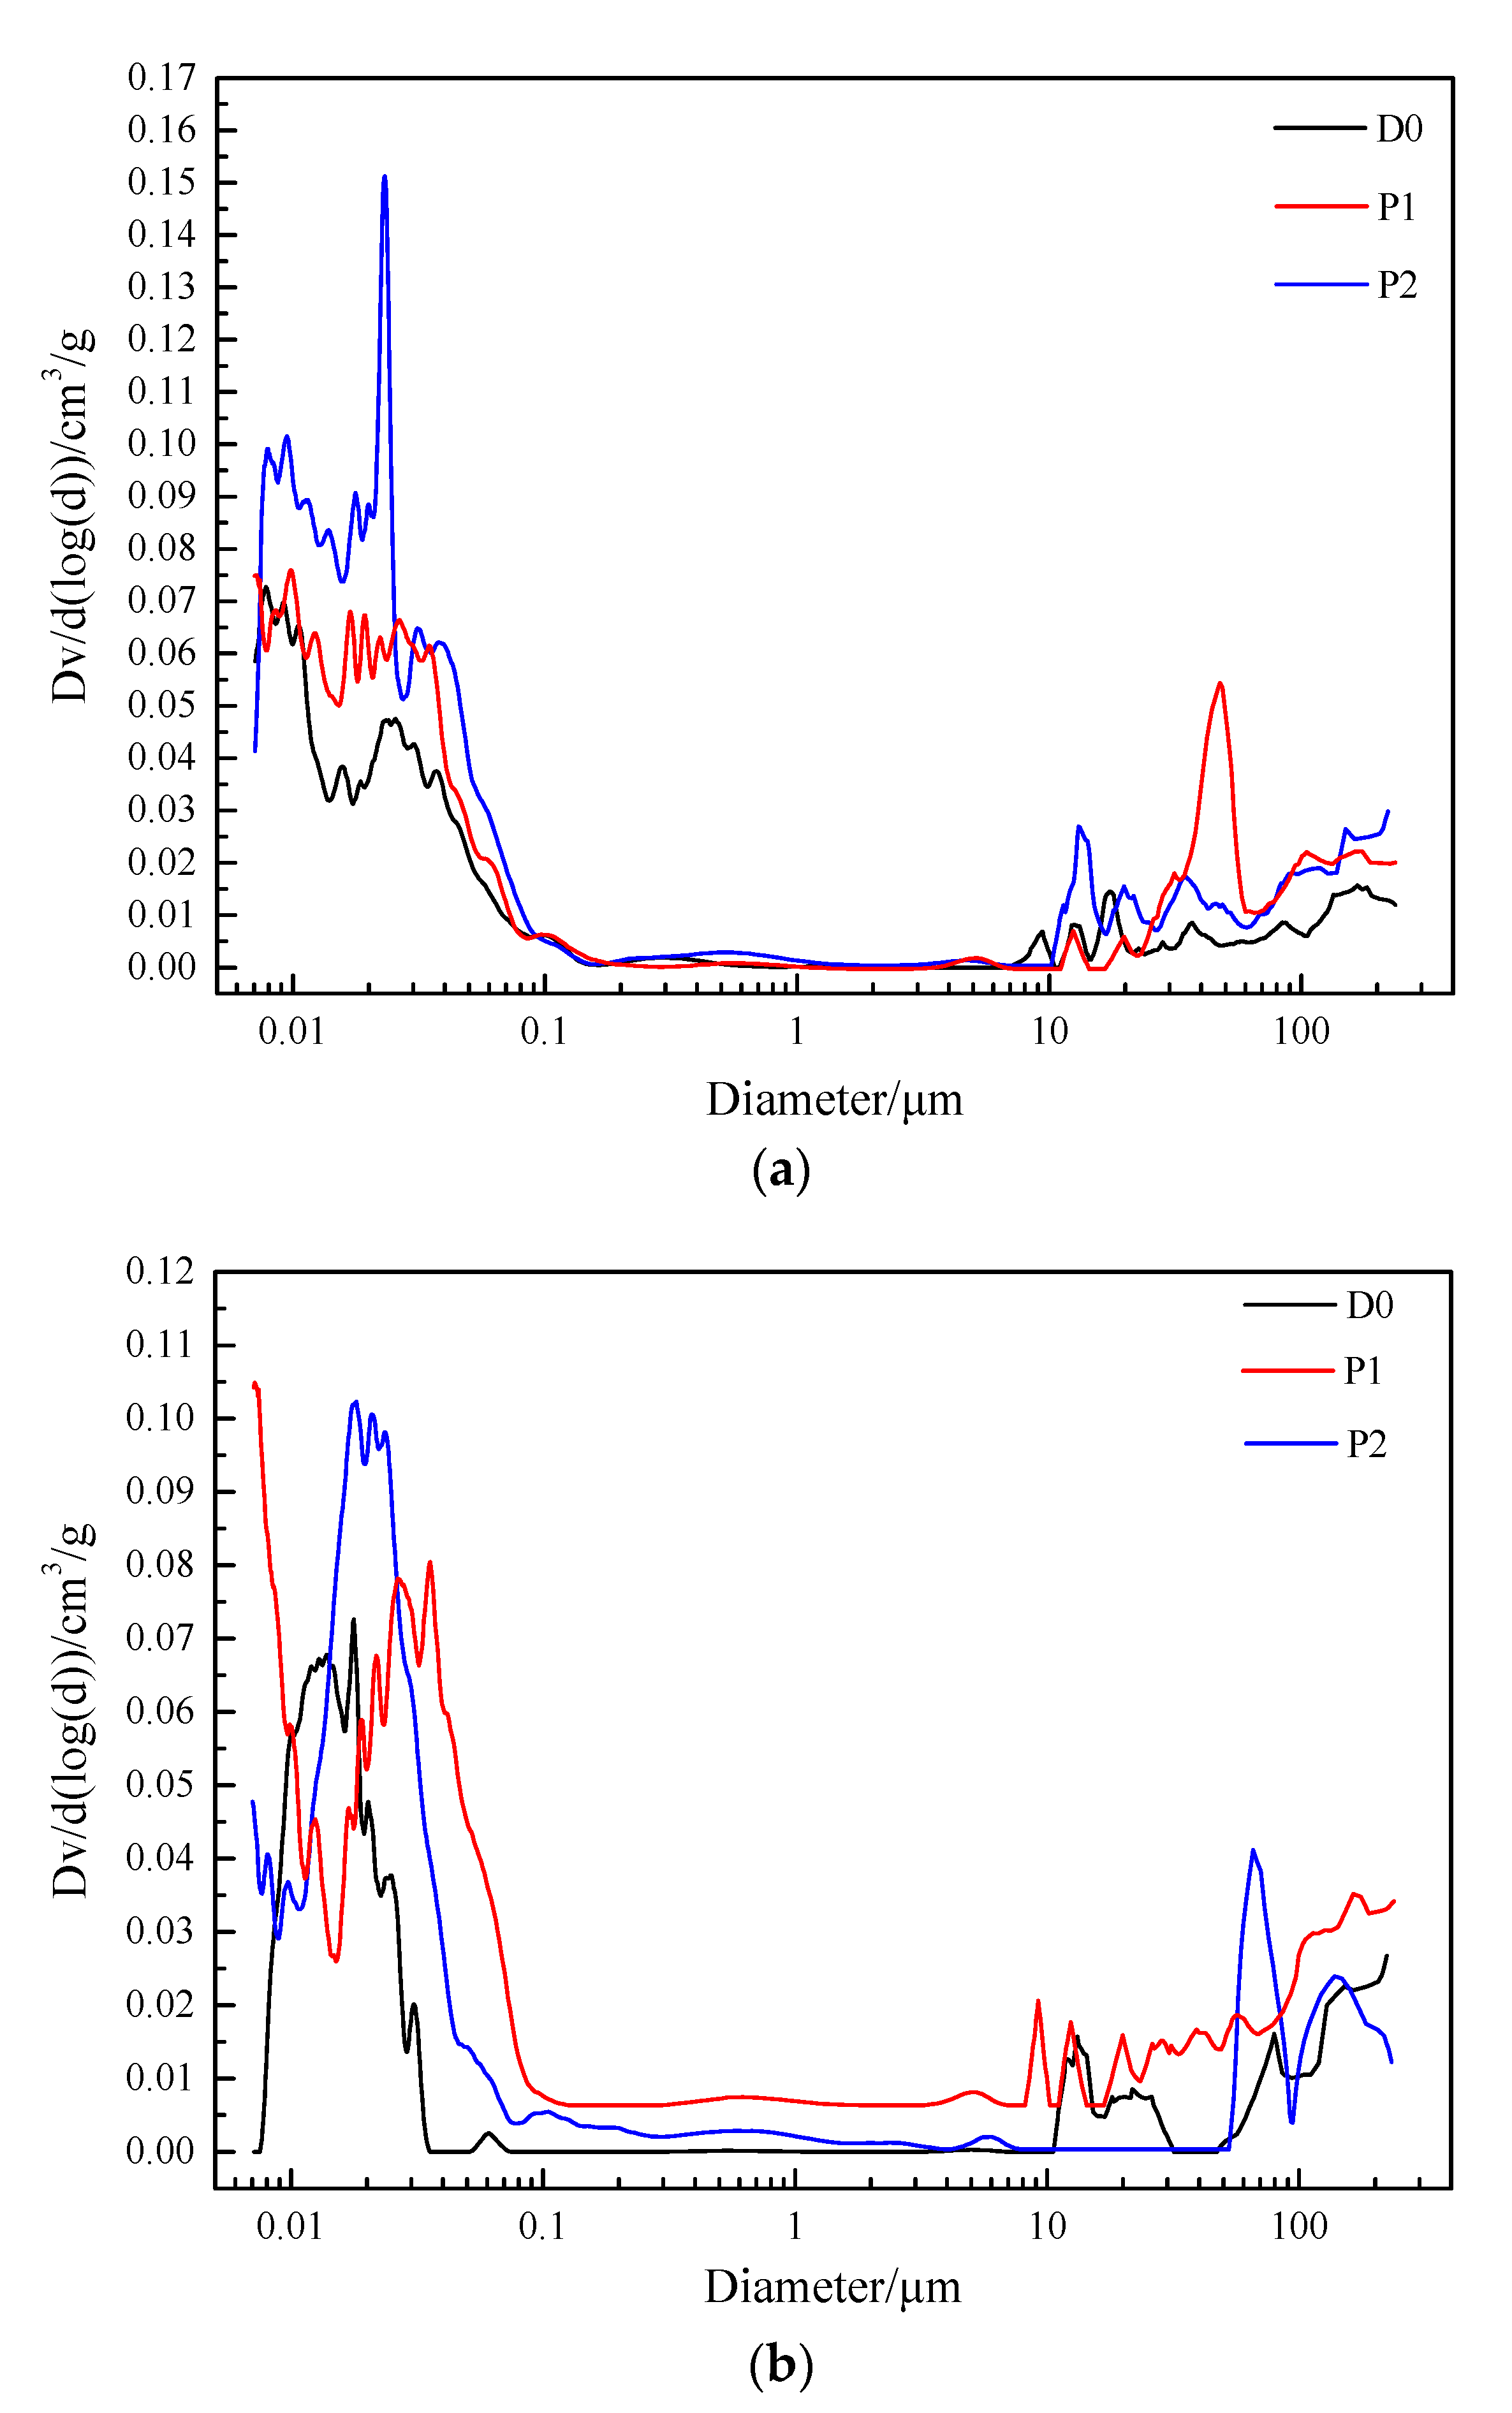
| Age | Sample | Total Porosity/% | Capillary Porosity/% | |||
|---|---|---|---|---|---|---|
| >100 μm | 50–100 μm | 10–50 μm | <10 μm | |||
| 4 h | D0 | 10.95 | 0.97 | 0.37 | 0.75 | 8.86 |
| P1 | 15.80 | 1.72 | 1.03 | 1.81 | 11.24 | |
| P2 | 18.55 | 1.53 | 0.61 | 1.66 | 14.75 | |
| 28 d | D0 | 9.02 | 1.35 | 0.45 | 0.77 | 6.45 |
| P1 | 13.19 | 1.92 | 0.62 | 1.36 | 9.29 | |
| P2 | 13.77 | 1.60 | 1.34 | 0 | 10.83 | |
Publisher’s Note: MDPI stays neutral with regard to jurisdictional claims in published maps and institutional affiliations. |
© 2021 by the authors. Licensee MDPI, Basel, Switzerland. This article is an open access article distributed under the terms and conditions of the Creative Commons Attribution (CC BY) license (https://creativecommons.org/licenses/by/4.0/).
Share and Cite
He, Y.; Mo, L.; Mao, Z.; Huang, F.; Han, Z. Influence of Polyvinyl Alcohol Powder on the Mechanical Performance and Volume Stability of Sulfoaluminate–Portland Cement Composite. Crystals 2021, 11, 692. https://doi.org/10.3390/cryst11060692
He Y, Mo L, Mao Z, Huang F, Han Z. Influence of Polyvinyl Alcohol Powder on the Mechanical Performance and Volume Stability of Sulfoaluminate–Portland Cement Composite. Crystals. 2021; 11(6):692. https://doi.org/10.3390/cryst11060692
Chicago/Turabian StyleHe, Yuhong, Liwu Mo, Zhongyang Mao, Fufan Huang, and Zhenghao Han. 2021. "Influence of Polyvinyl Alcohol Powder on the Mechanical Performance and Volume Stability of Sulfoaluminate–Portland Cement Composite" Crystals 11, no. 6: 692. https://doi.org/10.3390/cryst11060692