
La1–yBayF3–y Solid Solution Crystals as an Effective Solid Electrolyte: Growth and Properties


Abstract
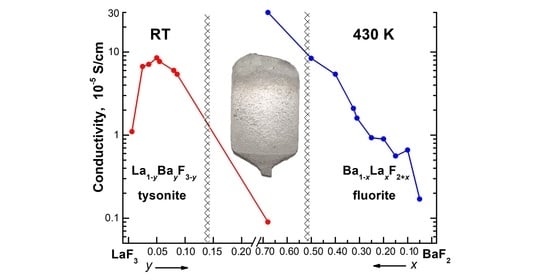
:
1. Introduction
2. Materials and Methods
2.1. The Peculiarities of the Growth Process
2.2. Density Measurement
2.3. Refractive Indices
2.4. X-ray Diffraction (XRD) Analysis
2.5. The Electrical Conductivity Measurements
3. Results and Discussion
3.1. Crystal Characterization
3.2. Ionic Conductivity of La1–yBayF3–y Crystals
4. Conclusions
Author Contributions
Funding
Data Availability Statement
Acknowledgments
Conflicts of Interest
References
- Sobolev, B.P.; Tkachenko, N.L. Phase diagrams of BaF2-(Y, Ln)F3 systems. J. Less-Common Met. 1982, 85, 155–170. [Google Scholar] [CrossRef]
- Sylianova, E.A.; Karimov, D.N.; Sobolev, B.P. Displacements in the cationic motif of nonstoichiometric fluorite phases Ba1−xRxF2+x as a result of the formation of {Ba8[R6F68–69]} clusters: III. Defect cluster structure of the nonstoichiometric phase Ba0.69La0.31F2.31 and its dependence on heat treatment. Crystals 2021, 11, 147. [Google Scholar] [CrossRef]
- Sobolev, B.P.; Sorokin, N.I.; Bolotina, N.B. Nonstoichiometric single crystals M1-xRxF2+x and R1-yMyF3-y (M–Ca, Sr, Ba; R—rare earth elements) as fluorine-conducting solid electrolytes. In Progress in Fluorine Science. Photonic & Electronic Properties of Fluoride, Materials; Tressaud, A., Poeppelmeier, K., Eds.; Elsevier: Amsterdam, The Netherlands, 2016; Chapter 21; Volume 1, pp. 465–491. [Google Scholar] [CrossRef]
- Wapenaar, K.E.D.; Van Koesveld, J.L.; Schoonman, J. Conductivity enhancement in fluorite-structured Ba1−xLaxF2+x solid solutions. Solid State Ion. 1981, 2, 145–154. [Google Scholar] [CrossRef]
- Roos, A.; Van de Pol, F.C.M.; Keim, R.; Schoonman, J. Ionic conductivity in tysonite-type solid solutions La1−xBaxF3−x. Solid State Ion. 1984, 13, 191–203. [Google Scholar] [CrossRef]
- Ivanov-Shits, A.K.; Sorokin, N.I.; Fedorov, P.P.; Sobolev, B.P. Specific features of ion transport in non-stoichiometric fluorite-type Ba1-xRxF2+x (R = La − Lu) phases. Solid State Ion. 1989, 31, 269–280. [Google Scholar] [CrossRef]
- Sorokin, N.I.; Breiter, M.W. Anionic conductivity and thermal stability of single crystals of solid solutions based on barium fluoride. Solid State Ion. 1997, 99, 241–250. [Google Scholar] [CrossRef]
- Roos, A.; Schoonman, J. Electronic conductivity in La1−xBaxF3−x crystals. Solid State Ion. 1984, 13, 205–211. [Google Scholar] [CrossRef]
- Reddy, S.N.S.; Rapp, R.A. Electronic conduction in the BaF2 solid electrolyte. J. Electrochem. Soc. 1979, 126, 2023–2025. [Google Scholar] [CrossRef]
- Krivandina, E.A. Preparation of single crystals of multicomponent fluoride materials with the fluorite type structure. Butll. Soc. Cat. Cien. 1991, 12, 393–412. Available online: https://www.raco.cat/index.php/ButlletiSCFQMT/article/view/21735 (accessed on 13 May 2021).
- Sobolev, B.P. The Rare Earth Trifluorides, Part 1; The High Temperature Chemistry of the Rare Earth Trifluorides, Institutd’Estudis Catalans: Barcelona, Spain, 2000; 520p, Available online: www.books.google.ru/books/rare earth trifluorides (accessed on 13 May 2021).
- Mohammad, I.; Witter, R.; Fichtner, M.; Reddy, M.A. Introducing interlayer electrolytes: Toward room-temperature high-potential solid-state rechargeable fluoride ion batteries. ASC Appl. Energy Mater. 2019, 2, 1553–1562. [Google Scholar] [CrossRef]
- Gschwind, F.; Rodriquez-Garcia, G.; Sandbeck, D.J.S.; Gross, A.; Weil, M.; Fichtner, M.; Hörmannet, N. Fluoride ion batteries: Theoretical performance, safety, toxicity, and a combinatorial screening of new electrodes. J. Fluor. Chem. 2016, 182, 76–90. [Google Scholar] [CrossRef]
- Liu, L.; Yang, L.; Liu, M.; Wang, X.; Li, X.; Shao, D.; Luo, K.; Luo, Z.; Chen, G. A flexible tysonite-type La0.95Ba0.05F2.95@PEO-based composite electrolyte for the application of advanced fluoride ion battery. J. Energy Storage 2019, 25, 100886. [Google Scholar] [CrossRef]
- Reddy, M.A.; Fichtner, M. Batteries based on fluoride shuttle. J. Mater. Chem. 2011, 21, 17059–17062. [Google Scholar] [CrossRef]
- Potanin, A.A. Solid-state chemical current source based on an ionic conductor such as lanthanum trifluoride. Russ. Chem. J. 2001, 45, 61–66. Available online: http://www.chem.msu.su/rus/jvho/2001-5-6/58.pdf (accessed on 13 May 2021).
- Krivandina, E.A.; Zhmurova, Z.I.; Sobolev, B.P.; Glushkova, T.M.; Kiselev, D.F.; Firsova, M.M.; Shtyrkova, A.P. Growth of R1−ySryF3−y crystals with rare earth elements of the cerium subgroup (R = La, Ce, Pr, or Nd; 0 ≤ y ≤ 0.16) and the dependence of their density and optical characteristics on composition. Crystallogr. Rep. 2006, 51, 895–901. [Google Scholar] [CrossRef]
- Roos, A. Crystal growth of solid solutions La1−xBaxF3−x. Mater. Res. Bull. 1983, 18, 405–409. [Google Scholar] [CrossRef]
- Vasyliev, V.; Molina, P.; Nakamura, M.; Víllora, E.G.; Shimamura, K. Magneto-optical properties of Tb0.81Ca0.19F2.81 and Tb0.76Sr0.24F2.76 single crystals. Opt. Mater. 2011, 33, 1710. [Google Scholar] [CrossRef]
- Ananyeva, G.V.; Baranova, E.N.; Zarzhitskaya, M.N.; Ivanova, I.A.; Koryakina, L.F.; Petrova, M.A.; Podkolzina, I.G.; Semenova, T.S.; Yagmurova, G.P. Growth and physicochemical study of single crystals of tysonite solid solutions (Y, Ln)1–xSrxF3–x. Izv. Akad. Nauk SSSR Ser. Neorg. Mater. 1980, 16, 68–72. (In Russian) [Google Scholar]
- Murin, I.V.; Glumov, O.V.; Amelin, Y.V. Ion transfer mechanism in LaF3. J. Appl. Chem. USSR 1980, 53, 1474–1478. [Google Scholar]
- Chable, J.; Dieudonné, B.; Body, M.; Legein, C.; Crosnier-Lopez, M.-P.; Galven, C.; Mauvy, F.; Durand, E.; Fourcade, S.; Sheptyakov, D.; et al. Fluoride solid electrolytes: Investigation of the tysonite-type solid solutions La1−xBaxF3−x (x <0.15). Dalton Trans. 2015, 44, 19625–19635. [Google Scholar] [CrossRef]
- Motohashi, K.; Nakamura, T.; Kimura, Y.; Uchimoto, Y.; Amezawa, K. Influence of microstructures on conductivity in tysonite-type fluoride ion conductors. Solid State Ion. 2019, 338, 113–120. [Google Scholar] [CrossRef]
- Bhatia, H.; Thieu, D.T.; Pohl, A.H.; Chakravadhanula, V.S.K.; Fawey, M.H.; Kübel, C.; Fichtner, M. Conductivity optimization of tysonite-type La1−xBaxF3−x solid electrolytes for advanced fluoride ion battery. ACS Appl. Mater. Interfaces 2017, 9, 23707–23715. [Google Scholar] [CrossRef] [PubMed]
- Rongeat, C.; Reddy, M.A.; Witter, R.; Fichtner, M. Solid electrolytes for fluoride ion batteries: Ionic conductivity in polycrystalline tysonite-type fluorides. ARS Appl. Mater. Interfaces 2014, 6, 2103–2110. [Google Scholar] [CrossRef]
- Duvel, A.; Bednarcik, J.; Sepelak, V.; Heitjans, P. Mechanosynthesis of the Fast fluoride ion conductor Ba1–xLaxF2+x: From the fluorite to the tysonite Structure. J. Phys. Chem. C 2014, 118, 7117–7129. [Google Scholar] [CrossRef] [Green Version]
- Breuer, S.; Gombotz, M.; Pregartner, V.; Hanzu, I.; Wilkening, M. Heterogeneous F anion transport, local dynamics and electrochemical stability of nanocrystalline La1−xBaxF3−x. Energy Storage Mater. 2019, 16, 481–490. [Google Scholar] [CrossRef]
- Chable, J.; Martin, A.G.; Bourdin, A.; Body, M.; Legein, C.; Jouanneaux, A.; Crosnier-Lopez, M.-P.; Galven, C.; Dieudonné, B.; Leblanc, M.; et al. Fluoride solid electrolytes: From microcrystalline to nanostructured tysonite-type La0.95Ba0.05F2.95. J. Alloys Compd. 2017, 692, 980–988. [Google Scholar] [CrossRef]
- Gombolz, M.; Pregartner, V.; Hanzu, I.; Wilkening, H.M.R. Fluoride-ion batteries: On the electrochemical stability of nanocrystalline La0.9Ba0.1F2.9 against metal electrodes. Nanomaterials 2019, 9, 1517. [Google Scholar] [CrossRef] [Green Version]
- Zhang, L.; Reddy, A.M.; Fichtner, M. Development of tysonite-type fluoride conducting thin film electrolytes for fluoride ion batteries. Solid State Ion. 2015, 272, 39–44. [Google Scholar] [CrossRef]
- Toma, O.; Rotella, H.; Dahab, H.; Maisonneuve, V.; Boulard, B. Tysonite-type solid state electrolyte for fluoride ion batteries: Highly dense thin film by PVD processing. J. Alloys Compd. 2021, 862, 158683. [Google Scholar] [CrossRef]
- Krivandina, E.A.; Zhmurova, Z.I.; Glushkova, T.M.; Firsova, M.M.; Shtyrkova, A.P.; Sobolev, B.P. Congruently melting compositions in the series of solid solutions R1–xSrxF3–x (R = La–Nd, 0 ≤ x ≤ 0.15) with tysonite structure (Refinement by directional crystallization). Crystallogr. Rep. 2003, 48, 878–882. [Google Scholar] [CrossRef]
- Krivandina, E.A.; Zhmurova, Z.I.; Berezhkova, G.V.; Sobolev, B.P.; Glushkova, T.M.; Kiselev, D.F.; Firsova, M.M.; Shtyrkova, A.P. Crystal growth, density, and mechanical properties of La1–xSrxF3-x solid solutions (0 <x <0.15) with the tysonite structure. Crystallogr. Rep. 1995, 40, 686–690. [Google Scholar]
- Buchinskaya, I.I.; Arkharova, N.A.; Ivanova, A.G.; Karimov, D.N. Growth of crystals of solid solutions with tysonite structure in the PbF2–RF3 systems (R = Pr, Nd). Crystallogr. Rep. 2020, 65, 147–151. [Google Scholar] [CrossRef]
- Sorokin, N.I.; Krivandina, E.A.; Zhmurova, Z.I. Dependences of the density of M1−xRxF2 + x and R1−yMyF3−y single crystals (M = Ca, Sr, Ba, Cd, Pb; R means rare earth elements) on composition. Crystallogr. Rep. 2013, 58, 948–952. [Google Scholar] [CrossRef]
- Ivanov-Shits, A.K.; Sorokin, N.I.; Fedorov, P.P.; Sobolev, B.P. Conductivity of Sr1–xLaxF2+x solid solutions. Soviet Phys. Solid State 1983, 25, 1007–1010. [Google Scholar]
- Chernaya, T.S.; Verin, I.A.; Khrykina, O.N.; Bolotina, N.B. Defect Structures of La1−ySryF3−y, La1−yBayF3−y, and Nd1−yCayF3−y (y = 0.05, 0.10) nonstoichiometric tysonite phases. Crystallogr. Rep. 2018, 63, 45–51. [Google Scholar] [CrossRef]
- Sorokin, N.I.; Sobolev, B.P.; Krivandina, E.A.; Zhmurova, Z.I. Optimization of single crystals of solid electrolytes with tysonite-type structure (LaF3) for conductivity at 293 K: 2. Nonstoichiometric phases R1−yMyF3−y(R = La-Lu, Y.; M = Sr, Ba). Crystallogr. Rep. 2015, 60, 123–129. [Google Scholar] [CrossRef]
- Sorokin, N.I.; Krivandina, E.A.; Zhmurova, Z.I.; Sobolev, B.P.; Fistul’, V.V. Superionic conductivity of the heterovalent solid solutions R1–xMxF3–x (R = REE, M = Ca, Ba) with tysonite-type structure. Phys. Solid State 1999, 41, 573–575. [Google Scholar] [CrossRef]
- Schoonman, J.; Oversluizen, G.; Wapenaar, K.E.D. Solid electrolyte properties of LaF3. Solid State Ion. 1980, 1, 211–221. [Google Scholar] [CrossRef]
- Sorokin, N.I.; Sobolev, B.P. The conductivity of single crystals La1-xSrxF3-x (0 ⩽ x ⩽ 0.15) with tysonite structure. Crystallogr. Rep. 1994, 39, 810–814. [Google Scholar]
- Geiger, H.; Schon, G.; Strok, H. Ionic conductivity of single crystals of the non-stoichiometric tysonite phase La(1−x)SrxF(3−x) (0 ⩽ x ⩽ 0.14). Solid State Ion. 1985, 15, 155–158. [Google Scholar] [CrossRef]
- Takahashi, T.; Iwahara, H.; Ishikawa, T. Ionic conductivity of doped cerium trifluoride. J. Electrochem. Soc. 1977, 124, 280–284. [Google Scholar] [CrossRef]
- Murin, I.V.; Glumov, O.V.; Sobolev, B.P. Electrical conductivity of solid electrolytes based on CeF3. Vestnik LGU 1980, 10, 84–88. (In Russian) [Google Scholar]
- Sorokin, N.I.; Fominykh, M.V.; Krivandina, E.A.; Zhmurova, Z.I.; Sobolev, B.P. Ion transport in R1-xSrxF3-x (R = La–Yb, Y) solid solutions with a LaF3 (tysonite) structure. Crystallogr. Rep. 1996, 41, 292–301. [Google Scholar]
- Sorokin, N.I.; Karimov, D.N.; Buchinskaya, I.I. Conductivity of R1–yPbyF3–y (R = Pr, Nd) solid electrolytes with tysonite structure. Russ. J. Electrochem. 2021, 57, 1–8. (In Russian) [Google Scholar] [CrossRef]
- Murin, I.V.; Glumov, O.V.; Glumov, A.V. Ion and electron transfer processes in solid electrolytes based on NdF3. In Proceedings of the 7th All-Union Symposium on the Chemistry of Inorganic Fluorides, Nauka, Moscow, 9–12 October 1984; p. 232. (In Russian). [Google Scholar]
- Sobolev, B.P.; Sorokin, N.I.; Krivandina, E.A.; Zhmurova, Z.I. 293-K-conductivity optimization for single crystals of solid electrolytes with tysonite structure (LaF3): I. Nonstoichiometric phases R1-yCayF3-y (R = La-Lu, Y). Crystallogr. Rep. 2014, 59, 550–562. [Google Scholar] [CrossRef]
- Karimov, D.N.; Sorokin, N.I.; Sobolev, B.P.; Sokolov, V.I. Growth of Nd1-yEuy2+F3-y single crystals with tysonite-type (LaF3) structure and investigation of the concentration dependence of some their properties. Crystallogr. Rep. 2019, 64, 354–359. [Google Scholar] [CrossRef]


| y | a, Å | c, Å | ΔT, K | A, SK/cm | ΔHσ, eV |
|---|---|---|---|---|---|
| 0.006 (1) | 7.1882 (1) | 7.3545 (1) | 294–437 437–615 | 7.8 × 10³ 3.5 × 10² | 0.373 0.256 |
| 0.025 (1) | 7.1947 (1) | 7.3611 (1) | 295–419 419–534 | 1.9 × 10⁴ 1.6 × 10³ | 0.347 0.258 |
| 0.036 (2) | 7.1985 (2) | 7.3647 (1) | 295–505 505–800 | 1.5 × 10⁴ 6.1 × 10² | 0.345 0.208 |
| 0.050 (2) | 7.2010 (1) | 7.3682 (2) | 295–557 557–754 | 1.1 × 10⁴ 1.6 × 10³ | 0.332 0.241 |
| 0.055 (1) | 7.2052 (1) | 7.3716 (1) | 294–427 427–623 | 5.5 × 10⁴ 3.0 × 10³ | 0.371 0.265 |
| 0.080 (1) | 7.2132 (1) | 7.3802 (1) | 295–419 419–531 | 9.0 × 10⁴ 6.3 × 10³ | 0.389 0.294 |
| 0.086 (2) | 7.2142 (2) | 7.3806 (1) | 294–436 436–614 | 1.2 × 10⁵ 2.7 × 10³ | 0.397 0.257 |
| Composition | Material Type * | ymax | σμαξ, Σ/Aμ | Reference |
|---|---|---|---|---|
| La1–yBayF3–y | S | 0.05 ± 0.01 | 8.5 × 10⁻⁵ | This work |
| −«− | 0.05 | 8 × 10⁻⁵ | [39] | |
| −«− | 0.07–0.09 | 8 × 10⁻⁵ | [5] | |
| P | 0.04 | 3 × 10⁻⁵ | [21] | |
| −«− | 0.05 | 2 × 10⁻⁵ | [24] | |
| −«− | 0.05 | 4 × 10⁻⁵ | [40] | |
| −«− | 0.06 | 6 × 10⁻⁵ | [16] | |
| −«− | 0.05−0.07 | 6 × 10⁻⁵ | [22] | |
| La1–ySryF3–y | S | 0.05 | 2 × 10⁻⁴ | [41] |
| −«− | 0.03 | 3 × 10⁻⁴ | [42] | |
| P | 0.05 | 5 × 10⁻⁵ | [21] | |
| La1–yCayF3–y | P | 0.06 | 8 × 10⁻⁶ | [21] |
| Ce1–yBayF3–y | P | 0.05 | 1 × 10⁻⁴ | [43] |
| −«− | 0.04–0.06 | − | [44] | |
| Ce1–ySryF3–y | S | 0.03 | 5 × 10⁻⁴ | [45] |
| P | 0.04 | 1 × 10⁻⁴ | [44] | |
| −«− | 0.07 | 3 × 10⁻⁵ | [43] | |
| −«− | 0.06 | 8 × 10⁻⁵ | [16] | |
| Ce1–yCayF3–y | P | 0.05 | 2 × 10⁻⁴ | [43] |
| −«− | 0.04–0.06 | – | [44] | |
| Pr1–ySryF3–y | S | 0.03 | 5 × 10⁻⁴ | [45] |
| Pr1–yPbyF3–y | S | 0.04 | 7 × 10⁻⁵ | [46] |
| Nd1–yBayF3–y | P | 0.04–0.05 | − | [47] |
| Nd1–ySryF3–y | S | 0.03 | 3 × 10⁻⁴ | [45] |
| P | 0.04–0.05 | − | [47] | |
| Nd1–yCayF3–y | S | 0.05 | 1.5 × 10⁻⁴ | [48] |
| P | 0.04–0.05 | − | [47] | |
| Nd1–yEuyF3–y | S | 0.03 | 2 × 10⁻⁴ | [49] |
| Nd1–yPbyF3–y | S | 0.05 | 3 × 10⁻⁵ | [46] |
Publisher’s Note: MDPI stays neutral with regard to jurisdictional claims in published maps and institutional affiliations. |
© 2021 by the authors. Licensee MDPI, Basel, Switzerland. This article is an open access article distributed under the terms and conditions of the Creative Commons Attribution (CC BY) license (https://creativecommons.org/licenses/by/4.0/).
Share and Cite
Buchinskaya, I.I.; Karimov, D.N.; Sorokin, N.I. La1–yBayF3–y Solid Solution Crystals as an Effective Solid Electrolyte: Growth and Properties. Crystals 2021, 11, 629. https://doi.org/10.3390/cryst11060629
Buchinskaya II, Karimov DN, Sorokin NI. La1–yBayF3–y Solid Solution Crystals as an Effective Solid Electrolyte: Growth and Properties. Crystals. 2021; 11(6):629. https://doi.org/10.3390/cryst11060629
Chicago/Turabian StyleBuchinskaya, Irina I., Denis N. Karimov, and Nikolay I. Sorokin. 2021. "La1–yBayF3–y Solid Solution Crystals as an Effective Solid Electrolyte: Growth and Properties" Crystals 11, no. 6: 629. https://doi.org/10.3390/cryst11060629