Article

Bridgman Growth and Physical Properties Anisotropy of CeF3 Single Crystals

1
Shubnikov Institute of Crystallography of Federal Scientific Research Center Crystallography and Photonics, Russian Academy of Sciences, Leninsky Prospekt 59, 119333 Moscow, Russia
2
Ishlinsky Institute for Problems in Mechanics, Russian Academy of Sciences, Prospekt Vernadskogo 101-1, 119526 Moscow, Russia
3
Department of Physics and Mathematics, Petrovsky Bryansk State University, Bezhitskaya Str. 14, 241036 Bryansk, Russia
*
Author to whom correspondence should be addressed.
Crystals 2021, 11(7), 793; https://doi.org/10.3390/cryst11070793
Submission received: 9 June 2021 / Revised: 30 June 2021 / Accepted: 4 July 2021 / Published: 7 July 2021
(This article belongs to the Special Issue Functional Materials Based on Rare-Earth Elements)

Abstract

:
Bulk c-oriented CeF3 single crystals (sp. gr. P 3 ¯ c 1 ) were grown successfully by the vertical Bridgman technique in a fluorinating atmosphere. A description of the crystal growth procedure and the solution of the difficulties during the growth process are presented in detail. The anisotropy of the mechanical, thermal and electrophysical properties were studied for the first time. The maximum values of the thermal conductivity coefficient (α = 2.51 ± 0.12 W·m−1·K−1) and the ionic conductivity (σdc = 2.7 × 10⁻⁶ S/cm) at room temperature are observed in the [0001] direction for the CeF3 crystals. The Vickers (HV) and Berkovich (HB) microhardnesses for the ( 0001 ) , ( 10 1 ¯ 0 ) and ( 11 2 ¯ 0 ) crystallographic planes were investigated. The HB values were higher than the HV ones and decreased from 3.8 to 2.9 GPa with an increase in the load in the range of 0.5–0.98 N for the hardest ( 0001 ) plane. The { 11 2 ¯ 0 } , { 10 1 ¯ 0 } and { 0001 } cleavage planes were observed during the indentation process of the CeF3 crystals. The variability of Young’s, the shear modules and Poisson’s ratio were analyzed. A significant correlation between the shapes of the Vickers indentation patterns with Young’s modulus anisotropy was found. The relationship between the anisotropy of the studied properties and the features of the CeF3 trigonal crystal structure is discussed.

Graphical Abstract

1. Introduction

Among bulk single crystals of the rare-earth trifluorides [1], cerium fluoride attracts special attention due to a wide range of promising applications. The undoped and rare-earth doped CeF3 single crystals (and solid solutions based on it) are a multifunctional material for various fields of science and technology.
These crystals can be used as optical materials in a wide (from VUV- to mid-IR) spectral range [2,3,4,5]: rare-earth (Dy3+, Er3+, Nd3+ ions, etc.)-doped laser host materials, efficiently emitting in the visible and IR ranges [6,7,8,9,10,11], and solid electrolyte basic components for fluoride ion batteries [12,13,14,15,16]. The possibility of using a CeF3 crystal as a density fast scintillator has caused a boom in research on its luminescence characteristics [17,18,19,20]. It showed promising scintillation characteristics, such as nanosecond scale decay time and high radiation hardness. However, performance improvement studies of these crystals are ongoing for high-energy physics applications [21,22].
In recent years, a huge potential for the utilization of CeF3 crystals as one of the promising magneto-optical materials for the development of high-power Faraday optical isolators for a broad variety of laser wavelengths was demonstrated [23,24,25,26,27].
The preparation of the bulk fluoride crystals is complicated by the high reactivity of rare-earth fluorides and their general tendency toward pyrohydrolysis, especially in the case of cerium fluoride [28]. This problem is successfully solved by using an appropriate fluorinating atmosphere [29,30].
Currently, large-size optical-quality CeF3 crystals (and solid solutions based on it) are grown from the melt by directional crystallization methods (by the Bridgman–Stockbarger technique [6,7,8,9,10,11,24,26,27] or Czochralski method [19,23]) and available on a commercial basis. The CeF3 crystal fibers can be successfully produced by the micro-pulling-down technique [20]. The Bridgman technique is a basic method of fluoride crystal growth [28,30]. This method is technologically simple and, thus, more economic and used for commercial industrial applications.
CeF3 single crystals belong to the group of rare-earth trifluorides with a tysonite-type structure and do not have any polymorphic destructive transformations up to melting. The crystal structure of CeF3 and other isostructural rare-earth fluorides have been studied many times [31,32,33,34,35]. The tysonite structure type is dimorphic and has a low-temperature trigonal (sp. gr. P 3 ¯ c 1 ) with a hexamolecular unit cell and high-temperature hexagonal (sp. gr. P63/mmc, Z = 2) modifications. However, their structures differ insignificantly, and they are not always determined in studies and may even coexist in one single crystal [31]. The transition between such structure modifications, which occur gradually and can be attributed to the diffuse transformation type, affects only the anion fluorine crystal sublattice.
Despite the nearly 60-year history of studying cerium fluoride crystals, many of its properties have remained unexplored. This problem is compounded by the fact that the relatively low (trigonal) symmetry of CeF3 single crystals leads to the anisotropy of their fundamental physical properties in contrast to the well-studied and widely used isotropic crystals based on cubic alkaline earth fluorides. Data on physical properties are necessary for the purposeful manufacture of passive and active optical crystalline elements and their further successful practical application in photonics, solid-state ionics, magneto-optics, radiation and thermal physics. In addition, the thermal characteristics of crystals are fundamental for analyzing their performance potential. The study of the temperature dependences of the crystal properties is extremely necessary, because most practical applications assume a thermomechanical impact, and a priori estimates of these changes are not always reliable.
Until now, the anisotropy of the properties of CeF3 single crystals, with the exception of the optical [36], elastic [37,38] and magnetic [39] characteristics, has not been given sufficient attention. Therefore, to fill this existing gap in our scientific knowledge, a comprehensive study of the anisotropy of the mechanical, electro- and thermophysical characteristics of CeF3 single crystals grown by the Bridgman technique is the goal of this work.

2. Materials and Methods

2.1. Crystal Growth Prosess and Samples Preparation

The CeF3 single crystals were grown by the Bridgman technique in a resistive double-zone growth chamber with a graphite heating unit in a multi-cell crucible (manufacturing at the FSRC “Crystallography and Photonics” RAS, Moscow, Russia). The anhydrous CeF3 (99.99%; Lanhit Ltd., Moscow, Russia) powder was used as the initial reagent. CeF3 among rare-earth trifluorides is one of the most prone to pyrohydrolysis [21,28,40]. Therefore, the powder was preliminarily annealed in vacuum (~10−2 Pa) for 3–5 h at 450 K and melted in a fluorinating atmosphere for deep purification from oxygen-containing impurities. The CeF3 melting point is Tm = 1716 ± 10 K [32]. The level of preliminary evacuation was 5 × 10⁻³ Pa. A high-purity He + CF4 mixture was used to create a fluorinating growth atmosphere. The commonly used scavengers, such as PbF2, were not added to the charge because of the strengthening effect of their residual amounts on the crystal mechanical characteristics [41] and their potential poorly controlled influence on the other physical properties, depending on the impurity composition.
The temperature gradient in the growth zone was 95–100 K/cm, and the crucible pulling rate was ~3 mm/h. After growth, the crystals were cooled down to room temperature (RT) at a rate of 100 K/h. The c-axes oriented ([0001] direction) seeds were utilized for CeF3 crystal growth. In the case of the spontaneous seeding of these crystals, it was noted that the optical c-axis was located at an acute angle to the growth axis of the crystalline cylindrical boules. The (0001) plane had a characteristic metallic luster. The losses of the substance due to evaporation during the crystallization process were 2 wt. %. The c-oriented CeF3 single crystals of optical quality with a diameter of 30 mm and a length of up to 60 mm were successfully grown under the above process parameters. An analysis of the grown crystals for their oxygen contents was carried out with vacuum induction fusion in graphite capsules (The ONH836 Analyzer, LECO Corp., St. Joseph, MI, USA).
The single-crystal orientation was determined by the back-reflection Laue method. Crystal samples with a thickness of about 2 mm were cut and polished along the main crystallographic (0001), ( 10   1 ¯ 0 ) and ( 11 2 ¯ 0 ) planes (orientation accuracy up to 1°). The CeF3 crystal structure was described within the hexagonal coordinate system in this article (Figure 1).

2.2. X-ray Diffraction (XRD) Analysis

XRD patterns of the CeF3 crystal samples were carried out on an X-ray powder diffractometer MiniFlex 600 (Rigaku, Japan) with CuKα radiation. The diffraction peaks were recorded within the angle range 2θ from 10° to 140°. Phases were identified using the ICDD PDF-2 (2014). The unit cell parameters were calculated by the Le Bail full-profile fitting (Jana2006 software).

2.3. Microhardness of Crystal

The microhardness was measured with a PMT-3 hardness tester (Russia) at RT under applied loads P in the range of 50–100 gf (1 gf = 9.807 × 10⁻³ N) using both square-based Vickers and triangular Berkovich pyramid diamond indenters.
The Vickers microhardness value HV was calculated by the formula:
HV [MPa] = 0.189 × P/d2,
where P [H] is the applied indenter load, and d [μm] is the diagonal length of the indentation imprint.
The Berkovich microhardness value HB was calculated using the following equation:
HB [MPa] = 0.2133 × P/L2,
where L (μm) is the indentation side length.
The time for the initial load application is 10–15 s, and the test force is maintained for 5 s. The measurement errors for the microhardness did not exceed 10% and 5% for the HV and HB values, respectively. The indentation patterns for the different planes were studied by optical microscopy methods.

2.4. The Thermal Conductivity

The thermal conductivity k(T) of undoped CeF3 crystals was measured by an absolute stationary technique of longitudinal thermal flux in the temperature range 50–300 K. A description of the equipment and measurement techniques are given in reference [42]. The samples were parallelepipeds with dimensions of 8 × 6 × 23 mm3 and 6 × 6 × 22 mm3 for samples with c- and a-orientations (relative to the long axis), respectively. Thermal conductivity coefficient values were calculated by the Fourier equation within a ± 5% error interval.

2.5. The Electric Conductivity

The CeF3 single crystals conductivity was measured by means of impedance spectroscopy (in dry Ar atmosphere) in the temperature range of 300–600 K and the frequency range of 1–1.4 × 10⁷ Hz (a Novoterm-1200 installation was employed with an impedance analyser Alpha-AN, Novocontrol, Germany). The impedance Z*(ω) frequency dependencies were measured with step heating under conditions of temperature stabilization. Pt paint were used as current-conducting electrodes. Static total bulk conductivity σdc was calculated from the impedance hodographs using the equivalent electrical circuit method by ZView software (Scribner Associates, Inc.). The relative error in σdc did not exceed 0.5%.

3. Results and Discussion

3.1. Crystal Growth and Characterization

The as-grown c-oriented CeF3 crystals were colorless and transparent, and no light-scattering inclusions were observed in the bulk of the crystals (Figure 2a). A milky foreign substance was detected at the top of the crystals. The reason for its appearance was associated with the low isomorphic capacity of the structure of these crystals in relation to the residual amount of oxygen-containing impurities, which were pushed into the melt during the growth process and accumulated in the upper parts of the boules. Note that a similar effect may be due to the presence of monovalent cation (such as Li+ and Na+) traces. The oxygen contents in the bottom and center parts of the grown CeF3 crystals measured by the vacuum melting technique were at the level of 30–35 ppm. The concentration of oxygen-containing impurities increased strongly up to 200 ppm in the top milky crystal parts. Thus, the effective segregation of oxygen impurities was observed in the process of direction crystallization of the CeF3 melt.
The assignment of crystals to the tysonite-type structure ( P 3 ¯ c 1 space group) was confirmed by XRD analysis (Figure 2b). The CeF3 crystals were single-phase with lattice parameters coinciding with the crystallochemical data [43]. The crystal density ρ = 6.080(6) g/cm3 (measured by hydrostatic weighing in distilled water) was insignificantly lower than the theoretical density value. The ordinary refractive index no = 1.6179(2), measured by the refractometric method for the wavelength λ = 0.589 μm at RT, was close to the data published in reference [4].
Absorption spectra, especially in the short wavelength range, reflect the optical quality of crystals in general. The absorption spectrum of the as-grown CeF3 single crystals is shown in Figure 3. Excellent optical characteristics, close to the theoretical value [19], indicate the “oxygen-free” nature of the grown CeF3 crystals. The optical transparency limit, determined by the onset of interconfigurational 4f–5d transitions in the Ce3+ ion, was about 0.285 μm for samples with a thickness of about 10 mm. No additional absorption bands associated with oxygen-containing or other impurities were detected. These crystals exhibited a characteristic transparency window from the UV spectral edge to 3.0 μm. The long-wavelength edge of this region was assigned to the electric dipole intraconfigurational 4f (2F5/22F7/2) transition in the Ce3+ ion [5,20]. The IR cut-off edge, determined by the phonon lattice vibrations, was located at about 12 μm [2,4,5].

3.2. Elastic Properties of the CeF3 Crystals

Below, the elastic characteristics of the CeF3 crystal will be analyzed, which will allow to relate the degree of anisotropy of the elastic characteristics to the shape of the indentation. The engineering elastic coefficients (Young’s modulus E, Poisson’s ratio ν and shear modulus G) depend on the orientation of the deformed crystal. In the case of the hexagonal crystal family, the expressions for Young’s modulus E, Poisson’s ratio ν and the shear modulus G have the forms [44]:
1 s 11 E = 1 + Π 1 Π 01 sin 2 θ cos 2 θ ,
ν s 13 E = 1 + Π 2 sin 2 ψ + Π 02 cos 2 θ cos 2 ψ sin 2 θ ,
1 s 44 G = 1 + Π 3 sin 2 ψ + 4 Π 03 cos 2 θ cos 2 ψ sin 2 θ ,
Π 01 δ s 11 ,      Π 02 δ s 13 ,      Π 03 δ s 44 ,
Π 1 s 33 s 11 s 11 ,      Π 2 s 12 s 13 s 13 ,      Π 3 2 s 11 2 s 12 s 44 s 44 ; δ s 11 + s 33 2 s 13 s 44 .
where s ij are matrix compliance coefficients. Dimensionless parameters Π 1 , Π 2 , Π 3 , Π 01 , Π 02 , Π 03 and dimensional coefficient δ are the characteristics of the degree of crystal anisotropy.
The elastic properties of the selected rare-earth trifluorides crystals with tysonite-type structures (namely, LaF3, CeF3, PrF3 and NdF3) described in hexagonal symmetry were investigated in references [37,38]. It is noted that the elastic constants of these crystals increase with an increase in the atomic number of the rare-earth element. The CeF3 crystals are described by five independent compliance coefficients: s 11 = 7.64, s 33 = 5.14, s 44 = 29.20, s 12 = −3.30 and s 13 = −1.22 TPa−1 [38] and an additional condition, s 66 = 2 ( s 11   s 12 ) .
Young’s modulus of the CeF3 crystals depends only on one Euler angle θ , which is measured from the main crystallographic third-order axis ([0001] direction) in the ( 10 1 ¯ 0 ) plane. These crystals can have three stationary values of the Young’s modulus:
E 1 = E [ 0001 ] = 1 s 33   and   E 2 = E [ 01 1 ¯ 0 ] = E [ 1 ¯ 2 1 ¯ 0 ] = 1 s 11 ,
which correspond to the stretching in the directions [0001] and 01 1 ¯ 0 , respectively, and [45].
E 3 = 4 Π 01 4 Π 01 Π 1 Π 01 2 1 s 11
The third value can be achieved under an additional condition:
0 cos 2 θ 3 = Π 01 Π 1 2 Π 01 1
A numerical analysis of Young’s modulus variability shows that E 1 = E [ 0001 ] = 195 and E 2 = E [ 01 1 ¯ 0 ] = 131 GPa. The third stationary value takes E 3 = 100 GPa at θ 3 = 50.2 ° . For CeF3 crystal, Young’s modules E 1 = E [ 0001 ] and E 3 are the global maximum and minimum, respectively, and E 2 = E [ 01 1 ¯ 0 ] is the local maximum.
The orientational dependences of Young’s modulus in the planes (0001) and ( 10 1 ¯ 0 ) for the CeF3 crystal are shown in Figure 4. In the plane (0001), Young’s modulus takes a constant value of E 2 = 131 GPa, since this plane is an isotropic one (Figure 4a).
A significant anisotropy of Young’s modulus E max / E min = E 1 / E 3 with an anisotropy coefficient close to 2 was observed for the CeF3 crystals (Figure 4b).
Poisson’s ratio ν ( θ , ψ ) depends on the two Euler angles. In this case, a sequence of two rotations of the crystallographic coordinate system was used, which can be written as a matrix product:
1 0 0 0 cos θ sin θ 0 sin θ cos θ cos ψ sin ψ 0 sin ψ cos ψ 0 0 0 1
The Euler angle θ is calculated from the main crystallographic third-order axis ([0001] direction) in the plane ( 10 1 ¯ 0 ) . The same sequence of rotations will be used to analyze the variability of the shear modulus.
In reference [45], it was demonstrated that hexagonal crystals can generally have eight stationary values of Poisson’s ratio. The surface of Poisson’s ratio as a function of the two Euler angles ( θ , ψ ) is shown in Figure 5a. Only six stationary values were detected for the CeF3 crystal. A numerical analysis of the variability of Poisson’s ratio showed that it varied from 0.16 to 0.48.
The three stationary values have a simple analytical form:
ν 1 ( θ = 0 , ψ ) = ν ( 0001 ) , [ 0001 ] = s 13 s 33 = 0.24
ν 2 θ = π 2 , ψ = 0 = ν [ 0001 ] , [ 0 1 ¯ 10 ] = s 13 s 11 = 0.16
ν 3 θ = π 2 , ψ = π 2 = ν [ 2 ¯ 110 ] , [ 0 1 ¯ 10 ] = s 12 s 11 = 0.43 .
In these formulas for the stationary values of Poisson’s ratio, the last four digits in square brackets indicate the direction of tension (compression), and the first four digits indicate the direction of transverse deformation. As can be seen from Figure 5a, the value ν 2 is the global minimum.
The other three stationary values take the following values: ν 4 = 0.48 at θ = 40.1 ° , ψ = 0 ° , ν 5 = 0.21 at θ = 28.7 ° , ψ = 90 ° and ν 6 = 0.33 at θ = 67.3 ° , ψ = 58.3 ° . The global maximum value of Poisson‘s ratio is ν 4 .
For the shear modulus, the number of stationary values in the case of the hexagonal crystals can be four [44]. Four stationary values can be identified for the CeF3. crystal. A numerical analysis of the variability of the shear modulus shows that it varies in the range from 34.2 to 65.7 GPa. The surface of the shear modulus as a function of the two Euler angles ( θ , ψ ) is shown in Figure 5b.
Two stationary values of the shear modulus have the form:
G 1 ( θ = 0 , ψ ) = G ( 0001 ) , [ 0001 ] = 1 s 44 = 34.2   GPa ,
G 2 θ = π 2 , ψ = π 2 = G [ 2 ¯ 110 ] , [ 0 1 ¯ 10 ] = 1 s 66 = 45.7   GPa .
In this case, the four digits in the second square bracket indicate the direction of the normal to the sliding plane, and the first four digits indicate the sliding direction. The other two stationary values take the following values:
G 3 θ = π / 4 , ψ = 0 = s 11 + s 33 2 s 13 1 = 65.7   GPa
and
G 4 θ = 68.8 ° , ψ = 67.2 = s 44   1 + Π 3 0.25 Π 3 2 / Π 03 1 = 43.8   GPa
Comparing these values shows that G 3 is the global maximum and G 1 is the global minimum. The ratio of the extremes G max / G min is close to 2, which shows a high anisotropy for the CeF3 single crystals.

3.3. Microhardness Testing of the CeF3 Crystals

Hardness is a mechanical parameter that is strongly related to the crystal structure and composition of the solids and is defined as the resistance to deformations or damage under an applied load. Hardness testing provides significant information on the strength and deformation characteristics of the material. Microhardness investigation is one of the best methods for understanding the mechanical properties of materials, such as the plasticity, hardness anisotropy, fracture behavior, etc.
There has been a lack of data on the mechanical properties of CeF3 (with the exception of some preliminary data [46]) and other isostructural tysonite rare-earth fluoride crystals. The averaged microhardness values of La1–xSrxF3–x (0 < x < 0.15) crystals (without taking into account the orientation of the crystal samples) were reported in reference [41]. For undoped LaF3 crystal, the value of HV = 2.43(1) GPa was obtained under the load of P = 35 gf. A natural analog of the investigated crystal is the fluocerite-(Ce) (tysonite) mineral, which is a solid solution of rare-earth trifluorides with a predominance of CeF3. This mineral is brittle; it is characterized by a Mohs hardness of 4.5–5 and has an average cleavage along the { 0001 } and { 11 2 ¯ 0 } planes [47]. As we noted, under an impact, the CeF3 crystals exhibit a pronounced cleavage along the { 11 2 ¯ 0 } at RT. According to the data of reference [48], LaxR1−xF3 (R = Ce, Pr, Nd) solid-solution crystals are also easily cleaved upon cooling in liquid nitrogen along the { 0001 } and { 11 2 ¯ 0 } planes. The positions of these planes in the unit cell of the CeF3 crystal are shown in Figure 6. It is obvious that the characteristic cracking of tysonite crystals under thermal or mechanical stress is observed along the planes consisting only of fluorine ions and having a minimum number of different chemical bonds in the perpendicular directions.
Different spatial positions of the indenter were used in the study of the Vickers microhardness of CeF3 crystals. The Vickers indenter diagonals were parallel to the [ 1 ¯ 010 ] and [ 1 ¯ 2 1 ¯ 0 ] directions on the (0001) base plane, to the [ 0001 ] and [ 1 ¯ 2 1 ¯ 0 ] directions on the ( 10 1 ¯ 0 ) plane and to the [ 0001 ] and [ 1 1 ¯ 00 ] directions on the ( 11 2 ¯ 0 ) crystallographic planes. The measured HV values for the CeF3 single crystal are presented in Table 1.

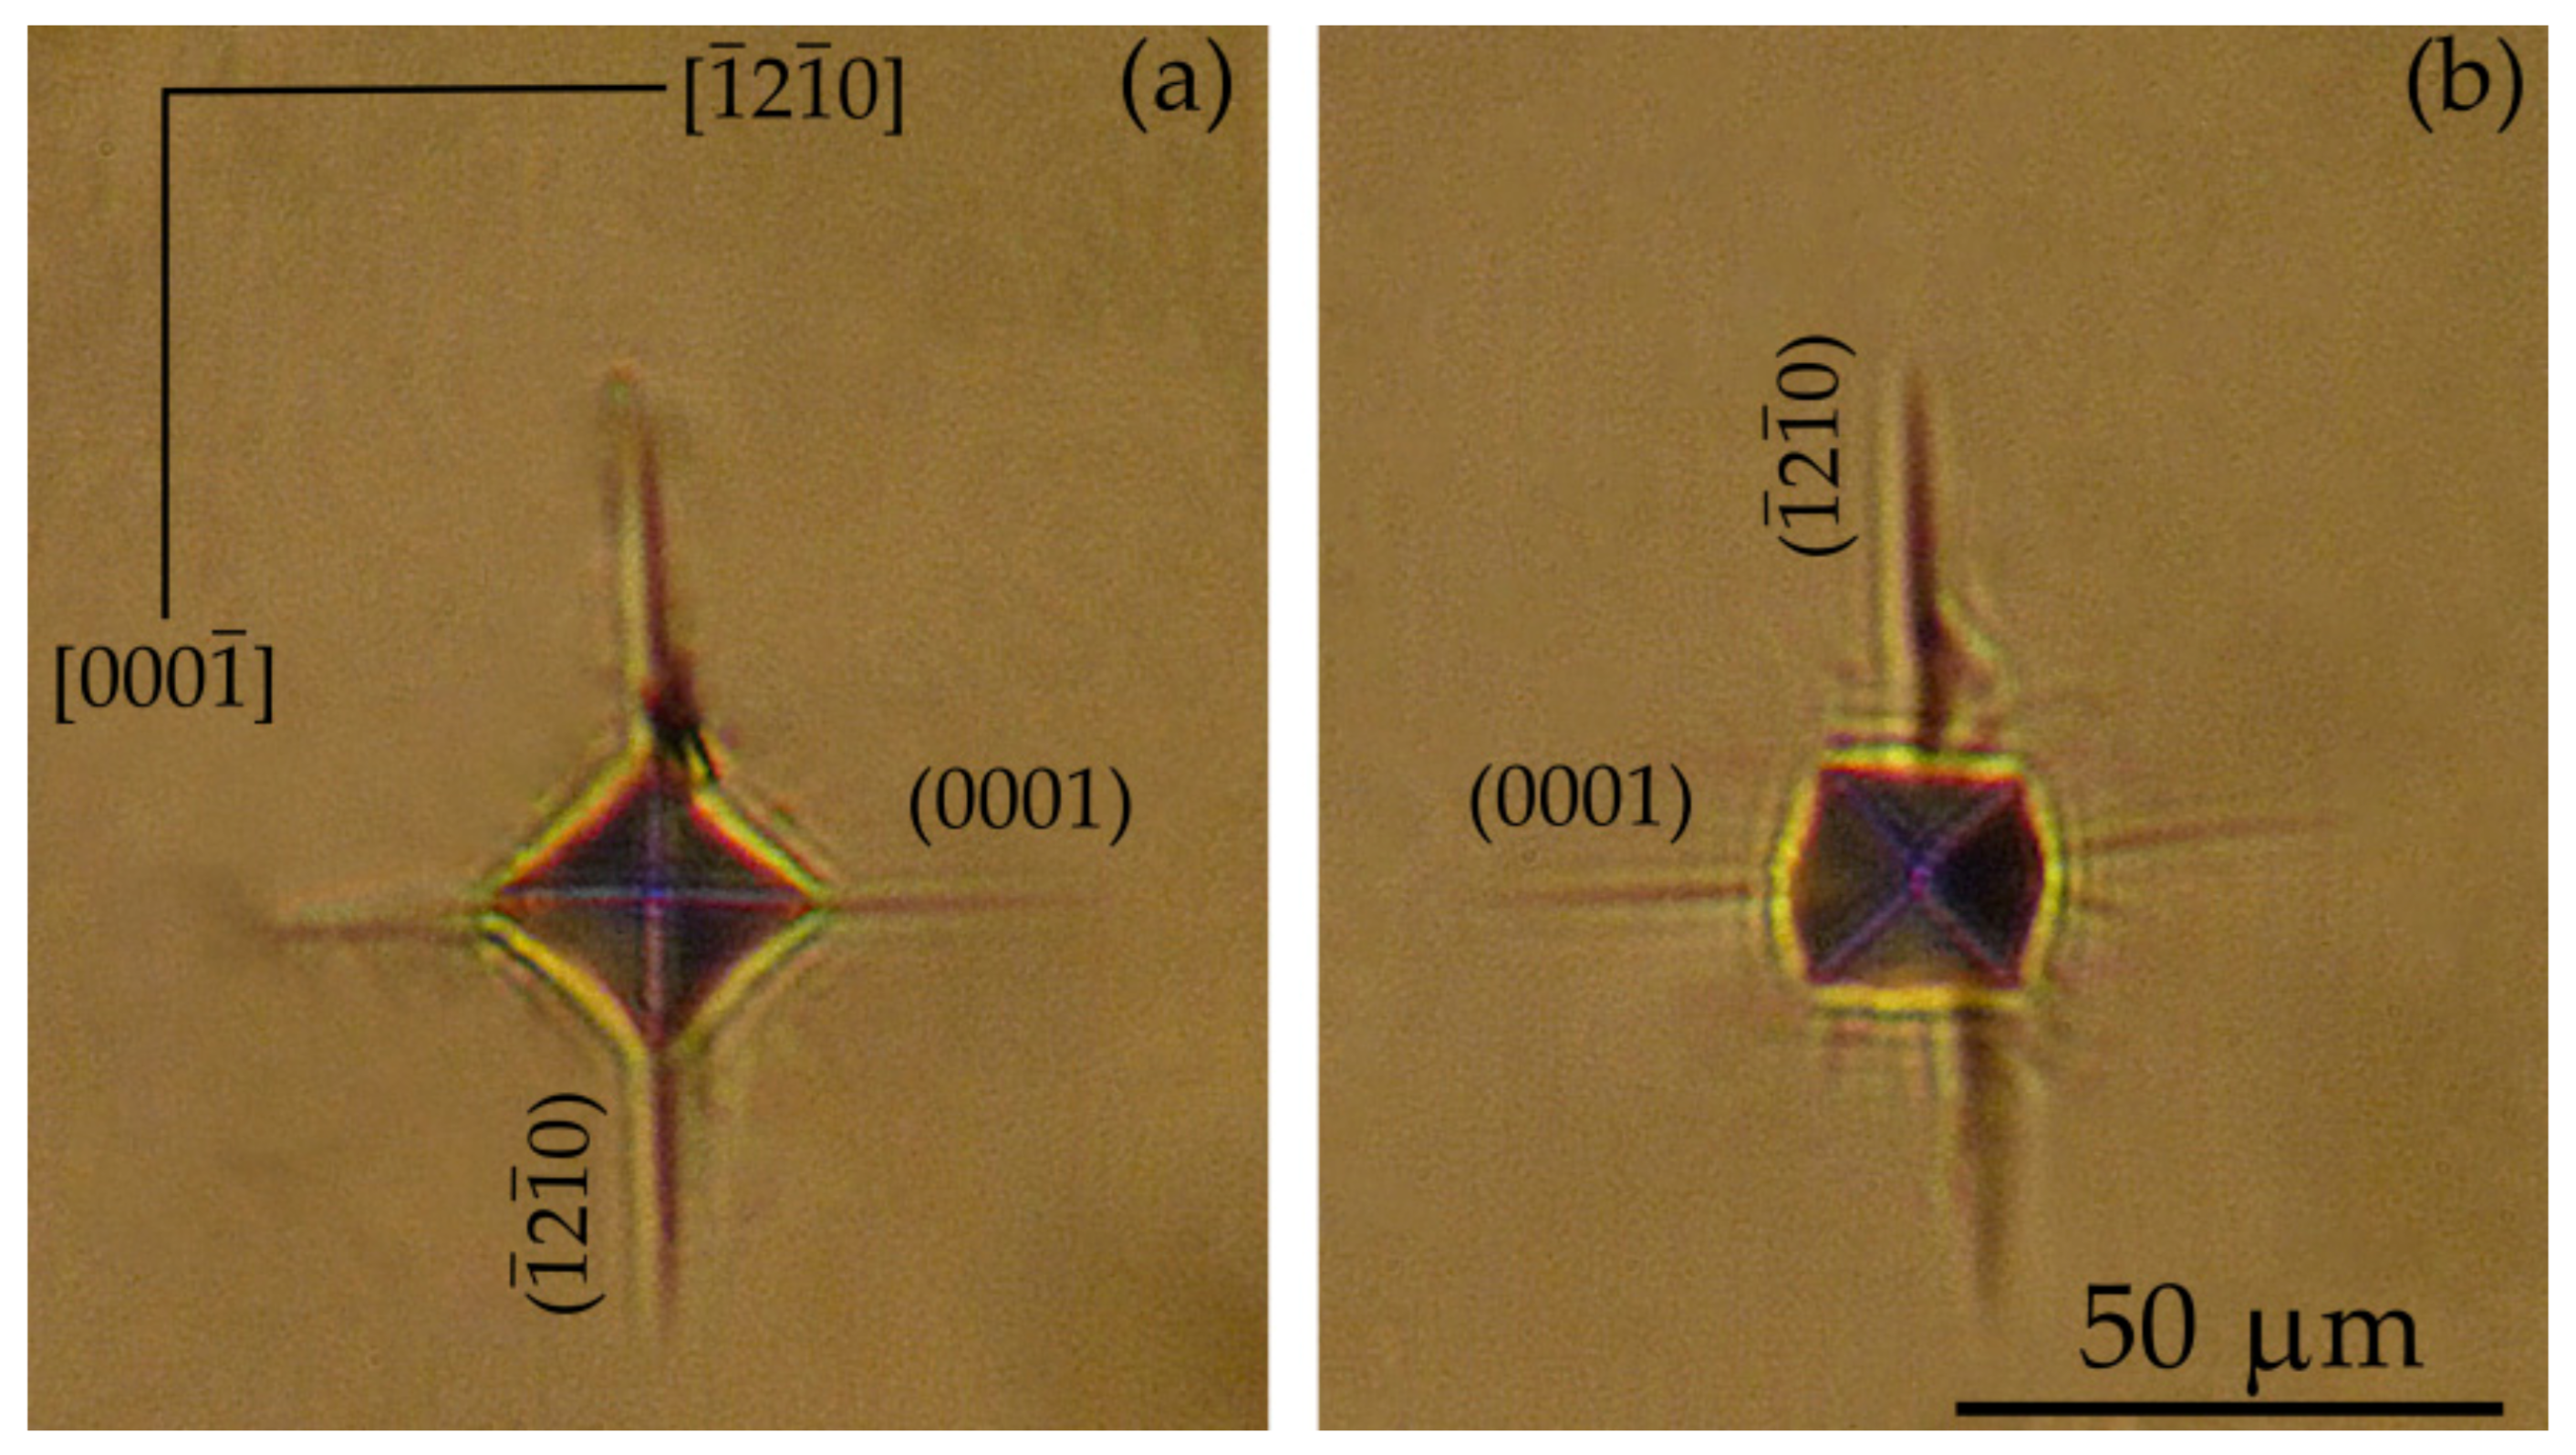
3.3.1. The Vickers Microhardness of the ( 10 1 ¯ 0 ) and ( 11 2 ¯ 0 ) Planes

The recovered indentations on the ( 10 1 ¯ 0 ) planes have a shape of a rhomb extended along the [ 1 ¯ 2 1 ¯ 0 ] direction at the orientation of the indenter diagonals along the [0001] and [ 1 ¯ 2 1 ¯ 0 ] crystallographic directions (Figure 7a).
This fact indicates the presence of first-order microhardness anisotropy on this plane and makes it possible to determine the HV values in the [0001] and [ 1 ¯ 2 1 ¯ 0 ] directions and the anisotropy coefficient KI = 1.33 (see Table 1). The second-order anisotropy coefficient (namely, different microhardness values for different crystallographic planes of the crystal) is KII = HV ( 0001 ) /HV ( 1 ¯ 2 1 ¯ 0 ) = 1.26. The anisotropy of the indentation recovery on the ( 10 1 ¯ 0 ) plane is consistent with the Young’s modulus anisotropy (see Figure 4b). The cracks on the ( 10 1 ¯ 0 ) plane are formed along the ( 1 ¯ 2 1 ¯ 0 ) and ( 0001 ) planes only. A significant change in the shape of the recovered indentation on this plane upon rotation of the Vickers indenter was noted. The indentation sides were slightly concave when the indenter diagonals were oriented along the [0001] and [ 1 ¯ 2 1 ¯ 0 ] directions, and the indentation sides became convex upon rotation of the Vickers indenter by 45° relatively to the [ 1 ¯ 2 1 ¯ 0 ] direction (Figure 7b). Thus, during rotation of the indenter in ( 10 1 ¯ 0 ) plane, a change in the mechanism of material removal from under the Vickers indenter was observed.
The recovered indentations on the ( 11 2 ¯ 0 ) plane had a similar shape of a rhomb extended along the [ 1 1 ¯ 00 ] direction at the orientation of the indenter diagonals along the [0001] and [ 1 1 ¯ 00 ] crystallographic directions. The HV values on the ( 11 2 ¯ 0 ) plane and the anisotropy coefficients KI and KII = HV ( 0001 ) / HV ( 11 2 ¯ 0 ) coincided with the measured data for the ( 10 1 ¯ 0 ) plane within the measurement error.

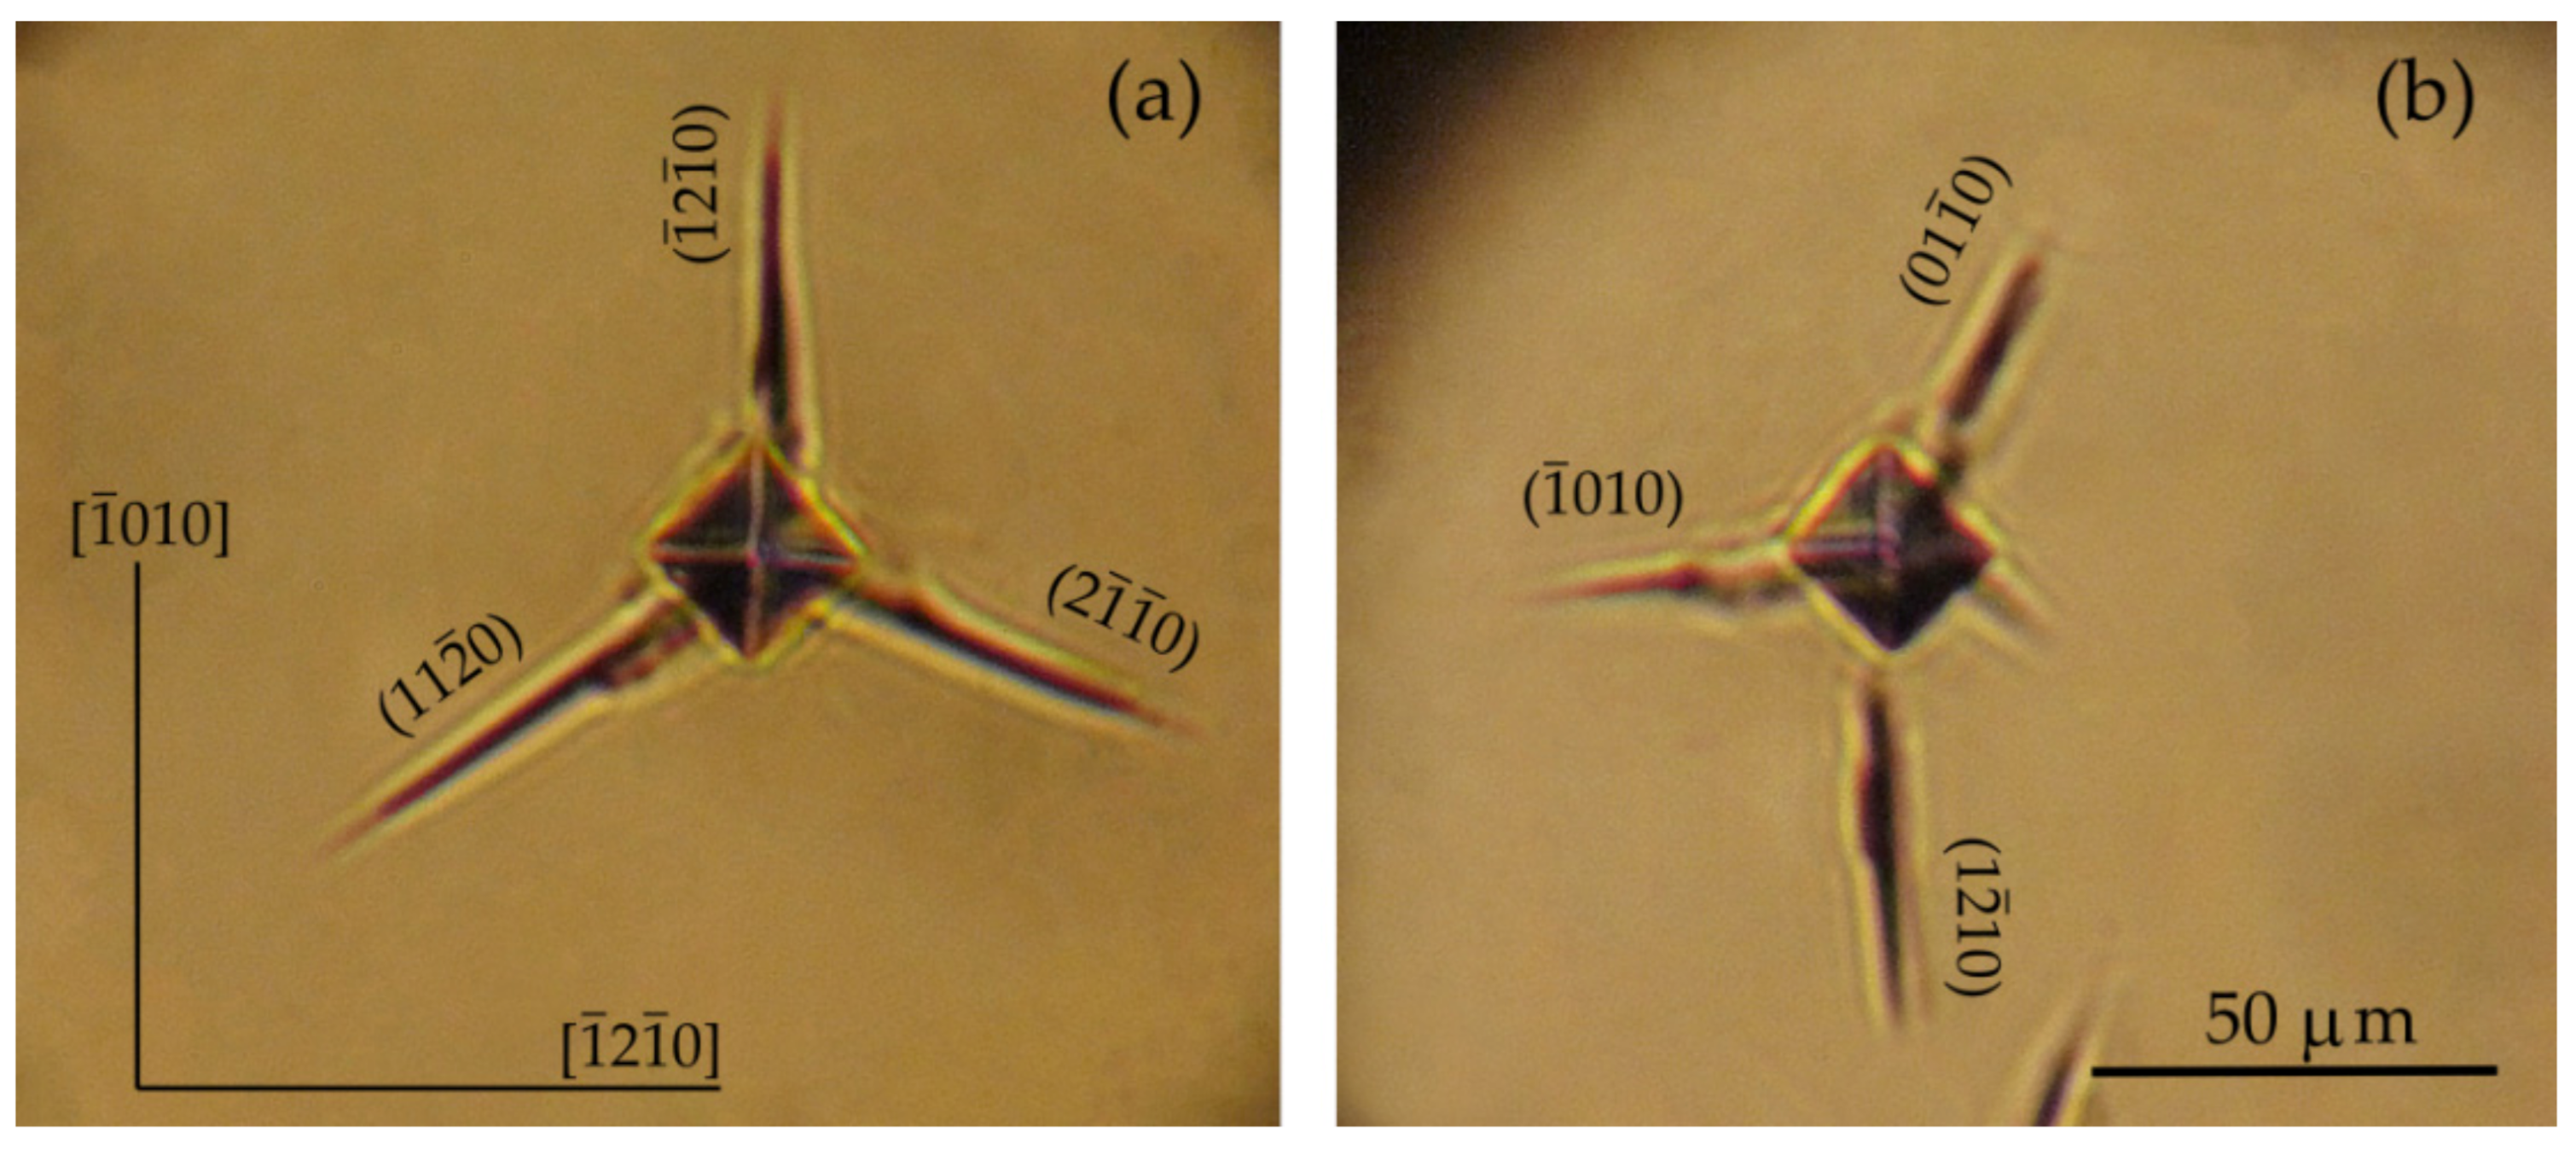
3.3.2. The Vickers Microhardness of the (0001) Crystallographic Plane

The indentation patterns of the (0001) basic planes for the CeF3 crystals are presented in Figure 8. The recovered Vickers indentation is undistorted and has a shape of a regular square at any indenter diagonal orientation, which points out the absence of first-order hardness anisotropy, i.e., the absence of the dependence of microhardness on the indenter position relative to the crystallographic directions, and this fact is consistent with the Young’s modulus isotropy in the (0001) plane (See Figure 4a).
The indentations on the (0001) plane are always precise. Characteristic cracks arise along the < 10 1 ¯ 0 > directions in which the corresponding { 1 ¯ 2 1 ¯ 0 } primary cleavage planes (Figure 8a) are located [46]. Thus, fracture upon indentation occurs only along the cleavage planes, and no random cracks are observed for the (0001) base plane of the CeF3 crystals. Sometimes, along with these cracks, cracks on the { 1 ¯ 010 } planes in the < 1 ¯ 2 1 ¯ 0 > directions arise, which suggests the existence of a secondary cleavage on these planes in these crystals, when the fracture along the primary cleavage plane is hindered probably by sample defects (Figure 8b). To verify this assumption, a Berkovich indenter was used to indent the (0001) plane of the CeF3 crystals, because its geometry corresponds to the symmetry of this plane.

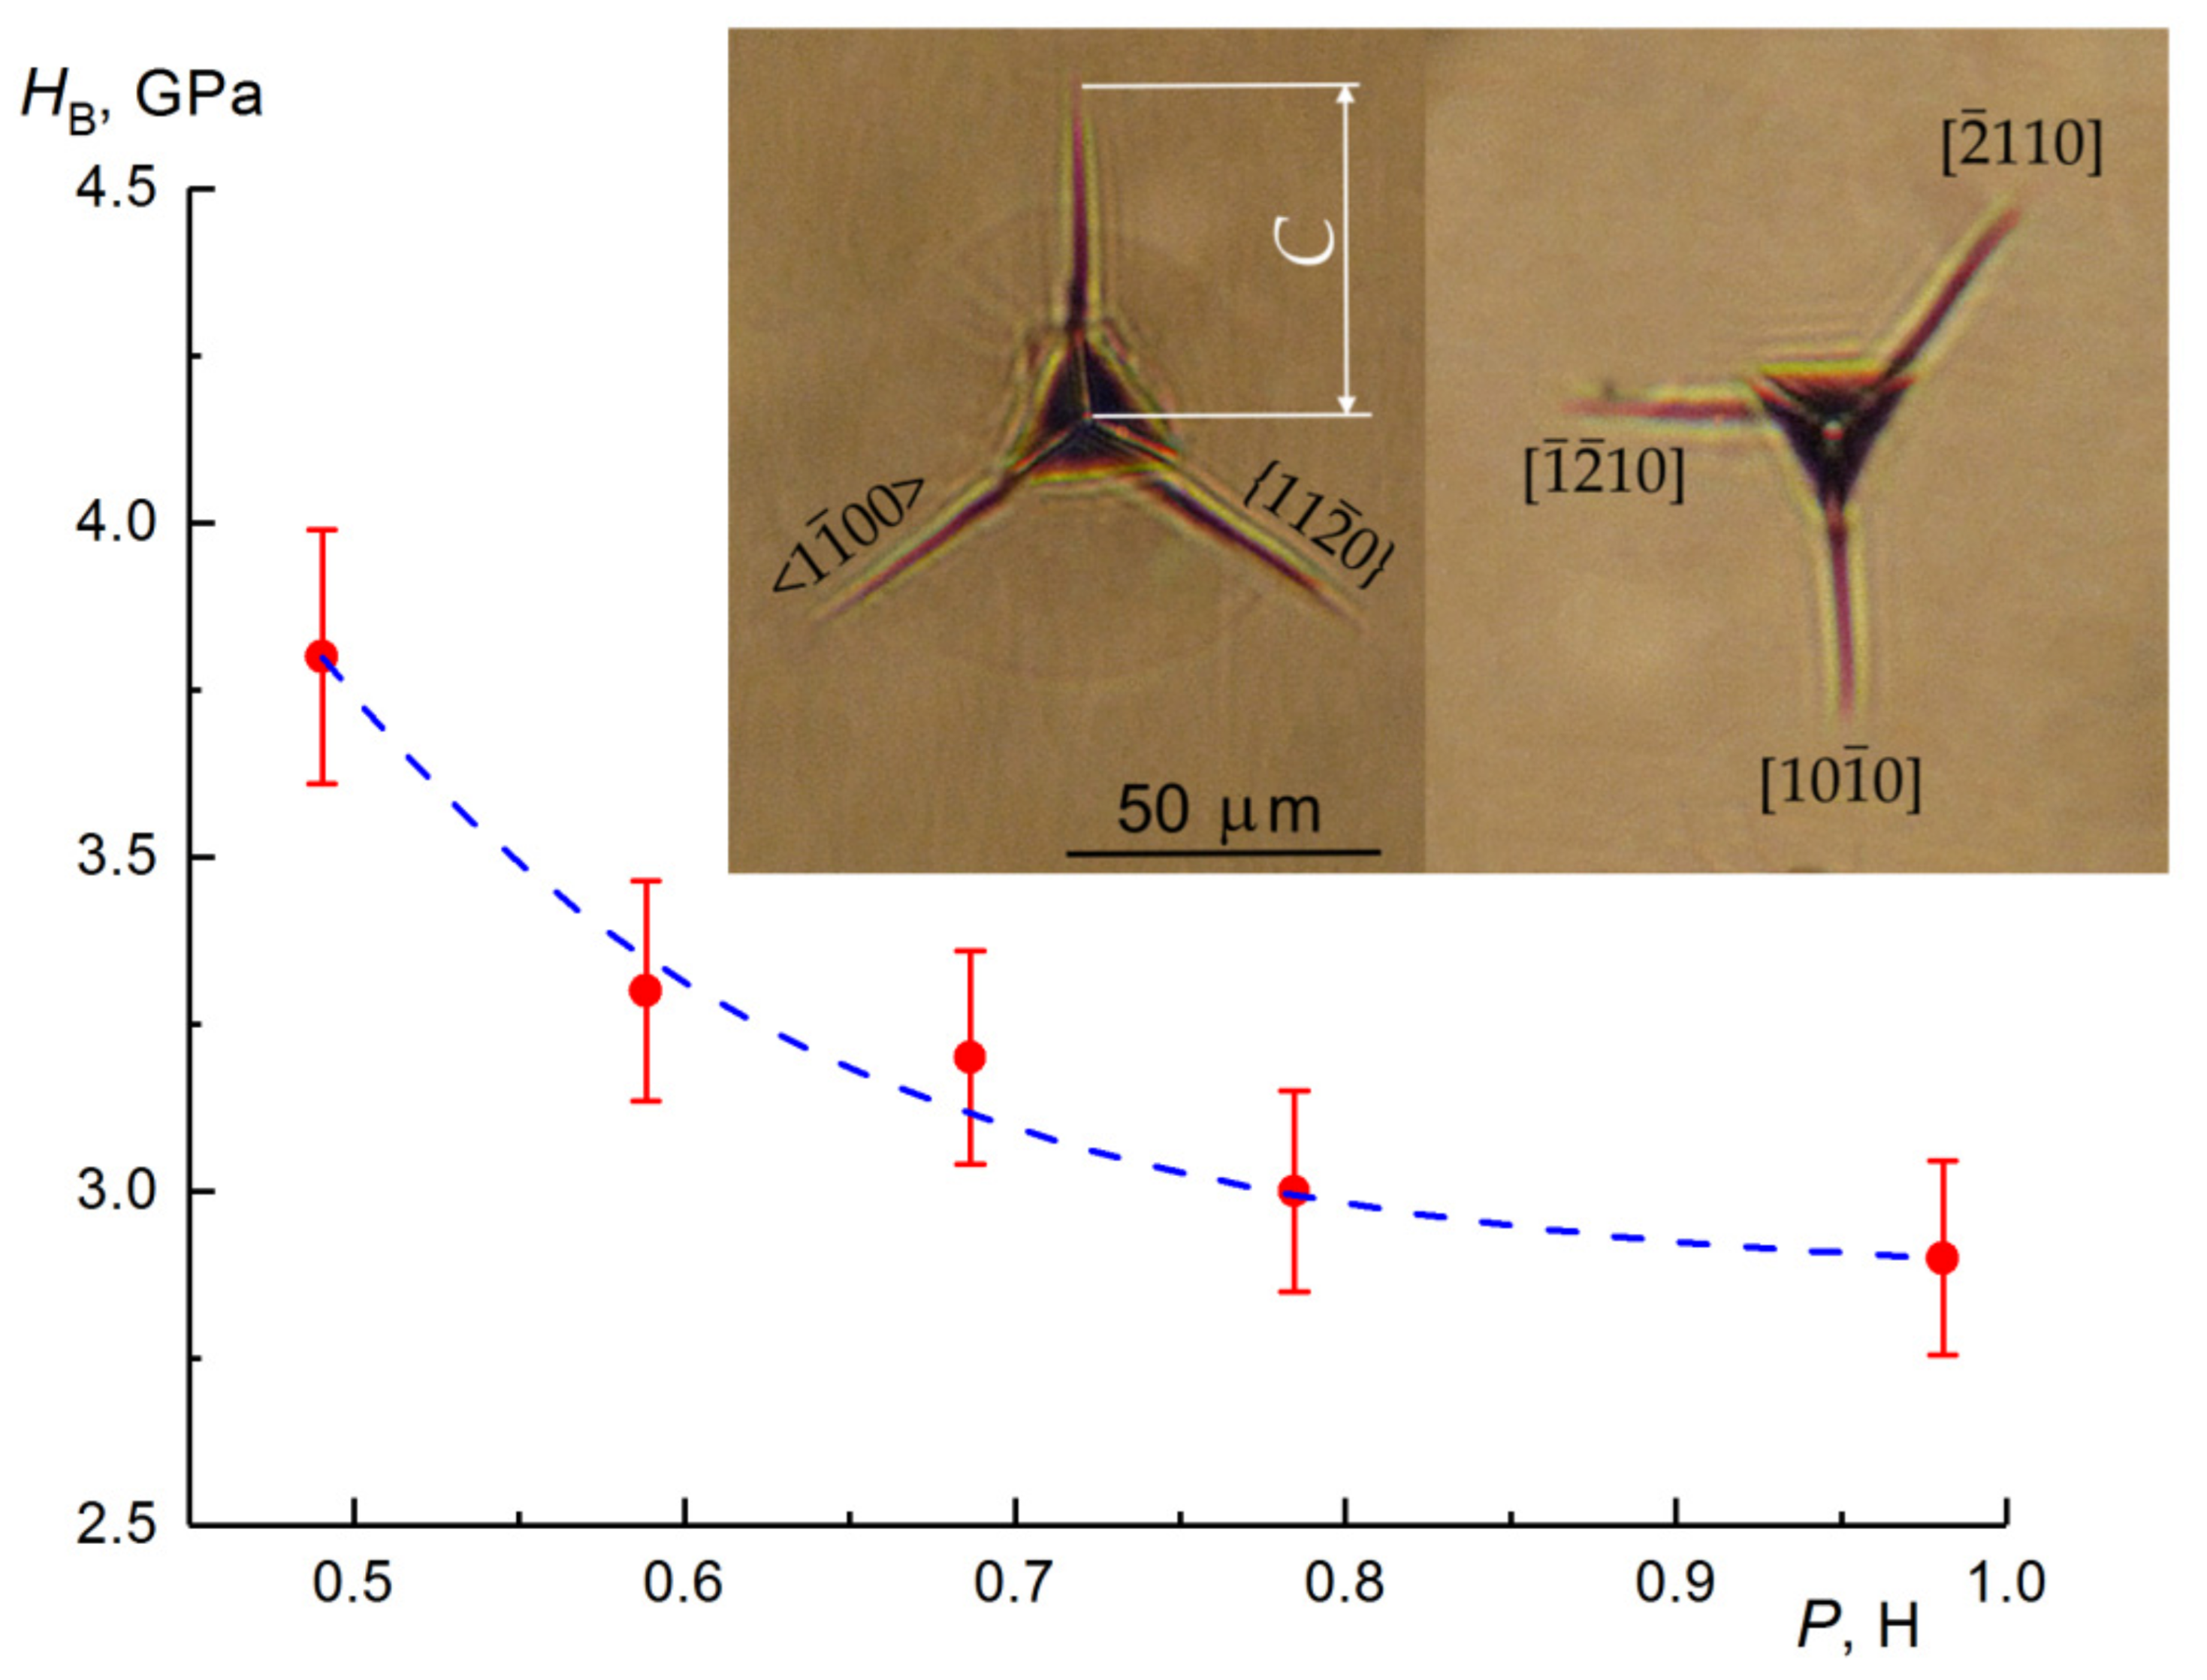
3.3.3. The Berkovich Microhardness of the (0001) Plane of the CeF3 Crystal

The Berkovich indentation patterns of the (0001) plane for the CeF3 crystals at different indentor orientations under the load P = 70 gf are presented in Figure 9. The fracture occurs clearly along the { 11 2 ¯ 0 } cleavage planes ( < 1 1 ¯ 00 > directions) of the CeF3 crystal in the case when the indenter sharp edges coincide with the < 1 1 ¯ 00 > crystallographic directions. In the case when the indenter sharp corners coincide with the < 10 1 ¯ 0 > directions and the maximum load acts in these directions, some cracks are located in the cleavage ( 10 1 ¯ 0 ) planes, but cracks along the { 11 2 ¯ 0 } planes are also observed, despite the fact the fact that the indenter geometry in this case facilitates crystal destruction predominantly along the { 1 ¯ 010 } planes. Thus, even when the geometry indenter facilitates the formation of cracks along the secondary cleavage { 1 ¯ 010 } planes, the { 11 2 ¯ 0 } planes, which are the primary cleavage planes in the CeF3 crystal, participate in the fracture process during indenter penetration.
In the range of loads P from 0.5 to 0.98 N, the Berkovich microhardness HB value changes from 3.8 to 2.9 GPa for the (0001) plane of the CeF3 crystal (see Figure 9). The HB value is higher than HV one (see Table 1). This fact agrees with the data of reference [49] on the study of the surface relief during the Berkovich and Vickers indentation, where it was shown that, at the same load during the Berkovich indentation, the degree of deformation is greater than with the Vickers indentation. This phenomenon is determined by the spiky shape of the Berkovich indenter. The HB value decreases with the increasing load P. Such a variation in HB(P) dependance is described by the indentation size effect (ISE). The model of indentation with the cracks formation does not provide load-independent microhardness. The ISE onset is assumed to be related to the crack formation upon indentation, which obeys the fundamentals of destruction mechanics and elastic recovery of an indentation impression after removal of the indenter [50]. The relative value of the elastic recovery increases in the region of low loads, and the elastic recovery of the indentation, depending on the direction, agrees with the character of the anisotropy of Young’s modulus [51,52].
The measurement of linear dimensions of the cracks C around the indenter imprint (see Figure 9) as a function of the indenter load P provides a quantitative characterization of the fracture toughness—coefficient KC. The resistance to fracture indicates the toughness of a material, and the fracture toughness K C determines how much fracture stress is applied under uniform loading. The value of K C is determined not only by the values of C but, also, by the indenter geometry and the material properties. In accordance with reference [53], the fracture toughness KC is given by a relation:
KC = 0.026 ctg(ϕ)1/2(E/HB)1/2 P/C3/2,
where E is the Young’s modulus (E = 131 GPa for the (0001) plane of the CeF3 crystal), ϕ = 76°54′ is the half-angle at the vertex of the Berkovich indenter and C is the crack length under the load (C = 36 μm under P = 70 gf)—thus, for the plane (0001) of the CeF3 crystal K C = 0.25 MPa m1/2 for cracks in the < 1 1 ¯ 00 > direction (i.e., along the primary cleavage { 11 2 ¯ 0 } planes).
Direct measurements of the crack dimensions around the point of action of a concentrated load make it possible to estimate the value of the surface energy of fracture γ [54]:
γ = K C 2   ( 1 ν 2 ) / 2 E ,
where ν = 0.16 is Poisson’s ratio for (0001) plane, and thus, the surface energy of the fracture γ = 0.23 J/m2.
A theoretical estimate of the value of the surface fracture energy:
γ = (E/y0) (λ/π)2
was proposed in reference [55] based on the values of the relaxation distance of the repulsive forces between the ions λ (λ is taken as the radius of the larger ion), the interplanar distance between the spreading planes y0 and Young’s modulus E. For the CeF3 crystal: λ = 1.246 Å (estimated fluorine ionic radius [56]), y0 = c = 7.283 Å and E = E [ 01 1 ¯ 0 ] = 131 GPa. Accordingly, γ = 0.28 J/m2. This value γ agrees with the direct calculations of the surface energy of the fracture for the cracks in the < 1 1 ¯ 00 > direction (i.e., along the primary cleavage { 11 2 ¯ 0 } planes) and indicates the reality of the value of the surface fracture energy obtained by the method of measuring the linear dimensions of the cracks during indentation.
Due to the pointed shape of the Berkovich indenter, the degree of deformation in the Berkovich indentation was greater than in the Vickers one. The coincidence of the geometric symmetry of the Berkovich indenter with the crystallographic symmetry of the investigated (0001) plane of the CeF3 crystal makes it possible to increase the measurement accuracy and more fully determine the nature of the fracture and mechanical anisotropy of this crystal. As a result, it was possible to confirm the data on the presence of the primary { 11 2 ¯ 0 } and secondary { 10 1 ¯ 0 } cleavage planes in the CeF3 crystals and quantify the fracture toughness coefficient K C and the surface fracture energy.

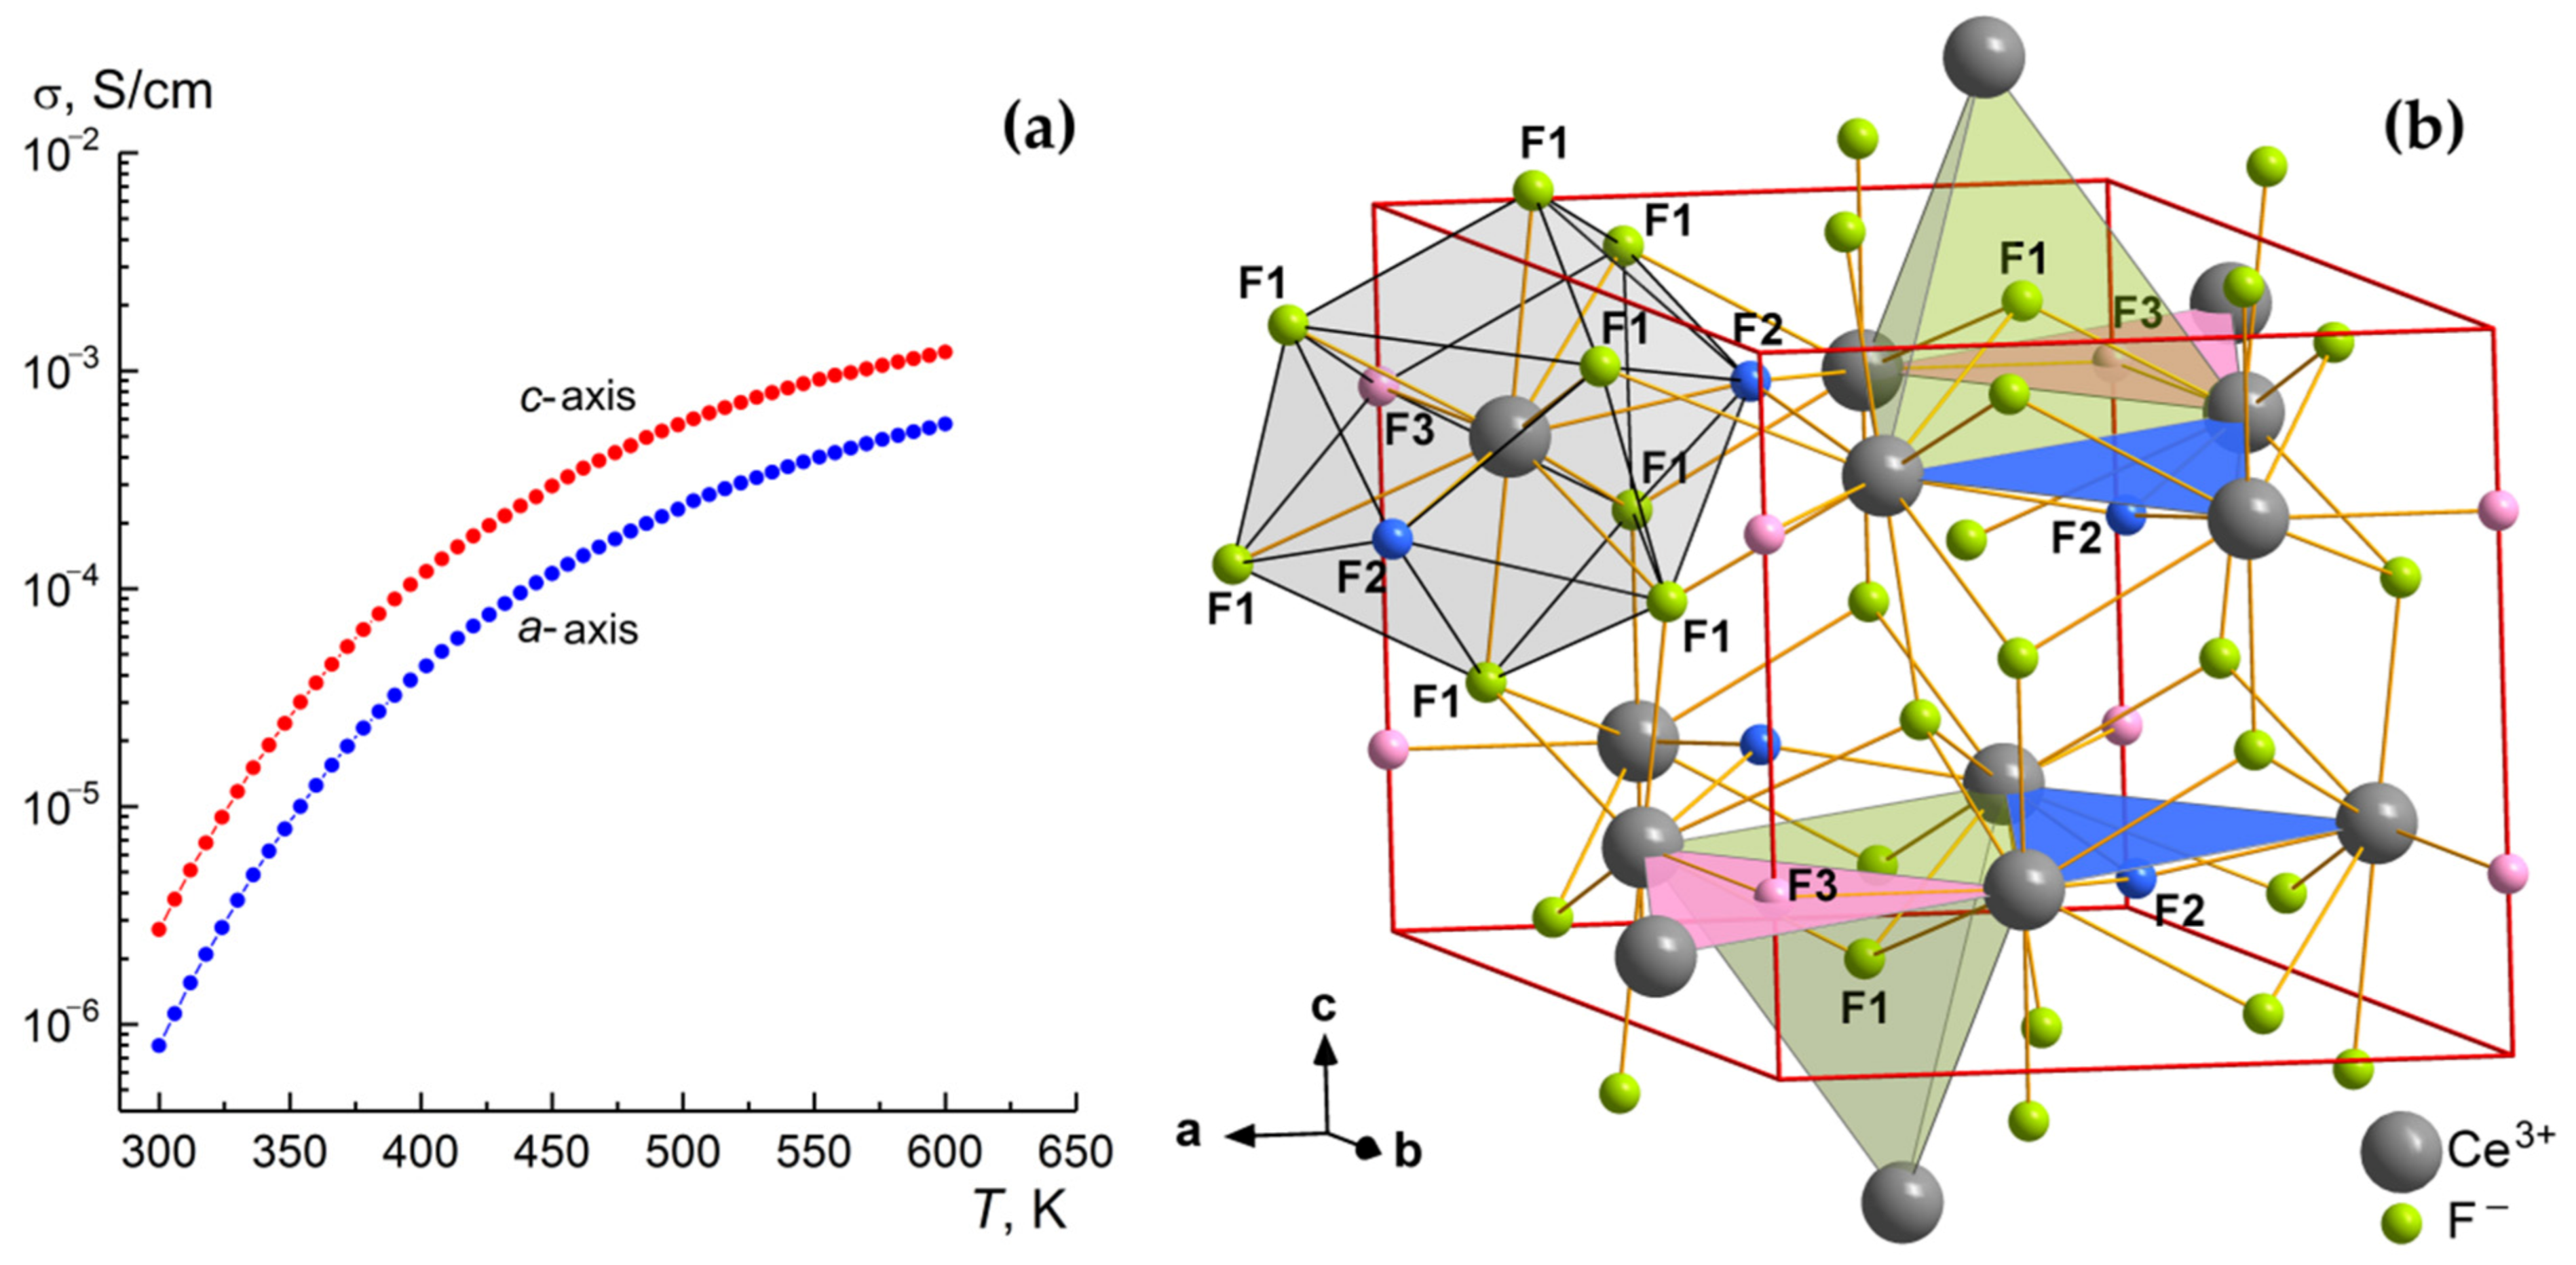
3.4. Ionic Conductivity Measurements

The effect of anisotropy of anionic conductivity in rare-earth fluorides with a tysonite-type structure (type LaF3, space group P 3 ¯ c 1 ) and, in particular, in grown undoped CeF3 single crystals is of great interest for the study of the mechanism of ionic transfer in fluoride superionic conductors and makes it possible to reveal the structural paths of ionic transport and determine the relationship of ionic conductivity and features of the crystal structure.
From the point of view of trigonal symmetry of the CeF3 crystals, the temperature dependences of the conductivity, studied only along the a- and c-axes, are shown in Figure 10. The preferable conduction path is determined, and the highest electrical conductivity is observed along the c-axis. The temperature dependences of conductivity σdc are divided into three sections: 300–355 (low temperatures LT), 355–545 (middle temperatures) and 545–600 K (high temperatures HT). The LT and HT regions of the σ(T) dependences are described by the Arrhenius equation:
σdcT = Aexp(–E/kBT),
where A is the preexponential factor, E is the activation energy of the ion conductivity process (further, we will denote Ea and Ec as the activation energy along the a- and c-axes, respectively), kB is the Boltzmann constant and T is the temperature. The parameters calculated by this equation in the LT and HT regions are given in Table 2.
The obtained values of the activation energies of conductivity Ea and Ec for the CeF3 are in good agreement with the corresponding data for the closest crystal chemical isostructural analog LaF3 (Ea = 0.46 and 0.27 eV, Ec = 0.44 and 0.27 eV and the LT and HT regions, respectively) [57].
In general, ionic conductivity in the tysonite-type rare-earth trifluorides (LaF3, CeF3, PrF3 and NdF3) is due to the translational hopping of F ions in the crystal lattice by the vacancy mechanism [58]. The high value of fluorine–ionic conductivity of the tysonite-type crystals in comparison with the other fluorides is associated with the high coordination of the cations with F ions (Figure 10b), which leads to a weakening of the chemical bonds “metal–fluorine” and increases the anions’ mobility.
The crystal structure of CeF3 is characterized by three crystallographic positions of the fluorine atoms: F1:F2:F3 = 12:4:2 (Figure 10b) [34,35]. In the trigonal motive of CeF3 along the c-axis, purely anionic layers formed by F1 atoms and cation–anionic layers containing F2 and F3 atoms with similar dynamic properties (F2 ≈ F3) alternate. With the temperature increasing, anionic transfer occurs first in the fluorine sublattice F1; then, there is an exchange of fluorine vacancies between subsystems F1 and (F2 + F3) [59]. In individual rare-earth tysonite fluorides, thermally stimulated defects are formed according to the Schottky mechanism (cationic and fluorine vacancies). The LT region corresponds to the region of the impurity association, and the HT region corresponds to the region of impurity conductivity [60,61]. In the middle-temperature region, a change in the mechanism of conductivity occurs, accompanied by a monotonic decrease in the activation energy of ion transport with the increasing temperature.
The anisotropy of σdc is determined by the nonequivalence of the fluorine positions and the hopping frequencies of the F- ions in these positions. The transfer of the F- ions along the c-axis occurs more rapidly, since it is carried out by fluorine vacancies with the participation of F1 positions, for which the hopping frequency is higher and shorter structural segments are involved in the conduction paths. The insignificant (max value along the c-axis) anisotropy of σdc in the CeF3 crystal indicates that there are no distinguished conduction channels in its structure, and it has quasi-three-dimensional (3D) electrical conductivity (crystallographic analysis fluorine motion in the tysonite structure was given in reference [62]). The ratios of the conductivity values measured along the c- and a-axes are σ||cc = 3.4, 2.4 and 2.1 at 300, 500 and 600 K, respectively—that is, it decreases with the increasing temperature. Experimental data on the anisotropy of the conductivity of a number of tysonite crystals are given in Table 3. The anisotropic effect of ion transfer in undoped tysonite-type rare-earth trifluorides is weak and practically disappears upon heavy doping with alkaline earth impurities.

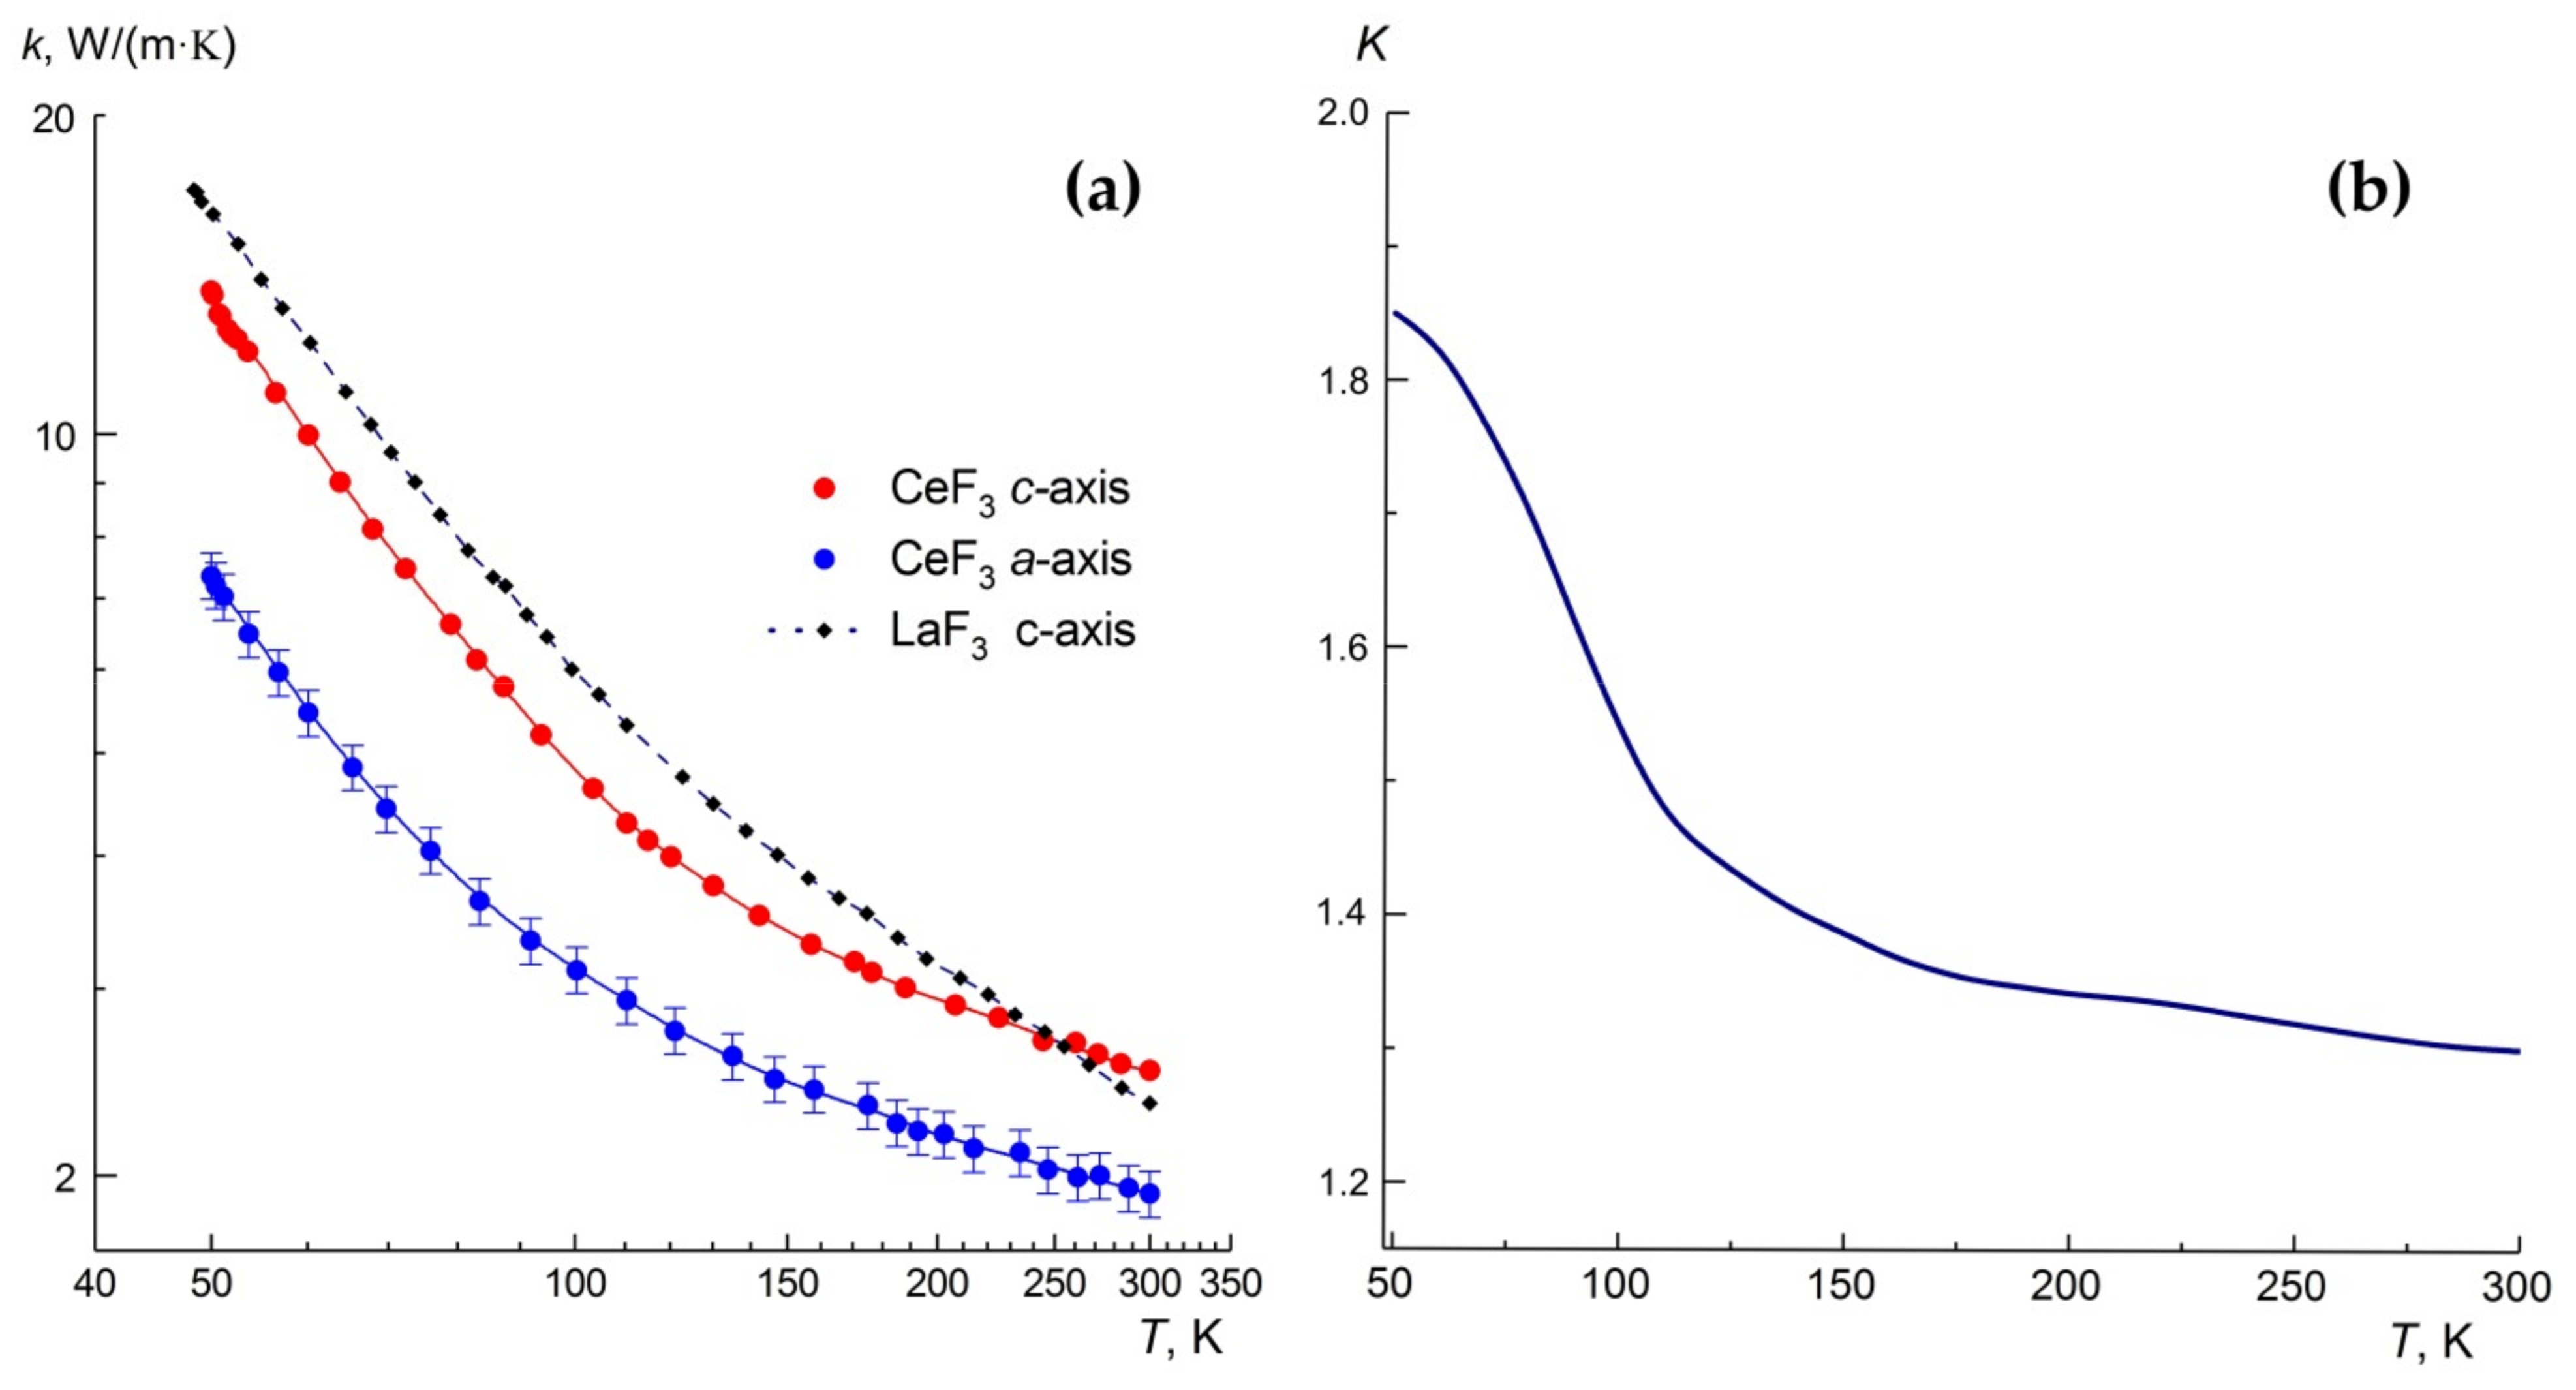
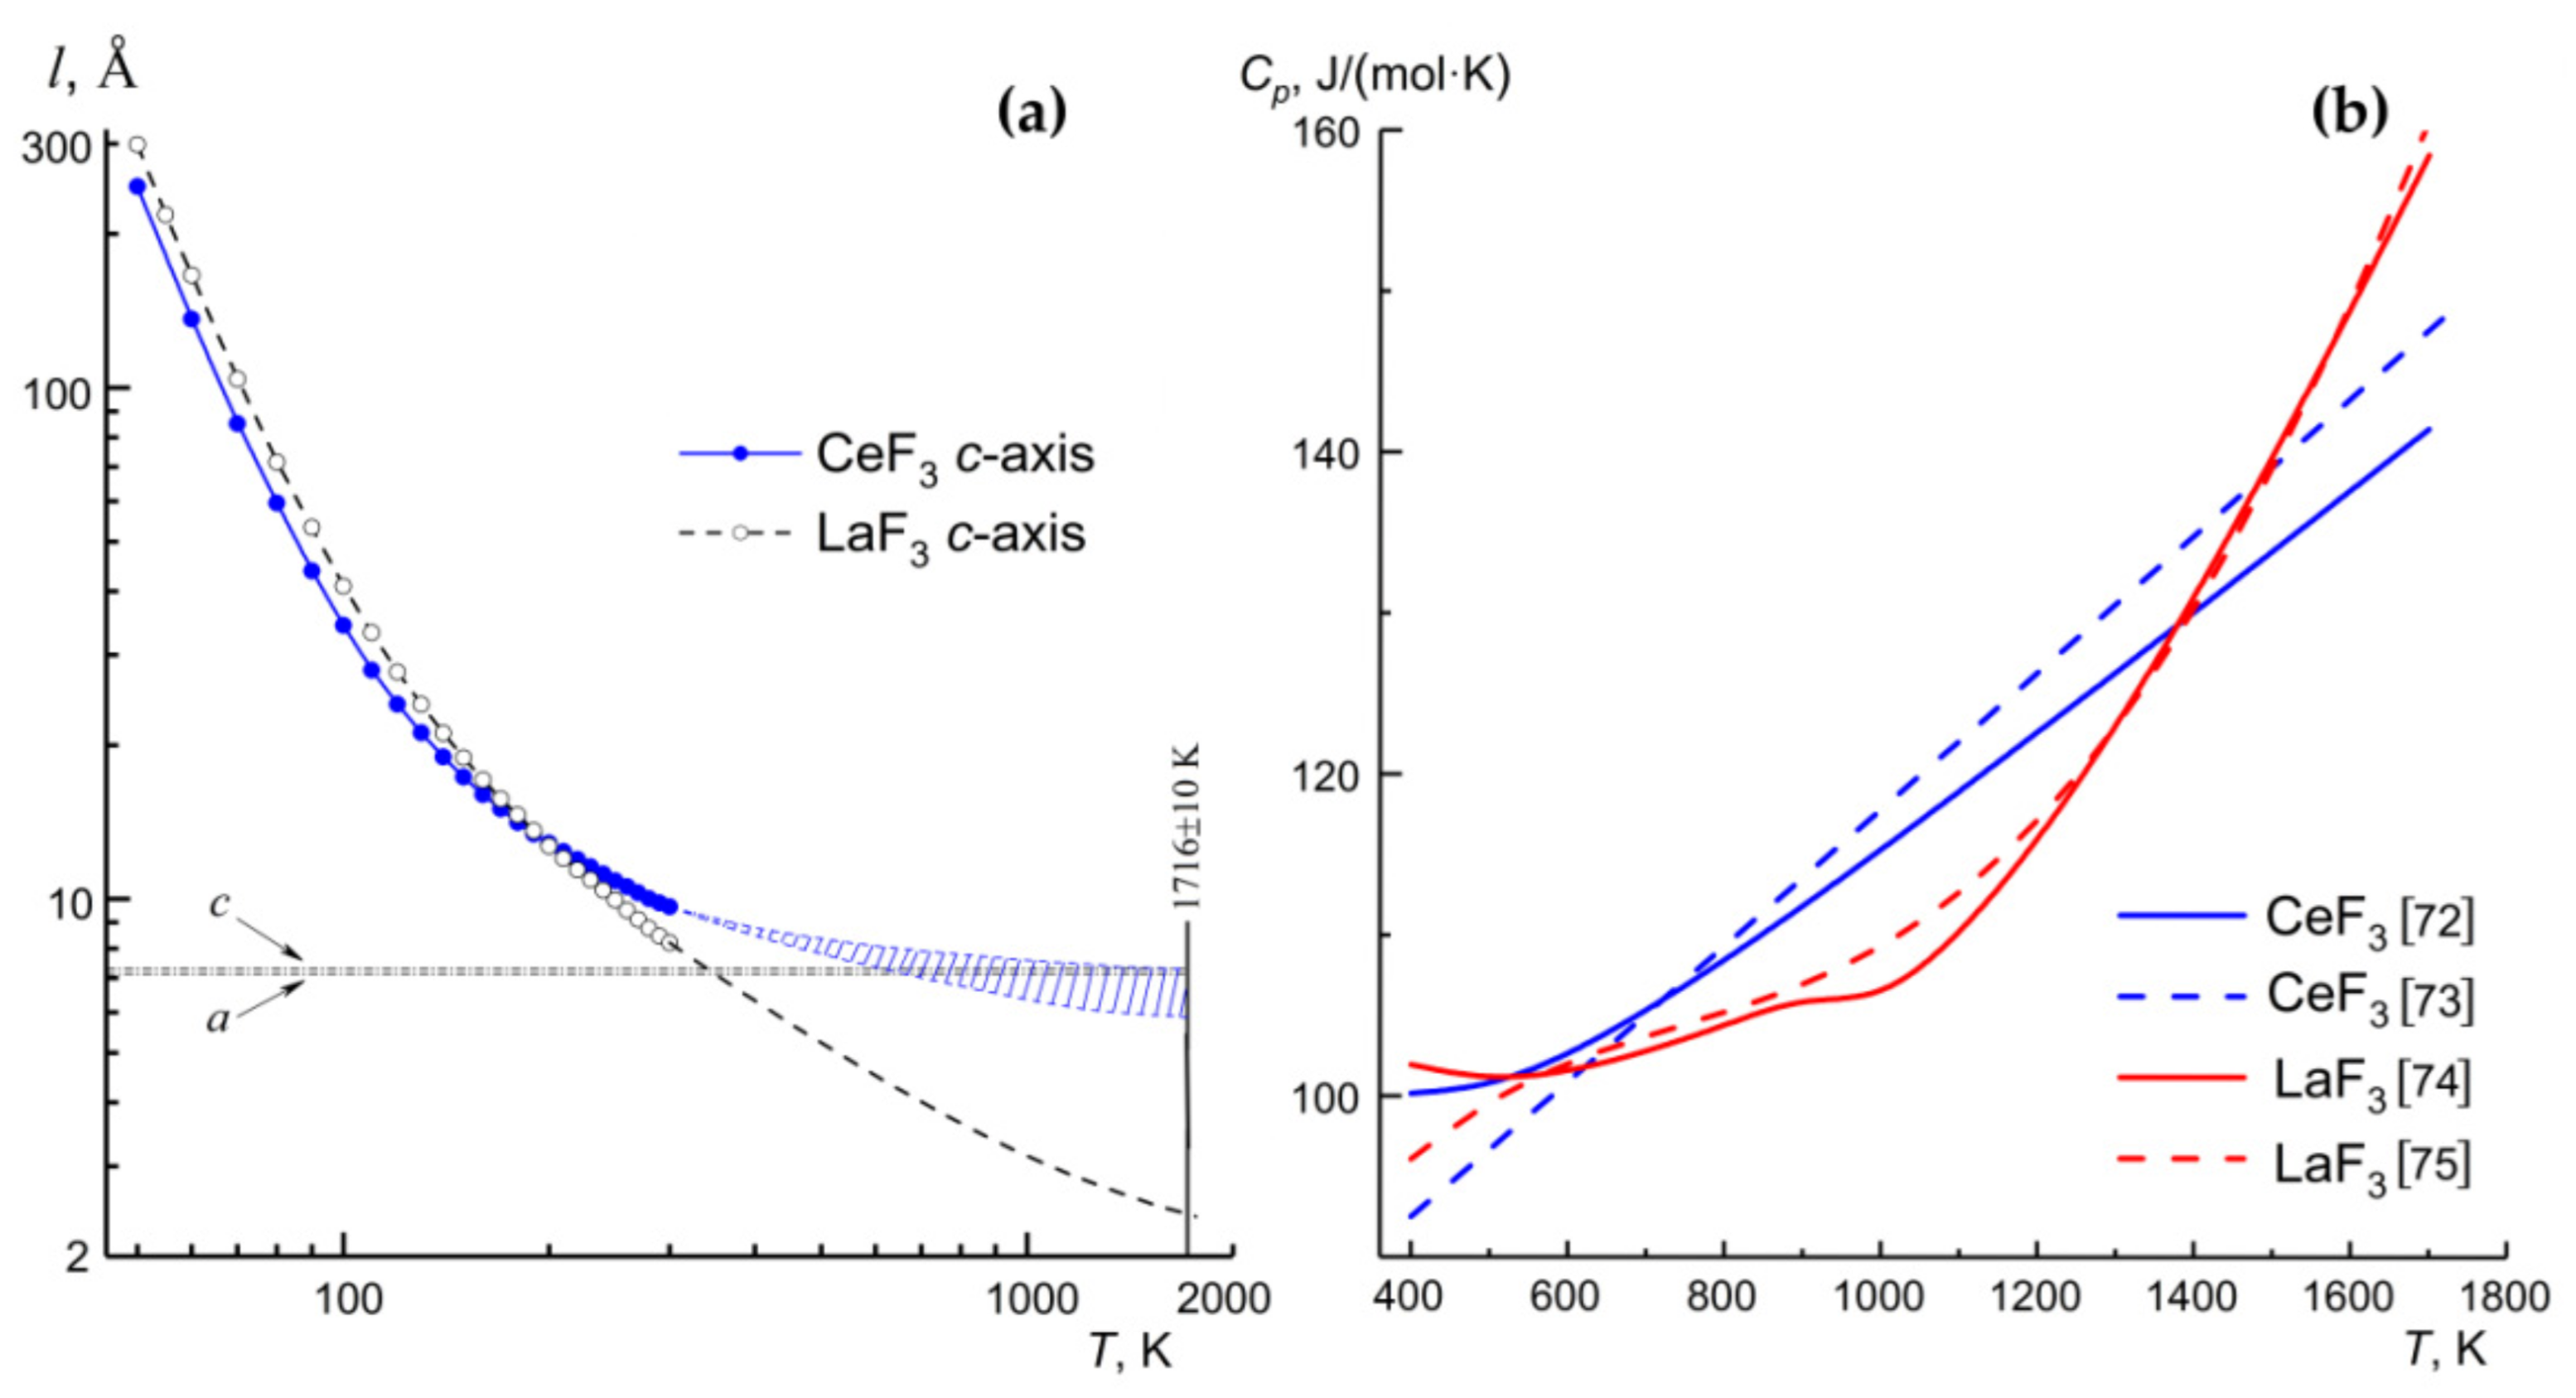
3.5. Anisotropy of the Thermal Conductivity of the CeF3 Crystals

The results of the measurements of the temperature dependence of the thermal conductivity coefficient are shown in Figure 11a and, for some selected temperatures, are given in numerical terms in Table 4.
Note that the values of the CeF3 thermal conductivity obtained in reference [10] are dramatically lower. The reason for this phenomenon can be assumed to be qualitative differences in the impurity composition of the grown crystal samples—for example, in the oxygen content.
The CeF3 crystals have a rather low thermal conductivity. It can be seen that, in comparison with many other optical materials, these crystals are a weak thermal conductor. This circumstance corresponds to the high values of the fluoride–ion conductivity in the CeF3 crystal given in this work (see Section 3.3. above). Inverse correlations between the thermal conductivity and ionic conductivity were established for many fluoride crystals [66,67] and are associated with partial disordering of the anion sublattice and the inelastic interaction of phonons with F ions migrating over the crystal. This phonon–defect scattering is added to the phonon–phonon one associated with the thermal vibrations of ions in the crystal. As a result, the value of thermal conductivity k decreases, and its temperature dependence k(T) becomes weaker. Indeed, the revealed dependence k(T) for the CeF3 crystal is weak, and the thermal conductivity value changes by only half an order of magnitude in the studied temperature range.
The anisotropy of the thermal conductivity of the CeF3 crystals is significant. The temperature dependence of the anisotropy coefficient K, defined as the ratio of the thermal conductivity coefficients K = k||c/ kc along two main orthogonal directions, is shown in Figure 11b. This coefficient K changes insignificantly with the temperature, except for the region of the lowest temperatures, where the thermal conductivity is especially sensitive to various kinds of structure defects. Taking into account the strong temperature dependence of the average phonons mean free path, it can be assumed that the main reason for the revealed thermal conductivity anisotropy is the difference in the velocity of the elastic wave propagation in these two main directions of the CeF3 crystal.
In terms of the absolute values of the thermal conductivity coefficient and its temperature behavior, CeF3 is close to its isostructural analog, the LaF3 crystals [65] (see Figure 11a). This compound is also characterized by high fluorine ionic conductivity [68]. Compared with the LaF3 crystal, the thermal conductivity of CeF3 is slightly lower up to T = 250 K. However, a monotonic decrease in thermal conductivity was observed for both crystals in the studied temperature range.
The thermal activation model of two-level systems was used earlier to describe the monotonic increase k(T) for superionic conductors, including the LaF3 and (presumably) CeF3 crystals [69]. According to our data, the antibate behavior of the k(T) dependences was observed in comparison with reference [69], and no special signs of the manifestation of the thermal activation two-level systems are detected. Counterarguments on the applicability of such models to the heat conduction phenomenon were given in reference [68]. The temperature dependence of the phonons mean free path l(T) along the c-axis of the CeF3 crystals is shown in Figure 12a. The data for the LaF3 crystals [65] are shown for comparison. The calculation was carried out from the well-known Debye expression:
k = C V ν l / 3 ,
where C V is the heat capacity per unit volume of a crystal, and ν is the average propagation speed of the phonons (sound). The value ν = 2.66 km/s, obtained by taking into account the results of measurements of the longitudinal and transverse ultrasonic waves in various crystallographic directions, was utilized as the average speed of phonons propagation [69]. Calorimetric data for the calculation were taken from reference [70]. As in the case of tysonite LaF3 crystals [65], the revealed temperature dependence l(T) was significantly weaker than the l(T) dependences observed for other fluorides with a fluorite-type structure [71]. Extrapolation of the dependence l(T) to the melting temperature region of CeF3 crystals (Tm = 1716 K) gave a value that did not exceed its unit cell parameters and was comparable to the interstitial distances in this crystal.
The reason for the different behaviors of the dependences k(T) and l(T) for isostructural CeF3 and LaF3 single crystals in the temperature range T > 200 K was probably related to the different temperature behaviors of their specific heats Cp(T) (see Figure 12b) [72,73,74,75]. Despite the fact that literature data are somewhat different, it was seen that the increase in Cp(T) was significant, and this indicated an additional contribution to the lattice heat capacity. The heat capacity of CeF3 crystal above room temperature increased much more steeply than that of LaF3, and this fact can determine different degrees of the temperature dependence of thermal conductivity for studied crystals in a low-temperature region.

4. Conclusions

Bulk CeF3 single crystals (sp. gr. P 3 ¯ c 1 ) were grown by the vertical Bridgman technique. The study of the mechanical, thermal and electrophysical properties demonstrated their pronounced anisotropy due to the crystal structural features. This must be taken into account when developing the design of the active or passive optical construction elements based on CeF3 single crystal. The utilization of the c-oriented crystal samples to achieve the maximum values of hardness, ionic conductivity and thermal conductivity is preferred.

Author Contributions

D.N.K. performed the crystal growth experiments; N.L.S. and P.A.P. analyzed the crystal quality; N.L.S. performed the mechanical property characterizations; D.S.L. performed the technical elastic constant calculations; D.N.K. performed the spectroscopic investigation; A.G.I. performed the crystal structure characterization; V.V.G. performed the ionic conductivity investigation; P.A.P. performed the thermal conductivity measurements; D.N.K., D.S.L., N.L.S., V.V.G. and P.A.P. analyzed the data and interpreted the experiments; D.N.K. provided the idea and designed the experiments and D.N.K. coordinated the scientific group. All authors have read and agreed to the published version of the manuscript.

Funding

This research was funded by the Russian Foundation for Basic Research (project 19-02-00877) in the part concerning the growth of the crystals and by the Ministry of Science and Higher Education of the Russian Federation within the State assignments of the Federal Scientific Research Centre «Crystallography and Photonics» of the Russian Academy of Sciences in the part concerning the investigation and analysis of crystal properties using the equipment of the Shared Research Center (project RFMEFI62119X0035). The technical elastic constants of the crystals were analyzed in the framework of the Government program of IPMech RAS AAAA-A20-120011690136-2.

Institutional Review Board Statement

Not applicable.

Informed Consent Statement

Not applicable.

Data Availability Statement

Data sharing not applicable.

Acknowledgments

We are deeply grateful to N.A. Arkharova, A.G. Savelyev, B.V. Nabatov and N.I. Sorokin for their help in carrying out the experiments and fruitful discussions.

Conflicts of Interest

The authors declare no conflict of interest. The funders had no role in the design of the study; in the collection, analyses or interpretation of the data; in the writing of the manuscript or in the decision to publish the results.

References

  1. Sobolev, B.P. The Yttrium, Lanthanum, and Lanthanide Trifluorides: Internal Periodicity of Phase Transitions. Crystallogr. Rep. 2019, 64, 713–723. [Google Scholar] [CrossRef]
  2. Pastor, R.C.; Harrington, J.A.; Gorre, L.E.; Chew, R.K. New coating materials for IR laser optical components. Mater. Res. Bull. 1979, 14, 543–551. [Google Scholar] [CrossRef]
  3. Elias, L.R.; Flach, R.; Yen, W.M. Variable bandwidth transmission filter for the vacuum ultraviolet: La1−xCexF3. Appl. Opt. 1973, 12, 138–139. [Google Scholar] [CrossRef] [PubMed]
  4. Krivandina, E.A.; Zhmurova, Z.I.; Sobolev, B.P.; Glushkova, T.M.; Kiselev, D.F.; Firsova, M.M.; Shtyrkova, A.P. Growth of R1−ySryF3−y crystals with rare earth elements of the cerium subgroup (R = La, Ce, Pr, or Nd; 0 ≤ y ≤ 0.16) and the dependence of their density and optical characteristics on composition. Crystallogr. Rep. 2006, 51, 895–901. [Google Scholar] [CrossRef]
  5. Fedorov, V.A.; Karimov, D.N.; Komar’kova, O.N.; Krivandina, E.A.; Zhmurova, Z.I.; Sobolev, B.P. Nanostructured crystals of fluorite phases Sr1−xRxF2+x (R are rare-earth elements) and their ordering. IV. Study of the optical transmission spectra in the 2-17-μm wavelength range. Crystallogr. Rep. 2010, 55, 122–126. [Google Scholar] [CrossRef]
  6. Connor, J.O.; Hargreaves, W.A. Lattice energy transfer and stimulated emission from CeF3:Nd3+. Appl. Phys. Lett. 1964, 4, 208–209. [Google Scholar] [CrossRef]
  7. Dmitruk, M.V.; Kaminskii, A.A.; Shcherbakov, I.A. Spectroscopic investigation of stimulated emission from lasers based on CeF3:Nd3+ crystals. Sov. Phys. JETP 1968, 27, 900–903. Available online: http://jetp.ac.ru/cgi-bin/dn/e_027_06_0900.pdf (accessed on 5 July 2021).
  8. Wang, Q.; Su, L.; Li, H.; Zheng, L.; Tang, H.; Guo, X.; Xu, J. Growth and spectroscopic characteristics of Er-doped CeF3 crystal. J. Cryst. Growth 2011, 318, 733–736. [Google Scholar] [CrossRef]
  9. Yang, Y.; Zhang, L.; Li, S.; Zhang, S.; Zhang, P.; He, M.; Xu, M.; Hang, Y. Crystal growth and 570 nm emission of Dy3+ doped CeF3 single crystal. J. Lumin. 2019, 215, 116707. [Google Scholar] [CrossRef]
  10. Yang, Y.; Zhang, L.; Quan, C.; Li, S.; Zhang, S.; Zhang, Y.; Fang, Q.; He, M.; Xu, M.; Hang, Y. Growth, thermal, and polarized spectroscopic properties of Nd:CeF3 crystal for dual-wavelength lasers. J. Lumin. 2020, 217, 117558. [Google Scholar] [CrossRef]
  11. Yang, Y.; Zhang, L.; Li, S.; Zhang, S.; Zhang, Y.; Fang, Q.; He, M.; Xu, M.; Hang, Y. Growth and mid-infrared luminescence property of Ho3+ doped CeF3 single crystal. Infrared Phys. Technol. 2020, 105, 103230. [Google Scholar] [CrossRef]
  12. Nowroozi, M.A.; Mohammad, I.; Molaiyan, P.; Wissel, K.; Munnangi, A.R.; Clemens, O. Fluoride ion batteries—past, present, and future. J. Mater. Chem. A 2021, 9, 5980–6012. [Google Scholar] [CrossRef]
  13. Sobolev, B.P.; Sorokin, N.I.; Bolotina, N.B. Nonstoichiometric single crystals M1–xRxF2+x and R1–yMyF3–y (M—Ca, Sr, Ba; R—rare earth elements) as fluorine-conducting solid electrolytes. In Progress in Fluorine Science; Tressaud, A., Poeppelmeier, K.V., Eds.; Elsevier: Amsterdam, The Netherlands, 2016; Volume 1, pp. 465–491. [Google Scholar] [CrossRef]
  14. Sorokin, N.I.; Karimov, D.N.; Sobolev, B.P. Increase in the fluorine-ion conductivity of single crystals of tysonite-type CeF3 superionic conductor by substituting polarized Cd2+ ions for Ce3+ ions. Crystallogr. Rep. 2018, 63, 769–773. [Google Scholar] [CrossRef]
  15. Sorokin, N.I.; Sobolev, B.P. Nonstoichiometric fluorides—solid electrolytes for electrochemical devices: A review. Crystallogr. Rep. 2007, 52, 842–863. [Google Scholar] [CrossRef]
  16. Dieudonné, B.; Chable, J.; Body, M.; Legein, C.; Durand, E.; Mauvy, F.; Fourcade, S.; Leblanc, M.; Maisonneuve, V.; Demourgues, A. The key role of the composition and structural features in fluoride ion conductivity in tysonite Ce1−xSrxF3−x solid solutions. Dalton Trans. 2017, 46, 3761–3769. [Google Scholar] [CrossRef] [Green Version]
  17. Moses, W.W.; Derenzo, S.E. Cerium fluoride, a new fast, heavy scintillator. IEEE Trans. Nucl. Sci. 1989, 36, 173–176. [Google Scholar] [CrossRef]
  18. Kobayashi, M.; Ishii, M.; Krivandina, E.A.; Litvinov, M.M.; Peresypkin, A.I.; Prokoshkin, Y.D.; Rykalin, V.I.; Sobolev, B.P.; Takamatsu, K.; Vasil’chenko, V.G. Cerium fluoride, a highly radiation-resistive scintillator. Nucl. Instrum. Methods Phys. Res. A 1991, 302, 443–446. [Google Scholar] [CrossRef]
  19. Auffray, E.; Baccaro, S.; Beckers, T.; Benhammou, Y.; Belsky, A.N.; Borgia, B.; Boutet, D.; Chipaux, R.; Dafinei, I.; de Notaristefani, F.; et al. Extensive studies on CeF3 crystals, a good candidate for electromagnetic calorimetry at future accelerators. Nucl. Instrum. Methods Phys. Res. A 1996, 383, 367–390. [Google Scholar] [CrossRef] [Green Version]
  20. Yoshikawa, A.; Satonaga, T.; Kamada, K.; Sato, H.; Nikl, M.; Solovieva, N.; Fukuda, T. Crystal growth of Ce: PrF3 by micro-pulling-down method. J. Crys. Growth 2004, 270, 427–432. [Google Scholar] [CrossRef]
  21. Inagaki, T.; Yoshimura, Y.; Kanda, Y.; Matsumoto, Y.; Minami, K. Development of CeF3 crystal for high-energy electromagnetic calorimetry. Nucl. Instrum. Methods Phys. Res. A 2000, 443, 126–135. [Google Scholar] [CrossRef]
  22. Nikl, M. Wide band gap scintillation materials: Progress in the technology and material understanding. Phys. Stat. Solidi (a) 2000, 178, 595–620. [Google Scholar] [CrossRef]
  23. Molina, P.; Vasyliev, V.; Víllora, E.G.; Shimamura, K. CeF3 and PrF3 as UV-visible Faraday rotators. Opt. Express 2011, 19, 11786–11791. [Google Scholar] [CrossRef]
  24. Starobor, A.; Mironov, E.; Palashov, O. High-power Faraday isolator on a uniaxial CeF3 crystal. Opt. Lett. 2019, 44, 1297–1299. [Google Scholar] [CrossRef] [PubMed]
  25. Vojna, D.; Slezák, O.; Yasuhara, R.; Furuse, H.; Lucianetti, A.; Mocek, T. Faraday rotation of Dy2O3, CeF3 and Y3Fe5O12 at the mid-infrared wavelengths. Materials 2020, 13, 5324. [Google Scholar] [CrossRef] [PubMed]
  26. Li, H.; Wang, J.; Chen, J.; Dai, Y.; Su, L.; Li, X.; Kalashnikova, A.M.; Wu, F. Bridgman growth and magneto-optical properties of CeF3 crystal as Faraday Rotator. Opt. Mater. 2020, 100, 109675. [Google Scholar] [CrossRef]
  27. Zhao, G.; Zhao, C.; Yang, Y.; Xu, M.; Li, S.; Hang, Y. Magneto-optical performances of novel neodymium-doped CeF3 crystal. Mater. Lett. 2021, 130134. [Google Scholar] [CrossRef]
  28. Sobolev, B.P. Chemical aspects of crystal growth of multicomponent fluoride materials from the melt. Crystallogr. Rep. 2002, 47, S63–S75. [Google Scholar] [CrossRef]
  29. Pastor, R.C. Crystal growth of metal fluorides for CO2 laser operation: II. Optimization of the reactive atmosphere process (RAP) choice. J. Cryst. Growth 1999, 203, 421–424. [Google Scholar] [CrossRef]
  30. Fedorov, P.P.; Osiko, V.V. Crystal Growth of Fluorides. In Bulk Crystal Growth of Electronic, Optical & Optoelectronic Materials; Capper, P., Ed.; John Wiley & Sons, Ltd.: Hoboken, NJ, USA, 2005; pp. 339–355. [Google Scholar] [CrossRef]
  31. Bolotina, N.B.; Chernaya, T.S.; Verin, I.A.; Khrykina, O.N.; Sobolev, B.P. Dimorphism of RF3 (R = La–Nd) crystals based on the data of X-ray diffraction studies. Crystallogr. Rep. 2016, 61, 29–34. [Google Scholar] [CrossRef]
  32. Greis, O.; Cader, M.S.R. Polymorphism of high-purity rare earth trifluorides. Thermochim. Acta 1985, 87, 145–150. [Google Scholar] [CrossRef]
  33. Afanasiev, M.L.; Habuda, S.P.; Lundin, A.G. The symmetry and basic structures of LaF3, CeF3, PrF3 and NdF3. Acta Cryst. B 1972, 28, 2903–2905. [Google Scholar] [CrossRef]
  34. Zalkin, A.; Templeton, D.H.; Hopkins, T.E. The Atomic Parameters in the Lanthanum Trifluoride Structure. Inorg. Chem. 1966, 5, 1466–1468. [Google Scholar] [CrossRef] [Green Version]
  35. Smann, M. Über Verbindungen vom Anti-LaF3-Strukturtyp. Z. Kristallogr. 1965, 122, 399–406. [Google Scholar] [CrossRef] [Green Version]
  36. Laiho, R.; Lakkisto, M. Investigation of the refractive indices of LaF3, CeF3, PrF3 and NdF3. Philos. Mag. B 1983, 48, 203–207. [Google Scholar] [CrossRef]
  37. Laiho, R.; Lakkisto, M.; Levola, T. Brillouin scattering investigation of the elastic properties of LaF3, CeF3, PrF3 and NdF3. Philos. Mag. A 1983, 47, 235–244. [Google Scholar] [CrossRef]
  38. Hart, S. The elastic constants of cerium fluoride. Phys. Status Solidi A 1973, 17, K107–K110. [Google Scholar] [CrossRef]
  39. Savinkov, A.V.; Korableva, S.L.; Tagirov, M.S.; Suzuki, H.; Matsumoto, K.; Abe, S. Revised measurements and interpretation of magnetic properties of oriented CeF3 single crystals. J. Low Temp. Phys. 2016, 185, 603–608. [Google Scholar] [CrossRef]
  40. Fedorov, P.P.; Alexandrov, A.A. Synthesis of inorganic fluorides in molten salt fluxes and ionic liquid mediums. J. Fluor. Chem. 2019, 227, 109374. [Google Scholar] [CrossRef]
  41. Krivandina, E.A.; Zhmurova, Z.I.; Berezhkova, G.V.; Sobolev, B.P.; Glushkova, T.M.; Kiselev, D.F.; Firsova, M.M.; Shtyrkova, A.P. Crystal growth, density, and mechanical properties of La1−xSrxF3−x solid solutions (0 ≤ x ≤ 0.15) with the tysonite structure. Crystallogr. Rep. 1995, 40, 686–690. [Google Scholar]
  42. Popov, P.A.; Sidorov, A.A.; Kul’chenkov, E.A.; Anishchenko, A.M.; Avetisov, I.S.; Sorokin, N.I.; Fedorov, P.P. Thermal conductivity and expansion of PbF2 single crystal. Ionics 2017, 23, 233–239. [Google Scholar] [CrossRef]
  43. Korczak, W.; Mikołajczak, P. Crystal growth and temperature variation of the lattice parameters in LaF3, CeF3, PrF3 and NdF3. J. Cryst. Growth 1983, 61, 601–605. [Google Scholar] [CrossRef]
  44. Goldstein, R.V.; Gorodtsov, V.A.; Komarova, M.A.; Lisovenko, D.S. Extreme values of the shear modulus for hexagonal crystals. Scr. Mater. 2017, 140, 55–58. [Google Scholar] [CrossRef]
  45. Gorodtsov, V.A.; Lisovenko, D.S. Extreme values of Young’s modulus and Poisson’s ratio of hexagonal crystals. Mech. Mater. 2019, 134, 1–8. [Google Scholar] [CrossRef]
  46. Sizova, N.L.; Karimov, D.N.; Kosova, T.B.; Lisovenko, D.S. Mechanical properties of CeF3 single crystals. Crystallogr. Rep. 2019, 64, 942–946. [Google Scholar] [CrossRef]
  47. Anthony, J.W.; Bideaux, R.A.; Bladh, K.W.; Nicois, M.C. Handbook of Mineralogy; Mineral Data Publishing: Tucson, Arizona, 1997; 628p. [Google Scholar]
  48. Paradowski, M.L.; Korczak, W.; Misiak, L.E.; Korczak, Z. Growth and investigation of LaxRE1–xF3 (RE=Ce, Pr, Nd) single crystals. Proc. SPIE 1999, 47–51. [Google Scholar] [CrossRef]
  49. Shikimaka, O.; Grabko, D. Deformation created by Berkovich and Vickers indenters and its influence on surface morphology of indentations for LiF and CaF2 single crystals. J. Phys. D: Appl. Phys. 2008, 41, 074012. [Google Scholar] [CrossRef]
  50. Sangwal, K. Review: Indentation size effect, indentation cracks and microhardness measurement of brittle crystalline solids—some basic concepts and trends. Cryst. Res. Technol. 2009, 44, 1019–1037. [Google Scholar] [CrossRef]
  51. Mott, B.W. Micro-Indentation Hardness Testing; Butterworths: London, UK, 1956. [Google Scholar]
  52. Boyarskaya, Y.S. Deformation of Crystals in Microhardness Testing; Stiintza: Kishinev, Moldova, 1972. (In Russian) [Google Scholar]
  53. Lawn, B.R.; Evans, A.G.; Marshall, D.B. Elastic/Plastic indentation damage in ceramics: The median/Radial crack system. J. Am. Ceram. Soc. 1980, 63, 574–581. [Google Scholar] [CrossRef]
  54. Tanaka, K.; Kitahara, Y.; Ichinose, Y.; Iimura, T. Fracture analysis of single crystal manganese zinc ferrites using indentation flaws. Acta Metall. 1984, 32, 1719–1729. [Google Scholar] [CrossRef]
  55. Aronova, A.M.; Berezhkova, G.V.; Butashin, A.V.; Kaminskii, A.A. Strength and plasticity of single crystals of La3Ga5SiO14. Sov. Phys. Crystallogr. 1990, 35, 550–552. [Google Scholar]
  56. Sobolev, B.P. Lanthanum and lanthanide trifluorides: Lanthanide contraction and volume of fluorine ion. Crystallogr. Rep. 2000, 65, 175–181. [Google Scholar] [CrossRef]
  57. Schoonman, J.; Oversluizen, G.; Wapenaar, K.E.D. Solid electrolyte properties of LaF3. Solid State Ionics 1980, 1, 211–221. [Google Scholar] [CrossRef]
  58. Sorokin, N.I.; Sobolev, B.P. Anionic high-temperature conduction in single crystals of nonstoichiometric phases R1–yMyF3–y (R = La–Lu, M = Ca, Sr, Ba) with the tysonite (LaF3) structure. Russ. J. Electrochem. 2007, 43, 398–409. [Google Scholar] [CrossRef]
  59. Sinitsyn, V.V.; Lips, O.; Privalov, A.F.; Fujara, F.; Murin, I.V. Transport properties of LaF3 fast ionic conductor studied by field gradient NMR and impedance spectroscopy. J. Phys. Chem. Solids 2003, 64, 1201–1205. [Google Scholar] [CrossRef]
  60. Privalov, A.F.; Vieth, H.-M.; Murin, I.V. Nuclear magnetic resonance study of superionic conductors with tysonite structure. J. Phys. Cond. Matter 1994, 6, 8237–8243. [Google Scholar] [CrossRef]
  61. Lips, O.; Kruk, D.; Privalov, A.; Fujara, F. Simultaneous effects of relaxation and polarization transfer in LaF3-type crystals as sources of dynamic information. Solid State Nucl. Magn. Reson. 2007, 31, 141–152. [Google Scholar] [CrossRef]
  62. Fujara, F.; Kruk, D.; Lips, O.; Privalov, A.F.; Sinitsyn, V.; Stork, H. Fluorine dynamics in LaF3-type fast ionic conductors—Combined results of NMR and conductivity techniques. Solid State Ionics 2008, 179, 2350–2357. [Google Scholar] [CrossRef]
  63. Hoff, C.; Wiemhofer, H.-D.; Glumov, O.; Murin, I.V. Orientation dependence of the ionic conductivity in single crystals of lanthanum and cerium trifluoride. Solid State Ionics 1997, 101–103, 445–449. [Google Scholar] [CrossRef]
  64. Roos, A.; Aalders, A.F.; Schoonman, J.; Arts, A.F.M.; de Wijn, H.W. Electrical conduction and 19F NMR of solid solutions La1−xBaxF3−x. Solid State Ionics 1983, 9–10, 571–574. [Google Scholar] [CrossRef]
  65. Popov, P.A.; Moiseev, N.V.; Filimonova, A.V.; Fedorov, P.P.; Konyushkin, V.A.; Osiko, V.V.; Papashvili, A.G.; Smirnov, A.N.; Mironov, I.A. Thermal conductivity of LaF3–based single crystals and ceramics. Inorg. Mater. 2012, 48, 304–308. [Google Scholar] [CrossRef]
  66. Sorokin, N.I.; Karimov, D.N.; Buchinskaya, I.I.; Sobolev, B.P.; Popov, P.A. Electrical and thermal conductivities of congruently melting single crystals of isovalent M1–xM’xF2 solid solutions (M, M’  = Ca, Sr, Cd, Pb) in relation to their defect fluorite structure. Crystallogr. Rep. 2015, 60, 532–536. [Google Scholar] [CrossRef]
  67. Fedorov, P.P.; Sorokin, N.I.; Popov, P.A. Inverse correlation between the ionic and thermal conductivities of single crystals of M1–xRxF2+x (M = Ca, Ba, R—rare-earth element) fluorite solid solutions. Inorg. Mater. 2017, 53, 626–632. [Google Scholar] [CrossRef]
  68. Sorokin, N.I.; Sobolev, B.P. The intrinsic fluorine-ion conductivity of crystalline matrices of fluoride superionics: BaF2 (fluorite type) and LaF3 (tysonite type). Phys. Solid State 2018, 60, 2450–2456. [Google Scholar] [CrossRef]
  69. Aliev, A.E.; Krivorotov, V.F.; Khabibullaev, P.K. Specific heat and thermal conductivity of superionic conductors in the superionic phase. Phys. Solid State 1997, 39, 1378–1382. [Google Scholar] [CrossRef]
  70. Westrum, E.F., Jr.; Beale, A.F., Jr. Heat capacities and chemical thermodynamics of cerium (III) fluoride and cerium (IV) oxide from 5 to 300° K. J. Phys. Chem. 1961, 65, 353–355. [Google Scholar] [CrossRef]
  71. Popov, P.A.; Fedorov, P.P.; Osiko, V.V. Thermal conductivity of single crystals with a fluorite structure: Cadmium fluoride. Phys. Solid State 2010, 52, 504–508. [Google Scholar] [CrossRef]
  72. Spedding, F.H.; Beaudry, B.J.; Henderson, D.C.; Moorman, J. High temperature enthalpies and related thermodynamic functions of the trifluorides of Sc, Ce, Sm, Eu, Gd, Tb, Dy, Er, Tm, and Yb. J. Chem. Phys. 1974, 60, 1578–1588. [Google Scholar] [CrossRef]
  73. King, E.G.; Christensen, A.U. Low-Temperature Heat Capacity and High-Temperature Heat Content of Cerous Fluoride; Bureau of Mines, Report of Investigations 5510; U.S. Dept. of the Interior: Washington, DC, USA, 1959; 7p. [Google Scholar]
  74. Spedding, F.H.; Henderson, D.C. High temperature heat contents and related thermodynamic functions of seven trifluorides of the rare earths: Y, La, Pr, Nd, Gd, Ho, and Lu. J. Chem. Phys. 1971, 54, 2476–2483. [Google Scholar] [CrossRef]
  75. Lyon, W.G.; Osborne, D.W.; Flotov, H.E.; Grandjean, F. Thermodynamics of the lanthanide trifluorides. I. The heat capacity of lanthanum trifluoride, LaF3 from 5 to 350° K and enthalpies from 298 to 1477° K. J. Chem. Phys. 1978, 69, 167–173. [Google Scholar] [CrossRef]
Figure 1. Crystallographic directions and planes for the CeF3 in a hexagonal setting. The black bold line represents the (0001) unit cell projection (a = x, b = y and c = z).
Crystals 11 00793 g001
Figure 2. Appearance (a) and XRD patterns (b) of an as-grown c-oriented CeF3 single crystal. The positions of the Bragg reflection peaks for the specified fit parameters are indicated.
Crystals 11 00793 g002
Figure 3. The RT absorption spectrum of a c-axis-oriented CeF3 single crystal.
Crystals 11 00793 g003
Figure 4. Orientation dependences of Young’s modulus for the (0001) (a) and ( 10 1 ¯ 0 ) (b) planes of the CeF3 single crystal.
Crystals 11 00793 g004
Figure 5. The surfaces of Poisson’s ratio (a) and the shear modulus (b) for the CeF3 crystal depending on the two Euler angles.
Crystals 11 00793 g005
Figure 6. Schematic view of the CeF3 crystal structure parallel (a) and perpendicular (b) to the c-axis. The positions of some characteristic crystallographic planes are demonstrated.
Crystals 11 00793 g006
Figure 7. The Vickers indentation patterns of the ( 10 1 ¯ 0 ) planes of CeF3 crystal at different indenter orientations (the indenter diagonals coincide with the [0001] and [ 1 ¯ 2 1 ¯ 0 ] directions (a) and rotated by 45° relative to the [ 1 ¯ 2 1 ¯ 0 ] direction (b)) under the load P = 100 gf. Crystallographic planes corresponding to cracks are indicated.
Crystals 11 00793 g007
Figure 8. The Vickers indentation patterns of the (0001) plane of the CeF3 single crystal under the load P = 100 gf. The indenter diagonals coincide with the [ 1 ¯ 010 ] and [ 1 ¯ 2 1 ¯ 0 ] directions. Crystallographic { 1 ¯ 2 1 ¯ 0 } (a) and { 1 ¯ 010 } (b) planes corresponding to cracks are indicated.
Crystals 11 00793 g008
Figure 9. Dependence of the Berkovich microhardness HB of the (0001) plane of the CeF3 crystal on the indenter load P and typical indentation patterns for the different indenter orientations (P = 70 gf). C: linear dimensions of the crack.
Crystals 11 00793 g009
Figure 10. Temperature dependences of the ionic conductivity σdc along the crystallographic a- and c-axes (a) and tysonite unit cell (space group P 3 ¯ c 1 ) of the CeF3 single crystal (b). Polyhedra for the Ce3+ cations (CeF11) and the different F sites are presented.
Crystals 11 00793 g010
Figure 11. Temperature dependences of the thermal conductivity of the undoped CeF3 and LaF3 [65] crystals in different crystallographic directions (a) and the anisotropy coefficient K of the thermal conductivity of the CeF3 single crystals (b).
Crystals 11 00793 g011
Figure 12. Temperature dependences of the mean free path of phonons l(T) along the c-axis (a), and the heat capacity Cp(T) of the CeF3 and LaF3 single crystals (b).
Crystals 11 00793 g012
Table 1. The Vickers microhardness anisotropy for the undoped CeF3 single crystal under the load P = 60 gf.
PlaneOrientation of
Indenter Diagonals
HV, GPaAnisotropy Coefficient
KI = HV max/ HV min
( 0001 ) [ 1 ¯ 010 ] , [ 1 ¯ 2 1 ¯ 0 ] 2.91.00
( 10 1 ¯ 0 ) [ 0001 ] , [ 1 ¯ 2 1 ¯ 0 ]
[ 0001 ]
[ 1 ¯ 2 1 ¯ 0 ]
2.3
2.8
2.1
1.33
Table 2. Parameters of the calculated static bulk conductivity of CeF3 single crystals in different crystallographic directions for low- (300–355 K) and high (545–600 K)-temperature ranges.
Parameters a - Axis   [ 2 1 ¯ 1 ¯ 0 ] c - Axis   [ 0001 ]
LT RegionHT RegionLT RegionHT Region
A, SK/cm9.8 × 103561.5 × 104 59
Hσ, eV0.450.260.44 0.22
σdc, S/cm8.0 × 10−7
(300 K)
5.7 × 10⁻⁴
(600 K)
2.7 × 10⁻⁶
(300 K)
1.2 × 10⁻³
(600 K)
Table 3. The anisotropy of ionic conductivity in selected fluoride crystals with a tysonite-type structure.
CompositionT, KAnisotropy
Coefficient σ||cc
σ||c, S/cmReference
LaF3300
500
2.0
1.6
1.0 × 10⁻⁶
1.5 × 10⁻³
[57]
[63]
CeF3300
500
3.4
2.4
2.7 × 10⁻⁶
5.6 × 10⁻⁴
Present work
La0.896Ba0.104F2.8965001.01.0 × 10−2[64]
Ce0.92Sr0.08F2.923201.06.0 × 10−4[58]
Table 4. The thermal conductivity values (W·m−1·K−1) of an undoped CeF3 single crystal at different temperatures.
Direction50 K100 K300 K
c-axis [ 0001 ] 13.60 ± 0.704.82 ± 0.242.51 ± 0.12
1.74 [10]
a-axis [ 2 1 ¯ 1 ¯ 0 ] 7.35 ± 0.373.13 ± 0.161.92 ± 0.09
Publisher’s Note: MDPI stays neutral with regard to jurisdictional claims in published maps and institutional affiliations.

