Article

Optimization of Ammonia Oxidation Using Response Surface Methodology

New Chemical Syntheses Institute, Al. Tysiąclecia Państwa Polskiego 13a, 24-100 Puławy, Poland
*
Author to whom correspondence should be addressed.
Catalysts 2019, 9(3), 249; https://doi.org/10.3390/catal9030249
Submission received: 22 December 2018 / Revised: 14 February 2019 / Accepted: 4 March 2019 / Published: 9 March 2019
(This article belongs to the Special Issue Emissions Control Catalysis)

Abstract

:
In this paper, the design of experiments and response surface methodology were proposed to study ammonia oxidation process. The following independent variables were selected: the reactor’s load, the temperature of reaction and the number of catalytic gauzes, whereas ammonia oxidation efficiency and N2O concentration in nitrous gases were assumed as dependent variables (response). Based on the achieved results, statistically significant mathematical models were developed which describe the effect of independent variables on the analysed responses. In case of ammonia oxidation efficiency, its achieved value depends on the reactor’s load and the number of catalytic gauzes, whereas the temperature in the studied range (870–910 °C) has no effect on this dependent variable. The concentration of nitrous oxide in nitrous gases depends on all three parameters. The developed models were used for the multi-criteria optimization with the application of desirability function. Sets of parameters were achieved for which optimization assumptions were met: maximization of ammonia oxidation efficiency and minimization of the N2O amount being formed in the reaction.

Graphical Abstract

1. Introduction

Nitric acid is mainly used for producing nitrogen fertilizers: ammonium nitrate (AN) and calcium ammonium nitrate (CAN) which constitute 75–80% of its entire production. The remaining amount of nitric acid is used in other industrial applications for example as a nitration agent for the production of explosives and other semi-organic products (aliphatic nitro compounds and aromatic nitro compounds) for the production of adipic acid, for metallurgy (etching steel) [1].
The industrial production of nitric acid is based on Ostwald process [1] which involves three basic stages: the catalytic oxidation of ammonia to nitrogen oxide (NO) with the use of oxygen from air, oxidation of nitrogen oxide (NO) to nitrogen dioxide (NO2) and absorption of nitrogen oxides in water with the formation of HNO3.
Ammonia consumption depends on the selectivity of the applied ammonia oxidation catalyst and on the process conditions. Among numerous catalysts [2,3,4,5,6,7,8], packages of gauzes made of noble metal alloys such as platinum and rhodium are most commonly applied in industrial practice [7,8,9,10]. Properly selected catalyst package allows to obtain ammonia conversion to main product (NO) in the range of 90–98% depending mainly on oxidation pressure [1,7,8]. Oxidation pressure has an inversely proportional effect on ammonia oxidation efficiency. In order to alleviate this effect, the temperature of reaction should be higher. However, this leads to the increased platinum losses and as a consequence, shortens the lifetime of the catalytic gauzes. For example, platinum losses are six times higher after increasing the temperature of reaction from 820 to 920 °C [1,2]. Therefore, both these aspects should be taken into account to determine the temperature of reaction.
The application of medium pressure in the oxidation unit (0.35–0.55 MPa) and high pressure in the absorption unit (0.8–1.5 MPa) is optimal for specific ammonia consumption and efficient energy use. Therefore, modern nitric acid plants are dual-pressure ones. The average pressure in the oxidation unit is a kind of trade-off between the capacity that is possible to achieve per 1 m2 of catalytic gauzes, oxidation efficiency, number of gauzes in package, lifetime of gauzes and noble metals losses during exploitation [1,2].
In the context of global warming and climate changes, a very important issue related to ammonia oxidation process is the amount of the by-product formed that is nitrous oxide (N2O). In Kyoto Protocol, N2O was qualified as a greenhouse gas with a very high global warming potential, about 300 times higher than CO2 [11]. At room temperature, N2O is a colourless, non-flammable gas with a delicate pleasant smell and sweet taste [12]. Since it was isolated at the end of 17th century and because of its pain-relieving and anaesthetic properties, it has been widely applied in dentistry and surgery. Currently, due to some concerns, there is an ongoing discussion on its safe use which has the effect of decreasing the N2O application in medicine [12,13]. At the same time, the increasing trend of its use for recreational purposes is observed. Inhaling the ‘laughing gas’ causes euphoria and hallucinations [13].
Microbial nitrification and de-nitrification in land and aqueous eco-systems are the natural sources of N2O in environment. The anthropogenic sources are cultivated soils fertilized intensely with nitrogen fertilizers and industrial processes such as burning fossil fuels and biomass as well as the production of adipic acid and nitric acid with the last one being regarded as the biggest source of N2O in the chemical industry [14,15]. Nitrous oxide formed in nitric acid plant does not undergo any conversions and it is released to atmosphere. Currently, the emission of this gas is monitored and industry is obliged to reduce it. Pursuant to BAT requirements, concentration of this gas in outlet gases cannot exceed 20–300 ppm depending on the type of nitric acid plants [16,17]. However, due to the battle against climate change and global warming, further restrictions in emission limits can be expected.
There are several methods of limiting N2O emissions from nitric acid plants [14]. Generally, they can be classified as primary and secondary methods. Primary methods involve preventing the formation of N2O during ammonia oxidation. They include modification of catalytic gauzes (so-called low-emissions systems) and parameters optimization of ammonia oxidation process. Secondary methods involve the removal of N2O. At the temperature over 800 °C, thermal decomposition of N2O occurs but the efficient decomposition requires ensuring adequately long residence time at high temperatures [14,15].
The achievement of low level of N2O emissions requires the application of the catalytic methods such as high temperature N2O decomposition from nitrous gases, low- or middle temperature N2O decomposition or reduction from tail gases. High temperature method is more common. In some cases, the combination of primary method (application of modified catalytic gauzes packages and/or optimization of ammonia oxidation parameters) and high temperature N2O decomposition ensures meeting the emission standards.
Optimization of production process requires extensive knowledge and understanding the effect of particular parameters on the process. Until recently, the most commonly applied approach of researchers to study simple and complex processes was ‘one-factor-at-a-time’ (OFAT), which is time consuming and ineffective method for processes with multiple complicated dependencies between parameters. Over the last years, mathematical and statistical methods for design of experiments and parameters optimization have been applied more frequently [18]. Because of its usability, this method is applied for the design, improvement and optimization of production processes and products [19,20,21]. It is a widely applied method in research of various processes [22,23,24,25,26,27] and approx. 50% of all applications is in medicine, engineering, biochemistry, physics and computer science [
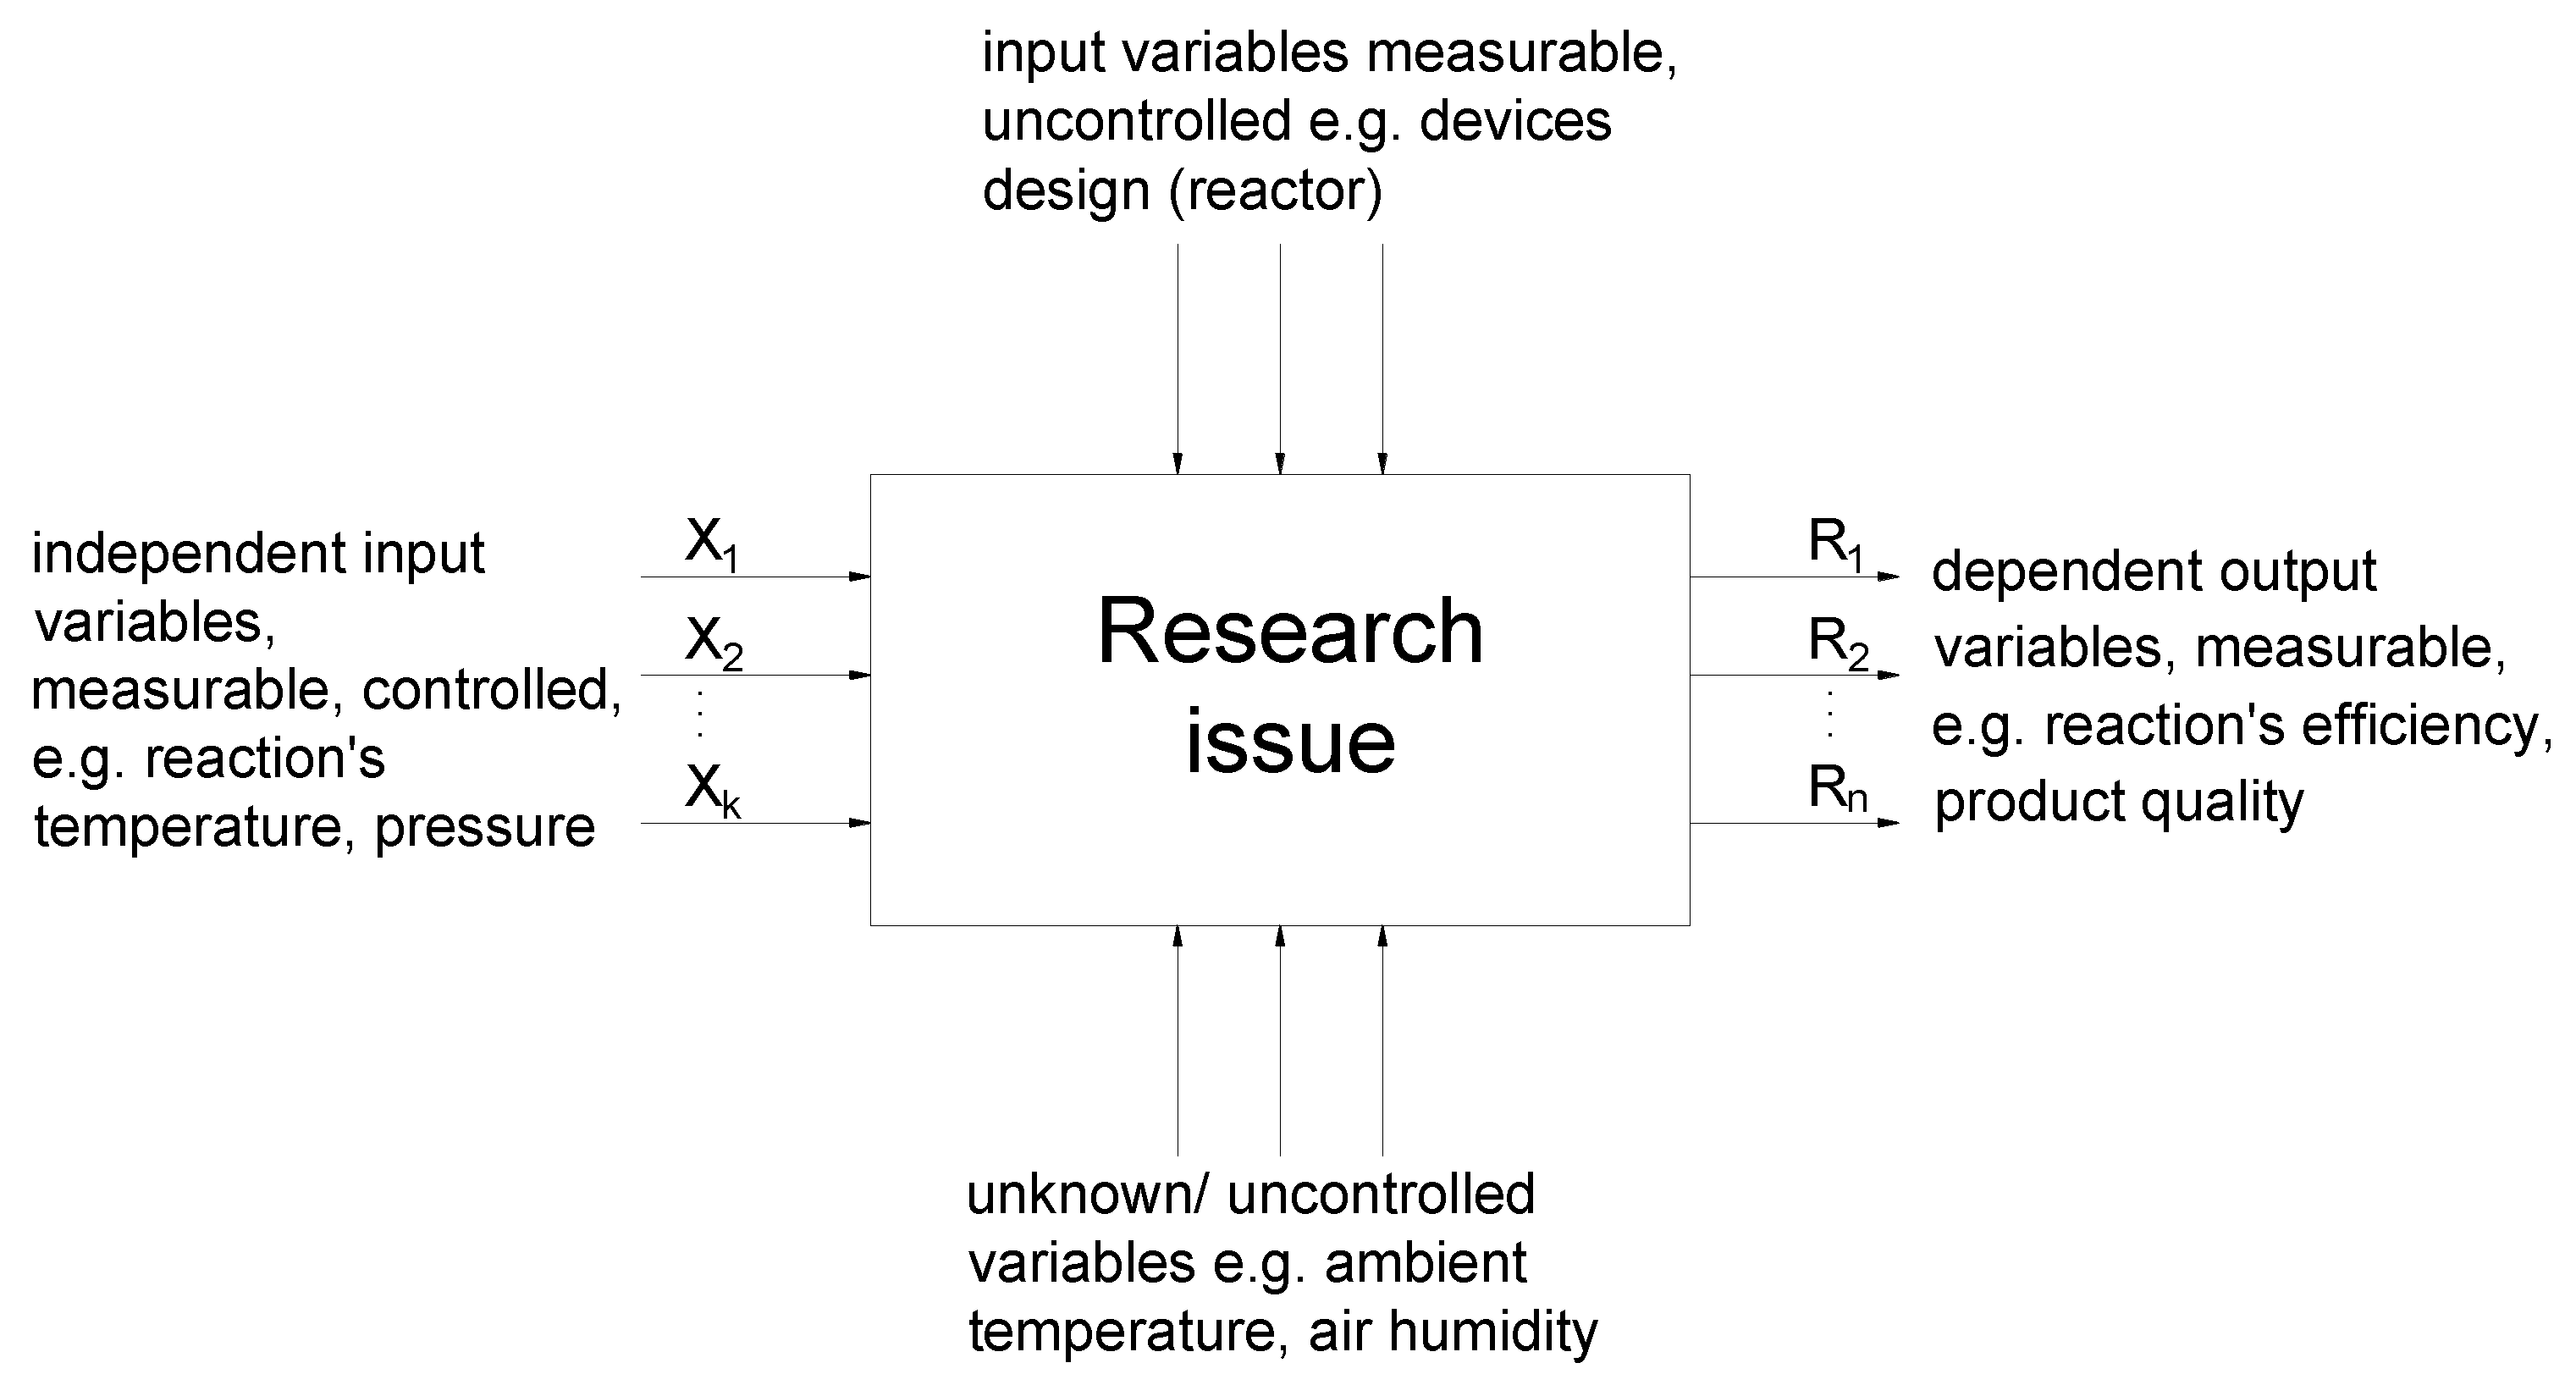
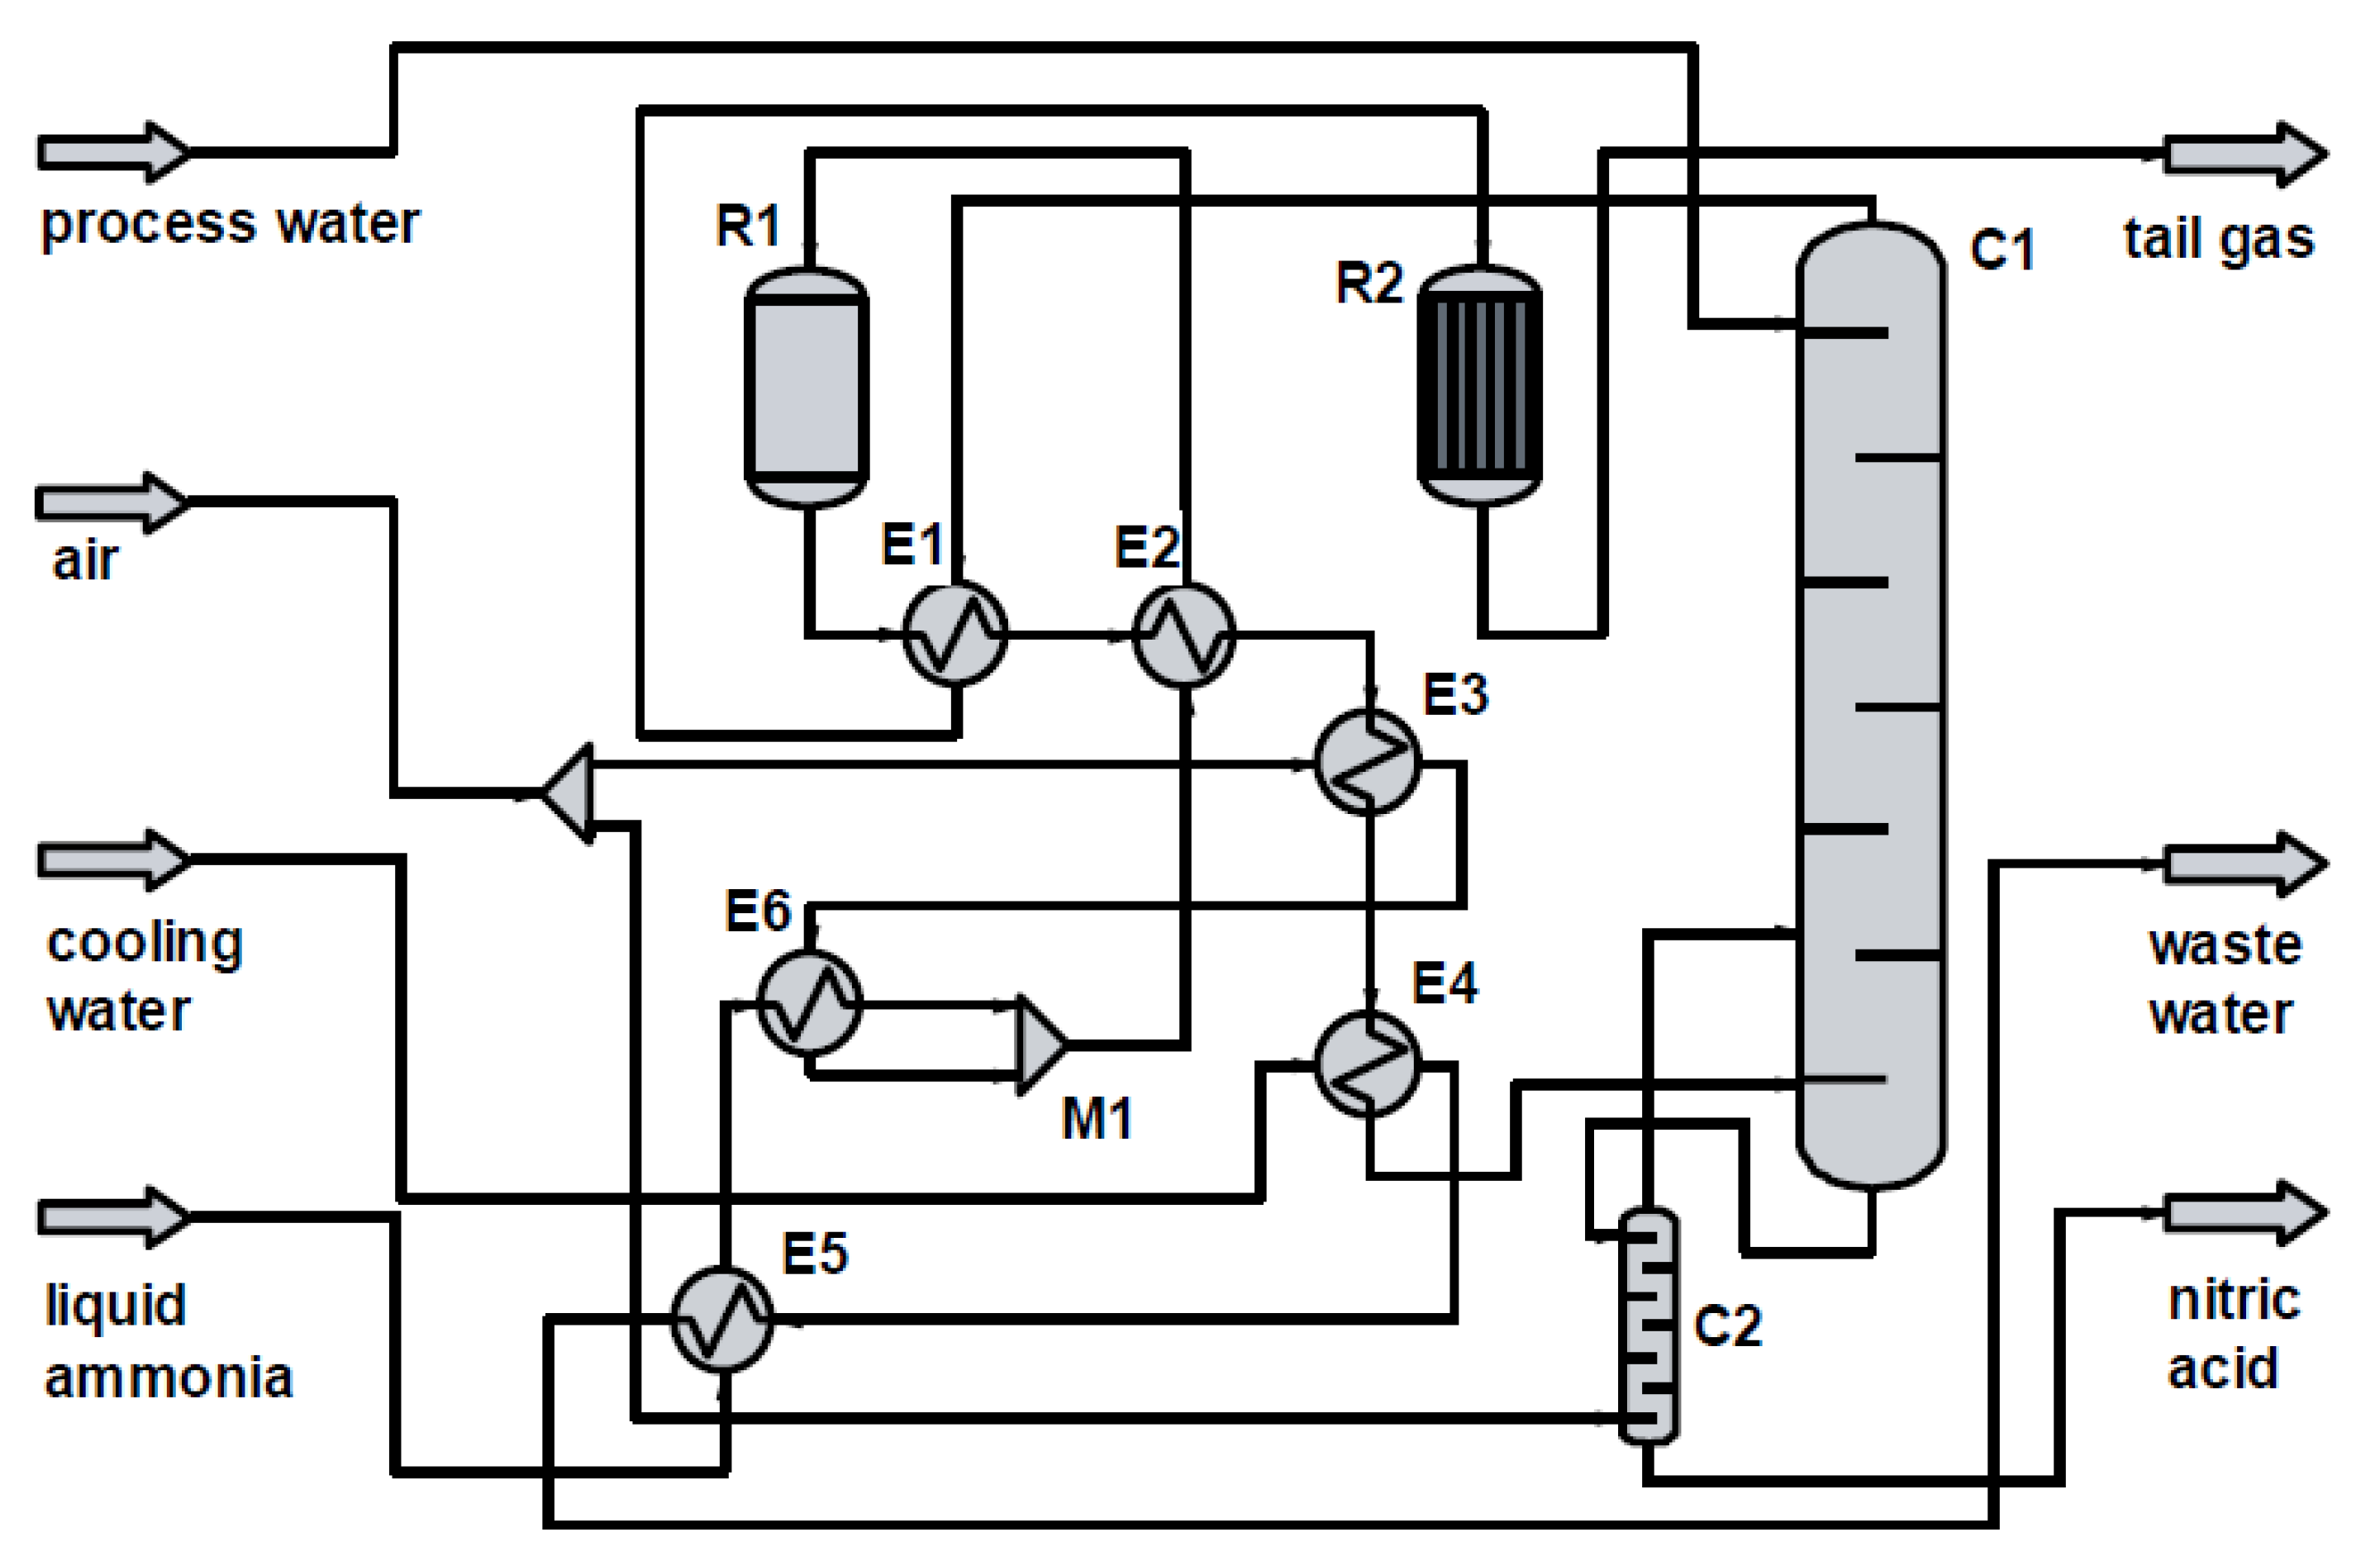
28]. In this method, reaction kinetics equations and process mechanism are not taken into account and they are regarded as a ‘black-box’ [29] (Figure 1).
The choice of experiment plan depends mainly on the issue which is the subject matter of investigations as well as on objectives which are set. The most commonly applied experiments plans include: full or fractional factorial, Plackett-Burman, central composite, Box-Behnken and Taguchi designs.
As a result of modelling of the data obtained, empirical equations with statistically significant importance are received which describe the effect of process variables (independent variables) on the process result (response variable).
Desirability function (DF) can be applied in search for optimal operational parameters. The method proposed by Derringer and Suich [18] involves the construction response surface model and then finding the values of independent variables which ensure the most desirable value. The objective of the presented studies was the analysis of the impact of reactor’s operational parameters on ammonia oxidation reaction. To the best of our knowledge, the approach presented here to describe ammonia oxidation process is published for the first time.

2. Results and Discussion

2.1. Design of Experiments

Ammonia oxidation reaction depends on a few process variables. In this study, the effect of the reactor’s load (X1), the temperature of nitrous gas specifying the temperature of reaction (X2) and the number of catalytic gauzes (X3) on ammonia oxidation reaction was investigated. The oxidation efficiency of NH3 to NO (R1) and N2O concentration in nitrous gases (R2) were selected as measures for ammonia oxidation reaction. The matrix of 15 experiments including particular levels of coded variables and achieved values of response variables R1 and R2 are presented in Table 1. In the regarded experimental area of independent variables, ammonia oxidation efficiency ranged from 91.4% to 96.4%, whereas N2O concentration in nitrous gases ranged from 1011 to 1762 ppm.

2.2. Model Fitting

The first task was to find out which equation would allow to obtain the best correlation between independent variables and responses. Analysis of Variance (ANOVA) was carried out for most frequently applied equations: linear, two-factor interaction (2FI), quadratic and cubic. Table 2 includes the summary statistics of both responses for different mathematical equations.
Based on the achieved results, it was found that the experimental data is described best with quadratic and cubic equations. For both responses, high values of R2 and adjusted R2 were achieved. The number of conducted experiments caused that the cubic model was aliased. It means that the experimental matrix contains an insufficient number of experimental points for independent estimation of all effects for these models. Therefore, quadratic equation was selected for further analysis.
The statistical significance of these equations and their particular terms was specified based on Analysis of Variance (ANOVA). Results of this analysis are presented in Table 3 and Table 4, for response variables R1 and R2 respectively. Large F-value indicates that most changes of independent variable can be explained with the developed regression equation. The correlated probability p-value is used to estimate whether F-value is large enough to show statistical significance.
The probability p-value for the achieved model of variable R1 is 0.0001. It means that the model is statistically significant but some terms of equation are statistically not significant. Coefficients: R2, adjusted R2 and predicted R2 are very high: 0.9908, 0.9744 and 0.8577, respectively. There is also high compliance between coefficients: predicted R2 and adjusted R2 (difference <0.2). The achievement of statistically significant value lack of fit (0.0256) is the incompliance of this model as this parameter should be statistically not significant.
In case of response variable R2, the probability p-value (0.0012) indicates that the assumed quadratic equation is statistically significant but some of its terms are statistically not significant. High coefficients R2, adjusted R2 and predicted R2 are also achieved for the second response variable and they are: 0.9784, 0.9396 and 0.6574, respectively. However, the difference between predicted R2 and adjusted R2 is larger than the recommended one (>0.2). This may demonstrate a large block effect or problems with model or data. This model is also characteristic of statistically significant parameter lack of fit (p = 0.0119).
At a further stage of analysis, statistically not significant terms of initial equation were eliminated from the analysis. The reduction was made using step-by-step method (from the most insignificant term). For both these response variables, only statistically significant terms were left and higher R2, adjusted R2 and predicted R2 coefficients were achieved. Results of Analysis of Variance (ANOVA) are presented in Table 5 and Table 6.
The obtained mathematical model for response R1 is highly significant (p-value < 0.0001). The dependence on linear terms X1, X3, interaction X1X3 and quadratic term X32 are significant. High determination coefficients are obtained l (R2 = 0.9835, adjusted R2 = 0.9768, predicted R2 = 0.9550).
The final model is presented in Equation (1).
R   =   96.04 0.4125 X 1   +   1.88 X 3   +   0.575 X 1 X 3 1.72 X 3 2
The obtained mathematical model for response R2 is highly significant (p-value < 0.0001). The dependence on linear terms X1, X2, X3 and quadratic term X32 are significant. High determination coefficients (R2 = 0.9513, adjusted R2 = 0.9318, predicted R2 = 0.8743) were achieved for the model. The final model is presented in Equation (2).
R   =   1260   +   60.37 X 1 217.75 X 2 100.88 X 3   +   123.37 X 3 2

2.3. Model Diagnostics

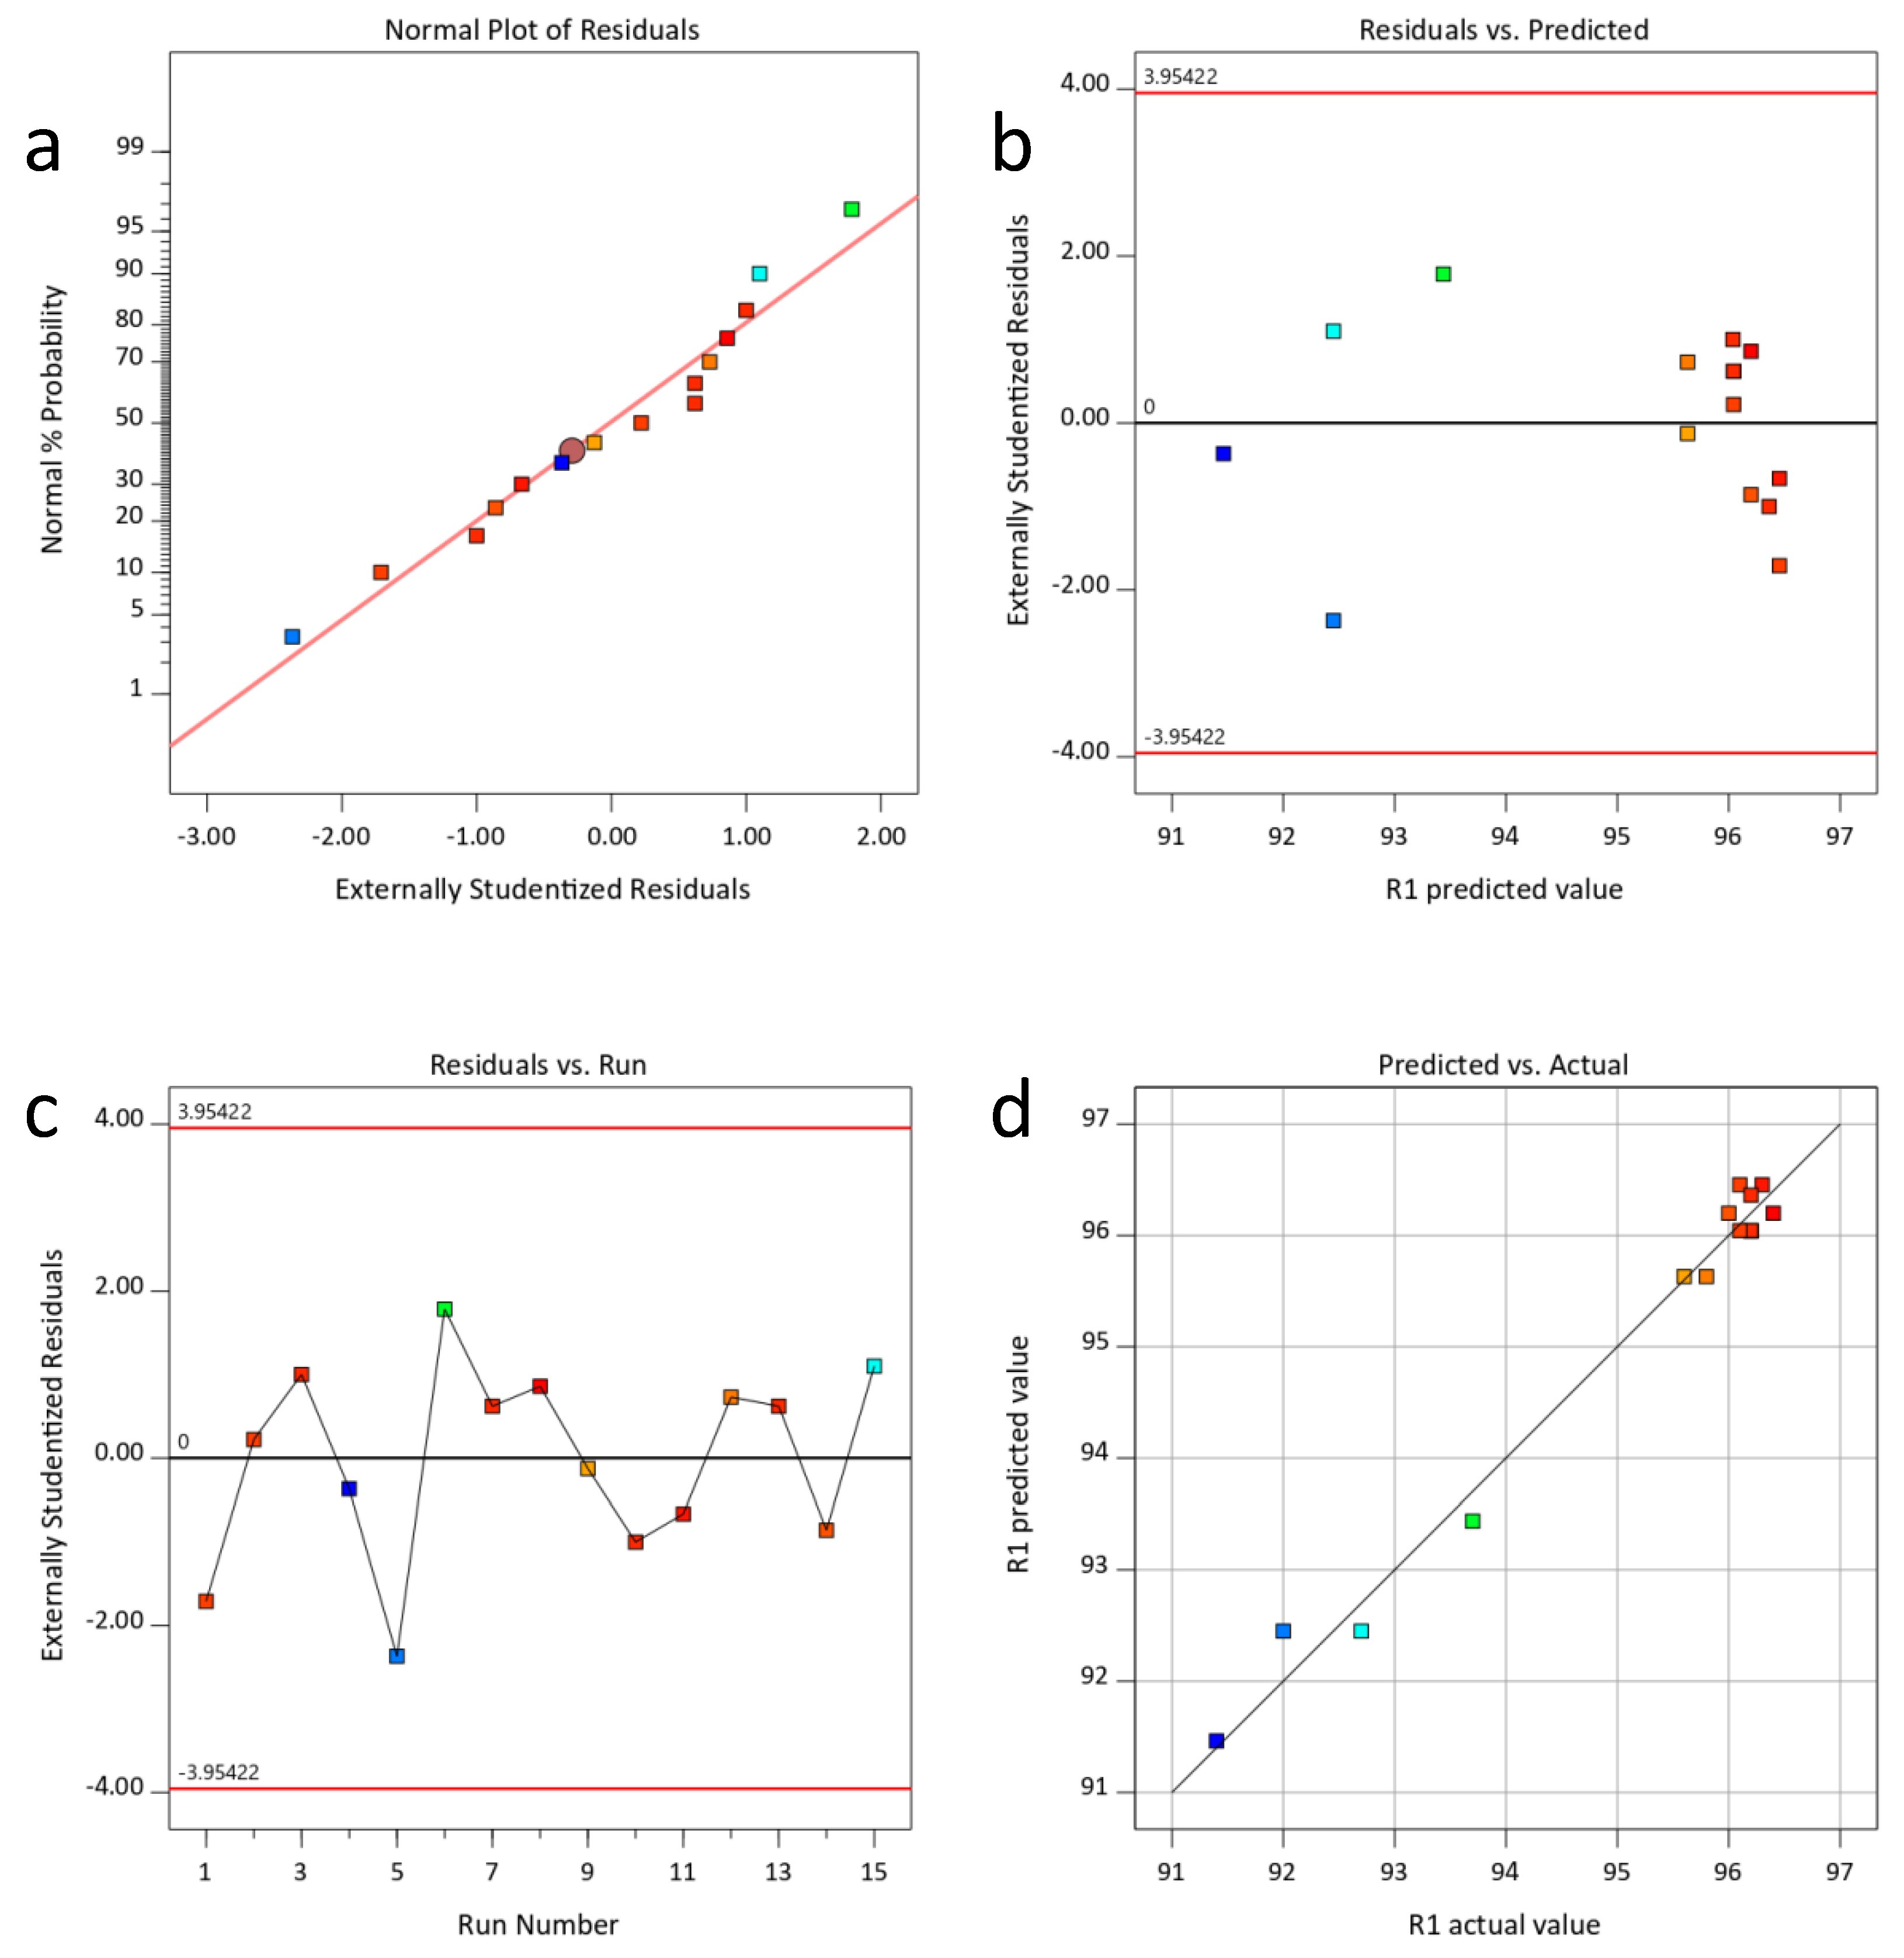
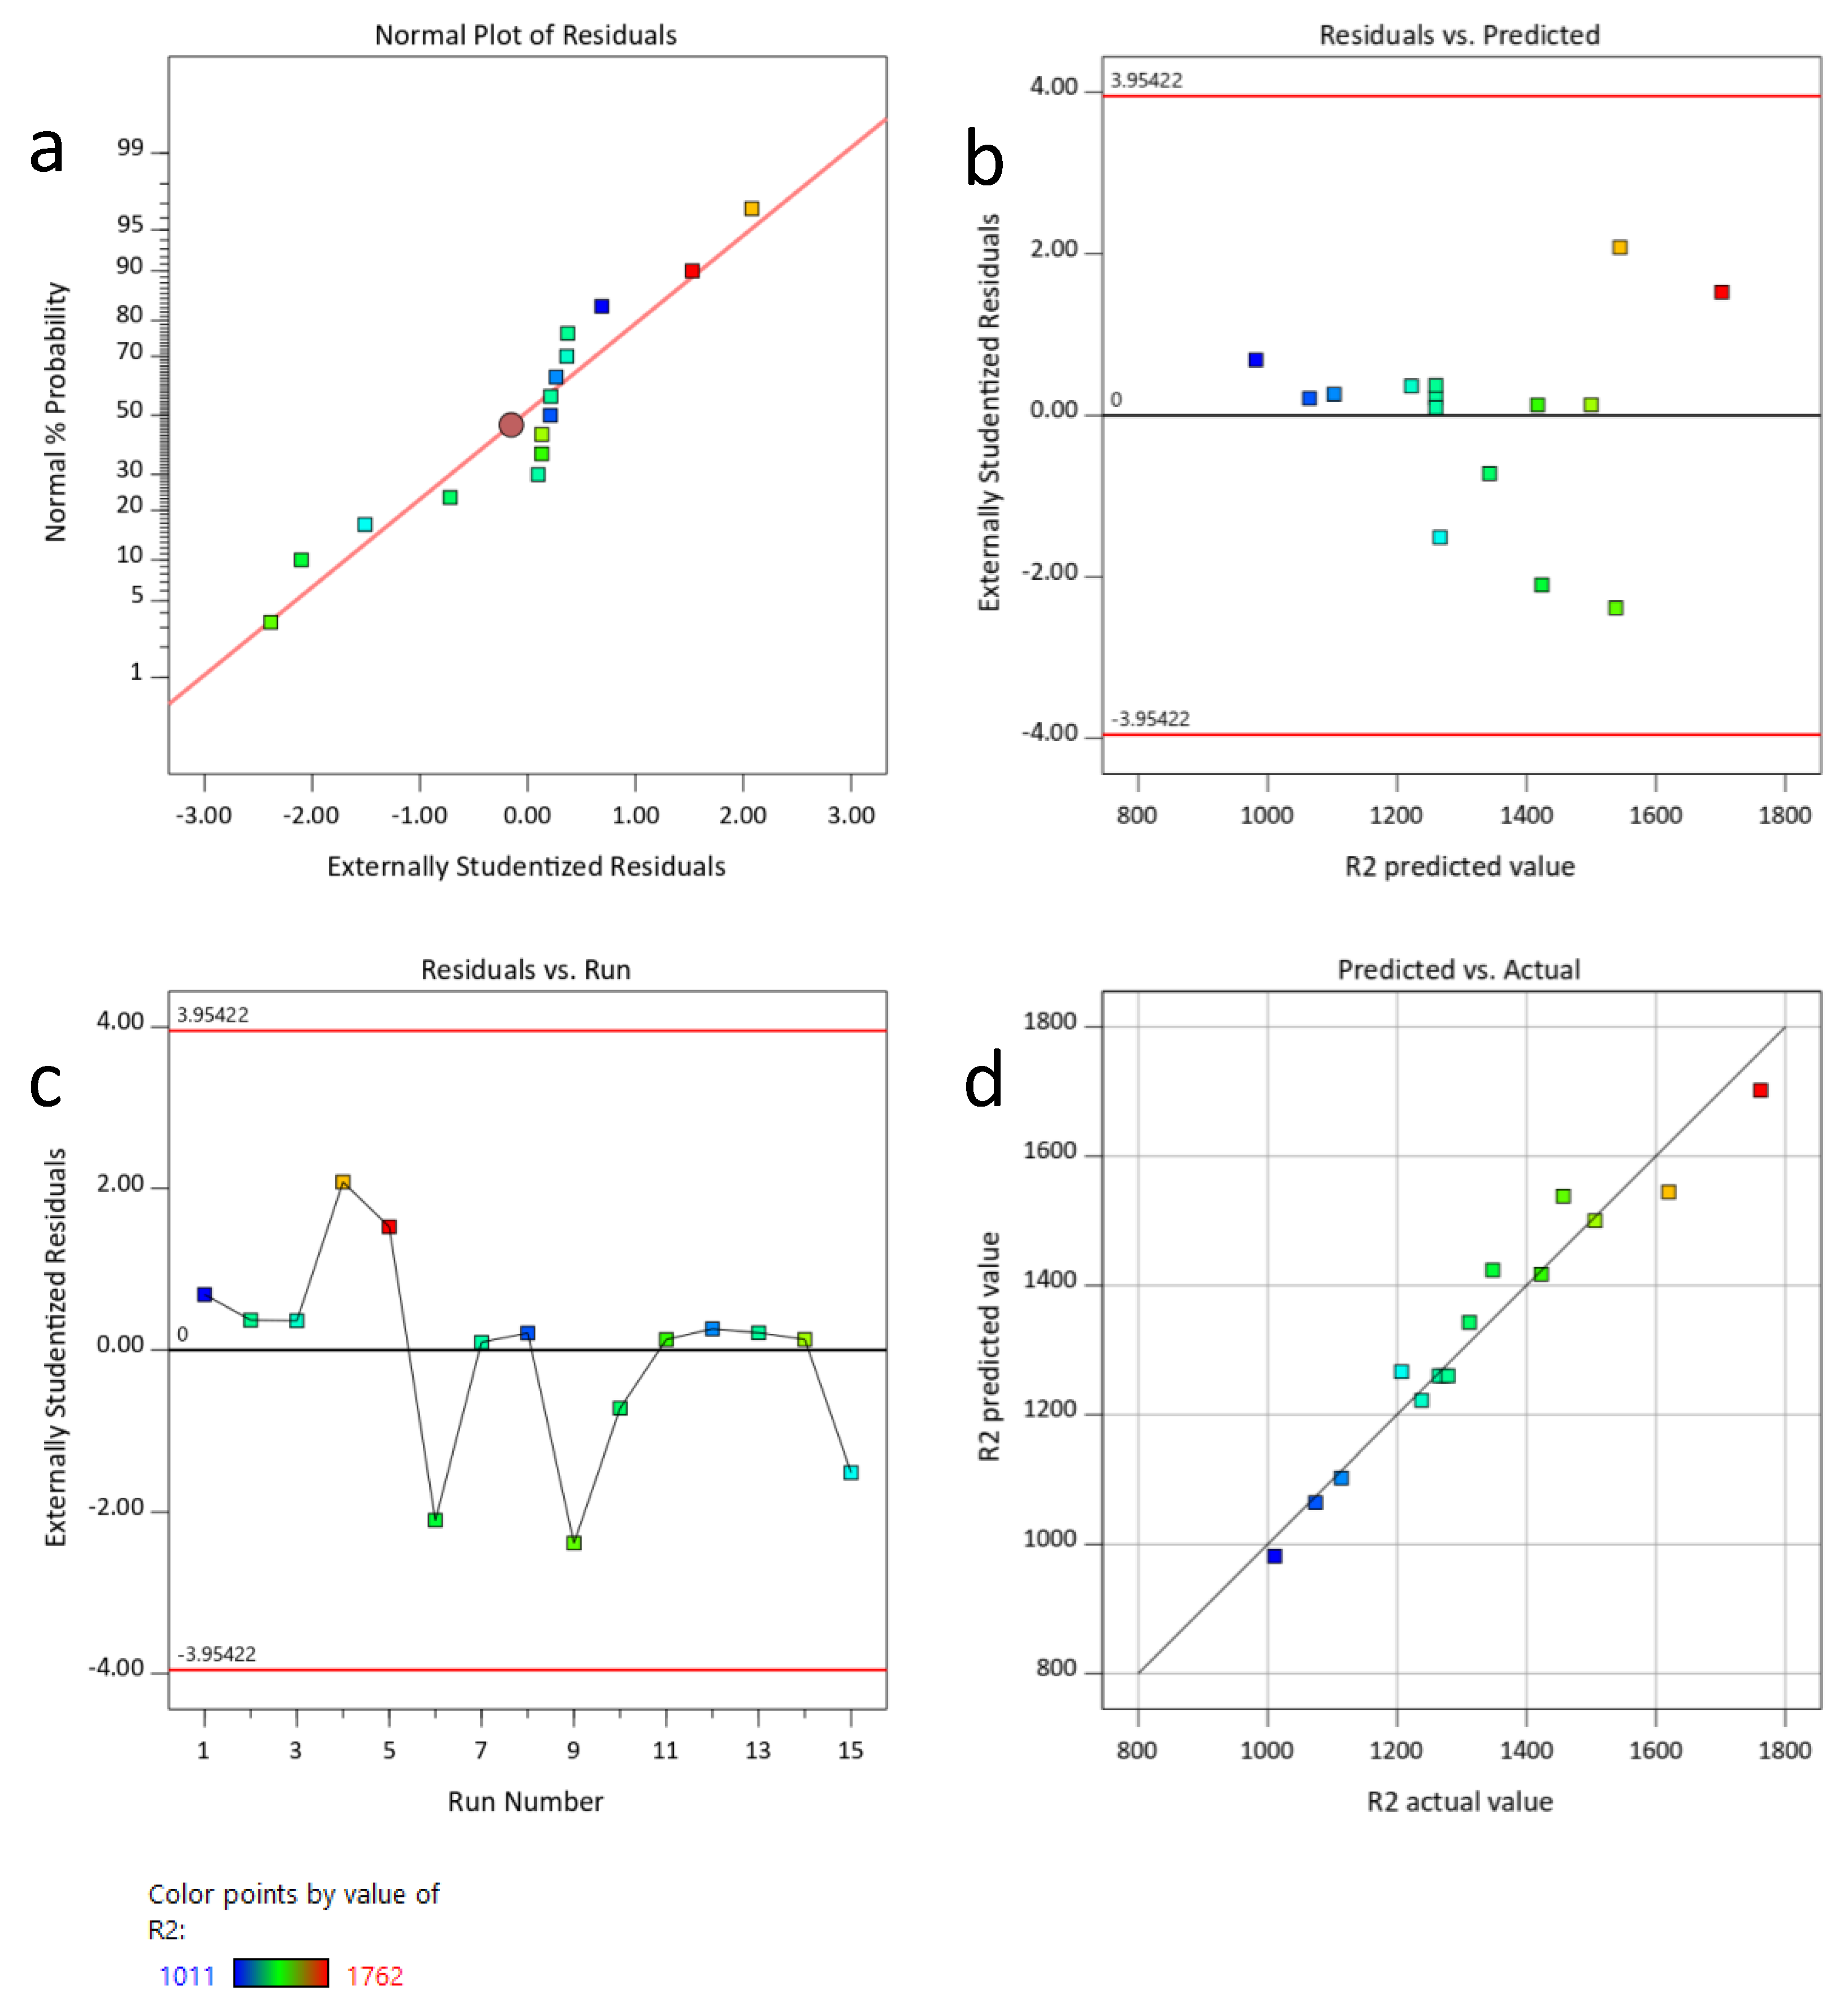
Before the process optimization, the model diagnostics for both equations was performed because of occurrence of statistically significant Lack of fit parameter. Results of model diagnostics: a normal probability of the residuals, residuals analysis and actual data versus predicted values plots were analysed.
Figure 2 presents model diagnostics for response variable R1, whereas Figure 3 presents model diagnostics for response variable R2. Normal plot of studentised residuals should be approximately a straight line, whereas studentised residuals versus predicted response values and versus run should be a random scatter. Points in plots of real response values with reference to predicted response values line up accurately along the axis at the angle of 45°.
These diagnostics show that despite the fact that Lack of fit parameter is statistically significant, experimental and predicted points for both equations correlate well with each other.

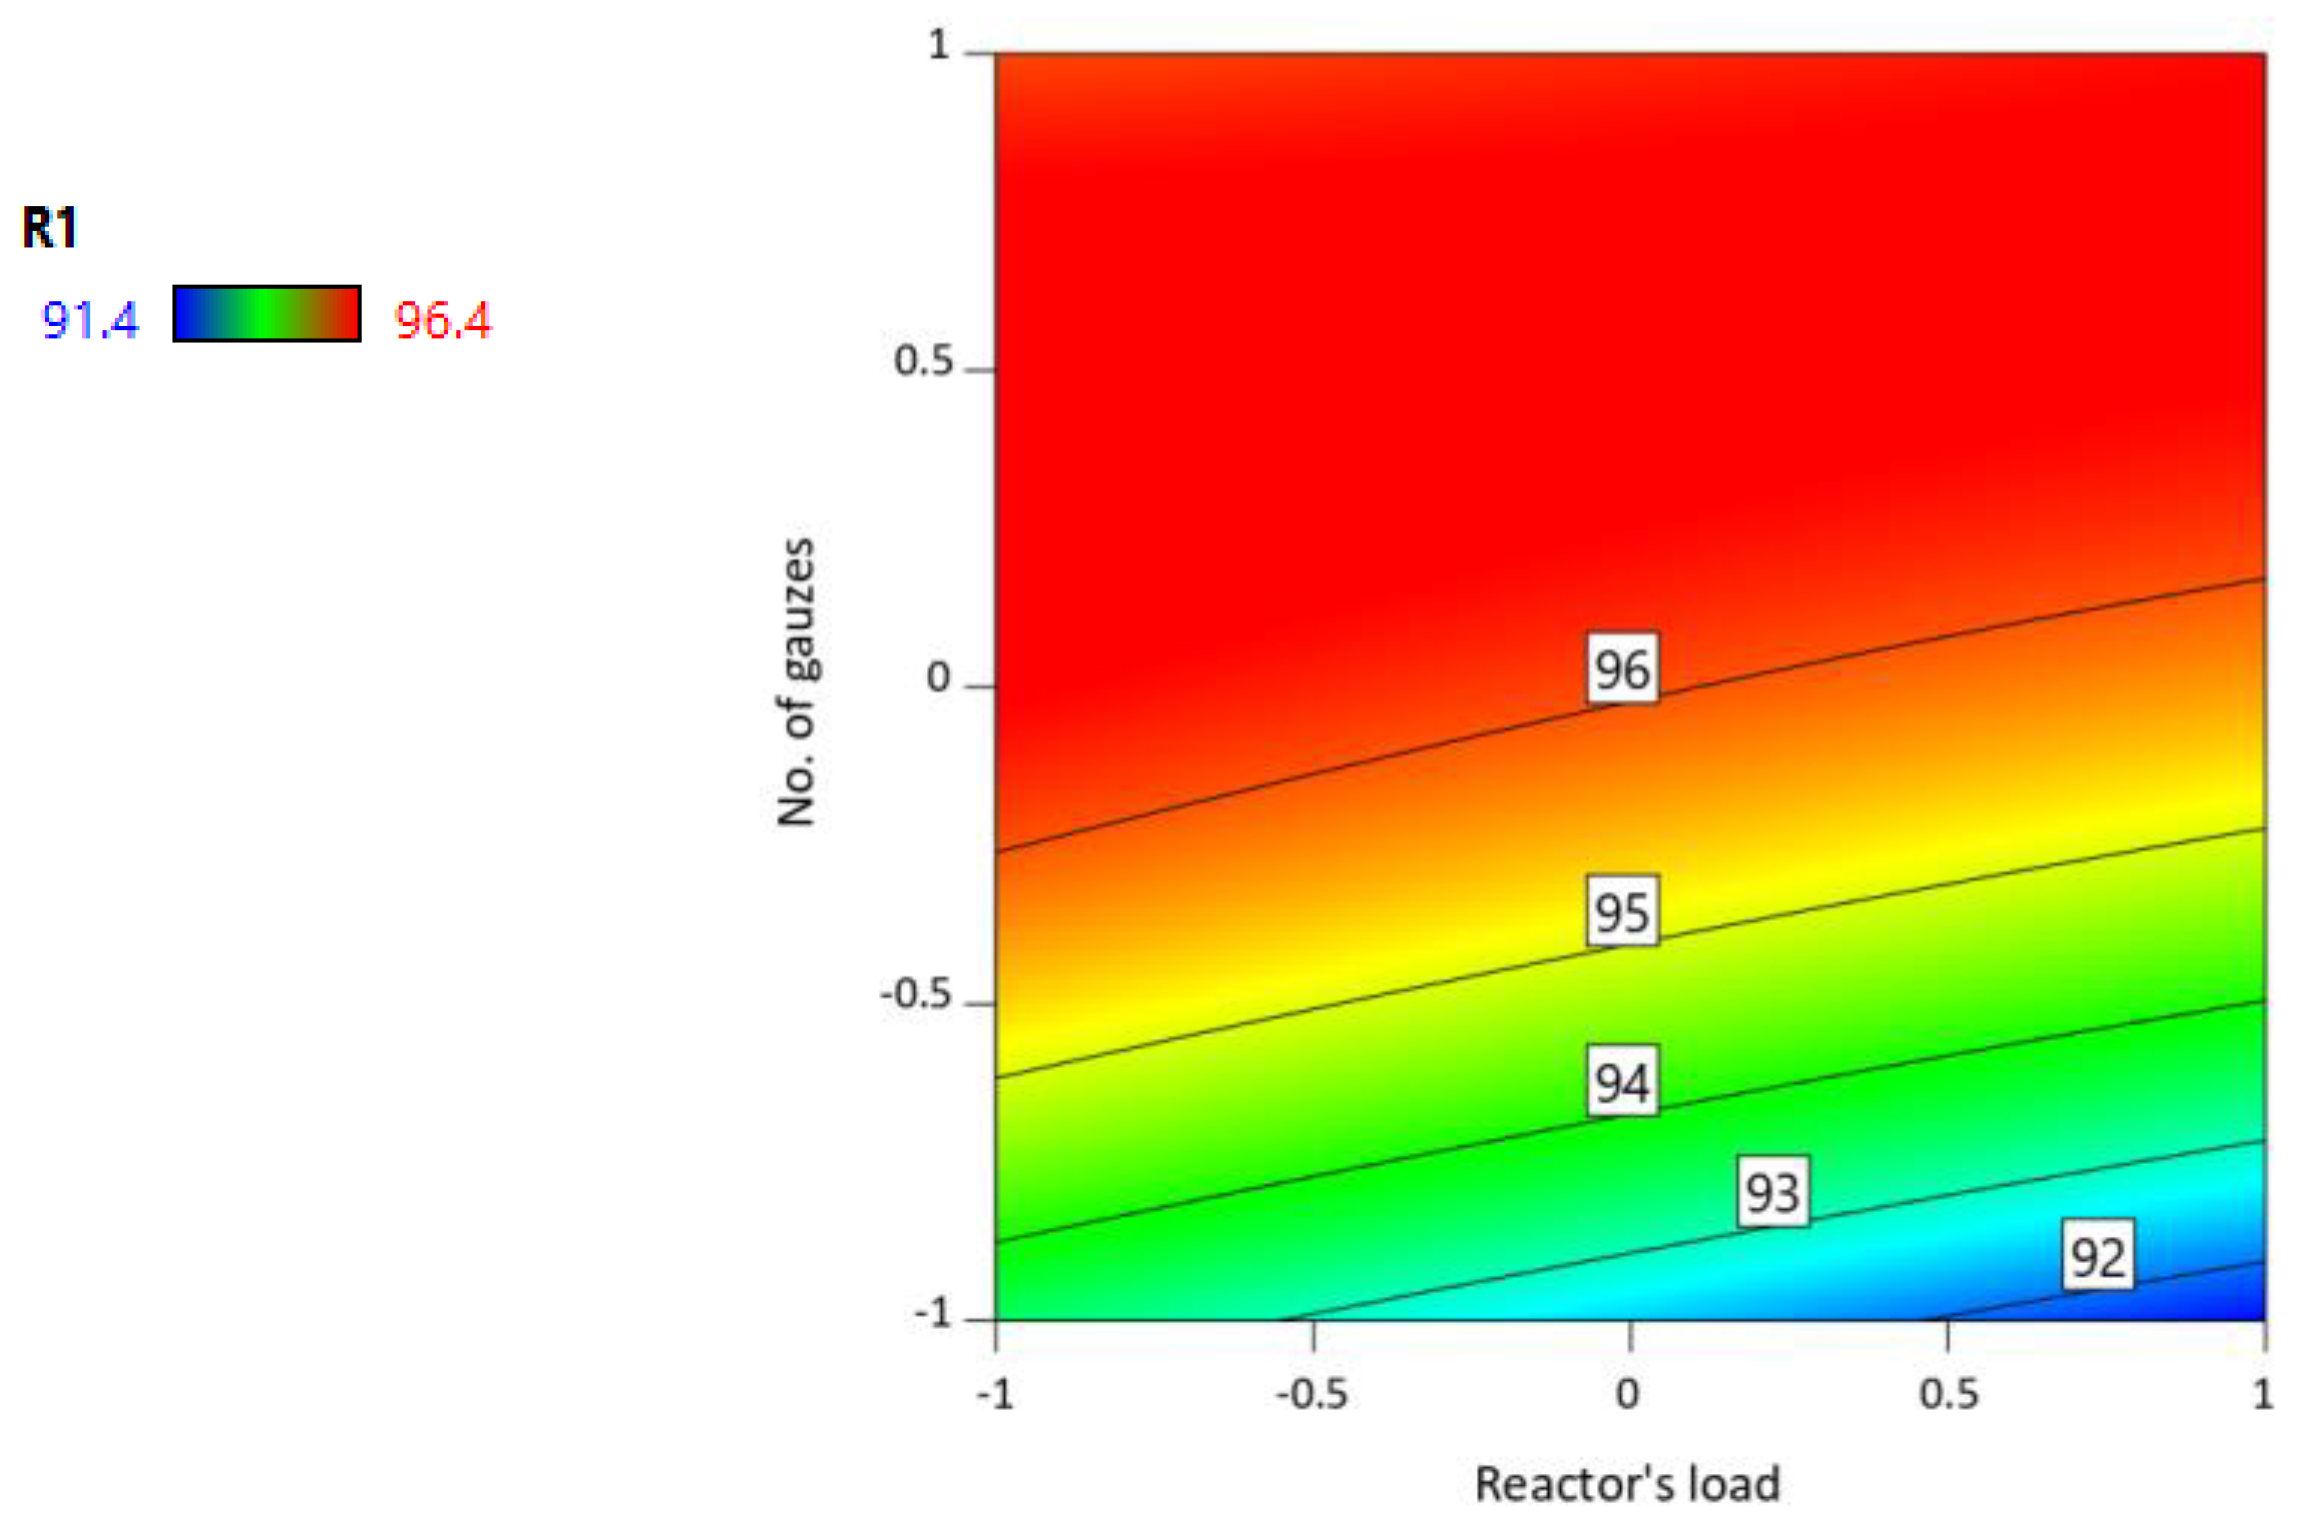
2.4. The Effect of Independent Variables

In case of response variable R1 (ammonia oxidation efficiency), the mathematical model shows a strong linear effect of the reactor’s load (X1) and the number of catalytic gauzes (X3) and interaction between these two variables (X1X3) and the quadratic term number of catalytic gauzes (X32) on the achieved response variable. The temperature of reaction in the studied range does not affect the ammonia oxidation efficiency. The effect of X1 and X3 on response R1 were shown as contour plot (Figure 4). According to the presented plot of variable of R1, a small number of catalytic gauzes causes lower ammonia oxidation efficiency for the entire range of studies reactor’s load. The increase in the number of catalytic gauzes to X3 = 0 causes increase in oxidation efficiency within the entire range of studied reactor’s load.
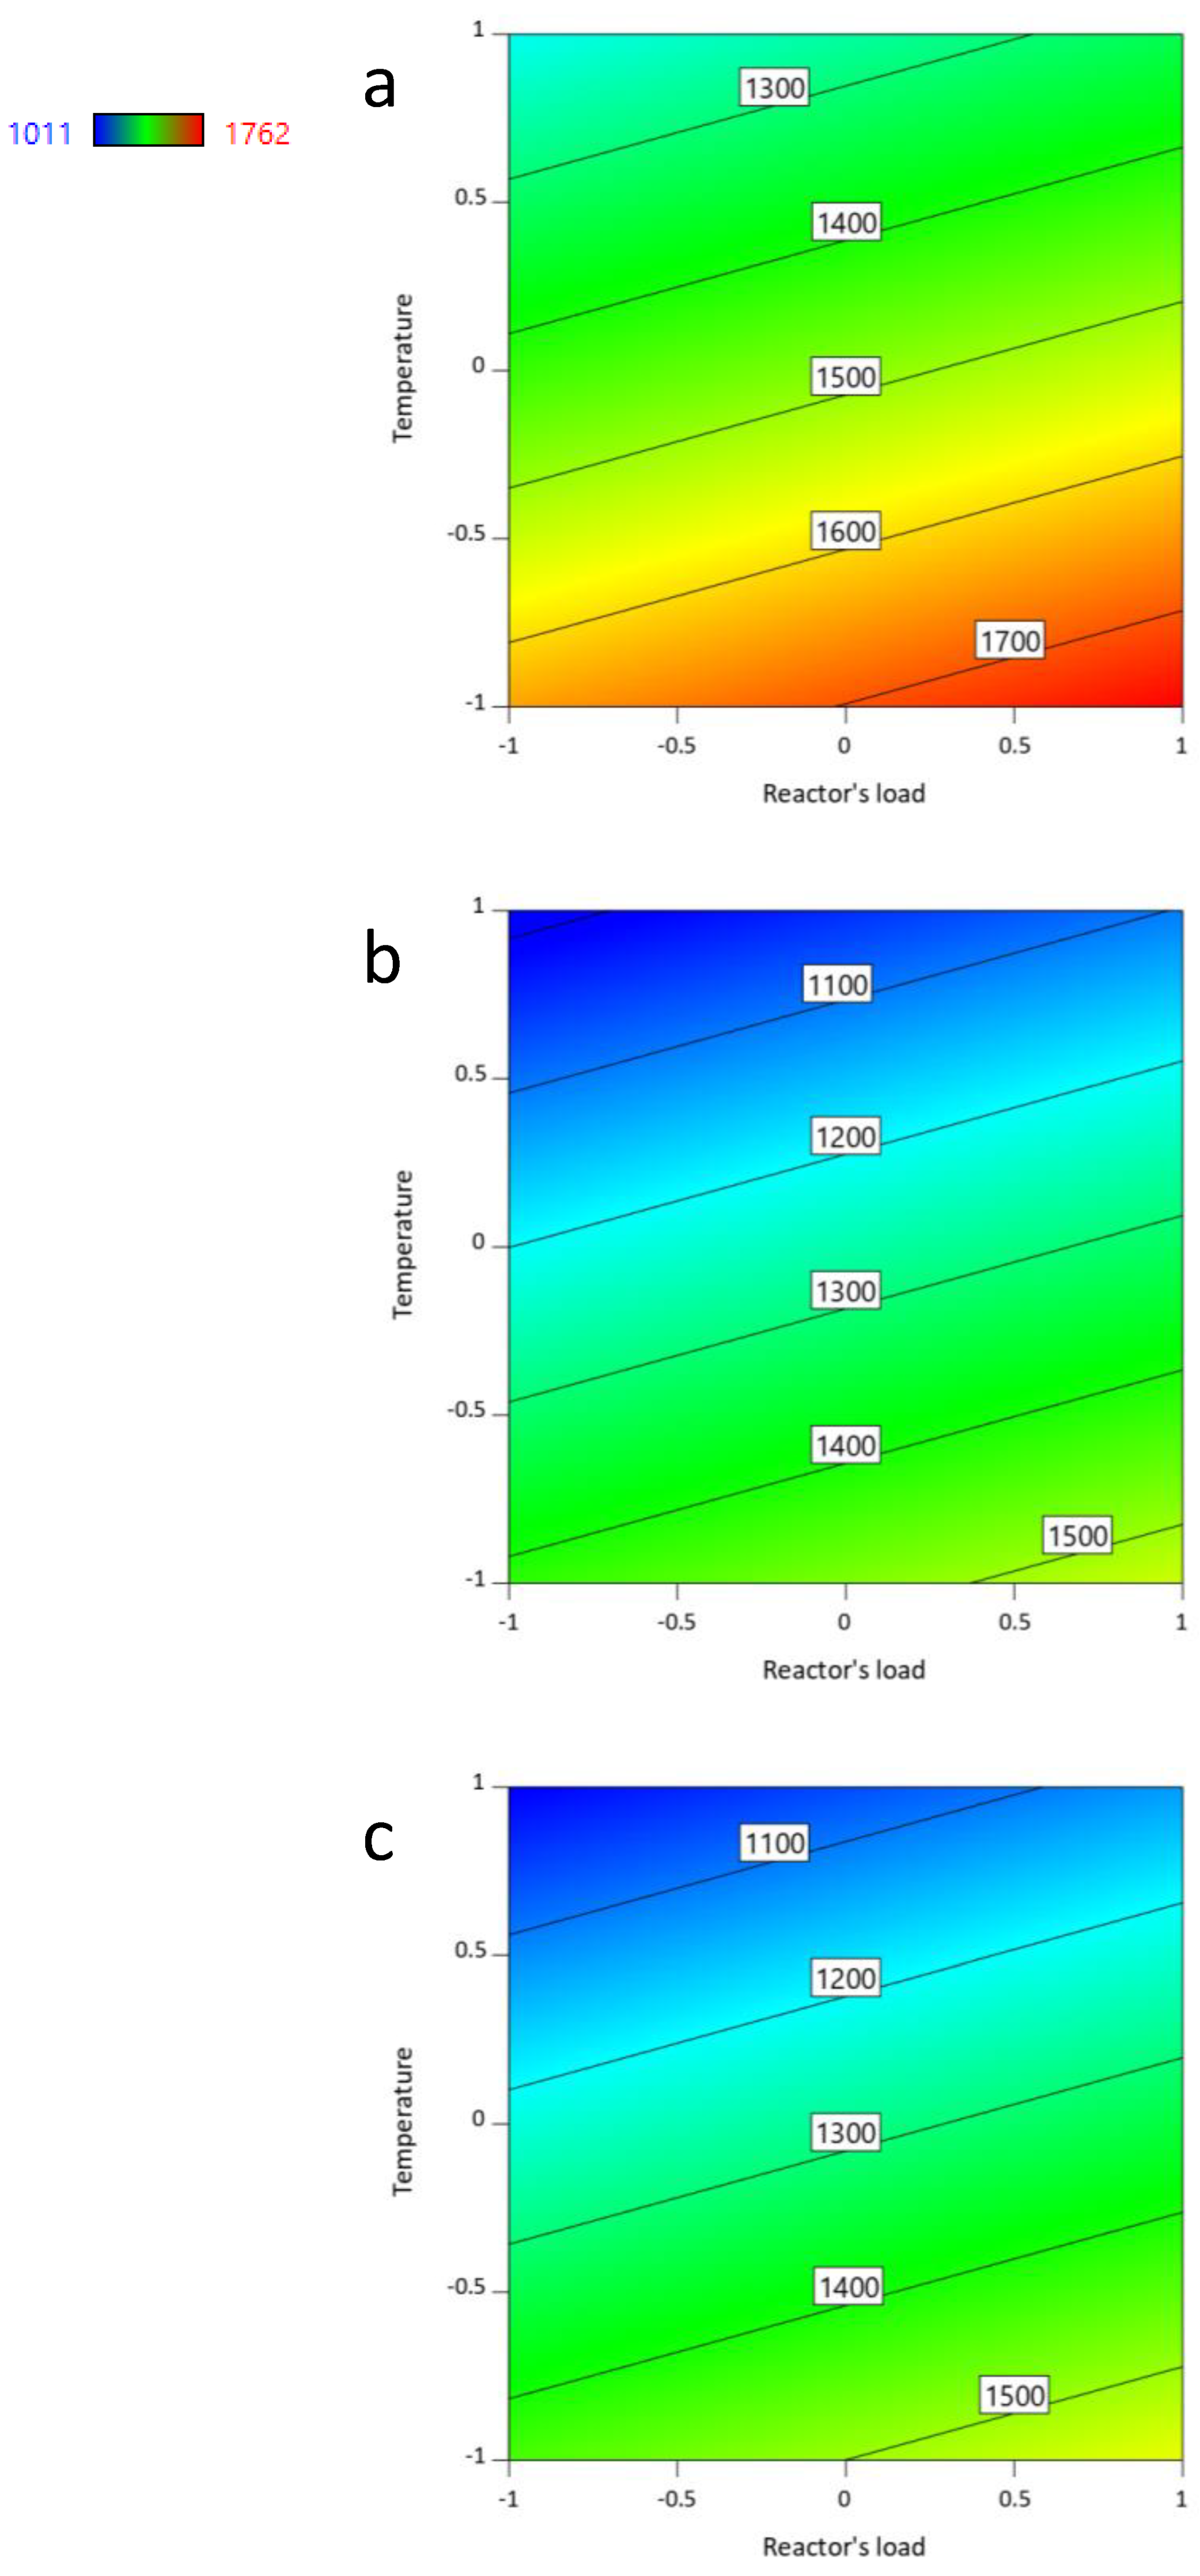
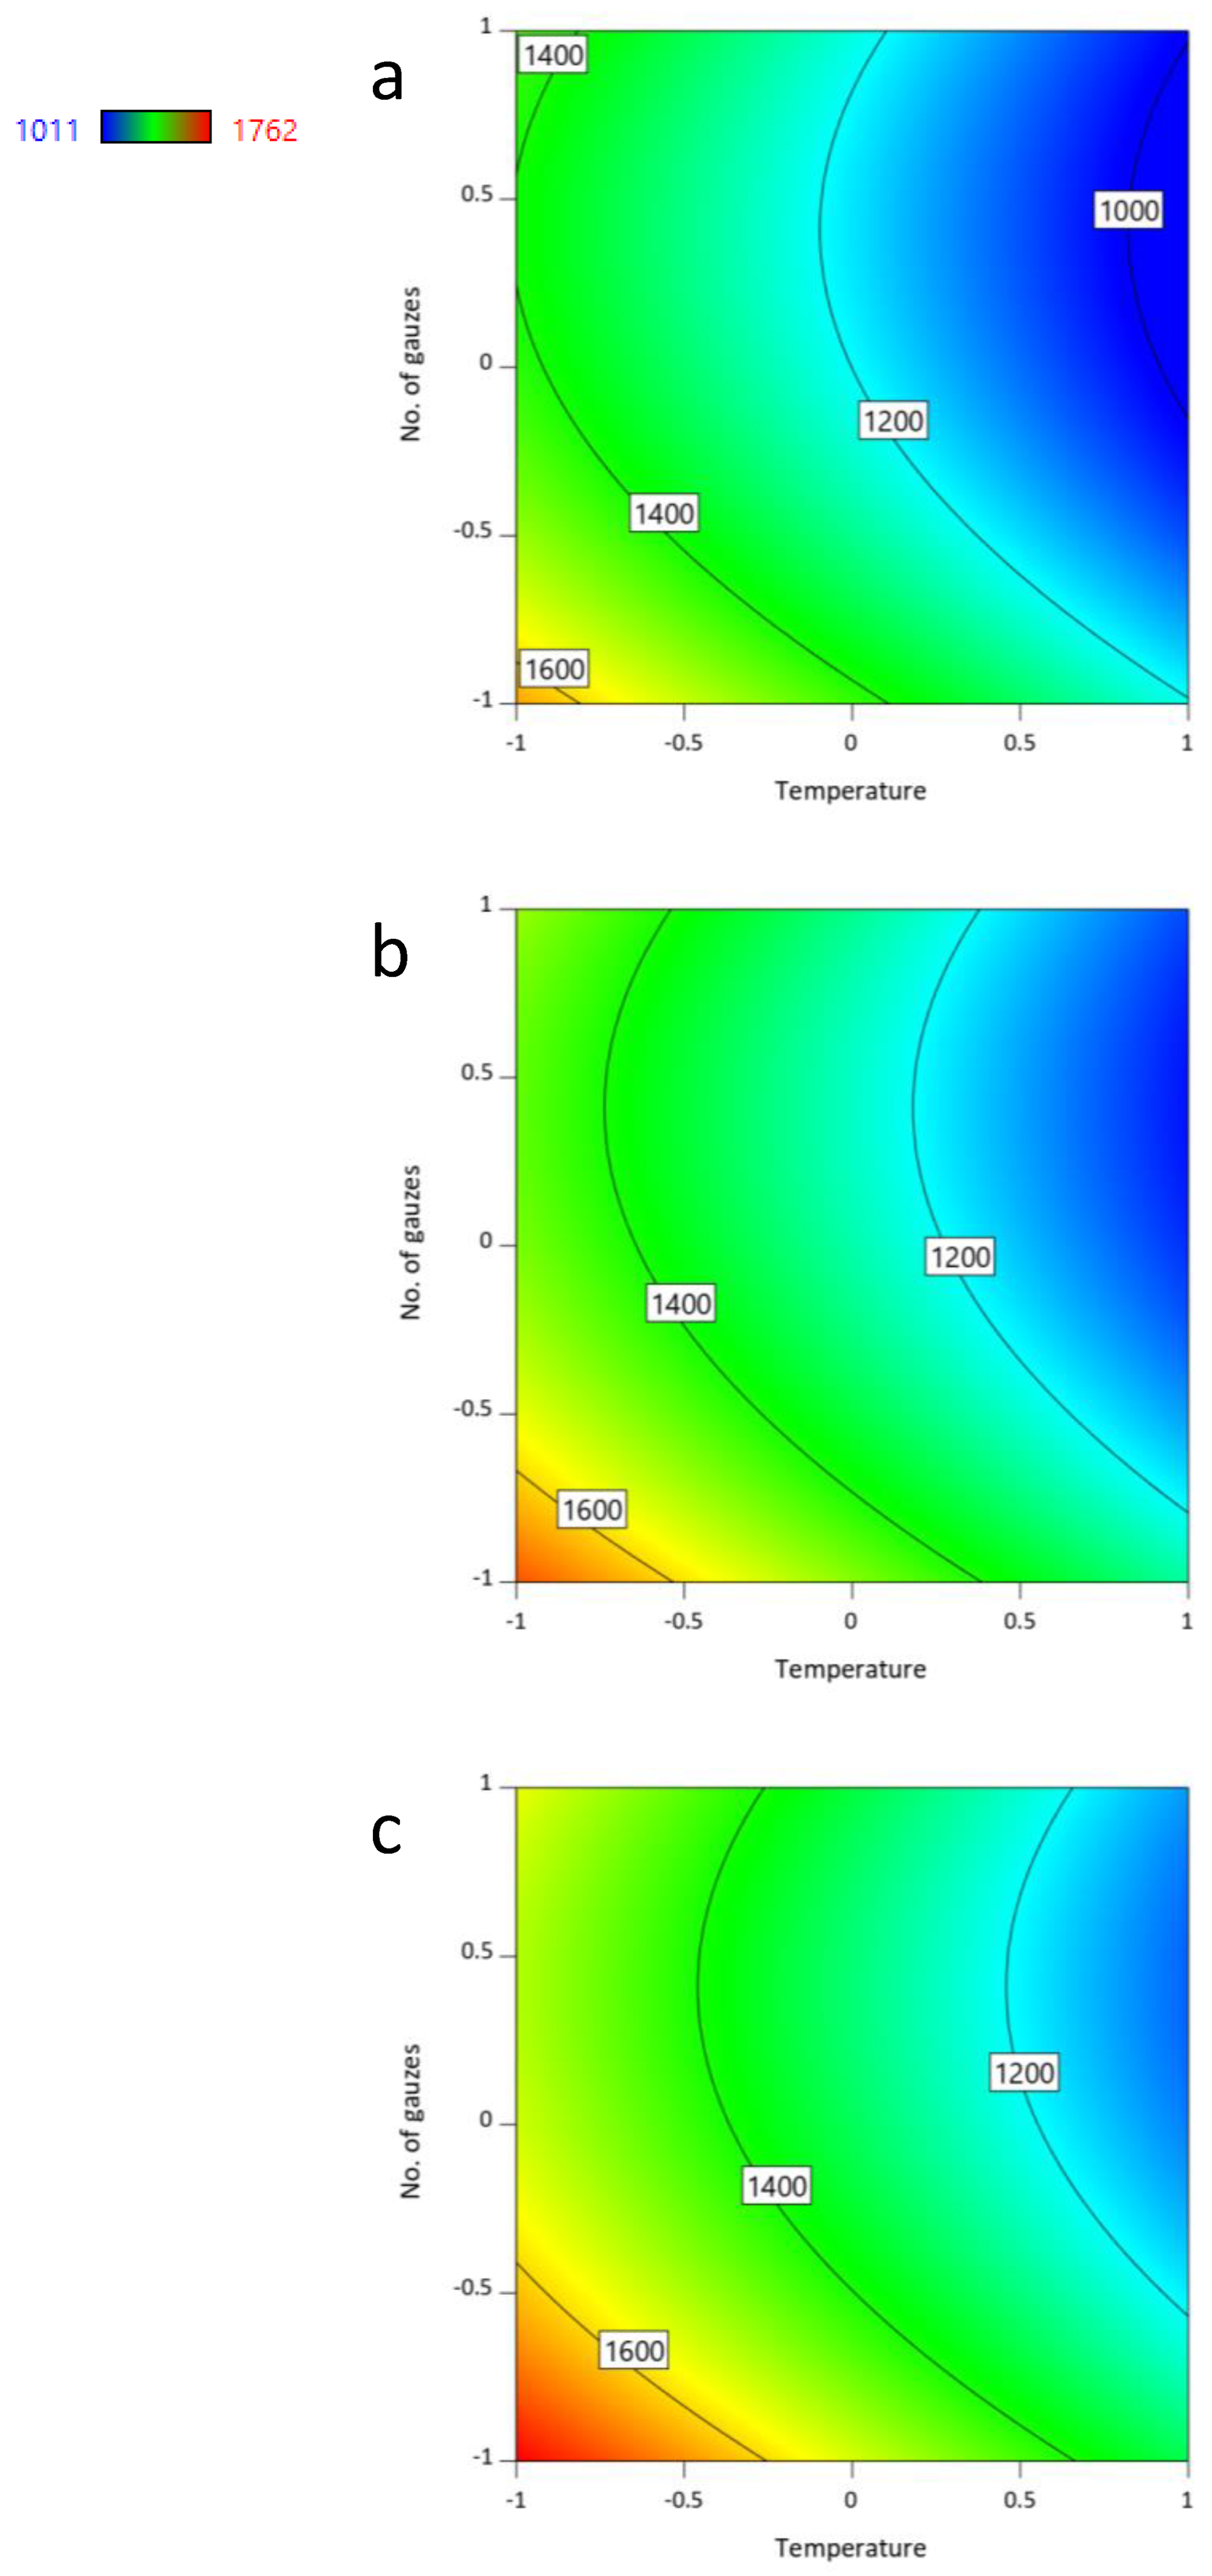
Studies related to dependency of N2O concentration in nitrous gases on operating parameters are relatively new research issue. Therefore, there is a lack of scientific reports dedicated to systematic studies in this field. In case of the N2O concentration in nitrous gases, the achieved mathematical model demonstrates a significant effect of the selected process variables (X1, X2, X3) and the quadratic term number of catalytic gauzes (X32) on the achieved response variable. This effect is illustrated in Figure 5, Figure 6 and Figure 7. The analysis of Equation (2) and Figure 5, Figure 6 and Figure 7 indicates that the temperature of reaction has the biggest quantitative effect on N2O concentration in nitrous gases. From the comparison of plots (Figure 5a–c) it can be concluded that despite the presence of statistically significant terms of equations derived from variable X3, plots of contour line corresponding to levels 0 and 1 are similar. Only for X3 = −1, higher values of R2 are achieved. Profiles of response variable
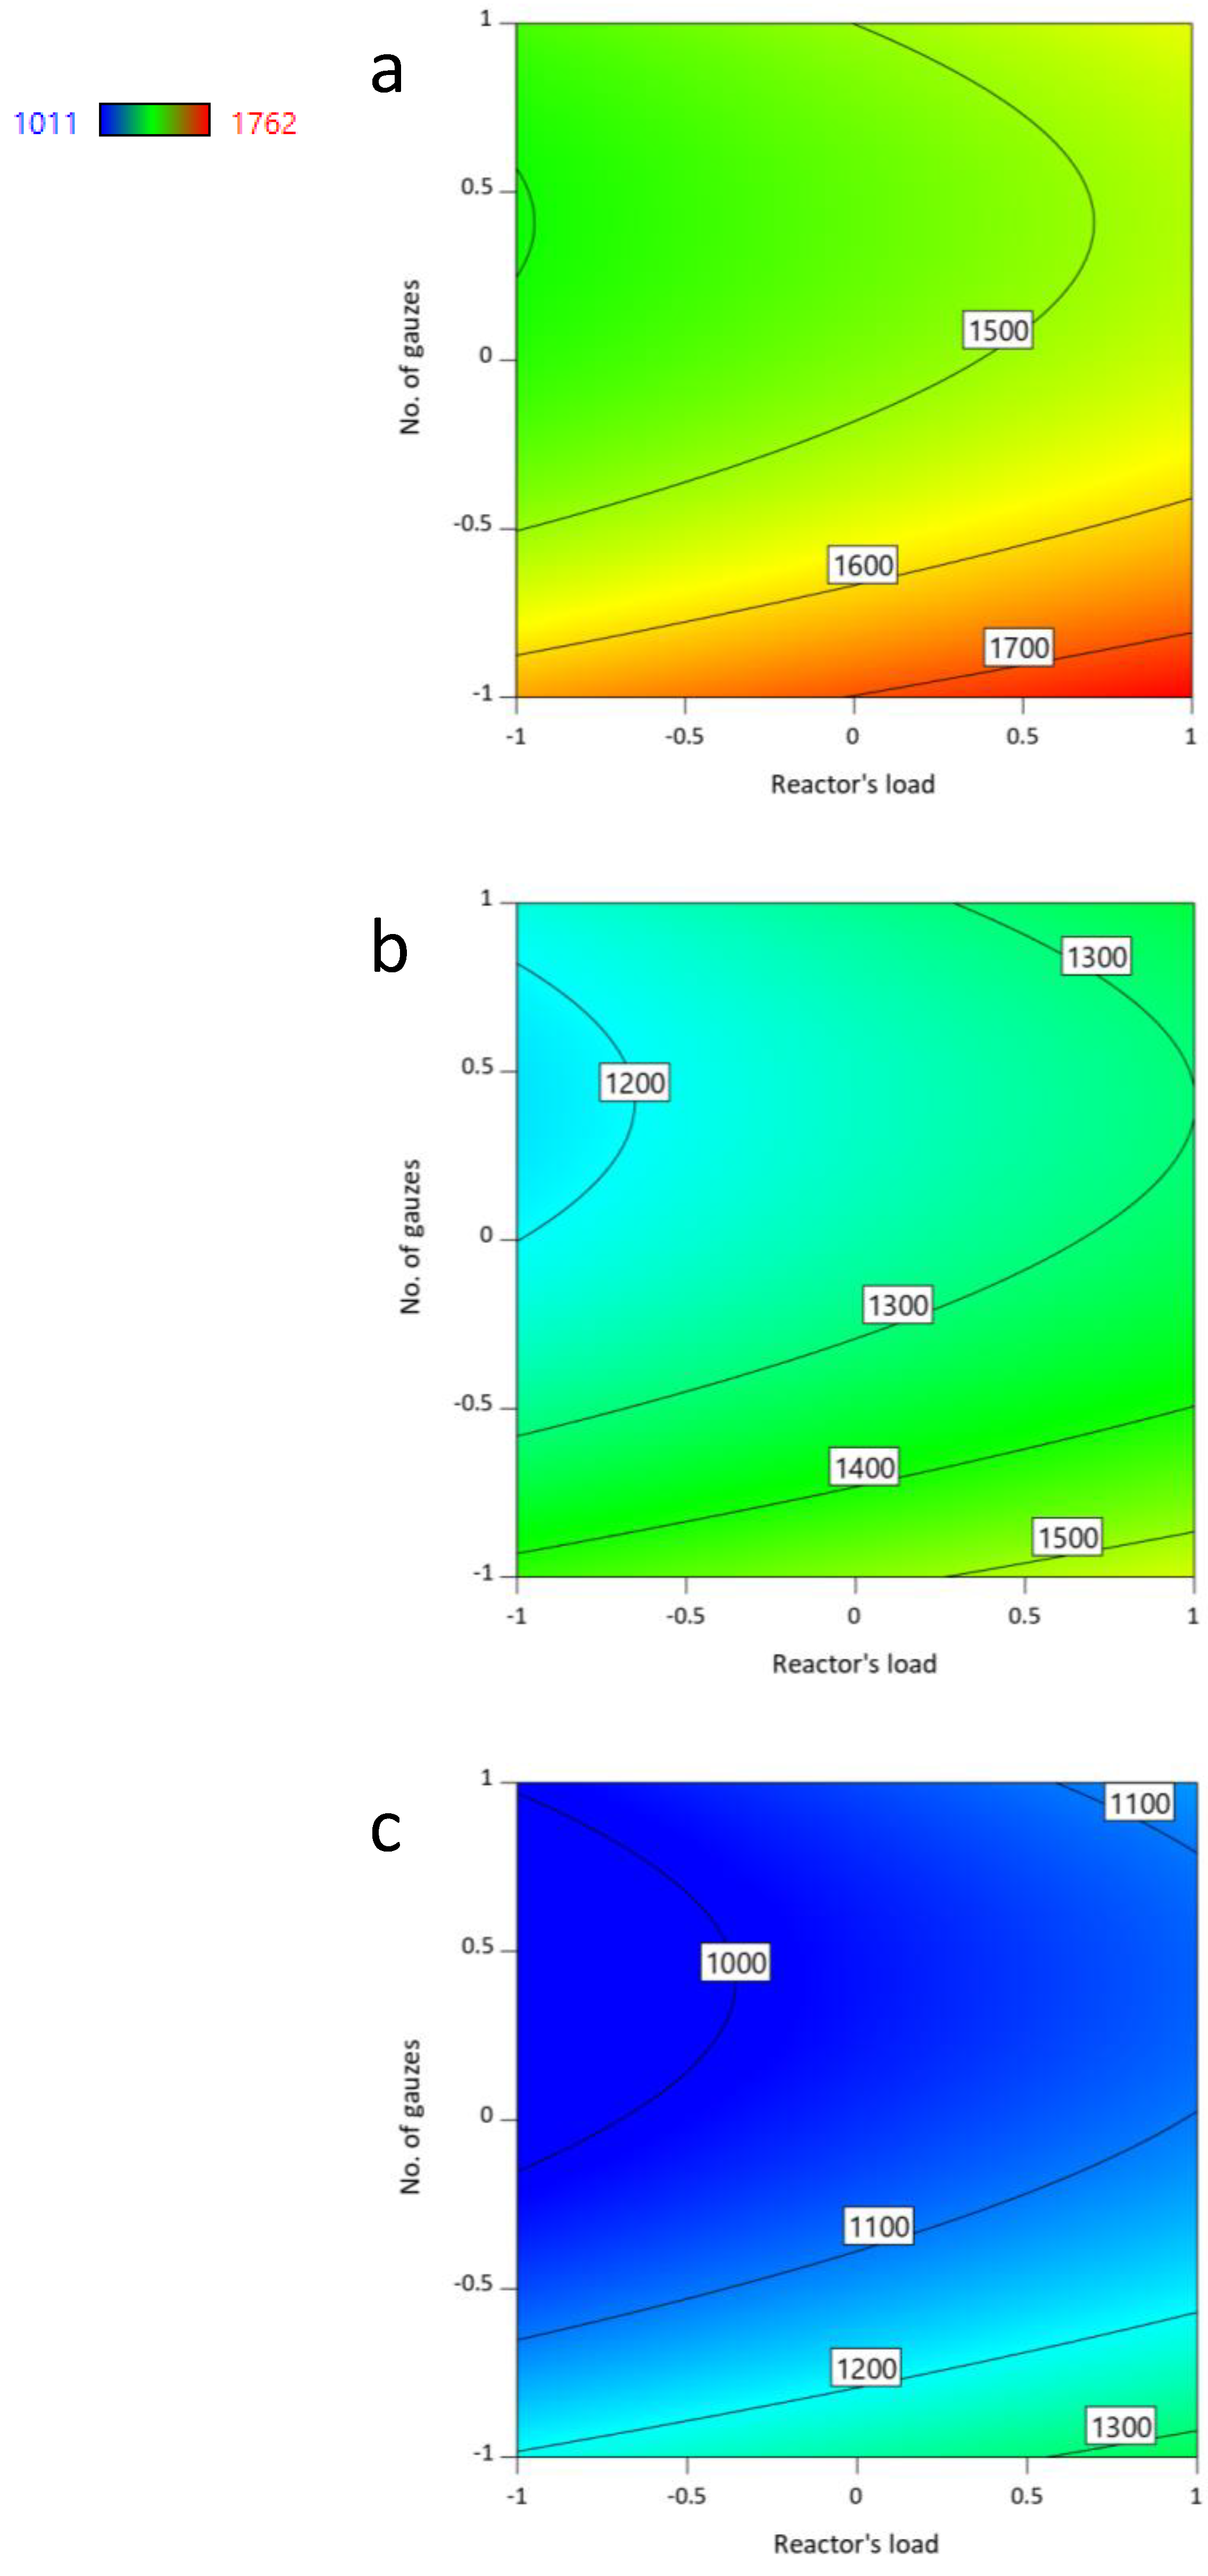
 R2 presented in Figure 6a–c and Figure 7a–c confirm the effect of the number of catalytic gauzes. Both these figures show that the number of catalytic gauzes has little effect on the amount of N2O being formed. For the level of X3 = 0–0.4 (10–12 gauzes), the local optimum is observed. For this number of gauzes, increasing the reactor’s load (X1 = 1) at the fixed reaction temperature (Figure 6a–c) and decreasing the reaction temperature at the fixed reactor’s load (Figure 7a–c) does not cause a significant decrease in N2O concentration in nitrous gases.

2.5. Multi-Response Desirability Optimization

The major optimization task is to find the number of catalytic gauzes and the permissible reactor’s load ensuring the maximization of ammonia oxidation efficiency (R1) and the minimization of N2O concentration in nitrous gases. Results of experiments discussed in Section 2.4. indicate that statistically, the temperature has no significant effect on ammonia oxidation efficiency but on the other hand, the amount of N2O formed is reversely proportional to the temperature of reaction. For desirability function, it was assumed that independent variables are in the variability range. Assumptions for the optimization are presented in Table 7.
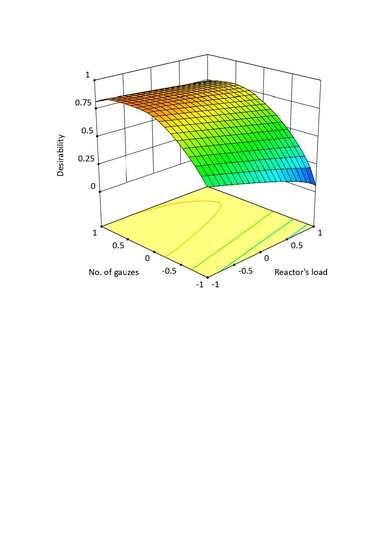
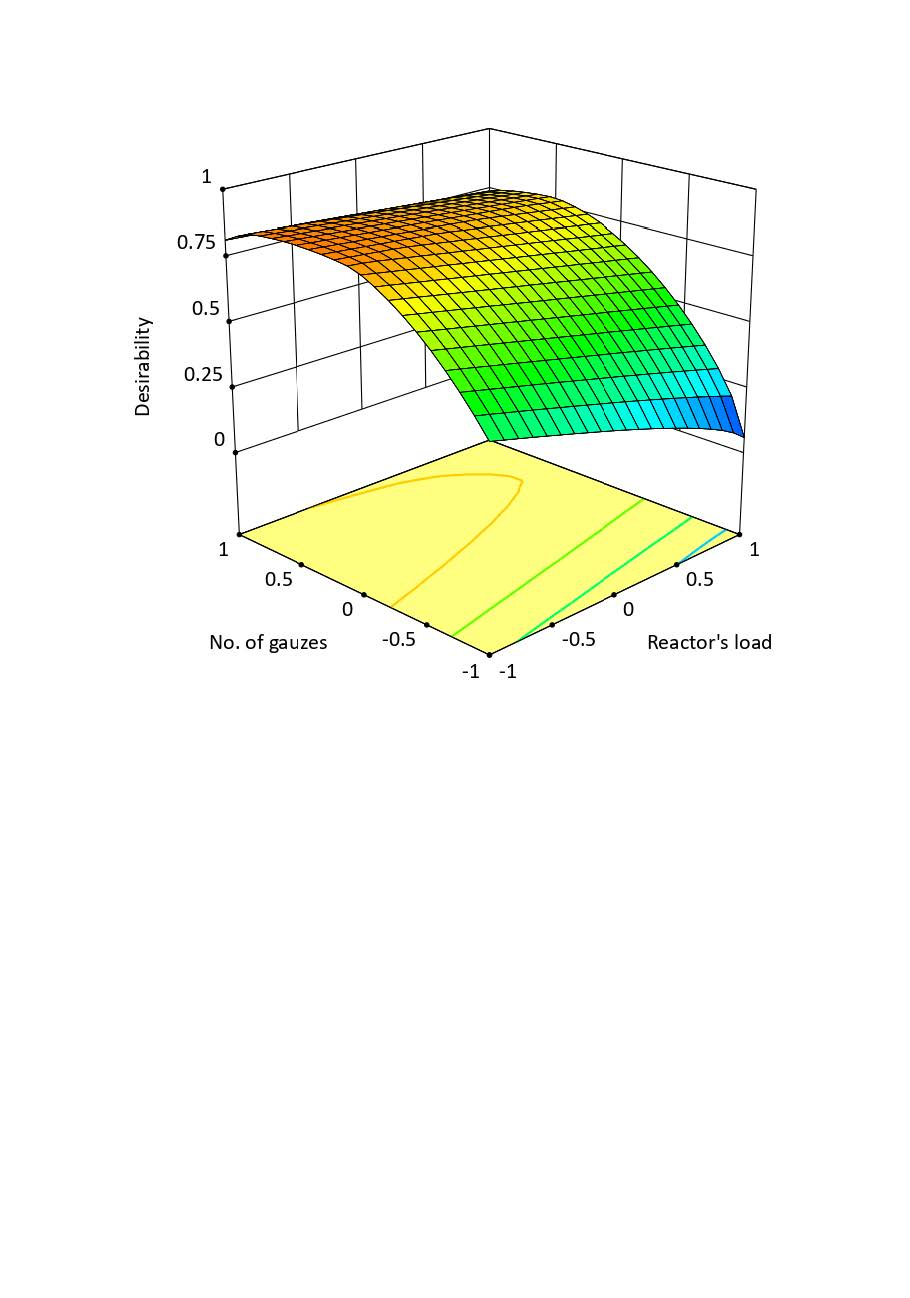
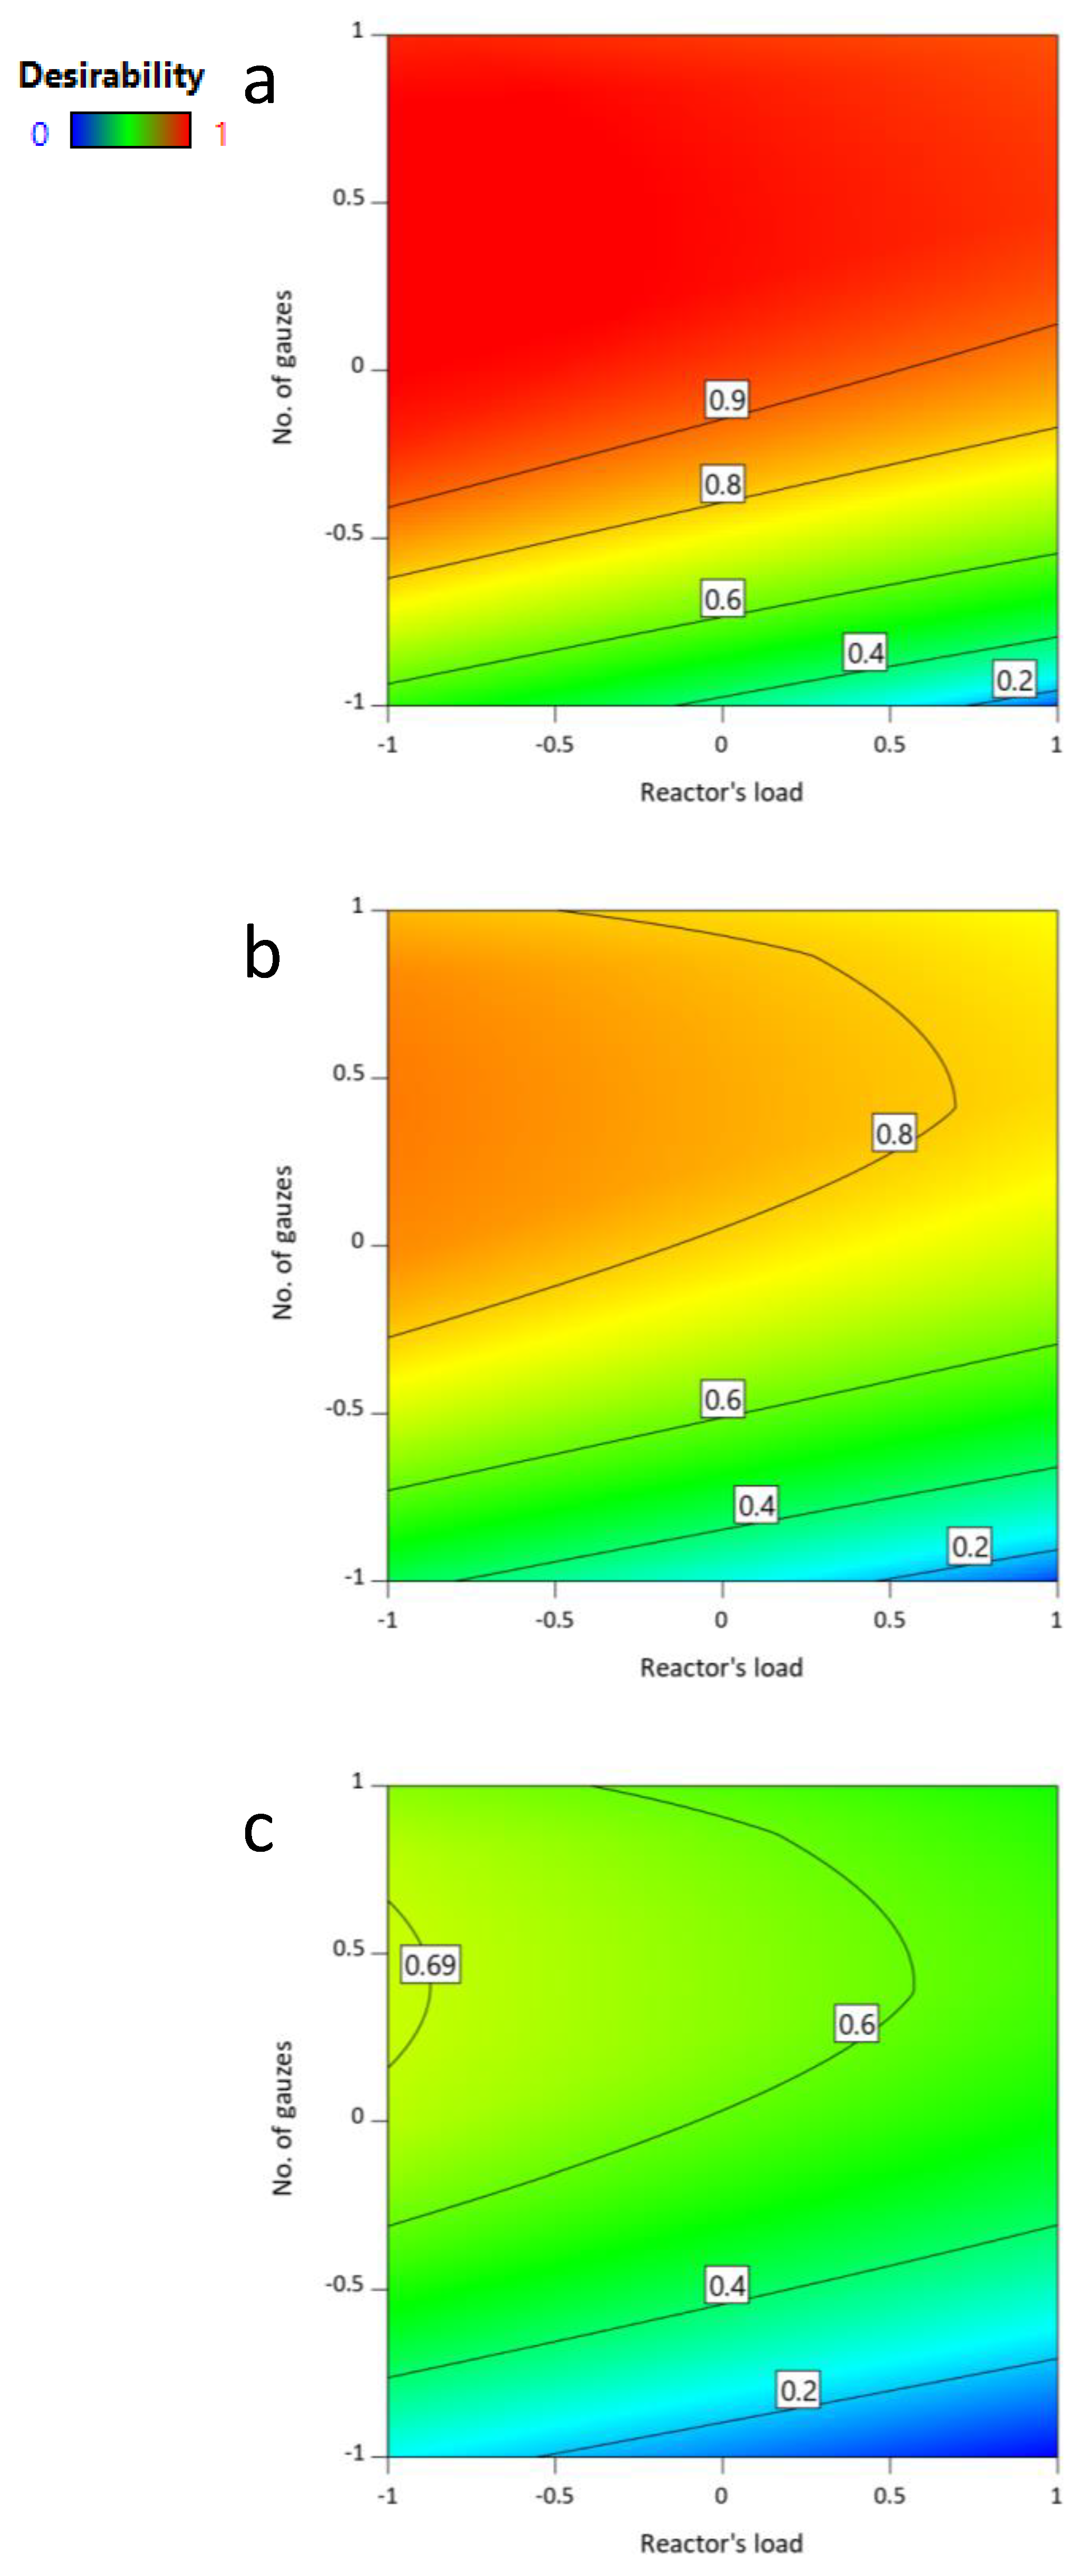
For such optimization assumptions, the area of detailed set of parameters was achieved. It confirms that optimization assumptions are met. Desirability functions for three temperature levels are presented as contour plot in Figure 8.
High values of desirability function (DF > 0.9) at 910 °C are described with dependency according to which for the load of 456 kg NH3/(m2h), the sufficient number of catalytic gauzes is 8. However, for the maximum load studied, 10 catalytic gauzes should be applied. At the temperature of 910 °C and when all optimization criteria are met, the expected value of N2O concentration ranges from 1000 ppm to 1100 ppm (Figure 8a). Lowering the reaction temperature to 890 °C means that desirability function DF > 0.8 is within the region where the minimum catalyst gauzes is 9 for the loading not higher than 480 kg NH3/(m2h) and 12 gauzes for load of 645 kg NH3/(m2h) (Figure 8b). At this temperature, the expected concentration of N2O in nitrous gases ranges from 1180 to 1200 ppm. At the lowest temperature (within the studied range) of 870 °C, the highest value of desirability function is 0.69. For 12 gauzes and the load of 456 kg/(m2h), the expected concentration of N2O in nitrous gases is 1400 ppm.
Taking into account the amount of the primary emissions of N2O (the environmental aspect), it is favourable to conduct the reaction at the temperature of 910 °C. However, this leads to the increased platinum losses. Platinum losses at 910 °C are higher by approx. 25% as compared to losses at 890 °C and by 45% as compared to losses at 870 °C [1,2]. Lowering the reaction temperature to 890 °C with maintaining the optimal range of other parameters causes the increase of N2O concentration in nitrous gases by 100–200 ppm.
The assumption of other values of ‘weight’ and ‘importance’ for particular variables leads to obtain other profiles of desirability function. Under industrial conditions, the assumed value of ‘weight’ and ‘importance’ should take into account the process economics with regard to platinum losses.

2.6. Validation

Validation of the developed optimization model should be carried out under conditions specified as optimal. Optimization results indicate a wide set of parameters for which desirability function achieved high values. Therefore, in order to carry out additional measurements, the point with the independent variables value of: 1, 1, 1 was selected. This point is in the range of high desirability function value. In Table 8 levels of independent variables, results of validation experiment and predicted mean values of response variables with standard deviation are presented.
For the assumed independent variables, the values of predicted mean with 95% two-sided confidence intervals met by 99% of population were estimated based on the achieved mathematical model. High conformity of results expected according to mathematical models with the obtained measurements results was achieved.

3. Materials and Methods

3.1. Materials

Standard knitted gauzes made of platinum alloy with the addition of 10% wt. Rh made of 0.076 mm wire and specific weight of 600 g/m2 were used for ammonia oxidation studies. The catchment gauzes which are most commonly used in industrial process were not used in studies. The prefiltered compressed air and gaseous ammonia were used as raw materials for ammonia oxidation reaction.

3.2. Experimental Procedure

Ammonia oxidation studies were performed in a pilot plant equipped with a flow reactor (inner diameter: 100 mm). The Pt-Rh catalytic gauzes were installed inside the basket. After initiating the reaction, the stable ammonia and air ratio was maintained in reaction mixture amounting to approx. 10.9% vol. The air–ammonia mixture temperature was controlled in such a manner as to obtain the temperature of nitrous gas as assumed in the experiment plan. Air–ammonia mixture temperature was variable in the range of 135–195 °C. The flow of the air-ammonia mixture was also controlled in order to obtain the assumed reactor’s load. All experiments were conducted under the pressure of 0.5 MPa. The range of temperature of reaction at which studies were carried out is similar to that applied in industrial practice. The reactor’s load was selected in such a manner as to ensure that the gas flow through the catalytic package in the range applied for medium-pressure industrial reactor namely 1–3 m/s. The scheme of the pilot plant is presented in Figure 9. For measuring ammonia oxidation efficiency, samples of ammonia-air mixture were taken at the inlet to the reactor and samples of nitrous gases were taken at the outlet of the reactor. For determination of N2O concentration in nitrous gases, only samples of nitrous gases were taken.

3.3. Analytical Methods

The ammonia oxidation efficiency was calculated based on concentrations of ammonia in the air-ammonia mixture at the inlet and concentrations of NO in nitrous gases at the outlet of the reactor. Both analysis were determined according to a titration method. Ammonia from air-ammonia mixture samples was absorbed in water with the formation of ammonia-water solution which was then titrated with sulphuric acid. The nitrous gases samples were absorbed in 3% water solution of hydrogen peroxide. After ensuring the sufficient period of time, NO oxidized completely to NO2 and then, it reacted with water to HNO3. The formed HNO3 was titrated with the sodium hydroxide solution in the presence of an indicator.
Ammonia oxidation efficiency (R1) was calculated according to the following formula:
R 1 = ( C 2 C 1 ) · 100 %
where: C1—ammonia concentration in ammonia-air mixture, % w/w; C2—concentration of oxidized ammonia, % w/w.
The result of each measurement is an average value, calculated from 7 independent samplings. The difference in the extreme individual values were not greater than ±0.3% in comparison to the average one.
N2O concentration in nitrous gases (R2) was determined by gas chromatography using a Unicam 610 system with a discharge ionization detector. Gaseous samples were collected in the vacuum flasks containing 3% water solution of hydrogen peroxide. After the absorption of nitrous gases and water vapor condensation, exhaust gas from the flasks was injected to the gas chromatograph through 1 mL sample loop. The result of each measurement was an average value calculated from 3 independent samplings. The difference in the extreme individual values was not greater than ±35 ppm in comparison to the average one.

3.4. Statistical Methods

The experimental procedure was carried out according to Box–Behnken design matrix. The reactor’s load (X1), the temperature of nitrous gas specifying the temperature of reaction (X2) and the number of catalytic gauzes (X2) were selected as independent variables. Ammonia oxidation efficiency (R1) and N2O concentration in nitrous gas (R2) were specified as response variables. Each level of independent variables were coded according to the Equation (4).
X i = x i x 0 Δ x i
where, Xi is the dimensionless, coded level of independent variable (−1, 0 or 1), xi is the actual value of the independent variable, x0 is the value of the independent variable at the centre point, Δxi is the step change in xi.
Ranges and levels of independent variables are presented in Table 9.
The total number of the experiments (N) was calculated using the Equation (5).
N = 2 k ( k 1 ) + c 0
where, k is the number of independent variables, c0—number of the replicates run of the centre point (in our research c0 = 3). For three independent variables, the total number of experiments assumed in the plan was 15.
The experiments were conducted in a randomized order to avoid the influence of uncontrolled variables on the dependent responses.
A mathematical relationship between the independent variables and response variables was determined by fitting the experimental data with second-order polynomial Equation (6).
R i = b 0 + i = 1 3 b i X i + i = 1 3 j = 1 ,   i < j 3 b i j X i X j + i = 1 3 b i i X i 2  
where Ri is the estimate response variable, b0, bi, bii, bij are regression coefficients fitted from the experimental data, Xi, Xj are coded independent variables, listed in Table 9.
The significance of the model equation, individual parameters, were evaluated through ANOVA with the confidence interval (CI) of 95%. A simultaneous optimization of several dependent variables requires the application of multi-criteria methodology. In this case, the desirability function (DF) was used. The particular desirability functions are combined using the geometric mean which allows to achieve overall desirability function [16], according to Equation (7).
D F = ( ( d 1 ) w 1 × ( d 2 ) w 2 × x   ( d n ) w n ) ) 1 / w i
where n is the number of responses, di is an individual response desirability, wi is a response ‘weight’.
The adjustment of the shape of particular desirability function can be performed by assigning the specified ‘weight.’ Setting a different ‘importance’ for each objective with respect to the remaining objectives is also possible. For these studies, identical ‘weight’ for all the independent variables and response variables was assumed. Desirability function assigns values from 0 to 1 where 1 means meeting all the optimization criteria. It is not always necessary to search for the solution aiming at achievement of the highest value of desirability function but it is vital to search for the set of parameters which would meet the optimization objectives to the particular extent (e.g., DF > 0.75). The statistical software used to experimental design and analysis was Design Expert 11.0.6.0 version (Stat-Ease, Inc., Minneapolis, MN, USA).

4. Conclusions

The conducted studies allowed us to develop statistically significant mathematical models describing the course of variables of ammonia oxidation efficiency and N2O concentration in nitrous gases depending on three selected independent variables.
The design of the experiment allowed the reduction of the costs of studies and to achieve a number of results accurate for modelling. It was found that, within the studied range of variability, the temperature of reaction has no significant effect statistically on the achieved ammonia oxidation efficiency, whereas it has the effect on the amount of N2O formed in the side reaction (primary emission of N2O).
The developed models were used to optimize the process. As a result of this optimization, the set of the independent variables was developed for which optimization assumptions are met, which are expressed as a high value of desirability functions. It is possible to specify the optimum number of gauzes with the determined reactor’s load for the studied package of catalytic gauzes.
In validation experiments, the developed model of desirability function achieved the high conformity of experimental values with the expected ones.
The presented methodology can be used to minimize the primary N2O emission at high ammonia oxidation efficiency. It can be applied for optimization of operating parameters of ammonia oxidation reactor with two types of catalysts: catalytic gauzes and catalyst for high temperature of N2O decomposition. As a result, it is possible to obtain the set of independent variables ensuring low N2O emission and to meet the binding environmental regulations.

Author Contributions

Conceptualization, M.I.; Formal analysis, M.I. and A.D.-I.; Investigation, M.I. and J.R.; Methodology, M.I.; Supervision, M.W.; Visualization, A.D.-I.; Writing—original draft, M.I.

Funding

This research received no external funding.

Conflicts of Interest

The authors declare no conflict of interest.

References

  1. Thiemann, M.; Scheibler, E.; Wiegand, K.W. Nitric Acid, Nitrous Acid, and Nitrogen Oxides. In Ullmann’s Encyclopedia of Industrial Chemistry; Wiley-VCH Verlag GmbH & Co. KGaA: Weinheim, Germany, 2012. [Google Scholar]
  2. Sadykow, V.A.; Isupova, L.A.; Zolotarskii, I.A.; Bobrova, L.N.; Noskov, A.S.; Parmon, V.N.; Brushtein, E.A.; Telyatnikova, T.V.; Chernyshev, V.I.; Lunin, V.V. Oxide catalysts for ammonia oxidation: Properties and perspectives. Appl. Catal. A Gen. 2000, 204, 59–87. [Google Scholar] [CrossRef]
  3. Biausque, G.; Schuurman, Y. The reaction mechanism of the high temperature ammonia oxidation to nitrous oxide over LaCoO3. J. Catal. 2010, 276, 306–313. [Google Scholar] [CrossRef]
  4. Petryk, J.; Kołakowska, E. Cobalt oxide catalysts for ammonia oxidation activated with cerium and lanthanum. Appl. Catal. A Environ. 2000, 24, 121–128. [Google Scholar] [CrossRef]
  5. Isupova, L.A.; Sutormina, E.F.; Kulikovskaya, N.A.; Plyasova, L.M.; Rudina, N.A.; Ovsyannikova, I.A.; Zolotarskii, I.A.; Sadykov, V.A. Honeycomb supported perovskite catalysts for ammonia oxidation processes. Catal. Today 2005, 105, 429–435. [Google Scholar] [CrossRef]
  6. Isupova, L.A.; Sutormina, E.F.; Zakharov, V.P.; Rudina, N.A.; Kulikovskaya, N.A.; Plyasova, L.M. Cardierite-like mixed oxide monolith for ammonia oxidation process. Catal. Today 2009, 1475, 5319–5323. [Google Scholar] [CrossRef]
  7. Marret, S.; du Chatelier, L. Recent advances in catalyst technology used in nitric acid production. Proc. Fertil. Soc. 1998, 413, 1–44. [Google Scholar]
  8. Kay, O.; Buennagel, T. Targeting improving performance and conversion efficiency in nitric acid plants. Proc. Fertil. Soc. 2016, 787, 1–31. [Google Scholar]
  9. Anonymous. New advances in platinum gauze systems. Nitrogn+Syngas 2016, 344, 34–41. [Google Scholar]
  10. Anonymous. Catalysts for ammonia oxidation. Nitrogen+Syngas 2017, 349, 48–50. [Google Scholar]
  11. Kyoto Protocol. Available online: https://unfccc.int/process/the-kyoto-protocol (accessed on 26 November 2017).
  12. Brown, S.M.; Sneyd, J.R. Nitrous oxide in modern anaesthetic practice. BJA Educ. 2016, 16, 87–91. [Google Scholar] [CrossRef] [Green Version]
  13. Van Amsterdam, J.; Nabben, T.; van den Brink, W. Recreational nitrous oxide use: Prevalence and risks. Regul. Toxicol. Pharmacol 2015, 73, 790–796. [Google Scholar] [CrossRef]
  14. Pérez-Ramirez, F.; Kapteijn, K.; Schöffel, J.A. Moulijn, Formation and control of N2O in nitric acid production: Where do we stand today? Appl. Catal. B Environ. 2003, 44, 117–151. [Google Scholar] [CrossRef]
  15. Marzo, L.M. Nitric acid production and abatement technology including azeotropic acid. Proc. Fertil. Soc. 2004, 540, 1–28. [Google Scholar]
  16. Reference Document on Best Available Techniques for the Manufacture of Large Volume Inorganic Chemicals—Ammonia, Acids and Fertilisers, Chapter 3 Nitric Acid, European Commission Document 2007. Available online: http://eippcb.jrc.es (accessed on 16 March 2012).
  17. Anonymous. Emission monitoring in nitric acid plants. Nitrogn+Syngas 2014, 328, 48–53. [Google Scholar]
  18. Myers, R.H.; Montgomery, D.C.; Anderson-Cook, C.M. Response Surface Methodology: Process and Product Optimization Using Designed Experiments, 3rd ed.; John Wiley & Sons: Hoboken, NJ, USA, 2009. [Google Scholar]
  19. Granato, D.; Ares, G. Mathematical and Statistical Methods in Food Science and Technology; John Wiley & Sons, Ltd.: Chicago, IL, USA, 2014. [Google Scholar]
  20. Capaci, F.; Bergquist, B.; Kulahci, M.; Vanhatalo, E. Exploring the use of design of experiments in industrial processes operating under closed-loop control. Qual. Reliab. Eng. Int. 2017, 33, 1601–1614. [Google Scholar] [CrossRef]
  21. Zhang, L.; Mao, S. Application of quality by design in the current drug development. Asian J. Pharm. Sci. 2017, 12, 1–8. [Google Scholar] [CrossRef] [Green Version]
  22. Huang, S.-M.; Wu, P.-Y.; Chen, J.-H.; Kou, C.-H.; Shieh, C.-J. Develpoing a High-Temperature Solvent-free System for Efficient Biocatalysis of Octyl Ferulate. Catalysts 2018, 8, 338. [Google Scholar] [CrossRef]
  23. Lin, Y.-P.; Mehrvar, M. Photocatalytic Treatment of An Actual Confectionery Wastewater Using Ag/TiO2/Fe2O3: Optimization of Photocatalytic Reactions Using Surface Response Methodology. Catalysts 2018, 8, 409. [Google Scholar] [CrossRef]
  24. Tafreshi, N.; Sharifnia, S.; Dehaghi, S.M. Box–Behnken experimental design for optimization of ammonia photocatalytic degradation by ZnO/Oak charcoal composite. Proc. Saf. Environ. Prot. 2017, 106, 203–210. [Google Scholar] [CrossRef]
  25. Nobandegani, M.S.; Birjandi, M.R.S.; Darbandi, T.; Khalilipour, M.M.; Shahraki, F.; Mohebbi-Kalhori, D. An industrial Steam Methane Reformer optimization using response surface methodology. J. Nat. Gas Sci. Eng. 2016, 36, 540–549. [Google Scholar] [CrossRef] [Green Version]
  26. Hafizi, A.; Rahimpour, M.R.; Hassanajili, S. Hydrogen production by chemical looping steam reforming of methane over Mg promoted iron oxygen carrier: Optimization using design of experiments. J. Taiwan Inst. Chem. Eng. 2016, 62, 140–149. [Google Scholar] [CrossRef]
  27. Hoseiny, S.; Zare, Z.; Mirvakili, A.; Setoodeh, P.; Rahimpour, M.R. Simulation–based optimization of operating parameters for methanol synthesis process: Application of response surface methodology for statistical analysis. J. Nat. Gas Sci. Eng. 2016, 34, 439–448. [Google Scholar] [CrossRef]
  28. Duraković, B. Design of experiments application, concepts, examples: State of the art. Period. Eng. Nat. Sci. 2017, 5, 421–439. [Google Scholar] [CrossRef]
  29. NIST/SEMATECH. e-Handbook of Statistical Methods. 2012. Available online: http://www.itl.nist.gov/div898/handbook/ (accessed on 29 November 2018).
Figure 1. “Black–box” model of the research issue in design of experiments methodology.
Catalysts 09 00249 g001
Figure 2. Model diagnostics for response variable R1 (a) A normal probability plot of the residuals; (b) Residuals versus predicted value of R1; (c) Residuals versus run number; (d) Predicted versus actual value of response variable R1. Points on graphs correspond to results of particular experiments and colour points correspond to the value in accordance with the scale.
Catalysts 09 00249 g002
Figure 3. Model diagnostics for response variable R2 (a) A normal probability plot of the residuals; (b) Residuals versus predicted value of R2; (c) Residuals versus run number; (d) Predicted versus actual value of response variable R2. Points on graphs correspond to results of particular experiments and colour points correspond to the value in accordance with the scale.
Catalysts 09 00249 g003
Figure 4. Interaction effect between the reactor’s load (X1) and the number of catalytic gauzes (X3) on ammonia oxidation efficiency (R1) by contour plot.
Catalysts 09 00249 g004
Figure 5. Interaction effect between the reactor’s load (X1) and the temperature (X2) at fixed number of catalytic gauzes (X3) on N2O concentration in nitrous gases (R2) by contour plot. (a) X3 = −1; (b) X3 = 0; (c) X3 = 1.
Catalysts 09 00249 g005
Figure 6. Interaction effect between the reactor’s load (X1) and the number of catalytic gauzes (X3) at fixed temperature (X2) on N2O concentration in nitrous gases (R2) by contour plot. (a) X2 = −1; (b) X2 = 0; (c) X2 = 1.
Catalysts 09 00249 g006
Figure 7. Interaction effect between the temperature (X2) and the number of catalytic gauzes (X3) at fixed reactor’s load (X1) on N2O concentration in nitrous gases (R2) by contour plot. (a) X1 = −1; (b) X1 = 0; (c) X1 = 1.
Catalysts 09 00249 g007
Figure 8. Desirability function plots. Effect of the reactor’s load (X1) and the number of catalytic gauzes (X3) at three levels of temperature (a) X2 = −1; (b) X2 = 0; (c) X2 = 1.
Catalysts 09 00249 g008
Figure 9. Scheme of the pilot plant. Symbols: C1—absorption column, C2—bleaching column, E1–E6—heat exchangers, M1—air–ammonia mixer, R1—ammonia oxidation reactor, R2—selective catalytic reduction reactor.
Catalysts 09 00249 g009
Table 1. The Box-Behnken design matrix and experimental data.
Standard OrderRun OrderX1X2X3R1R2
Reactor’s Load, kg NH3/(m2h)Temperature, °CNo. of Gauzes, pcsAmmonia Oxidation Efficiency, %N2O Concentration in Nitrous Gases, ppm
31−11096.1 1011
15200096.11279
73−10196.21238
6410−191.41620
950−1−192.01762
56−10−193.71348
14700096.21265
12801196.41074
291−1095.61457
81010196.21312
111−1−1096.31423
41211095.81114
131300096.21271
11140−1196.01506
101501−192.71207
Table 2. Model summary statistics for response variables R1 and R2.
Response Variable: R1—Ammonia Oxidation Efficiency
SourceStd. Dev.R2Adjusted R2Predicted R2PRESS
Linear1.080.69690.61420.426824.38
2FI1.200.72940.5265−0.121547.70
Quadratic0.27900.99080.97440.85576.14Suggested
Cubic0.05770.99980.9989 *Aliased
Response variable: R2—N2O concentration in nitrous gases
SourceStd. Dev.R2Adjusted R2Predicted R2PRESS
Linear87.820.85240.81210.69931.728 × 105
2FI93.580.87810.78670.41553.359 × 105
Quadratic49.780.97840.93960.65741.969 × 105Suggested
Cubic7.020.99980.9988 *Aliased
* - case(s) with leverage of 1.0000; PRESS statistic not defined.
Table 3. ANOVA results for response variable R1.
SourceSum of SquaresdfMean SquareF-Valuep-ValueSignificance
Model42.1494.6860.160.0001highly significant
X11.3611.3617.490.0086significant
X20.151210.15121.940.2221not significant
X328.13128.13361.35<0.0001highly significant
X1X20.040010.04000.51390.5055not significant
X1X31.3211.3216.990.0092significant
X2X30.022510.02250.28910.6139not significant
X120.012610.01260.16140.7044not significant
X220.092610.09261.190.3252not significant
X3211.09111.09142.53< 0.0001highly significant
Residual0.389250.0778
Lack of Fit0.382530.127538.250.0256significant
Pure Error0.006720.0033
Corrected total SS42.5314
p < 0.0001—highly significant, 0.0001 < p < 0.05—significant, p > 0.05—not significant
Table 4. ANOVA results for response variable R2.
SourceSum of SquaresdfMean SquareF-Valuep-ValueSignificance
Model5.623 × 105962,480.2825.210.0012highly significant
X129,161.12129,161.1211.770.0186significant
X23.793 × 10513.793 × 105153.05<0.0001highly significant
X381,406.13181,406.1332.850.0023significant
X1X21190.2511190.250.48030.5192not significant
X1X39801.0019801.003.950.1034not significant
X2X33782.2513782.251.530.2716not significant
X12732.331732.330.29550.6101not significant
X22148.101148.100.05980.8166not significant
X3254,881.26154,881.2622.140.0053significant
Residual12,391.9252478.38
Lack of Fit12,293.2534097.7583.060.0119significant
Pure Error98.67249.33
Corrected total SS5.74710514
p < 0.0001—highly significant, 0.0001 < p < 0.05—significant, p > 0.05—not significant
Table 5. ANOVA results for reduced model of the response variable R1.
SourceSum of SquaresdfMean SquareF-Valuep-ValueSignificance
Model41.83410.46148.66<0.0001highly significant
X11.3611.3619.350.0013significant
X328.13128.13399.85<0.0001highly significant
X1X31.3211.3218.800.0015significant
X3211.02111.02156.63<0.0001highly significant
Residual0.7034100.0703
Lack of Fit0.696780.087126.130.0374significant
Pure Error0.006720.0033
Corrected total SS42.5314
R20.9835
Adjusted R20.9768
Predicted R20.9550
Table 6. ANOVA results for reduced model of the response variable R2.
SourceSum of SquaresdfMean SquareF-Valuep-ValueSignificance
Model5.467 × 10541.367 × 10548.81<0.0001highly significant
X129,161.12129,161.1210.410.0091significant
X23.793 × 10513.793 × 105135.47<0.0001highly significant
X381,406.13181,406.1329.070.0003significant
X3256,826.52156,826.5220.300.0011significant
Residual28,000.13102800.01
Lack of Fit27,901.4683487.6870.700.0140significant
Pure Error98.67249.33
Corrected total SS5.747 × 10514
R20.9513
Adjusted R20.9318
Predicted R20.8743
Table 7. Assumptions for the optimization of the ammonia oxidation process using desirability function. Variables symbol identification according to the Table 1.
NameGoalLower LimitUpper LimitLower Weight *Upper Weight *Importance **
X1in range−11113
X2in range−11113
X3in range−11113
R1maximize91.496.4113
R2minimize10111762113
* Weight: 1—linear change of values in the range from 0 to 1; ** Importance: 5—high, 3—medium, 1—low.
Table 8. The assumed levels of independent variables in validation studies and predicted responses values.
Independent VariableReactor’s LoadTemperatureNumber of Gauzes
Level111
Two-sided Confidence = 95%; Population = 99%
Response variableExperimental DataPredicted Mean ValueStd Dev
R196.296.3625 ± 0.46720.265216
R211201125.12 ± 83.3752.9151
Table 9. Coded and uncoded levels of independent variables used in experiments.
Independent Variable:X1X2X3
Reactor’s Load, kg NH3/(m2h)Temperature of Reaction, °CNumber of Catalytic Gauzes, pcs
Coded variable level:
Low level (−1)4568705
Mid-level (0)58289010
High level (+1)70891015

