Article

Low-Temperature Selective Catalytic Reduction of NO with NH3 over Natural Iron Ore Catalyst

Institute of Thermal Energy Engineering, School of Mechanical Engineering, Shanghai Jiao Tong University, Shanghai 200240, China
*
Author to whom correspondence should be addressed.
Catalysts 2019, 9(11), 956; https://doi.org/10.3390/catal9110956
Submission received: 28 October 2019 / Revised: 11 November 2019 / Accepted: 12 November 2019 / Published: 14 November 2019
(This article belongs to the Special Issue Sustainable and Environmental Catalysis)

Abstract

:
The selective catalytic reduction of NO with NH3 at low temperatures has been investigated with natural iron ore catalysts. Four iron ore raw materials from different locations were taken and processed to be used as catalysts. The methods of X-ray diffraction (XRD), X-ray fluorescence (XRF), Brunauer-Emmett-Teller (BET), X-ray photoelectron spectroscopy (XPS), hydrogen temperature-programmed reduction (H2-TPR), ammonia temperature-programmed desorption (NH3-TPD), scanning electron microscopy (SEM) and Fourier-transform infrared spectroscopy (FTIR) were used to characterize the materials. The results showed that the sample A (comprised mainly of α-Fe2O3 and γ-Fe2O3), calcined at 250 °C, achieved excellent selective catalytic reduction (SCR) activity (above 80% at 170–350 °C) and N2 selectivity (above 90% up to 250 °C) at low temperatures. Suitable calcination temperature, large surface area, high concentration of surface-adsorbed oxygen, good reducibility, lots of acid sites and adsorption of the reactants were responsible for the excellent SCR performance of the iron ore. However, the addition of H2O and SO2 in the feed gas showed some adverse effects on the SCR activity. The FT-IR analysis indicated the formation of sulfate salts on the surface of the catalyst during the SCR reaction in the presence of SO2, which could cause pore plugging and result in the suppression of the catalytic activity.

1. Introduction

Current global major environmental problems, such as smog, rain, fine particle pollution, and ozone depletion are credited to nitrogen oxides (NOx, x = 1, 2) [1]. Around the world, NOx legislation has become more and more stringent due to the increased awareness in society about protecting the environment [2]. Therefore, in the modern era, a lot of focus is given to the removal of NOx by the researchers. To meet these stringent regulations of NOx abatement for point sources (coal-fired power plants), selective catalytic reduction (SCR) of NOx with ammonia (NH3) has become the most effective and extensively used NOx reduction technology [3]. Vanadium-based catalysts (V2O5/TiO2 or V2O5-WO3/TiO2) are the most common industrial catalysts for SCR of NOx with NH3, for which the most efficient reaction temperature range is 300~400 °C [4]. Since the operating temperature range is high, that is why the catalyst must be placed upstream of the desulfurizing section and the particulate removal device, to avoid reheating the flue gas; but it can cause deactivation due to the high concentration of sulfur dioxide and dust [5]. Other issues include high activity for the oxidation of SO2 to SO3 [6], the formation of N2O at high temperatures [7] and the toxicity of vanadium to the environment [8]. That is why recently, environmental catalysis has put great efforts into the development of V-free NH3-SCR catalysts.
Some other transition metal oxide-based catalysts (Cr, Mn, Fe, Ni, Zr, Co, Cu, La, etc.) have shown good NH3-SCR performance [9]. For example, Ma et al. prepared TiO2-supported iron oxide catalysts. It was found that Fe2(SO4)3/TiO2 catalysts have shown excellent NOx conversions in the NH3-SCR reaction at low temperatures [10]. Chen et al. synthesized a series of Fe–Mn oxide-based catalysts by three different synthesis methods: the citric acid method, the coprecipitation method and the solid reaction method [11]. The results exhibited that the catalytic activity of the catalyst prepared by the citric acid method (Fe(0.4)-MnOx(CA-500)) was higher (around 98.8% NOx conversion at 120 °C) than other catalysts. Sankar et al. applied two preparation techniques (impregnation and deposition–precipitation) to synthesize the Mn–Fe/TiO2 catalysts, and concluded that the deposition–precipitation technique-based catalyst (25 wt % Mn0.75Fe0.25Ti) showed superior catalytic activity (97% at 200 °C) [12]. Likewise, Wu et al. prepared a FeMnTiOx-mixed oxide catalyst by cetyltrimethylammonium bromide (CTAB)-assisted coprecipitation method [13,14]. It was found that the NOx conversion was around 80~100% at 100~350 °C. Zhang et al. prepared catalysts by loading Mn–FeOx and MnO2–Fe2O3–CeO2–Ce2O3 onto carbon nanotubes (CNTs) support, respectively [15,16]. The NOx conversion reached almost 100% from 140~180 °C. Although some catalysts could provide high NOx conversion at low temperatures, yet there exist some difficulties in their sophisticated preparation methods, as well as the fact that the preparation cost of these catalysts is very high.
For many centuries, the oxides of iron have been serving humankind. The first use of yellow and red ochres was in prehistoric paintings in the caves. After that, the role of iron oxides in our lives has seen an unbelievable expansion. Their primary applications include the steel industry (as a precursor of iron and steel), the ecosphere (their activity as absorbents), and chemical reactions (their ability to catalyze various chemical reactions). Around 80% of the world’s iron ore production consists of sedimentary iron ore, and the significant proportion of these sedimentary iron ore deposits in the world is made up of iron oxides [17].
Previously, the NO conversion of manganese ore has been investigated in some studies. Park et al. used natural manganese ore for NO reduction and studied its catalytic activity [18]. Similarly, Zhu et al. also studied the performance of natural manganese ore catalysts and showed that the NH3-SCR activity of the manganese-based catalyst reached 80% at 120 °C [19]. Gui et al. studied the performance of iron and iron ore particles as catalysts in a magnetically fluidized bed [20]. The results showed that the catalytic activity of the iron ore was not affected much by the magnetic field. However, some of these studies were unable to clarify why the temperature of NO conversion was reduced by those catalysts.
Inspired by the idea of finding a catalyst with low preparation cost, high NO conversion and nominal environmental pollution, natural iron ore as a De–NOx catalyst is investigated in this study. The methods of XRD, XRF, BET, XPS, H2-TPR, NH3-TPD, SEM and FT-IR were used to characterize the materials. The results showed that the sample A which calcined at 250 °C achieved excellent SCR activity (above 80% at 170–350 °C) and N2 selectivity (above 90% up to 250 °C) at low temperatures. Suitable calcination temperature, large surface area, high concentration of surface-adsorbed oxygen, good reducibility, lots of acid sites and adsorption of the reactants, were responsible for the excellent SCR performance of the iron ore. However, the addition of H2O and SO2 in the feed gas showed some adverse effects on the SCR activity. The FT-IR analysis indicated the formation of sulfate salts on the surface of the catalyst during the SCR reaction in the presence of SO2, which could cause pore plugging and result in a reduction of the catalytic activity.

2. Results and Discussion

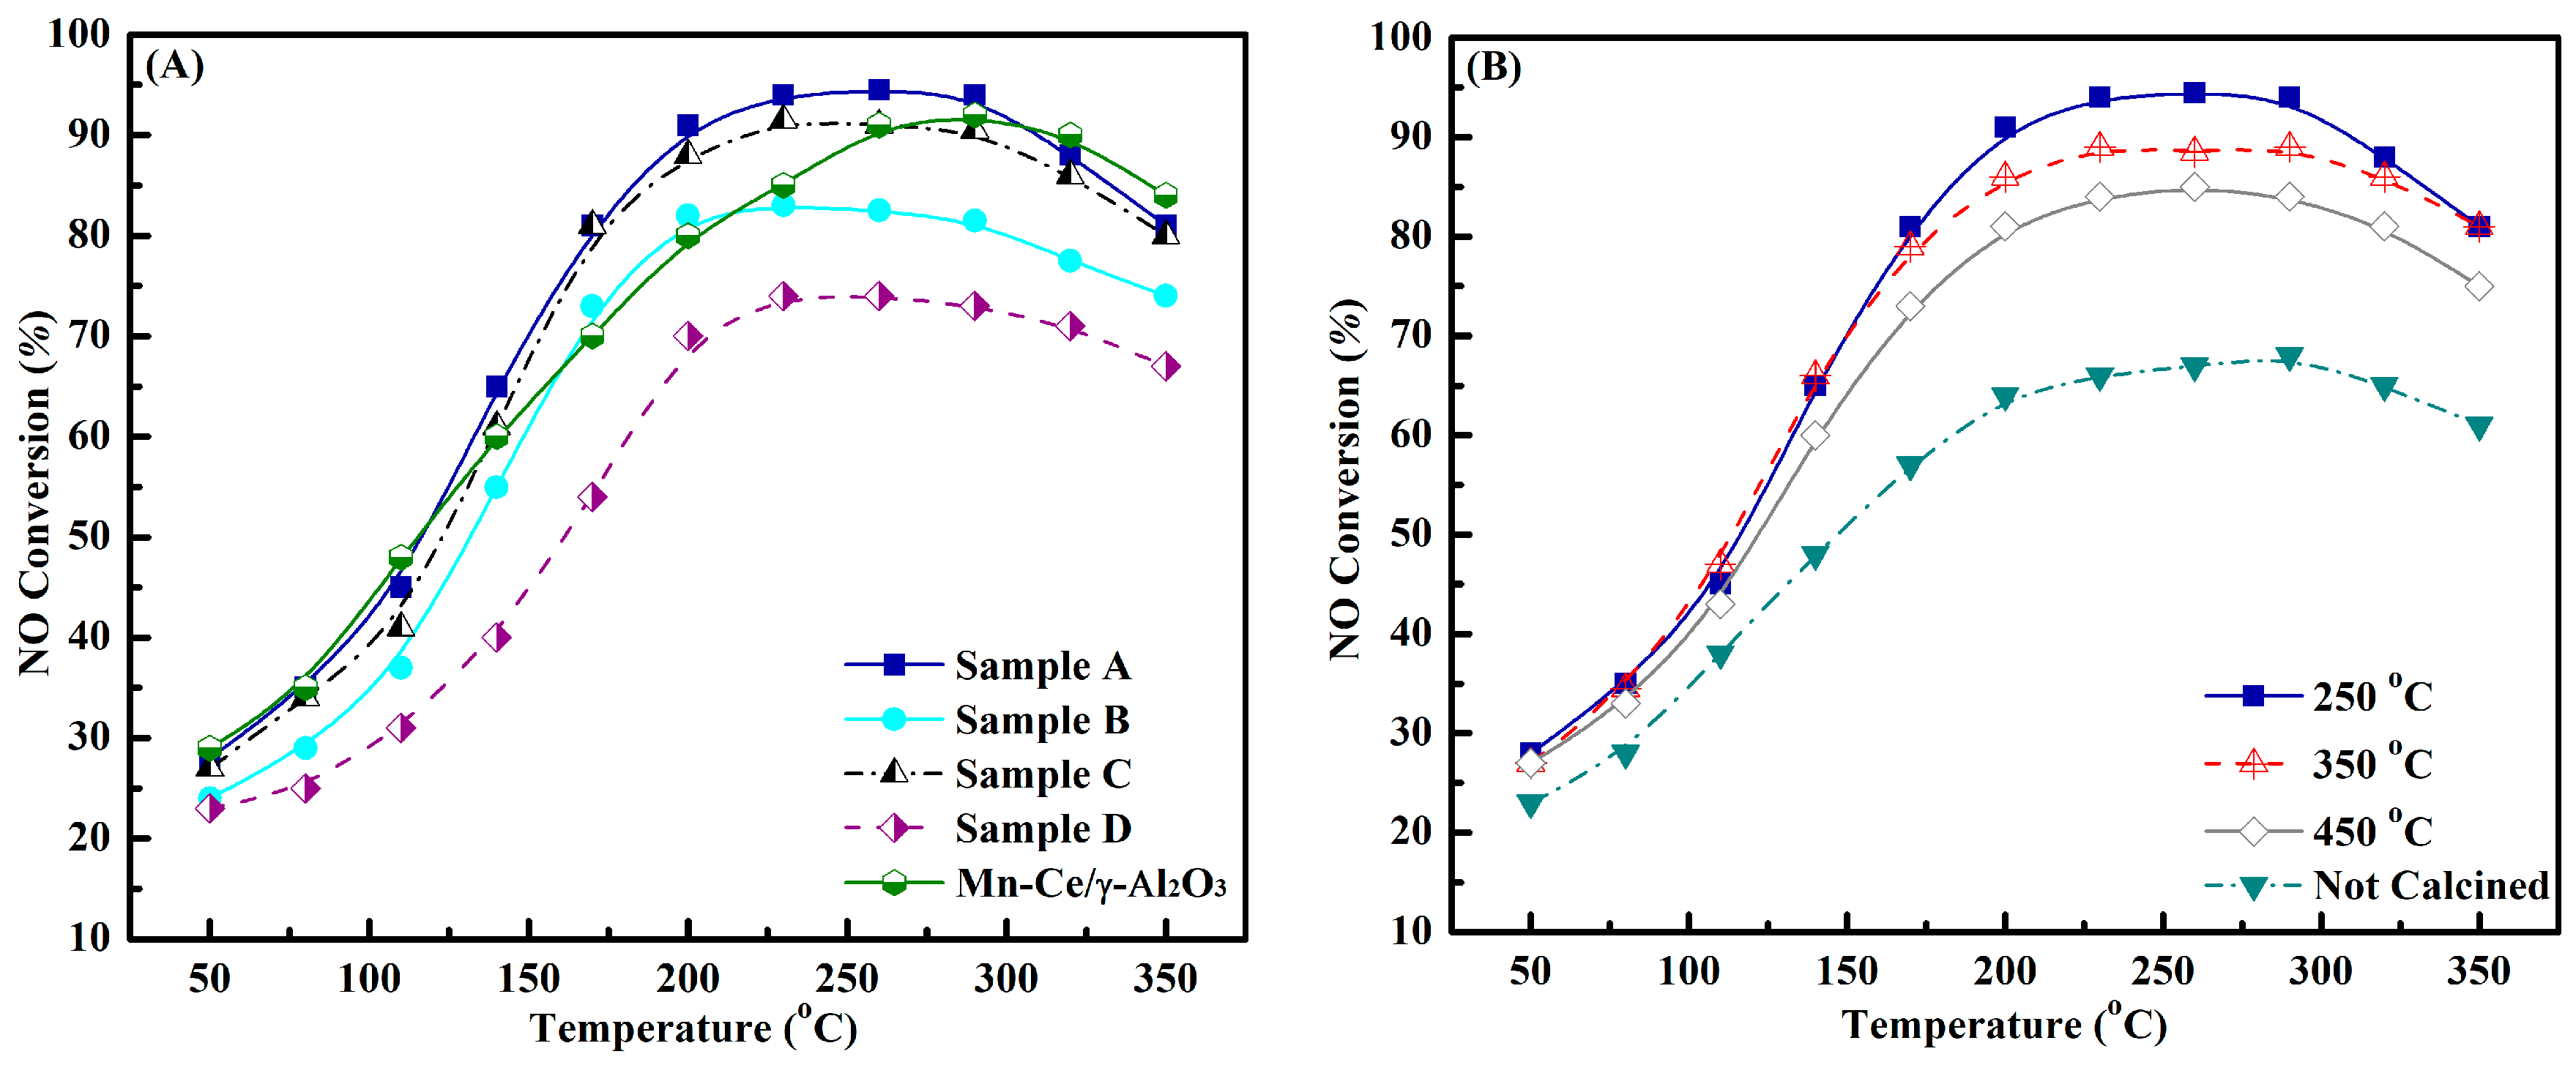
2.1. NH3-SCR Activity and Selectivity

For different samples calcined at 250 °C, the low-temperature SCR removal activity, and N2 selectivity at different reaction temperatures, are shown in Figure 1A and Table 1, respectively. It can be seen that sample A exhibited the best activity and selectivity among other samples in a wide temperature range with NO conversion above 90% from 200–290 °C and the N2 selectivity above 90% up to 250 °C.
It can be concluded that the catalytic activity and selectivity of all the samples were different from each other, which could result from the difference in their material structure, surface properties and composition of the iron ore. The catalytic activity and selectivity of the catalysts at low temperatures followed the particular sequence: Sample D ˂ Sample B ˂ Sample C ˂ Sample A. In addition, it can be seen that the NO conversion of sample A is higher than the Mn–Ce–γ–Al2O3 catalyst [21] within 150–300 °C, even though the gas hourly space velocity (GHSV) of our experiments is higher than that of the literature.
Calcination of a catalyst can help to obtain a large specific surface area and better dispersion of the active ingredients of the catalyst [2]. To find out the suitable calcination temperature for iron ore catalysts, sample A was thermally treated to different temperatures (250 °C, 350 °C, 450 °C) and the NO conversions are shown in Figure 1B. The results showed that the NO conversions of the thermally-treated samples were better than the sample without thermal treatment. For example, at 200 °C reaction temperature, the NO conversion of sample A that calcined at 250 °C was 91%, whereas the catalytic activity of sample A without calcination was just 64%. Additionally, the sample A calcined at 250 °C showed better NO conversion than the other samples calcined at 350 °C and 450 °C, respectively, indicating the possible severe morphology changes in the iron ore sample after high calcination temperatures of 350 and 450 °C (as shown in SEM results). Higher calcination temperatures cause a decrease of the surface area and the mobility of lattice oxygen, which may be the reason for the lower catalytic activity of these samples [19,21].

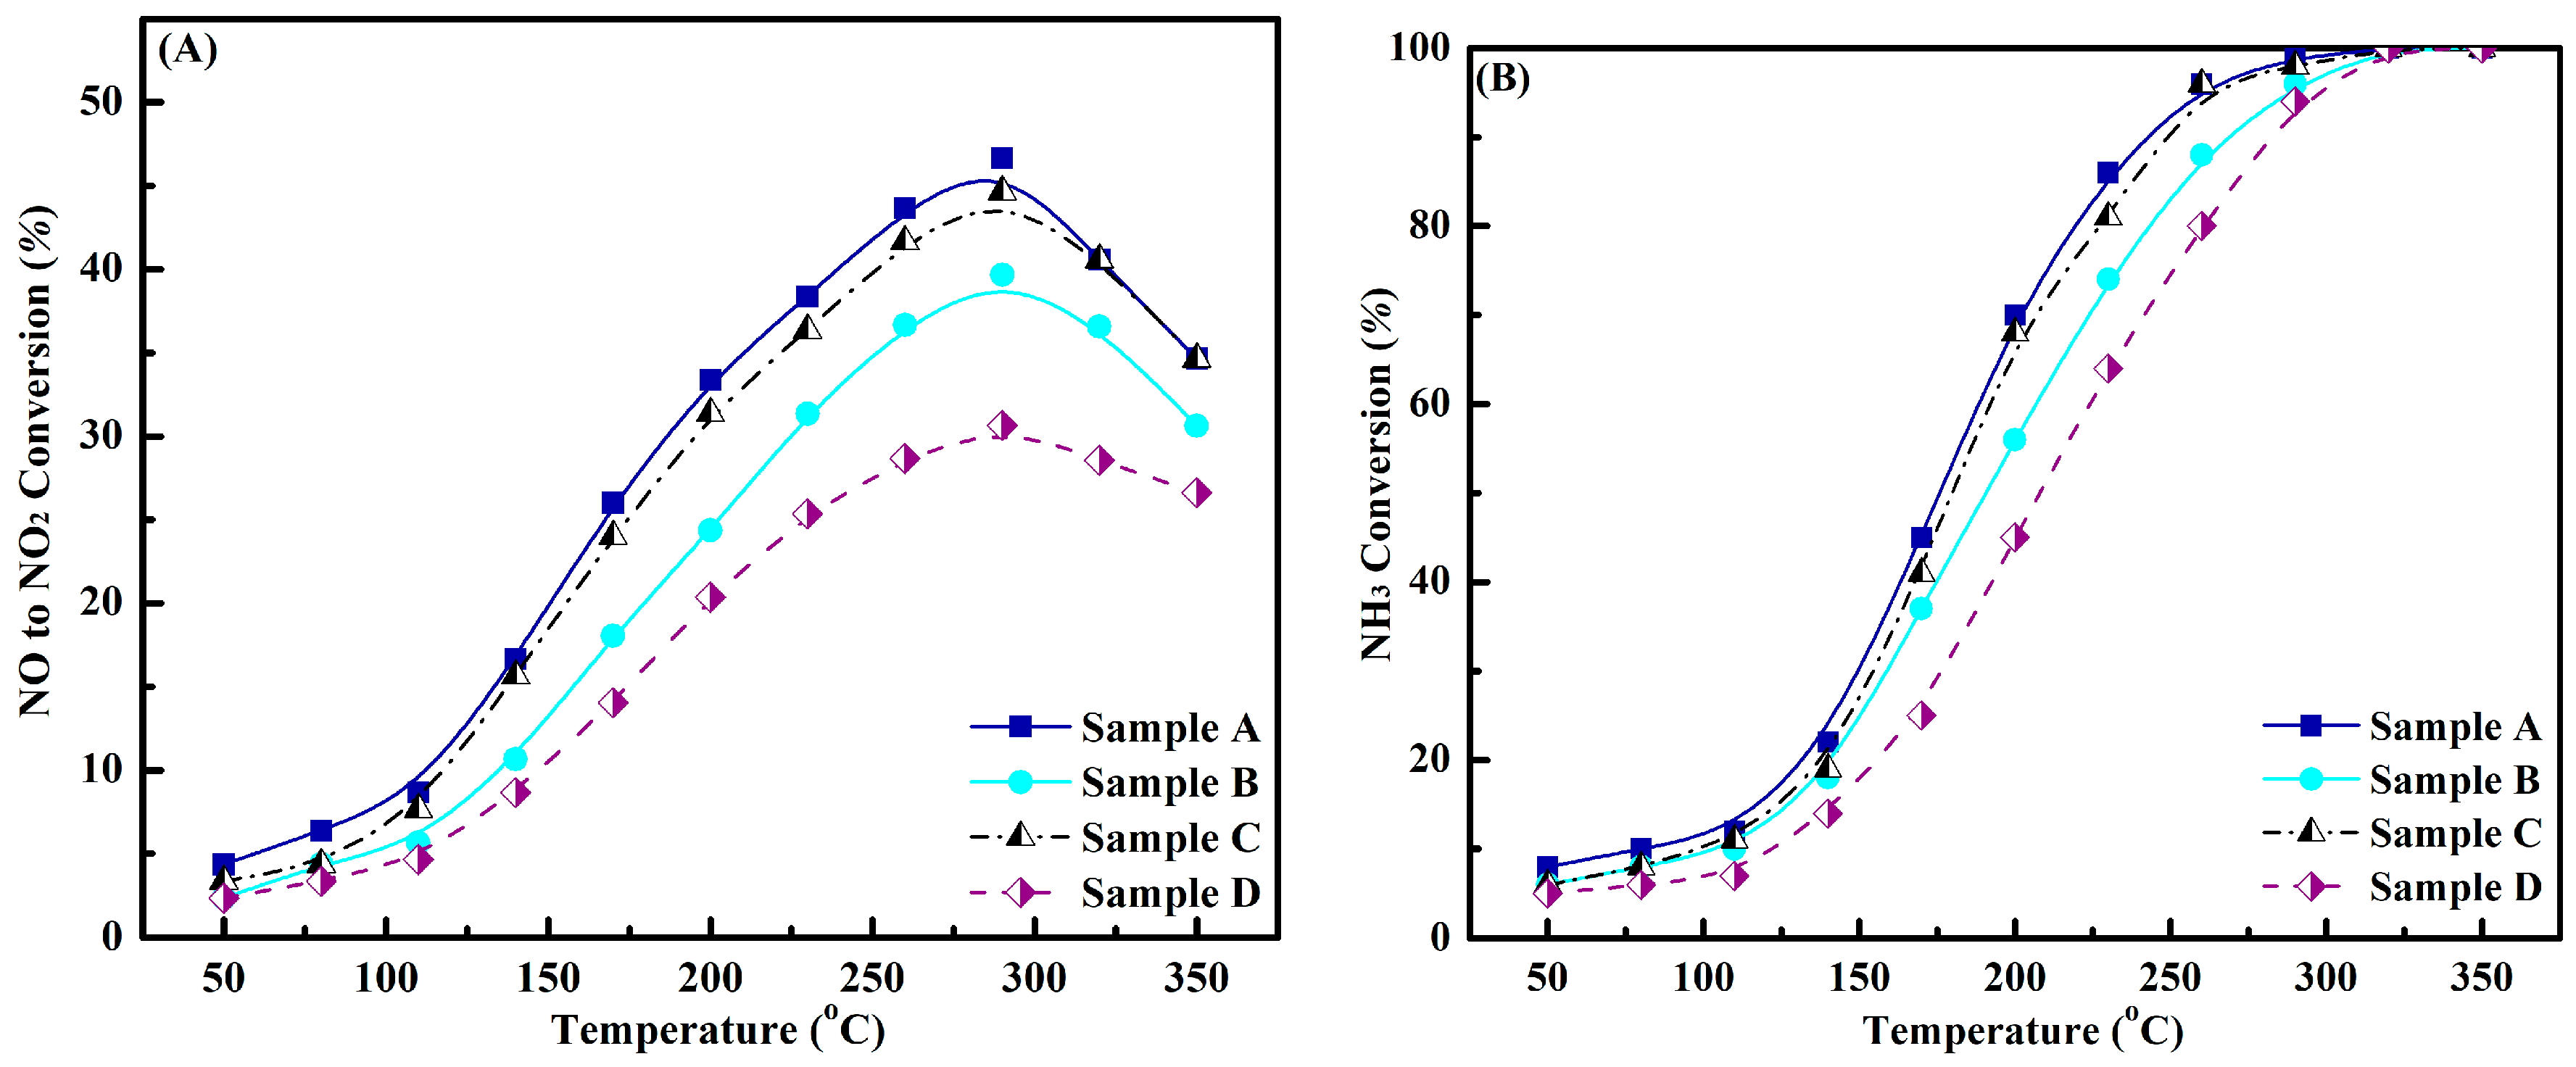
2.2. NO, and NH3 Oxidation Activity

It was reported that with the increase in the NO2/NO molar ratio in the feeding gas fast SCR reaction: NO + NO2 + 2NH3→2N2 + 3H2O could be promoted, which can significantly boost the low-temperature SCR activity of the catalyst [16,22]. That is why separate NO oxidation activities of the different samples were tested and the results are demonstrated in Figure 2A.
It can be seen that with the rise in temperature the NO oxidation activities increased, first up to the 300 °C reaction temperature, and then decreased. Some evident differences could be seen between the NO oxidation activity and SCR activity of the samples which could be ascribed to the role of NH3 during SCR reaction; in a real SCR reaction, the presence of NH3 would increase the NO to NO2 conversion as compared to the pure NO oxidation. NO conversion to NO2 was proven to be a slow step for an SCR reaction, and the NO2 generated was rapidly consumed in the existence of ammonia [22]. Sample A comprising the larger weight fraction of γ-Fe2O3 exhibited the highest NO conversion to NO2 as well as the NH3–SCR activity. Figure 2B shows that the NH3 oxidation increased with the rise in temperature. This increase in the NH3 oxidation at high temperatures is considered as a side reaction which aids in the formation of NO in the NH3–SCR system and also causes the deactivation of the catalysts at high temperatures [13].

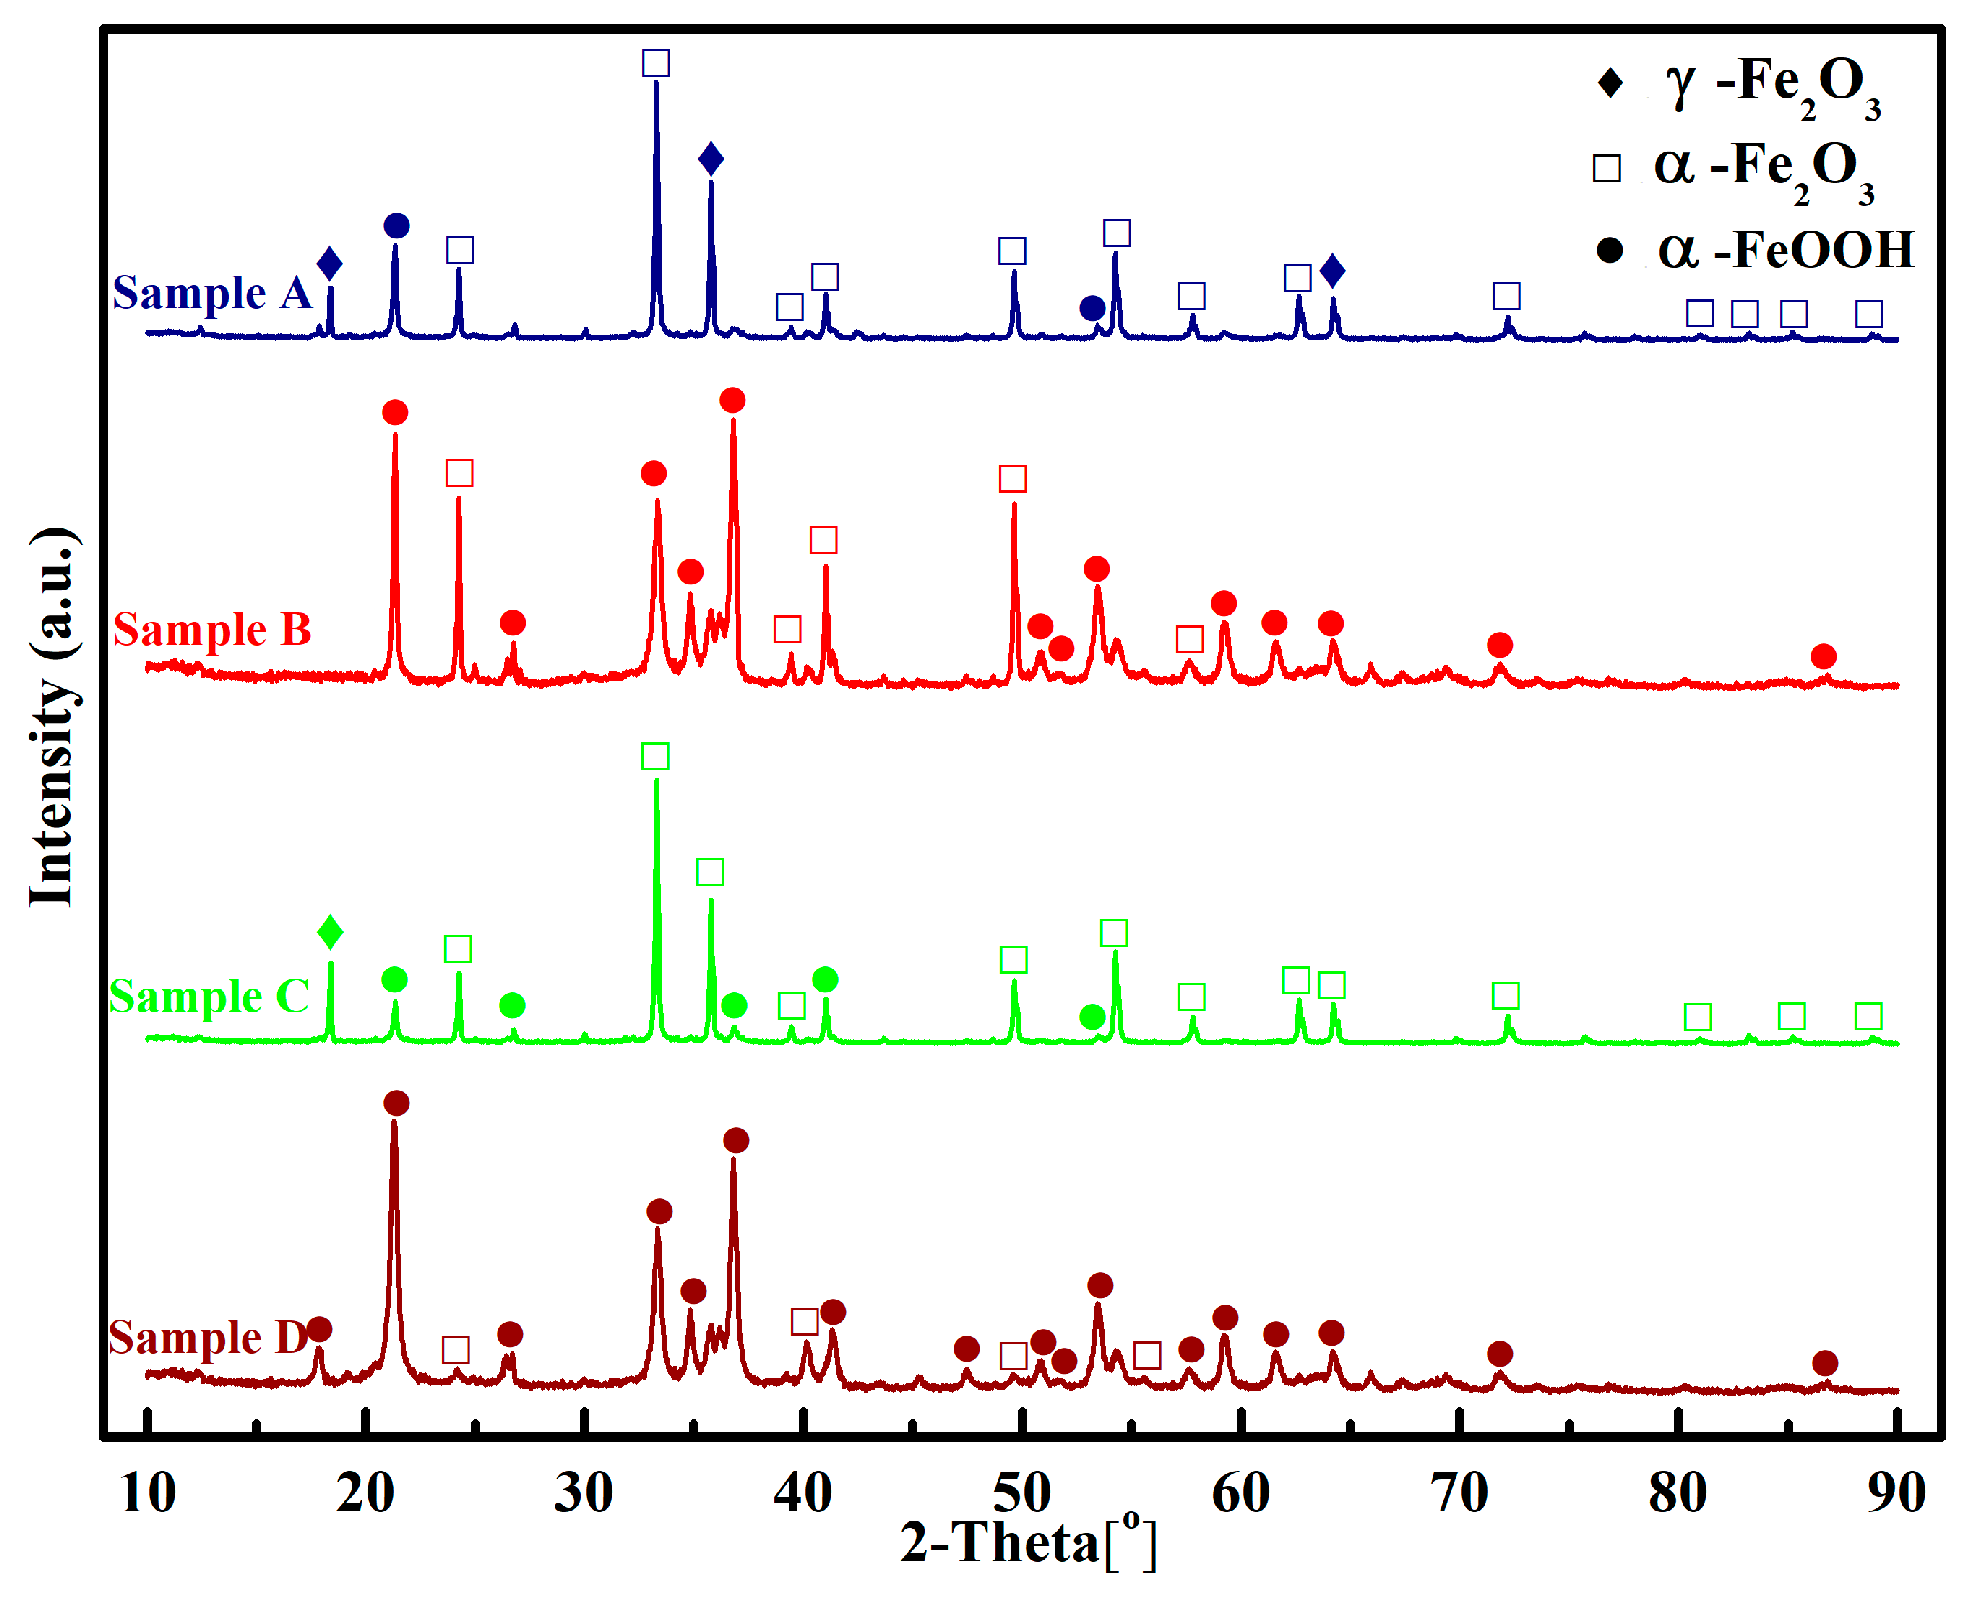
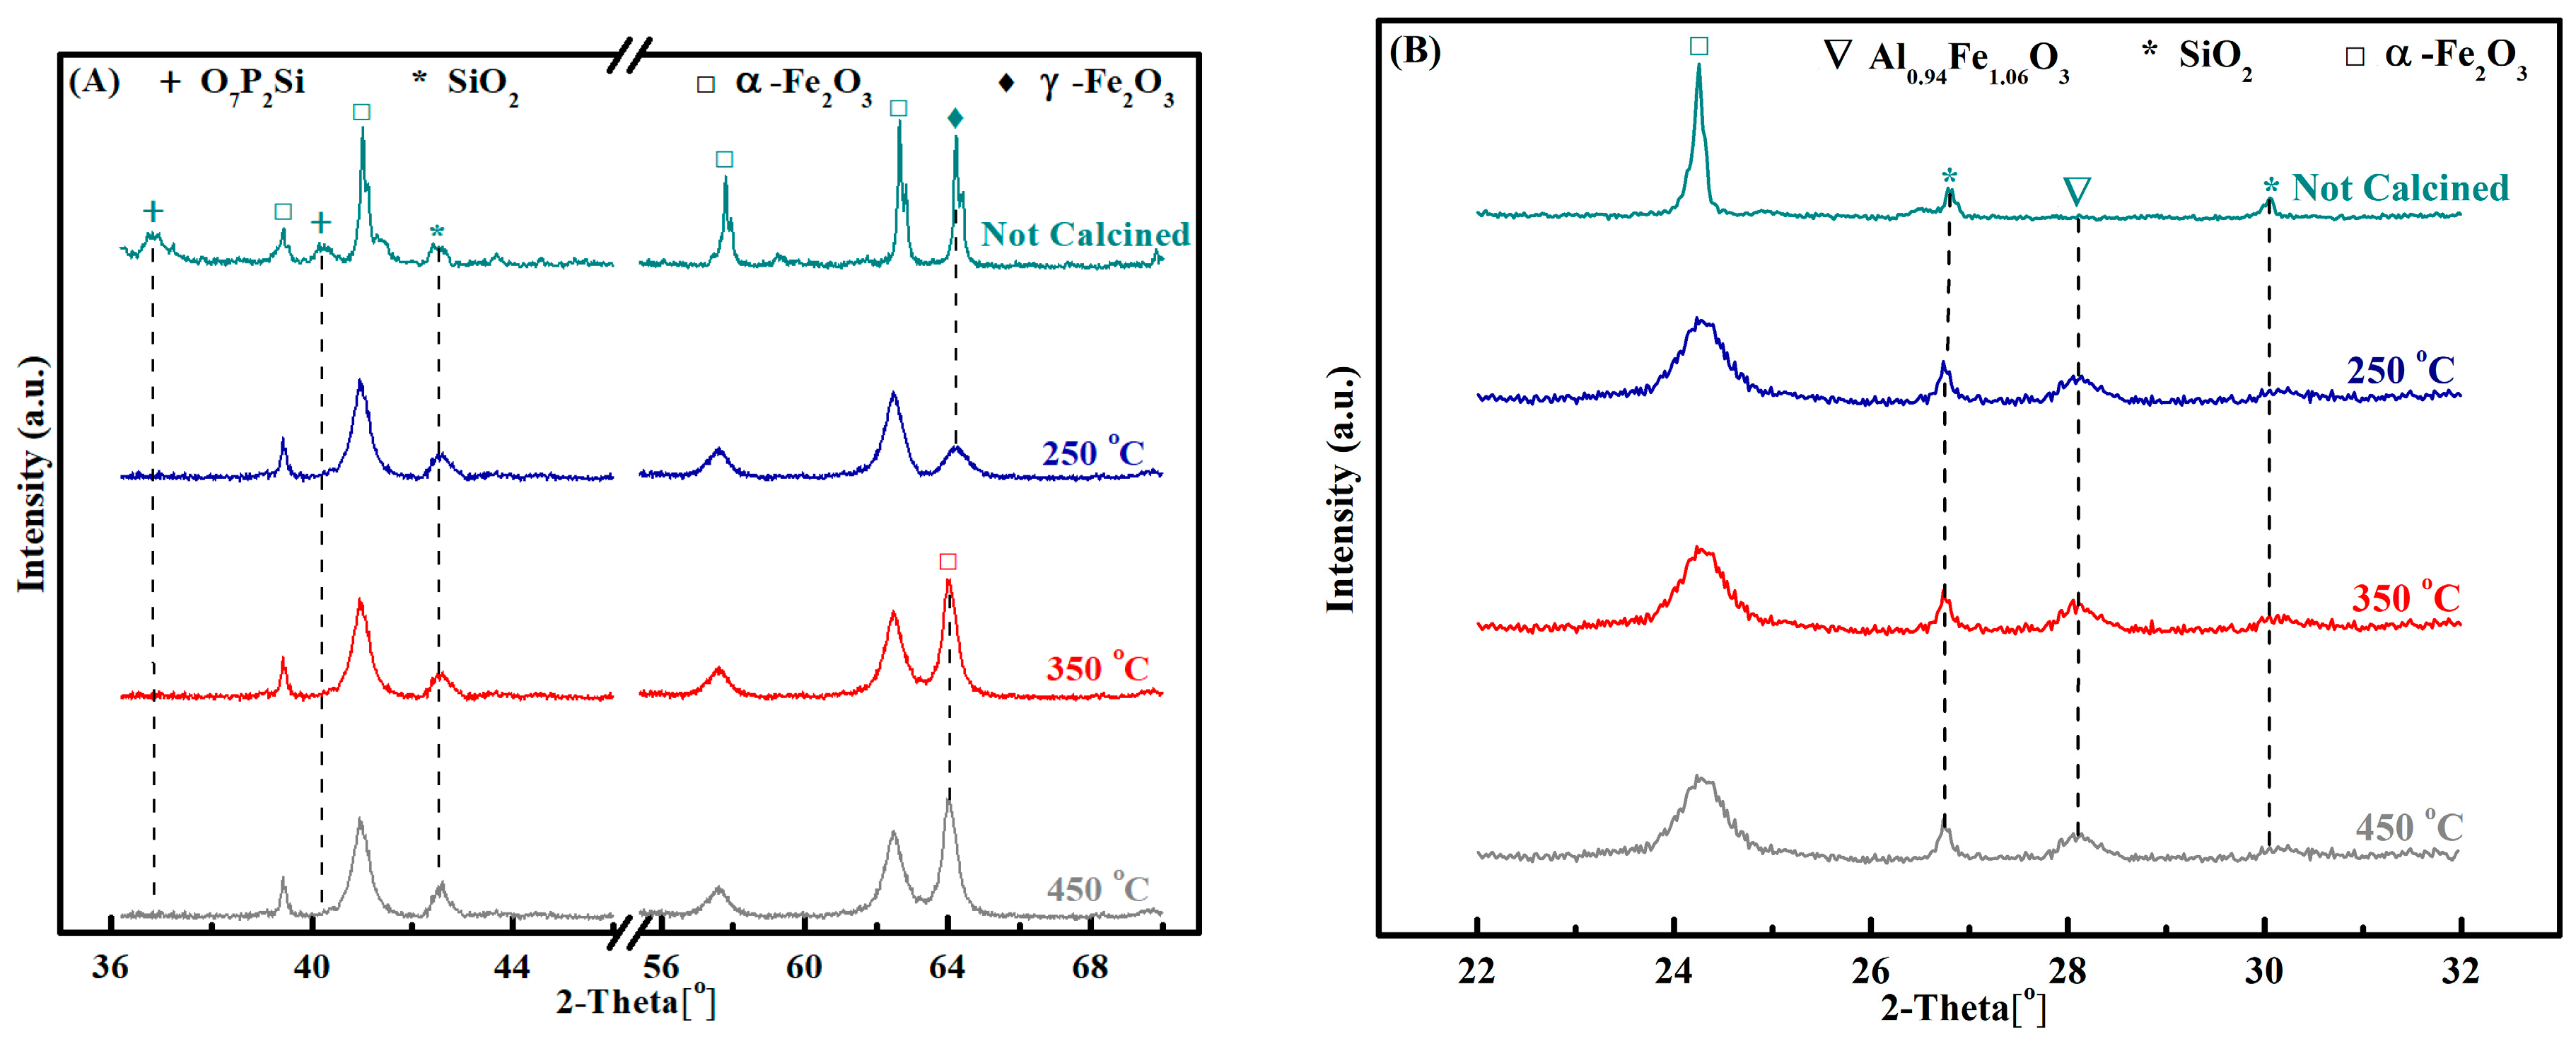
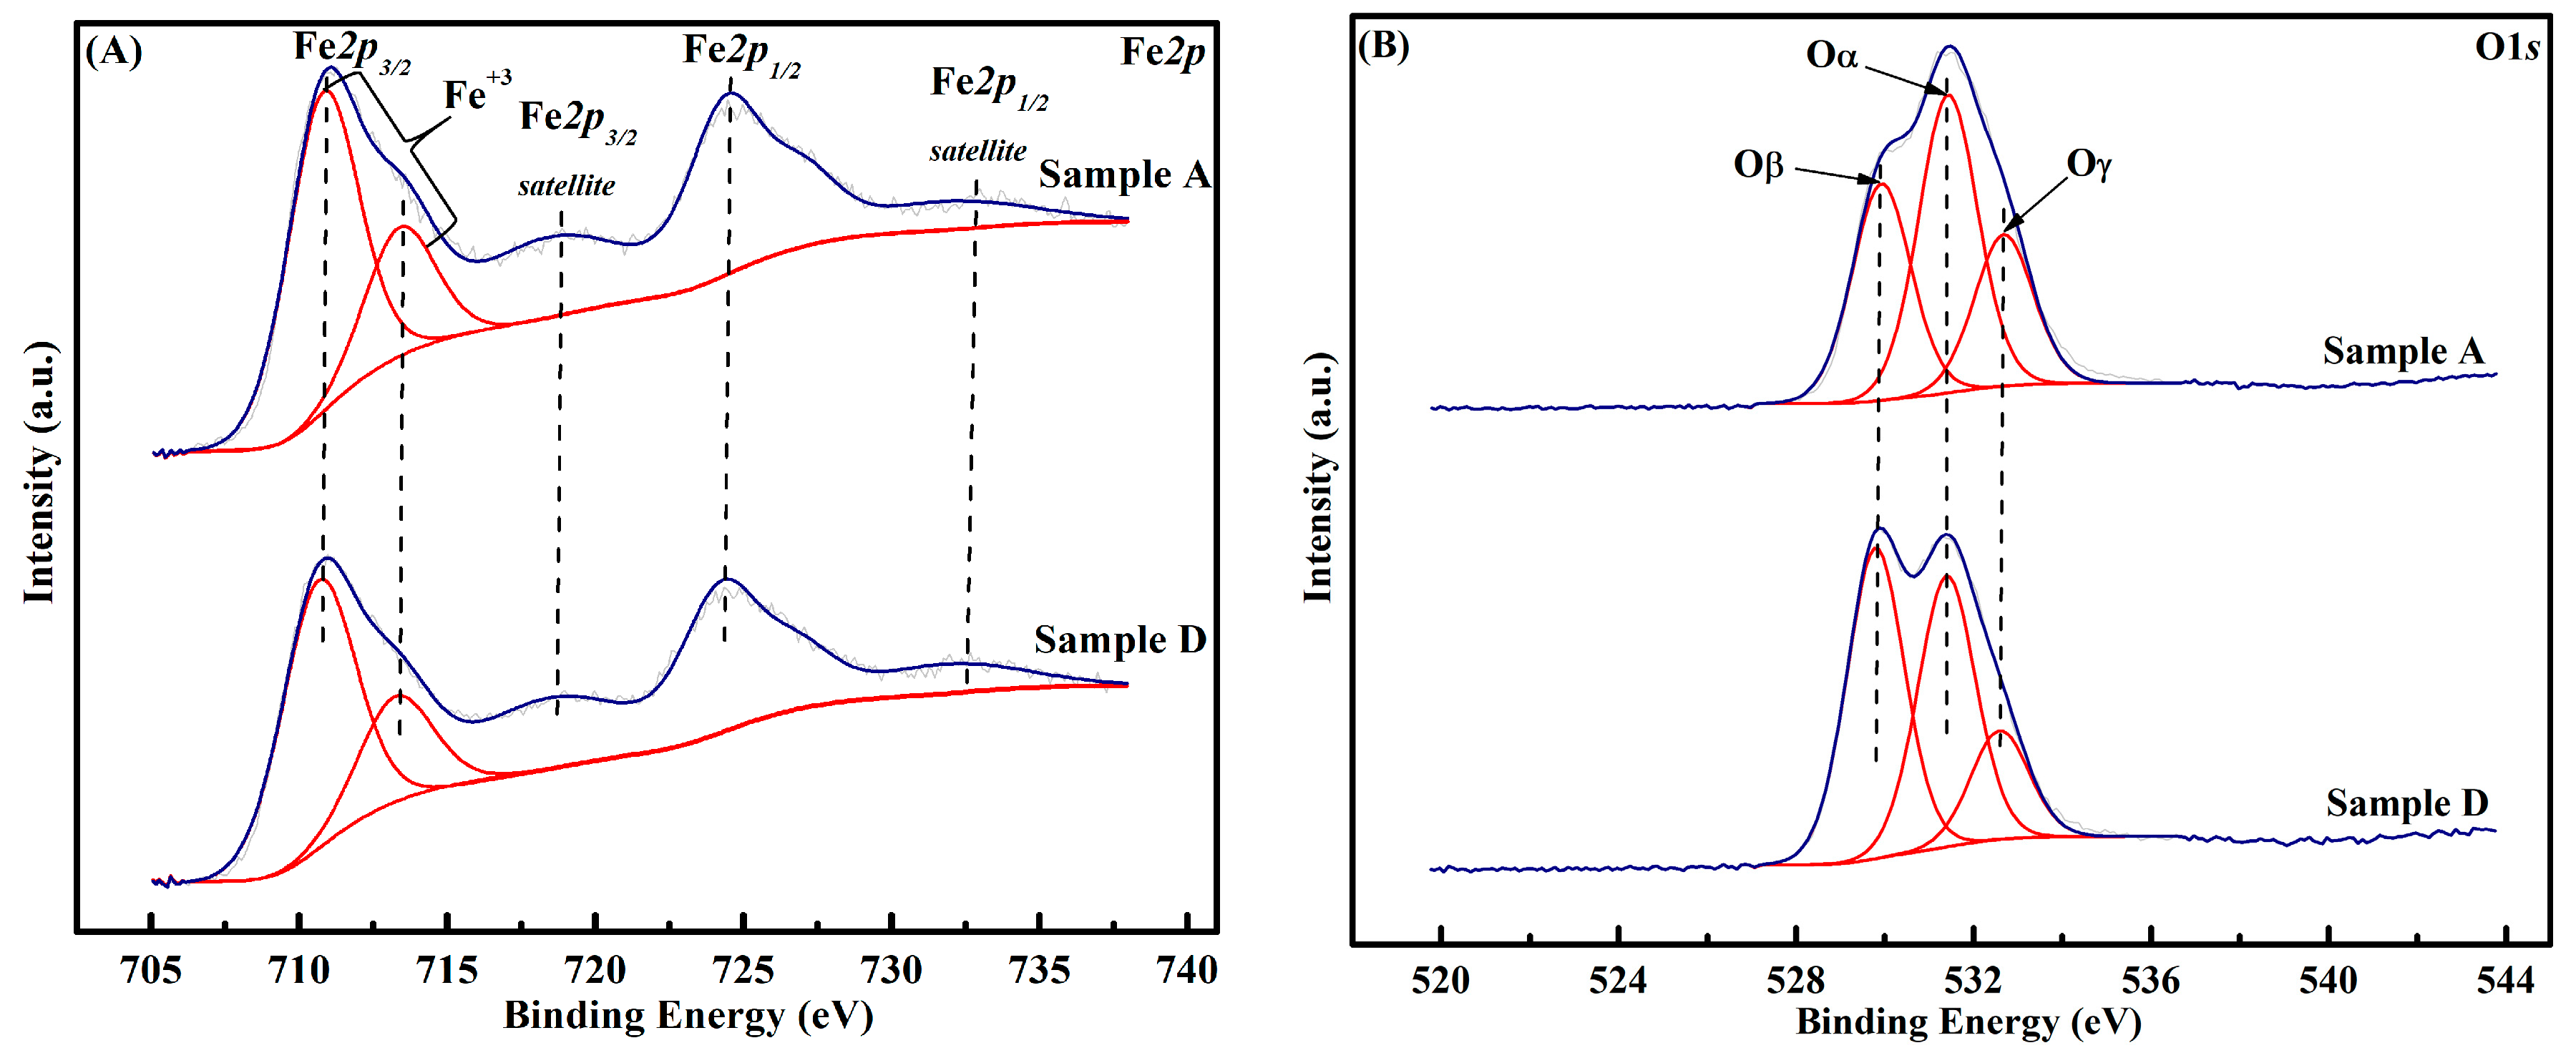
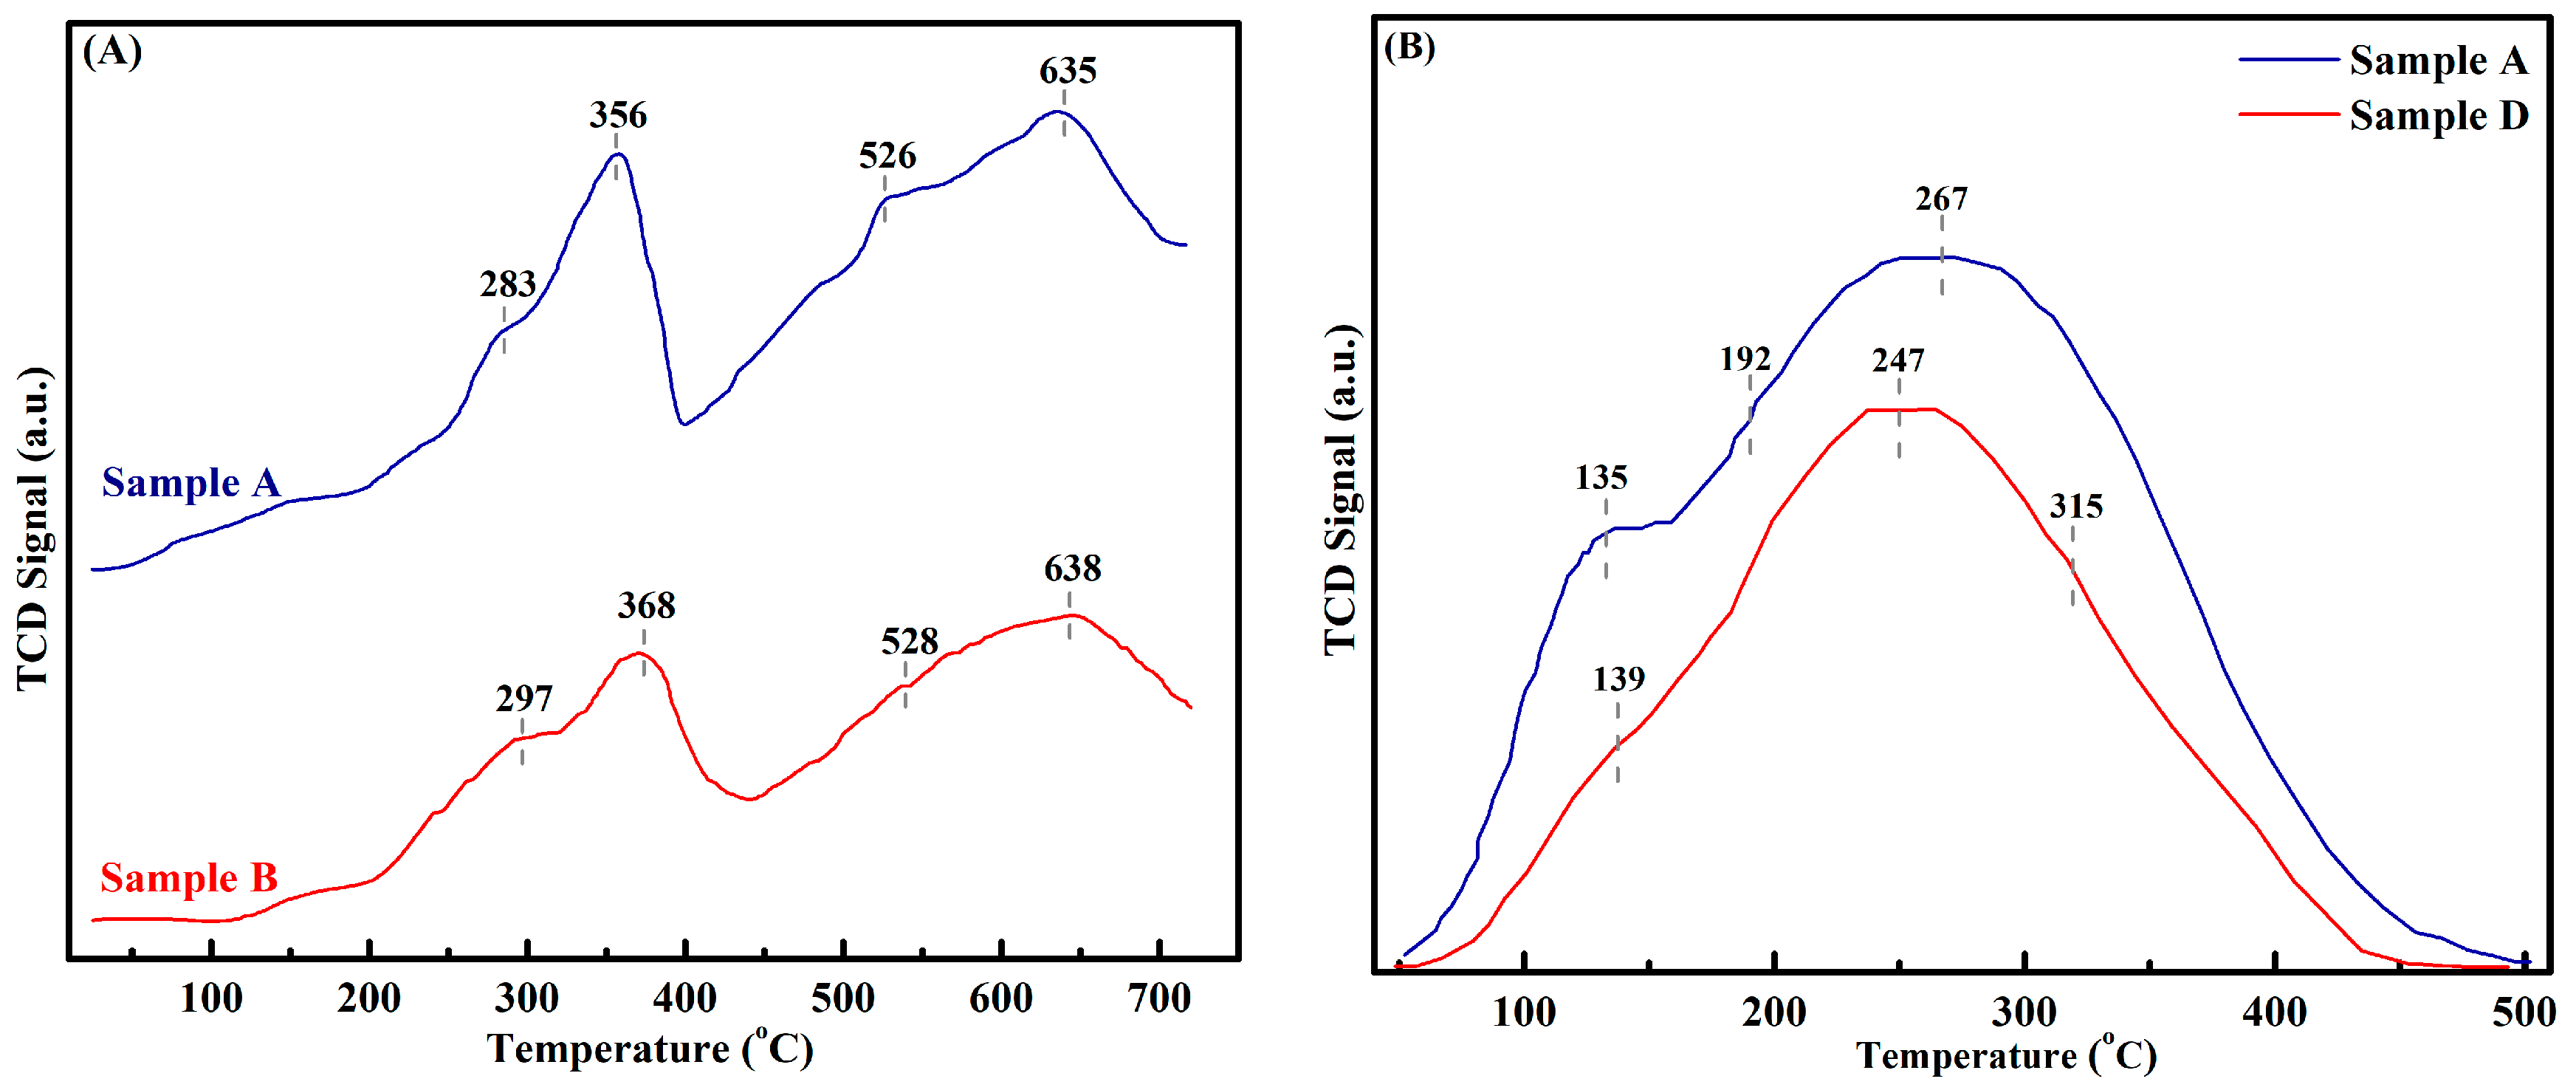
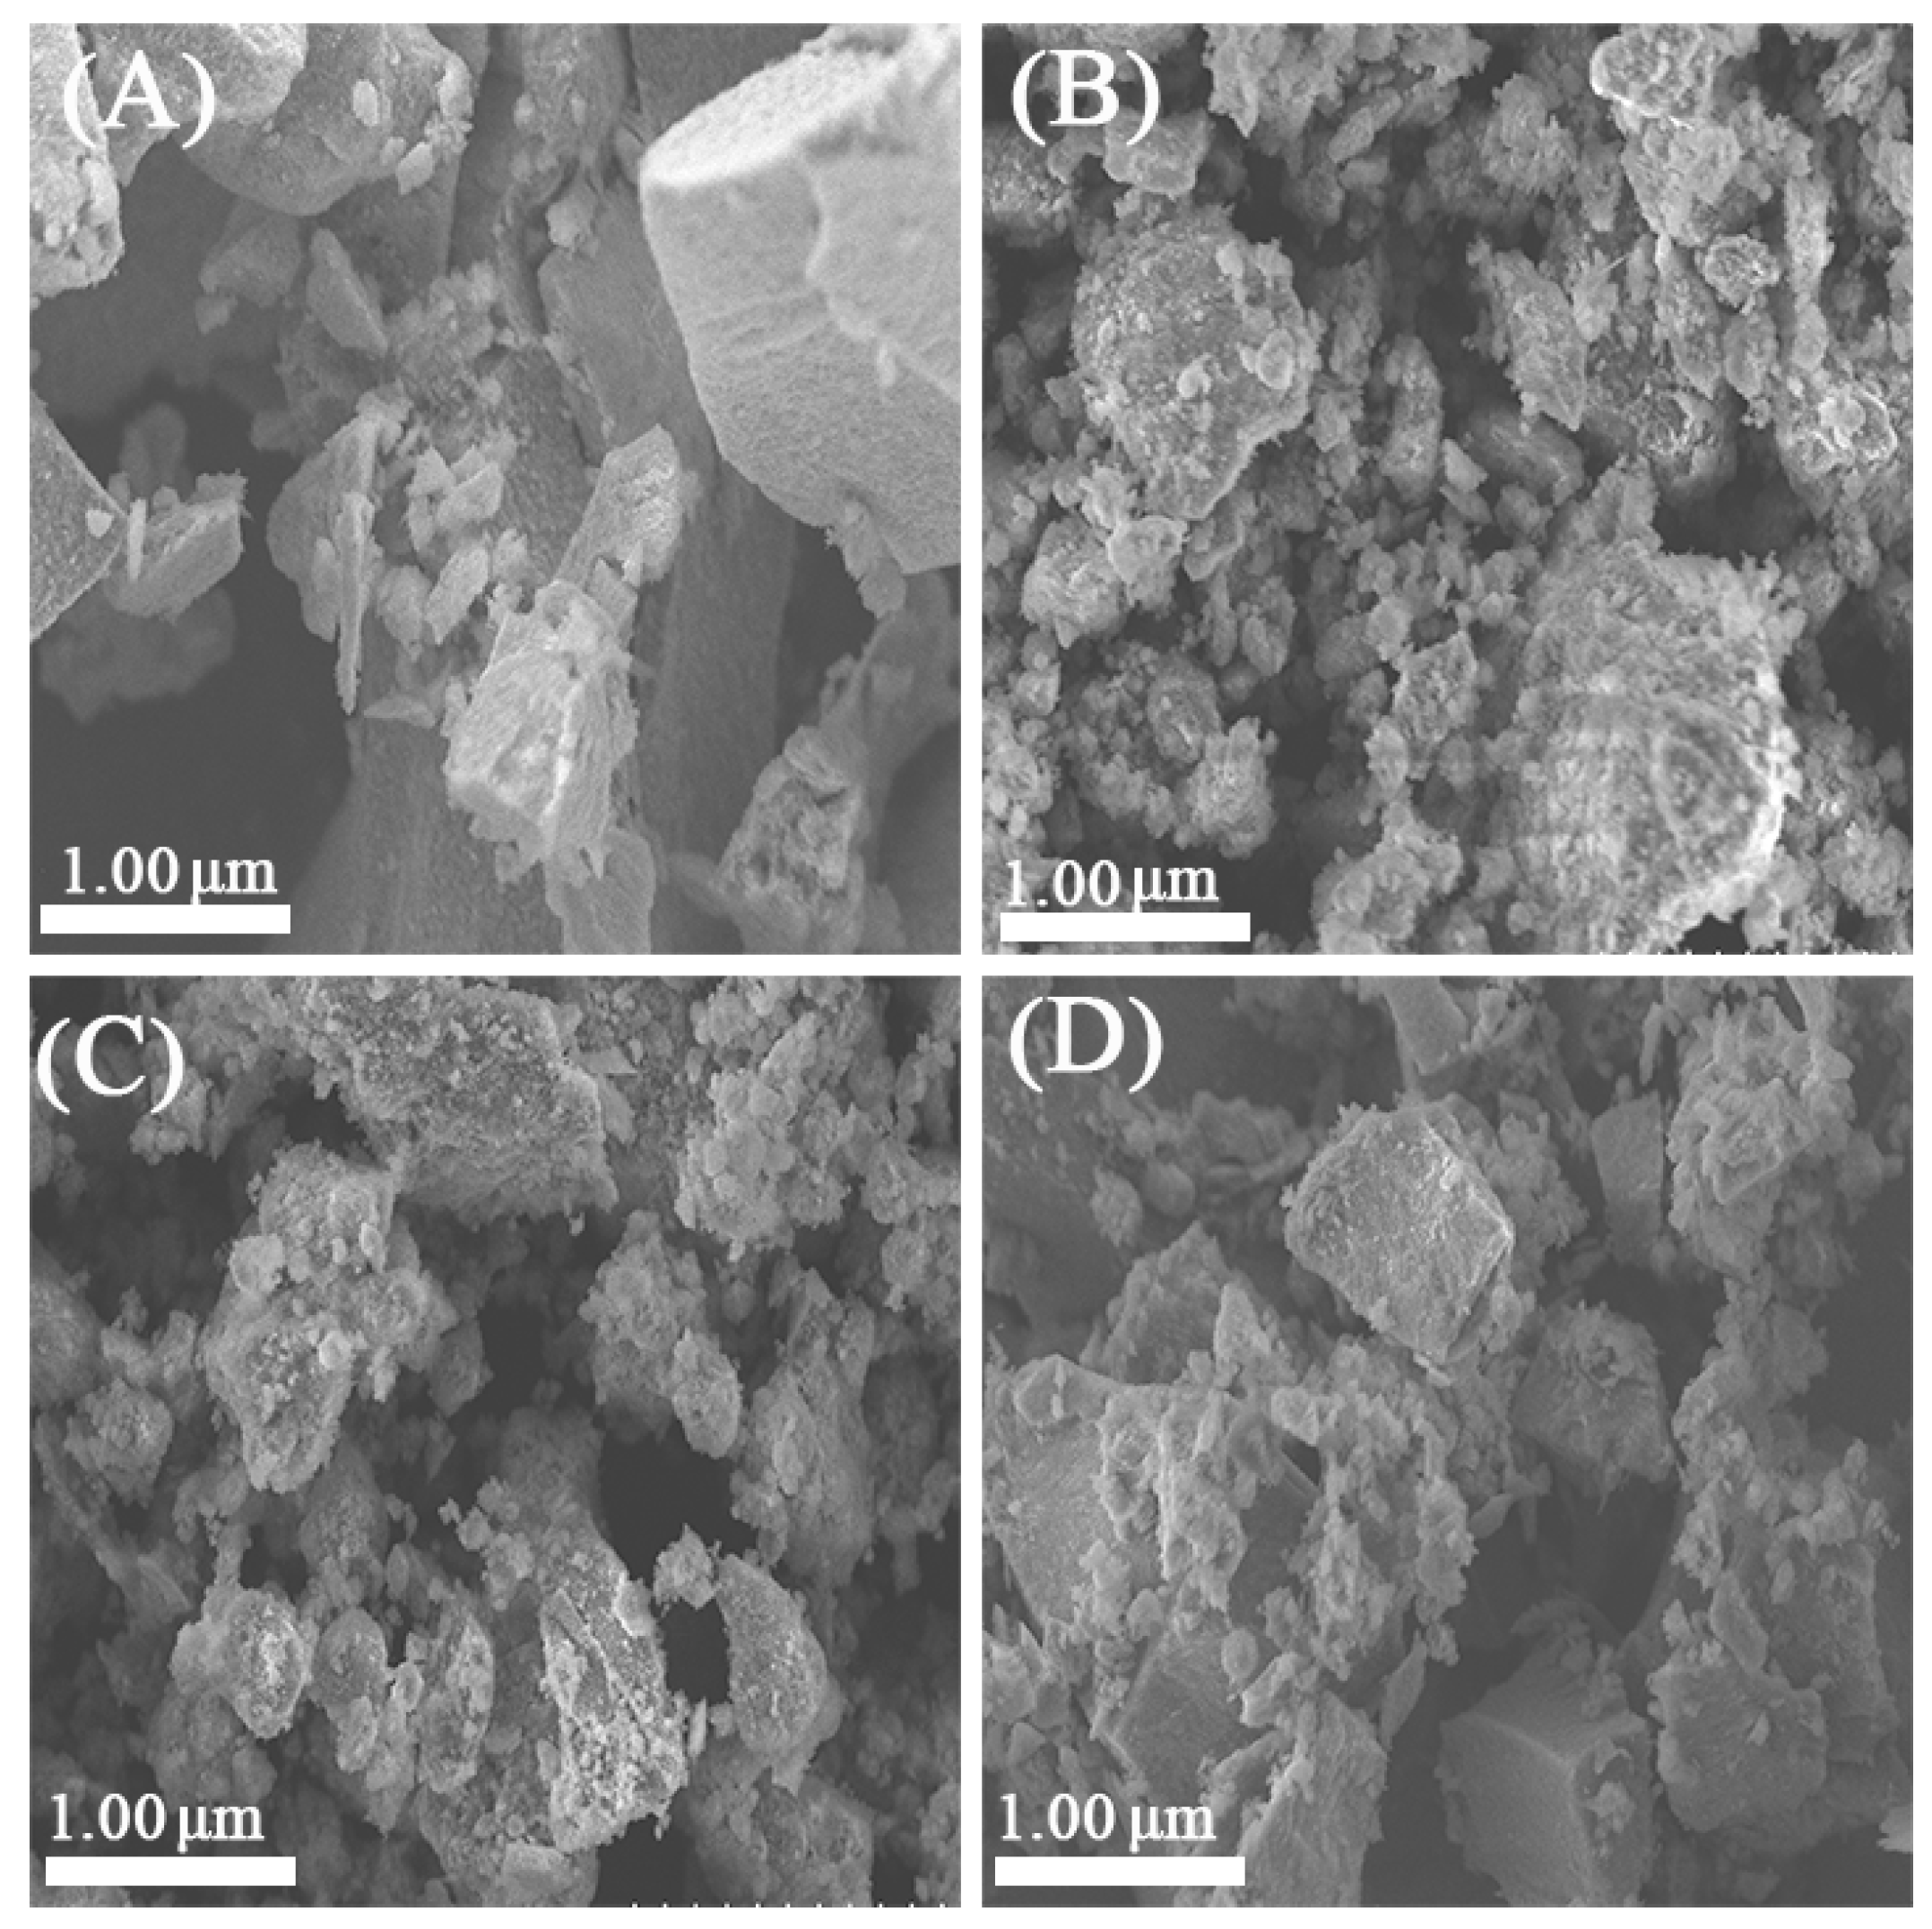
2.3. Characterization

XRD patterns of the different iron ore samples without calcination are shown in Figure 3. It can be seen that the samples consist of three minerals of iron: γ-Fe2O3 (maghemite, JCPDS 00-39-1346), α-Fe2O3 (hematite, JCPDS 01-089-8104) and α-FeOOH (goethite, JCPDS 00-017-0536).
The diffraction spectra of sample A indicated that three main phases of ferric oxide (α-Fe2O3, α-FeOOH and γ-Fe2O3,) were present in it, and through quantitative analysis by the Rietveld method it was found that the ratio of these three phases in sample A was 59.4:11.5:29.1, respectively. Similarly, in sample C the ratio was 67.7:24.1:8.2, respectively. Diffraction spectra of sample B showed that α-Fe2O3 and α-FeOOH were the two phases present in the sample and existed in 27.4:72.6, respectively. Whereas, in sample D the ratio was 7.7:92.3, respectively.
The XRD spectra in Figure 3 depicts that the sample A comprised mainly of α-Fe2O3 and γ-Fe2O3 and the weight fraction of γ-Fe2O3 was found highest among other samples. With a change in the temperature range, the catalytic influence of these two components varies. The optimum temperature of the NO conversion of γ-Fe2O3 is relatively low as compared to α-Fe2O3 [23]. It is known that the lattice of γ-Fe2O3 has point defects created by its cation vacancies [24]. These point lattice defects could be useful in providing more active sites for the catalytic reaction to take place, as well as contribute to the surface electron transfer in the SCR reaction. So the existence of γ-Fe2O3 could be crucial for the low-temperature SCR activity of the iron ore.
Partly magnified XRD spectra of the ‘not calcined’ as well as ‘calcined’ sample A at different temperatures is shown in Figure 4. Sample A without calcination exhibited sharp crystalline peaks of α-Fe2O3 and γ-Fe2O3, indicating good crystallinity (Figure 4A). After calcining the sample to 250 °C, both phases of the Fe2O3 were still intact, but the intensities of the peaks were much lower, indicating a poor crystallinity (amorphous structure formation verified by SEM) which was beneficial for obtaining high SCR activity at low temperatures. However, with a further rise in calcination temperature above 250 °C, the γ-Fe2O3 phase (peak at 63.99°) in the sample has been converted into the α-Fe2O3 phase (peak at 64.17°). Cao et al. also concluded that after increasing the calcination temperature above 250 °C, the γ-Fe2O3 particles started to engulf their surrounding crystals and the different sizes of the α-Fe2O3 particles formed [25], which resulted in the decrease of surface area. According to the Scherrer formula (Equation (5)), the half-width of the diffraction peak and the crystallite size of the material are inversely proportional to each other. So, the average crystallite sizes of the sample that was calcined at 350 °C and 450 °C, respectively are larger than the sample calcined at 250 °C, which could be related to the sintering (frittage) phenomenon at higher temperatures and the formation of α-Fe2O3. That is why the samples calcined at a higher calcination temperature (350 °C, 450 °C) exhibited lower catalytic activity and selectivity than the sample calcined at 250 °C (Figure 1, Table 1).
In addition, it can be seen in Figure 4A (not calcined sample), apart from α-Fe2O3 peaks, two small peaks appear at 36.8° and 40.25° which correspond to the O7P2Si crystals phase (JCPDS 00-022-1274), and one peak at 42.46° represents the presence of SiO2 (JCPDS 00-046-1045). In calcined samples, the peaks of O7P2Si are not present. However, the peaks of Al0.94Fe1.06O3 (JCPDS 00-011-0562) at 28.36°, and SiO2 at 26.7° are detected (Figure 4B). These results exhibited that the O7P2Si was decomposed to SiO2, and after calcination Al0.94Fe1.06O3 was formed. This formation of Al0.94Fe1.06O3 may have aided in a better NO reduction of sample A.
The elemental compositions of the iron ore samples show that Fe, O, Al and Si are the major elements present in these samples (Table 2). Natural iron ore was composed mainly of ferric oxide (XRD). Ferric oxide, particularly maghemite (γ-Fe2O3) particles, exhibited good SCR activity at low temperatures [26], and the interactions of some major elements like Al and Si with ferric oxide could be beneficial for the low-temperature SCR activity [27,28,29]. XRD results indicated the formation of Al0.94Fe1.06O3 and SiO2 (from the decomposition of O7P2Si) after calcining the catalyst, which may have assisted in a better NO reduction of sample A.
BET surface areas and average crystallite size of the catalysts are shown in Table 3 and Table 4. It can be seen from Table 3 that BET surface areas of the calcined samples are much higher than the non-calcined sample, and a decline in the surface area of sample A was observed with a rise in calcination temperature (350 °C and 450 °C). In addition, it can be seen from Table 3 that the surface area of the catalysts and the average crystallite size are inversely proportional to each other. Table 4 is comprised of BET surface areas and the average crystallite size of the different samples of the iron ore calcined at 250 °C. Sample A exhibited the highest surface area among other samples. Larger surface area can help to provide more active sites on the surface of the catalyst by which flue gas adsorption could be promoted. That is why the catalytic activity and selectivity of the sample A calcined at 250 °C was the best among other samples (Figure 1, Table 1).
XPS analysis was performed to identify the oxidation state of the surface elements of the iron ore samples. For samples A and D, the binding energy values (in eV) and valence state ratios of O are shown in Table 5. The XPS spectrum of the samples in the Fe2p and O1s regions are shown in Figure 5.
Figure 5A shows the Fe2p spectra of the samples A and D. For sample A, the characteristic peaks of Fe 2p3/2, Fe 2p3/2 satellite, Fe2p1/2 and Fe 2p1/2 satellite were located at 710.8, 718.7, 724.7 and 732.5 eV, respectively [30]. Whereas for sample D, the characteristics peaks have shown a little higher BE values (Fe 2p3/2 (710.9), Fe 2p3/2 satellite (718.9), Fe2p1/2 (724.8) and Fe 2p1/2 satellite (732.9) (in eV)). The Fe2p3/2 envelopes of both the samples showed multiple splitting spectra and are in good agreement with the Gupta and Sen (GS) multiples [30]. The fitted 2p3/2 envelopes in the samples correspond well to the presence of iron oxide in the Fe3+ state [31]. The result is in good agreement with the XRD data (Figure 3 and Figure 4). The XPS spectrum of the Samples A and D in the O1s region is shown in Figure 5B. After deconvolution of the peaks, the O1s spectra peaks of both of the samples can be separated into three peaks. According to the literature [32], the peak at the lower BE around 529.9 eV corresponds to the lattice oxygen (denoted as Oβ); the second one at a bit higher BE value around 531.4 eV corresponds to the surface adsorbed oxygen (denoted as Oα); the third peak around 532.6 corresponds to the peak originates from chemisorbed water (indicated as Oγ). It is reported that surface chemisorbed oxygen (Oα) is highly active in the oxidation reaction because of its higher mobility than the lattice oxygen (Oβ) [33], and the high SCR activity could be correlated with the high relative concentration ratio of Oα/Oα + Oβ + Oγ on the surface of the catalyst. As shown in Table 5, the concentration ratio of Oα/(Oα + Oβ + Oγ) of sample A was 44%; whereas, the concentration ratio of sample D was 39%. Therefore, the higher NO conversion of sample A could be due to higher values of surface chemisorbed oxygen (Oα).
To examine the redox properties of samples A and D, temperature-programmed reduction (H2-TPR) experiments were conducted. Generally, the hydrogen consumption peaks located at 250–500 °C are attributed to surface lattice oxygen, and peaks at 500–700 °C are attributed to bulk lattice oxygen [34]. Figure 6A shows the H2-TPR profiles of samples A and D. It can be seen that two well-separated reduction peaks were present in the H2-TPR profiles of the catalysts. Surface lattice oxygen was credited with the first stage of the reduction process from hematite to magnetite (α-Fe2O3 → Fe3O4) in the low-temperature peak, and the bulk lattice oxygen was responsible for the reduction of magnetite to metallic iron (Fe3O4 → Fe) in the high-temperature peak. In point of fact, with a sample heating rate of 5.5 °C per minute and higher, two heavily overlapped peaks could be observed in the high-temperature region (as shown in Figure 6A). That is why the reduction of magnetite was believed to happen in a two-step magnetite reduction sequence, i.e., 2Fe3O4 → 6FeO → 6Fe [35]. Sample D was characterized by four different reduction peaks at 297 °C, 368 °C, 528 °C and 638 °C, corresponding to the reduction of Fe2O3 to Fe3O4 (297 °C, 368 °C), Fe3O4 to FeO (528 °C), and FeO to Fe (638 °C) [36,37]. However, the results exhibited that the corresponding temperatures to the reduction peaks have shifted to lower values for the sample A, which indicated higher mobility of the oxygen species in the sample A. Since the reducibility can be indicated by the reduction peak temperature, the lower reduction peak temperature indicated the stronger reducibility. Therefore, the catalytic activity of sample A was better than that of sample D.
One of the main processes of the NH3–SCR reaction is the adsorption and activation of ammonia on the acid sites that are present on a catalyst’s surface. To examine this, NH3–TPD experiments were conducted. It can be seen from Figure 6B that the samples have three NH3 desorption peaks from 50~500 °C. For sample A, two desorption peaks can be observed at 135 °C and 192 °C, which can be attributed to NH4+ bound to weak Brønsted acid sites [38]. Whereas, the third peak is centered at 267 °C (strong peak), respectively. The peak above 200 °C can be ascribed to NH4+ bound to strong Brønsted acid sites, and the coordinated NH3 bound to Lewis acid sites [39,40]. So NH3–TPD results showed the presence of both Lewis and weak Brønsted acid sites in the catalysts for ammonia adsorption. It is interesting to note that the peak area of Lewis acid sites and weak Brønsted acid sites are obviously larger than those of sample D. The peak area implies the amount of ammonia adsorption in the sample [19], and this indicated that sample D has less number of acid sites than the sample A. Therefore, the catalytic activity and selectivity of the sample A was higher than the sample D.
A scanning electron microscope was used to observe the influence of calcination on the micromorphology of the iron ore sample A (Figure 7). It can be seen from Figure 7A,B that calcination of the sample at 250 °C resulted in the formation of an amorphous structure of the iron ore, which is also shown by the XRD results (Figure 4A). An amorphous structure usually has a higher surface area than a crystallized structure [21].
Therefore, the BET surface area of the sample A calcined at 250 °C is much higher than that of the non-calcined sample (Table 3). However, with a rise in calcination temperature the aggregated particles appeared due to the sintering phenomenon which becomes a worse further increase in calcination temperature (Figure 7C,D). This sintering phenomenon caused a decrease in the surface area (Table 3) and consequently the number of active sites for the SCR reaction. So, the calcination temperature of 250 °C was found suitable for the iron ore sample to achieve optimum NH3–SCR performance at low temperatures.

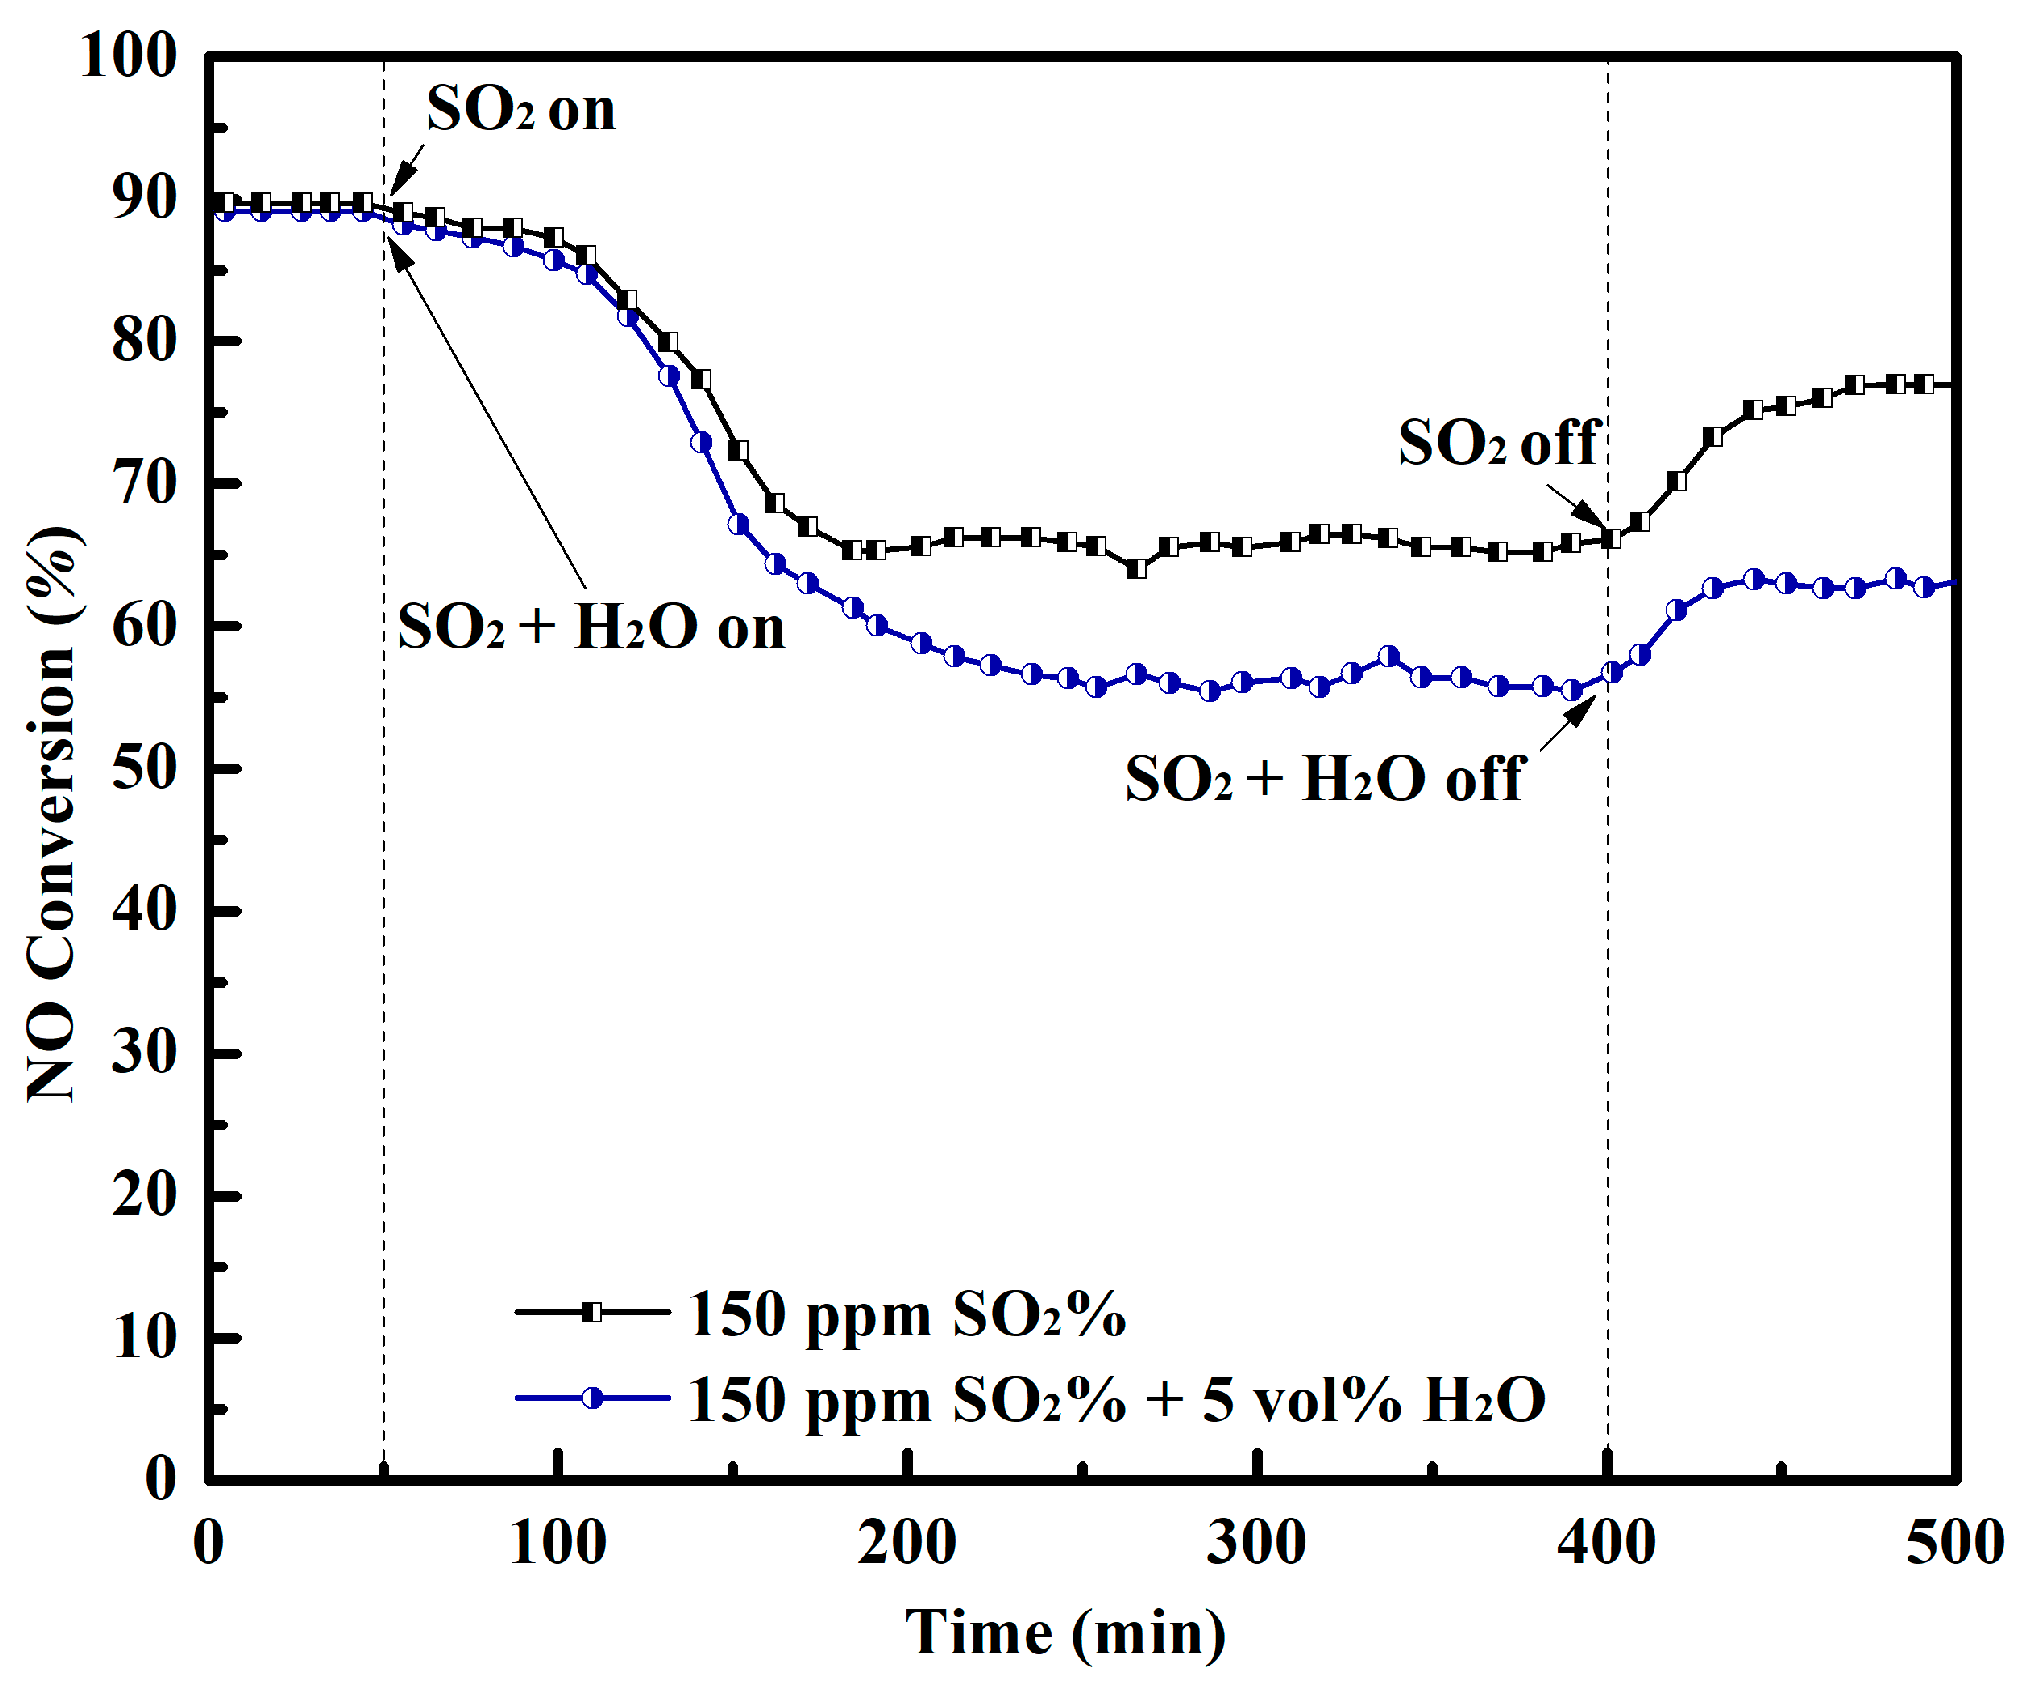
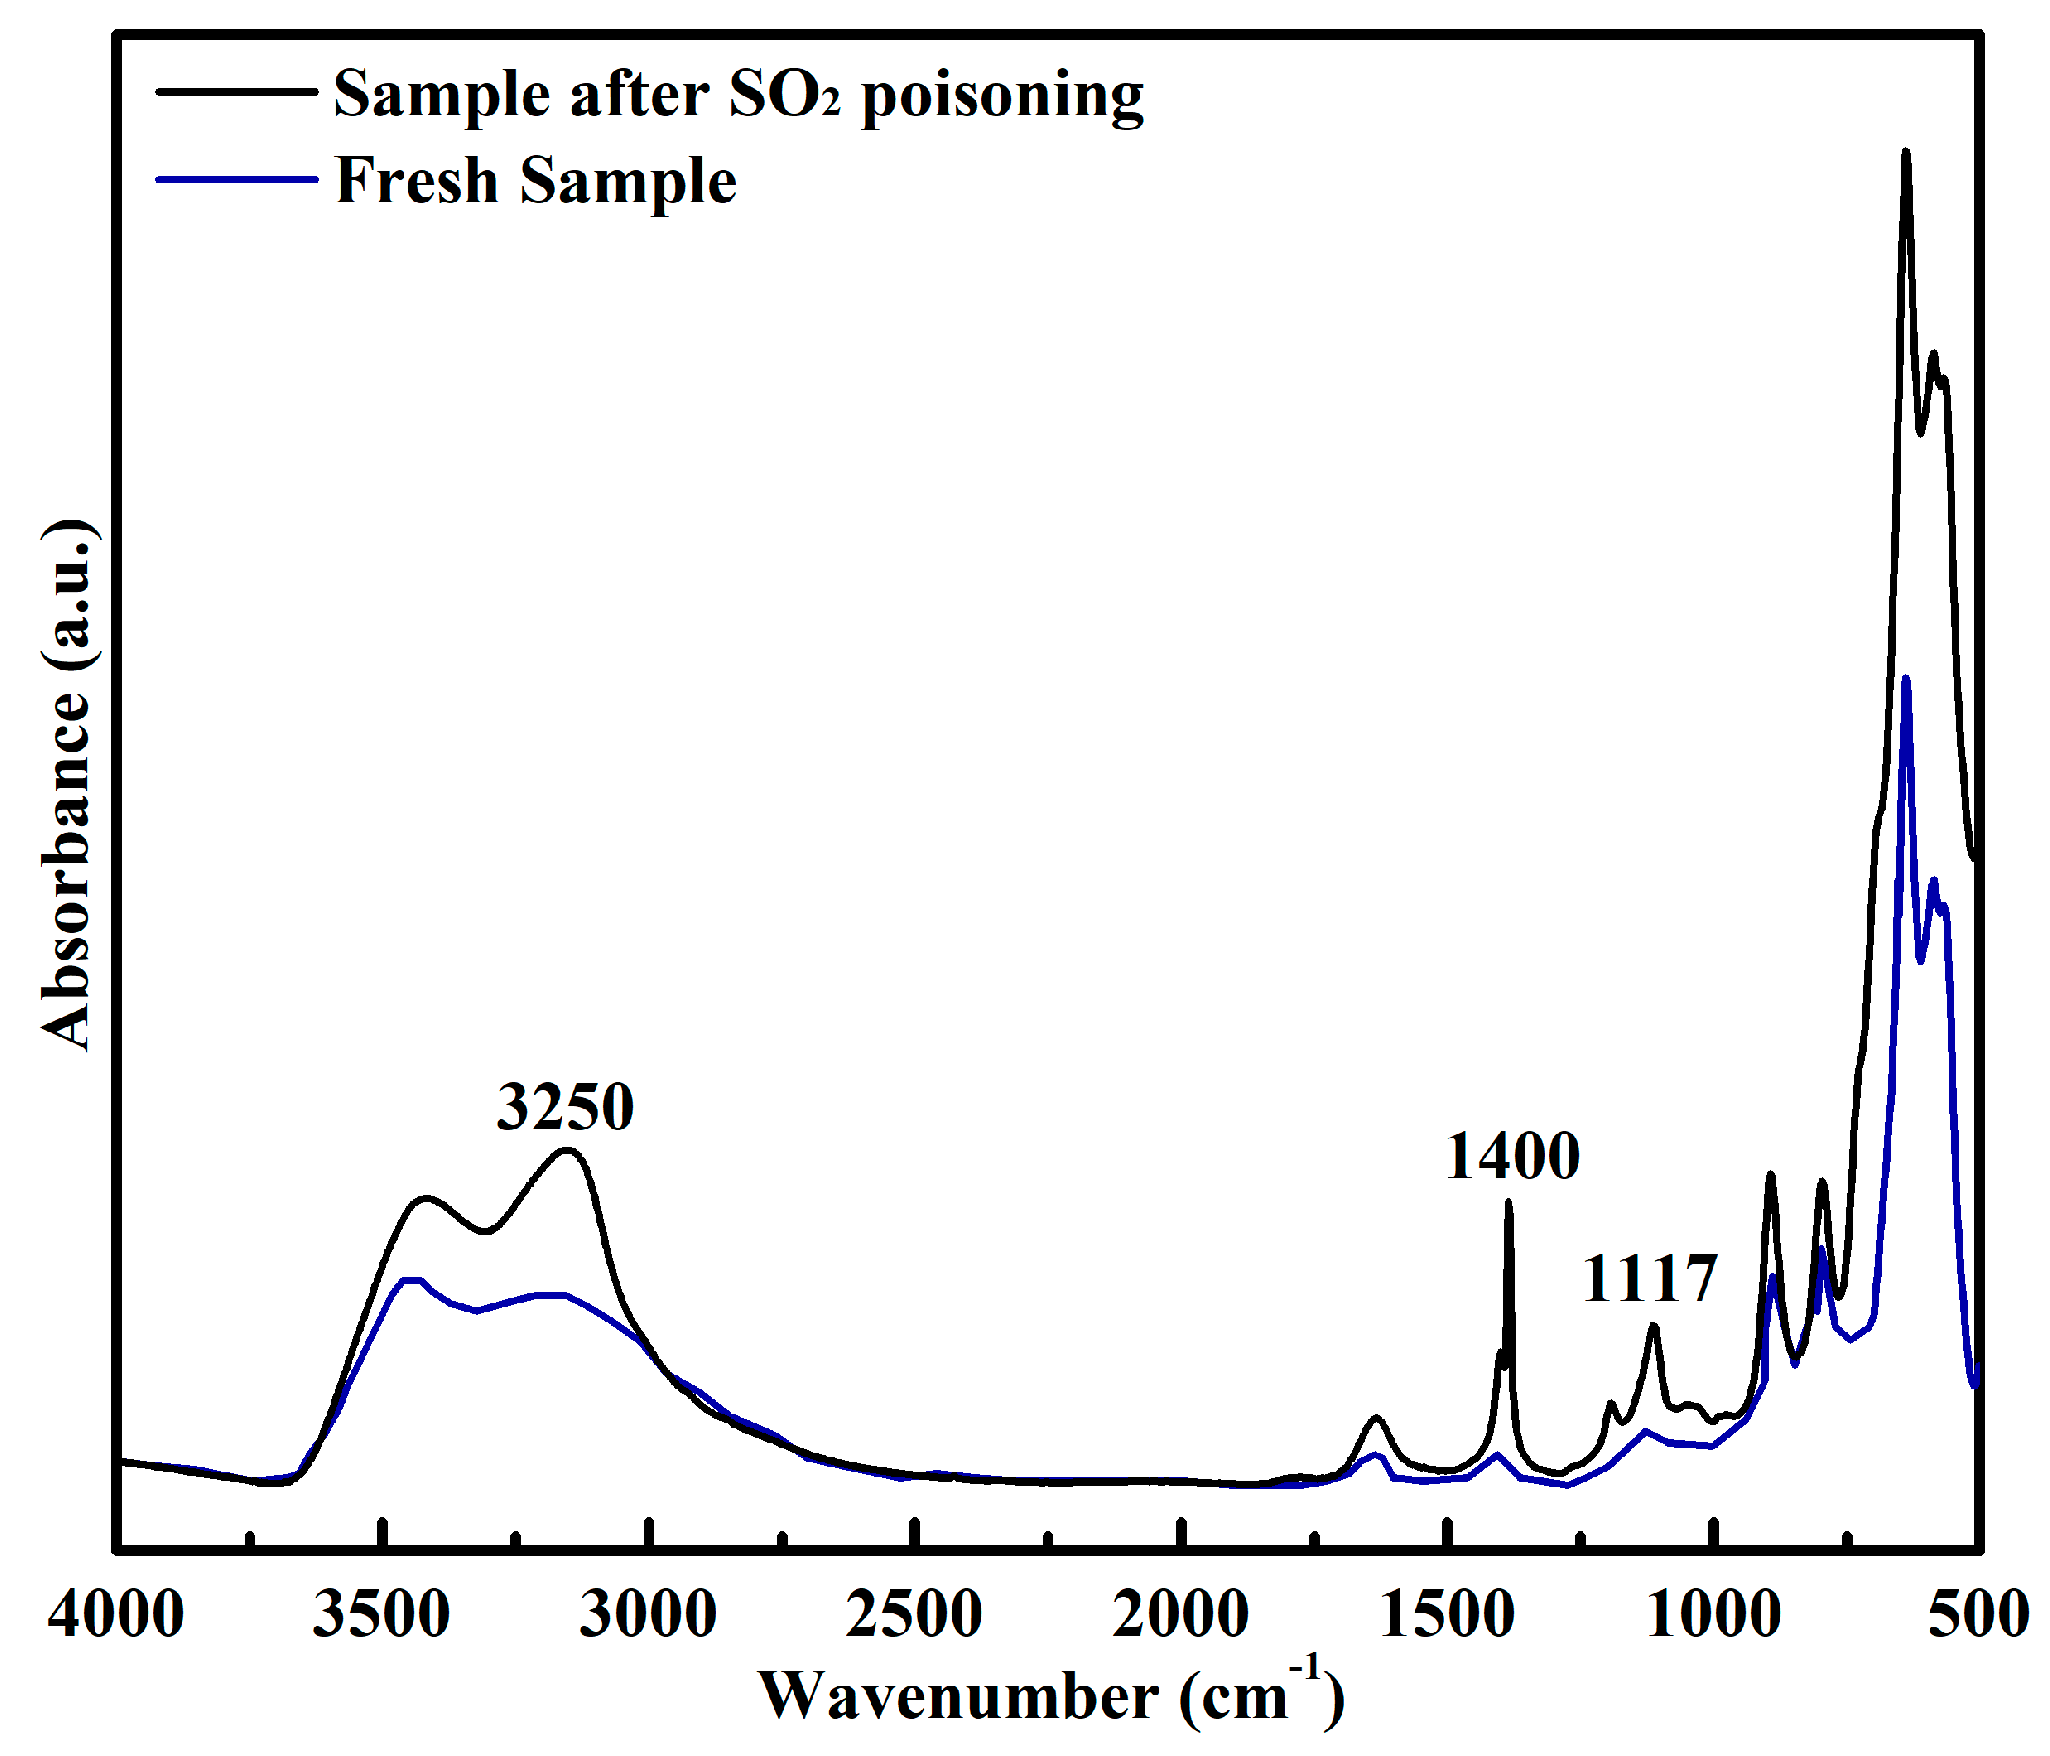
2.4. Influence of H2O and SO2 on SCR Activity

The influence of SO2 and H2O on the SCR activity was investigated at 200 °C (Figure 8). To test SO2 tolerance, 150 ppm SO2 was added to the simulated flue gas after 50 min of stable reaction. It can be seen that the NO conversion showed a negligible decrease and the NO conversion still remained above 85% after 100 min. However, the NO conversion decreased from 85% to 65% in 200 min, and after that, the NO conversion became almost stable. When the SO2 feed was stopped after 400 min, the NO conversion was restored to some extent. Compared with the previous reports [41,42], our experiments exhibited that the iron ore sample had better tolerance to SO2 at 200 °C in one hour of added SO2. However, after this time, substantial deactivation occurred due to the formation of sulfates on the surface of the catalyst, which resulted in a sharp decrease in NO conversion. The coexistence of H2O and SO2 led to more catalyst deactivation to the addition of a single gas (SO2), because H2O can compete with the gaseous NH3 for the active sites [43]. When 5 vol % H2O and 150 ppm SO2 were added to the simulated flue gas after 50 min of stable reaction, the synergy effects of the H2O and SO2 could be seen on the NO conversion of the iron ore catalyst.
To authenticate the formation of ammonium sulfates the FT-IR analysis of the fresh and the deactivated sample was carried out, and the results are shown in Figure 9. By comparison, some new bands at 1117, 1400 and 3250 cm−1 were found in the spectra of the sample poisoned by the SO2 gas. The new bands at 1117 and 1400 cm−1 are credited to the adsorption peak of SO42- [44,45], whereas, the band at 3250 cm−1 is ascribed to the corresponding N–H stretching vibration of NH4+ ions [42]. These results showed that sulfate salts such as (NH4)2SO4 and NH4HSO4 were formed during the SCR reaction on the iron ore sample, which could cause pore plugging and result in a reduction of the catalytic activity.

3. Materials and Methods

3.1. Materials and Reagents

In this study, four iron ore raw materials from different locations were taken and processed to be used as catalysts. Among them, two were mined in Australia and the other two in Brazil. To prepare the catalysts, the raw materials were processed as follows: At first, the iron ore raw materials were dried at 105 °C for 4 h, and then ZM-200 Ultra Centrifugal Mill (Retsch, Germany) was used to ground the ore to make 100-mesh powder. Then, these ground samples were again dried at 105 °C for 5 h. Finally, these ground samples were calcined at 250 °C, 350 °C and 450 °C, respectively, for 6 h to obtain the catalysts.

3.2. Experimental Setup and Governing Equations

The experimental setup consisted of a simulated flue gas system, an electrically heated test rig, a fixed-bed quartz reactor and a flue gas analyzer system. The reactor was made of quartz glass (6 mm i.d × 500 mm length). A K-type thermocouple of 2 mm diameter with an accuracy of 2.5 °C was inserted into the reactor to obtain the data of the flue gas temperature from the reactor inlet and outlet. The catalyst powder (500 mg) was loaded inside the reactor and was heated to the desired temperature by an electrically heated test rig. The reaction gas consisted of 500 ppm NO, 500 ppm NH3, 3 vol % O2, 150 ppm SO2 (when used), 5 vol % H2O (when used), with balance N2 at a total flow rate of 145 mL·min−1 and gas hourly space velocity (GHSV) of 20,000 h−1. Water vapors were generated by passing N2 through a heated gas-wash bottle containing deionized water. Mass flow controllers (MFCs) (CS200A, CS200D, Sevenstar, Beijing, China) were used to control the flow of simulated flue gas. A flue gas analyzer (Testo 350, Lenzkirch, Germany) was used to constantly monitor the concentrations of NO, NO2, O2 and SO2. To test N2 selectivity, the outlet gas compositions were detected by GC-14C with Porapak Q column (Shimadzu, Kyoto, Japan) and FT-IR spectrometer (Vertex70v, Billerica, USA) with a scanning range of 4000–400 cm−1, 0.15 cm−1 resolution and an average of 32 scans for each spectrum. By using the concentration of gases at steady state, the NO conversion and N2 selectivity were calculated according to the following equations:
NO   conversion   ( % ) = [ NO ] i n - [ NO ] o u t [ NO ] i n × 100 %
N 2   selectivity   ( % ) = [ NO ] i n + [ NH 3 ] i n [ NO ] o u t [ NH 3 ] o u t 2 [ N 2 O ] o u t [ NO ] i n + [ NH 3 ] i n [ NO ] o u t [ NH 3 ] o u t × 100 %
where [NO]in represents the NO concentration at the inlet of the reactor (ppm), and [NO]out represents the NO concentration at the outlet of the reactor (ppm).
Both NO and NH3 oxidation tests were conducted in the same reactor with a 500 mg sample. For NO oxidation, the feed gas consisted of 500 ppm NO, 3 vol % O2, and balance N2. For NH3 oxidation, the feed gas consisted of 500 ppm NH3, 3 vol % O2, and balance N2. The total flow rate was 145 mL·min−1. The NO to NO2 conversion percentage was calculated using the following equation:
NO   to   NO 2   conversion   ( % ) = [ NO 2 ] o u t [ NO ] i n × 100 %
The NH3 conversion percentage was calculated using the following equation:
NH 3   conversion   ( % ) = [ NH 3 ] i n [ NH 3 ] o u t [ NH 3 ] i n × 100 %
where [NH3]in and [NH3]out were the concentration of NH3 in the inlet and outlet flue gases, respectively (ppm).
The Scherrer formula is shown as follows.
D = 0.94 × λ / ( β × C o s θ )
where D represents the average diameter of crystallite, λ denotes the wavelength of the incident X-ray, β is the half-width of the diffraction peak, and θ is the diffraction angle.

3.3. Characterization Used

X-ray powder diffraction (XRD) measurements were carried out to determine the crystalline structures of the catalysts with CuKα radiation on a D8 Advance X-ray diffractometer (Bruker, Billerica, USA). The scan rate of diffraction pattern was 1° min−1, with a resolution of 0.02° and the diffraction pattern was taken in a 2θ range of 10~90°.
An XRF-1800 sequential X-ray fluorescence spectrometer (Shimadzu, Japan) was used to carry the elemental analysis of the ore samples.
An Autosorb-IQ3 (Quantachrome; Anton Paar, Austria) analyzer was used to determine the Brunauer-Emmett-Teller (BET) surface properties of the catalysts. To examine the surface characteristics of the catalysts, the samples were undergone by N2 adsorption at 77 K, and after that, the samples were degassed under vacuum for 12 h at 180 °C.
X-ray photoelectron spectroscopy (XPS) analysis was performed on an AXIS Ultra DLD (Shimadzu Kratos, Kyoto, Japan) X-ray photoelectron spectrometer with a spherical mirror and concentric hemispherical detector operating at constant pass energy (PE = 46.95 eV). All binding energies (BE) were referenced to the C1s line at 284.6 eV.
A Scanning electron microscope (SEM) S-3400 (Hitachi, Tokyo, Japan) was used to study the micromorphologies of the catalysts.
An AutoChem II 2920 (Micrometrics, Norcross, USA) instrument was used to conduct temperature-programmed reduction (H2-TPR) experiments. Each catalyst (100 mg) was placed in a quartz U-tube reactor to conduct the experiment. The samples were pretreated in He at 100 °C for 1 h before reduction and then cooled to a temperature of 50 °C. Then the samples were heated from 50~700 °C with a heating rate of 5.5 °C·min−1 and were simultaneously introduced to a mixture of gases (90% Ar and 10% H2) with a flow rate of 0.03 L·min−1. A thermal conductivity detector (TCD) was used to determine the content of H2 in the effluent gas.
An AutoChem II 2920 (Micrometrics, USA) instrument was used to conduct temperature-programmed desorption (NH3–TPD) experiments. Each catalyst (100 mg) was placed in a quartz U-tube reactor to conduct the experiment. The samples were pretreated at 100 °C in He gas atmosphere with a flow rate of 0.03 L·min−1 for 2 h. After that, the samples were cooled to a temperature of 50 °C, and at this temperature, the samples were fed with a mixture of gases (10% NH3 and 90% He) until saturation. Then, He gas was used for cleaning the samples. After this, the samples were heated to 550 °C with a heating rate of 10 °C·min−1.
A Fourier transform infrared spectrometer Nicolet 6700 (Thermo Fisher, Waltham, USA) with spectral range 4000–400 cm−1 was used to identify the sulfur-based species present on the surface of the deactivated catalyst.

4. Conclusions

In this work, iron ore raw materials from different locations were taken and processed to be used as catalysts for the NH3–SCR of NO at low temperatures. The existence of the γ-Fe2O3 (maghemite) phase along with a suitable calcination temperature was found crucial for the NH3–SCR performance of the iron ore at low temperatures. It was found that sample A (composed mainly of α-Fe2O3 and γ-Fe2O3) calcined at 250 °C exhibited poor crystallinity, large surface area, high concentration of surface-adsorbed oxygen, good reducibility, lots of acid sites, as well as adsorption of the reactants, which brought about excellent SCR activity (above 80% at 170–350 °C) and N2 selectivity (above 90% up to 250 °C) at low temperatures. However, the addition of H2O and SO2 in the feed gas showed some adverse effects on the SCR activity.
FT-IR analysis confirmed the presence of sulfate salts ((NH4)2SO4 and NH4HSO4) during the SCR reaction in the presence of SO2, which could cause pore plugging and result in the suppression of the catalytic activity.

Author Contributions

Conceptualization, E.W.; methodology, N.H., E.W.; characterization, N.H., S.F; investigation, N.H., E.W.; writing—original draft preparation, N.H., E.W.; writing—review and editing, E.W., N.H.; visualization, S.F., N.H.; supervision, E.W; funding acquisition, E.W.

Funding

This research was funded by the National Natural Science Foundation of China (grant no. 50676057).

Acknowledgments

The authors would like to thank National Natural Science Foundation of China for the research funding. In addition, the authors are highly thankful to Muhammad Tuoqeer Anwar (SJTU), Nabila Mehwish (SJTU), and Muhammad Ashraf (SJTU) for providing the technical support for this study.

Conflicts of Interest

The authors state no conflict of interest.

References

  1. Skalska, K.; Miller, J.S.; Ledakowicz, S. Trends in NOx abatement: A review. Sci. Total Environ. 2010, 408, 3976–3989. [Google Scholar] [CrossRef] [PubMed]
  2. Husnain, N.; Wang, E.; Li, K.; Anwar, M.T.; Mehmood, A.; Gul, M.; Li, D.; Jinda, M. Iron oxide-based catalysts for low-temperature selective catalytic reduction of NOx with NH3. Rev. Chem. Eng. 2019, 35, 239–264. [Google Scholar] [CrossRef]
  3. Damma, D.; Ettereddy, P.R.; Reddy, B.M.; Simirniotis, P.G. A review of low temperature NH3-SCR for removal of NOx. Catalyst 2019, 9, 349. [Google Scholar] [CrossRef]
  4. Phil, H.H.; Reddy, M.P.; Kumar, P.A.; Ju, L.K.; Hyo, J.S. SO2 resistant antimony promoted V2O5/TiO2 catalyst for NH3-SCR of NOx at low temperatures. Appl. Catal. B Environ. 2008, 78, 301–308. [Google Scholar] [CrossRef]
  5. Rivas, F.C.; Iznaga, I.R.; Berlier, G.; Ferro, D.T.; Rosabal, B.C.; Petranovskii, V. Fe speciation in iron modified natural zeolites as sustainable environmental catalysts. Catalysts 2019, 9, 866. [Google Scholar] [CrossRef]
  6. Dunn, J.P.; Koppula, P.R.; Stenger, H.G.; Wachs, I.E. Oxidation of sulfur dioxide to sulfur trioxide over supported vanadia catalysts. Appl. Catal. B Environ. 1998, 19, 103–117. [Google Scholar] [CrossRef]
  7. Bauerle, G.L.; Wu, S.C.; Nobe, K. Catalytic reduction of nitric oxide with ammonia on vanadium oxide and iron-chromium oxide. Ind. Eng. Chem. Pro. Res. Dev. 1975, 14, 268–273. [Google Scholar] [CrossRef]
  8. Balle, P.; Geiger, B.; Kureti, S. Selective catalytic reduction of NOx by NH3 on Fe/HBEA zeolite catalysts in the oxygen-rich exhaust. Appl. Catal. B Environ. 2009, 85, 109–119. [Google Scholar] [CrossRef]
  9. Liu, C.; Shi, J.W.; Gao, C.; Niu, C. Manganese oxide-based catalysts for low-temperature selective catalytic reduction of NOx with NH3: A review. Appl. Catal. A Gen. 2016, 522, 54–69. [Google Scholar] [CrossRef]
  10. Ma, L.; Li, J.; Ke, R.; Fu, L. Catalytic performance, characterization, and mechanism study of (Fe2SO4)3/TiO2 catalyst for selective catalytic reduction of NOx by ammonia. J. Phys. Chem C. 2011, 115, 7603–7612. [Google Scholar] [CrossRef]
  11. Zhihang, C.; Wang, F.; Li, H.; Wang, L.; Li, X. Low-temperature selective catalytic reduction of NOx with NH3 over Fe-Mn mixed-oxide catalysts containing Fe3Mn3O8 phase. Ind. Eng. Chem. Res. 2011, 51, 202–212. [Google Scholar]
  12. Putluru, S.S.R.; Schill, L.; Jensen, A.D.; Siret, B.; Tabaries, F.; Fehrmann, R. Mn/TiO2 and Mn-Fe/TiO2 catalysts synthesized by deposition precipitation-promising for selective catalytic reduction of NO with NH3 at low temperatures. Appl. Catal. B Environ. 2015, 165, 628–635. [Google Scholar] [CrossRef]
  13. Wu, S.; Yao, X.; Zhang, L.; Cao, Y.; Zou, W.; Li, L.; Ma, K.; Tang, C.; Gao, F.; Dong, L. Improved low-temperature NH3-SCR performance of FeMnTiOx mixed oxide with CTAB-assisted synthesis. Chem. Commun. 2015, 51, 3470–3473. [Google Scholar] [CrossRef] [PubMed]
  14. Wu, S.; Zhang, L.; Wang, X.; Zou, W.; Cao, Y.; Sun, J.; Tang, C.; Gao, F.; Deng, Y.; Dong, L. Synthesis, characterization and catalytic performance of FeMnTiOx mixed oxides catalyst prepared by a CTAB-assisted process for mid-low temperature NH3-SCR. Appl. Catal. A Gen. 2015, 505, 235–242. [Google Scholar] [CrossRef]
  15. Zhang, Y.; Zheng, Y.; Wang, X.; Lu, X. Preparation of Mn-FeOx/CNTs catalysts by redox co-precipitation and application in low-temperature NO reduction with NH3. Catal. Commun. 2015, 62, 57–61. [Google Scholar] [CrossRef]
  16. Zhang, Y.; Zheng, Y.; Zou, H.; Zhang, X. One-step synthesis of ternary MnO2-Fe2O3-CeO2-Ce2O3/CNT catalysts for use in low-temperature NO reduction with NH3. Catal. Commun. 2015, 71, 46–50. [Google Scholar] [CrossRef]
  17. Salama, W.; El, A.M.; Gaupp, R. Spectroscopic characterization of iron ores formed in different geological environments using FTIR, XPS, Mössbauer spectroscopy and thermoanalyses. Spectrochim. Acta Part A Mol. Biomol. Spectrosc. 2015, 136, 1816–1826. [Google Scholar] [CrossRef]
  18. Park, T.S.; Jeong, S.K.; Hong, S.H.; Hong, S.C. Selective catalytic reduction of nitrogen oxides with NH3 over natural manganese ore at low-temperature. Ind. Eng. Chem. Res. 2001, 40, 4491–4495. [Google Scholar] [CrossRef]
  19. Zhu, B.; Yin, S.; Sun, Y.; Zhu, Z.; Li, J. Natural manganese ore catalyst for low-temperature selective catalytic reduction of NO with NH3 in the coke-oven flue gas. Environ. Sci. Pollut. Res. 2017, 24, 24584–24592. [Google Scholar] [CrossRef]
  20. Gui, K.; Liang, H.; Wang, F.; Yao, G. Low-temperature selective catalytic reduction of NO on an iron ore catalyst in a magnetically fluidized bed. Chem. Eng. Tech. 2015, 38, 1537–1542. [Google Scholar] [CrossRef]
  21. Cao, F.; Su, S.; Wang, P.; Hu, S.; Sun, L.; Zhang, A. The activity and mechanism study of Fe–Mn–Ce/γ-Al2O3 catalyst for low-temperature selective catalytic reduction of NO with NH3. Fuel 2015, 139, 232–239. [Google Scholar] [CrossRef]
  22. Liu, F.; He, H.; Zhang, C. Selective catalytic reduction of NOx with NH3 over iron titanate catalyst: Catalytic performance and characterization. Appl. Catal. B Environ. 2010, 96, 408–420. [Google Scholar] [CrossRef]
  23. Liu, C.; Yang, S.; Ma, L.; Peng, Y.; Hamidreza, A.; Chang, H.; Li, J. Comparison on the performance of α-Fe2O3 and γ-Fe2O3 for selective catalytic reduction of nitrogen oxides with ammonia. Catal. Lett. 2013, 143, 697–704. [Google Scholar] [CrossRef]
  24. Wang, D.; Yang, Q.; Li, X.; Peng, Y.; Li, B.; Si, W.; Lu, C.; Gan, L. Preparation of γ-Fe2O3 catalysts and their de-NOx performance: Effects of precipitation conditions. Chem. Eng. Technol. 2018, 41, 1019–1026. [Google Scholar] [CrossRef]
  25. Cao, D.; Li, H.; Pan, L.; Li, J.; Wang, X.; Jing, P.; Cheng, X.; Wang, W.; Wang, J.; Liu, Q. High saturation magnetization of γ-Fe2O3 nano-particles by a facile one-step synthesis approach. Sci. Rep. 2016, 6, 1–9. [Google Scholar] [CrossRef]
  26. Wang, X.; Gui, K. Fe2O3 particles as superior catalysts for low temperature selective catalytic reduction of NO with NH3. J. Environ. Sci. 2013, 25, 2469–2475. [Google Scholar] [CrossRef]
  27. Gao, F.; Kollar, M.; Kukkadapu, R.K.; Washton, N.M.; Wang, Y.; Szanyi, J.; Peden, C.H.F. Fe/SSZ-13 as an NH3-SCR catalyst: A reaction kinetics and FTIR/Mössbauer spectroscopic study. Appl. Catal. B Environ. 2015, 164, 407–419. [Google Scholar] [CrossRef]
  28. Gao, F.; Zheng, Y.; Kukkadapu, R.K.; Wang, Y.; Walter, E.D.; Schwenzer, B.; Szanyi, J.; Peden, C.H.F. Iron loading effects in Fe/SSZ-13 NH3-SCR catalysts: Nature of the Fe ions and structure-function relationships. ACS Catal. 2016, 6, 2939–2954. [Google Scholar] [CrossRef]
  29. Wang, A.; Wang, Y.; Walter, E.D.; Washton, N.M.; Guo, Y.; Lu, G.; Peden, C.H.F.; Gao, F. NH3-SCR on Cu, Fe and Cu + Fe exchanged beta and SSZ-13 catalysts: Hydrothermal aging and propylene poisoning effects. Catal. Today 2019, 320, 91–99. [Google Scholar] [CrossRef]
  30. Omran, M.; Fabritius, T.; Elmahdy, A.M.; Abdel-Khalek, N.A.; Aref, M.E.; Elmanawi, A.H. XPS and FTIR spectroscopic study on microwave treated highphosphorus iron ore. Appl. Surf. Sci. 2015, 345, 127–140. [Google Scholar] [CrossRef]
  31. Grosvenor, A.P.; Kobe, B.A.; Biesinger, M.C.; Mclntyre, N.S. Investegation of multiplet splitting of Fe 2p XPS spectra and bonding in iron compounds. Surf. Interface Anal. 2004, 36, 1564–1574. [Google Scholar] [CrossRef]
  32. Xu, L.; Yang, Q.; Hu, L.; Wang, D.; Peng, Y.; Shao, Z.; Lu, C.; Li, J. Insights over titanium modified FeMgOx catalysts for selective catalytic reduction of NOx with NH3: Influence of precursors and crystalline structures. Catalysts 2019, 9, 560. [Google Scholar] [CrossRef] [Green Version]
  33. Wu, Z.; Jin, R.; Liu, Y.; Wang, H. Ceria modified MnOx/TiO2 as a superior catalyst for NO reduction with NH3 at low temperature. Catal. Commun. 2008, 9, 2217–2220. [Google Scholar] [CrossRef]
  34. Pineau, A.; Kanari, N.; Gaballah, I. Kinetics of reduction of iron oxides by H2. Thermochim. Acta 2006, 447, 89–100. [Google Scholar] [CrossRef]
  35. Jozwiak, W.K.; Kaczmarek, E.; Maniecki, T.P.; Ignaczak, W.; Maniukiewicz, W. Reduction behavior of iron oxides in hydrogen and carbon monoxide atmospheres. Appl. Catal. A Gen. 2007, 326, 17–27. [Google Scholar] [CrossRef]
  36. Yang, S.; Guo, Y.; Yan, N.; Wu, D.; He, H.; Qu, Z.; Yang, C.; Zhou, Q.; Jia, J. Nanosized cation-deficient Fe-Ti spinel: A novel magnetic sorbent for elemental mercury capture from flue gas. Appl. Mater. Interface 2011, 3, 209–217. [Google Scholar] [CrossRef] [PubMed]
  37. Hou, B.; Zhang, H.; Li, H.; Zhu, Q. Study on the kinetics of iron oxide reduction by hydrogen. Chin. J. Chem. Eng. 2012, 20, 10–17. [Google Scholar] [CrossRef]
  38. Ning, R.; Chen, L.; Li, E.; Liu, X.; Zhu, T. Applicability of V2O5-WO3/TiO2 catalysts for the SCR denitrification of alumina calcining flue gas. Catalysts 2019, 9, 220. [Google Scholar] [CrossRef] [Green Version]
  39. Cheng, L.S.; Yang, R.T.; Chen, N. Iron oxide and chromia supported on titania-pillared clay for selective catalytic reduction of nitric oxide with ammonia. J. Catal. 1996, 164, 70–78. [Google Scholar] [CrossRef]
  40. Long, R.Q.; Yang, R.T. Selective catalytic oxidation of ammonia to nitrogen over Fe2O3–TiO2 prepared with a sol-gel method. J. Catal. 2002, 207, 158–165. [Google Scholar] [CrossRef]
  41. Li, Q.; Yang, H.; Ma, Z.; Zhang, X. Selective catalytic reduction of NO with NH3 over CuOX-carbonaceous materials. Catal. Commun. 2012, 17, 8–12. [Google Scholar] [CrossRef]
  42. Chen, W.; Hu, F.; Qin, L.; Han, J.; Zhao, B.; Tu, Y.; Yu, F. Mechanism and Performance of the SCR of NO with NH3 over Sulfated Sintered Ore Catalyst. Catalysts 2019, 9, 90. [Google Scholar] [CrossRef] [Green Version]
  43. Yang, S.; Wang, C.; Chen, J.; Peng, Y.; Ma, L.; Chang, H. A novel magnetic Fe–Ti–V spinel catalyst for the selective catalytic reduction of NO with NH3 in a broad temperature range. Catal. Sci. Technol. 2012, 2, 915–917. [Google Scholar] [CrossRef]
  44. Won, P.; Hee, K.; Chang, S. SO2 durability enhancement of ball-milled V/TiO2 catalyst. Ind. Eng. Chem. Res. 2010, 16, 283–287. [Google Scholar]
  45. Pietrogiacomi, D.; Magliano, A.; Ciambelli, P.; Sannino, D.; Campa, M.C.; Indovina, V. The effect of sulphation on the catalytic activity of CoOx/ZrO2 for NO reduction with NH3 in the presence of O2. Appl. Catal. B Environ. 2009, 89, 33–40. [Google Scholar] [CrossRef]
Figure 1. (A) NO conversion of different iron ore samples calcined at 250 °C and the Mn–Ce–γ–Al2O3 catalyst reported in literature [21]; (B) Influence of calcination temperature on the NO conversion of sample A. Our reaction conditions: 500 ppm NO, 500 ppm NH3, 3 vol % O2, N2 balance, the flow rate of 145 mL·min−1, and gas hourly space velocity (GHSV) = 20,000 h−1. Reaction conditions of literature [21]: 700 ppm NO, 700 ppm NH3, 3 vol % O2, N2 as balance, and GHSV = 10,000 h1.
Catalysts 09 00956 g001
Figure 2. (A) NO oxidation activity; (B) NH3 oxidation activity. Reaction conditions: 500 ppm NO or 500 ppm NH3, 3 vol % O2, N2 balance, flow rate of 145 mL·min−1, and GHSV = 20,000 h−1.
Catalysts 09 00956 g002
Figure 3. XRD spectra of different iron ore samples.
Catalysts 09 00956 g003
Figure 4. Partly magnified XRD spectra of sample A: (A) transformation of γ-Fe2O3 to α-Fe2O3 above 250 °C; (B) formation of Al0.94Fe1.06O3 in the calcined samples.
Catalysts 09 00956 g004
Figure 5. XPS spectrum of (A) Fe2p; (B) O1s of sample A and sample D, calcined at 250 °C.
Catalysts 09 00956 g005
Figure 6. (A) H2–TPR profiles; (B) NH3–TPD profiles of samples A and D, calcined at 250 °C.
Catalysts 09 00956 g006
Figure 7. SEM images of sample A: (A) Not Calcined; calcined at (B) 250 °C; (C) 350 °C; and (D) 450 °C.
Catalysts 09 00956 g007
Figure 8. Influence of H2O and SO2 on SCR activity at 200 °C. Reaction conditions: 500 ppm NO, 500 ppm NH3, 3 vol % O2, 150 ppm SO2, 5 vol % H2O (when used), flow rate of 145 mL·min−1, N2 balance, and GHSV = 20,000 h−1.
Catalysts 09 00956 g008
Figure 9. FT-IR spectra of fresh sample and the sample after SO2 poisoning.
Catalysts 09 00956 g009
Table 1. N2 selectivity of the calcined samples (at 250 °C) at different reaction temperatures.
Samples50 °C150 °C250 °C350 °C
Sample A96.66%95.43%91.98%85.45%
Sample B96.66%94.50%83.45%70.35%
Sample C96.66%94.52%86.35%80.84%
Sample D96.66%94.13%78.78%59.47%
Table 2. Iron ore samples with their major elements and their mass percentages.
ElementsSample A (%)Sample B (%)Sample C (%)Sample D (%)
Fe60.96168.09967.85364.32
O31.56426.63025.80128.95
Al1.7062.0432.2432.13
Si3.3861.0801.8812.95
P0.0290.0660.0820.087
Table 3. Sample A BET surface area at different calcination temperatures.
Calcination Temperature (°C)BET Surface Area (m2·g−1)Average Crystallite Size (nm)
Not calcined21.6343.24
25042.5219.62
35036.7633.98
45028.1438.24
Table 4. Four ore samples and their BET surface area (calcined at 250 °C).
SamplesBET Surface Area (m2·g−1)Average Crystallite Size (nm)
Sample A42.5219.63
Sample B26.8139.64
Sample C38.8729.74
Sample D22.8442.04
Table 5. Comparison of samples A and D: binding energies and valance state ratio of O.
Samples AOα/A(Oα + Oβ + Oγ) (%)
BE (eV)AreaBE (eV)AreaBE (eV)Area
Sample A529.97841531.410784532.65483.944
Sample D529.87016531.46117532.62469.539

