Article

Positive Effects of Impregnation of Fe-oxide in Mesoporous Al-Oxides on the Decontamination of Dimethyl Methylphosphonate

1
Department of Chemistry, Sungkyunkwan University, Suwon 16419, Korea
2
Department of Chemistry and Energy Engineering, Sangmyung University, Seoul 03016, Korea
*
Authors to whom correspondence should be addressed.
These authors equally contributed to this work.
Catalysts 2019, 9(11), 898; https://doi.org/10.3390/catal9110898
Submission received: 27 September 2019 / Revised: 23 October 2019 / Accepted: 25 October 2019 / Published: 28 October 2019
(This article belongs to the Special Issue State-of-the-Art Catalytical Technology in South Korea)

Abstract

:
Dimethyl methylphosphonate (DMMP) is an important simulant of organophosphates pesticides and chemical warfare nerve agents. Here, we investigated the catalytic decontamination of DMMP on Fe-oxide impregnated mesoporous Al2O3. Fe-oxide/Al2O3 sample was prepared via the temperature regulated chemical vapor deposition of Fe-oxide on mesoporous Al2O3 and post-annealing at 750 °C. The Fe-oxide/Al2O3 and bare Al2O3 samples were exposed to DMMP-containing dry air at room temperature to study the effects of Fe-oxide impregnation on the reactive adsorption of DMMP. The facilitation of DMMP degradation into CO2 and methanol at room temperature in the presence of nano-dispersed Fe-oxide was evidenced by gas-chromatograph and Fourier transform-infrared (FT-IR) absorption spectroscopy. In addition, temperature programmed oxidation (TPO) experiments and gas chromatography (Agilent, 6890) equipped with mass spectrometer (Agilent, 5973N) (GC/MS) analyses revealed that the minimum temperature that was required for total oxidation of DMMP into CO2 can also be lowered by Fe-oxide impregnation in mesoporous Al2O3.

1. Introduction

Organophosphates (OPs) are organophosphorus compounds that contain the O=P(OR)3 functional group and they have been widely used in the agricultural sector as pesticides [1,2]. Many of OPs can be toxic to human and animals, including insects and parasites, and the structure of OPs are also related to the chemical warfare agents (CWAs), such as sarin, VX, GA, and GB [3]. There has been a great interest in developing efficient technique of decontamination of harmful OPs from water, soil, and air. Dimethyl methylphosphonate (DMMP) is one of the most widely used simulants of OPs, since it is structurally similar to toxic OPs, including CWAs, but are relatively nontoxic [4,5,6,7].
The adsorption and decomposition of gaseous DMMP molecules on various metal oxides, such as SiO2, Al2O3, MgO, La2O3, and Fe2O3, have been investigated by numerous research groups [4,8,9,10,11,12,13]. Besides, the mixed structure of different metal oxides (or supported metal oxides) and nano-sized metal oxides have been also examined for the decontamination of DMMP molecules [14,15,16,17,18,19], and, recently, the utilization of photo-catalysts has been also suggested [20,21].
The chemical nature as well as geometrical structure of metal oxides (porosity and surface area) can influence the adsorption behaviors of DMMP, for instance, the surface-bound hydroxyl groups and Lewis acidity of metal oxides surface can play an important role in determining the adsorption behaviors of DMMP on various metal oxides. On most of metal oxides surfaces, DMMP adsorption begins with binding of P=O moiety of DMMP at an acidic site on metal oxides. Afterwards, it is followed by preferential elimination of the methoxy groups by nucleophilic attack of surface-bound hydroxyl groups, whereas P–CH3 bonding were more resistant to bond breaking and generally remained intact on the metal oxide surface [10,11,12,22,23].
On the other hand, it has been reported that adsorbed DMMP underwent a somewhat different series of events on the surface of iron oxides. No preferential loss of methoxy groups of DMMP (P–O–CH3) over methyl group (P–CH3) was observed for the case of iron oxides by many research groups [10,14,15]. It implied that Fe-oxide surface can promote the P–CH3 bond breaking, which can be related to the ability of Fe(III)/Fe(II) redox coupling or accommodation of multiple oxidation states of Fe-oxide [10,14,15]. This unique ability of Fe-oxide being able to promote the cleavage of P–CH3, as well as P–O–CH3 bonds of DMMP molecule demonstrated by previous studies [10,14,15], makes Fe-oxide a potential candidate material in developing catalysts for DMMP decontamination. However, there was a certain gap that exists in the experimental conditions of DMMP exposure between previous studies and real application.
In the present work, in an attempt to prove the potential of utilization of Fe-oxides in developing efficient catalytic materials for DMMP decontamination, we investigated the effects of Fe-oxide impregnation on porous alumina on the decontamination of DMMP in more realistic conditions (ambient pressure, continuous exposure of DMMP containing air, room temperature). The Fe-oxides were impregnated in mesoporous Al2O3 via a TR-CVD of Fe-oxide on Al2O3, followed by thermal annealing at 750 °C. The prepared Fe-oxide/Al2O3 sample and bare Al2O3 were exposed to DMMP containing dry air at room temperature and the effects of Fe-oxide impregnation in mesoporous Al2O3 on the decontamination of DMMP were investigated while using various analysis techniques, such as gas chromatography (GC), Fourier transform-infrared (FT-IR), Temperature Programmed Oxidation (TPO), and gas chromatography (Agilent, 6890) equipped with mass spectrometer (Agilent, 5973N) (GC/MS). DMMP adsorption and degradation on the Fe-oxide/Al2O3 sample and bare Al2O3 at room temperature were examined by means of GC connected to a flow type reactor and FT-IR absorption spectroscopy. The degradation behaviors of DMMP adsorbed on both samples surfaces at elevated temperature were further examined by conducting TPO experiments with a combination of the solid phase microextraction (SPME) method and GC/MS analysis.

2. Results and Discussion

2.1. Characterization Results

A STEM image and STEM-EDS mapping images of Fe, Al, and O elements were measured at the sample position of Fe-oxide/Al2O3 particles and they indicate that the Fe atoms were evenly distributed on Al2O3 particles (Figure 1a–d). Figure 1e shows a Fe 2p3/2 core-level X-ray photoelectron spectrum (XPS) of Fe-oxide/Al2O3 and a broad peak extended from 715 to 706 eV was found in the Fe 2p3/2 binding energy region, indicating that distributed Fe atoms in oxidized states. Binding energy position of Fe 2p3/2 XPS peak can differ upon the oxidation state of Fe-oxides, e.g., Fe3O4 (~710.4 eV) and α-Fe3O4 (~710.4 eV). However, the inherent complexity and broadness of Fe 2p core-level XPS spectrum results from the existence of multiple elements due to the final state relaxation effects prevent us from determining the exact oxidation state of Fe-oxide. It is likely that Fe-oxide consisted of a complex mixture of various oxidized Fe-oxide, such as Fe3O4 and α-Fe3O4, which was indicated by our previous analysis on the Fe-oxide/Al2O3 sample that was prepared via a similar TR-CVD and post-annealing process by means of Mössbauer spectroscopy [24].
The crystallinities of bare Al2O3 and Fe-oxide/Al2O3 samples were also studied by measuring their XRD patterns (Figure 1f). A pronounce XRD peak at 67° was observed with broad feature consist of multiple peaks in the 2θ range of 20~50° for the case of bare Al2O3, which can be attributed to χ-phase of Al2O3 [24]. No additional XRD peaks appeared upon the Fe-oxide deposition and subsequent 750 °C-annealing, and the Fe-oxide/Al2O3 sample also exhibited very similar XRD patterns with bare Al2O3, which can be attributed to the small size of Fe-oxide moiety existed in Fe-oxide/Al2O3. However, it is noticeable that the intensity of the XRD peak at 67° decreased upon Fe-oxide deposition, followed by 750 °C-annealing, which implies that Fe-oxide deposited on Al2O3 can disturb the lattice structure of Al2O3 during the annealing process (750 °C, 8 h).
Figure 2 shows the pore size distributions of pristine Al2O3 (none-annealed), bare Al2O3 (750 °C annealed), and Fe-oxide/Al2O3 (750 °C annealed), and Table 1 summarizes their BET specific surface areas and average pore diameters. The pore size distribution curve of pristine Al2O3 underwent significant changes upon 750 °C-annealing. The average pore diameter Al2O3 increased from 4.38 nm to 9.56 nm, accompanied with a decrease of surface area of Al2O3 (from 334.2 m2/g to 138.6 m2/g). These results indicated that the porous structure of pristine Al2O3 was significantly ruptured upon 750 °C-annealing. Similar phenomenon was observed when the Fe-oxide were deposited on Al2O3; an increase of average pore diameter from 4.38 to 6.46 nm and decrease of surface area from 334.2 to 171.8 m2/g upon 750 °C-annealing were observed. However, the structural changes due to collapsing of the original porous structure of Al2O3 upon 750 °C annealing were less significant when Fe-oxide was deposited on Al2O3, resulting in higher BET surface area and smaller average pore diameter of Fe-oxide/Al2O3 (750 °C-annealed) than bare Al2O3 (750 °C-annealed) (Figure 2 and Table 1). Those results implied that the thermal stability of the porous structure of Al2O3 particle can be improved in the presence of TR-CVD deposited Fe-oxide on Al2O3, which can be attributed to the interaction between Fe-oxide and Al2O3.
Those are somewhat different situations from our previous studies, where the formation of crystalline Fe-oxide nanoparticles was observed on mesoporous materials via a TR-CVD of Fe-oxide and subsequent thermal annealing [25]. In the previous case, the original pore structure of mesoporous SiO2 was mostly maintained, so that TR-CVD deposited Fe-oxide can be accumulated inside a specific pore generating crystalline Fe-oxide nanoparticles during the post-annealing process [25]. Additionally, it resulted in a decrease of pore volume with a specific size (~10 nm) of which size was correlated with the diameter (~10 nm) of crystalline Fe-oxide nanoparticles directly measured by the size of Fe-oxide lattice fringes on TEM images [25].
In contrast, in this case of study, the mesoporous structure Al2O3 underwent significant changes during the annealing process. Thus, it was likely that the accumulation of Fe-oxide inside a specific size of pore originally existed on pristine Al2O3 took place. Instead, Fe-oxide might accumulate inside a newly formed pores (>10 nm) of the 750 °C-annealed sample. However, no indication of the formation of Fe-oxide nanoparticles (>10 nm) was found by HRTEM and XRD analyses, although the even distribution of Fe atoms on Al2O3 was confirmed by STEM-EDS analysis (Figure 1). It is worth mentioning that the formation of Fe-oxide nanoparticles (~10 nm) was confirmed by TEM and XRD analyses in our previous studies [25]. Therefore, we conclude that Fe-oxide impregnation into mesoporous Al2O3 took place, rather than specific sized Fe-oxide nanoparticles forming by accumulation of temperature regulated chemical vapor deposition (TR-CVD) deposited Fe-oxide inside the pores of Al2O3.

2.2. DMMP Exposure at Room Temperature

DMMP containing dry air (total flow of 50 mL/min) flowed into the SUS reactor that was filled with 2.0 g of each sample (bare Al2O3 and Fe-oxide/Al2O
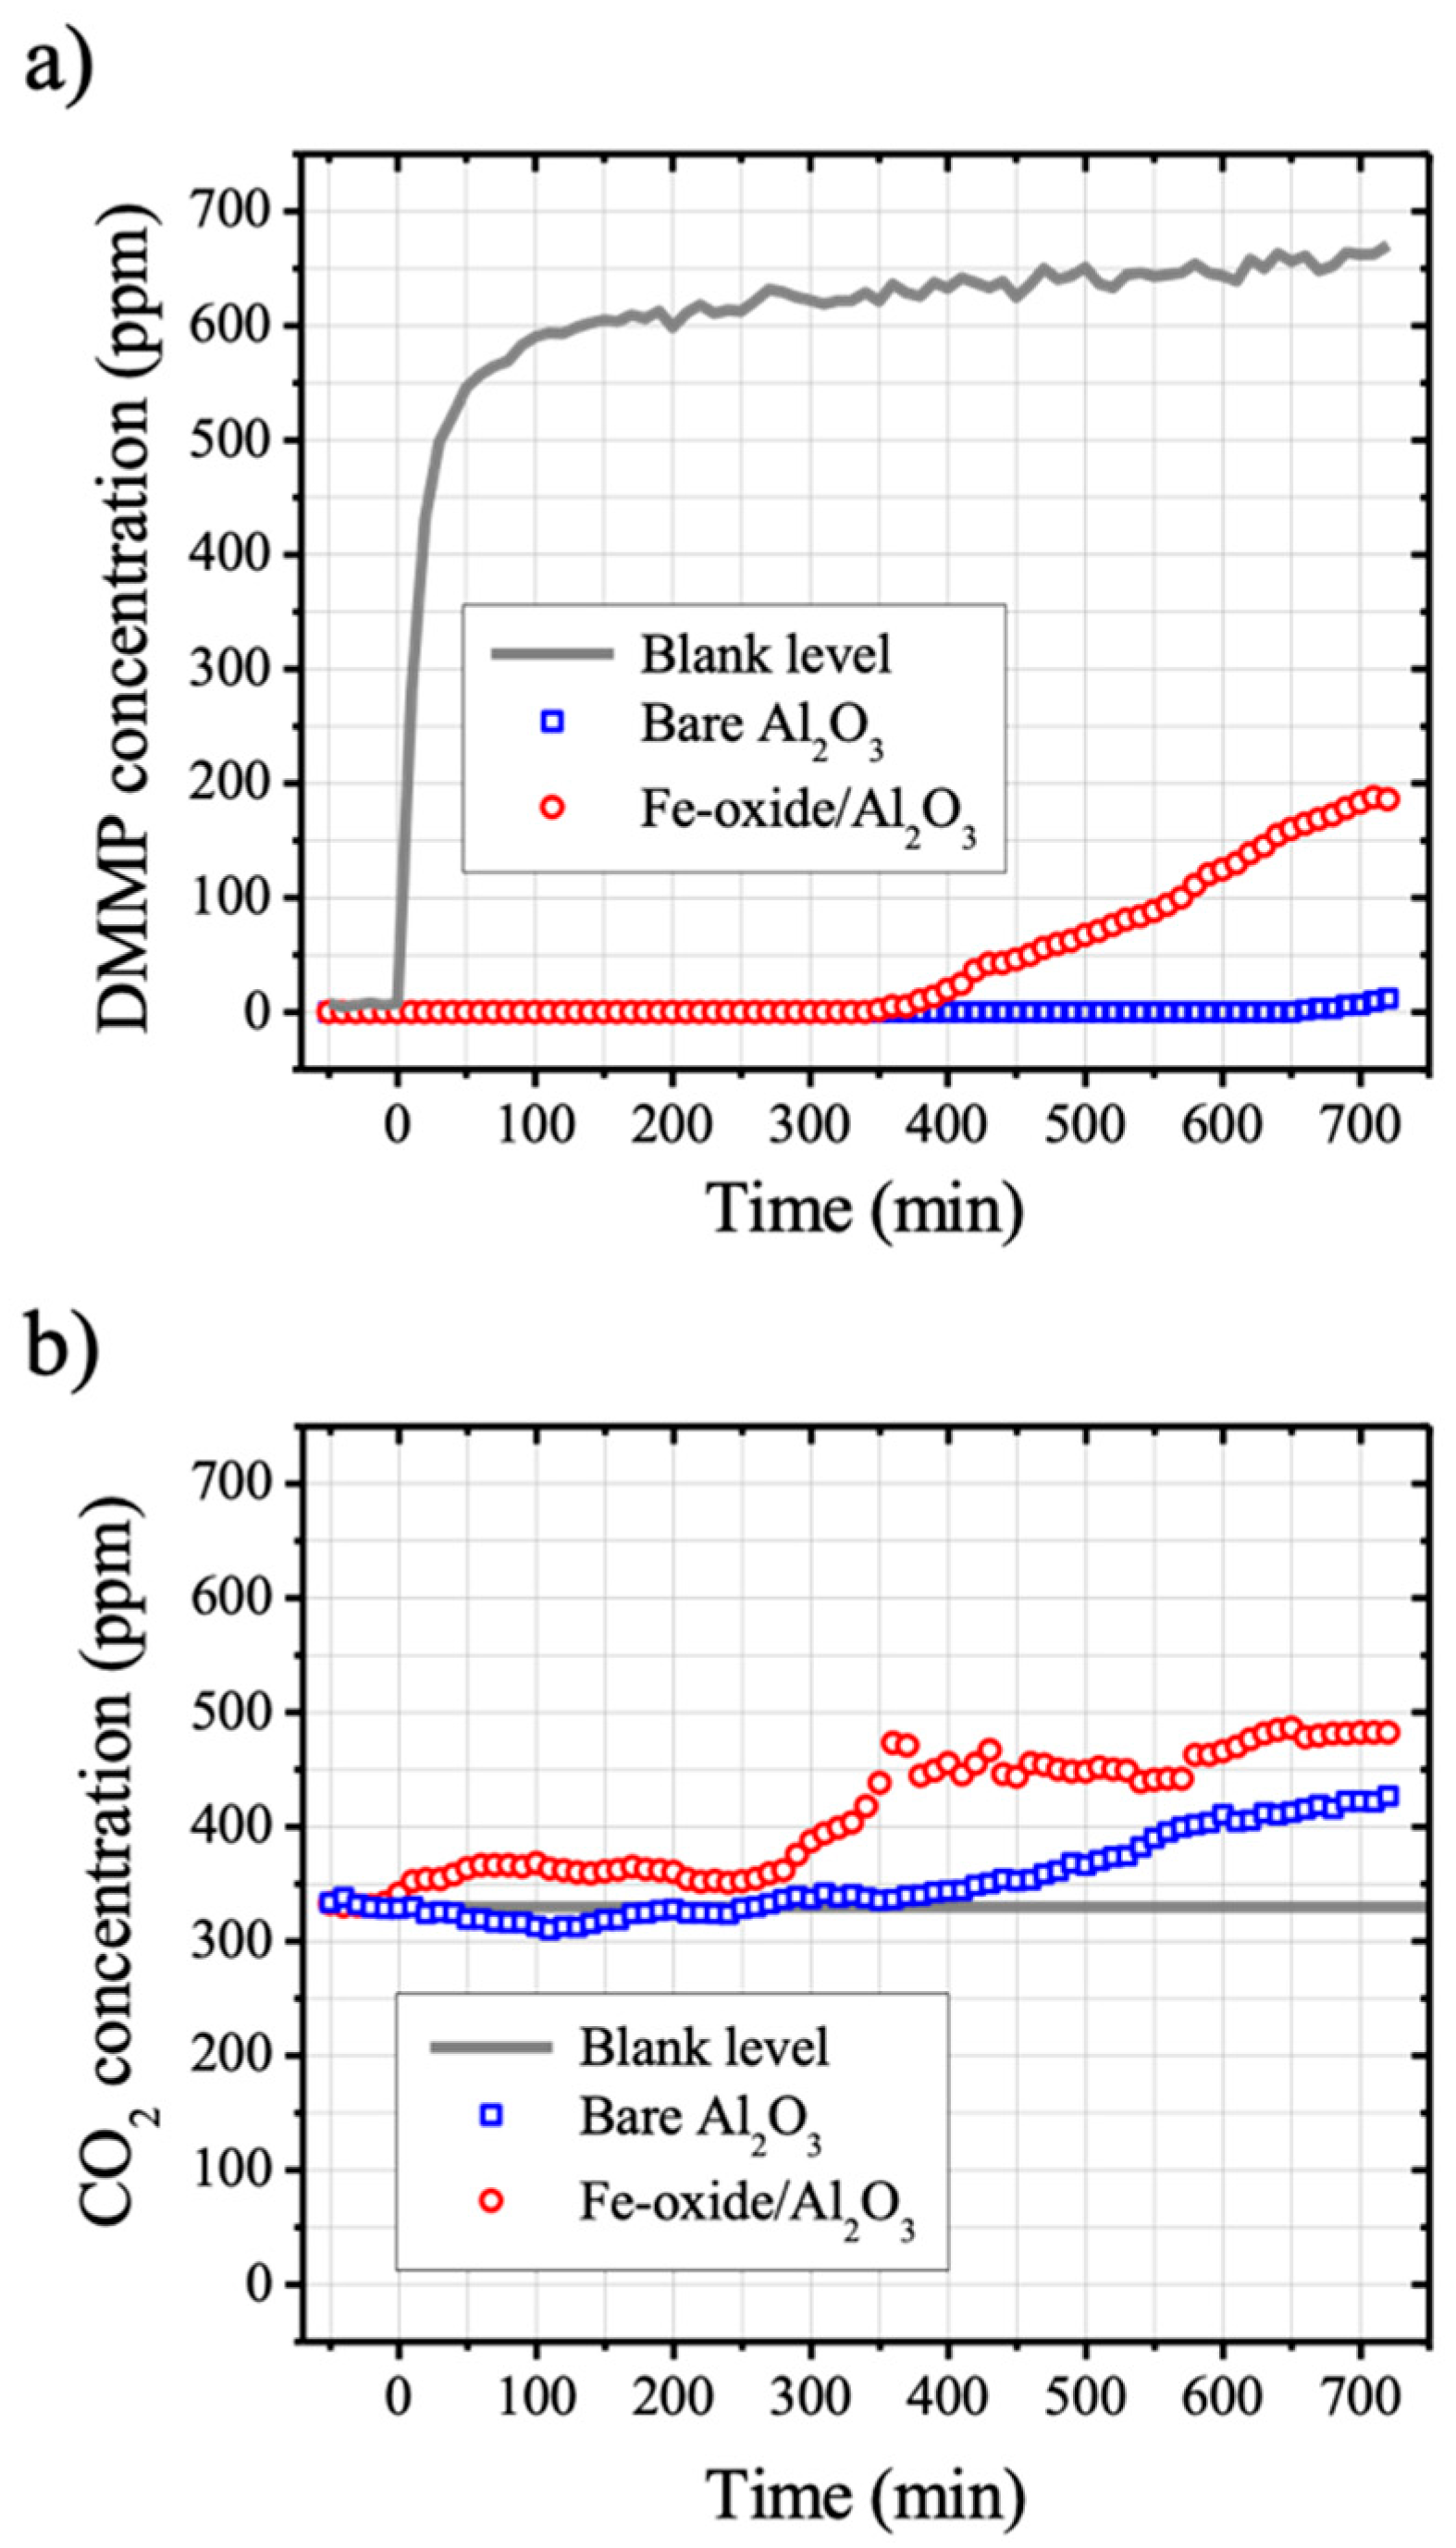
3 particles) at room temperature and the gas that passed through the reactor was analyzed by online GC. Two peaks were detected by online GC at different retention times, one centered at ~4.46 min and the other one at ~2.27 min, and they corresponded to the DMMP and CO2, respectively. The area of each GC peak was converted to mol-ppm and its change with increasing DMMP exposure time is shown in Figure 3. The grey solid lines in Figure 3 correspond to the blank level of each species measured with empty SUS reactor under the same conditions of gas flow and temperature.
Figure 3a shows the DMMP breakthrough curves of bare Al2O3 and Fe-oxide/Al2O3. The breakthrough times of bare Al2O3 and Fe-oxide/Al2O3 where the DMMP concentration at effluent gas was higher than 1 percent of the blank level were determined to be 710 min and 380 min, respectively (Table 2). For both cases of bare Al2O3 and Fe-oxide/Al2O3, increases of CO2 level as a function of exposure time were observed before the respective breakthrough time, which implies that the degradation of DMMP molecules occurred on both samples surface at room temperature (Figure 3b). There were certain induction periods of gaseous CO2 evolution from the surfaces of both samples, and Fe-oxide/Al2O3 exhibited shorter induction time when compared to the bare Al2O3 (Figure 3b). The time when more than 20% of increase from the blank level of CO2 concentration (330 ppm) was found was taken as an induction time since there was a fluctuation of CO2 concentration level (±9%) under our experimental conditions. The induction time of Fe-oxide/Al2O3 for gaseous CO2 was determined to be 310 min, whereas that of bare Al2O3 was determined to be 560 min (Table 2).
Gaseous CO2 evolution from the metal-oxide surface at room temperature has been previously reported [11,16,17,26], and the relationship between the induction period of CO2 evolution and surface area has been suggested; the higher the surface area, the longer the CO2 induction time [16,17]. However, in our case of study, the different induction time for CO2 evolution between two samples (bare Al2O3 and Fe-oxide/Al2O3) was not likely attributed to the difference in surface area. Fe-oxide/Al2O3 with higher surface area (171.8 m2/g) exhibited shorter CO2 induction time (310 min) than bare Al2O3 (560 min) with lower surface area (138.6 m2/g) in this study. Alternatively, the shorter induction CO2 time of Fe-oxide/Al2O3 samples than that of bare Al2O3 can be attributed to the co-existence of Fe-oxides and Al-oxides, which can provide additional sites being able to facilitate DMMP degradation.

2.3. IR Analysis

The surface of each sample (bare Al2O3 and Fe-oxide/Al2O3) before and after DMMP exposure at room temperature was analyzed by means of IR absorption spectroscopy in order to understand different behaviors of bare Al2O3 and Fe-oxide/Al2O3 observed during the DMMP exposure experiments at room temperature (Figure 4). The conditions of DMMP exposure to prepare the samples for IR analysis were same as those of the aforementioned DMMP exposure experiments. However, the DMMP exposure time was reduced to 360 min from 720 min, i.e., DMMP exposure was ended before the DMMP breakthrough times of both samples (Table 1) to keep the amount of adsorbed DMMP on both samples surface at same level. Figure 4 shows the IR absorption spectra of bare Al2O3 and Fe-oxide/Al2O3 measured before and after the DMMP exposure. The spectra are displayed in two wavenumber ranges (lower wavenumber range of 900–1500 cm−1 and higher wavenumber range of 2400–3800 cm−1), respectively, and they were only vertically shifted without background subtraction. Background subtracted IR spectra in higher wavenumber range are additionally provided in the supplementary material Figure S1.
Upon the DMMP exposure at room temperature, appearances of characteristic IR absorption peaks of DMMP molecules were observed on the bare Al2O3 samples, which were P-CH3 deformation (~1315 cm−1), P=O stretching (~1215 cm−1), O–CH3 deformation (~1181 cm−1), and asymmetric and symmetric stretching of C–O (~1065 and 1045 cm−1, respectively) (Figure 4a) [22]. Apart from the appearances of characteristic DMMP peaks, other changes were not noticeable for the case of bare Al2O3 upon the DMMP exposure. It has been reported that the DMMP adsorption on aluminum oxide took place via an electrophilic attack of the surface on DMMP [10]; the P=O bond of DMMP molecule interacts with coordinatively unsaturated aluminum (Lewis acid) sites and phosphoryl group of DMMP molecule interacts with a surface hydroxyl group (Figure 5). Subsequently, it was followed by the loss of one methoxy group from surface-bound DMMP molecule, leaving a surface-bridging methyl methylphosphonate (MMP) on the surface [10]. As temperature increases, the other methoxy group remained at MMP can be lost, forming a surface-bound methylphosphonate (MP). The formation of surface-bound MMP and MP was evidenced by the shift of P=O stretching vibration towards lower wavenumber from 1216 cm−1 to ~1190 cm−1 [10]. However, in our case of study, it is not clear whether the surface-bound MMP or MP was formed on bare Al2O3 surface under our experimental conditions, since the reported IR absorption peak position of surface-bound MMP and MP was very close to the peak of O–CH3 deformation (~1181 cm−1).
Characteristic IR absorption peaks of DMMP molecules were also detected on the surface of Fe-oxide/Al2O3 after the DMMP exposure at room temperature, which were P–CH3 deformation at ~1315 cm−1 and asymmetric and symmetric stretching of C–O at ~1065 and 1045 cm−1, respectively (Figure 4c). However, in contrast to the case of bare Al2O3 sample, the IR peak at ~1114 cm−1 increased in its intensity and P=O stretching (~1215 cm−1), O–CH3 deformation (~1181 cm−1) peaks of DMMP molecules were no longer observable after the DMMP exposure. The peak at 1114 cm−1 existed on the surface of Fe-oxide/Al2O3 before the DMMP adsorption was attributed to oxidized carbon impurities (C–O stretching mode), which were likely to be formed on the surface of Fe-oxide/Al2O3 during the sample preparation, e.g., oxidation of adsorbed ferrocene molecules. The increase of IR peak intensity at ~1114 cm−1 can be attributed to the P=O stretching mode of the surface-bound MMP or MP molecules formed on the surface of Fe-oxide/Al2O3 (Figure 4c) during DMMP exposure. The difference in IR absorption peak position of surface-bound MMP or MP species between on the surface of Fe-oxide/Al2O3 and on previously studied alumina surface can be ascribed to the different nature of the surfaces, e.g., the degree of Lewis acidity of the surfaces or coordination of surface-bound species on the surfaces [10].
Those results indicate that the interaction between DMMP molecules and Al2O3 surface was enhanced by Fe-oxide impregnation, which facilitated the dissociation of DMMP molecules on the surface formation of surface-bound MMP or MP and methanol species (Figure 5). It is also worth mentioning that surface-bound methanol species can be also formed, which can contribute to the intensity increase of IR absorption peak at 1114 cm−1 (C–O stretching mode of methanol) and increase of –OH stretching IR band (3600~3200 cm−1) (Figure 4d) [27]. The surface-bound formate species might also be formed during the DMMP conversion into CO2; however, in our case of study, there was no IR absorption peak that appeared at 1600 cm−1 (antisymmetric COO stretching mode) upon DMMP exposure for both samples (bare Al2O3, and Fe-oxide/Al2O3).
Our IR analyses results cannot reveal the detailed mechanisms of the reactive DMMP adsorption on Fe-oxide/Al2O3 sample. Additionally, further investigations, e.g., operando FT-IR analyses during the DMMP exposure, are needed to follow the adsorption mechanisms that guarantee another subject of study. For instance, P–CH3 bond breaking was not evidenced on the surface Fe-oxide/Al2O3, which is different from the previously reported study [10], and this discrepancy likely arises from different nature of the sample. The previous study was performed with pure Fe-oxide surface; whereas, we studied Fe-oxide impregnated Al2O3, where the Fe-Al oxide interface sites as well as two oxidic surface (Fe- and Al-oxide surface) took part in the reactive DMMP adsorption process. However, this cannot be clearly addressed solely based on the presented IR analyses results and it requires further studies. Nevertheless, our experimental observations show that Fe-oxide impregnation in Al2O3 can promote the dissociation of adsorbed DMMP molecules on the surface, which can facilitate the degradation of DMMP into CO2 on the surface of Fe-oxide/Al2O3, which reduces the CO2 induction time (Table 2).

2.4. Temperature Programmed Oxidation (TPO) Experiments and GC/MS Analysis

The TPO experiments were performed after 360 min of DMMP adsorption at room temperature with bare Al2O3 and Fe-oxide/Al2O3. Temperature was linearly increased (1 °C/min) from the room temperature to 750 °C at a constant dry air flow (50 mL/min) and the gaseous species evolved from sample surface was analyzed by online GC. During the TPO experiments, only one GC peak was detected around at ~2.27 min and no other GC peaks, including a DMMP peak (at ~4.46 min), were detected.
Figure 6a and b show the GC peak area as a function of temperature during TPO for either case of bare Al2O3 or Fe-oxide/Al2O3. The y-axis values (GC peak area) of Figure 6a,b are displayed in same Y-axis scale, thus a direct comparison of the GC peak area value between bare Al2O3 and Fe-oxide/Al2O3 is possible, although they are displayed in arbitrary units.
The peak around at 2.27 min can be tentatively assigned to gaseous CO2 generated by DMMP decomposition during TPO, and, at a first glance, CO2 evolution due to DMMP degradation at low temperature region (<200 °C) was pronounced on the surface of bare Al2O3 than Fe-oxide/Al2O3 (Figure 6a,b). Thus, one might come to the conclusion that the bare Al2O3 surface was more active for DMMP degradation at a lower temperature region (<200 °C) when compared to the surface of Fe-oxide/Al2O3. Additionally, it is not correlated to the afore-discussed results (Figure 3b, Table 2, and Figure 4), implying a facilitation of DMMP degradation into CO2 or methanol in the presence of Fe-oxide on Al2O3 surface at room temperature.
However, it should be noted that, on the surface of Fe-oxide/Al2O3, gaseous CO2 evolution and methanol generation resulted from DMMP degradation already took place during the 360 min of DMMP adsorption conducted before the TPO experiments, as pointed out by the aforementioned experimental results (Figure 3, Table 2, and Figure 4). Whereas both the CO2 evolution and methanol generation were not evidenced under the same conditions on the surface of bare Al2O3.
Further on, we carefully examined the GC spectra of TPO experiments in the range of 2.2~2.5 min for both cases of samples (bare Al2O3 and Fe-oxide/Al2O3), and the changes of shape and position of the GC peaks of TPO were examined (Figure 6c,d). For the examination of shape and positions of the GC peaks, the peak height of each GC peak was normalized to that of the respective GC peak that was obtained with each sample (bare Al2O3 or Fe-oxide/Al2O3) at 30 °C and the GC spectra were vertically shifted for comparison (Figure 6c,d).
The GC peaks centering at ~2.27 min can be attributed to gaseous CO2, which were observed in the beginning of TPO (at 30 °C) for both cases of samples. In the case of bare Al2O3, a falling edge of the GC peak was extended to a longer retention time as the temperature increased to 90 °C from 30 °C, attributed to an appearance of additional GC peak at a longer retention time. The extension was more pronounced by a further temperature increase to 150 °C due to an increase of the additional GC peak component in its intensity, and the contribution of the additional component to the GC spectrum reached its maximum at ~240 °C; the shift of the center peak position of GC peak to a longer retention time was most pronounced at 240 °C. Subsequently, the intensity of additional GC peak component with respect to the CO2 peak gradually decreased as the temperature increased from 240 °C. Finally, the GC spectrum became identical to the original GC spectrum that was measured at 30 °C when the temperature reached to 600 °C.
The GC spectra of Fe-oxide/Al2O3 samples behaved similarly upon the temperature increase during the TPO experiments that were performed under the same conditions. The initiation of GC peak extension to a longer retention time was observed at 90 °C due to an appearance of additional GC peak at longer time. The intensity of the additional GC peak component gradually increased as the temperature was ramped to 240 °C and then decreased by a further temperature increase (>240 °C). However, the contribution of the additional GC peak component was decreased much faster when compared to the bare Al2O3 case. The GC peak of Fe-oxide/Al2O3 recovered its original shapes and position at 30 °C when the temperature reached to 300 °C, whereas a significant shift of the center position of GC peak to a longer time was still found for the case of bare Al2O3 at 300 °C.
Gaseous molecules evolved from the surface of samples during the TPO experiments were collected by SPME fibers and analyzed by GC/MS in order to identify the chemical species responsible for the additional GC peak component observed during the TPO experiments with Fe-oxide/Al2O3 samples. Figure 6 shows the results of GC/MS analysis with Fe-oxide/Al2O3 samples. The main GC/MS peak was in the retention time range of 1.0 to 2.0 min (Figure 7a) and it mostly consisted of 18, 28, and 32 m/z species that were attributed to water vapor, N2, and O2 of ambient air, respectively (Supplementary material Figure S2). Along with species that originated from ambient air adsorption on SPEM fiber, the existence of species corresponding to 44 m/z and 31 m/z signal in the retention time region of main GC/MS peak were evidenced (Figure 7b,c). The 44 m/z signal that was attributed to CO2, which was originated either from ambient air adsorption or adsorption of CO2 evolved during the TPO experiment. On the other hand, the 31 m/z signal that can assigned to methanol did not originate from ambient air, since no 31 m/z signal was detected by SPME fiber injection exposed to ambient air (Supplementary material Figure S2). The 31 m/z signal (methanol) was also found in the main GC/MS peak region measured with bare Al2O3 samples (Supplementary material Figure S3). Those results allow for us to conclude that gaseous methanol molecules were generated together with CO2 at a certain temperature range of the TPO, resulting in the broadening and shifting of GC peaks.
Further on, we deconvolute the GC peaks at various temperatures of TPO experiments while using two components (CO2 and methanol components) (Figure 6e,f). During the deconvolution process, only each peak intensity was varied, while the peak position and the peak width at half maximum (FWHM) of each peak were fixed. The deconvolution results show that the temperature window for the evolution of gaseous methanol of Fe-oxide/Al2O3 was smaller than that of bare Al2O3 (Figure 5e,f). In the case of Fe-oxide/Al2O3, methanol formation was ended and the most of adsorbed DMMP molecules was converted to CO2 at the temperature at 300 °C. Whereas, still, a significant amount of methanol molecules was evolved from the surface bare Al2O3 together with CO2 by the degradation of adsorbed DMMP molecules until the temperature reached to 400 °C. It indicated that the minimum temperature required for total oxidation of DMMP molecules to CO2 can be lowered in the presence of Fe-oxides on Al2O3. Additionally, one can suggest the utilization of Fe-oxide/Al2O3 at elevated temperature higher than 300 °C for a continuous total oxidation of DMMP molecules.

3. Materials and Methods

3.1. Sample Preparation

The Fe-oxide/Al2O3 samples were prepared by a temperature regulated chemical vapor deposition (TR-CVD) of Fe-oxide on mesoporous Al2O3, followed by a thermal annealing at 750 °C. TR-CVD of Fe-oxide on Al2O3 particles was carried out using a stainless-steel chamber containing 67.5 g of bis(cyclopentadienyl)iron (Fe(Cp)2) and 100 g of Al2O3 particles [24]. The porous Al2O3 particles (particle size of 2.0 mm) were purchased from BASF (Ludwigshafen, Germany) and used as a substrate without a further treatment, while Fe(Cp)2 that was bought from Sigma Aldrich (Saint Louis, MO, USA) was used as a Fe precursor. Fe(Cp)2 powder was placed on the bottom of the chamber (size: 56 × 37 × 9 cm3) and the Al2O3 particles were placed ~5 cm above the chamber bottom while using a stainless-steel mesh container. The outside of the reactor was wrapped with heating bands that were connected to the power supply via a timer (DONGHWA, DH-26). The temperature of the reactor was monitored and controlled using a k-type thermocouple and a temperature control unit (SAMWON ENG., SU-105K). During the TR-CVD process, the reactor temperature was increased by two steps: (1) it was increased to 60 °C and maintained at 60 °C for 2 h and then (2) increased to 200 °C and maintained at 200 °C for 12 h. After the TR-CVD process, the Fe-oxide deposited Al2O3 particles were annealed at 750 °C for 8 h under a constant dry air flow of 30 mL/min while using a furnace. The bare Al2O3 particles were also annealed under the same conditions (at 750 °C for 8 h, 30 mL/min of dry air flow).

3.2. Sample Characterization

Crystallinities of 750 °C-annealed Fe-oxide/Al2O3 and 750 °C-annealed bare Al2O3 were characterized by obtaining X-ray diffraction patterns while using an X-ray diffractometer (Rigaku, Ultima IV, Tokyo, Japan). Cu Kα radiation (40 kV, 30 mA, λ = 1.54 Å) was used and a scanning rate was 2 °/min. Elemental distribution of 750 °C-annealed Fe-oxide/Al2O3 was investigated by means of scanning transmission electron microscopy-energy dispersive spectroscopy (STEM-EDS, JEOL USA Inc., Peabody, MA, USA, JEM-ARM200F). N2 adsorption/desorption isotherms (3Flex, Micromeritics, Norcross, GA, USA) of 750 °C-annealed Fe-oxide/Al2O3, bare Al2O3, and 750 °C-annealed bare Al2O3 were measured. Additionally, their surface areas and pore structures (average pore diameters and pore size distributions) were determined by Brunauer-Emmett-Teller (BET) and Barrett-Joyner-Halenda (BJH) methods, respectively. The inductively coupled plasma optical emission spectroscopy (ICP-OES) was used to determine the amount of Fe loading on 750 °C-annealed Fe-oxide/Al2O3 particles. The surfaces of selected samples were analyzed by means of Fourier transform-infrared (FT-IR) absorption spectroscopy while using a FT-IR spectroscopy (ThermoFisher SCIENTIFIC, Nicolet iS10, Waltham, MA, USA). The XPS spectra of Fe-oxide/Al2O3 sample were obtained while using an Mg Kα-line and a concentric hemispherical analyzer (CHA, PHOIBOS-Has 2500, SPECS, Berlin, Germany) at room temperature.

3.3. DMMP Exposure at Room Temperature

The DMMP exposing experiment was conducted at room temperature while using a flow-type reactor that was connected to online gas chromatography (GC) (Figure 8a). ½″ SUS (stainless steel) tube was used as a reactor and it was filled with 2.0 g of each sample (750 °C-annealed bare Al2O3 or 750 °C-annealed Fe-oxide/Al2O3). Both ends of the SUS reactor were sealed with stainless steel mesh to keep each Al2O3 particles inside the reactor during DMMP exposure experiments. All of the experiments discussed in the followings were conducted with 750 °C-annealed bare Al2O3 and 750 °C-annealed Fe-oxide/Al2O3 and, hereafter, they are referred to as bare Al2O3 and Fe-oxide/Al2O3. DMMP-containing dry air (total gas flow rate of 50 mL/min) was flowed into the reactor while using two mass flow controllers (MFC, LINE TECH, M3030V). A bottle containing DMMP was kept at 40 °C and it was bubbled by dry air at a constant flow rate of 30 mL/min while using MFC 2 in Figure 8a. The DMMP gas from the bottle was mixed with dry air flowed at a constant flow rate of 20 mL/min using MFC 1 in Figure 8a before it passed through the reactor. Check valves were installed at the gas lines between each MFC and reactor to prevent a possible back stream of the gas (from the reactor to MFC or DMMP bottle). The other side of the reactor was connected to the online gas-chromatography (GC, Hewlett Packard, HP 6890) that was equipped with a capillary column (Agilent Technologies, DB-5, 30 × 0.32 mm), methanizer, and flame ionization detector (FID). All of the gas lines, except, the reactor, consisted of ¼” polytetrafluoroethylene (PTFE) tube and the temperature of gas line was kept at 80 °C to prevent DMMP adsorption on gas lines. Prior to the DMMP exposure experiments, dry air (50 mL/min, while using MFC 1) containing no DMMP gas was flowed through the reactor until online GC detected no peaks other than CO2.

3.4. Temperature Programmed Oxidation (TPO) Experiments and GC/MS Analysis

After 360 min of DMMP exposure experiments at room temperature either with 2.0 g of bare Al2O3 or Fe-oxide/Al2O3 packed inside the SUS reactor, each Al2O3 particle was collected and transferred to a quartz reactor (inner diameter of 30 mm) (Figure 8b). Afterwards, dry air flowed through the quartz reactor at a constant flow rate of 50 mL/min while using MFC and the temperature of the reactor containing each Al2O3 particles increased from the room temperature to 750 °C at a constant heating rate of 1 °C/min. Before the initiation of TPO, the reactor was kept at room temperature and flowed by dry air (50 mL/min) to remove the weakly bound species from the sample surface. An additional line with an on/off valve was attached to the gas line between the reactor and online GC (Figure 8b), and this line was connected to solid phase microextraction (SPME, SUPELCO 57330-U) fiber. During the TPO process, online GC monitored the gas molecules that evolved from the surface of each Al2O3 particles and, at the same time, they were accumulatively adsorbed on SPME fiber. The molecules adsorbed on SPME fiber was injected into the gas chromatography (Agilent, 6890) that was equipped with mass spectrometer (Agilent, 5973N) (GC/MS) for further analysis. A capillary column (DM-5MS, 30 × 0.25 mm) was installed in the GC/MS and the base pressure for a mass detector was ~1.0 × 10⁻⁵ torr. The SPME fiber was inserted into the inlet of GC/MS and out-gassed at 250 °C until no GC/MS peak was detected before it was connected to the set-up for TPO experiments.

4. Conclusions

The Fe-oxide/Al2O3 sample was prepared via a TR-CVD of Fe-oxide and subsequent annealing at 750 °C. STEM-EDS, XRD, and N2 adsorption/desorption analyses show an even distribution of Fe atoms on mesoporous Al2O3 implying the impregnation of Fe-oxide in mesoporous Al2O3. The effects of Fe-oxide impregnation into mesoporous Al2O3 on the decontamination of DMMP was investigated by exposing the two samples (Fe-oxide/Al2O3 and bare Al2O3) to DMMP-containing dry air at room temperature.
At room temperature, molecular DMMP adsorption took place on both samples surface and the evolution of gaseous CO2 molecules was observed. The induction time of CO2 evolution (310 min) of Fe-oxide/Al2O3 was significantly shorter than the case of bare Al2O3 (560 min). Additionally, FT-IR analyses revealed that the dissociation of adsorbed DMMP molecules generating surface-bound MMP and methanol took place on the surface Fe-oxide/Al2O3 samples after 360 min of DMMP exposure at room temperature. Those results indicated that DMMP degradation was promoted in the presence of dispersed Fe-oxide in mesoporous Al2O3.
TPO and GC/MS analyses that were conducted after 360 min of DMMP exposure at room temperature revealed the generation of gaseous methanol together with CO2 molecules from both samples surface at elevated temperature. For the case of Fe-oxide/Al2O3 sample, the evolution of gaseous methanol was gradually increased with increasing temperature, but it soon ended at 300 °C, and only the gaseous CO2 was generated at the temperature higher than 300 °C as a result of DMMP degradation. However, still, the significant amount of methanol was generated from the surface of bare Al2O3 sample, even at 400 °C, and the gaseous methanol generation can be traced until the temperature reached to 600 °C.
Our experimental observations indicated that the degradation of DMMP molecules on Al2O3 surface could be facilitated with the existence of Fe-oxide on Al2O3 surface, which can lower the minimum temperature for the total oxidation of DMMP into CO2. Additionally, these show a potential of mixed structure of Fe- and Al-oxides as a catalyst for the degradation of DMMP molecules in gas phase.

Supplementary Materials

The following are available online at https://www.mdpi.com/2073-4344/9/11/898/s1, Figure S1: Background subtracted FT-IR spectra of bare Al2O3 and Fe-oxide/Al2O3 before and after 360 min of DMMP exposure at room temperature, Figure S2: GC/MS signal measured with Fe-oxide/Al2O3 and mass spectrum of ambient air, Figure S3: GC/MS signal measure with bare Al2O3.

Author Contributions

Conceptualization, T.G.W. and Y.D.K.; methodology, T.G.W., B.J.C.; validation, H.O.S. and Y.D.K.; formal analysis and investigation, T.G.W. and B.J.C.; data curation and draft preparation, H.O.S.; review and editing, H.O.S. and Y.D.K., Supervision, H.O.S. and Y.D.K.

Funding

This research was supported by Basic Science Research Program through the National Research Foundation of Korea (NRF) funded by the Ministry of Education (2017R1D1A1B03034381).

Acknowledgments

This research was supported by Basic Science Research Program through the National Research Foundation of Korea (NRF) funded by the Ministry of Education (2017R1D1A1B03034381). This research was supported by the Basic Science Research Program through the National Research Foundation of Korea (NRF) funded by the Ministry of Education(2018R1D1A1B07040916) and by a research grant from the Korea Basic Science Institute (D39613).

Conflicts of Interest

The authors declare no conflict of interest.

References

  1. Mileson, B.E.; Chambers, J.E.; Chen, W.L.; Dettbarn, W.; Ehrich, M.; Eldefrawi, A.T.; Gaylor, D.W.; Hamernik, K.; Hodgson, E.; Karczmar, A.G.; et al. Common mechanism of toxicity: A case study of organophosphorus pesticides. Toxicol. Sci. 1998, 41, 8–20. [Google Scholar] [PubMed]
  2. Pope, C.N. Organophosphorus pesticides: Do they all have the same mechanism of toxicity? J. Toxicol. Environ. Health Part B 1999, 2, 161–181. [Google Scholar] [CrossRef] [PubMed]
  3. Picard, B.; Chataigner, I.; Maddaluno, J.; Legros, J. Introduction to chemical warfare agents, relevant simulants and modern neutralisation methods. Org. Biomol. Chem. 2019, 17, 6528–6537. [Google Scholar] [CrossRef] [PubMed]
  4. Ekerdt, J.G.; Klabunde, K.J.; Shapley, J.R.; White, J.M.; Yates, J.T. Surface chemistry of organophosphorus compounds. J. Phys. Chem. 1988, 92, 6182–6188. [Google Scholar] [CrossRef]
  5. Zhou, J.; Varazo, K.; Reddic, J.E.; Myrick, M.L.; Chen, D.A. Decomposition of dimethyl methylphosphonate on TiO2(110): Principal component analysis applied to X-ray photoelectron spectroscopy. Anal. Chim. Acta 2003, 496, 289–300. [Google Scholar] [CrossRef]
  6. Tzou, T.Z.; Weller, S.W. Catalytic oxidation of dimethyl methylphosphonate. J. Catal. 1994, 146, 370–374. [Google Scholar] [CrossRef]
  7. O’Shea, K.E.; Beightol, S.; Garcia, I.; Aguilar, M.; Kalen, D.V.; Cooper, W.J. Photocatalytic decomposition of organophosphonates in irradiated TiO2 suspensions. J. Photochem. Photobiol. A Chem. 1997, 107, 221–226. [Google Scholar] [CrossRef]
  8. Wilmsmeyer, A.R.; Gordon, W.O.; Davis, E.D.; Troya, D.; Mantooth, B.A.; Lalain, T.A.; Morris, J.R. Infrared spectra and binding energies of chemical warfare nerve agent simulants on the surface of amorphous silica. J. Phys. Chem. C 2013, 117, 15685–15697. [Google Scholar] [CrossRef]
  9. Wilmsmeyer, A.R.; Uzarski, J.; Barrie, P.J.; Morris, J.R. Interactions and binding energies of dimethyl methylphosphonate and dimethyl chlorophosphate with amorphous silica. Langmuir 2012, 28, 10962–10967. [Google Scholar] [CrossRef]
  10. Mitchell, M.B.; Sheinker, V.N.; Mintz, E.A. Adsorption and decomposition of dimethyl methylphosphonate on metal oxides. J. Phys. Chem. B 1997, 101, 11192–11203. [Google Scholar] [CrossRef]
  11. Templeton, M.K.; Weinberg, W.H. Adsorption and decomposition of dimethyl methylphosphonate on an aluminum oxide surface. J. Am. Chem. Soc. 1985, 107, 97–108. [Google Scholar] [CrossRef]
  12. Lin, S.T.; Klabunde, K.J. Thermally activated magnesium oxide surface chemistry. Adsorption and decomposition of phosphorus compounds. Langmuir 1985, 1, 600–605. [Google Scholar] [CrossRef]
  13. Li, Y.X.; Schlup, J.R.; Klabunde, K.J. Fourier transform infrared photoacoustic spectroscopy study of the adsorption of organophosphorus compounds on heat-treated magnesium oxide. Langmuir 1991, 7, 1394–1399. [Google Scholar] [CrossRef]
  14. Štengl, V.; Houšková, V.; Bakardjieva, S.; Murafa, N.; Maříková, M.; Opluštil, F.; Němec, T. Zirconium doped nano-dispersed oxides of Fe, Al and Zn for destruction of warfare agents. Mater. Charact. 2010, 61, 1080–1088. [Google Scholar] [CrossRef]
  15. Tesfai, T.M.; Sheinker, V.N.; Mitchell, M.B. Decomposition of dimethyl methylphosphonate (DMMP) on alumina-supported iron oxide. J. Phys. Chem. B 1998, 102, 7299–7302. [Google Scholar] [CrossRef]
  16. Mitchell, M.B.; Sheinker, V.N.; Tesfamichael, A.B.; Gatimu, E.N.; Nunley, M. Decomposition of dimethyl methylphosphonate (DMMP) on supported cerium and iron co-impregnated oxides at room temperature. J. Phys. Chem. B 2003, 107, 580–586. [Google Scholar] [CrossRef]
  17. Sheinker, V.N.; Mitchell, M.B. Quantitative study of the decomposition of dimethyl methylphosphonate (DMMP) on metal oxides at room temperature and above. Chem. Mater. 2002, 14, 1257–1268. [Google Scholar] [CrossRef]
  18. Tang, X.; Hicks, Z.; Wang, L.; Ganteför, G.; Bowen, K.H.; Tsyshevsky, R.; Sun, J.; Kuklja, M.M. Adsorption and decomposition of dimethyl methylphosphonate on size-selected (MoO3)3 clusters. Phys. Chem. Chem. Phys. 2018, 20, 4840–4850. [Google Scholar] [CrossRef]
  19. Hung, W.-C.; Wang, J.-C.; Wu, K.-H. Adsorption and decomposition of dimethyl methylphosphonate (DMMP) on expanded graphite/metal oxides. Appl. Surf. Sci. 2018, 444, 330–335. [Google Scholar] [CrossRef]
  20. Mera, N.; Hirakawa, T.; Sano, T.; Takeuchi, K.; Ichinose, H.; Seto, Y.; Negishi, N. Continuous elimination of gaseous dimethyl methylphosphonate by a photocatalytic flow reaction system. Appl. Catal. B Environ. 2014, 146, 71–78. [Google Scholar] [CrossRef]
  21. Grandcolas, M.; Sinault, L.; Mosset, F.; Louvet, A.; Keller, N.; Keller, V. Self-decontaminating layer-by-layer functionalized textiles based on WO3-modified titanate nanotubes. Application to the solar photocatalytic removal of chemical warfare agents. Appl. Catal. A Gen. 2011, 391, 455–467. [Google Scholar] [CrossRef]
  22. Rusu, C.N.; Yates, J.T. Adsorption and decomposition of dimethyl methylphosphonate on TiO2. J. Phys. Chem. B 2000, 104, 12292–12298. [Google Scholar] [CrossRef]
  23. Panayotov, D.A.; Morris, J.R. Uptake of a chemical warfare agent simulant (DMMP) on TiO2: Reactive adsorption and active site poisoning. Langmuir 2009, 25, 3652–3658. [Google Scholar] [CrossRef] [PubMed]
  24. Jeong, J.H.; Kim, S.Y.; Kim, J.; Cha, B.J.; Han, S.W.; Park, C.H.; Woo, T.G.; Kim, C.S.; Kim, Y.D. Adsorption and oxidative desorption of acetaldehyde over mesoporous FexOyHz/Al2O3. ACS Omega 2019, 4, 5382–5391. [Google Scholar] [CrossRef] [PubMed]
  25. Hong, Y.; Cha, B.J.; Kim, Y.D.; Seo, H.O. Mesoporous SiO2 particles combined with Fe oxide nanoparticles as a regenerative methylene blue adsorbent. ACS Omega 2019, 4, 9745–9755. [Google Scholar] [CrossRef] [PubMed]
  26. Templeton, M.K.; Weinberg, W.H. Decomposition of phosphonate esters adsorbed on aluminum oxide. J. Am. Chem. Soc. 1985, 107, 774–779. [Google Scholar] [CrossRef]
  27. Dixon, J.R.; George, W.O.; Hossain, M.F.; Lewis, R.; Price, J.M. Hydrogen-bonded forms of methanol IR spectra and abinitiocalculations. J. Chem. Soc. Faraday Trans. 1997, 93, 3611–3618. [Google Scholar] [CrossRef]
Figure 1. (a) Scanning transmission electron microscopy (STEM) image of Fe-oxide/Al2O3 sample and scanning transmission electron microscopy-energy dispersive spectroscopy (STEM-EDS) mapping images of (b) Fe, (c) Al, and (d) O of Fe-oxide/Al2O3 sample are displayed. STEM image and EDS mapping images were taken at same position of Fe-oxide/Al2O3 sample. (e) Fe 2p3/2 core-level X-ray photoelectron spectrum (XPS) spectrum of Fe-oxide/Al2O3 is shown. (f) XRD patterns of bare Al2O3 and Fe-oxide/Al2O3 are shown.
Catalysts 09 00898 g001
Figure 2. Barrett-Joyner-Halenda (BJH) pore size distributions of pristine Al2O3 (none-annealed), bare Al2O3 (750 °C-annealed), and Fe-oxide/Al2O3 (750 °C-annealed) are shown.
Catalysts 09 00898 g002
Figure 3. Concentration changes of (a) dimethyl methylphosphonate (DMMP) and (b) CO2 in the gas passed through the empty SUS reactor (solid gray lines), the reactor filled with bare Al2O3 (empty blue squares) and Fe-oxide/Al2O3 (empty red circles) are displayed as a function of DMMP exposing time.
Catalysts 09 00898 g003
Figure 4. Fourier transform-infrared (FT-IR) spectra of (a,b) bare Al2O3 and (c,d) Fe-oxide/Al2O3 before and after 360 min of DMMP exposure at room temperature in two different wavenumber ranges of (a,c) 900–1500 cm−1, and (b,d) 2400–3800 cm−1 are shown. Characteristic IR absorption peaks of DMMP molecules are marked by arrows in (a) and (c).
Catalysts 09 00898 g004
Figure 5. A mechanism of reactive DMMP adsorption on metal-oxide surface via an electrophilic attack of the surface on DMMP molecule [10].
Catalysts 09 00898 g005
Figure 6. Gas chromatography (GC) peak area of Temperature Programmed Oxidation (TPO) experiments are displayed as a function of temperature for either case of (a) bare Al2O3 or (b) Fe-oxide/Al2O3. GC peaks of TPO experiments measured at various temperatures are displayed for either case of (c) bare Al2O3 or (d) Fe-oxide/Al2O3. The peak height of each GC peak was normalized to that of the respective GC peak obtained with each sample at 30 °C and the normalized GC spectra were vertically shifted for comparison. Deconvolution results of the GC peaks of TPO at various temperatures are displayed as a function of temperature of TPO experiments for the case of (e) bare Al2O3 and (f) Fe-oxide/Al2O3. The y-axis values of graphs in left- and right- column are displayed in same Y-axis scale, thus the GC peak area values between bare Al2O3 and Fe-oxide/Al2O3 can be directly compared.
Catalysts 09 00898 g006
Figure 7. (a) The main gas chromatography (Agilent, 6890) equipped with mass spectrometer (Agilent, 5973N) (GC/MS) peak in the retention time range of 1.0 to 2.0 min obtained with Fe-oxide/Al2O3 sample is shown. Intensity of (b) 44 m/z and (c) 31 m/z signal in the retention time region of the main GC/MS peak obtained with Fe-oxide/Al2O3 sample are shown.
Catalysts 09 00898 g007
Figure 8. (a) Experimental set-up used for DMMP exposing experiments at room temperature and (b) experimental set-up used for TPO experiments are schematically described.
Catalysts 09 00898 g008
Table 1. BET specific surface areas and pore diameters of pristine bare Al2O3 (none-annealed), bare Al2O3 (750 °C-anneaeld), and Fe-oxide/Al2O3 (750 °C-annealed) are summarized with the amount of Fe-loading of Fe-oxide/Al2O3 (750 °C-annealed) sample determined by inductively coupled plasma optical emission spectroscopy (ICP-OES).
BET Surface Area
(m2/g)
Average Pore Diameter
(nm)
Fe Loading
(wt%)
Pristine bare Al2O3
(none-annealed)
334.24.38-
Bare Al2O3
(750 °C-annealed)
138.69.56-
Fe-oxide/Al2O3
(750 °C-annealed)
171.86.4610.0
Table 2. DMMP breakthrough time and CO2 induction time of bare Al2O3 and Fe-oxide/Al2O3 are summarized.
DMMP
Breakthrough Time
(min)
CO2
Induction Time
(min)
Bare Al2O3
(none-annealed)
710560
Fe-oxide/Al2O3
(750 °C-annealed)
380310

