Article

A Comprehensive Study of Electrocatalytic Degradation of M-Tolylhydrazine with Binary Metal Oxide (Er2O3@NiO) Nanocomposite Modified Glassy Carbon Electrode

by
Tahir Ali Sheikh
1,*,
Abdullah M. Asiri
2,3,
Amna Siddique
1,
Hadi M. Marwani
2,3,
Md. Rezaur Rahman
4,
Muhammad Nadeem Akhtar
1 and
Mohammed M. Rahman
2,3,*
1
Institute of Chemistry, Baghdad-ul-Jadeed Campus, The Islamia University of Bahawalpur, Bahawalpur 63100, Pakistan
2
Center of Excellence for Advanced Materials Research (CEAMR), Faculty of Science, King Abdulaziz University, Jeddah 21589, Saudi Arabia
3
Chemistry Department, Faculty of Science, King Abdulaziz University, Jeddah 21589, Saudi Arabia
4
Faculty of Engineering, University of Malaysia Sarawak, Kota Samarahan 94300, Sarawak, Malaysia
*
Authors to whom correspondence should be addressed.
Catalysts 2023, 13(5), 905; https://doi.org/10.3390/catal13050905
Submission received: 26 February 2023 / Revised: 12 May 2023 / Accepted: 16 May 2023 / Published: 19 May 2023

Abstract

:
Generally, our ecosystem is continuously contaminated as a result of anthropogenic activities that form the basis of our comfort in our routine life. Thus, most scientists are engaged in the development of new technologies that can be used in environmental remediation. Herein, highly calcined binary metal oxide (Er2O3@NiO) semiconductor nanocomposite (NC) was synthesized using a classical wet chemical process with the intention to both detect and degrade the toxic chemicals in an aqueous medium using a novel electrochemical current–potential (I–V) approach for the first time. Optical, morphological, and structural properties of the newly synthesized semiconductor NC were also studied in detail using FT-IR, UV/Vis., FESEM-EDS, XPS, BET, EIS, and XRD techniques. Then, a modified glassy carbon electrode (GCE) based on the newly synthesized semiconductor nanocomposite (Er2O3@NiO-NC/Nafion/GCE) as a selective electrochemical sensor was fabricated with the help of 5% ethanolic-Nafion as the conducting polymer binder in order to both detect and electro-hydrolyze toxic chemicals in an aqueous medium. Comparative study showed that this newly developed Er2O3@NiO-NC/Nafion/GCE was found to be very selective against m-tolyl hydrazine (m-Tolyl HDZN) and to have good affinity in the presence of other interfering toxic chemicals. Analytical parameters were also studied in this approach to optimize the newly designed Er2O3@NiO-NC/Nafion/GCE as an efficient and selective m-Tolyl HDZN sensor. Its limit of detection (LOD) at an SNR of 3 was calculated as 0.066 pM over the linear dynamic range (LDR) of our target analyte concentration (0.1 pM–0.1 mM). The limit of quantification (LOQ) and sensitivity were also calculated as 0.22 pM and 14.50 µAµM−1cm−2, respectively. m-Tolyl HDZN is among the toxic chemicals in our ecosystem that have lethal effects in living beings. Therefore, this newly designed electrochemical sensor based on semiconductor nanostructure material offers, for the first time, a cost-effective technique, in addition to long-term stability, that can be used as an alternative for efficiently probing other toxic chemicals in real samples.

1. Introduction

Recently, the advancement in nanoscience and nanotechnology has attained the impressive attention of many scientists owing to the significant impact of these technologies on the growth in this modern era of science. These technologies have a wide range of commercial applications in food industries [1], pharmaceutical industries [2], chemical industries [3], energy conversion and storage devices [4,5,6], and many other domains of life, in addition to toxic chemical sensing in our ecosystem [7,8,9]. Their advancement relies on the production of semiconductor nanostructure materials of different kinds of metal oxides, along with their unique morphologies at nano scales. Compared to their bulk substances, semiconductor nanostructure materials of different metal oxides have highly impressive physio-chemical properties, such as electrical, optical, mechanical, and magnetic properties, besides catalytic and thermal stability, and can be used for various purposes [10,11]. Similarly, advanced research on semiconductor nanostructure materials has also shown that doped semiconductor nanostructure metal oxides have gained popularity in the field of nanoscience as they have impressive and excellent enhanced physio-chemical properties [12,13,14]. Moreover, these physio-chemical properties can also be modulated according to our requirements by doping or co-doping of inner or outer transition metal oxides in different proportions into pure intrinsic semiconductor nanostructure metal oxides [15].
Recently, many researchers have focused their research on the field of advanced materials by developing different kinds of doped/undoped semiconductor nanostructure materials, with the aim of environmental remediation, for the detection, removal, and degradation of ubiquitous contaminants via different analytical approaches [16,17,18,19,20]. Among these various analytical approaches, different electro-analytical approaches based on doped or undoped semiconductor nanostructure materials, as well as on heteronuclear nanostructure composites, have been also reported in the literature for the detection of toxic chemicals in our ecosystem [21,22,23]. Subsequently, the good electron communication feature of semiconductor nanostructure materials form the basis of electrochemical sensing of toxic chemicals, in addition to their electrocatalytic degradation by advanced oxidation processes (AOPs). Although rare earth elements are not too much efficient in electrical conductivity but their electrochemical performance can be further enhanced by doping, in a very minute quantity, or mixing, in bulk with semiconductor transition metal oxides [7,24]. Thus, in this work, a binary metal oxide semiconductor nanostructure composite of erbium oxide in combination with nickel oxide (Er2O3@NiO) was synthesized with the intention to evaluate its electrocatalytic behavior against various toxic chemicals in an aqueous system. Results showed it to be both selective and effective against m-Tolyl HDZN. Moreover, the nanomaterials Er2O3 and NiO are individually thought to be multifunctional because of their prestigious physio-chemical properties [25,26,27,28,29,30,31,32,33,34], and have a wide range of applications in biomedical [34,35,36,37], chemical [38,39], thermal conductivity [40,41], pharmaceutical [42,43,44,45], sensing [15,24,46,47], electrochromic [48,49], energy storage [50,51,52], agri-science [53,54,55], and catalysis fields [56,57,58,59,60,61,62].
Hydrazine and its derivatives are used as raw materials that are involved in different kinds of chemical reactions during the production of final products in different domains of chemical industries, such as in the manufacture of pesticides, plant-growth regulators, dyes, paint, pharmaceuticals, and polymers [63,64,65,66,67]. Moreover, unprocessed effluents from these industries also contain traces of respective hydrazine compounds that are continuously contaminating our ecosystem. Our newly designed non-reported binary metal oxide(Er2O3@NiO) semiconductor nanocomposite (NC) was found to be effective against m-Tolyl HDZN, which is a derivative of hydrazine that has been declared toxic and carcinogenic in nature by the National Institute for Occupational Safety and Health (NIOISH) and the US Environmental Protection Agency (EPA) [68]. It is also known as a nephrotoxic and cynogenic chemical. It causes cancer and chronic damage to the kidney, and for this reason is known as being a nephrotoxic chemical. Similarly, it also causes hazardous effects in the liver, lungs, and central nervous system (CNS), in addition to headaches, dizziness, vomiting, and some allergic reactions in the skin, eyes, and respiratory tract if exposed to it for a long time [68,69,70,71]. So, various research techniques, such as ultra-high-performance liquid chromatography–tandem mass spectrometry [72], high-performance liquid chromatography coupled with a UV detector [73], ion-exclusion chromatography [74], spectrophotometry [75,76], flow injection chemiluminescence [77], chemiluminescence [78], gas chromatography–mass spectrometry [73,79,80], fluorimetry [81], colorimetry [82], microchip capillary electrophoresis/electrochemical detection [83], capillary electrophoresis [84,85], and solid phase extraction [86,87], in addition to electrochemical techniques [88,89,90,91,92], have been cited in the literature for the detection of hydrazine itself and its derivatives. Most of the reported methods are not very sensitive, and those that are sensitive are very expensive and complicated to understand. Hence, it is necessary to develop a cheap, reliable, and efficient method for the sensitive and selective determination of m-Tolyl HDZN, both qualitatively and quantitatively, in addition to its electrocatalytic degradation by advanced oxidation processes (AOPs).
In this study, for the first time, binary metal oxide Er2O3@NiO NC was synthesized using a classical wet chemical method to assess its electrocatalytic performance against toxic chemicals in an aqueous system. A glassy carbon electrode (GCE) modified by the newly synthesized non-reported binary metal oxide Er2O3@NiO NC was fabricated as an efficient and selective electrochemical probe and was found to be effective against m-Tolyl HDZN, qualitatively and quantitatively. For this purpose, a novel, cost-effective, and reliable electrochemical, current–potential (I–V), approach was employed using a Keithley electrometer and the current response of newly modified GCE was observed in the presence of m-Tolyl HDZN against applied potential ranging from 0.0 to +1.5 V. This I–V approach is considered as being more efficient than other electrochemical approaches such as CV, DPV, and LSV. It uses a two-electrode system (counter electrode and working electrode) instead of three electrodes (counter electrode, working electrode, and reference electrode) as is needed in CV, DPV, and LSV. Moreover, the response obtained by this novel current–potential approach is known as the I–V curve or I–V response and is very easy to understand as it follows Ohm’s law. In this technique, current is measured against the potential applied in the two-electrode system, where one electrode is the counter electrode (Pt-wire) and the other is the working electrode (newly developed/designed electrode based on semiconductor materials),which measures the current against the potential applied in an aqueous system. Furthermore, this effort presents a very impressive initiative for the determination and electrocatalytic degradation of toxic chemicals in an aqueous system via advanced oxidation processes (AOPs) based on newly designed non-reported semiconductor nanostructure materials applied using a reliable electrochemical (I–V) approach.

2. Results and Discussion

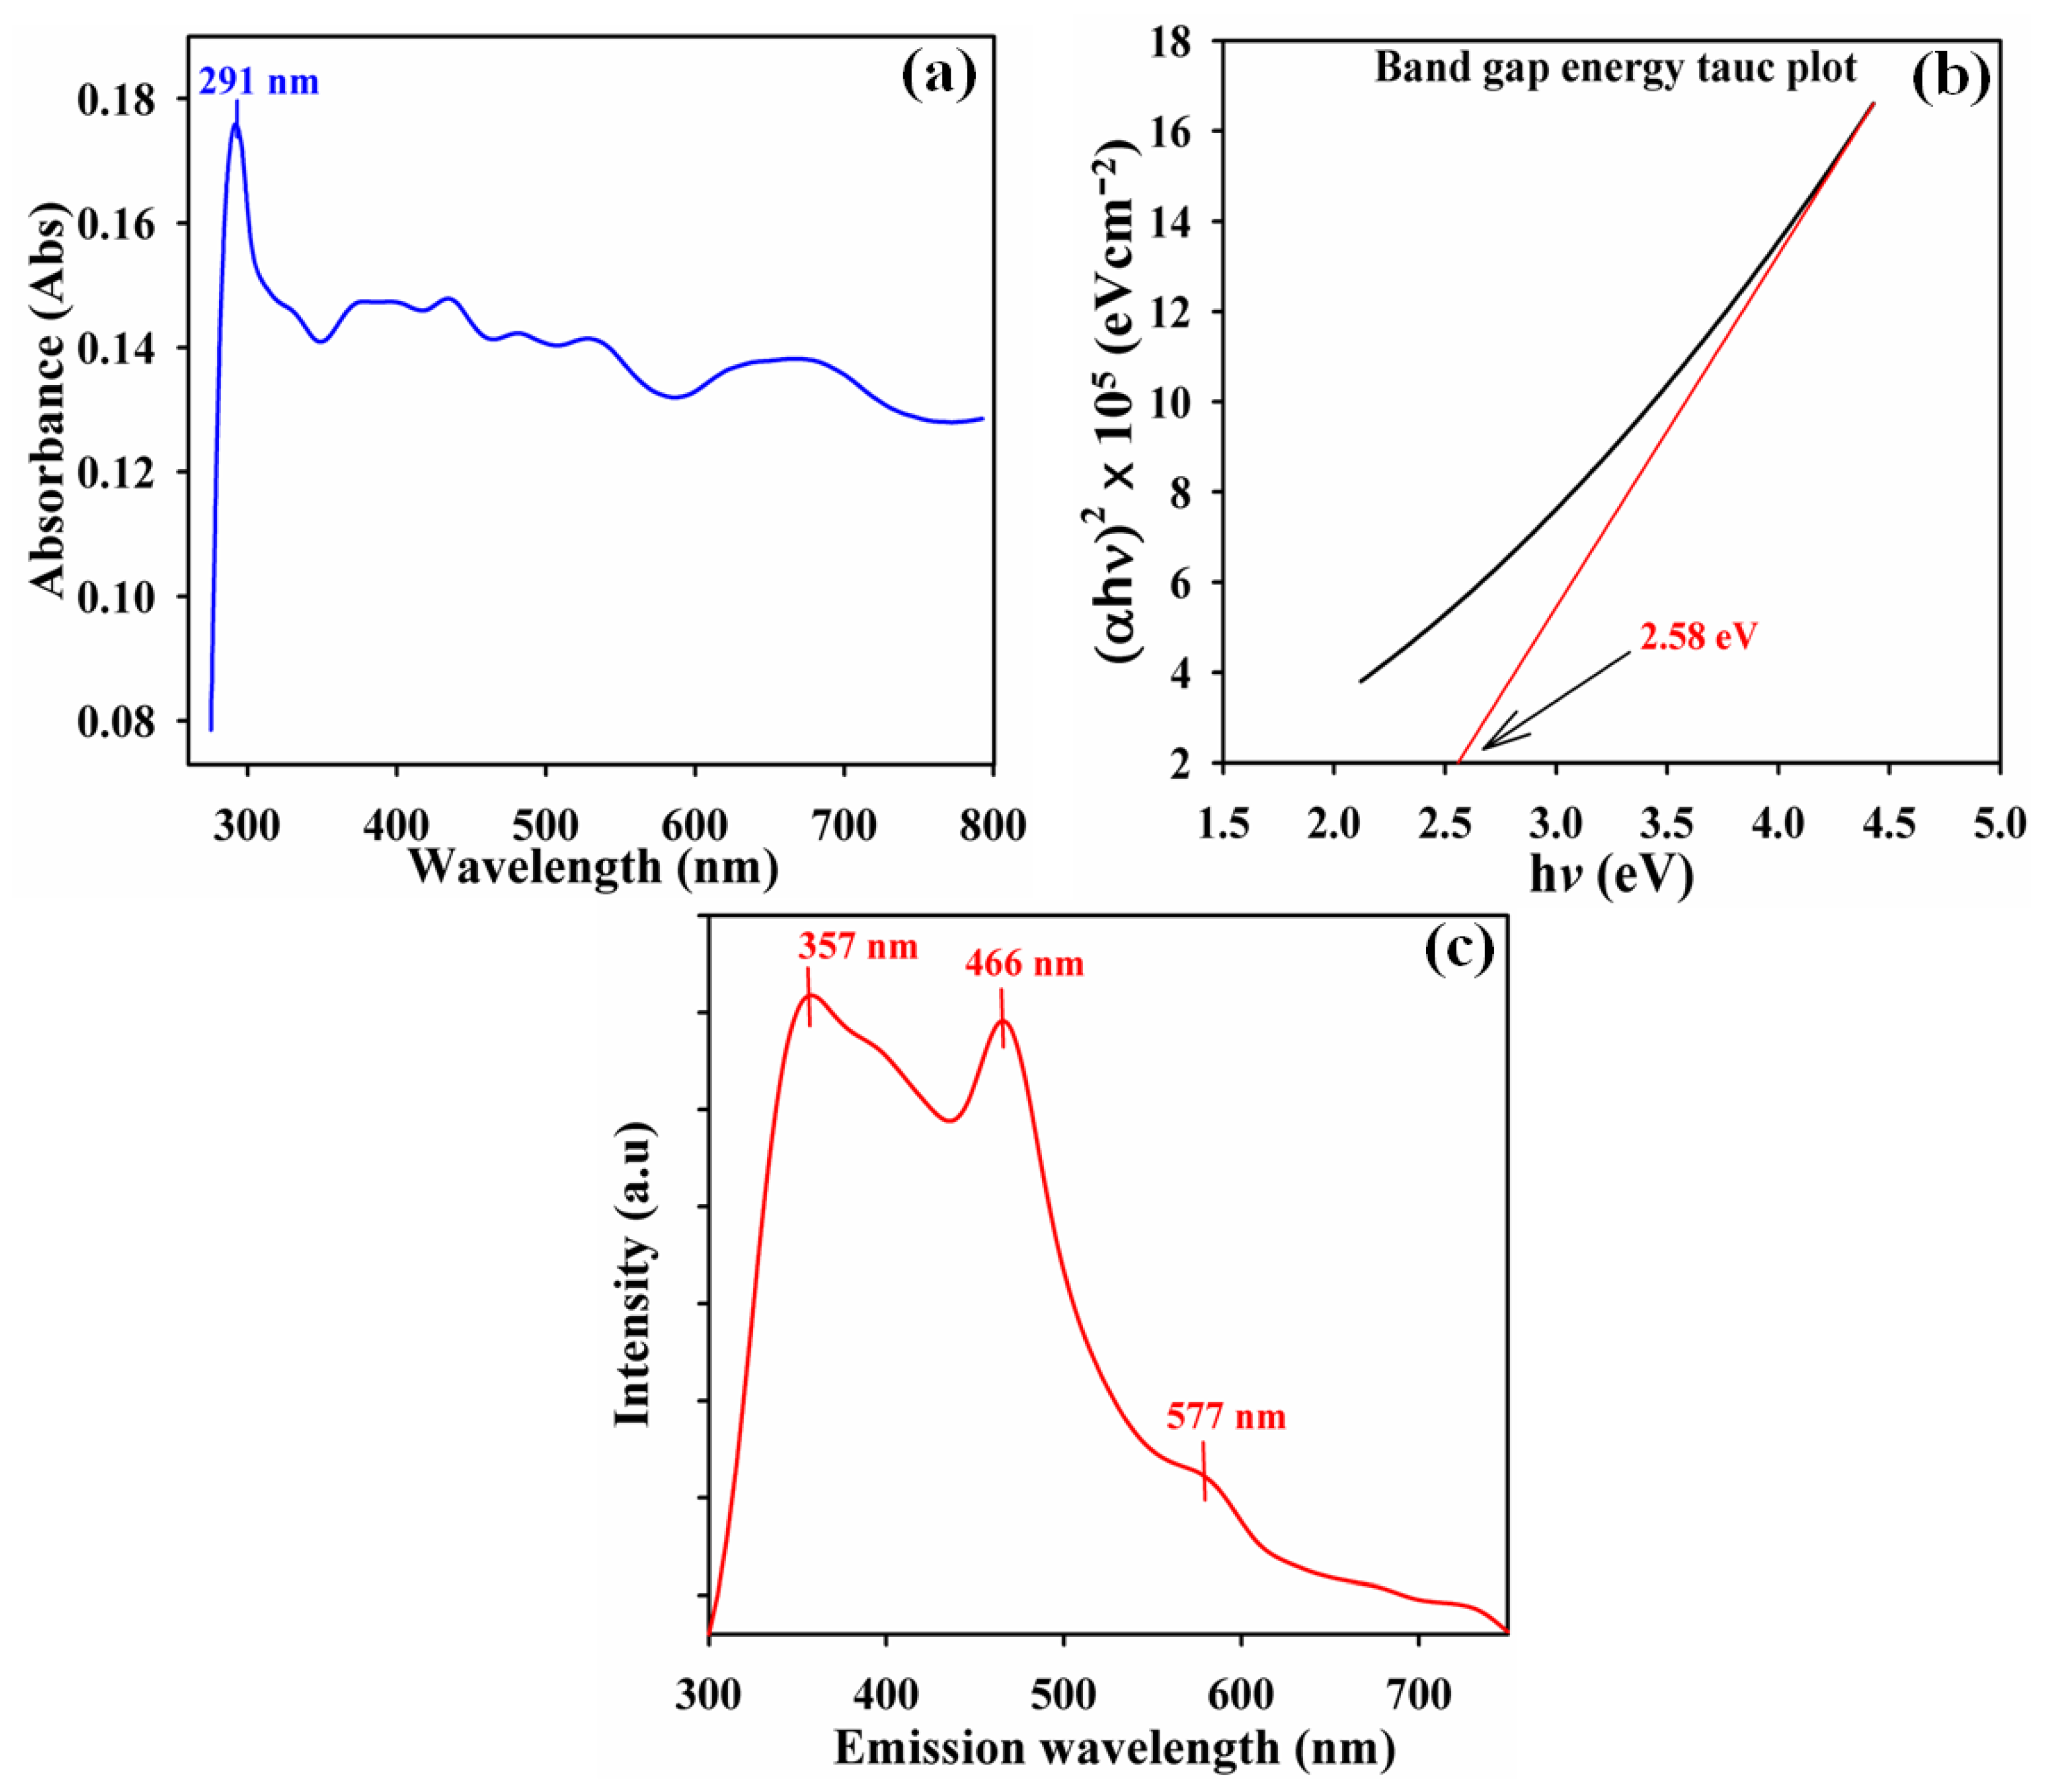
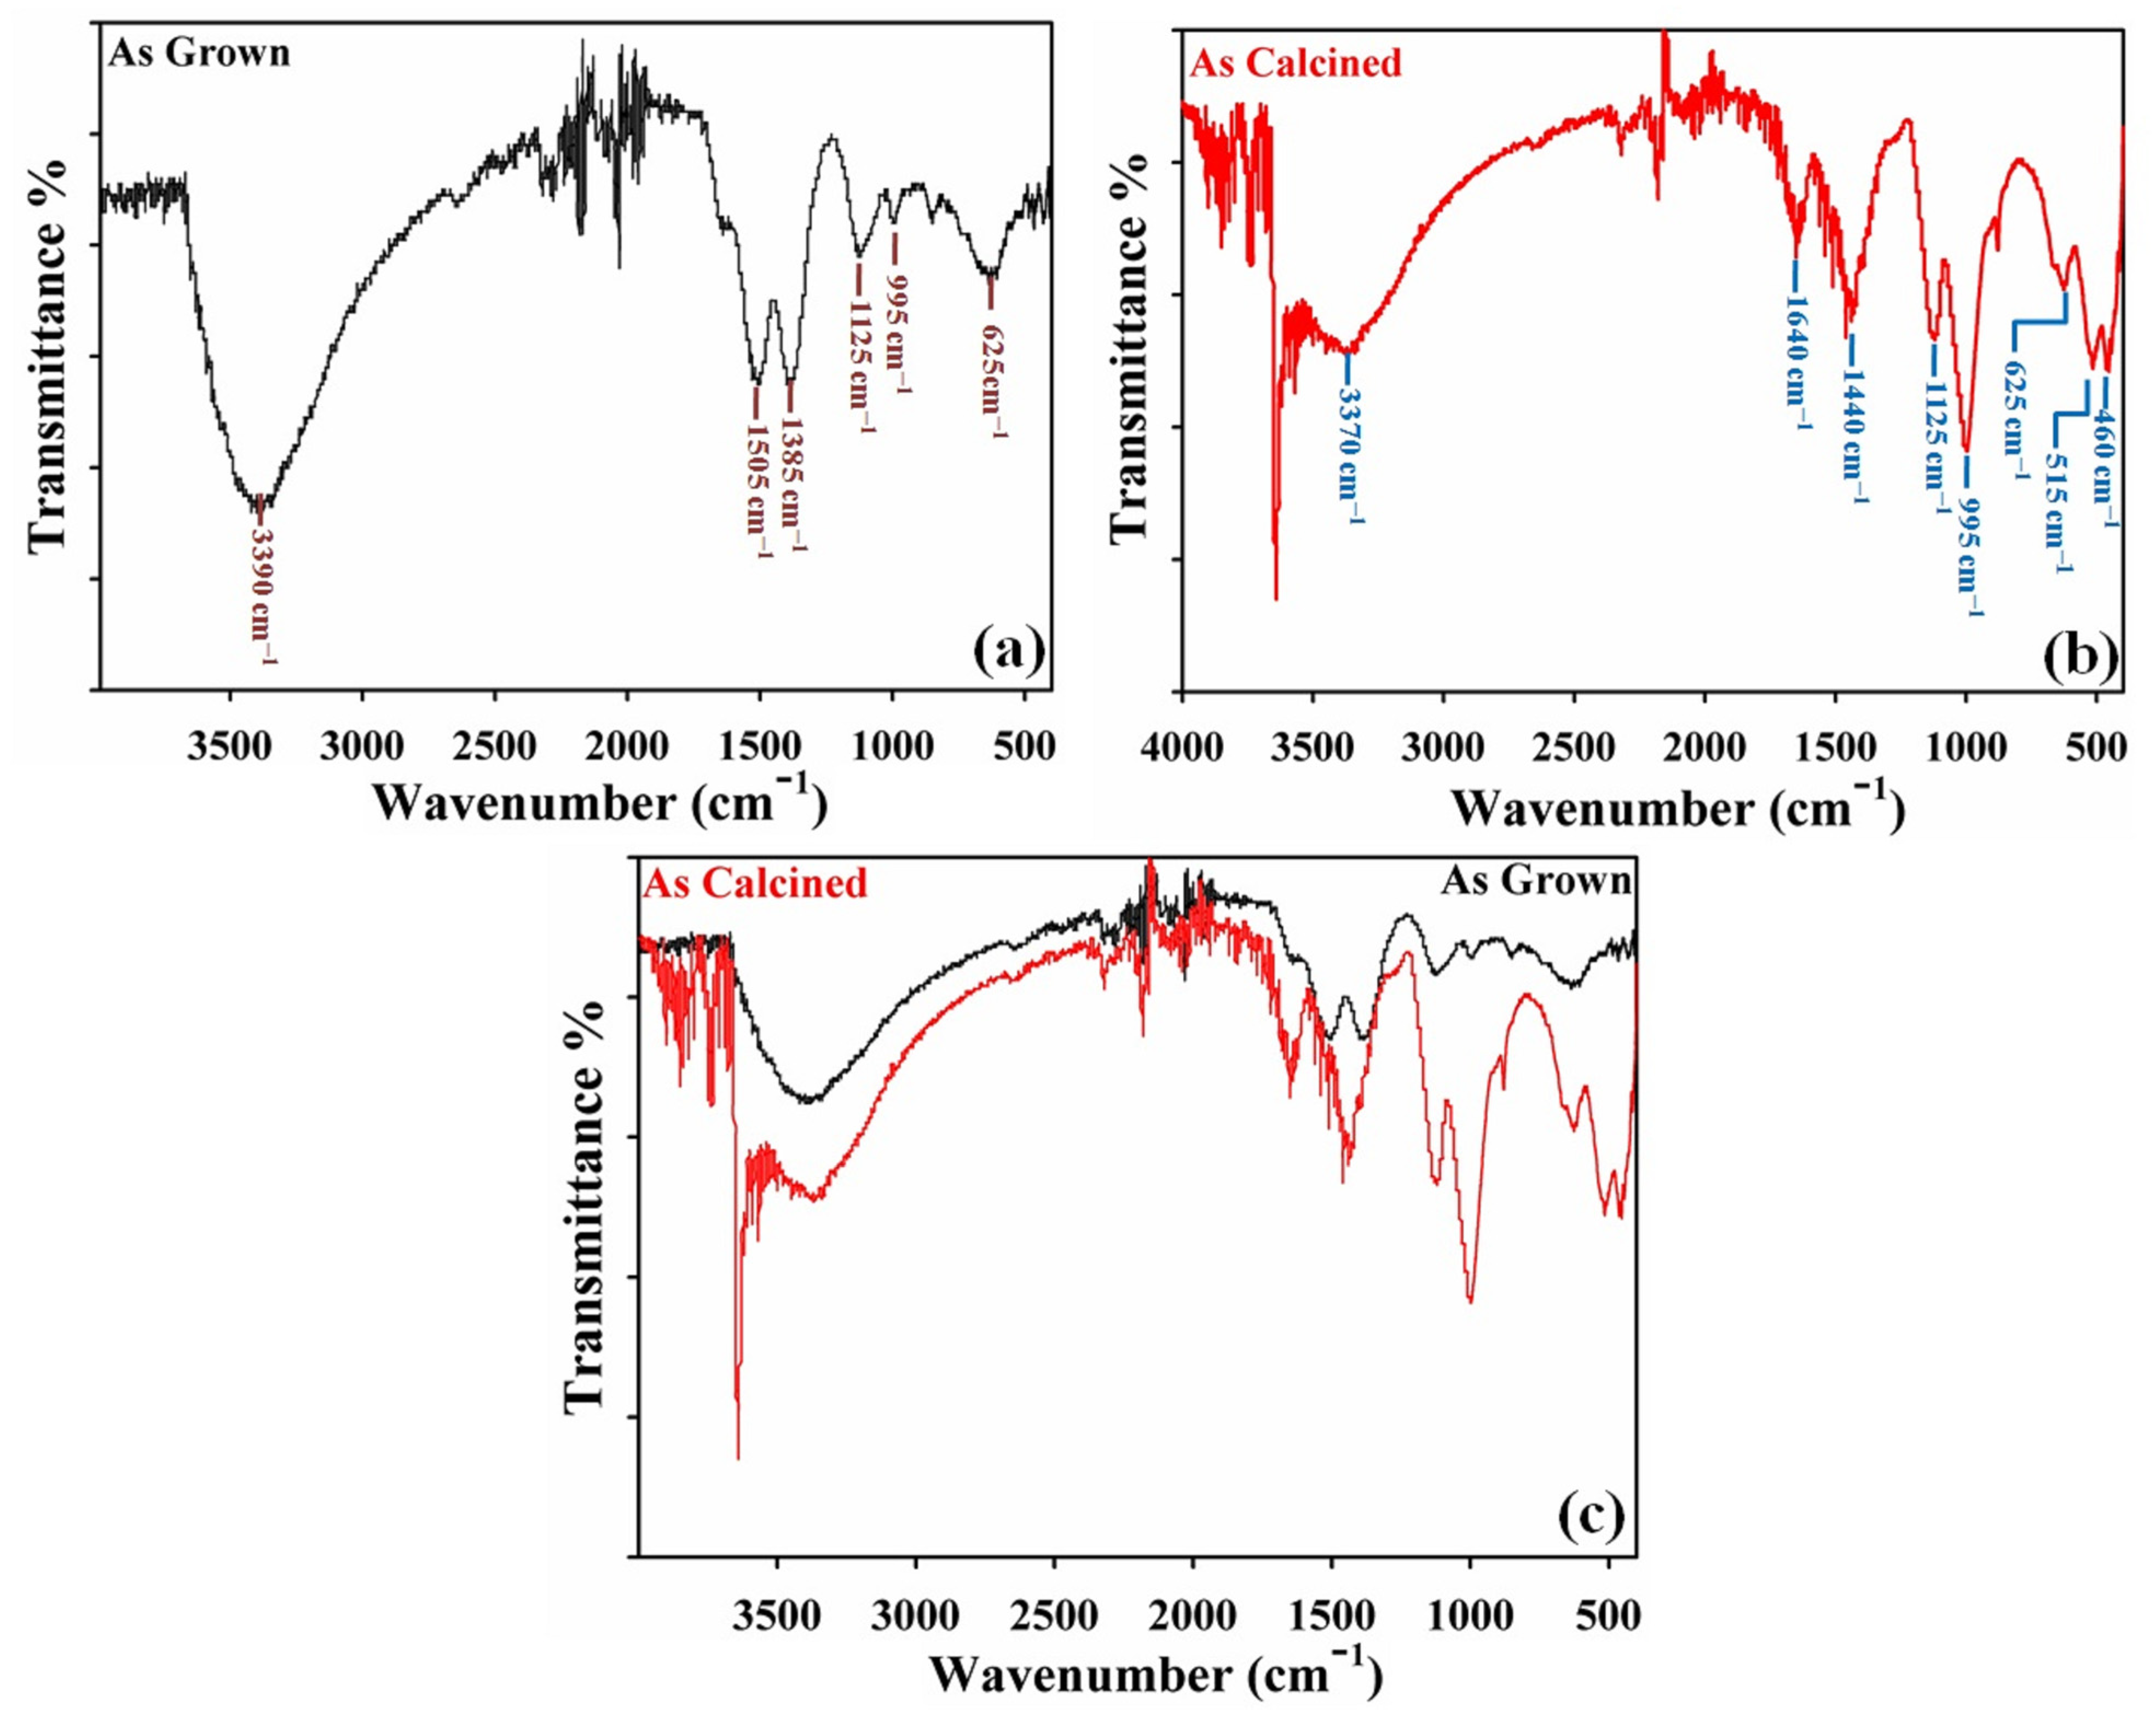
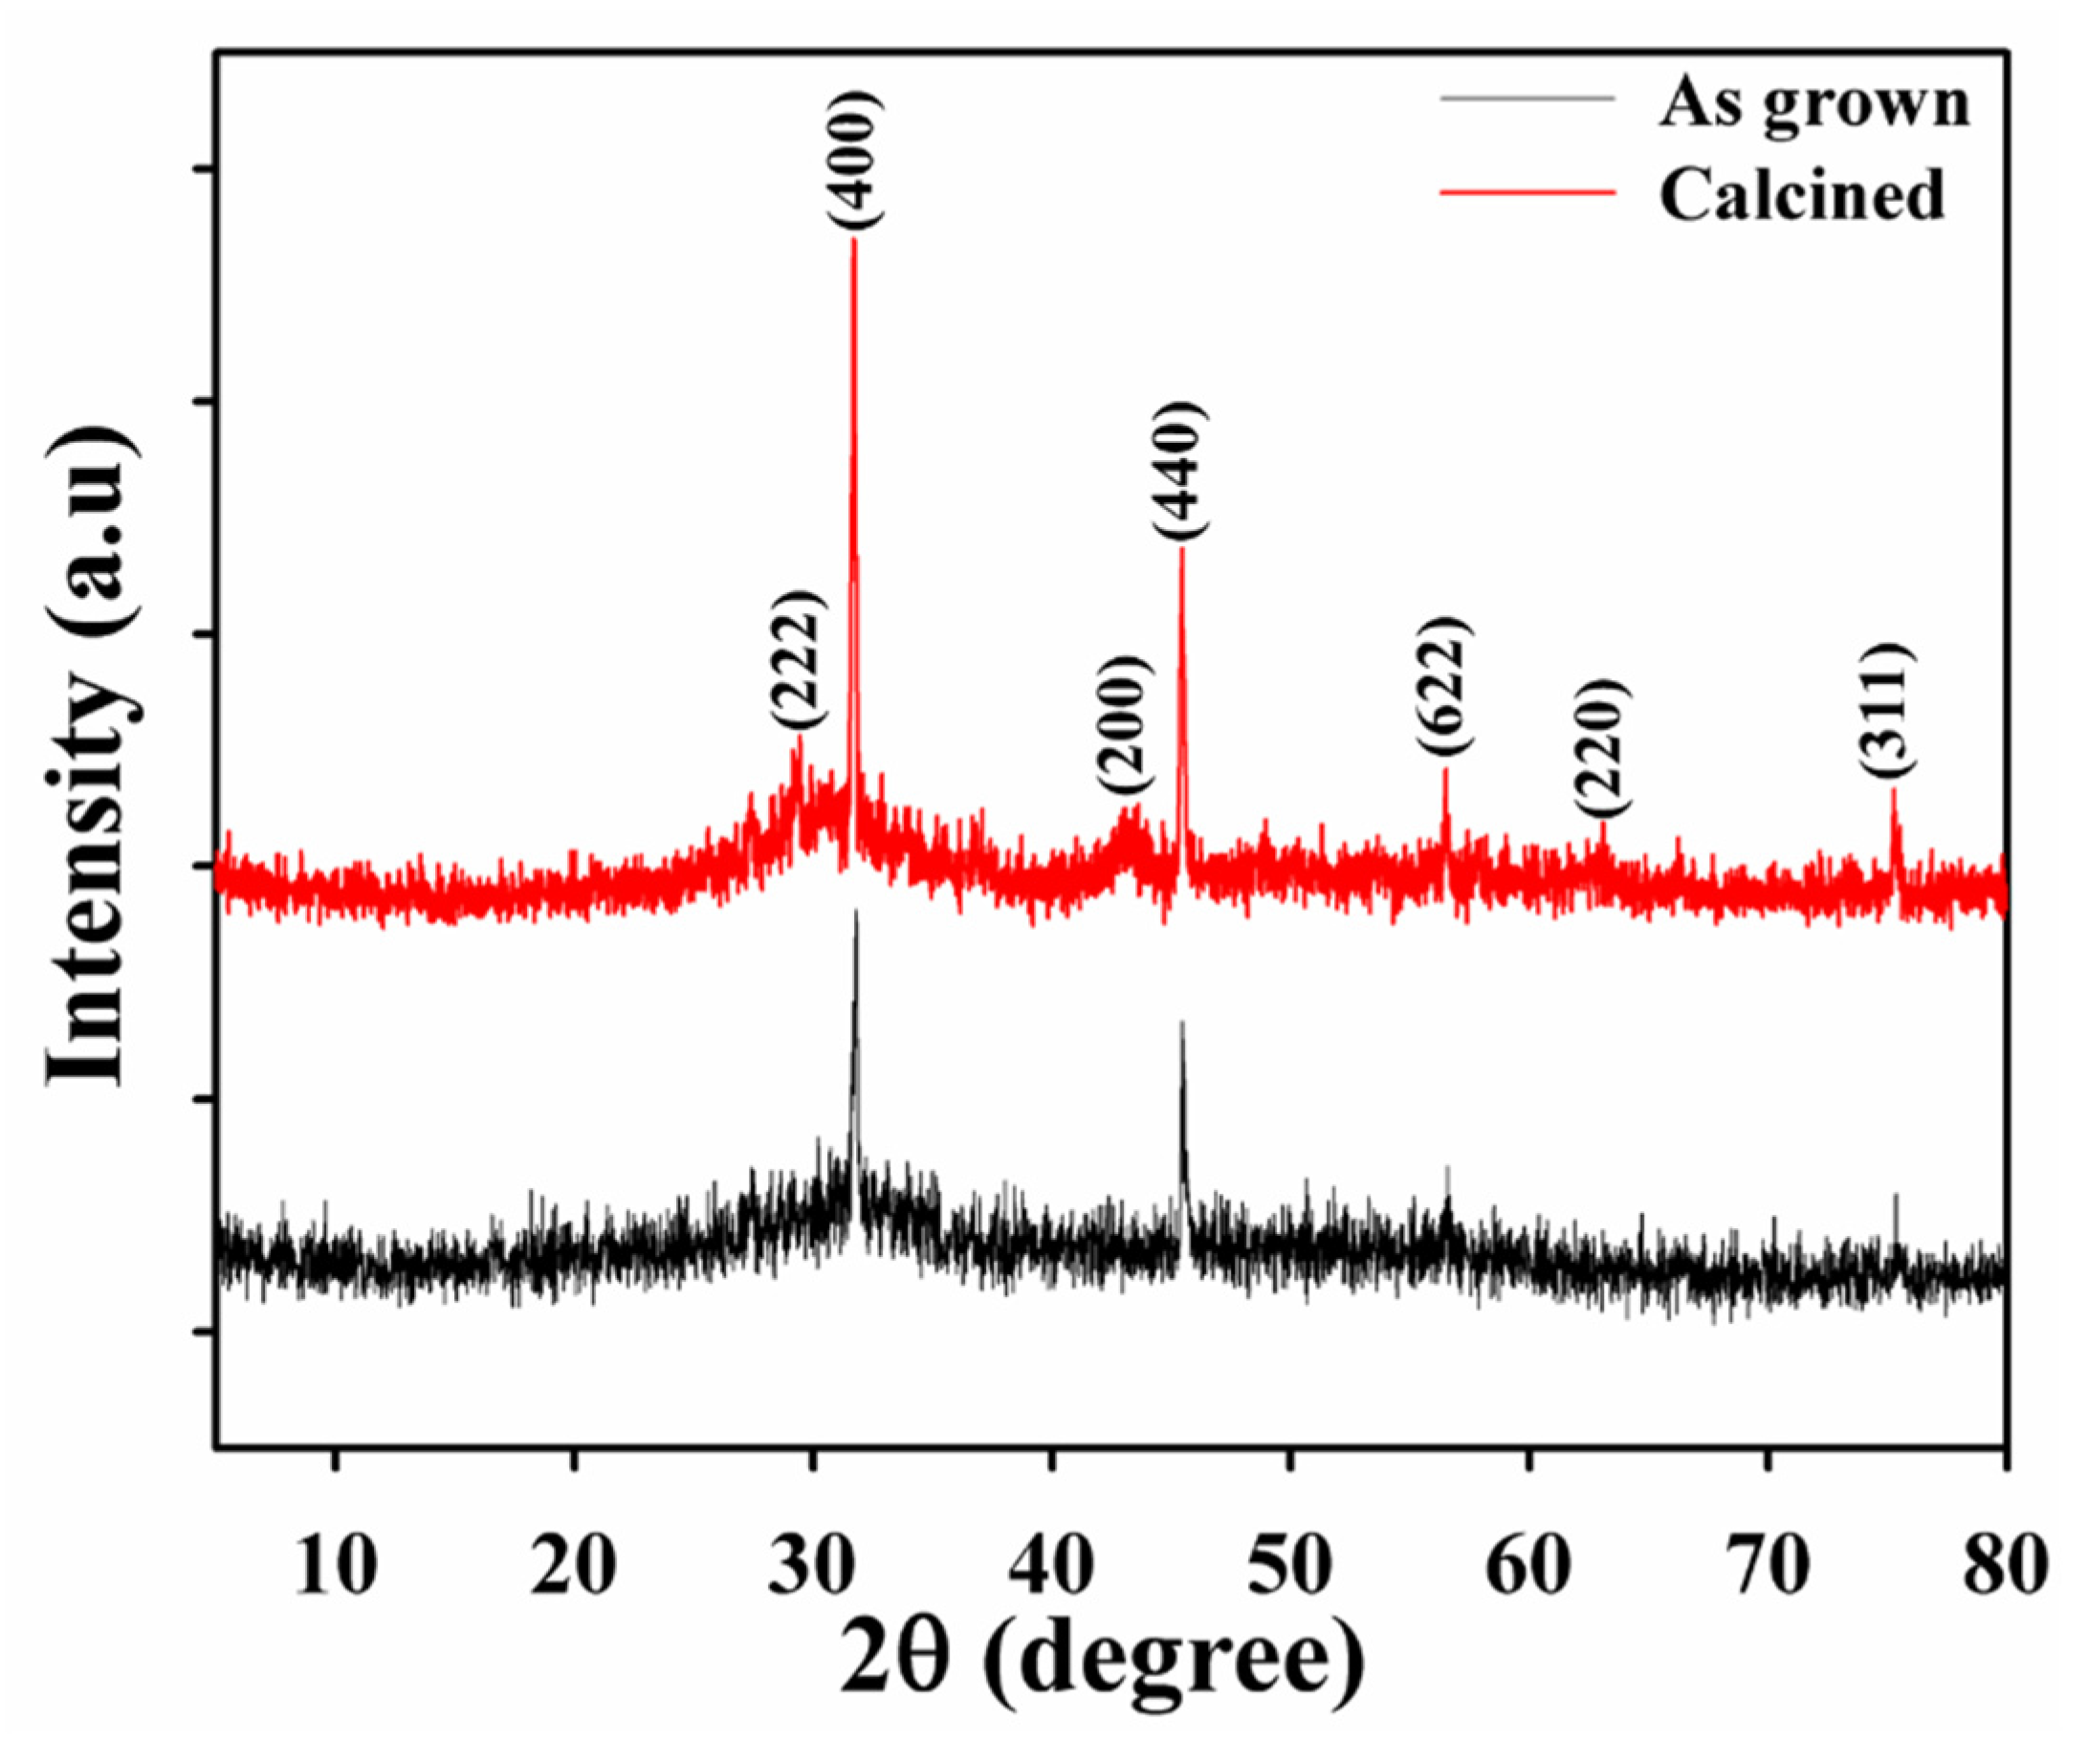
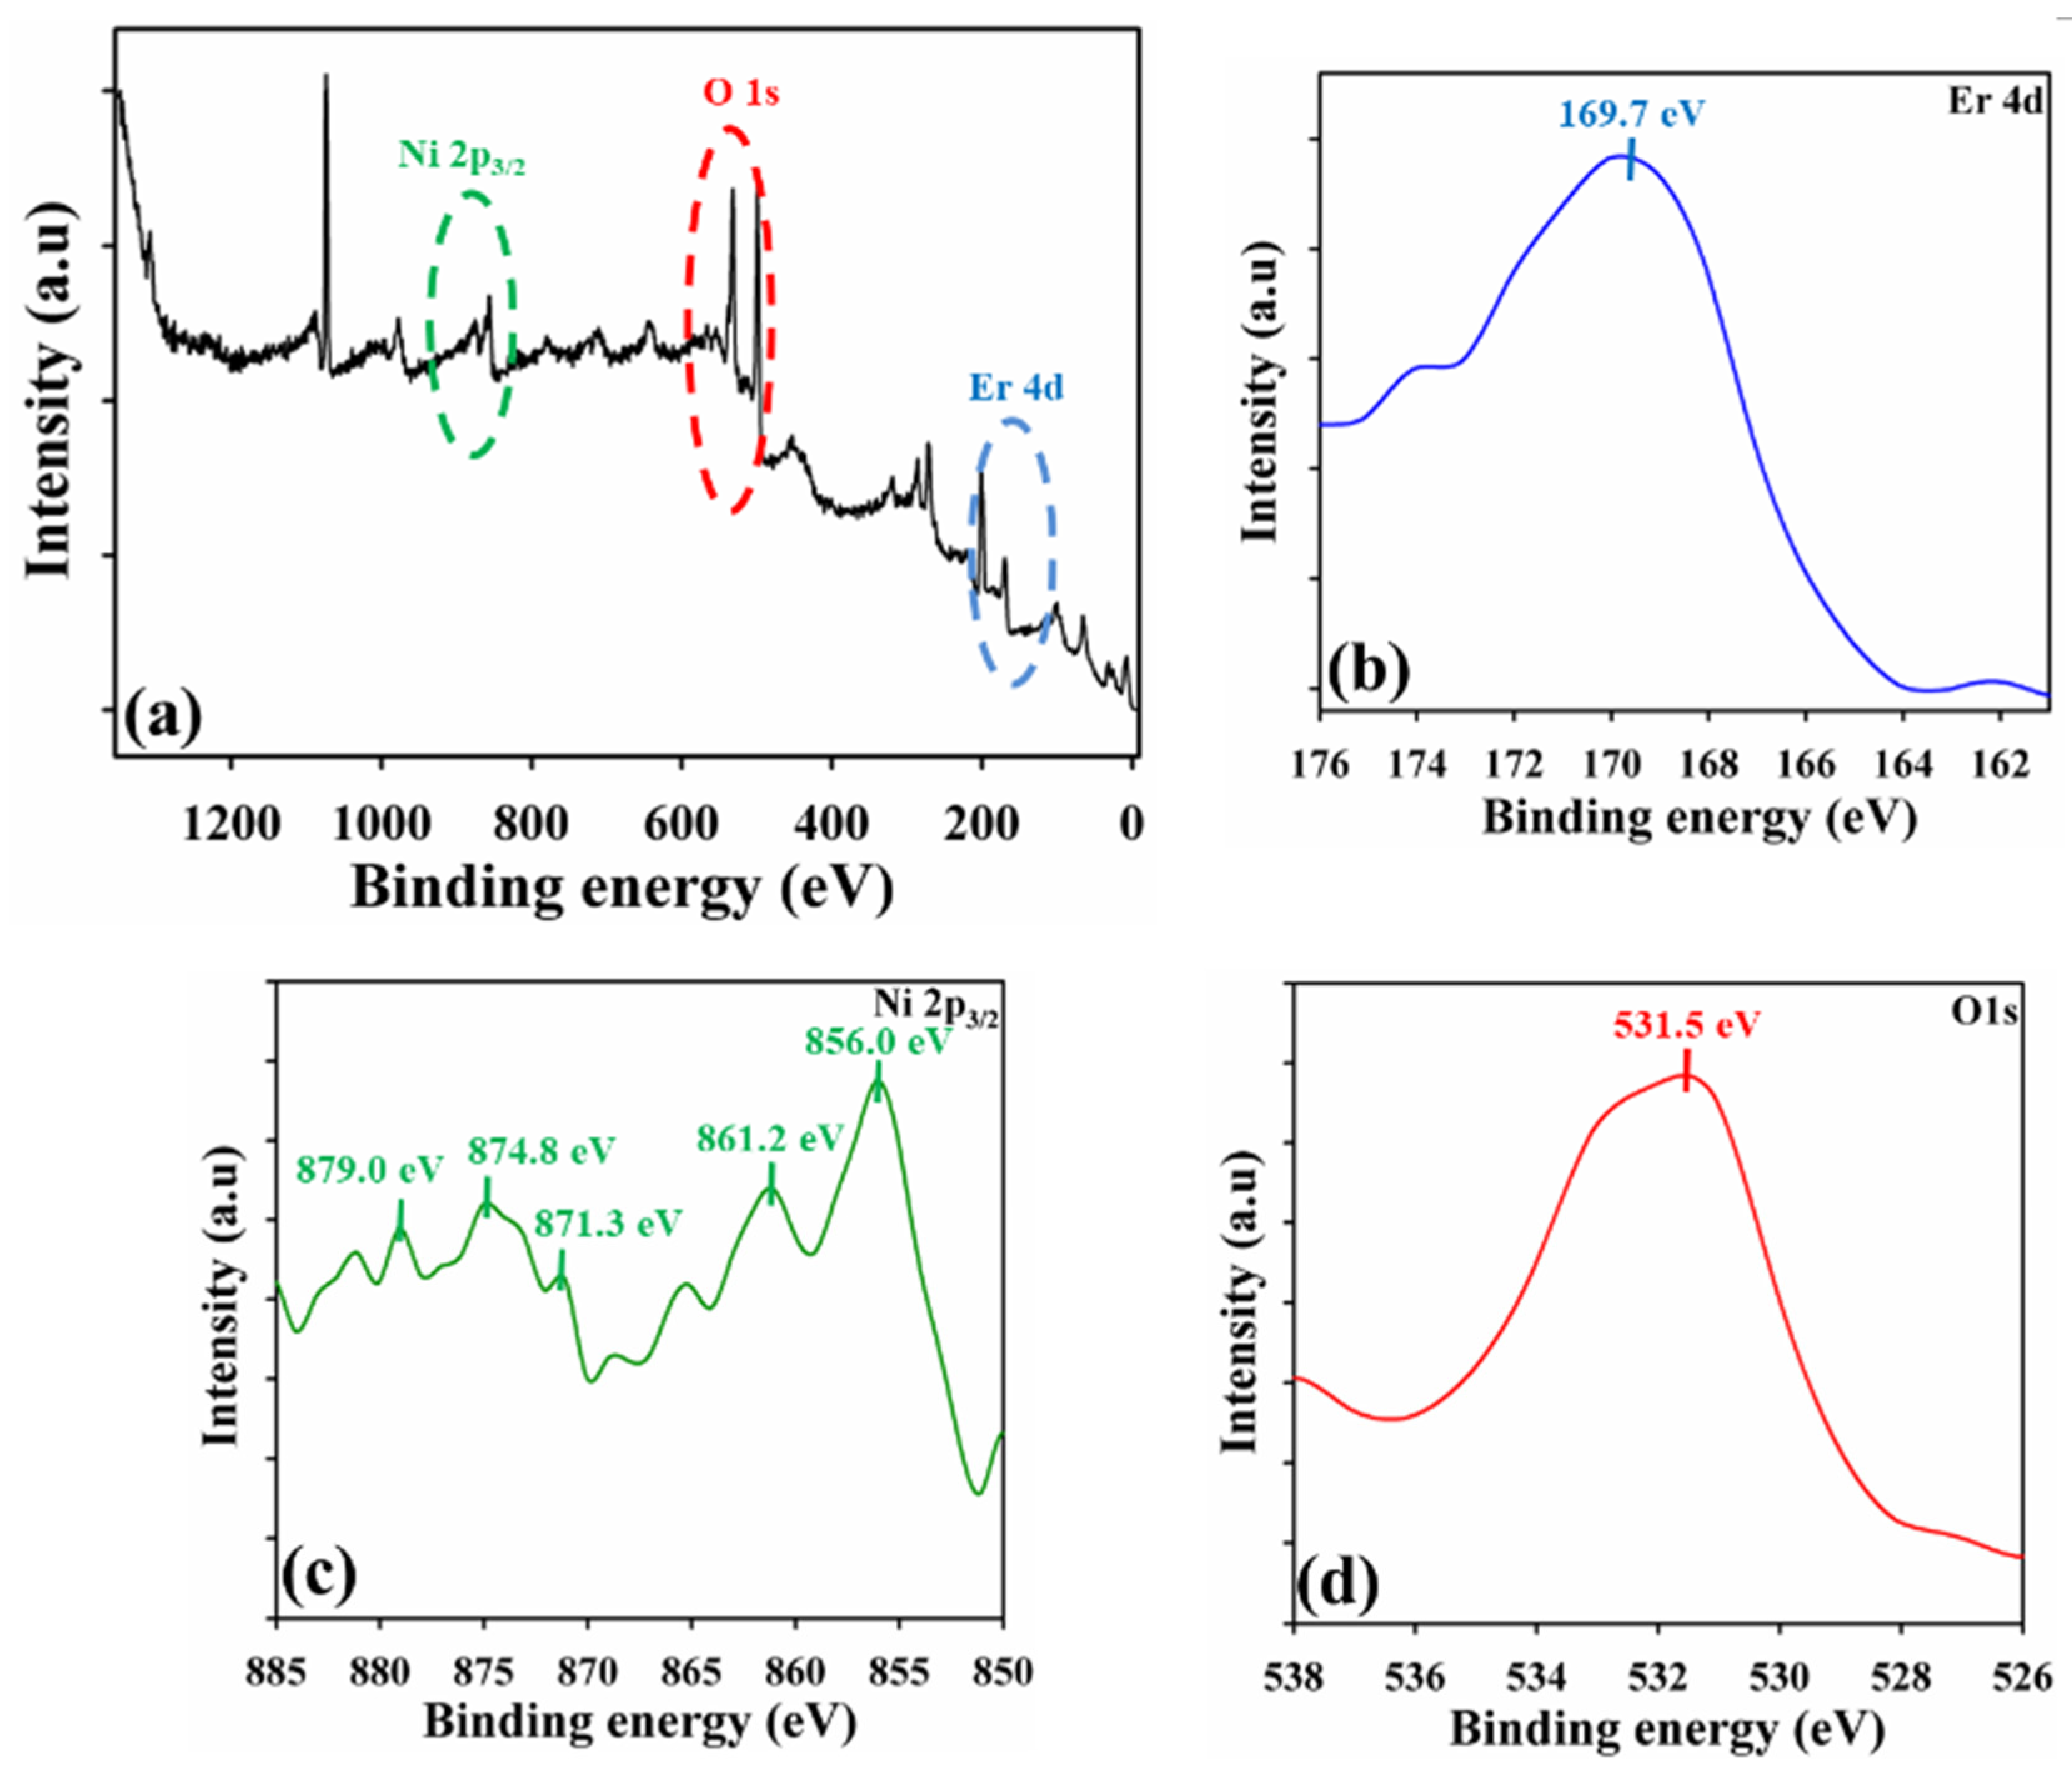
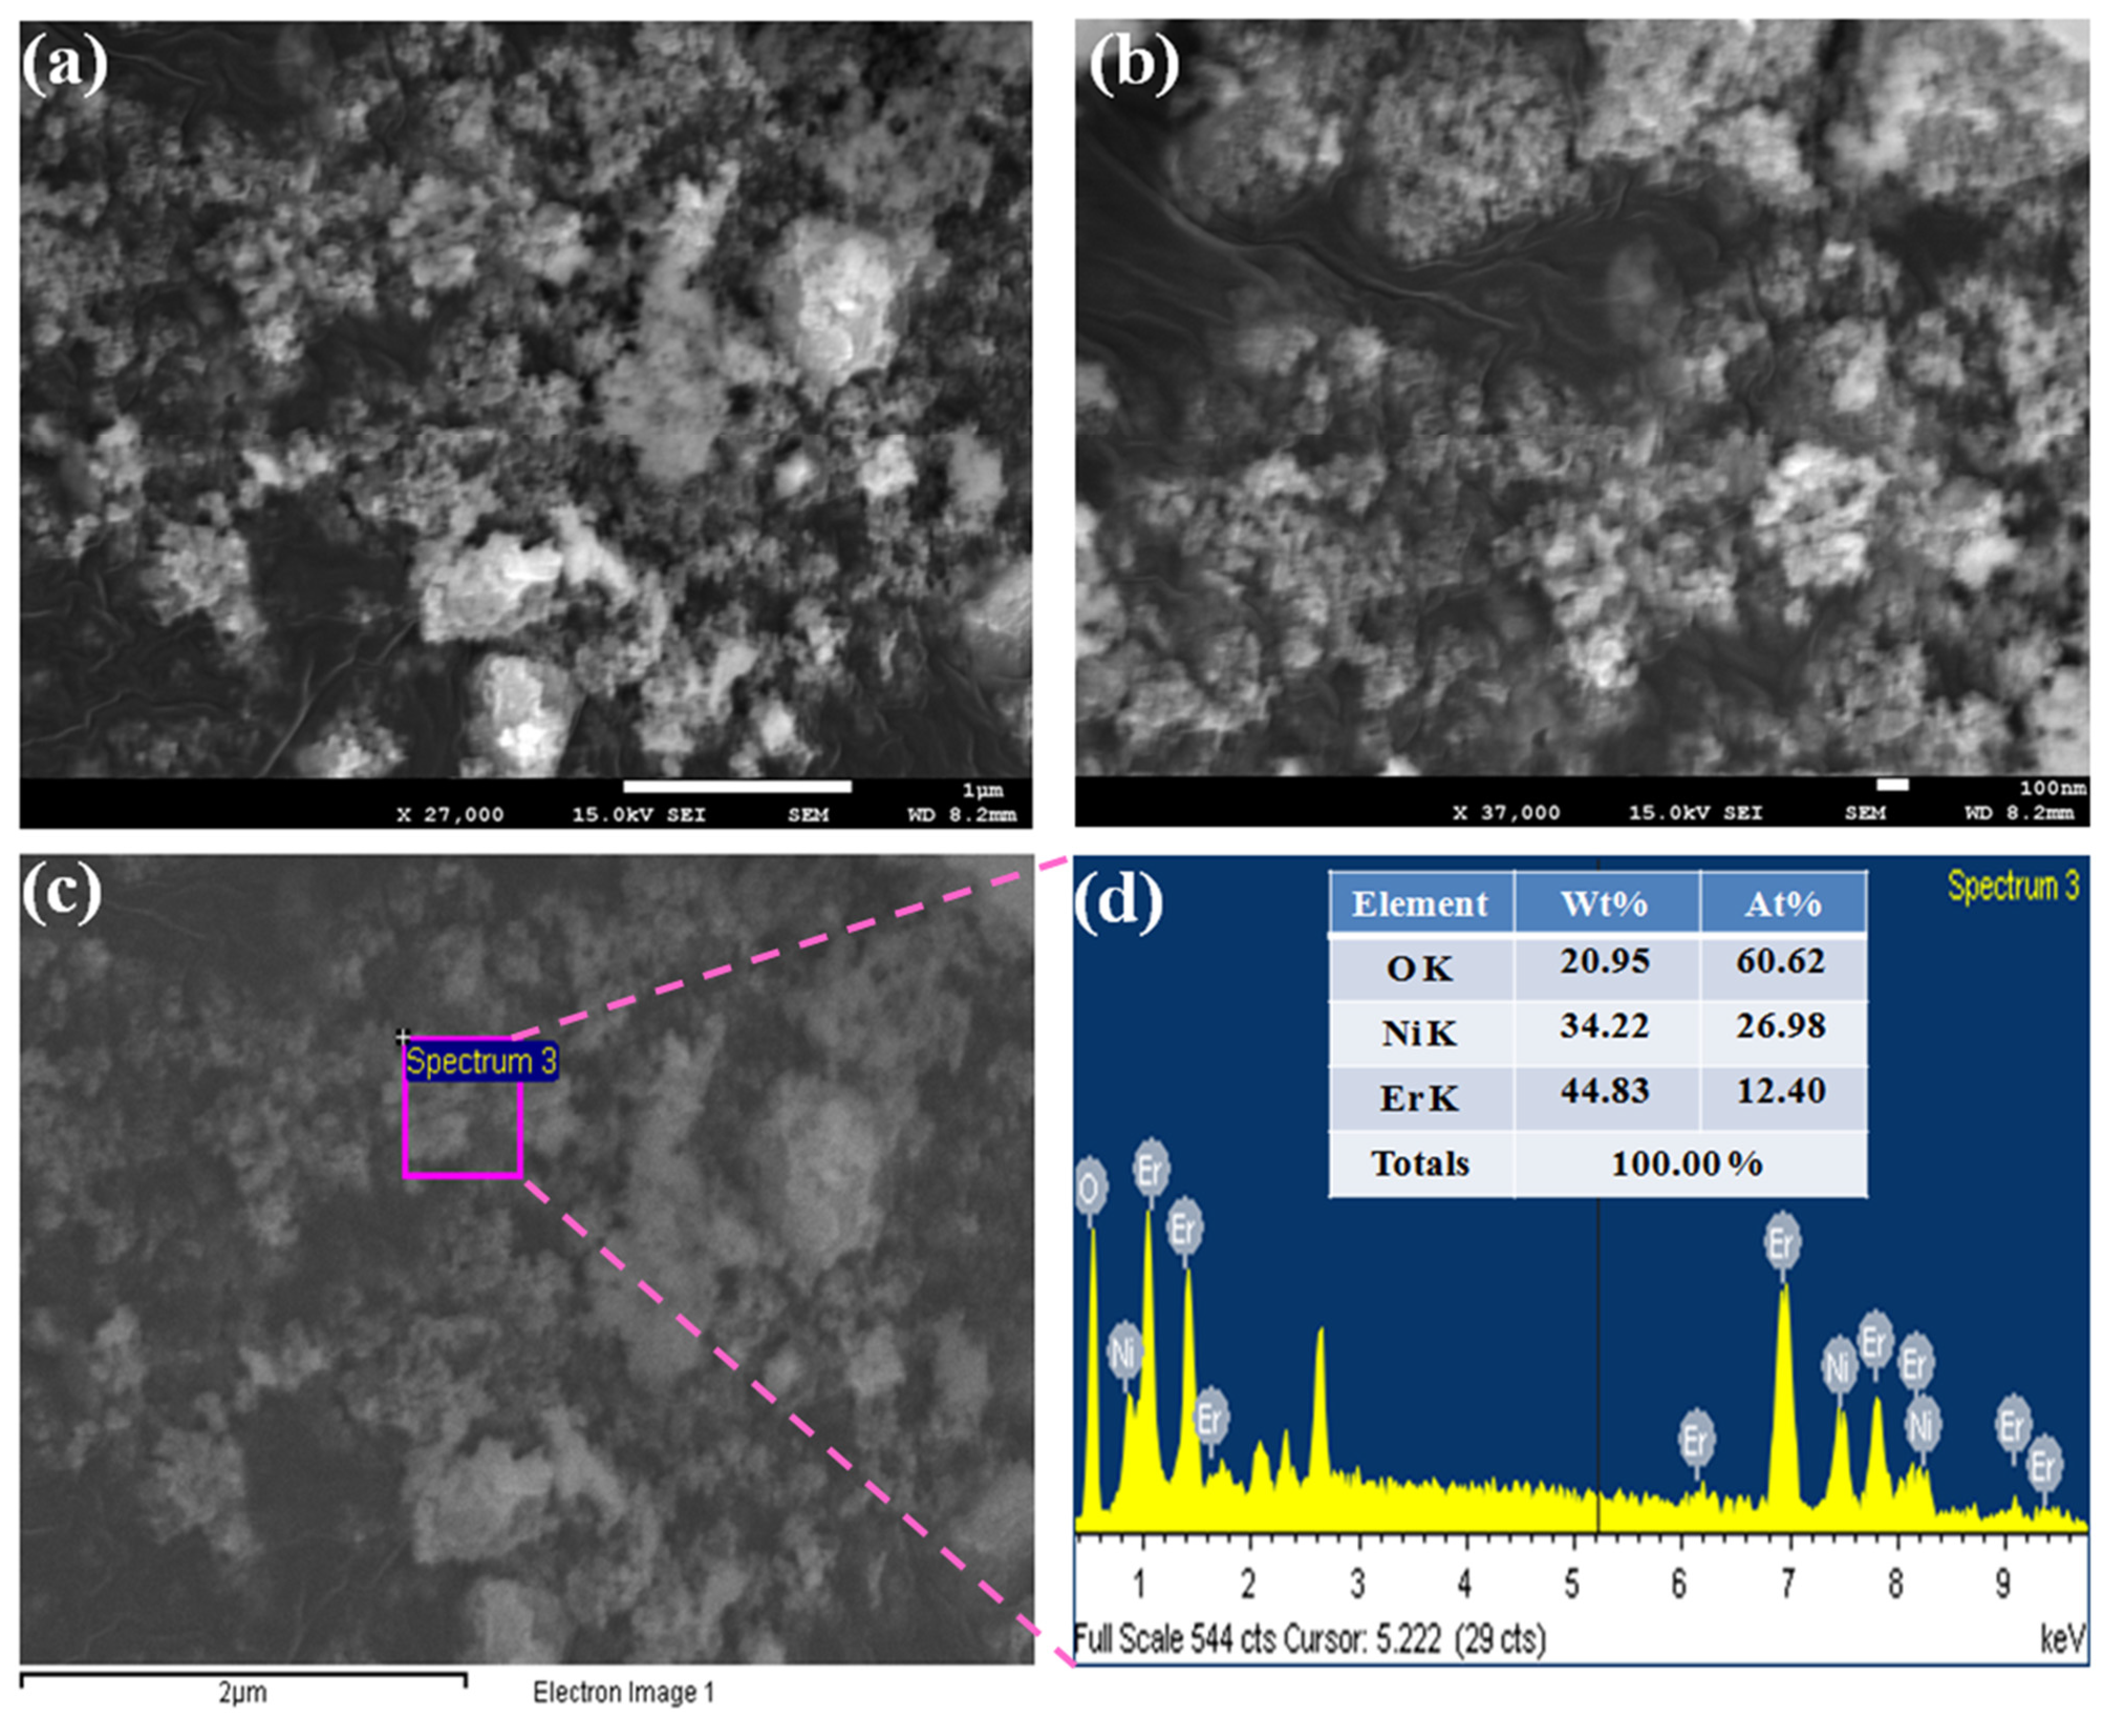
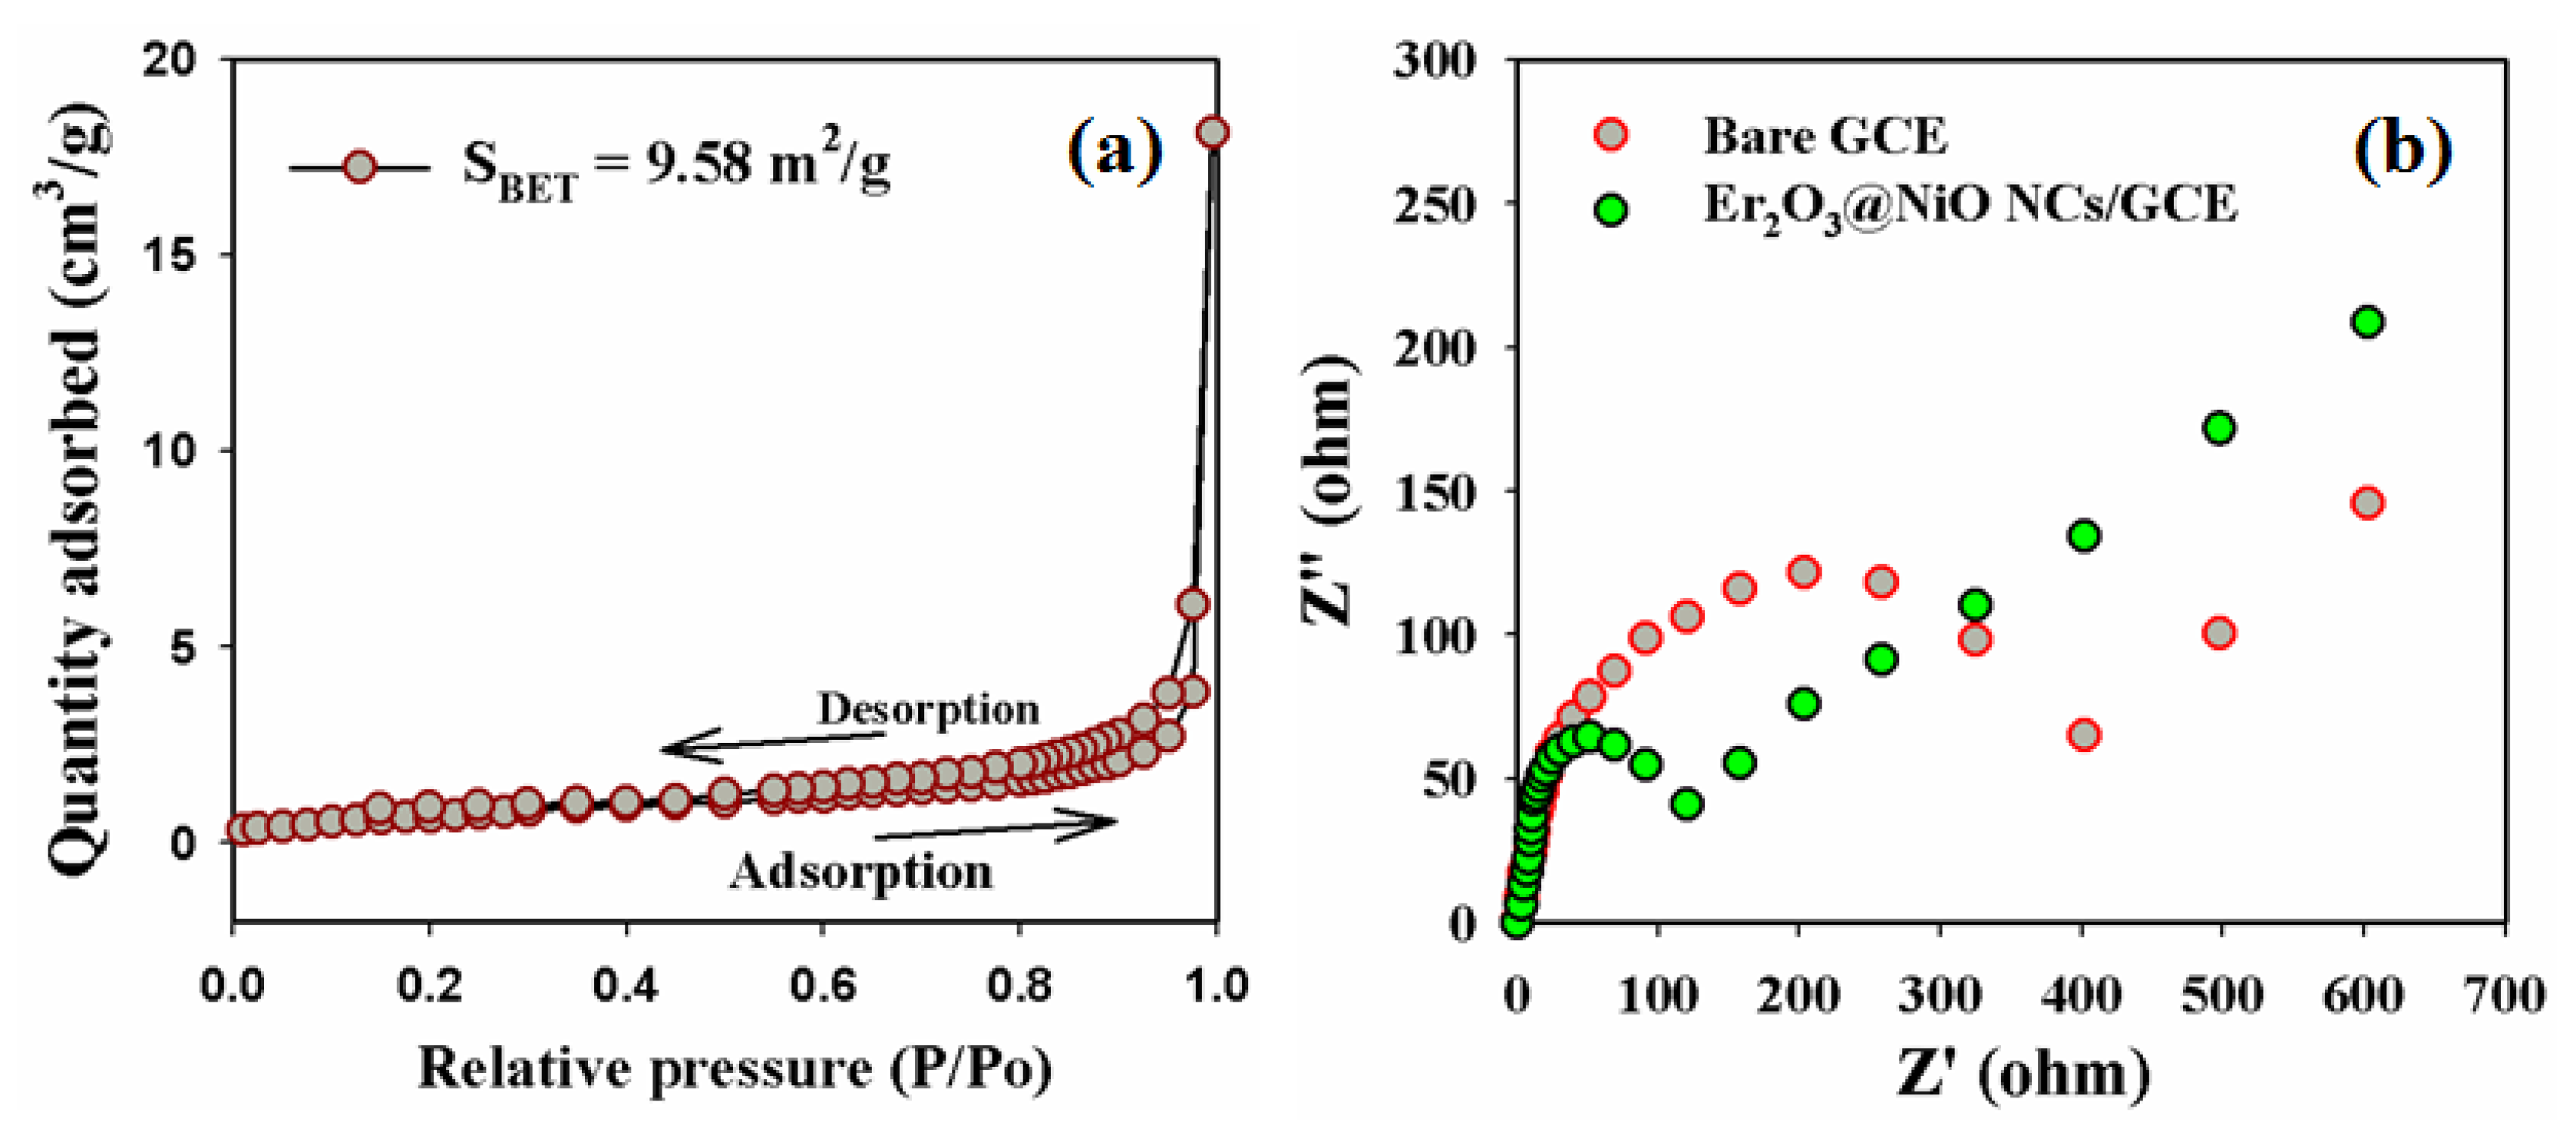
2.1. Optical and Structural Characterization of Er2O3@NiO NC

The newly synthesized non-reported binary metal oxide (Er2O3@NiO) semiconductor NC was subjected to UV/Vis, PL, FTIR, powder XRD, XPS, BET, EIS, and FESEM equipped with EDS analysis for the elucidation of its optical and structural characteristics.
The UV/Vis spectrum of our newly synthesized Er2O3@NiO NC was recorded in the range of 200 nm to 800 nm. From the UV/Vis absorption spectrum (Figure 1a), it was found that maximum absorption occurred at λmax = 291 nm. Similarly, band gap energy was also ascertained from a Tauc plot (direct band gap rule) and was found to be 2.58 eV, which indicates that our newly synthesized Er2O3@NiO NC falls in the domain of semiconductors [93]; Figure 1b. For intrinsic erbium oxide, two band gap values, one at 3.0 eV and the second at 3.5 eV, corresponding to an absorption edge position around 354 nm, have been reported in the literature [94]. These values indicate that intrinsic erbium oxide has a very poor semiconductor property as the band gap size for semiconductors is in the range of 2–3 eV. Moreover, variations in the positions of peaks are very common in nanocomposite materials, which vary from one derivative of nanocomposite to another. Herein, variation in maximum absorption from 354 nm to 291 nm is mainly considered due to the mixed energy levels of binary metal oxides (Er2O3@NiO) because nanocomposites are considered as mixtures of materials or different metal oxides. Thus, it is not possible for two derivatives to show peaks at the same position as slight or greater variations may exist. The shifting of the band gap value from 3.5 eV to 2.58 eV indicates that our newly synthesized Er2O3@NiO NC developed the semiconductor property because the band gap size for insulators is in the range of 3–4 eV. Similarly, the optical properties with respect to crystal defects, and transfer, migration, and recombination of photo-generated electron hole pairs, were also studied using PL spectroscopy and found to be in good concurrence with the results previously reported in the literature. The PL emission spectrum was recorded at the excitation wavelength of 200 nm, yielding three emission peaks at 357 nm, 466 nm, and 577 nm; Figure 1c. The UV emission peak at 357 nm is associated with intrinsic transmission of excitation from conduction to the valance band and related to transition of 3d8electrons of Ni2+ [95]. Similarly, the emission peak at 466 nm (blue region) is due to transition vacancies of oxygen and interstitial oxygen [12]. Moreover, the peak at the shoulder at 577 nm may have appeared because of bond-to-bond transition as well as oxygen-related defects due to the calcination temperature, i.e., 650 °C [95].
The functional and structural nature of the newly synthesized semiconductor NC were analyzed using FTIR spectroscopy and FTIR spectra were recorded in the range of 400 cm−1 to 4000 cm−1, before and after calcination at 650 °C; Figure 2a,b. After calcination, very sharp and prominent peaks and their displacement from their original positions indicate the formation of Er2O3@NiO NC. The broad absorption bands appearing in the range from 3360 to 3410 cm−1, 1640 cm−1, and 995 cm−1 are attributed to O-H stretching owing to moisture absorption on the surface of metal oxide NC [15,96,97]. Moreover, the absorption bands appearing in the finger print region lower than 1100 cm−1 or 1000 cm−1 correspond to the vibration modes of M-O or M-O-M. The stretching vibrations of Er-O appeared at 1440 cm−1 and 1125 cm−1 in addition to its bending vibrations at 625 cm−1 and 515 cm−1 [12,24]. The band at 460 cm−1belongs to the characteristic peak of Ni-O which confirms the assimilation of the binary metal oxide(Er2O3@NiO)semiconductor NC [98].
Because crystalline nature is a good indication of the metal oxygen framework, powder XRD analysis was carried out before and after calcination in the range of (2θ) of 10–80° to examine the crystallinity of the newly synthesized semiconductor NC; Figure 3. The strong and sharp diffraction peaks indexed as (222), (400), (440), (622), and (311) at 2θ values were assumed to be of Er2O3 and they were in good agreement with the values reported in the literature for erbium oxide [JCPDS file No. 77-0464 and 77-0777] [99,100]. Similarly, weak and broad diffraction peaks at (200) and (220) besides Er2O3occurred because of small-grain-size or disordered NiO and they were also in good agreement with the previously reported values for nickel oxide [JCPDF file No. 04-0835] [96,101,102]. Sharp peak intensities after calcination indicate that its crystallinity increased with heating at 650 °C for 6 h. Moreover, mixed diffraction plans for both metal oxides also affirm the formation of the newly synthesized semiconductor NC. The Scherrer equation was also used to calculate the average diameter of the crystalline nanomaterial as an individual particle,which was found to be 23.84 ± 2.0 nm.
D = 0.94   λ ( β c o s θ )
where λ = wavelength of X-ray radiation; β = full width at half maximum (FWHM) of the peaks at diffracting angle; and θ = Bragg angle.
The chemical composition and the electronic states of elements present in our newly synthesized semiconductor NC were confirmed by XPS analysis. The full spectrum of XPS analysis of Er2O3@NiO NC is shown in Figure 4a. The broad peak centered at 169.0 eV is attributed to the Er 4d spin orbit; Figure 4b [12,103]. In the same way, the peak at 531.5 eV is associated with the oxygen lattice, i.e., O 1s; Figure 4d [7,104]. Moreover, peaks of nickel appeared in the range of 850 eV to 880.0 eV; Figure 4c. The peaks at 856.0 eV and 861.2 eV are related to Ni 2p3/2 spin orbit levels. Meanwhile, peaks at 871.3 eV, 874.8 eV, and 879.0 eV are associated with Ni 2P½ spin orbit levels [105,106,107]. All these values were in good agreement with the values reported previously for Er 4d and Ni 2p spin orbitals in addition to O 1s. Sometimes, the strongest peaks around 500 and 1100 eV, as can also be observed in Figure 4a, arise because the sodium moiety as its hydroxide is used to maintain the alkaline pH in the wet chemical process during the hydrolysis of precursor ions (Er3+and Ni2+) in order to form their respective nanocomposites. Consequently, this analysis affirms the formation of Er2O3@NiO NC by the classical wet chemical method, which accommodates the two different species, Er2O3 and NiO, in its chemical composition.
FESEM-equipped EDS analysis was also carried out to examine the morphology of the newly synthesized semiconductor Er2O3@NiO NC in addition to its elemental ratio. FESEM images of newly synthesized Er2O3@NiO NC were recorded from low to high resolution; Figure 5a,b. Tiny aggregates of NC as a cumulative structure of our newly synthesized Er2O3@NiO NC can also be easily observed in the collected FESEM images. These tiny aggregates provide a large surface for the semiconductor NC in addition to its enhanced electron communication feature. Moreover, EDS analysis reflects that our newly synthesized NC accommodates the nickel (Ni), erbium (Er), and oxygen (O) at 20.95%, 34.22%, and 44.83% by weight, respectively; Figure 5c,d. It is concluded that information collected from FESEM-EDS analysis is in parallel agreement with the results of XPS analysis. Accordingly, no other peak related to any impurity was observed by EDS, thus confirming that our newly synthesized NC is composed only of Er, Ni, and O.
In this approach, to measure the active surface area of Er2O3@NiO NC, the BET (Brunauer–Emmett–Teller) theory analysis was also undertaken, as presented in Figure 6a. Here, the characteristics of the prepared NC are clarified through a nitrogen adsorption/desorption isotherm, known as BET analysis. Generally, a plot of relative pressure versus the adsorption of nitrogen gas was drawn to calculate the relative surface area of the prepared Er2O3@NiO NC material, which was found to be 9.58 m2/g. Therefore, the morphological and textural studies of the Er2O3@NiO NC showed values favorable to electro-catalytic performance in the chemical sensor application. Additionally, the EIS (electrochemical impedance spectroscopy) test was carried out for further clarification of the electrochemical characterization of bare GCE and Er2O3@NiO NC modified GCE. Faster electron mobility on the Er2O3@NiO NC modified GCE is expected if the fabrication of Er2O3@NiO0-NC/GCE is successful. In EIS, the diameter of the semicircle denotes the charge-transfer resistance (RCT) at the surface of the modified electrode. As presented in Figure 6b, the bare GCE electrode showed the higher resistance (406 Ω) as compared to the fabricated Er2O3@NiO-NC/GCE electrode (112 Ω) in a solution containing 0.1 mM ferricyanide (in 0.1 M KCl). This shows that Er2O3@NiO-NC/GCE has significantly enhanced the charge-transfer ability of the modified sensor surface, by three-fold. This is also an indication that the conductivity of the GCE has greatly increased due to the enhancement of the electron transfer properties of the fabricated Er2O3@NiO NC on the GCE, and that the GCE is fit for electrochemical sensing as an application.

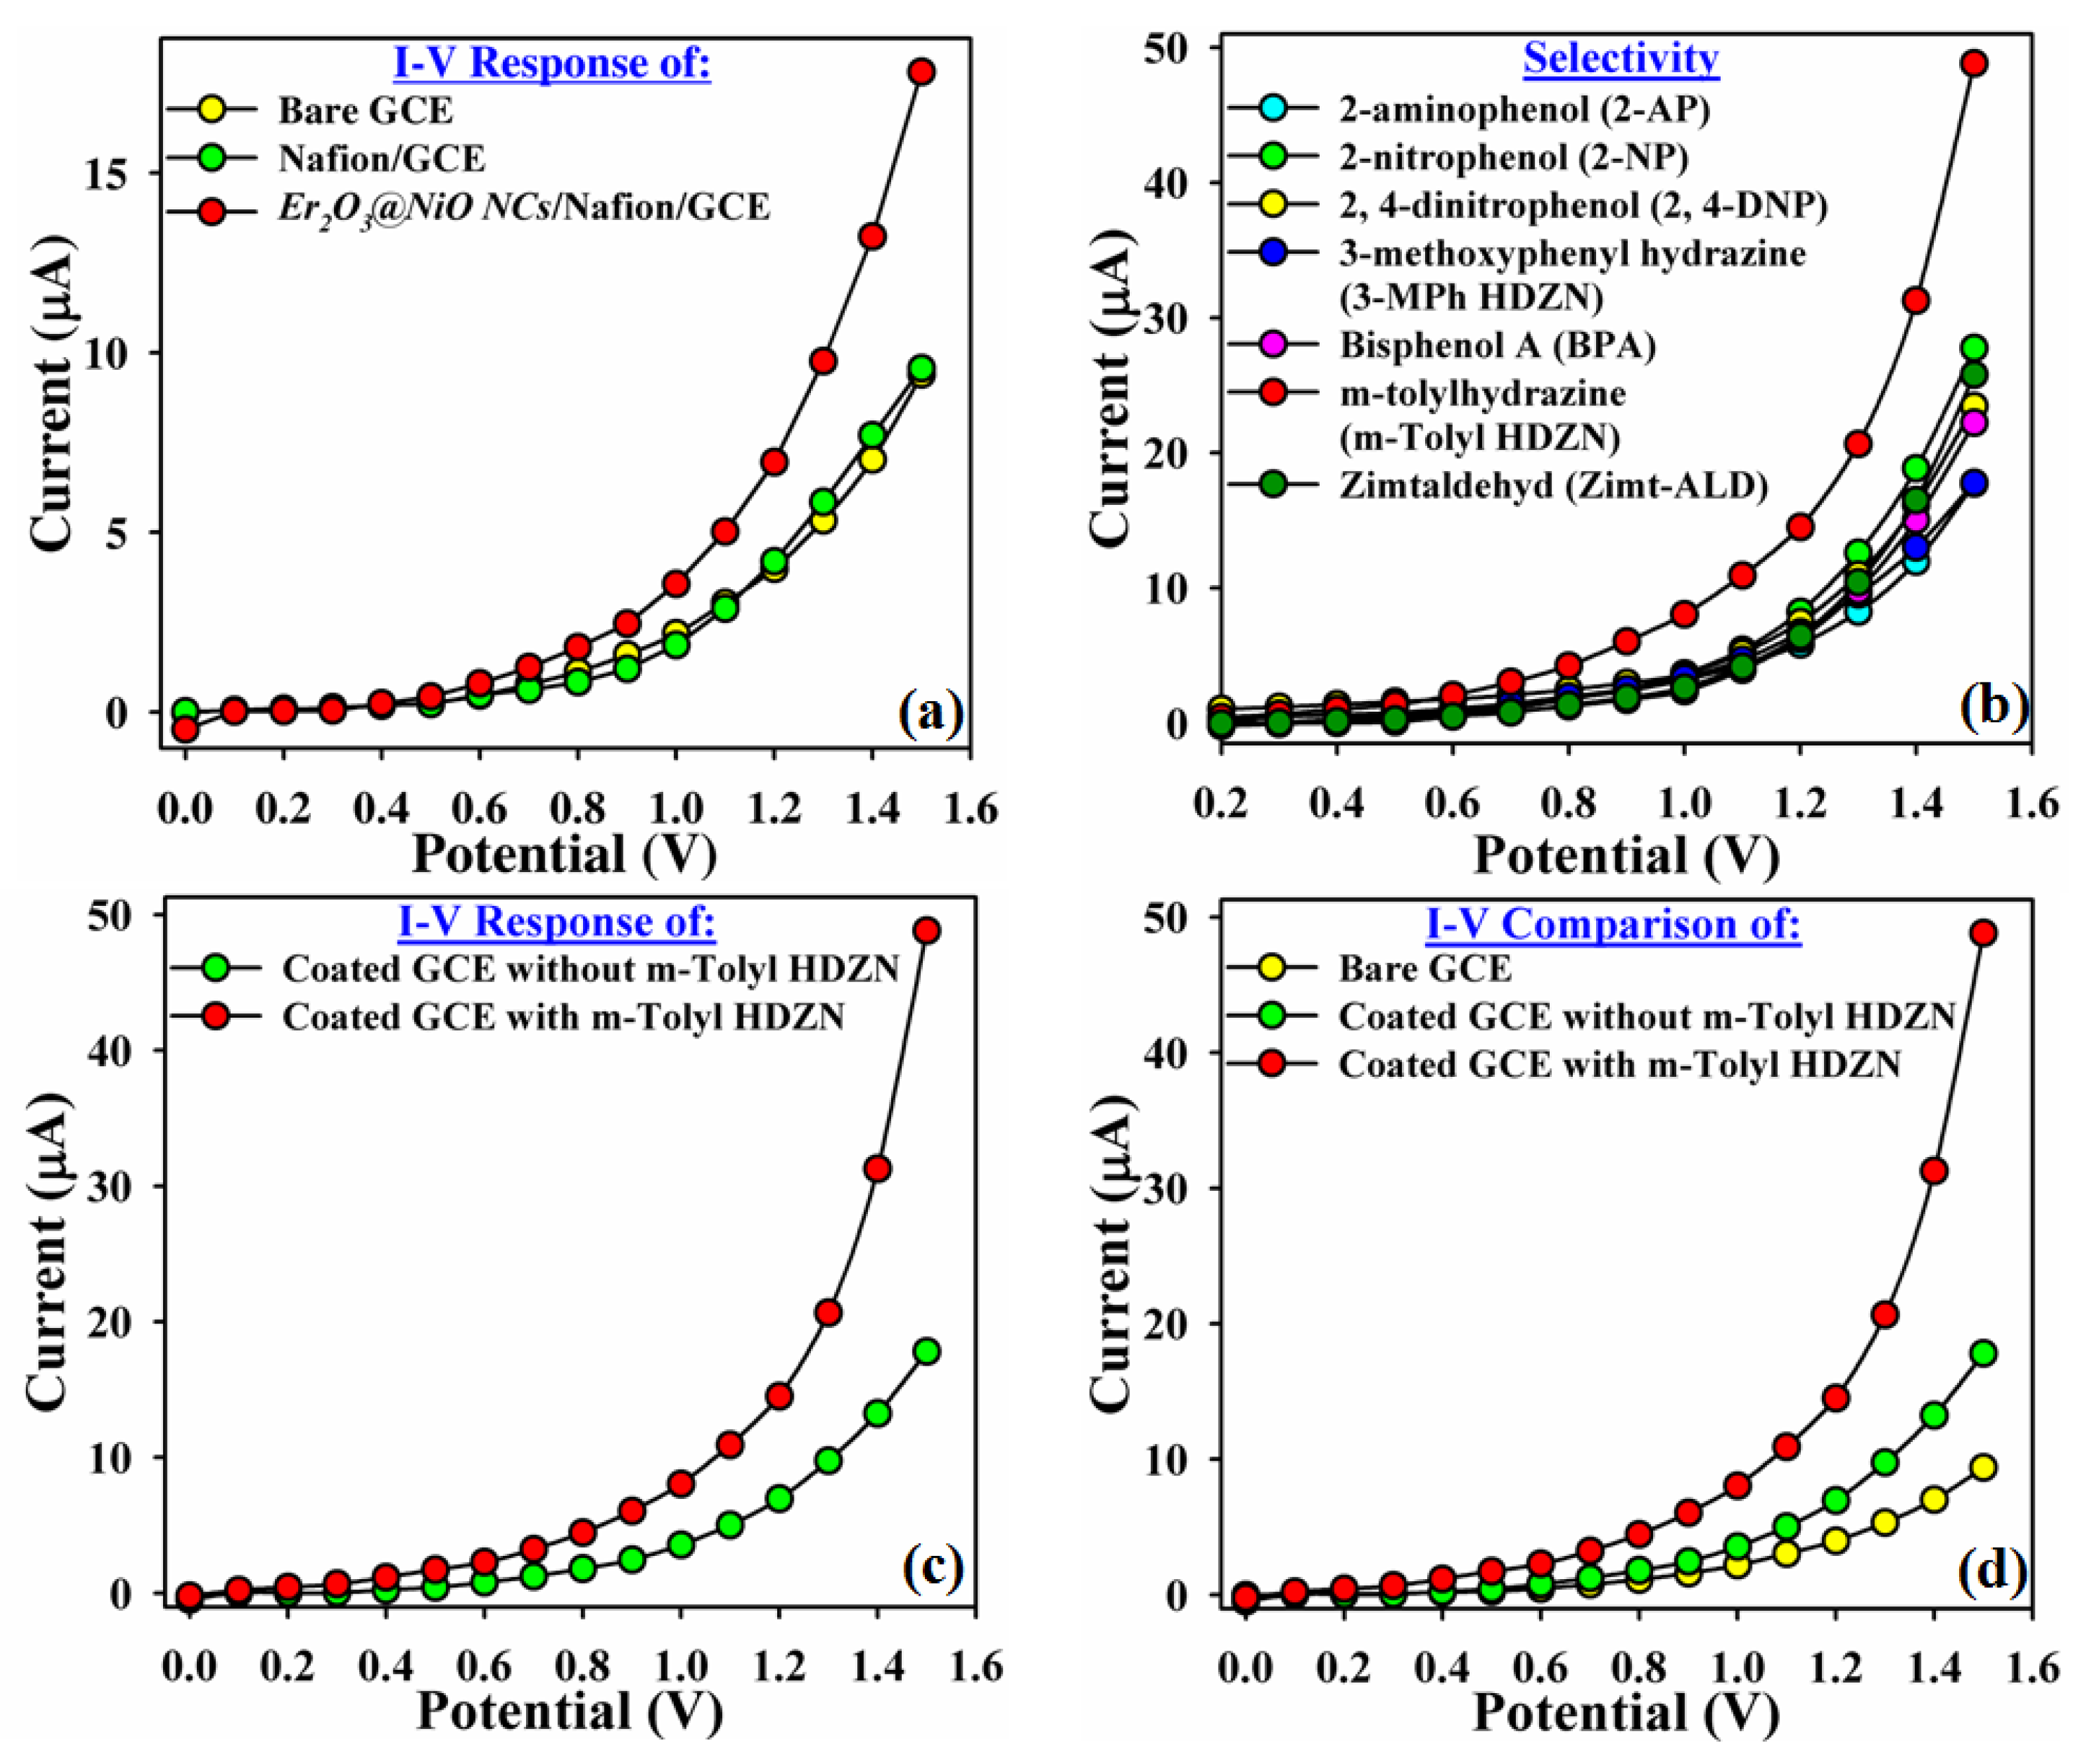
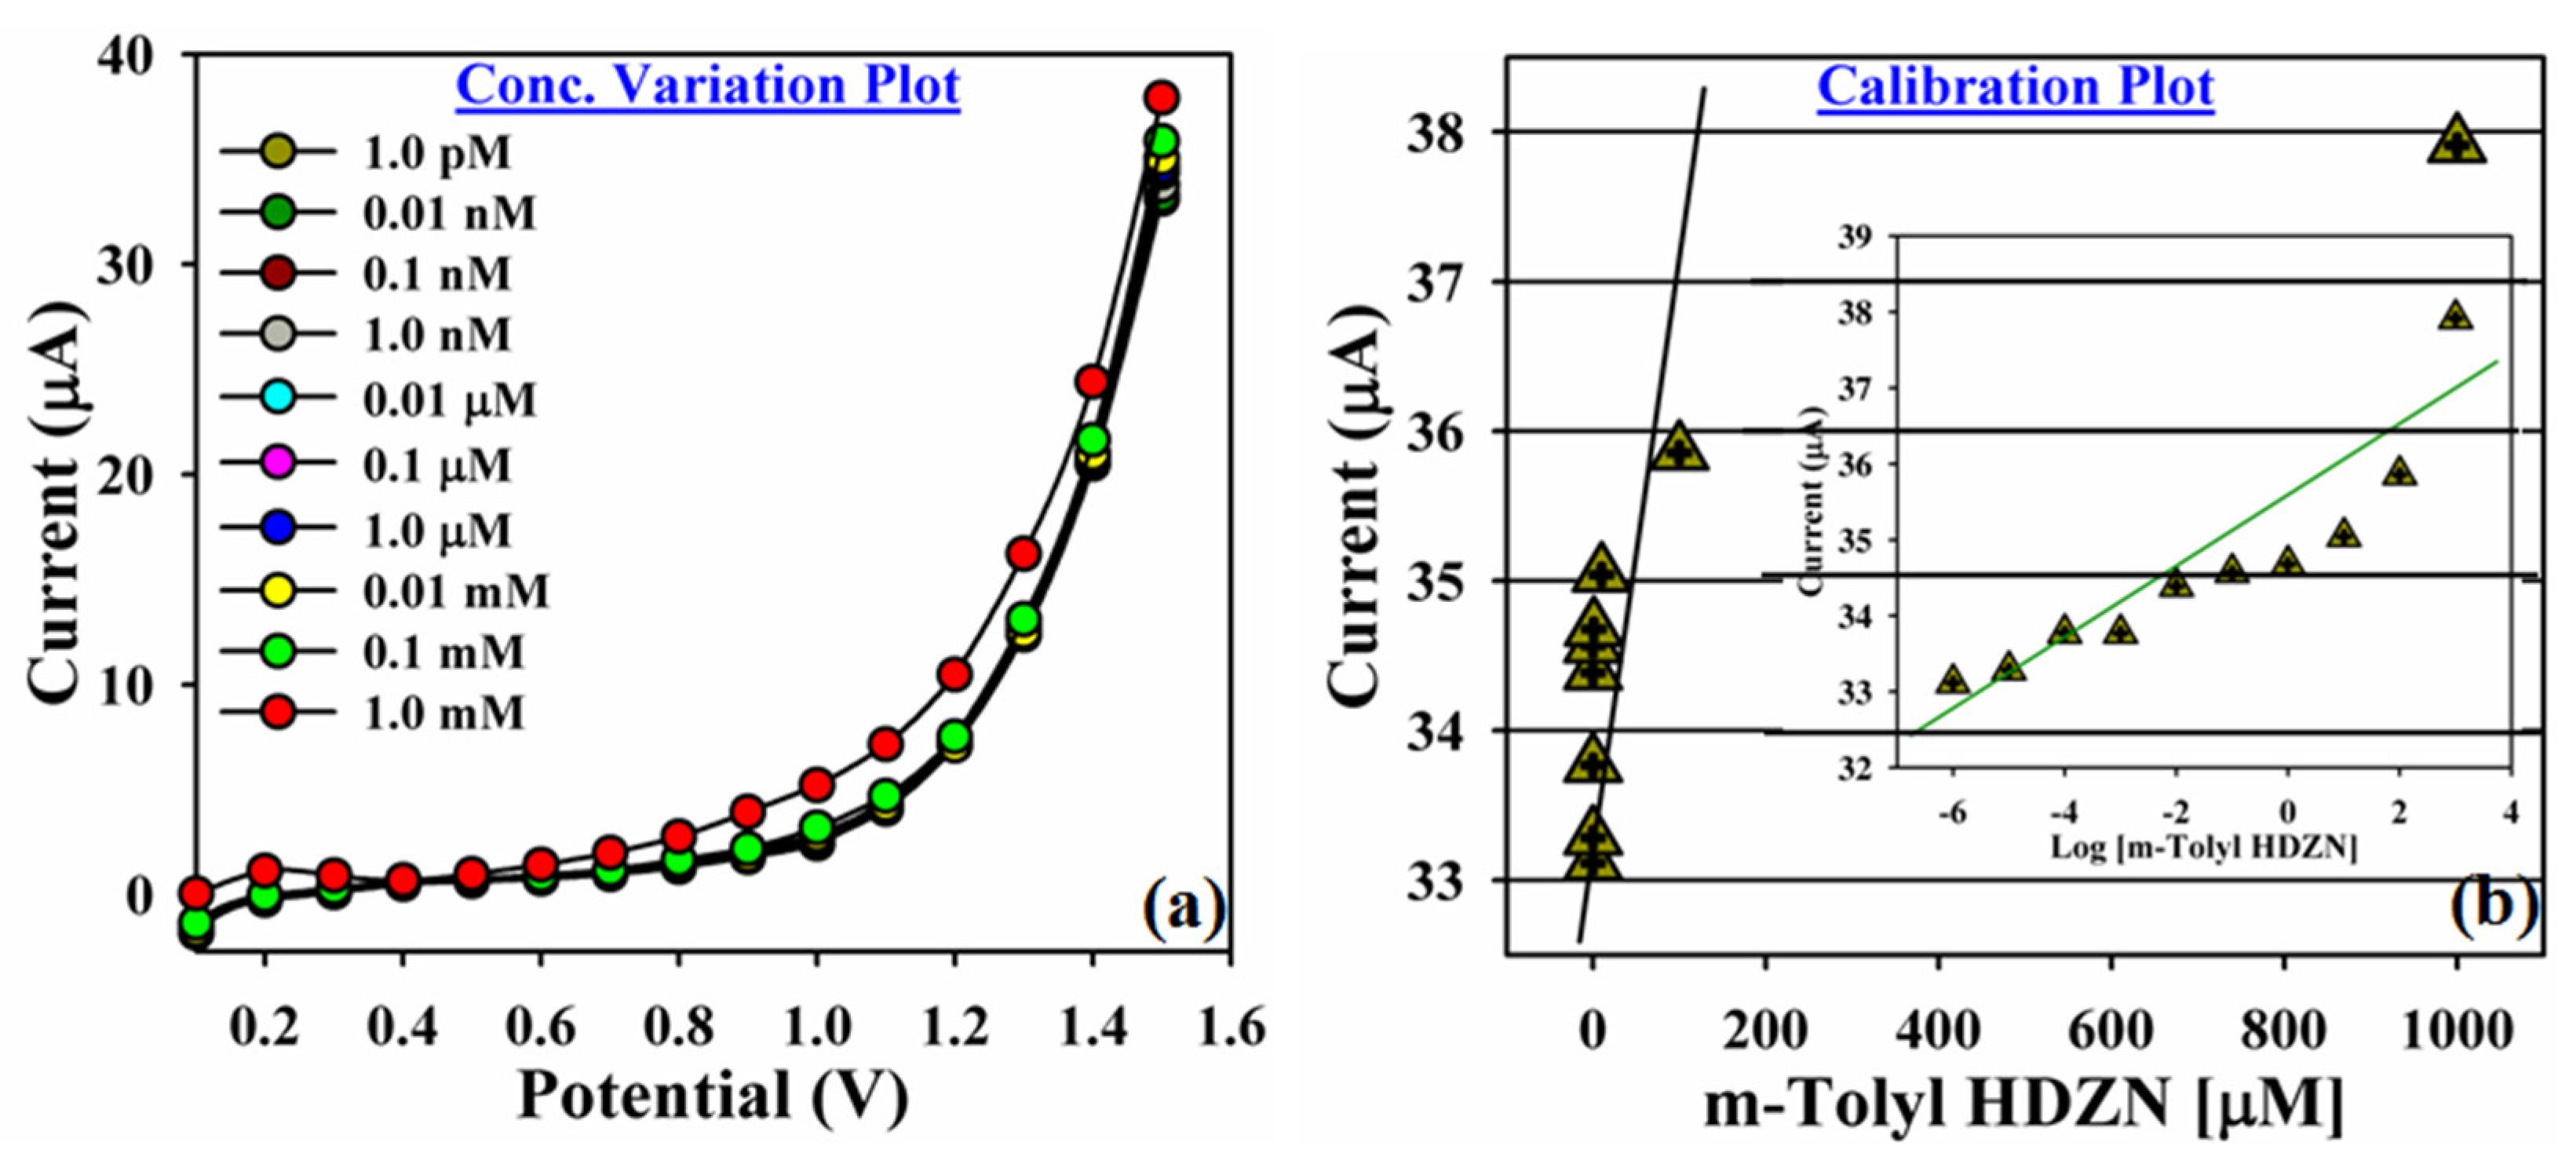
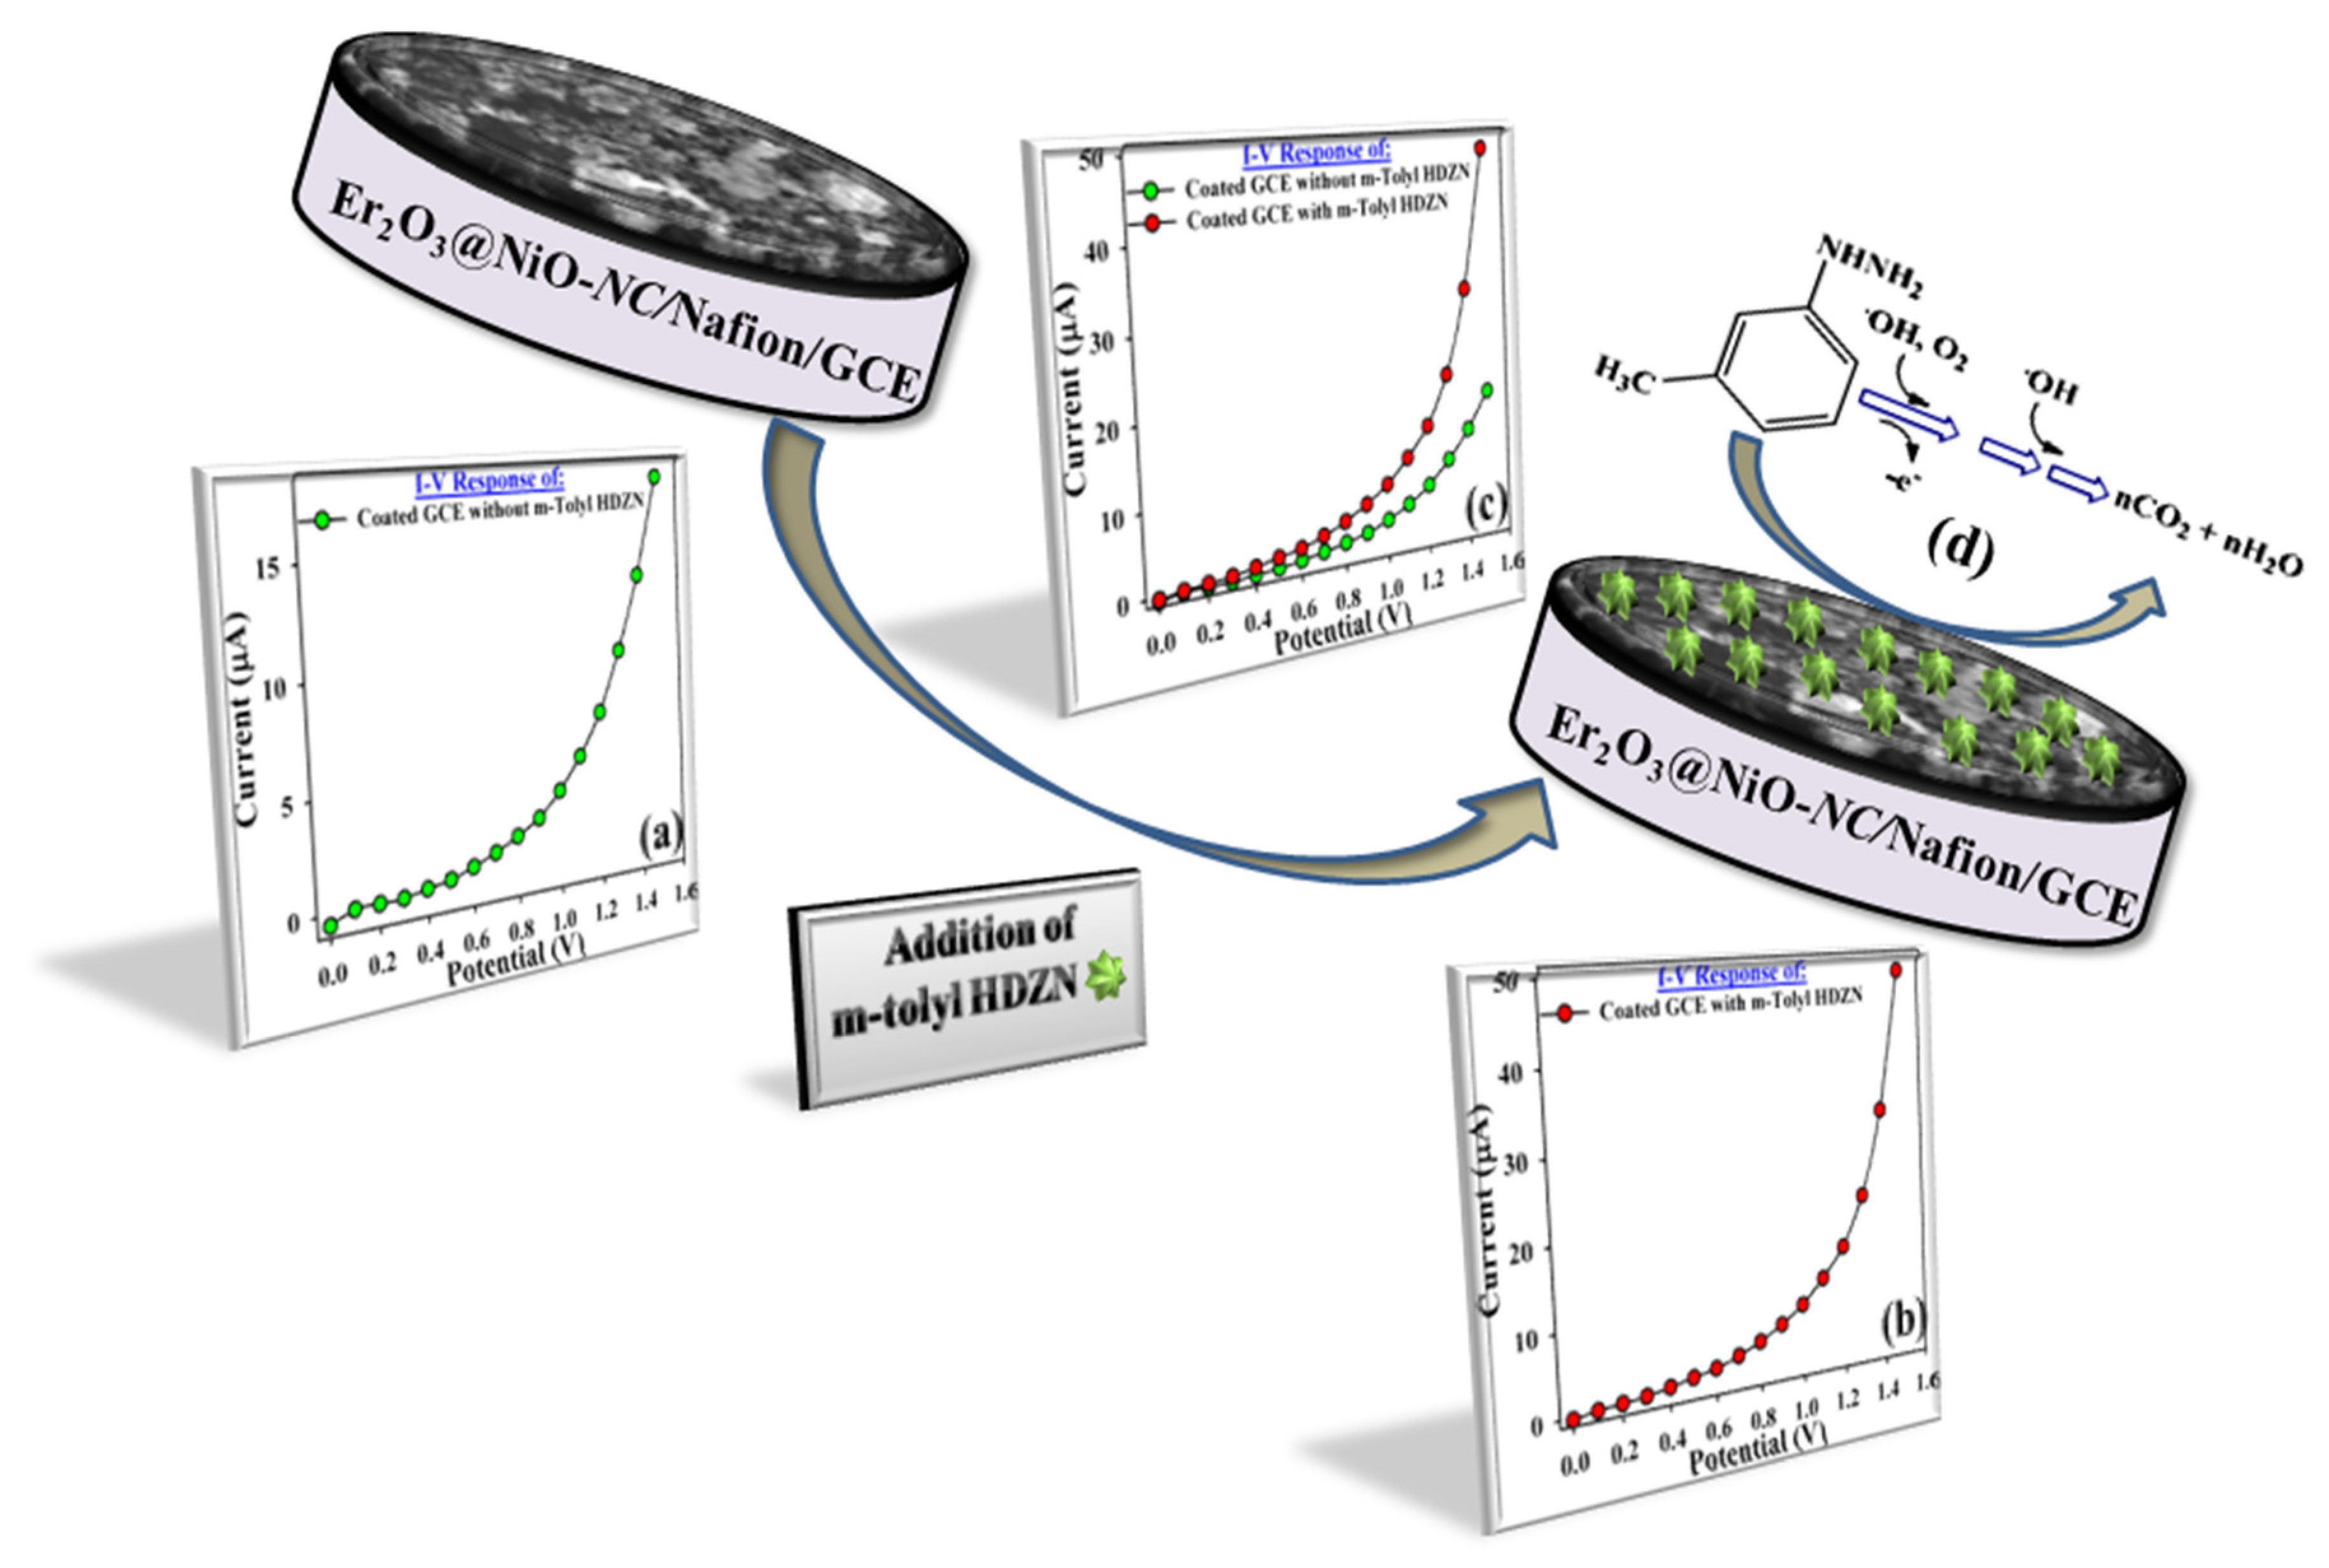
2.2. Applications: m-Tolylhydrazine Detection Using an I–V Approach

Herein, the main aim of the newly synthesized non-reported Er2O3@NiO NC was the detection, qualitatively and quantitatively, and the electrocatalytic degradation, of harmful chemicals in an aqueous system through an I–V approach via a Keithley electrometer. For this purpose, an Er2O3@NiO NC modified GCE was employed as selective electrochemical sensor in an I–V approach. The fabrication of the modified GCE, Er2O3@NiO-NC/Nafion/GCE, is discussed in detail in the Section 3. In any electrochemical approaches, electrode fabrication/preparation is a crucial step that can appreciably impact the reliability and reproducibility of the results. So, at this stage it is also very important to discuss the reproducibility of electrode preparation in order to ensure that results of the study are reliable and can be replicated by other researchers in the same or different laboratories. The same, very simple protocol is always adopted for the preparation of the different electrodes by keeping all conditions the same, as discussed in the Section 3. It was previously noted that the results for our target analyte, m-Tolyl HDZN, were positive in terms of the I–V comparison of the bare and coated GCE in the presence of m-Tolyl HDZN, the interference study, and repeatability and reproducibility testing, in addition to the control experiment.
Therefore, in order to gauge the sensitivity of the newly fabricated Er2O3@NiO-NC/Nafion/GCE, the current response of bare, Nafion-coated, and coated GCEs against the applied potential (0.0 V–+1.5 V) was initially measured in 0.1 M PBS of pH = 7. It was observed that the current responsiveness of the GCE coated with the newly synthesized NC increased significantly due to the enhanced electron communication feature between active sites of the Er2O3@NiO NC and the surface of the GCE; Figure 7a. Then, a selectivity study was conducted of various toxic chemicals, namely, 2-AP, 2-NP, 2,4-DNP, 3-Mph HDZN, BPA, m-Tolyl HDZN, and Zimt-ALD, in an aqueous system for the development of an efficient and selective electrochemical sensor. In spite of being exposed to various toxic chemicals in an aqueous system, the newly fabricated Er2O3@NiO-NC/Nafion/GCE was observed to be extremely sensitive and selective against m-Tolyl HDZN (m-Tolylhydrazine). From Figure 7b, it can be easily observed that the newly fabricated Er2O3@NiO-NC/Nafion/GCE shows a high current against m-Tolyl HDZN in the presence of other toxic chemicals. The concentration of 25.0 µL of each toxic chemical was taken as 0.1 µM in this study. Thus, we can say that the usage of the newly synthesized NC in the form of a sensor offers a number of characteristic features, such as ease of assembly and usage, good current response, large surface area, non-toxicity, air stability, and biosafety, in addition to selectivity with electro-catalytic behavior.
In order to further confirm the sensitivity of the newly fabricated Er2O3@NiO-NC/Nafion/GCE against m-Tolyl HDZN, the current response with and without m-Tolyl HDZN was observed. A positive current response in response to the applied potential was noticed before and after the injection of 25.0 µL of 0.1 µM m-Tolyl HDZN in 5.0 mL PBS of pH = 7.0; Figure 7c. Moreover, for our convenience and in order to understand the sensitivity of the newly fabricated Er2O3@NiO-NC/Nafion/GCE towards m-Tolyl HDZN, an overall I–V comparison of bare and NC-coated GCEs with and without m-Tolyl HDZN is also shown in Figure 7d; this comparison was positive. Similarly, we can also say that our newly synthesized NC exhibits excellent adsorption and absorption properties on its large, porous surface area.
A statistical approach was also used in order to check the affinity of our newly fabricated Er2O3@NiO-NC/Nafion/GCE for m-Tolyl HDZN at +1.5 V in addition to the interference impact of toxic chemicals (2-AP, 2-NP, 2,4-DNP, 3-Mph HDZN, BPA, and Zimt-ALD) in PBS of pH = 7.0. In this investigation, the concentration of each interfering toxic chemical was also taken as 0.1 µM and the volume was taken as 25.0 µL. In this investigation, the current response of Er2O3@NiO-NC/Nafion/GCE to m-Tolyl HDZN was deemed to be 100% and did not show any remarkable change in the presence of other toxic chemicals; Figure 8 and Table 1. From this study, it was concluded that our newly fabricated Er2O3@NiO-NC/Nafion/GCE is only selective, reliable, and sensitive to m-Tolyl HDZN in the presence of other interfering toxic chemicals.

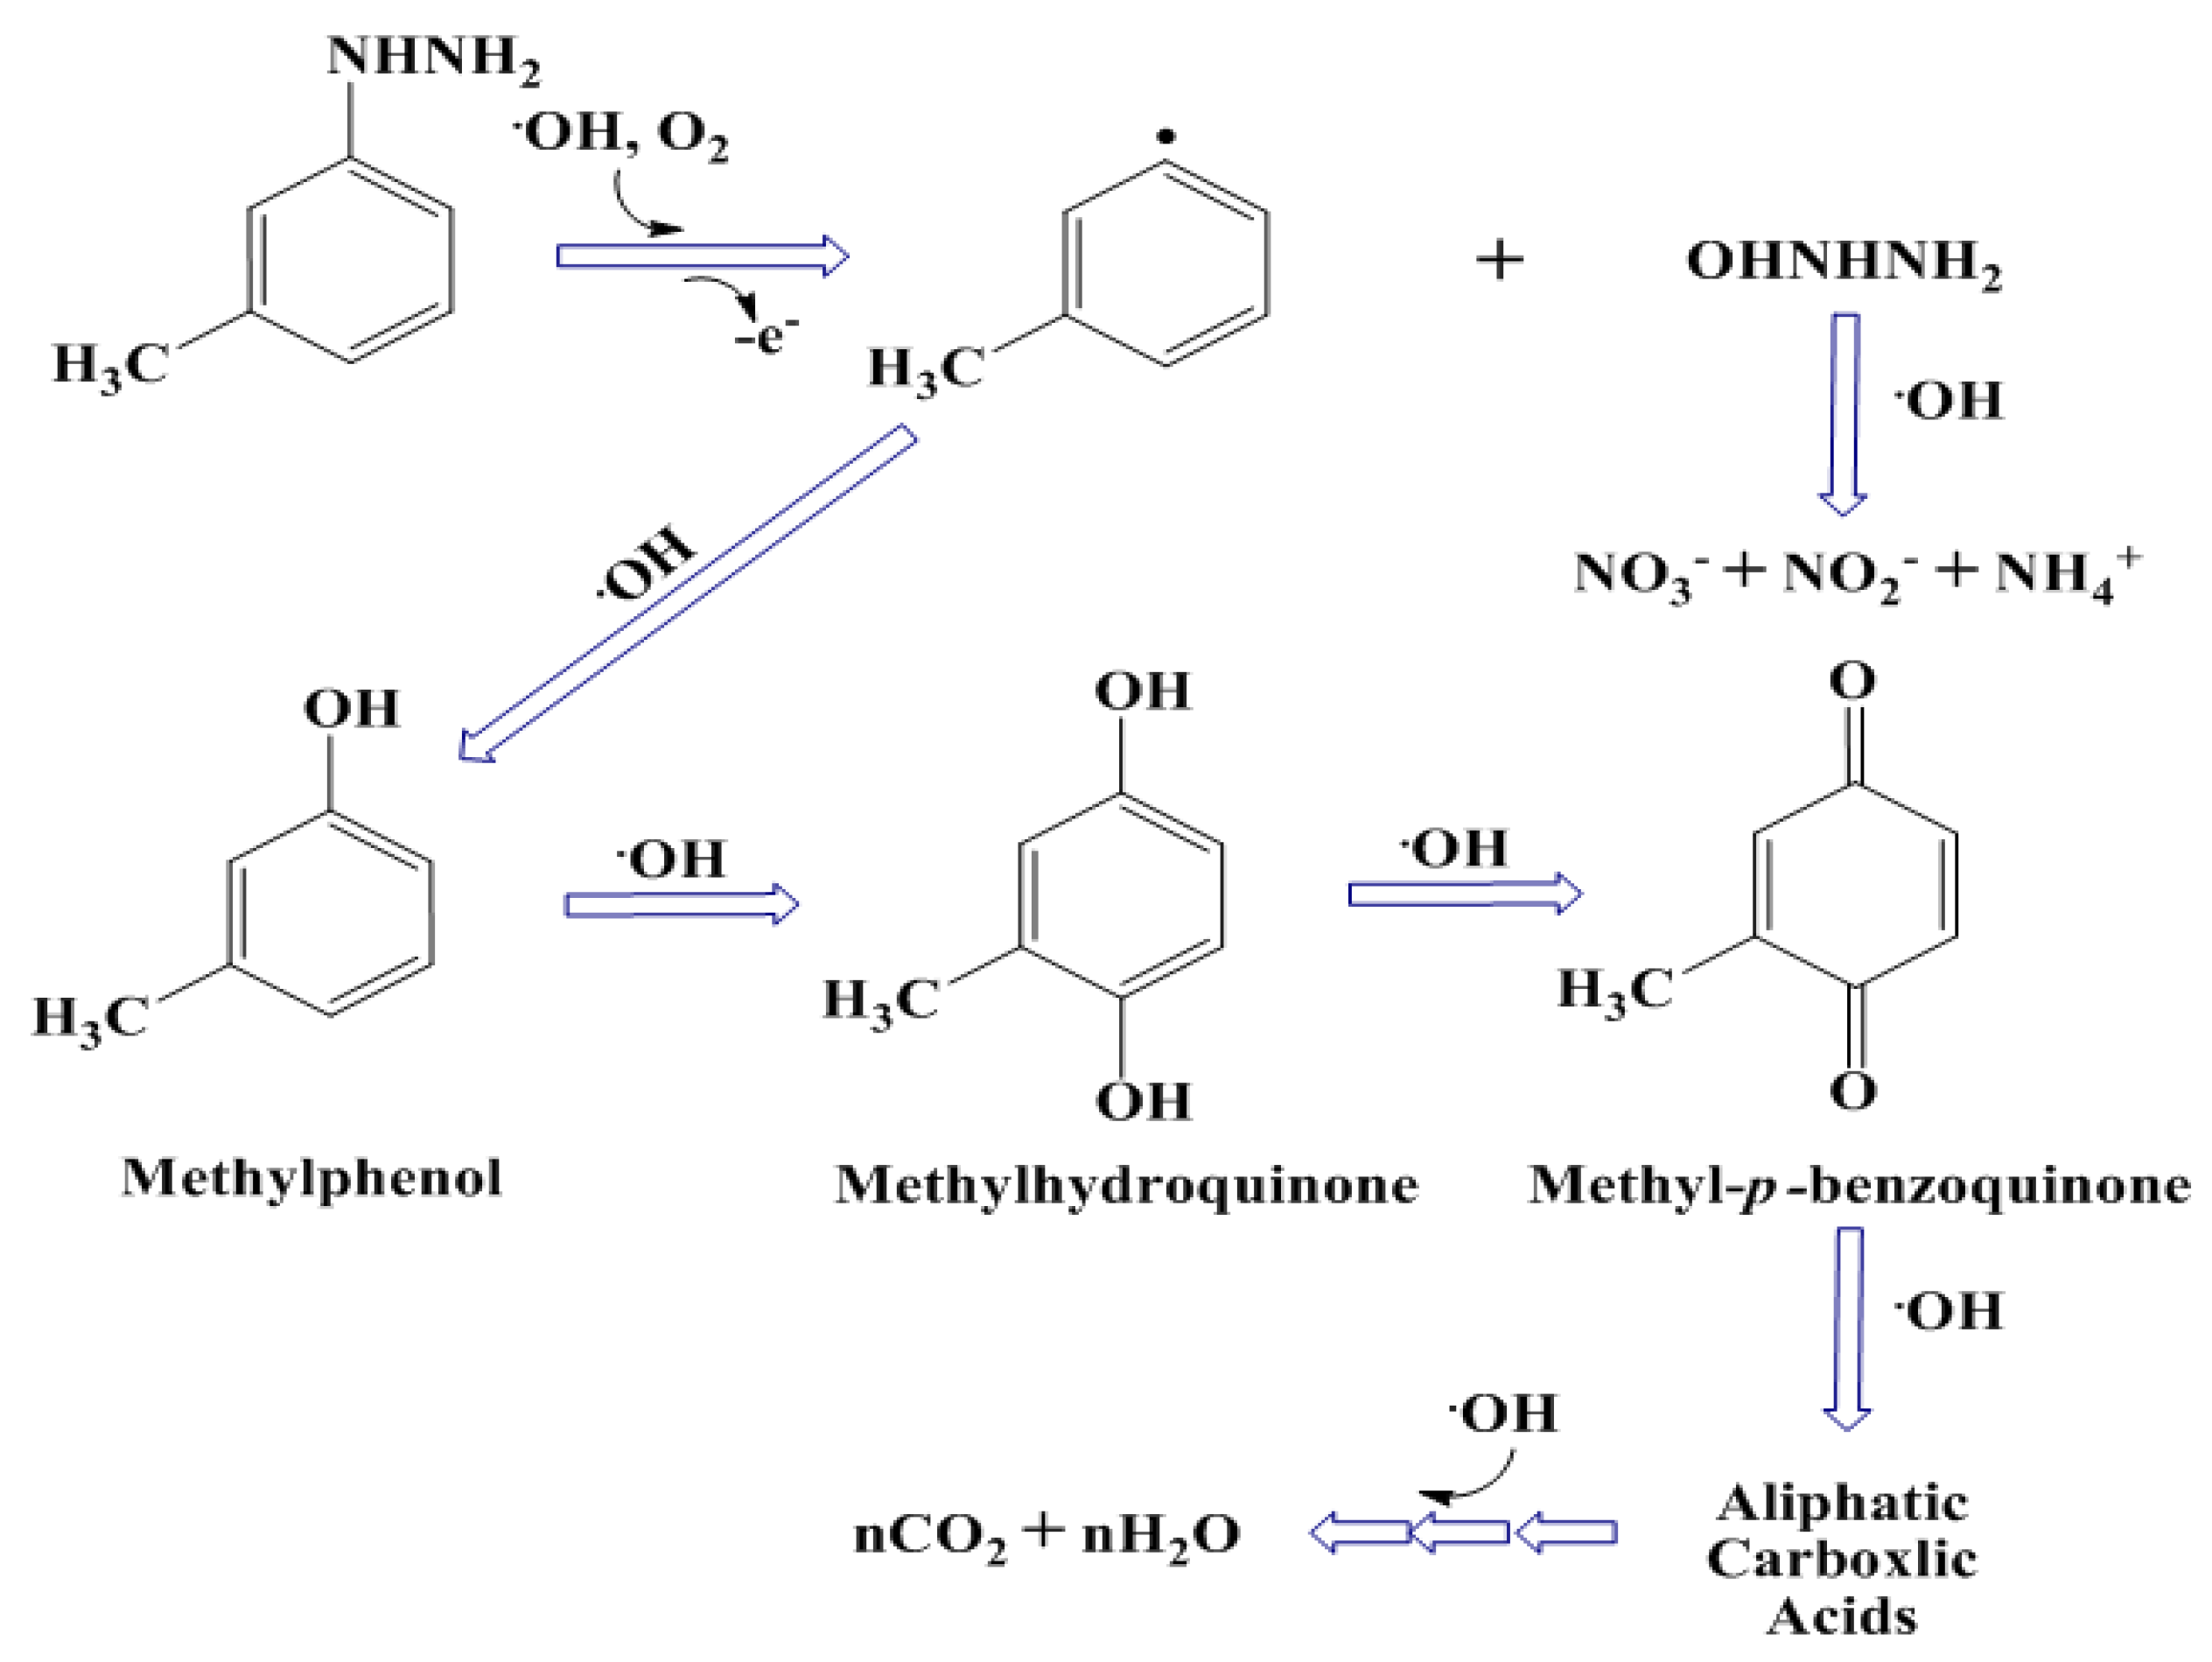
2.3. Electrocatalytic Degradation of m-Tolyl HDZN

The proposed mechanism for trace detection as well as electrocatalytic degradation of m-Tolyl HDZN by the newly designed Er2O3@NiO-NC/Nafion/GCE as a selective m-Tolyl HDZN sensor is shown in Scheme 1 with I–V graphical representation. The sensitivity in terms of the current response of the Er2O3@NiO-NC/Nafion/GCE, in the absence and presence of our target analyte, is shown in Scheme 1a,b, respectively, with their comparisons shown in Scheme 1c.
It is assumed that oxidation/reduction of the newly synthesized non-reported binary metal oxide (Er2O3@NiO)semiconductor NC deposited onto the flat surface of the GCE is responsible for the detection and the electrocatalytic degradation of m-Tolyl HDZN, even in trace amounts. When the Er2O3@NiO NC modified GCE was plunged into PBS of pH = 7.0, the semiconductor Er2O3@NiO NC chemisorbed the dissolved oxygen (O2) present in the solution onto its porous surface. As a consequence, ionic species such as (O2) and (O) were created by acquiring electrons from their conduction bands [108,109,110]. As a result, the coated GCE’s I–V response rose.
e (Er2O3@NiO NC/GCE) + O2→ O2−
e(Er2O3@NiO NC/GCE)+O2→ 2O
Owing to the presence of surface-adsorbed water, the above-mentioned reactions do not stop here, but persist, and result in the production of excessive free hydroxyl radicals in the system [111]. The overall reaction is as follows:
e + O2→ O2 + e→ 2O + H2O → H2O2→•OH
These free hydroxyl radicals, which are present in excess in our system, attack m-Tolyl HDZN and cause the cleavage of the carbon-nitrogen bond with the release of electrons, thereby enhancing the current response. This attack leads to the formation of m-Tolylphenyl radicals and organic nitrogen containing the hydrazine moiety. The former moiety is transferred into NO3, NO2, and NH4+ ions by further attack of the free hydroxyl radicals in the system. Moreover, m-Tolyl phenyl radicals are also converted into methyl phenol followed by methylhydroquinone with the release of free electrons in the conduction band. This results in the further increment in the current response during the I–V measurement of the Er2O3@NiO-NC/Nafion/GCE in the presence of m-Tolyl HDZN under normal conditions, as shown in Scheme 1a–c. Similarly, methylhydroquinone is further oxidized into methyl-p-benzoquinon by the action of free hydroxyl radicals. This chain of attack of free hydroxyl radicals does not stop here but yields aliphatic carboxylic acids followed by carbon dioxide and water as end products in our system; Scheme 1d and Scheme 2. These kinds of mechanism have been cited in the literature for degradation of hydrazine and phenolic compounds by advanced oxidation processes (AOPs) [112,113,114].
In order to ensure the electrocatalytic degradation of m-Tolyl HDZN, the chemical oxygen demand (COD) test before and after the I–V response was also conducted in the laboratory. Using this investigation, we analyzed the presence of m-Tolyl HDZN in the context of the total amount of required oxygen for the oxidation of m-Tolyl HDZN to carbon dioxide and water. The COD of m-Tolyl HDZN before and after the I–V response was evaluated. The initial COD before the I–V response was found to be 1291.0 mgL−1 and decreased to 467.0 mgL−1(average of three) after the I–V response under normal conditions. On the porous surface of the newly designed semiconductor nanocomposite, the afore-mentioned reactions took place in bulk. The oxygen that was adsorbed on the porous surface of the Er2O3@NiO NC coated on the GCE makes the Er2O3@NiO-NC/Nafion/GCE sensitive to m-Tolyl HDZN and electro-catalytically degrades it by AOPs. The oxidizing capacity of the newly synthesized NC, as well as the rate of m-Tolylhydrazine’s oxidation, is increased with the increase in the amount of oxygen adsorbed.

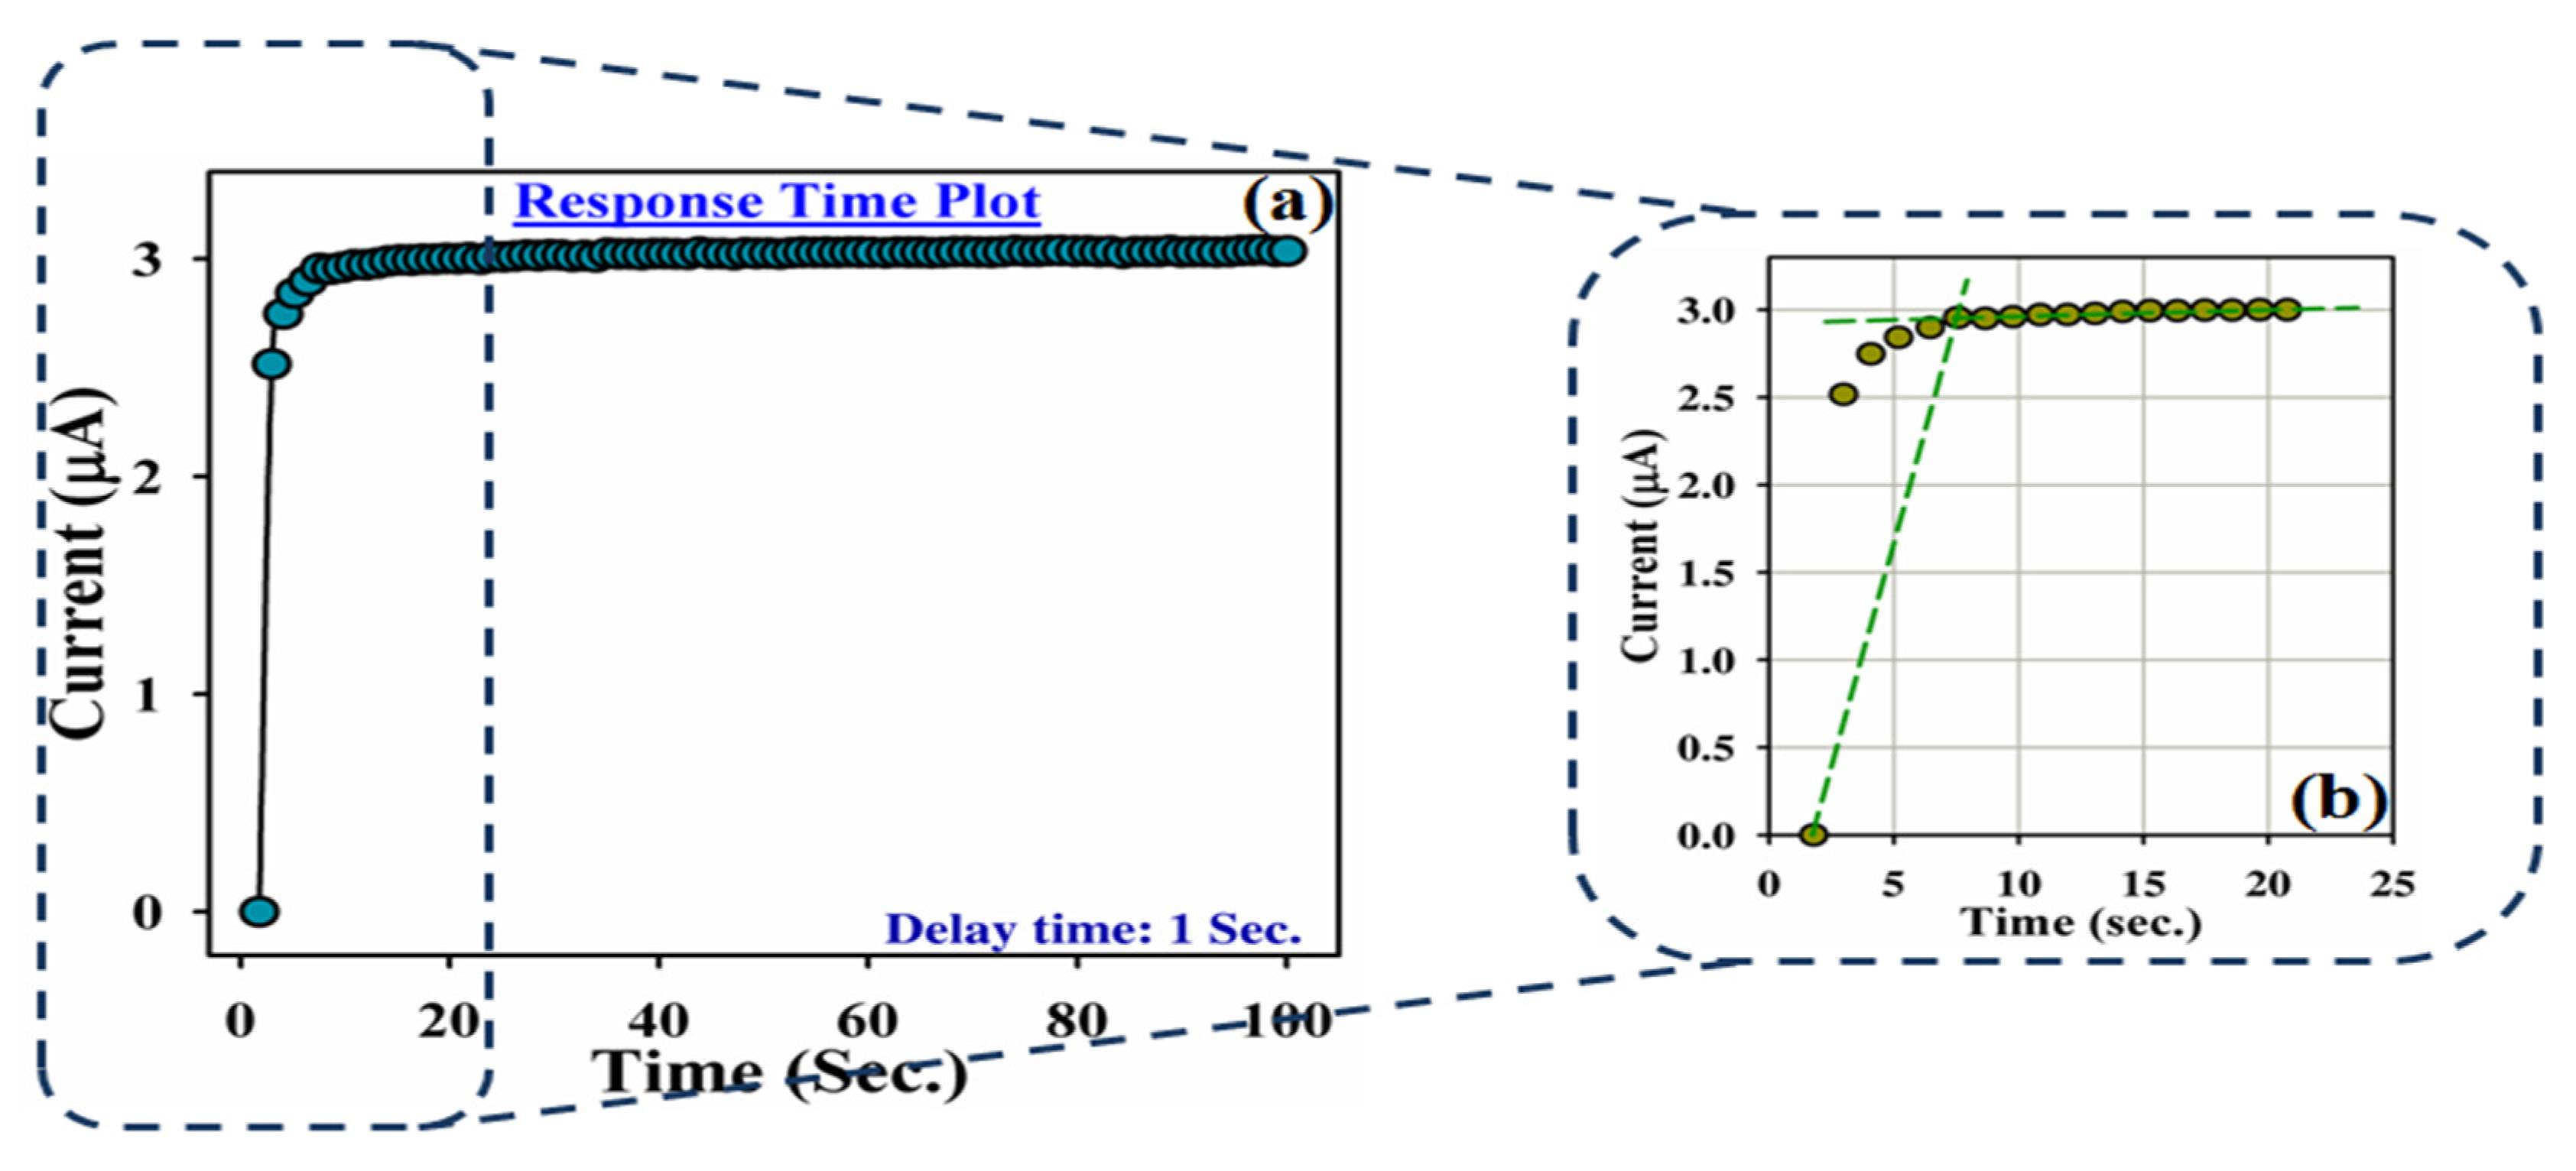
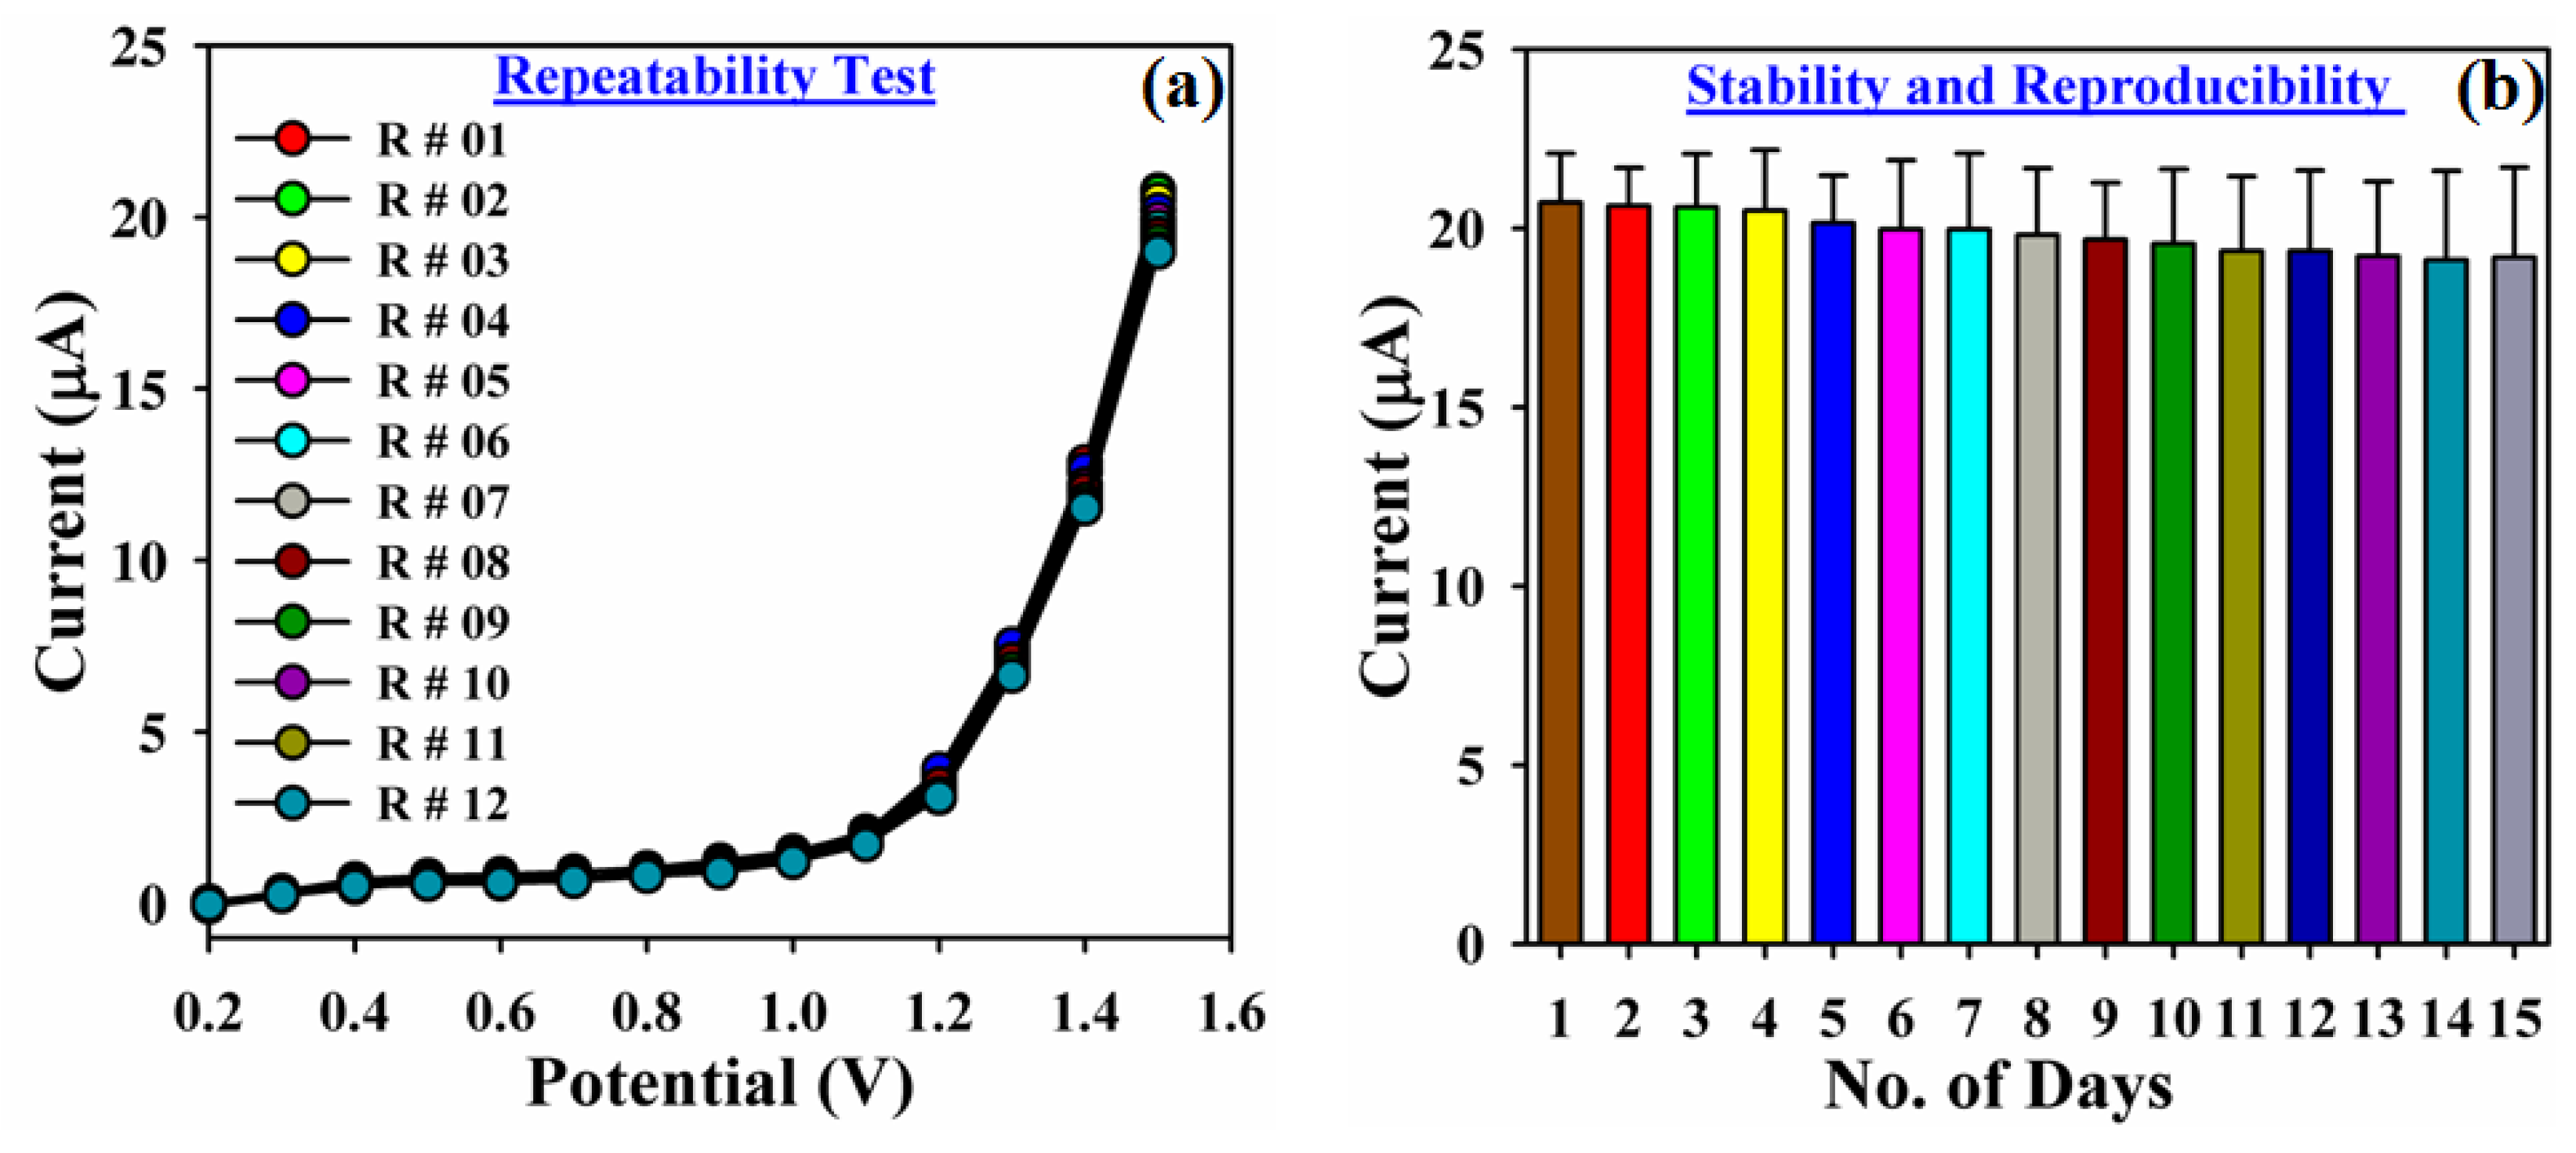
2.4. Optimization of Newly Designed m-Tolylhydrazine Sensor

Many analytical parameters, such as linear dynamic range (LDR), coefficient of correlation (r)/r2 square value, sensitivity, LOD (limit of detection), and LOQ (limit of quantification), were determined from the calibration curve plotted at the potential of +1.0 V in order to optimize our newly designed Er2O3@NiO-NC/Nafion/GCE as a selective m-Tolyl HDZN electrochemical sensor.
In the context of these parameters, I–V responses of the Er2O3@NiO-NC/Nafion/GCE as an efficient and sensitive sensor, even at very low concentrations, were examined at varied concentrations of m-Tolyl HDZN ranging from 1.0 pM to 1.0 mM in an aqueous solution of pH = 7.0. Under these circumstances, a consistent rise in current responsiveness was seen as a function of m-Tolyl HDZN concentration increasing from a lower to a higher value, as shown in Figure 9a. Then, the calibration curve from the m-Tolyl HDZN concentration variation plot was drawn at +1.5 V so as to calculate the optimal values of the above parameters, as shown in Figure 9b. The results for LDR, coefficient of correlation (r)/r2square value, and sensitivity were determined to be (1.0 pM to 0.1 mM), r = 0.9115/r2 = 0.8308 and 14.50 μAμM−1cm−2, respectively. Moreover, LOD and LOQ were found to be 0.066 ± 0.002 pM and 0.22 ± 0.02 pM, respectively.
The response time of Er2O3@NiO-NC/Nafion/GCE in the context of the sensing of m-Tolyl HDZN was also investigated in addition to all of the above-mentioned parameters, and was observed to be around 5 to 10 s to establish a saturated constant state, as shown in Figure 10a,b. Similarly, in order to further demonstrate the validity of the I–V approach, a repeatability test at 0.1 μM was also conducted under similar circumstances as those used in the previous experiments. In this regard, the results of ten to twelve subsequent measurements were checked during the repeatability test after predetermined intervals. It was observed that after washing with deionized water for each trial, the response of the newly designed Er2O3@NiO-NC/Nafion/GCE towards m-Tolyl HDZN was still repeatable and showed no signs of substantial alteration, as shown in Figure 11a. After this, I–V response of this newly non-reported m-Tolyl HDZN sensor was also monitored for up to 16 days in the context of its stability and reproducibility towards m-Tolylhydrazine and it was determined to be stable and reproducible with no discernible change in the current response after washing for each experiment, as shown in Figure 11b. It is also pertinent to mention here that when m-Tolyl HDZN was detected throughout these stability trials, there was no electrode contamination or poisoning, and the sensitivity was nearly identical to that of the original response.

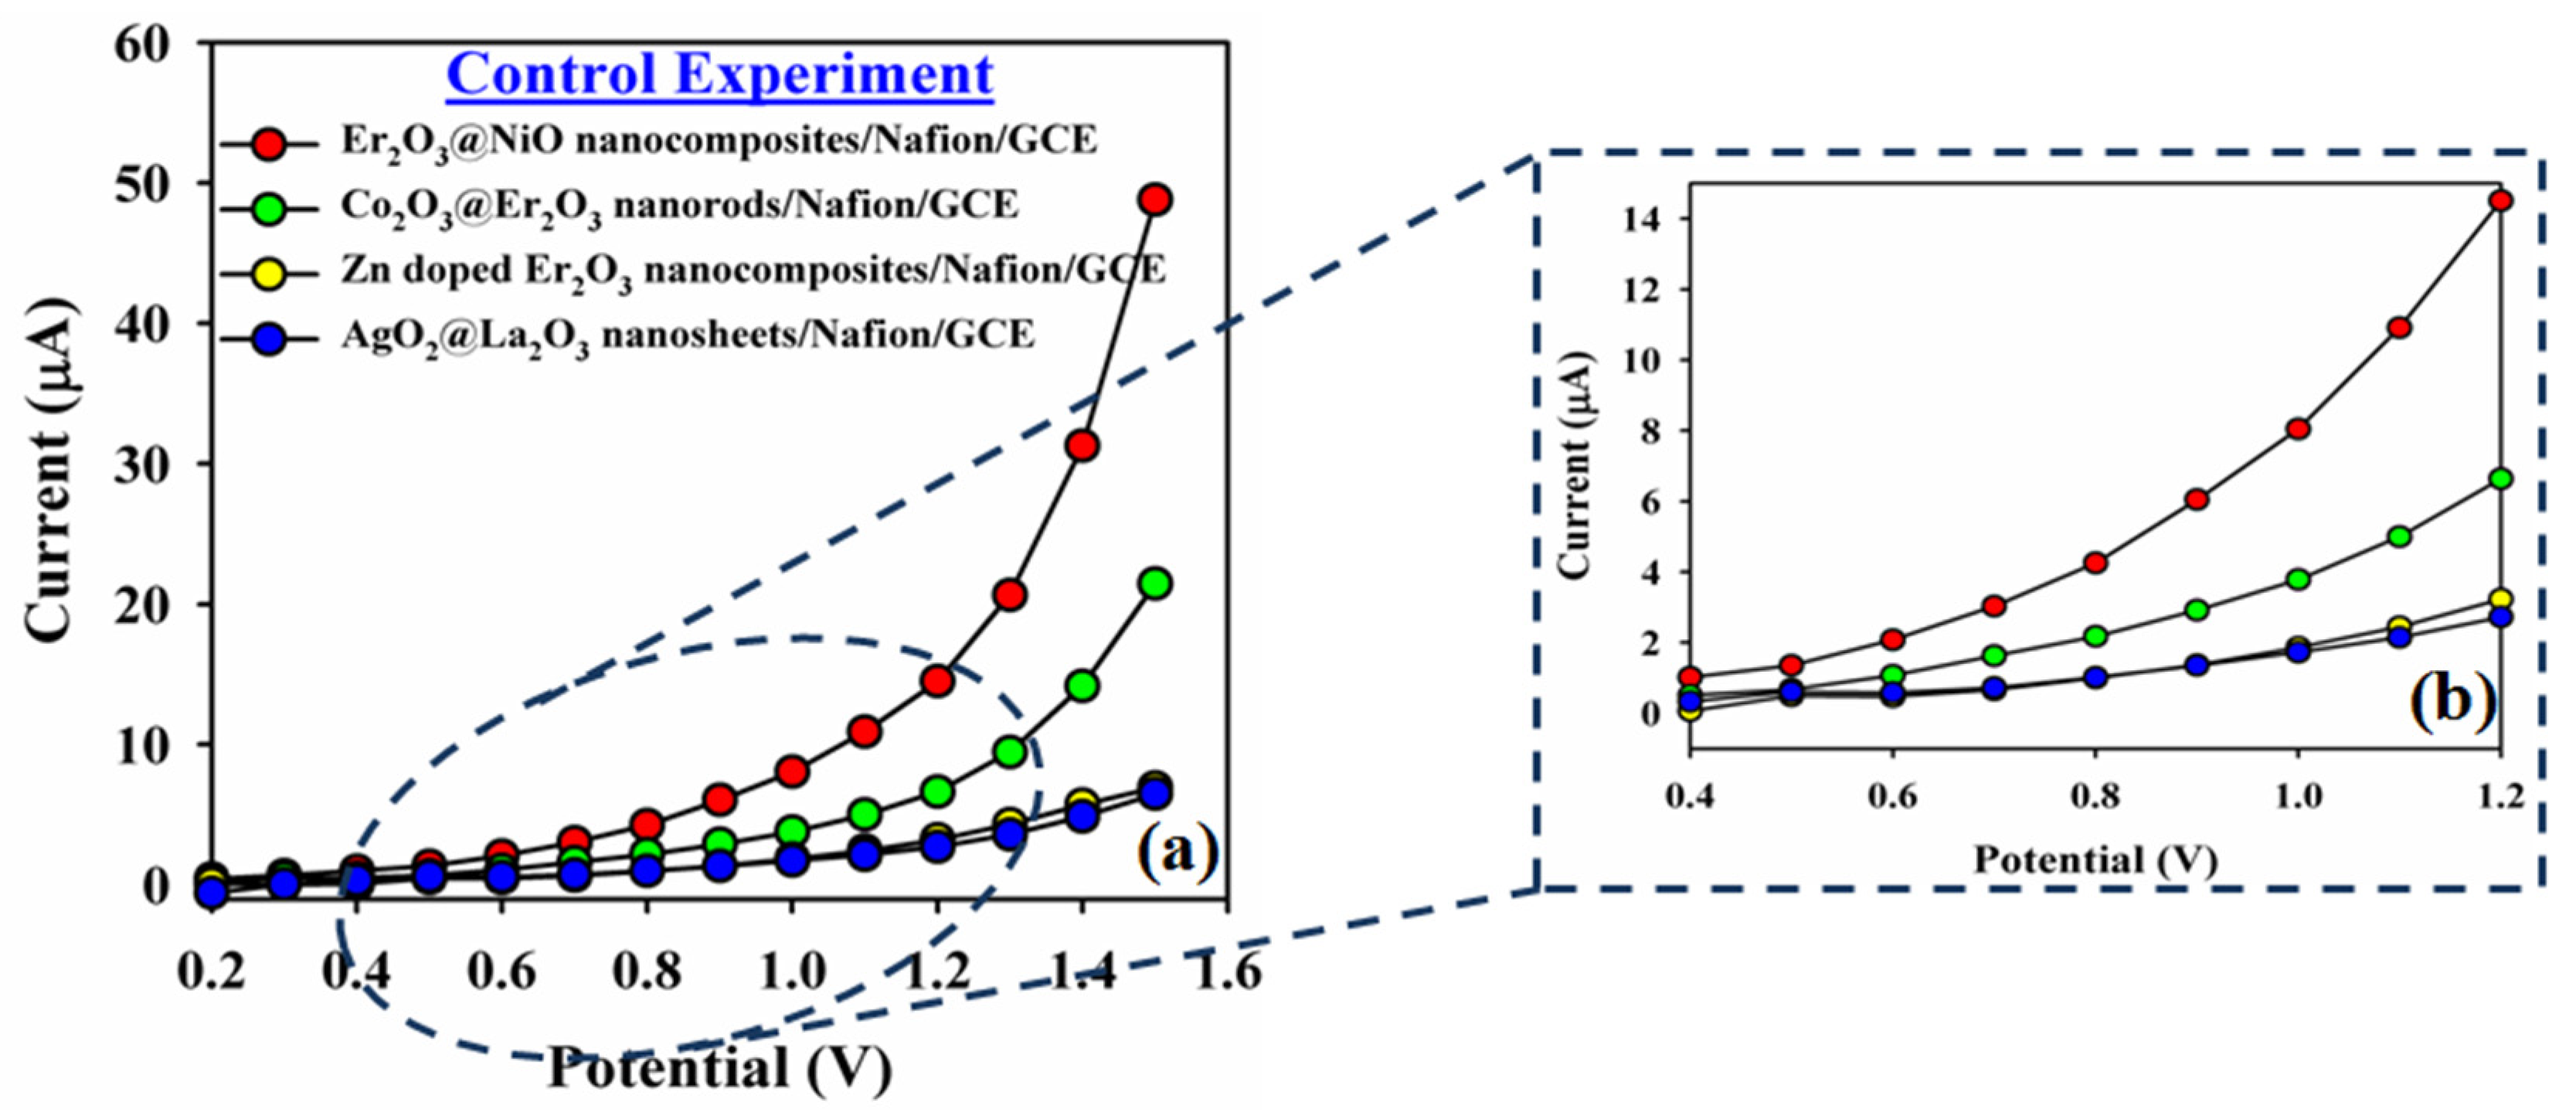
2.5. Control Experiment

In order to further validate that our newly designed Er2O3@NiO-NC/Nafion/GCE is only valid for m-Tolyl HDZN, a control experiment was also carried out by using different modified GCEs, and their current responses were observed against the potential applied (0.0 to +1.5 V) in the presence of m-Tolyl HDZN. The GCEs were fabricated using different materials via the same protocol that was adopted for the Er2O3@NiO-NC/Nafion/GCE. For this study, different derivatives of Er2O3, such as Ca2O3@Er2O3 nanorods and Zn-doped Er2O3, and materials other than erbium derivatives, such as AgO2@La2O3 nanosheets, that were available at that time in our laboratory, were used to modify the GCEs. It was discovered that the Er2O3@NiO-NC/Nafion/GCE was highly selective and sensitive to m-Tolyl HDZN and possesses very good affinity for our target analyte, as shown in Figure 12a,b.
Therefore, our newly fabricated Er2O3@NiO-NC/Nafion/GCE has good adsorption and absorption capability, in addition to its stability, ease of use, strong electrocatalytic behavior, and biocompatibility with our ecosystem when compared with other approaches presented in the literature for the detection of common harmful cations and organic toxic pollutants. Hence, this novel I–V electrochemical approach is also exceptionally sensitive and selective, and has a quick reaction time towards toxic chemicals, as discussed herein for m-Tolyl HDZN in the presence of other interfering toxic chemicals. Moreover, the strong electron communication feature between the active sites of the (Er2O3@NiO) NC and the flat surface of the GCE is related to its high sensitivity towards m-Tolyl HDZN. In addition, its porous surface provides a large surface area as an ideal nano-environment for the detection of our target analyte with excellent absorption and adsorption abilities. Additionally, a literature study reveals that this is the first report of the qualitative and quantitative detection of m-Tolylhydrazine, in addition to its electrocatalytic degradation, using an I–V approach, compared to other analytical methods that were reported earlier; Table 2.

2.6. Real Sample Analysis

A standard addition method was used for the analysis of real samples for further validation of an I–V approach for the detection m-Tolyl HDZN using the newly designed Er2O3@NiO-NC/Nafion/GCE as a selective m-Tolyl HDZN electrochemical sensor. Real environmental samples, such as industrial effluent, an extract of a baby feeding bottle, an extract of a PC bottle, and an extract of a PVC food packing bag, were used for this purpose. Before analysis, real samples of the baby feeding bottle, PC bottle, and PVC food packing bag were ground into fine powder, followed by controlled reflux at 60 °C in the mixture, at a 1:1 ratio, of methanol and PBS of pH = 7.0 for three hours. The mixture was then left for seven days to evaporate the methanol. Then, a fixed amount of 25.0 μL aliquot was shifted to 5.0 mL PBS of pH = 7.0 for its analysis using the standard addition method. For this purpose, a similar electrochemical (I–V) approach was used with the newly fabricated Er2O3@NiO-NC/Nafion/GCE as the selective electrochemical probe only for m-Tolyl HDZN. The results of their analysis are given in Table 3.

3. Experimental

3.1. Materials and Methods

All chemicals, such as erbium(III) chloride (ErCl3), nickel chloride hexahydrate (NiCl2.6H2O), 2-Aminophenol (2-AP), 2-nitrophenol (2-NP), 3-methoxyphenyl hydrazine (3-MPh HDZN), m-Tolylhydrazine (m-TolylHDZN), Zimtaldehyde (Zimt-ALD), para-nitrophenol (para-NP), sodium hydroxide, thiourea, 5% ethanolic-Nafion solution, and mono-and disodium phosphate, were analytical grade, purchased from Sigma-Aldrich, and used without further purification. For structural and optical characterization of newly synthesized Er2O3@NiO NC, FTIR, UV/Vis, and photoluminescence (PL) spectral analyses were performed, respectively, on a NICOLET iS50 FTIR spectrometer, Thermo Scientific (Madison, WI, USA), Evolution 300 UV/Visible spectrophotometer, Thermo Scientific (Madison, WI, USA), and fluorescence spectro-fluorometer. Additionally, a powder X-ray diffraction examination was carried out to ascertain the sample’s crystallinity under ambient circumstances on a Thermo Scientific Diffractometer (ARL X’TRA XRD) (Madison, WI, USA). JSM-7600F FESEM, JEOL (Tokyo, Japan) equipped with XEDS analysis was also used for our newly synthesized NC to examine its structural morphology and its organization in addition to its elemental analysis. Moreover, X-ray photoelectron spectroscopy (XPS) analysis was performed using K-Alpha XPS Thermo Scientific (Madison, WI, USA) in order to further confirm its chemical composition as well as the electronic states of elements present in it. Then, a new electrochemical approach called the I–V method was employed via a 6517A–Keithleyelectrometer, Keithley Instruments, (Cleveland, USA) to detect m-Tolylhydrazine (m-Tolyl HDZN), qualitatively and quantitatively. In this I–V approach, a two-electrode setup was established in a laboratory, in which one electrode served as the counter/reference electrode and the other as the working electrode (NC-modified GCE), so as to measure the current against the applied potential (0.0 V to +1.5 V) in accordance with Ohm’s law. The newly designed modified GCE, Er2O3@NiO NC/Nafion/GCE, was used as the working electrode and a Pt wire as the counter electrode. Throughout this investigation, stock solutions and chemical solutions of various concentrations were prepared using de-ionized water.

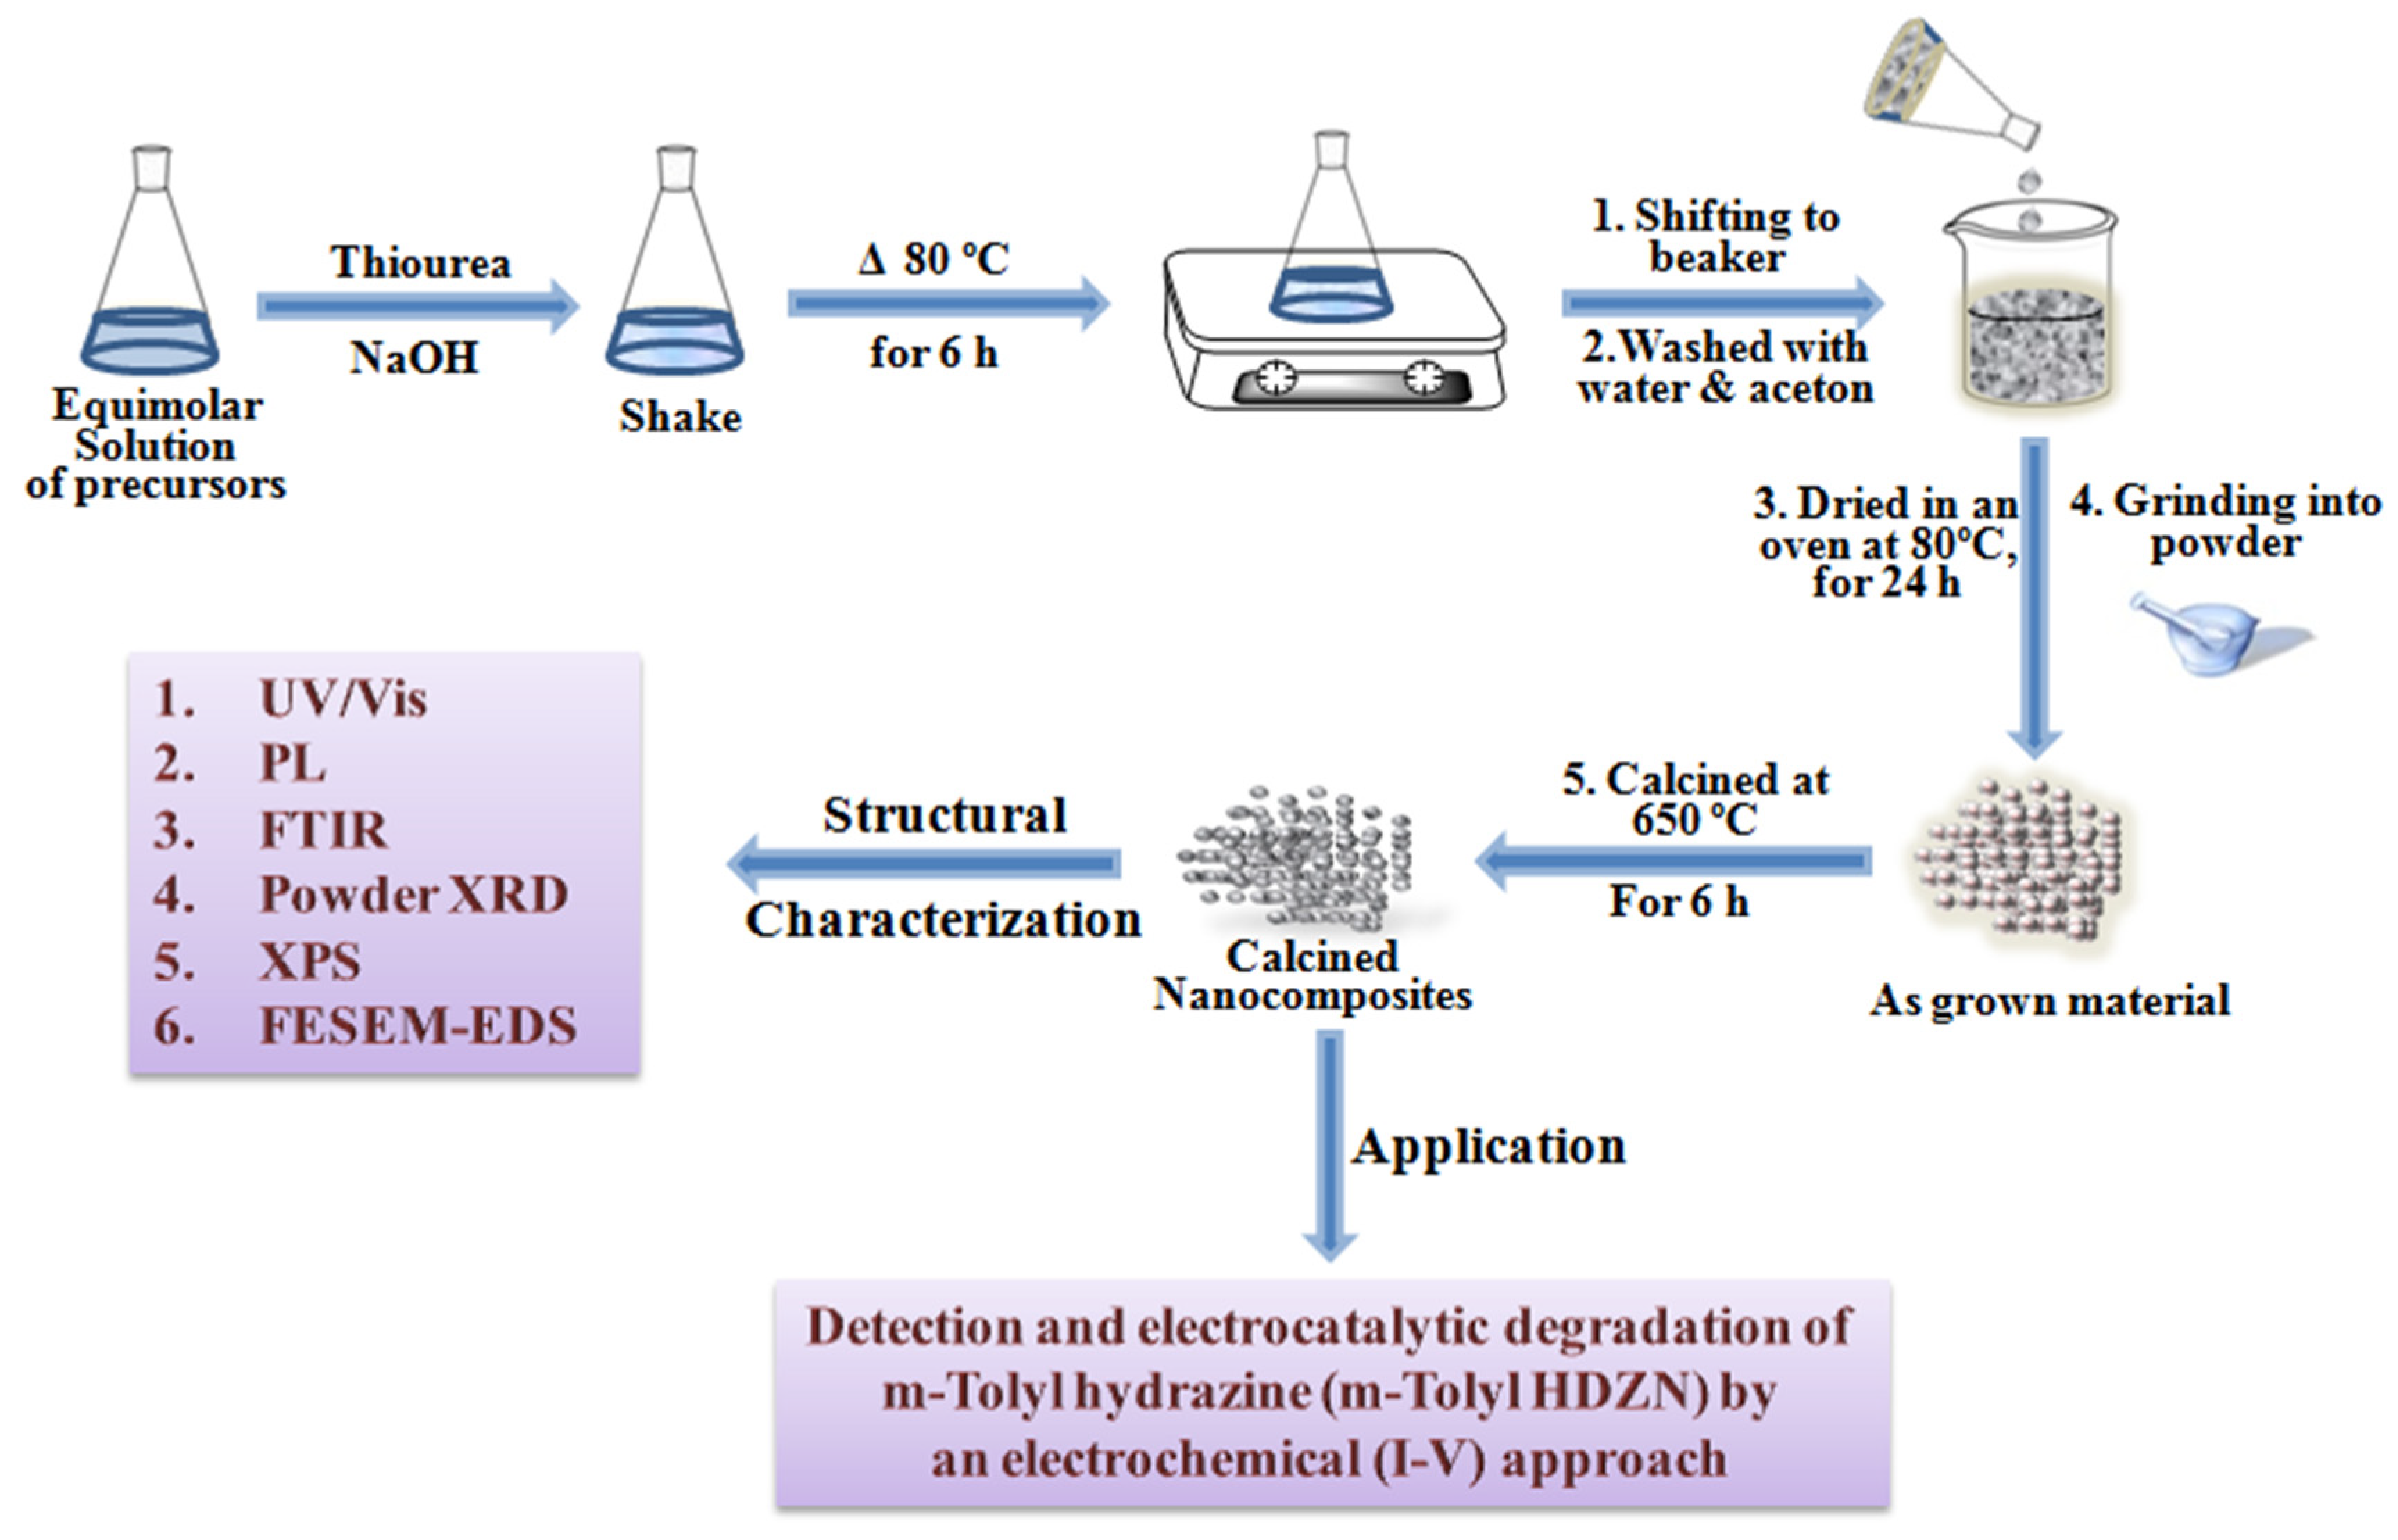
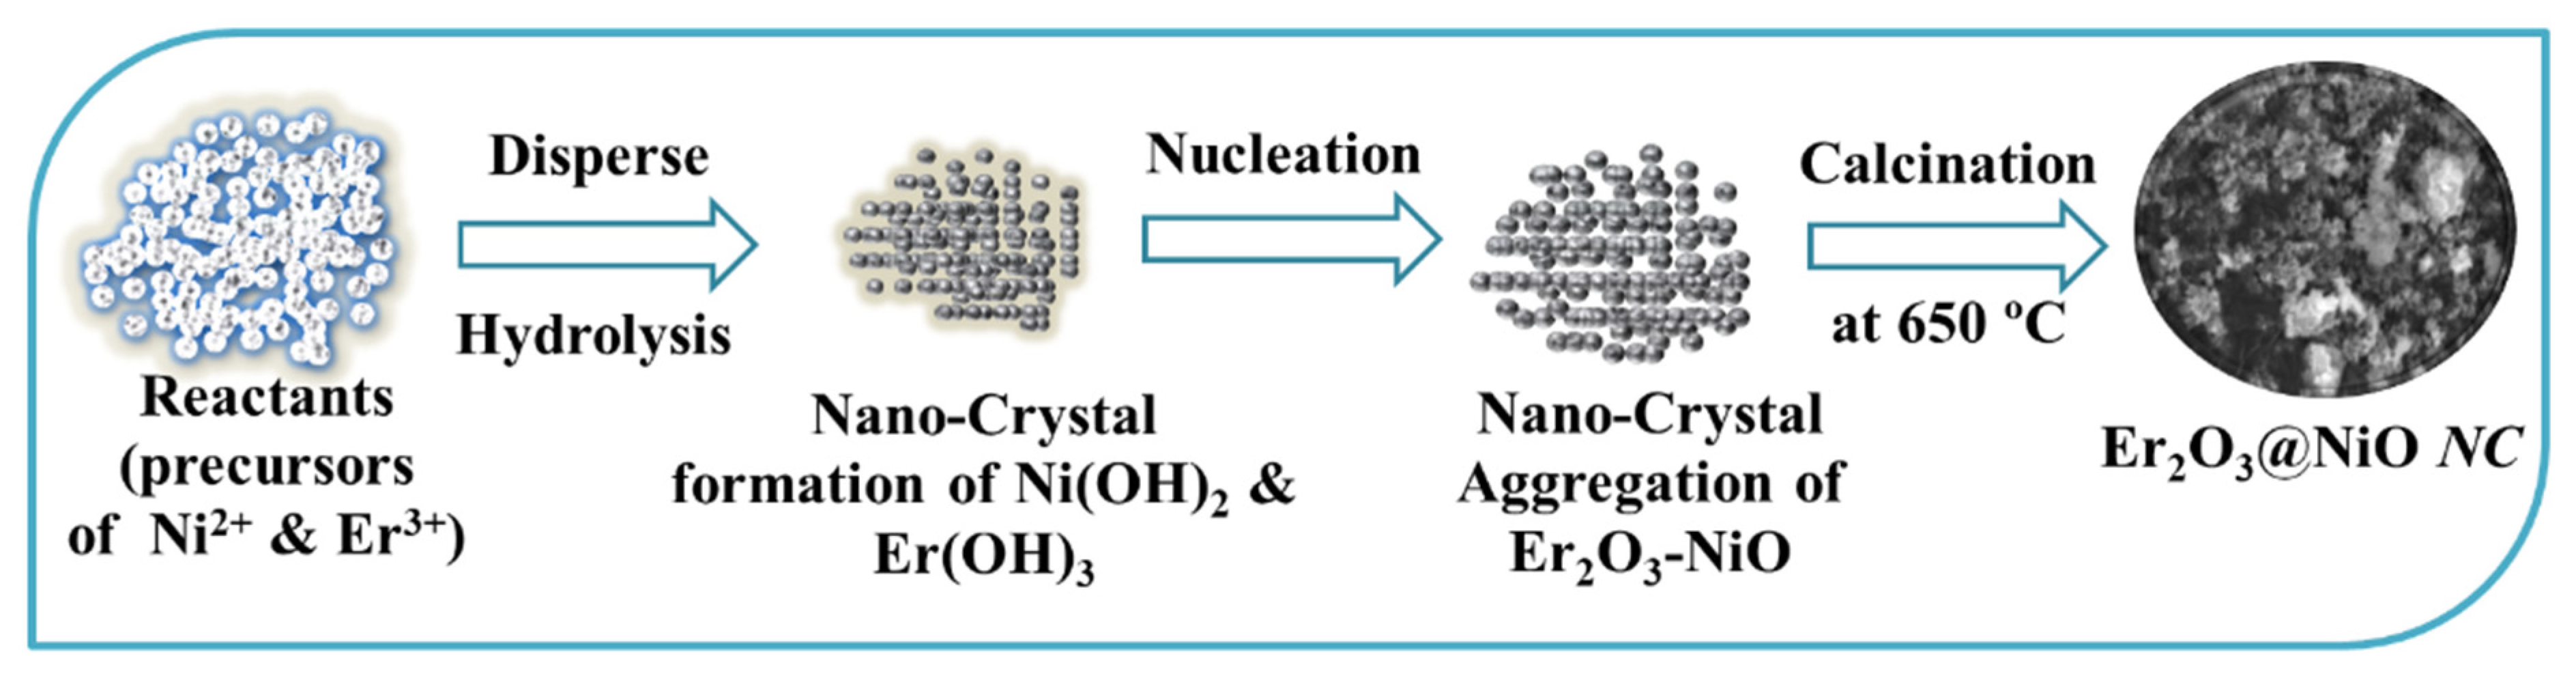
3.2. Synthesis of Binary Metal Oxide(Er2O3@NiO) Semiconductor Nanocomposite (NC) Using a Wet Chemical Method

A simple classical wet chemical approach at alkaline pH was employed to synthesize the binary metal oxide(Er2O3@NiO) semiconductor nanocomposite. In this procedure, equimolar precursor solutions of ErCl3 (50.0 mL) and NiCl2.6H2O (50.0 mL), along with thiourea of equal concentration at a 1:2 ratio by volume were put into a 250.0 mL Erlenmeyer flask and vigorously stirred to homogenize it. Thiourea plays a role as a surfactant to the mixture for the purposes of de-agglomeration. The pH was then changed to an alkaline state by adding (2.0 M) NaOH drop-wise. Following the addition of NaOH, the flask was heated for 6 h at 80 °C with constant stirring on an electric hotplate. A co-precipitate of Er2O3-NiO was generated at the completion of the reaction which was filtered and thoroughly washed with a mixture of water and acetone to eliminate any undesired impurities. This was dried at 80°C in an oven for 24 h followed by grinding to ensure homogeneity before being placed in a muffle furnace (Barnstead Thermolyne, 6000 Furnace, Dubuque, USA) and constantly calcined at 600 °C for 6 h; Scheme 3. The formation of the binary metal oxide (Er2O3@NiO) semiconductor nanocomposites can be explained by the chemical reactions shown in Equations (5) to (9).
N a O H ( s ) N a ( a q ) + + O H ( a q )
E r C l 3 E r ( a q ) 3 + + 3 C l ( a q )
N i C l 2 .6 H 2 O N i ( a q ) 2 + + 2 C l ( a q ) + 6 H ( a q ) + + 6 O H ( a q )
5 O H ( a q ) + N i ( a q ) 2 + + E r ( a q ) 3 + N i ( O H ) 2 ( a q ) + E r ( O H ) 3 ( a q )
N i ( O H ) 2 ( a q ) + 2 E r ( O H ) 3 ( a q ) E r 2 O 3 @ N i O ( s ) + 4 H 2 O ( a q )
The production of the Er2O3@NiO nanocrystals depends heavily on an alkaline pH and NaOH, and the pH was thus maintained at 10 by adding hydroxyl (OH) to the system. In this way, ErCl3 and NiCl2·6H2O were hydrolyzed in the water to form their corresponding unstable hydroxides, namely, Er(OH)3 and Ni(OH)2), which were then further changed into their respective oxides by the dehydration with ongoing heating. Due to the lower activation energy barrier of heterogeneous nucleation during this phase and a larger concentration of Er3+ions in the solution in addition to OH ions, Ni(OH)2 first started to precipitate. After that, a number of bulkier materials in the form of assembledEr2O3-NiO precipitates were generated among the materials as a result of the system’s greater concentration of Er3+. According to the Ostwald ripening theory, the formation of Er2O3-NiO nanocrystals started. For this Er2O3-NiO, nuclei first started to develop via mutual and self-aggregation, creating the nanocrystals. Van der Waals forces caused these nanocrystals to re-aggregate with one another, creating the binary metal oxide (Er2O3@NiO) semiconductor NC; Scheme 4.
The optical, morphological, and structural characteristics of the newly synthesized non-reported calcined NC were investigated via modern analytical tools such as UV/Vis, FTIR, and PL spectroscopy, in addition to powder XRD, XPS, BET, EIS, and FESEM combined with EDS to confirm its formation. The synthesized NC was then used for detection and electrocatalytic degradation of selective toxic chemicals in an aqueous system via an easy and credible electrochemical (I–V) approach by developing its modified GCE for the first time.

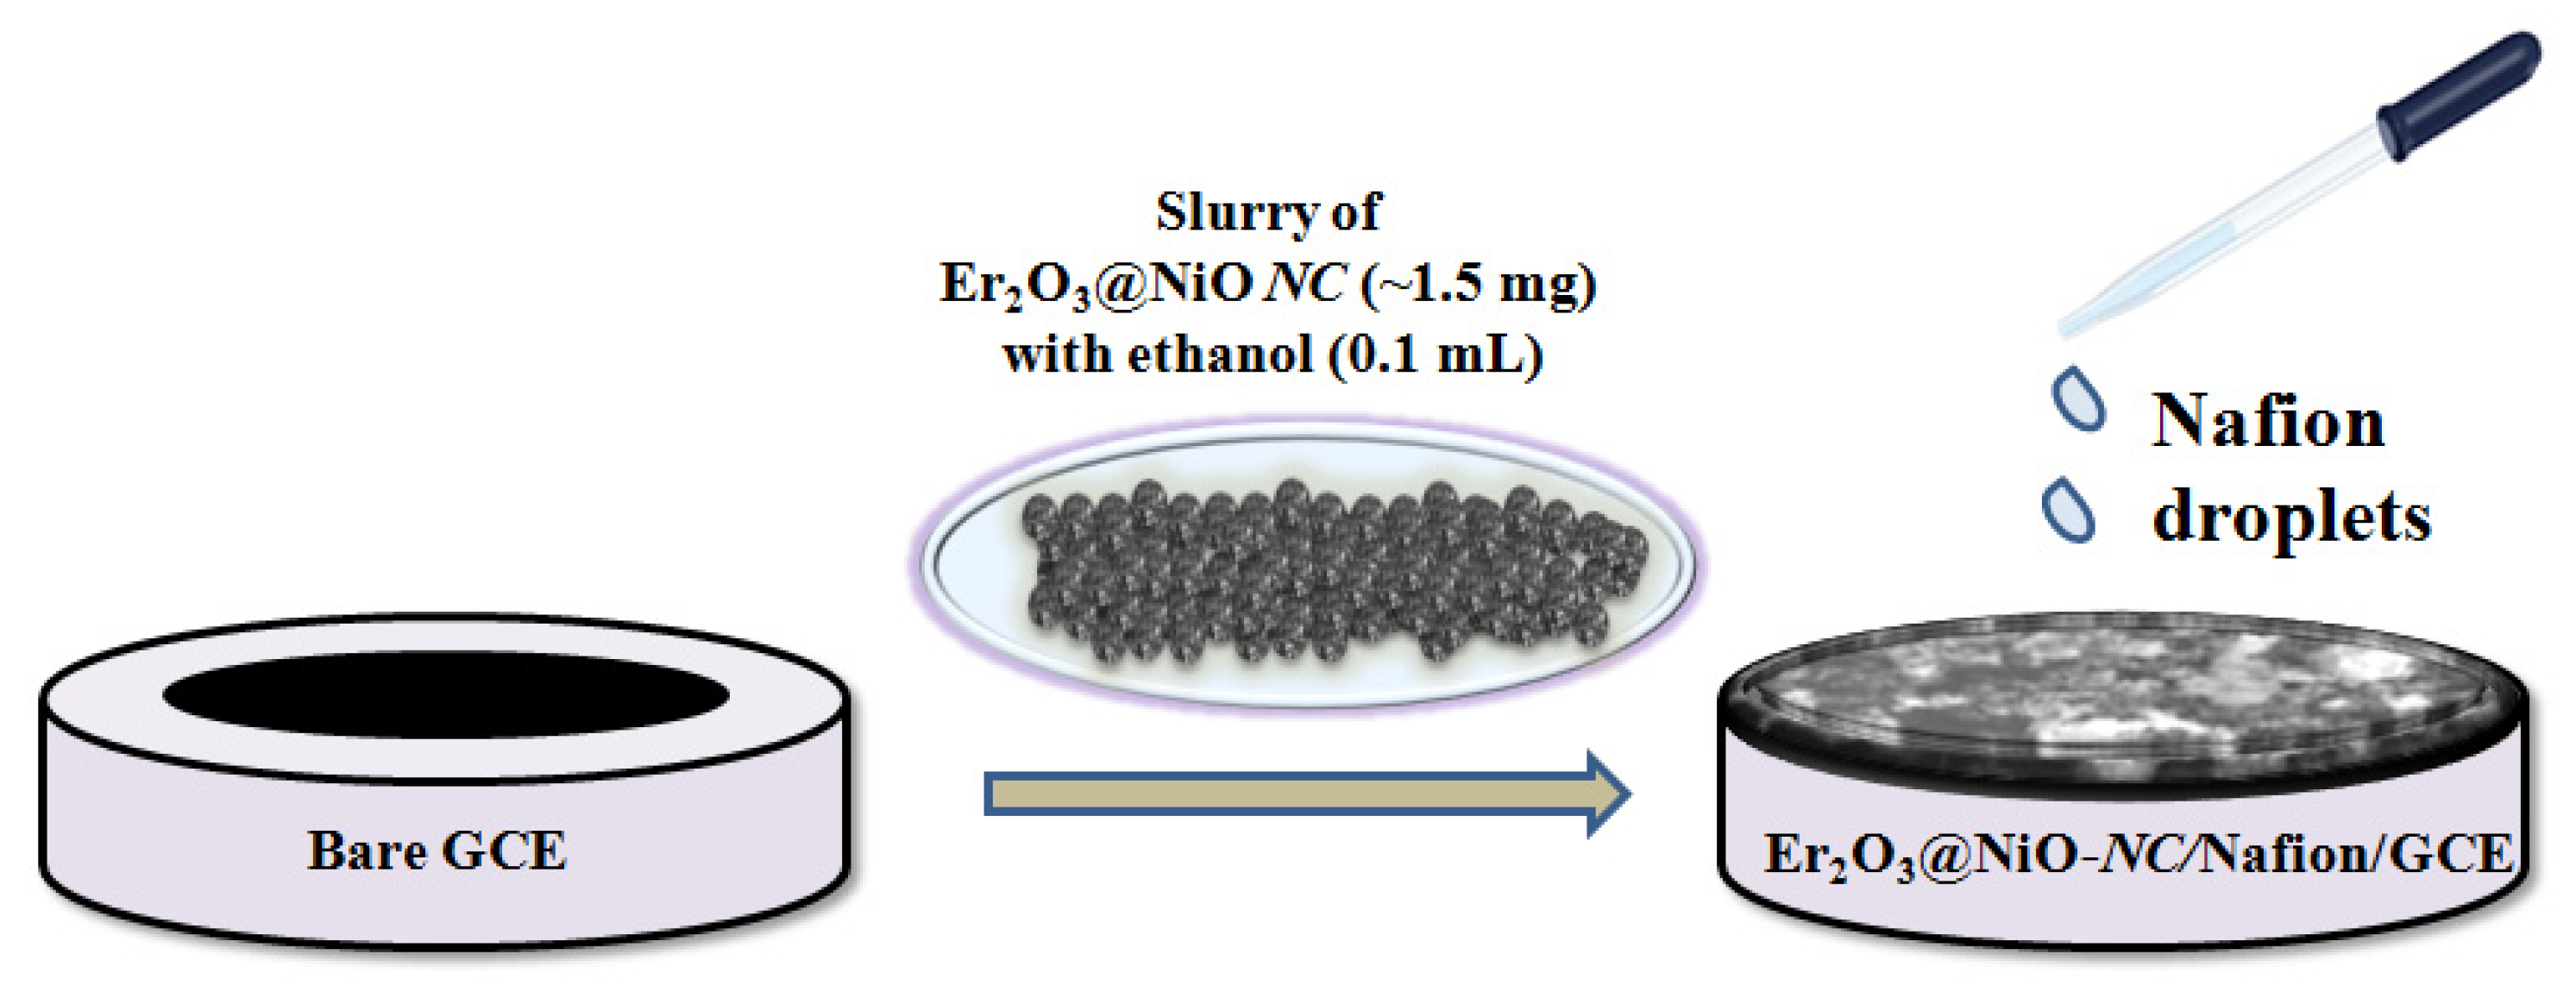
3.3. Fabrication of GCE with Er2O3@NiO NC

A very basic and inexpensive approach was used for the fabrication of Er2O3@NiO-NC/Nafion/GCE as a selective and efficient m-Tolyl HDZN sensor. A GCE with geometric dimensions of 12 cm in length and 0.0316 cm2 in diameter was used in this regard. First, the GCE was washed using a basic process prior to manufacturing. The GCE was first immersed in acetone for 10 min. It was then scrubbed with deionized water, dipped in ethanol using cotton swabs, and dried for 15 min at 60 °C. After thorough washing, 5.0 to 10.0 mg of Er2O3@NiO NC was mixed with ethanol to make the slurry, which was then applied on the GCE’s flat surface with 1 to 2 drops of 5% ethanolic-Nafion as an adherent and a conducting binder. After coating, it was set in an oven at 40 °C for 10 to 15 min in order to obtain evenly dry Er2O3@NiO-NC/Nafion/GCE as a selective m-Tolyl HDZN sensor; Scheme 5. For an I–V response in phosphate buffer solution (PBS) of pH = 7.0, a laboratory-made electrochemical cell was devised using the newly fabricated Er2O3@NiO-NC/Nafion/GCE as the working electrode, which was selective for m-Tolyl HDZN, and Pt-wire (1.5 mm in diameter) as the counter electrode. A 100.0 mL measuring cylinder was used to combine an equimolar (0.2 M) solution of Na2HPO4 (39 mL) and NaH2PO4 (61.0 mL) to prepare the PBS of pH = 7.0. A fixed amount (5.0 mL) of 0.2 M PBS of pH = 7.0 was used consistently throughout this investigation. A 0.1 M stock solution of target analyte, m-Tolyl HDZN, was prepared in deionized water, and was further diluted to make various concentrations (full concentration range: 1.0 pM to 1.0 mM). Different analytical parameters, such as linear dynamic range (LDR), coefficient of correlation (r), sensitivity, limit of detection (LOD) (at S/N 3), and limit of quantification (LOQ), were calculated to optimize our newly designed m-Tolyl HDZN sensor (Er2O3@NiO NC/Nafion/GCE) using the slope of the calibration curve. With the basic two-electrode setup, stipulated above, a Keithley electrometer was used as a constant voltage source for the I–V measurement.

4. Conclusions

In conclusion, the newly designed non-reported Er2O3@NiO NC modified GCE was proven to be an efficient and selective electrochemical sensor for the probing of m-Tolyl HDZN, in addition to its electrocatalytic degradation via AOPs using a novel electrochemical (current–potential) approach. The response of the newly fabricated Er2O3@NiO NC/Nafion/GCE to our target analyte was very fast (i.e., 5 to 10 s) in the presence of other interfering toxic chemicals, with a detection limit of 0.066 pM over a wide range of concentrations from 0.1 pM to 0.1 mM. Er2O3@NiO NC was synthesized using a classical wet chemical method, which is considered to be a simple, easy, and economical method. Moreover, the results of powder XRD, FTIR, PL, XPS, BET, EIS, and FESEM-EDS analyses for its structural elucidation were also in good concurrence with the results previously reported in the literature. Hence, this novel (I–V) approach is an effective method for the qualitative detection, quantitative determination, and electrocatalytic degradation of toxic chemicals in health care and environmental fields, as reflected in real sample analysis.

Author Contributions

T.A.S. Conceptualization; Formal analysis; Investigation; Validation; Writing—original draft; A.M.A. Conceptualization; Investigation; Resources; Supervision; Writing—review and editing; A.S. Investigation; Validation; Writing—review and editing; H.M.M. Formal analysis; Funding acquisition; Resources; Supervision; Writing—review and editing; M.R.R. Formal analysis; Investigation; Validation; Writing—review and editing; M.N.A. Investigation; Validation; Writing—review and editing; M.M.R. Conceptualization; Formal analysis; Funding acquisition; Investigation; Resources; Supervision; Writing—original draft. All authors have read and agreed to the published version of the manuscript.

Funding

This research work was funded by Institutional Fund Projects under grant no (IFPIP-477-130-1443).

Data Availability Statement

All data are contained within the article.

Acknowledgments

This research work was funded by Institutional Fund Projects under grant no (IFPIP-477-130-1443). The authors gratefully acknowledge technical and financial support provided by the ministry of Education and King Abdulaziz University, DSR, Jeddah, Saudi Arabia. Moreover, the authors also acknowledge the technical support of Institute of Chemistry, The Islamia University of Bahawalpur, Baghdad-ul-Jadeed Campus, Bahawalpur-63100, Pakistan.

Conflicts of Interest

The authors declare no conflict of interest.

References

  1. Vijayakumar, M.; Surendhar, G.; Natrayan, L.; Patil, P.P.; Ram, P.; Paramasivam, P. Evolution and recent scenario of nanotechnology in agriculture and food industries. J. Nanomater. 2022, 2022, 1280411. [Google Scholar] [CrossRef]
  2. Nayak, V.; Singh, K.R.; Paliwal, R.; Singh, J.; Pandey, M.D.; Singh, R.P. Introduction to nanotechnological utility in the pharmaceutical industry. In Nanotechnology for Drug Delivery and Pharmaceuticals; Elsevier: Amsterdam, The Netherlands, 2023; pp. 337–355. [Google Scholar]
  3. Malik, S.; Muhammad, K.; Waheed, Y. Nanotechnology: A revolution in modern industry. Molecules 2023, 28, 661. [Google Scholar] [CrossRef] [PubMed]
  4. Ansari, S.A.; Parveen, N.; Rahman, M.M. Nanomaterials for catalysis and energy storage. Nanomaterials 2023, 13, 360. [Google Scholar] [CrossRef] [PubMed]
  5. Xiao, J.; Cai, Z.; Muhmood, T.; Hu, X.; Lin, S.; Hu, X. Tailoring ordered porous carbon embedded with cu clusters for high-energy and long-lasting phosphorus anode. Small 2022, 18, 2106930. [Google Scholar] [CrossRef] [PubMed]
  6. Lin, S.; Chen, Y.; Wang, Y.; Cai, Z.; Xiao, J.; Muhmood, T.; Hu, X. Three-dimensional ordered porous nanostructures for lithium–selenium battery cathodes that confer superior energy-storage performance. ACS Appl. Mater. Interfaces 2021, 13, 9955–9964. [Google Scholar] [CrossRef]
  7. Rahman, M.M.; Sheikh, T.A.; Asiri, A.M.; Awual, M.R. Development of 3-methoxyaniline sensor probe based on thin ag 2 o@ la 2 o 3 nanosheets for environmental safety. New J. Chem. 2019, 43, 4620–4632. [Google Scholar] [CrossRef]
  8. Muhmood, T.; Xia, M.; Lei, W.; Wang, F.; Mahmood, A. Fe-zro2 imbedded graphene like carbon nitride for acarbose (acb) photo-degradation intermediate study. Adv. Powder Technol. 2018, 29, 3233–3240. [Google Scholar] [CrossRef]
  9. Muhmood, T.; Uddin, A. Fabrication of spherical-graphitic carbon nitride via hydrothermal method for enhanced photo-degradation ability towards antibiotic. Chem. Phys. Lett. 2020, 753, 137604. [Google Scholar] [CrossRef]
  10. Abbas, N.; Zhang, J.-M.; Nazir, S.; Ahsan, M.T.; Saleem, S.; Ali, U.; Akhtar, N.; Ikram, M.; Liaqat, R. A comparative study of structural, vibrational mode, optical and electrical properties of pure nickel selenide (nise) and ce-doped nise nanoparticles for electronic device applications. Phys. BCondens. Matter 2023, 649, 414471. [Google Scholar] [CrossRef]
  11. Shaheen, I.; Khalil, A.; Shaheen, R.; Tahir, M.B. A review on nanomaterials: Types, synthesis, characterization techniques, properties and applications. Innov. Sci. Technol. 2023, 2, 56–62. [Google Scholar] [CrossRef]
  12. Sheikh, T.A.; Rahman, M.M.; Asiri, A.M.; Marwani, H.M. Sensitive 3-chlorophenol sensor development based on facile er 2 o 3/cuo nanomaterials for environmental safety. New J. Chem. 2018, 42, 3936–3946. [Google Scholar] [CrossRef]
  13. Cai, Z.; Lin, S.; Xiao, J.; Muhmood, T.; Hu, X. 3d ordered co@ n c skeleton for bifunctional oxygen reduction and oxygen evolution reaction electrocatalysts. Adv. Mater. Interfaces 2021, 8, 2001922. [Google Scholar] [CrossRef]
  14. Mahmood, A.; Muhmood, T.; Ahmad, F. Carbon nanotubes heterojunction with graphene like carbon nitride for the enhancement of electrochemical and photocatalytic activity. Mater. Chem. Phys. 2022, 278, 125640. [Google Scholar] [CrossRef]
  15. Rahman, M.M.; Sheikh, T.A.; Asiri, A.M.; Alamry, K.; Hasnat, M. Fabrication of an ultra-sensitive para-nitrophenol sensor based on facile zn-doped er 2 o 3 nanocomposites via an electrochemical approach. Anal. Methods 2020, 12, 3470–3483. [Google Scholar] [CrossRef] [PubMed]
  16. Khalid, N.; Sabir, M.; Ali, F.; Tahir, M.; Javid, M.A.; Niaz, N.; Ahmed, R.; Rafique, M.; Imran, M.; Assiri, M.A. Green synthesis and characterizations of bi-functional mo-doped zno nanostructures for antimicrobial and photocatalytic applications. Mater. Chem. Phys. 2023, 296, 127306. [Google Scholar] [CrossRef]
  17. Sun, Y.; Waterhouse, G.I.; Qiao, X.; Xiao, J.; Xu, Z. Determination of chloramphenicol in food using nanomaterial-based electrochemical and optical sensors-a review. Food Chem. 2023, 410, 135434. [Google Scholar] [CrossRef] [PubMed]
  18. Panda, P.; Chakraborty, S.; Krishna, S.B.N. The use of silver nanoparticles in environmental remediation. Preprints.org 2023, 2023010330. [Google Scholar] [CrossRef]
  19. Muhmood, T.; Xia, M.; Lei, W.; Wang, F. Under vacuum synthesis of type-i heterojunction between red phosphorus and graphene like carbon nitride with enhanced catalytic, electrochemical and charge separation ability for photodegradation of an acute toxicity category-iii compound. Appl. Catal. B Environ. 2018, 238, 568–575. [Google Scholar] [CrossRef]
  20. Liu, X.; Zhao, C.; Muhmood, T.; Yang, X. Regulating the assembly of precursors of carbon nitrides to improve photocatalytic hydrogen production. Catalysts 2022, 12, 1634. [Google Scholar] [CrossRef]
  21. Zhu, Y.; Yang, L. Synthesis of ag nanoparticles decorated carbon nanotubes as an electrochemical sensor for determination of phenolic compounds in shale gas wastewater. Int. J. Electrochem. Sci. 2021, 16, 21074. [Google Scholar] [CrossRef]
  22. Padmanaban, A.; Murugadoss, G.; Venkatesh, N.; Hazra, S.; Kumar, M.R.; Tamilselvi, R.; Sakthivel, P. Electrochemical determination of harmful catechol and rapid decolorization of textile dyes using ceria and tin doped zno nanoparticles. J. Environ. Chem. Eng. 2021, 9, 105976. [Google Scholar] [CrossRef]
  23. Kunene, K.; Sabela, M.; Kanchi, S.; Bisetty, K. High performance electrochemical biosensor for bisphenol a using screen printed electrodes modified with multiwalled carbon nanotubes functionalized with silver-doped zinc oxide. Waste Biomass Valorization 2020, 11, 1085–1096. [Google Scholar] [CrossRef]
  24. Sheikh, T.A.; Rahman, M.M.; Asiri, A.M.; Marwani, H.M.; Awual, M.R. 4-hexylresorcinol sensor development based on wet-chemically prepared co3o4@ er2o3 nanorods: A practical approach. J. Ind. Eng. Chem. 2018, 66, 446–455. [Google Scholar] [CrossRef]
  25. Taghizadeh, F. The study of structural and magnetic properties of nio nanoparticles. Opt. Photonics J. 2016, 6, 8. [Google Scholar] [CrossRef]
  26. Sagadevan, S.; Podder, J. Investigations on structural, optical, morphological and electrical properties of nickel oxide nanoparticles. Int. J. Nanoparticles 2015, 8, 289–301. [Google Scholar] [CrossRef]
  27. Ramesh, R.; Yamini, V.; Sundaram, S.J.; Khan, F.L.A.; Kaviyarasu, K. Investigation of structural and optical properties of nio nanoparticles mediated by plectranthusamboinicus leaf extract. Mater. Today Proc. 2021, 36, 268–272. [Google Scholar] [CrossRef]
  28. Lan, X.; Li, Z.-B.; Zhang, H.; Zhang, G.-H. Effect of rare earth oxide doping on microstructure and mechanical property of mo-30 w solid solution alloy. Int. J. Refract. Met. Hard Mater. 2023, 110, 106014. [Google Scholar] [CrossRef]
  29. Nafee, S.S.; Hamdalla, T.A.; Darwish, A. Studies of the morphology and optical properties of nano erbium oxide embedded in pmma matrix. Opt. Laser Technol. 2020, 129, 106282. [Google Scholar] [CrossRef]
  30. Neuman, A.; Platero, M.; Romero, R.; Mcclellan, K.J.; Petrovic, J.J. Fabrication and properties of erbium oxide. In Proceedings of the 21st Annual Conference on Composites, Advanced Ceramics, Materials, and Structures—B: Ceramic Engineering and Science Proceedings, Cocoa Beach, FL, USA, 12–16 January 1997; John Wiley & Sons, Inc.: Hoboken, NJ, USA, 1997; pp. 37–44. [Google Scholar]
  31. Dargis, R.; Williams, D.; Smith, R.; Arkun, E.; Roucka, R.; Clark, A.; Lebby, M. Structural and thermal properties of single crystalline epitaxial gd2o3 and er2o3 grown on si (111). ECS J. Solid State Sci. Technol. 2012, 1, N24. [Google Scholar] [CrossRef]
  32. Pan, T.-M.; Chen, C.-L.; Yeh, W.W.; Hou, S.-J. Structural and electrical characteristics of thin erbium oxide gate dielectrics. Appl. Phys. Lett. 2006, 89, 222912. [Google Scholar] [CrossRef]
  33. Aguilar, T.; Navas, J.; Sánchez-Coronilla, A.; Martín, E.I.; Gallardo, J.J.; Martínez-Merino, P.; Gómez-Villarejo, R.; Piñero, J.C.; Alcántara, R.; Fernández-Lorenzo, C. Investigation of enhanced thermal properties in nio-based nanofluids for concentrating solar power applications: A molecular dynamics and experimental analysis. Appl. Energy 2018, 211, 677–688. [Google Scholar] [CrossRef]
  34. Marand, S.A.; Almasi, H.; Marand, N.A. Chitosan-based nanocomposite films incorporated with nio nanoparticles: Physicochemical, photocatalytic and antimicrobial properties. Int. J. Biol. Macromol. 2021, 190, 667–678. [Google Scholar] [CrossRef]
  35. Balarama, S.; Iruson, B.; Krishnmoorthy, S.; Elayaperumal, M.; Sangaraju, S. Synthesis of er2o3 blended ceo2 nanocomposites and investigation of their biomedical applications. Chem. Phys. Impact 2023, 6, 100167. [Google Scholar] [CrossRef]
  36. Palani, U.; Iruson, B.; Balaraman, S.; Krishnamoorthy, S.; Elayaperumal, M. Synthesis and characterization of iron oxide, rare earth erbium oxide, and erbium oxide blended iron oxide nanocomposites for biomedical activity application. Int. J. Nano Dimens. 2023, 14, 103–114. [Google Scholar]
  37. Khodair, Z.T.; Ibrahim, N.M.; Kadhim, T.J.; Mohammad, A.M. Synthesis and characterization of nickel oxide (nio) nanoparticles using an environmentally friendly method, and their biomedical applications. Chem. Phys. Lett. 2022, 797, 139564. [Google Scholar] [CrossRef]
  38. Procopio, A.; Gaspari, M.; Nardi, M.; Oliverio, M.; Rosati, O. Highly efficient and versatile chemoselective addition of amines to epoxides in water catalyzed by erbium (iii) triflate. Tetrahedron Lett. 2008, 49, 2289–2293. [Google Scholar] [CrossRef]
  39. Liu, J.; Zhu, Y.; Wang, C.; Singh, T.; Wang, N.; Liu, Q.; Cui, Z.; Ma, L. Facile synthesis of controllable graphene-co-shelled reusable ni/nio nanoparticles and their application in the synthesis of amines under mild conditions. Green Chem. 2020, 22, 7387–7397. [Google Scholar] [CrossRef]
  40. Alsboul, M.; Ghazali, M.S.M.; Gomaa, M.R.; Albani, A. Experimental and theoretical investigations of the thermal conductivity of erbium oxide/ethylene glycol nanofluids for thermal energy applications. Chem. Eng. Technol. 2022, 45, 2139–2149. [Google Scholar] [CrossRef]
  41. Sahoo, P.; Misra, D.K.; Chaubey, G.S.; Salvador, J.; Takas, N.J.; Poudeu, P.F. Thermal conductivity of nickel oxide nanoparticles synthesized by combustion method. MRS Online Proc. Libr. 2010, 1256, 621. [Google Scholar] [CrossRef]
  42. Soares, L.; Pérez-Herrera, R.A.; Novais, S.; Ferreira, A.; Silva, S.; Frazão, O. Measurement of Paracetamol Concentration Using an Erbium-Doped Fiber Ring Cavity. Photonics 2023, 10, 50. [Google Scholar] [CrossRef]
  43. Ahmad, W.; Kaur, N.; Joshi, H.C. Photocatalytic behavior of nio nanoparticles towards photocatalytic degradation of paracetamol. Mater. Today Proc. 2023, 73, 36–40. [Google Scholar] [CrossRef]
  44. Balarak, D.; Mostafapour, F.K. Photocatalytic degradation of amoxicillin using uv/synthesized nio from pharmaceutical wastewater. Indones. J. Chem. 2019, 19, 211–218. [Google Scholar] [CrossRef]
  45. Khalil, A.T.; Ovais, M.; Ullah, I.; Ali, M.; Shinwari, Z.K.; Hassan, D.; Maaza, M. Sageretiathea (osbeck.) modulated biosynthesis of nio nanoparticles and their in vitro pharmacognostic, antioxidant and cytotoxic potential. Artif. CellsNanomed. Biotechnol. 2018, 46, 838–852. [Google Scholar] [CrossRef]
  46. Luyo, C.; Ionescu, R.; Reyes, L.; Topalian, Z.; Estrada, W.; Llobet, E.; Granqvist, C.-G.; Heszler, P. Gas sensing response of nio nanoparticle films made by reactive gas deposition. Sens. Actuators B Chem. 2009, 138, 14–20. [Google Scholar] [CrossRef]
  47. Karimi-Maleh, H.; Sanati, A.L.; Gupta, V.K.; Yoosefian, M.; Asif, M.; Bahari, A. A voltammetric biosensor based on ionic liquid/nio nanoparticle modified carbon paste electrode for the determination of nicotinamide adenine dinucleotide (nadh). Sens. Actuators B Chem. 2014, 204, 647–654. [Google Scholar] [CrossRef]
  48. Hadi, A.A.; Taha, J.M.; Mahdi, R.O.; Khashan, K.S. Influence of Laser Pulse on Properties of NioNps Prepared by Laser Ablation in Liquid; AIP Publishing LLC: Melville, NY, USA, 2020; p. 020308. [Google Scholar]
  49. Sun, D.-L.; Zhao, B.-W.; Liu, J.-B.; Wang, H.; Yan, H. Application of nickel oxide nanoparticles in electrochromic materials. Ionics 2017, 23, 1509–1515. [Google Scholar] [CrossRef]
  50. Chai, S.-S.; Zhang, W.-B.; Yang, J.-L.; Zhang, L.; Theint, M.M.; Zhang, X.-L.; Guo, S.-B.; Zhou, X.; Ma, X.-J. Sustainability applications of rare earths from metallurgy, magnetism, catalysis, luminescence to future electrochemical pseudocapacitance energy storage. RSC Sustain. 2023, 1, 38–71. [Google Scholar] [CrossRef]
  51. Wang, K.; Li, L.; Zhang, H. A novel synthesis of nickel oxide and its electrochemical performances. Int. J. Electrochem. Sci. 2013, 8, 4785–4791. [Google Scholar]
  52. Liu, M.; Wang, X.; Zhu, D.; Li, L.; Duan, H.; Xu, Z.; Wang, Z.; Gan, L. Encapsulation of nio nanoparticles in mesoporous carbon nanospheres for advanced energy storage. Chem. Eng. J. 2017, 308, 240–247. [Google Scholar] [CrossRef]
  53. Kralova, K.; Jampilek, J. Applications of nanomaterials in plant disease management and protection. In Nanotechnology in Agriculture and Agroecosystems; Elsevier: Amsterdam, The Netherlands, 2023; pp. 239–296. [Google Scholar]
  54. Spormann, S.; Sousa, F.; Oliveira, F.; Ferreira, V.; Teixeira, B.; Pereira, C.; Soares, C.; Fidalgo, F. Ascorbate supplementation: A blessing in disguise for tomato seedlings exposed to nio nanoparticles. Agriculture 2022, 12, 1546. [Google Scholar] [CrossRef]
  55. Kuhn, R.; Bryant, I.M.; Jensch, R.; Böllmann, J. Applications of environmental nanotechnologies in remediation, wastewater treatment, drinking water treatment, and agriculture. Appl. Nano 2022, 3, 54–90. [Google Scholar] [CrossRef]
  56. Kabir, M.H.; Hossain, M.; Jalil, M.; Hossain, M.; Ali, M.; Khandaker, M.; Jana, D.; Rahman, M.M.; Hossain, M.K.; Uddin, M. Enhancement of photocatalytic performance of v2o5 by rare-earth ions doping, synthesized by facile hydrothermal technique. arXiv 2023, arXiv:2301.06666. [Google Scholar]
  57. Voncken, J.H.L. Applications of the rare earths. In The Rare Earth Elements: An Introduction; Springer International Publishing: Cham, Switzerland, 2016; pp. 89–106. [Google Scholar]
  58. Boikanyo, D.; Mishra, S.; Nxumalo, E.; Mhlanga, S.; Mishra, A. Erbium and mwcnt-modified titanium dioxide nanocomposites for the photocatalytic degradation of azo dyes. WRC Rep. 2019. [Google Scholar]
  59. Gaggero, E.; Calza, P.; Cerrato, E.; Paganini, M.C. Cerium-, europium-and erbium-modified zno and zro2 for photocatalytic water treatment applications: A review. Catalysts 2021, 11, 1520. [Google Scholar] [CrossRef]
  60. Zhao, B.; Ke, X.-K.; Bao, J.-H.; Wang, C.-L.; Dong, L.; Chen, Y.-W.; Chen, H.-L. Synthesis of flower-like nio and effects of morphology on its catalytic properties. J. Phys. Chem. C 2009, 113, 14440–14447. [Google Scholar] [CrossRef]
  61. Medeiros, S.E.; da Silva, R.B.; Gomes, K.C.; Silva, V.D.; Gonçalves, J.A.; Macedo, D.A.; Lourenço, A.A.; da Silva, F.F.; Azevedo, S. Influence of particle size on the electrocatalytic activity and optical properties of nio nanoparticles. Mater. Sci. Eng. B 2023, 289, 116266. [Google Scholar] [CrossRef]
  62. Akhtar, K.; Khan, S.B.; Bakhsh, E.M.; Asiri, A.M. A nanocomposite of nickel oxide-tin oxide and carboxymethylcellulose coated cotton fibres for catalytic reduction of water pollutants. J. Mol. Liq. 2023, 375, 121275. [Google Scholar] [CrossRef]
  63. Subhan, M.A.; Saha, P.C.; Hossain, M.A.; Alam, M.; Asiri, A.M.; Rahman, M.M.; Al-Mamun, M.; Rifat, T.P.; Raihan, T.; Azad, A. Photocatalysis, photoinduced enhanced anti-bacterial functions and development of a selective m-tolyl hydrazine sensor based on mixed ag· nimn 2 o 4 nanomaterials. RSC Adv. 2020, 10, 30603–30619. [Google Scholar] [CrossRef]
  64. Schmidt, E. One Hundred Years of Hydrazine Chemistry. In Proceedings of the 3rd Conference on the Environmental Chemistry of Hydrazine Fuels, Panama City, FL, USA, 15–17 September 1987. [Google Scholar]
  65. Samuelson, A. Inorganic Hydrazine Derivatives: Synthesis, Properties and Applications; John Wiley & Sons Ltd.: Hoboken, NJ, USA, 2016. [Google Scholar]
  66. Schiessl, H.W. Hydrazine and its derivatives. Kirk-OthmerEncycl. Chem. Technol. 2000. [Google Scholar] [CrossRef]
  67. Ragnarsson, U. Synthetic methodology for alkyl substituted hydrazines. Chem. Soc. Rev. 2001, 30, 205–213. [Google Scholar] [CrossRef]
  68. Rahman, M.M.; Alam, M.; Alamry, K.A. Sensitive and selective m-tolyl hydrazine chemical sensor development based on cdo nanomaterial decorated multi-walled carbon nanotubes. J. Ind. Eng. Chem. 2019, 77, 309–316. [Google Scholar] [CrossRef]
  69. Vernot, E.; MacEwen, J.; Bruner, R.; Haun, C.; Kinkead, E.; Prentice, D.; Hall III, A.; Schmidt, R.; Eason, R.; Hubbard, G. Long-term inhalation toxicity of hydrazine. Fundam. Appl. Toxicol. 1985, 5, 1050–1064. [Google Scholar] [CrossRef]
  70. Kimball, R. The mutagenicity of hydrazine and some of its derivatives. Mutat. Res. /Rev. Genet. Toxicol. 1977, 39, 111–126. [Google Scholar] [CrossRef]
  71. Zelnick, S.D.; Mattie, D.R.; Stepaniak, P.C. Occupational exposure to hydrazines: Treatment of acute central nervous system toxicity. Aviat. Space Environ. Med. 2003, 74, 1285–1291. [Google Scholar] [PubMed]
  72. Oh, J.-A.; Shin, H.-S. Simple and sensitive determination of hydrazine in drinking water by ultra-high-performance liquid chromatography–tandem mass spectrometry after derivatization with naphthalene-2, 3-dialdehyde. J. Chromatogr. A 2015, 1395, 73–78. [Google Scholar] [CrossRef] [PubMed]
  73. Smolenkov, A. Chromatographic methods of determining hydrazine and its polar derivatives. Rev. J. Chem. 2012, 2, 329–354. [Google Scholar] [CrossRef]
  74. Mori, M.; Tanaka, K.; Xu, Q.; Ikedo, M.; Taoda, H.; Hu, W. Highly sensitive determination of hydrazine ion by ion-exclusion chromatography with ion-exchange enhancement of conductivity detection. J. Chromatogr. A 2004, 1039, 135–139. [Google Scholar] [CrossRef] [PubMed]
  75. Rawat, J.; Bhattacharjee, P. Spectrophotometric determination of phenylhydrazine with ammonium molybdate. Microchim. Acta 1976, 66, 619–624. [Google Scholar] [CrossRef]
  76. Kosyakov, D.; Amosov, A.; Ul’yanovskii, N.; Ladesov, A.; Khabarov, Y.G.; Shpigun, O. Spectrophotometric determination of hydrazine, methylhydrazine, and 1, 1-dimethylhydrazine with preliminary derivatization by 5-nitro-2-furaldehyde. J. Anal. Chem. 2017, 72, 171–177. [Google Scholar] [CrossRef]
  77. Safavi, A.; Karimi, M.A. Flow injection chemiluminescence determination of hydrazine by oxidation with chlorinated isocyanurates. Talanta 2002, 58, 785–792. [Google Scholar] [CrossRef]
  78. Liu, J.; Jiang, J.; Dou, Y.; Zhang, F.; Liu, X.; Qu, J.; Zhu, Q. A novel chemiluminescent probe for hydrazine detection in water and hela cells. Org. Biomol. Chem. 2019, 17, 6975–6979. [Google Scholar] [CrossRef] [PubMed]
  79. Oh, J.-A.; Park, J.-H.; Shin, H.-S. Sensitive determination of hydrazine in water by gas chromatography–mass spectrometry after derivatization with ortho-phthalaldehyde. Anal. Chim. Acta 2013, 769, 79–83. [Google Scholar] [CrossRef]
  80. Sun, M.; Bai, L.; Liu, D.Q. A generic approach for the determination of trace hydrazine in drug substances using in situ derivatization-headspace gc–ms. J. Pharm. Biomed. Anal. 2009, 49, 529–533. [Google Scholar] [CrossRef] [PubMed]
  81. Smolenkov, A.; Rodin, I.; Shpigun, O. Spectrophotometric and fluorometric methods for the determination of hydrazine and its methylated analogues. J. Anal. Chem. 2012, 67, 98–113. [Google Scholar] [CrossRef]
  82. Erdemir, S.; Malkondu, S. A colorimetric and fluorometric probe for hydrazine through subsequent ring-opening and closing reactions: Its environmental applications. Microchem. J. 2020, 152, 104375. [Google Scholar] [CrossRef]
  83. Siangproh, W.; Chailapakul, O.; Laocharoensuk, R.; Wang, J. Microchip capillary electrophoresis/electrochemical detection of hydrazine compounds at a cobalt phthalocyanine modified electrochemical detector. Talanta 2005, 67, 903–907. [Google Scholar] [CrossRef] [PubMed]
  84. Liu, J.; Zhou, W.; You, T.; Li, F.; Wang, E.; Dong, S. Detection of hydrazine, methylhydrazine, and isoniazid by capillary electrophoresis with a palladium-modified microdisk array electrode. Anal. Chem. 1996, 68, 3350–3353. [Google Scholar] [CrossRef] [PubMed]
  85. Wang, J.; Chatrathi, M.P.; Tian, B.; Polsky, R. Capillary electrophoresis chips with thick-film amperometric detectors: Separation and detection of hydrazine compounds. Electroanal. Int. J. Devoted Fundam. Pract. Asp. Electroanal. 2000, 12, 691–694. [Google Scholar] [CrossRef]
  86. Oh, J.-A.; Shin, H.-S. Simple determination of hydrazine in waste water by headspace solid-phase micro extraction and gas chromatography-tandem mass spectrometry after derivatization with trifluoro pentanedione. Anal. Chim. Acta 2017, 950, 57–63. [Google Scholar] [CrossRef]
  87. Kato, T.; Sugahara, S.; Kajitani, T.; Senga, Y.; Egawa, M.; Kamiya, H.; Seike, Y. Determination of trace hydrazine in environmental water samples by in situ solid phase extraction. Anal. Sci. 2017, 33, 487–491. [Google Scholar] [CrossRef]
  88. Tiwari, I.; Gupta, M.; Sinha, P.; Aggarwal, S. Electro-oxidation of phenyl hydrazine on a modified electrode constructed using nanocomposite of ruthenium terpyridyl complex, multiwalled carbon nanotubes and nafion. Electrochim. Acta 2012, 76, 106–111. [Google Scholar] [CrossRef]
  89. Afzali, D.; Karimi-Maleh, H.; Khalilzadeh, M.A. Sensitive and selective determination of phenylhydrazine in the presence of hydrazine at a ferrocene-modified carbon nanotube paste electrode. Environ. Chem. Lett. 2011, 9, 375–381. [Google Scholar] [CrossRef]
  90. Srinidhi, G.; Sudalaimani, S.; Giribabu, K.; Basha, S.S.; Suresh, C. Amperometric determination of hydrazine using a cus-ordered mesoporous carbon electrode. Microchim. Acta 2020, 187, 359. [Google Scholar] [CrossRef] [PubMed]
  91. Rahman, H.A.; Rafi, M.; Putra, B.R.; Wahyuni, W.T. Electrochemical sensors based on a composite of electrochemically reduced graphene oxide and pedot: Pss for hydrazine detection. ACS Omega. 2023, 8, 3258–3269. [Google Scholar] [CrossRef]
  92. Alsalme, A.; Alsaeedi, H. Fabrication of selective and sensitive hydrazine sensor using sol-gel synthesized mose2 as efficient electrode modifier. Crystals 2023, 13, 161. [Google Scholar] [CrossRef]
  93. Khalifeh, S. Polymers in Organic Electronics: Polymer Selection for Electronic, Mechatronic, and Optoelectronic Systems; Elsevier: Amsterdam, The Netherlands, 2020. [Google Scholar]
  94. Rahimi-Nasrabadi, M.; Pourmortazavi, S.M.; Karimi, M.S.; Aghazadeh, M.; Ganjali, M.R.; Norouzi, P. Statistical optimization of experimental parameters for synthesis of two efficient photocatalyst: Erbium carbonate and erbium oxide nanoparticles. J. Mater. Sci. Mater. Electron. 2017, 28, 15224–15232. [Google Scholar] [CrossRef]
  95. Siddique, M.N.; Ahmed, A.; Ali, T.; Tripathi, P. Investigation of Optical Properties of Nickel Oxide Nanostructures Using Photoluminescence and Diffuse Reflectance Spectroscopy; AIP Publishing LLC: Melville, NY, USA, 2018; p. 030027. [Google Scholar]
  96. Khairnar, S.D.; Shrivastava, V.S. Facile synthesis of nickel oxide nanoparticles for the degradation of methylene blue and rhodamine b dye: A comparative study. J. Taibah Univ. Sci. 2019, 13, 1108–1118. [Google Scholar] [CrossRef]
  97. Bodurov, G.; Stefchev, P.; Ivanova, T.; Gesheva, K. Investigation of electrodeposited nio films as electrochromic material for counter electrodes in “smart windows”. Mater. Lett. 2014, 117, 270–272. [Google Scholar] [CrossRef]
  98. Pham, T.M.H.; Nguyen, N.S.; Le, T.T.; Nguyen, T.H.; Pham, H.N.; Nguyen, T.H. Facile ultrasound-assisted green synthesis of nio/chitosan nanocomposite from mangosteen peel extracts as antibacterial agents. J. Nanomater. 2022, 10, 2022. [Google Scholar] [CrossRef]
  99. Castañeda-Contreras, J.; Marañón-Ruiz, V.; Meneses-Nava, M.; Pérez-Ladrón de Guevara, H.; Rodríguez Rojas, R.; Chiu-Zárate, R. Properties of er2o3 nanoparticles synthesized by a modified co-precipitation method. Rev. Mex. Física 2015, 61, 127–131. [Google Scholar]
  100. Xu, W.; Min, X.; Chen, X.; Zhu, Y.; Zhou, P.; Cui, S.; Xu, S.; Tao, L.; Song, H. Ag-sio2-er2o3 nanocomposites: Highly effective upconversion luminescence at high power excitation and high temperature. Sci. Rep. 2014, 4, 5087. [Google Scholar] [CrossRef] [PubMed]
  101. Alagiri, M.; Ponnusamy, S.; Muthamizhchelvan, C. Synthesis and characterization of nio nanoparticles by sol–gel method. J. Mater. Sci. Mater. Electron. 2012, 23, 728–732. [Google Scholar] [CrossRef]
  102. Rahdar, A.; Aliahmad, M.; Azizi, Y. Nio nanoparticles: Synthesis and characterization. J. Nanostructures. 2015, 5, 145–151. [Google Scholar]
  103. Li, X.; Wu, P.; Qiu, H.; Chen, S.; Song, B. Crystallization behavior and mechanical properties of erbium oxide coatings fabricated by pulsed magnetron sputtering. Thin Solid Film. 2012, 520, 2316–2320. [Google Scholar] [CrossRef]
  104. Xu, D.; Fan, D.; Shen, W. Catalyst-free direct vapor-phase growth of zn1−xcuxo micro-cross structures and their optical properties. Nanoscale Res. Lett. 2013, 8, 46. [Google Scholar] [CrossRef]
  105. Liu, F.; Wang, X.; Hao, J.; Han, S.; Lian, J.; Jiang, Q. High density arrayed ni/nio core-shell nanospheres evenly distributed on graphene for ultrahigh performance supercapacitor. Sci. Rep. 2017, 7, 17709. [Google Scholar] [CrossRef]
  106. Liu, W.; Lu, C.; Wang, X.; Liang, K.; Tay, B.K. In situ fabrication of three-dimensional, ultrathin graphite/carbon nanotube/nio composite as binder-free electrode for high-performance energy storage. J. Mater. Chem. A 2015, 3, 624–633. [Google Scholar] [CrossRef]
  107. Mishra, S.; Yogi, P.; Sagdeo, P.; Kumar, R. Mesoporous nickel oxide (nio) nanopetals for ultrasensitive glucose sensing. Nanoscale Res. Lett. 2018, 13, 16. [Google Scholar] [CrossRef] [PubMed]
  108. Sakamoto, T.; Matsumura, D.; Asazawa, K.; Martinez, U.; Serov, A.; Artyushkova, K.; Atanassov, P.; Tamura, K.; Nishihata, Y.; Tanaka, H. Operando xafs study of carbon supported ni, nizn, and co catalysts for hydrazine electrooxidation for use in anion exchange membrane fuel cells. Electrochim. Acta 2015, 163, 116–122. [Google Scholar] [CrossRef]
  109. Manukyan, K.V.; Cross, A.; Rouvimov, S.; Miller, J.; Mukasyan, A.S.; Wolf, E.E. Low temperature decomposition of hydrous hydrazine over feni/cu nanoparticles. Appl. Catal. A Gen. 2014, 476, 47–53. [Google Scholar] [CrossRef]
  110. Tamašauskaitė-Tamašiūnaitė, L.; Rakauskas, J.; Balčiūnaitė, A.; Zabielaitė, A.; Vaičiūnienė, J.; Selskis, A.; Juškėnas, R.; Pakštas, V.; Norkus, E. Gold–nickel/titania nanotubes as electrocatalysts for hydrazine oxidation. J. Power Sources 2014, 272, 362–370. [Google Scholar] [CrossRef]
  111. Thomas, J.; Radhika, S.; Yoon, M. Nd3+-doped tio2 nanoparticles incorporated with heteropoly phosphotungstic acid: A novel solar photocatalyst for degradation of 4-chlorophenol in water. J. Mol. Catal. A Chem. 2016, 411, 146–156. [Google Scholar] [CrossRef]
  112. Nezamzadeh-Ejhieh, A.; Hushmandrad, S. Solar photodecolorization of methylene blue by cuo/x zeolite as a heterogeneous catalyst. Appl. Catal. A Gen. 2010, 388, 149–159. [Google Scholar] [CrossRef]
  113. Xu, L.; Wang, J. A heterogeneous fenton-like system with nanoparticulate zero-valent iron for removal of 4-chloro-3-methyl phenol. J. Hazard. Mater. 2011, 186, 256–264. [Google Scholar] [CrossRef]
  114. Nezamzadeh-Ejhieh, A.; Khodabakhshi-Chermahini, F. Incorporated zno onto nano clinoptilolite particles as the active centers in the photodegradation of phenylhydrazine. J. Ind. Eng. Chem. 2014, 20, 695–704. [Google Scholar] [CrossRef]
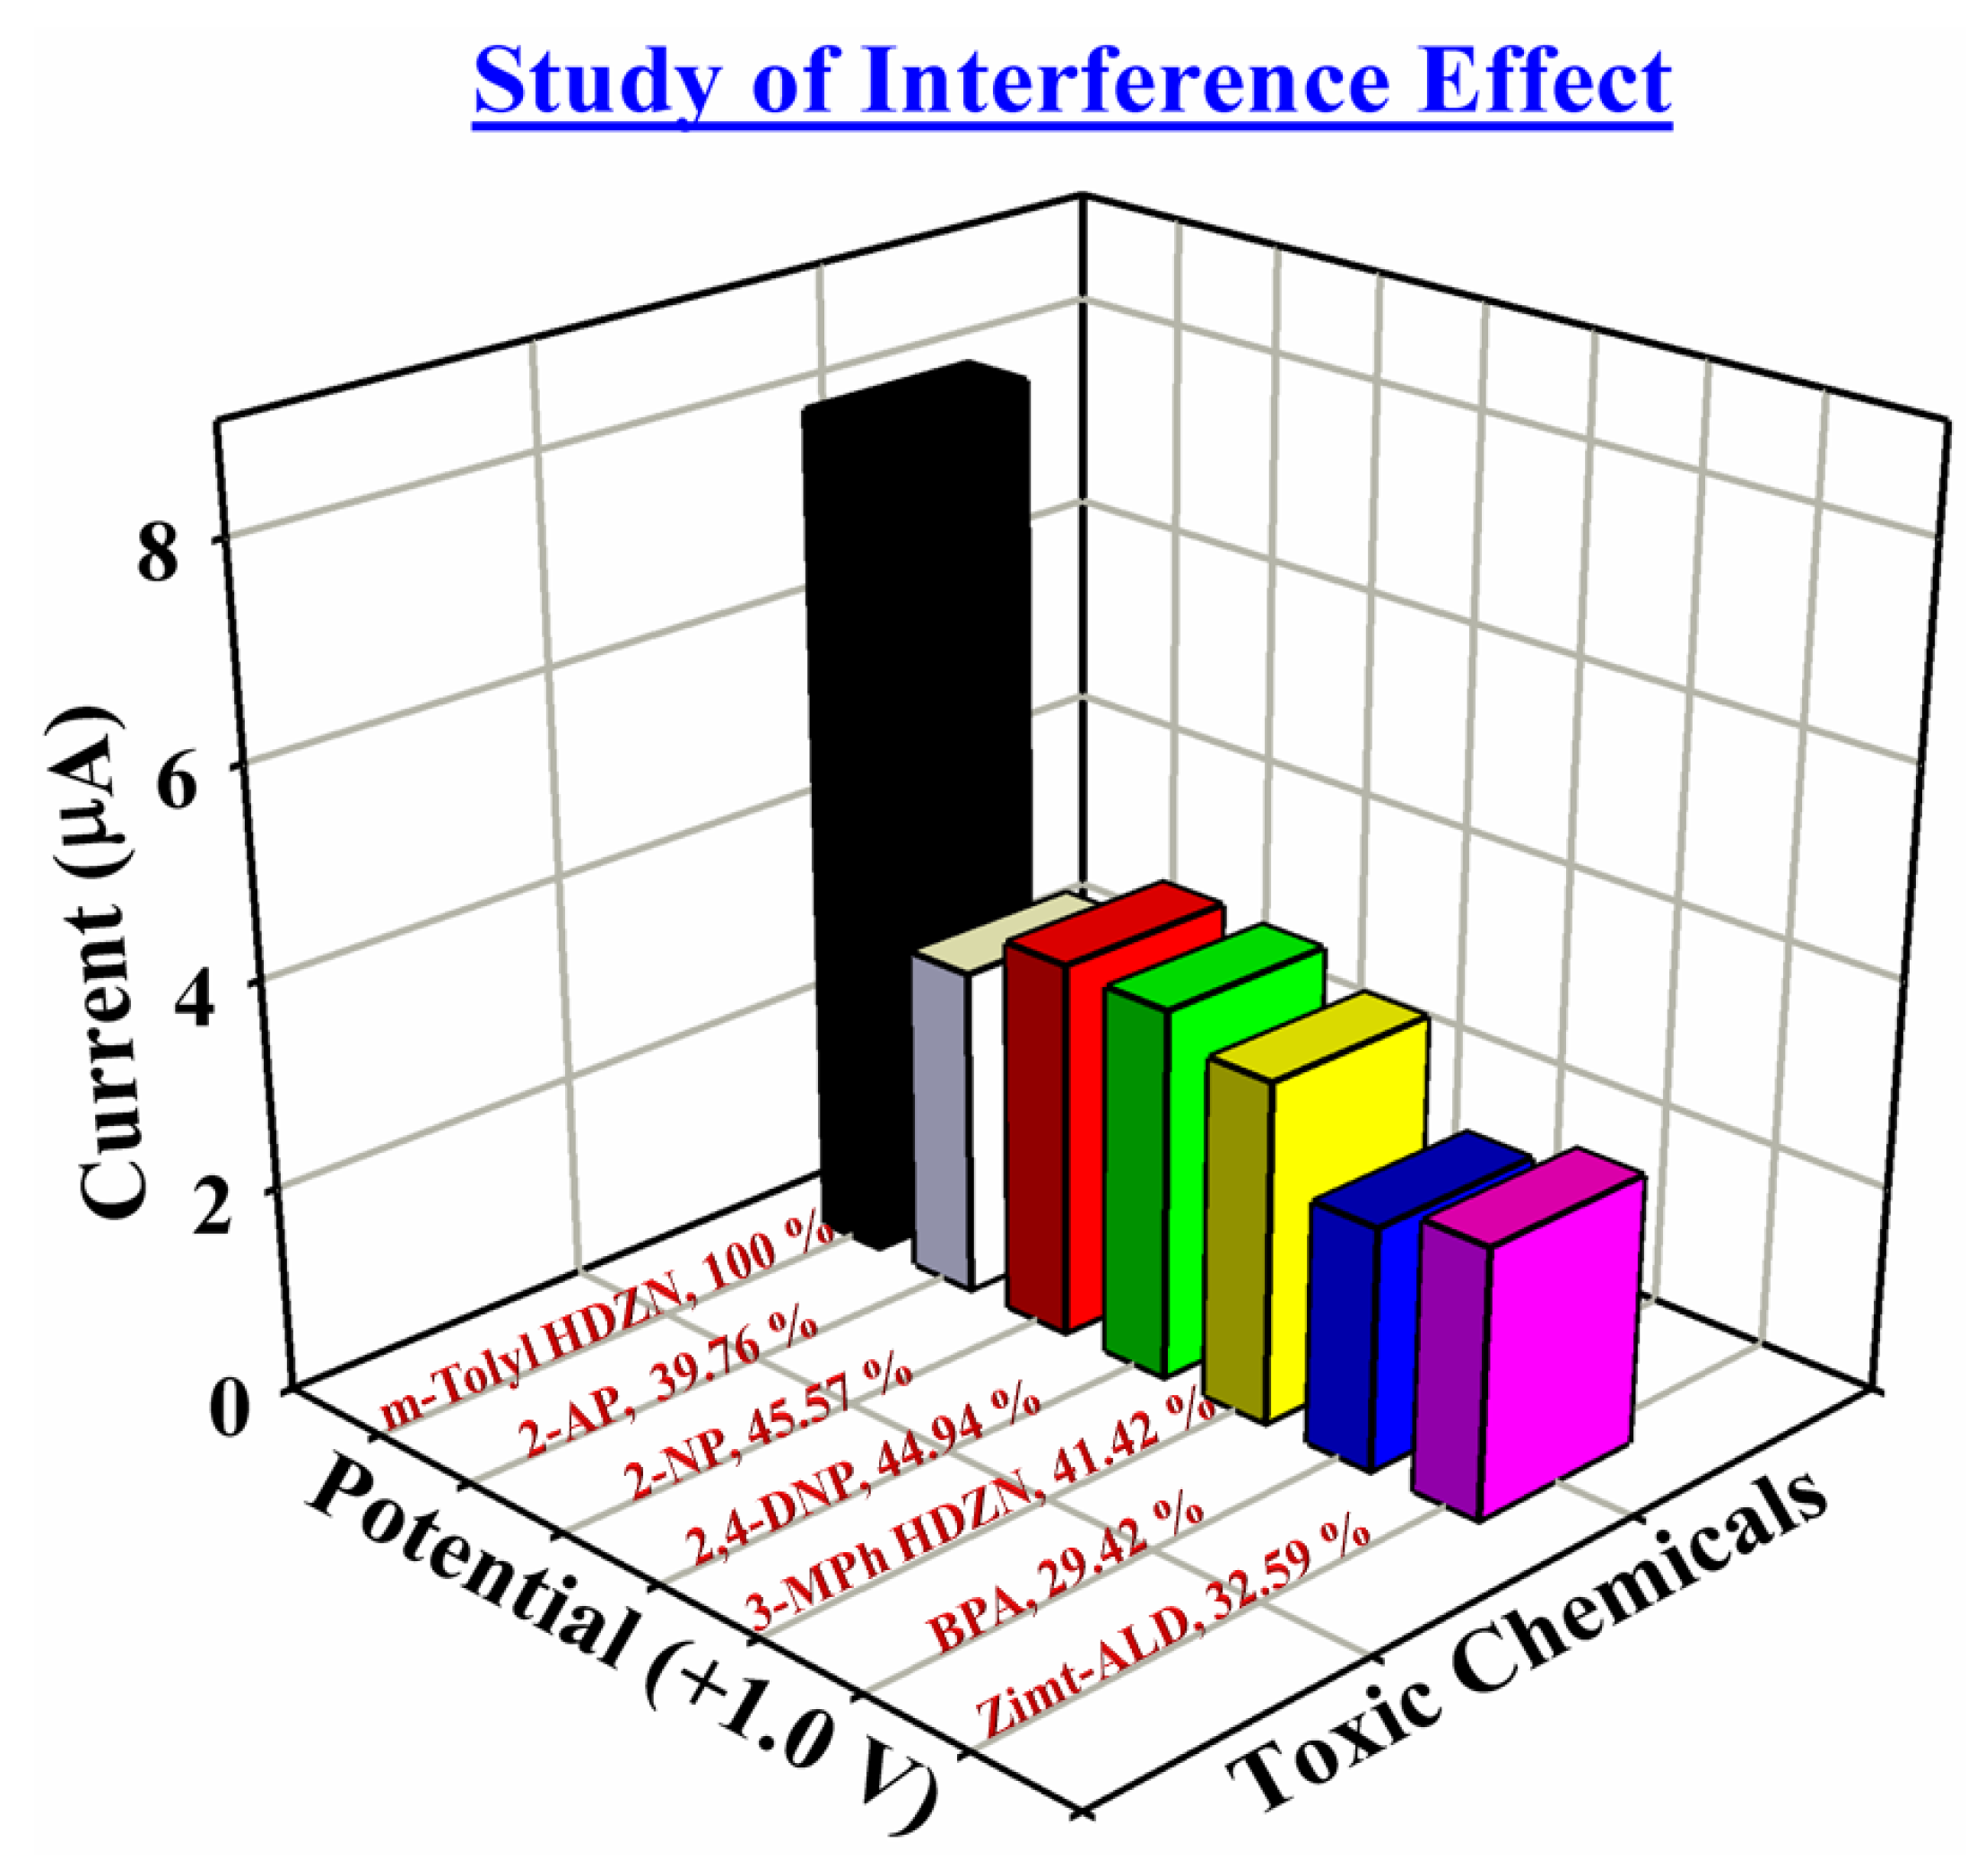
Figure 1. UV/Vis and PL characterization of Er2O3@NiO NC; (a) UV spectrum; (b) bandgap energy plot; (c) PL emission spectrum.
Catalysts 13 00905 g001
Figure 2. FTIR characterization of Er2O3@NiO NC; (a) FTIR before calcination; (b) FTIR after calcinationat 650 °C; (c) comparison of (a,b).
Catalysts 13 00905 g002
Figure 3. XRD pattern of the Er2O3@NiO NC.
Catalysts 13 00905 g003
Figure 4. Evaluation of binding energy analysis (XPS) of Er2O3@NiONC at normal conditions: (a) full spectra of Er2O3@NiONC; (b) Er4d; (c) Ni 2P3/2; (d) O1s.
Catalysts 13 00905 g004
Figure 5. Morphological and elemental analysis of Er2O3@NiO NC: (a,b) low-to high-magnification FESEM images; (c,d) EDS spectrum for the calcined Er2O3@NiO NC.
Catalysts 13 00905 g005
Figure 6. (a)Surface area analysis using BET for Er2O3@NiO NC; (b) Nyquist plot for bare and Er2O3@NiO NC modified GCE.
Catalysts 13 00905 g006
Figure 7. I–V response of modified GCE and selectivity study: (a) I–V response of bare, Nafion-coated, and Er2O3@NiO NCs/Nafion/GCE, potential range: 0 to +1.5 V; (b) selectivity study with various toxic analytes in the presence of m-toylyhydrazine; (c) I–V response of coated GCE with and without m-Tolyl HDZN; (d) I–V comparison of bare and coated GCE without and with m-Tolyl HDZN.
Catalysts 13 00905 g007
Figure 8. Interference effect and current response of analytes at +1.5 V (interference effect of m-Tolyl HDZN was considered to be 100%).
Catalysts 13 00905 g008
Scheme 1. (a)I–V response of coated GCE without m-Tolyl HDZN;(b) I–V response of coated GCE with m-Tolyl HDZN; (c) comparison of (a,b); (d) probable electrocatalytic degradation mechanism of m-Tolyl HDZN on Er2O3@NiO-NC/Nafion/GCE.
Catalysts 13 00905 sch001
Scheme 2. Suggested mechanism for the degradation of m-Tolyl HDZN.
Catalysts 13 00905 sch002
Figure 9. Optimization of m-Tolyl HDZN sensor; (a) concentration variation plot of m-Tolyl HDZN ranging from 1.0 mM to 1.0 pM; (b) calibration plot of Er2O3@NiO-NC/Nafion/GCE.
Catalysts 13 00905 g009
Figure 10. Response time plot: (a) current vs. time plot to check the time of response of Er2O3@NiO-NC/Nafion/GCE towards m-Tolyl HDZN; (b) magnified view of the response time of the electrochemical sensor with delayed time of 1 s.
Catalysts 13 00905 g010
Figure 11. Repeatability andstabilitytest: (a) repeatability test of 1 to 12 runs; (b) stability and reproducibility test for 15 days. A quantity of 25.0 µL of 0.1 µM of our target analyte was taken for each trial in repeatability and stability tests.
Catalysts 13 00905 g011
Figure 12. Control experiment: (a) I–V responses of other nanomaterials for the detection of m-Tolylhydrazine; (b) magnified view of the control experiment from +0.4 V to +1.2 V. This study was conducted under similar circumstances as those used in the previous experiments.
Catalysts 13 00905 g012
Scheme 3. Schematic diagram of the wet chemical process for the synthesis of Er2O3@NiO NC.
Catalysts 13 00905 sch003
Scheme 4. Growth mechanism of Er2O3@NiO NC by the wet chemical process.
Catalysts 13 00905 sch004
Scheme 5. Fabrication of GCE by Er2O3@NiO NC with Nafion as the conducting binder.
Catalysts 13 00905 sch005
Table 1. Interference effect of various toxic chemicals on the Er2O3@NiO-NC/Nafion/GCE sensor.
Metal IonsObserved Current (µA)Interference Effect (%)SD (n = 3)RSD (%) (n = 3)
R1R2R3Average
M-Tolyl HDZN8.07298.13047.95068.05131000.09181.14
2-AP3.18673.2643.1523.200939.750.05731.79
2-NP3.69343.65523.65723.668645.560.02150.59
2,4-DNP3.58913.65933.60563.61844.930.03671.01
3MPh HDZN3.27933.42733.29783.334841.410.08062.42
BPA2.35912.39372.35362.368829.420.02170.92
Zimt-ALD2.63872.63412.59982.624232.590.02130.81
Interference effect of m-Tolyl HDZN is considered to be 100%; R = reading; SD = standard deviation; and RSD = relative standard deviation.
Table 2. Comparison of the proposed I–V method with different previously reported analytical methods for the detection of hydrazine compounds.
Methods/MaterialsAnalytesSensitivityLDR *LOD **LOQ ***Ref
UV SpectrophotometerHydrazine1.5 × 105 pM[76]
Colorimetric/FluorometricHydrazine0.00–100 µM9.40 × 106 pM[82]
ChemiluminescenceHydrazine0.00–500 µM9.30 × 105 pM[78]
UPLC–MS/MSHydrazine93.75 pM312.5 pM[72]
Ion-exclusion chromatographyHydrazine3.1 × 104–3.1 × 10⁹ pM2.0 × 104 pM[74]
HS-SPME and GC-MS/MSHydrazine625–3125 pM62.50 pM218.7 pM[86]
GC-MS Hydrazine1.5 × 103–3.1 × 10⁶ pM62.5 pM218.7 pM[79]
CE-ADHydrazine0.247 nAµM−12.0 × 10⁻⁵–2.0 × 10⁻⁴ M1.5 × 106 pM[85]
AmperometricHydrazine0.915 µAµM−1cm−20.25–40 µM1.0 × 105 pM[90]
CVPhenyl Hydrazine0.02 µAµM−15.0 µM × 0.2 mM1.0 × 105 pM[88]
DPVHydrazine196.7 µAmM−10.2–100 µM1.0 × 104 pM3.0 × 104 pM[91]
LSVHydrazine0.68 µAµM−1cm−20.0–350 µM9.1 × 104 pM[92]
I–V method
CdO/CNT NCs/binder/GCE
m-Tolyl HDZN25.79 µAµM−1cm−20.01 nM–0.1 mM4.0 pM [68]
I–V method
Ag.NiMn2O4nanomaterial/binder/GCE
m-Tolyl HDZN47.27 µAµM−1cm−21.0 pM–0.01 mM0.9 pM [63]
I–V method
Er2O3@NiO-NC/Nafion/GCE
m-Tolyl HDZN14.50 µAµM−1cm−20.1 pM–0.1 mM0.066 pM0.22 pMThis work
* linear dynamic range; ** limit of detection; *** limit of quantification. UPLC-MS/MS = ultra-performance liquid chromatography–tandem mass spectrometry; HS-SPME = headspace solid-phase micro extraction; GC-MS/MS = gas chromatography-tandem mass spectrometry; GC-MS = gas chromatography-mass spectrometry; CE-AD = capillary electrophoresis-amperometric detector; CV = cyclic voltametry; DPV = differential pulse voltammetry; LSV = linear sweep voltametry I–V method = (current–potential) method.
Table 3. Real sample analysis of m-Tolyl HDZN in various environmental samples.
Real SamplesAmount of Hg2+ AddedNo. of
Readings
Measured
Response in (µA)
% RecoveryMean
(% Recovery)
SDRSDSEM
m-Tolyl HDZN0.1 µM, 25 µL--12.771100--------
Industrial effluent0.1 µM, 25 µLR112.24195.897.61.501.540.86
R212.59698.6
R312.54198.2
Plastic baby feeding bottle0.1 µM, 25 µLR113.391104.9102.25.495.373.17
R212.24295.9
R313.511105.8
Plastic mineral water bottle0.1 µM, 25 µLR113.202103.495.86.626.913.82
R211.87593.0
R311.63291.1
Food packaging bag0.1 µM, 25 µLR113.086102.599.74.864.872.80
R212.02094.1
R313.102102.6
SD = standard deviation; RSD = relative standard deviation; SEM = standard error of mean.
Disclaimer/Publisher’s Note: The statements, opinions and data contained in all publications are solely those of the individual author(s) and contributor(s) and not of MDPI and/or the editor(s). MDPI and/or the editor(s) disclaim responsibility for any injury to people or property resulting from any ideas, methods, instructions or products referred to in the content.

