Article

PtCu Nanoparticle Catalyst for Electrocatalytic Glycerol Oxidation: How Does the PtCu Affect to Glycerol Oxidation Reaction Performance by Changing pH Conditions?

1
Chemical & Process Technology Division, Korea Research Institute of Chemical Technology (KRICT), 141 Gajeong-ro, Yuseong-gu, Daejeon 34114, Republic of Korea
2
Department of Chemical and Biomolecular Engineering, Yonsei University, 50 Yonsei-ro, Seodaemun-gu, Seoul 03722, Republic of Korea
3
Department of Chemical Engineering, Pohang University of Science and Technology (POSTECH), 77 Cheongam-ro, Nam-gu, Pohang 37673, Republic of Korea
4
Advanced Materials and Chemical Engineering, University of Science and Technology (UST), 113 Gwahangno, Yuseong-gu, Daejeon 34113, Republic of Korea
*
Authors to whom correspondence should be addressed.
Catalysts 2023, 13(5), 892; https://doi.org/10.3390/catal13050892
Submission received: 4 April 2023 / Revised: 4 May 2023 / Accepted: 11 May 2023 / Published: 15 May 2023
(This article belongs to the Special Issue Theme Issue in Honor of Prof. Dr. Jae Sung Lee)

Abstract

:
In this work, we show that finding and controlling optimum pH environments with Pt-based alloy catalysts can create high catalytic performances for electrocatalytic glycerol oxidation reaction (EGOR). Compared to a Pt/C catalyst, the PtCu/C alloy catalyst has higher reaction rate and turnover frequency (TOF) values by increasing the pH. Specifically, the reaction rate and TOF of the PtCu/C catalyst at pH 13 were 2.93 and 6.65 times higher than those of Pt/C, respectively. The PtCu/C catalyst also showed lower onset potential value and higher mass and specific activities than the Pt/C by increasing the pH. This indicates that the Cu in the PtCu alloy improves the catalytic activity for the EGOR in an OH group-rich environment. In the case of the PtCu/C catalyst at a high pH condition, the selectivities of tartronic acid and oxalic acid tended to increase as the selectivity of lactic acid decreased. This result means that the PtCu alloy follows primary alcohol oxidation pathways, which are more favorable in an OH group-rich environment than with only Pt. This study proposes that it is critical to optimize and control the reaction conditions for developing efficient EGOR catalysts.

1. Introduction

Biodiesel, a substitute for fossil fuels, is a renewable fuel that is produced through the transesterification process from renewable resources such as animal fats, vegetable oils and waste oil [1,2,3,4,5,6,7,8]. The amount of the world biodiesel production is growing at an average annual rate of 42% and is expected to reach about 40 billion liters by 2027 [9,10]. Glycerol is a byproduct generated from the production of biodiesel [6,11]. The supply of glycerol also increases as the production of biodiesel increases rapidly every year, thus making it commercially available in large amounts at reasonable prices (0.3 USD kg−1) [12]. It has become essential in research communities to determine how glycerol can be efficiently converted to more valuable chemicals.
Catalytic glycerol oxidation is a promising method to produce a variety of value-added products and can be performed by electrocatalysis, thermal catalysis, and biological catalysis [13]. Among the various methods of glycerol oxidation, electrocatalytic glycerol oxidation reaction (EGOR) technology is a promising way to generate valuable chemicals—such as dihydroxyacetone (DHA), glyceraldehyde (GAD), glyceric acid (GLA), tartronic acid (TTA), lactic acid (LA), glycolic acid (GCA), oxalic acid (OXA) and formic acid (FA)—by a selective glycerol oxidation reaction at the anode and hydrogen by the hydrogen evolution reaction at the cathode in an electrolytic cell [13,14,15,16,17,18,19,20,21,22,23,24,25,26,27,28,29,30,31,32]. The EGOR can be performed in the presence of water and electrolytes (Na+ or K+/OH in alkaline condition and H+/SO2− in acidic condition). In acidic condition, the electrocatalytic glycerol oxidation generates reaction products (i.e., GAD and GLA), protons and electrons at the anode. The protons are transported to the cathode from the anode via the liquid or solid electrolytes. At the cathode, they combine with the electrons to produce H2 gas. On the other hand, since OH as a catalytic role and a rapid oxidation reaction proceeds, GAD is hardly detected in alkaline conditions. The GLA, GCA, and FA are generated as the major products by an enhanced C-H and C-C bond-breaking ability in the OH condition.
Pt or Au-based materials are considered state-of-the-art electrocatalysts due to their kinetically excellent performance and catalytically stable characteristics for the EGOR. Recently, bimetallic catalysts of Pt with Sb, Bi, Ni, Au, Ru, Sn, Pd, etc, have been used for the EGOR to increase catalytic activity, product selectivity, and catalyst stability by improving the surface properties of catalysts through the interaction between metals [25,33,34,35,36,37,38,39,40,41,42,43,44]. The Pt catalysts with incorporating with Sb and Bi demonstrated highly selective production of DHA from electrocatalytic glycerol oxidation in acidic condition. The AuPt catalyst also produced the LA from the electrochemical glycerol oxidation in alkaline condition. Most studies with the Pt-based catalysts have been conducted in a specific pH condition. Understanding and revealing how the Pt-based alloys can exhibit optimal catalytic performances at a variety of reaction pH conditions should be established more in detail.
Here we report on how, compared to Pt/C, a bimetallic PtCu/C catalyst affects the reaction performance and chemistry by changing pH conditions for the EGOR. This will allow us to understand and explain the catalytic role of Cu in PtCu/C at different pH conditions for the EGOR. Interestingly, the PtCu/C alloy catalyst has a higher reaction rate and higher turnover frequency (TOF) values with an increase in pH compared to Pt/C catalyst, suggesting that the Cu in a PtCu combination enhances the catalytic activity for the EGOR in an OH- group-rich environment. In addition, the PtCu alloy changes to primary alcohol oxidation pathways that are favorable for the EGOR in an OH group-rich environment compared to only Pt, leading to an increase in TTA and OXA selectivities. In this study, we also investigated and analyzed the promotional effect of a Cu addition in Pt for the EGOR, with detailed physicochemical and electrochemical characterizations.

2. Results and Discussion

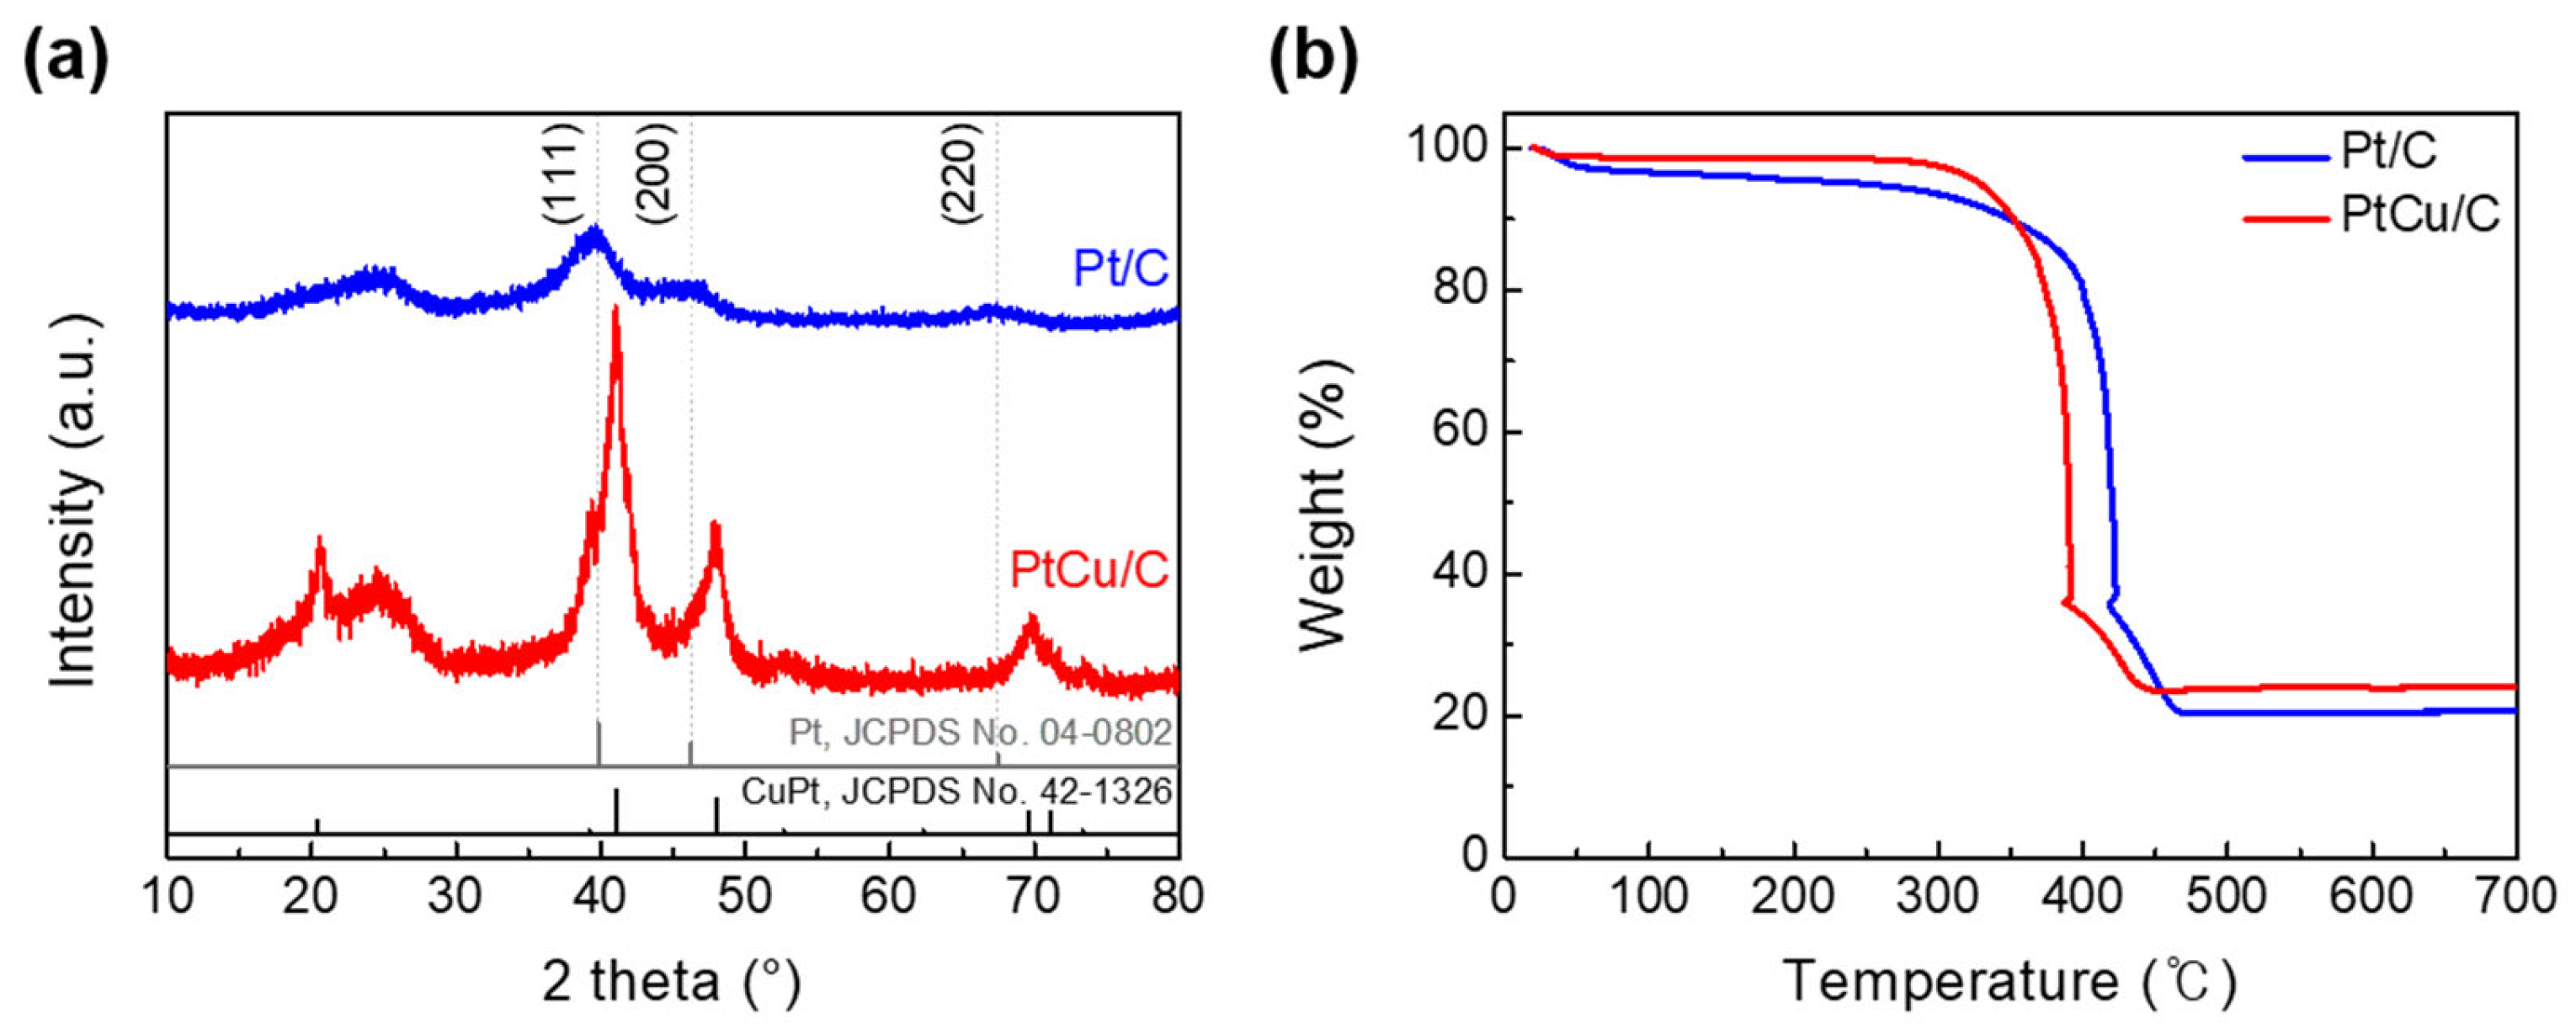
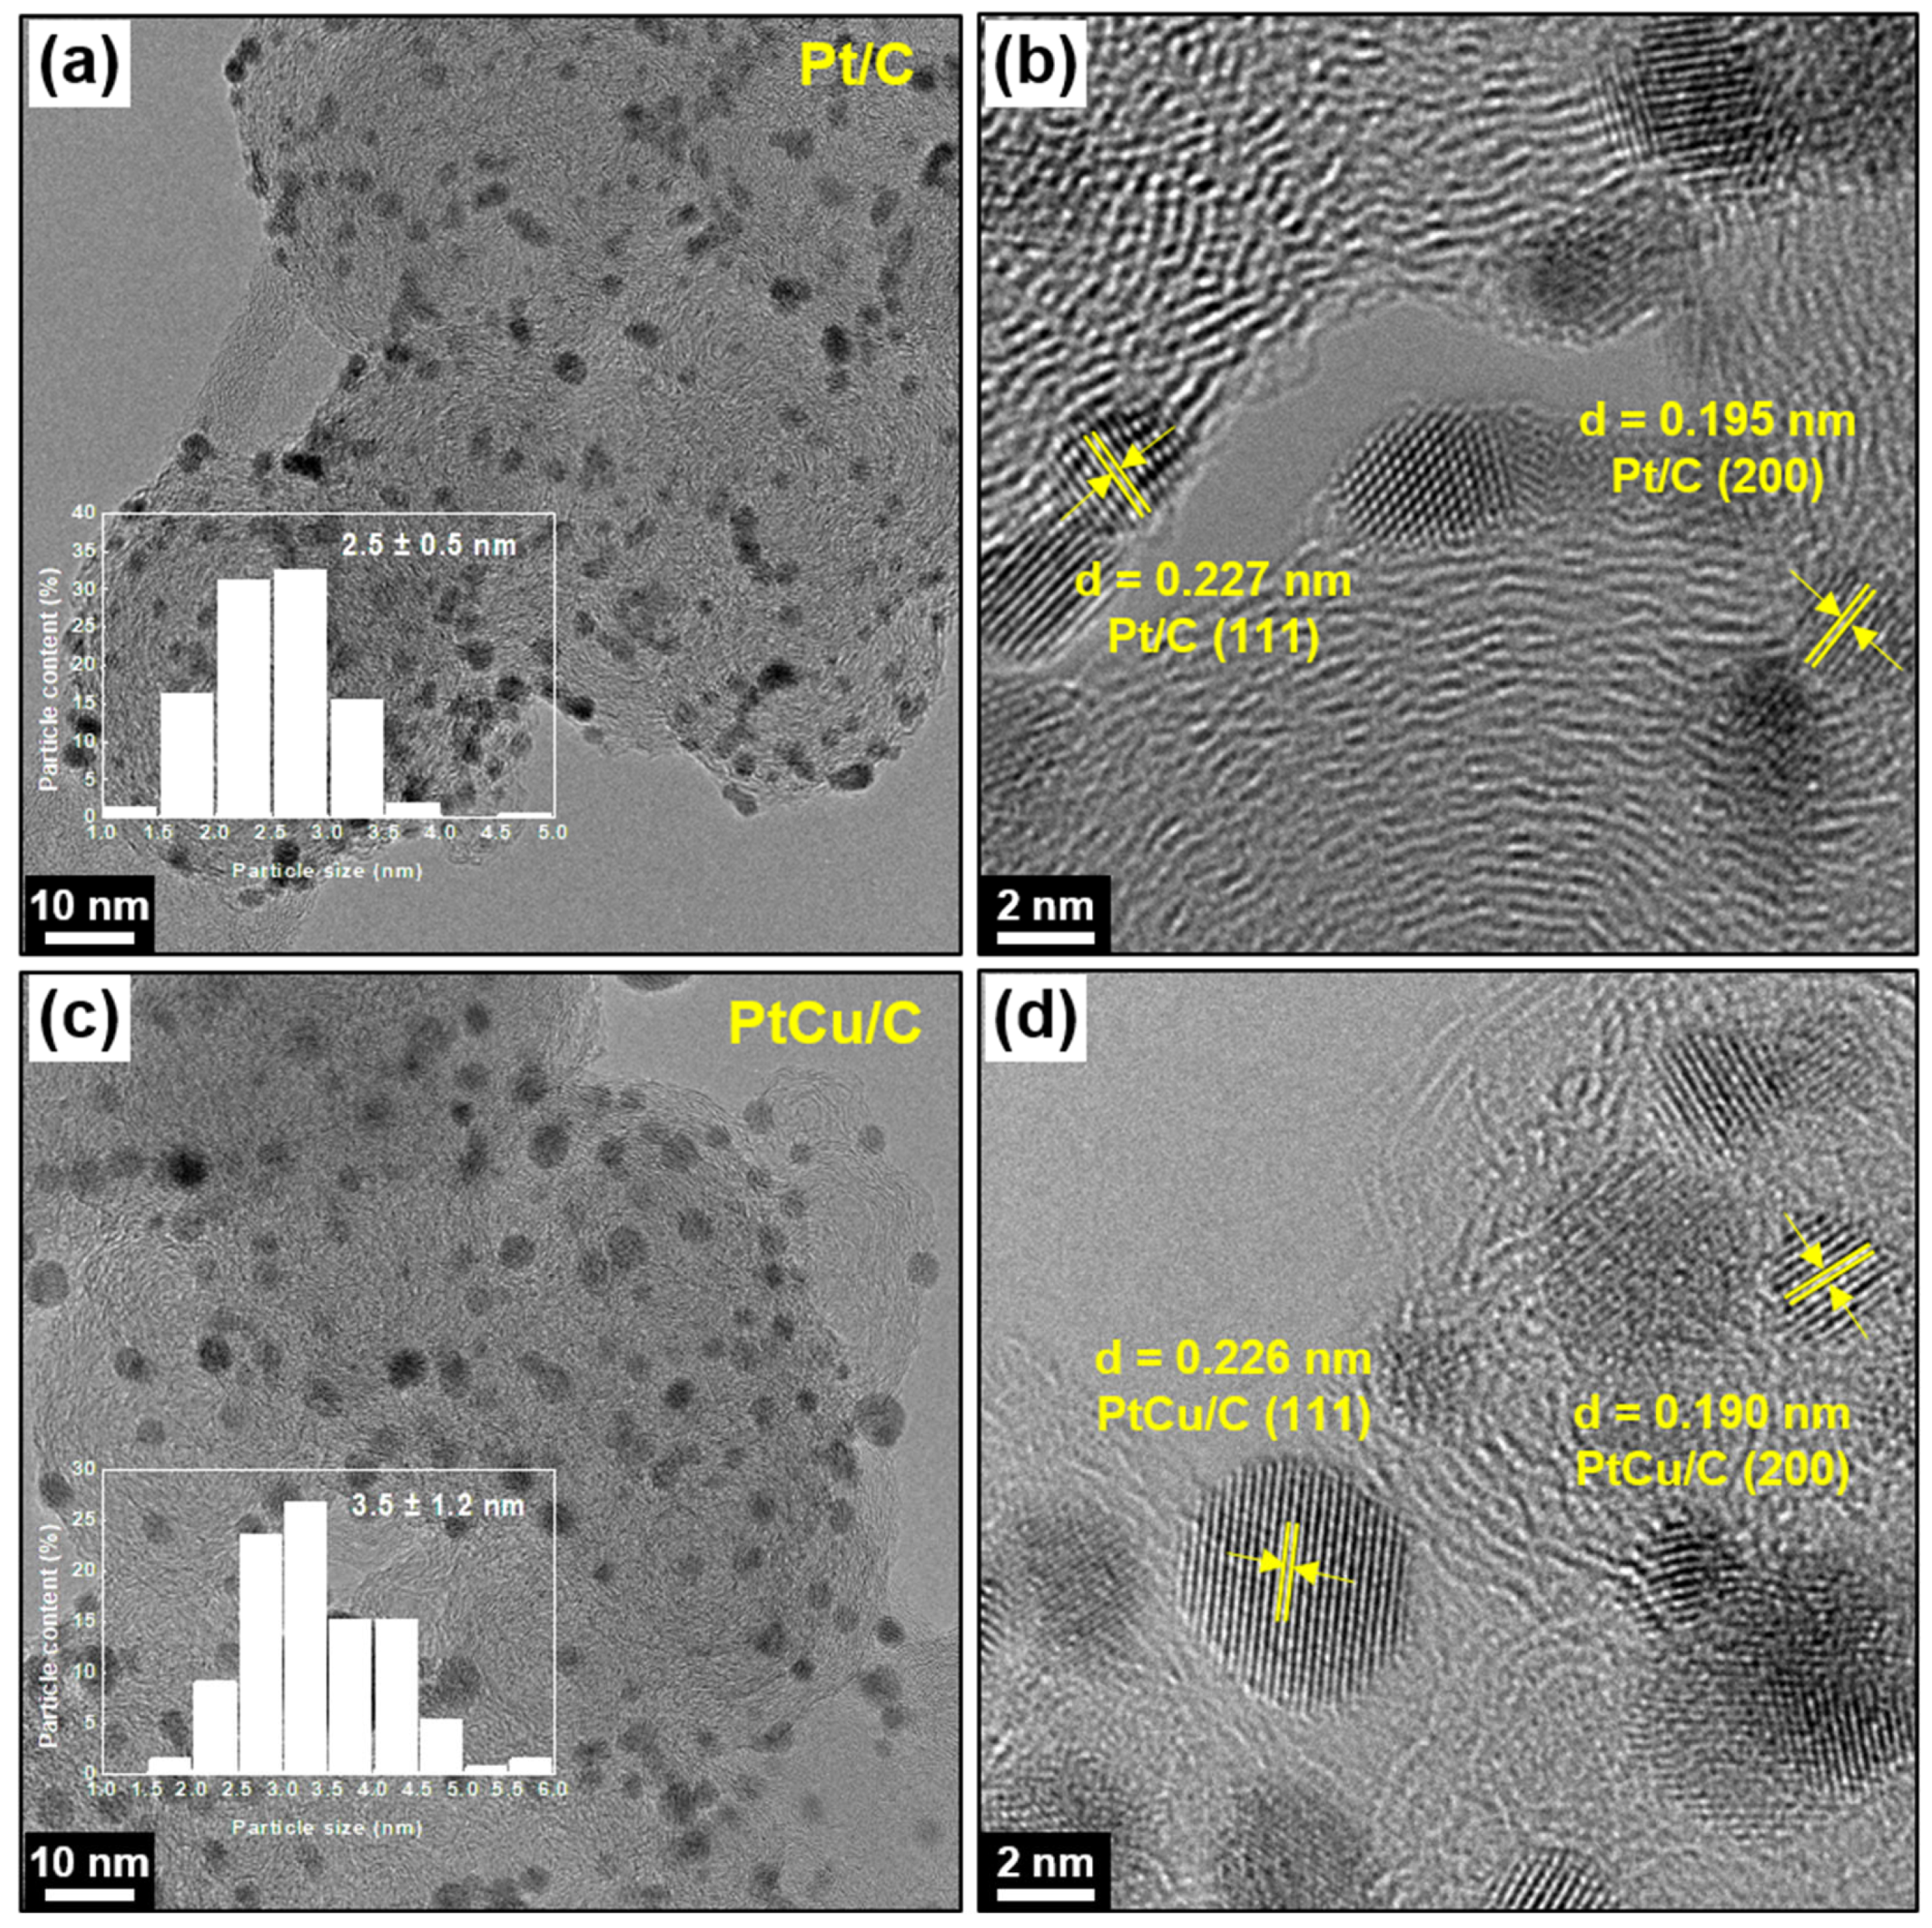
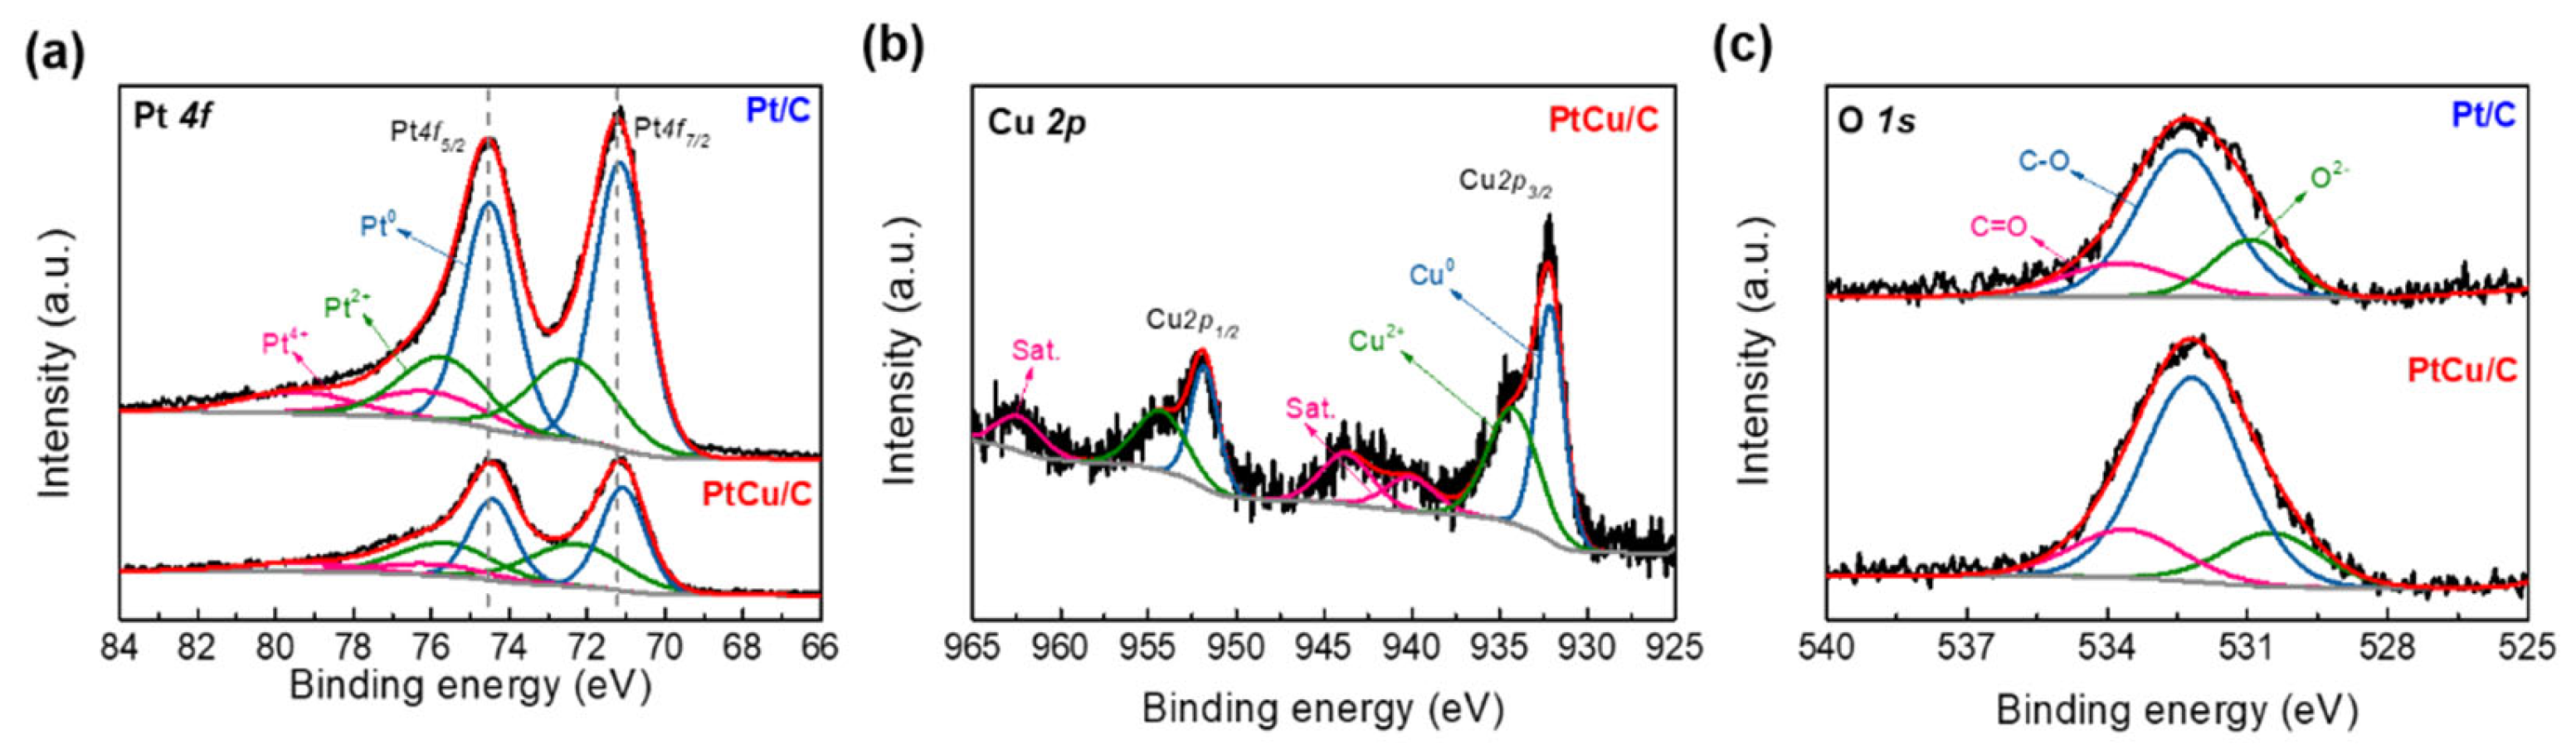
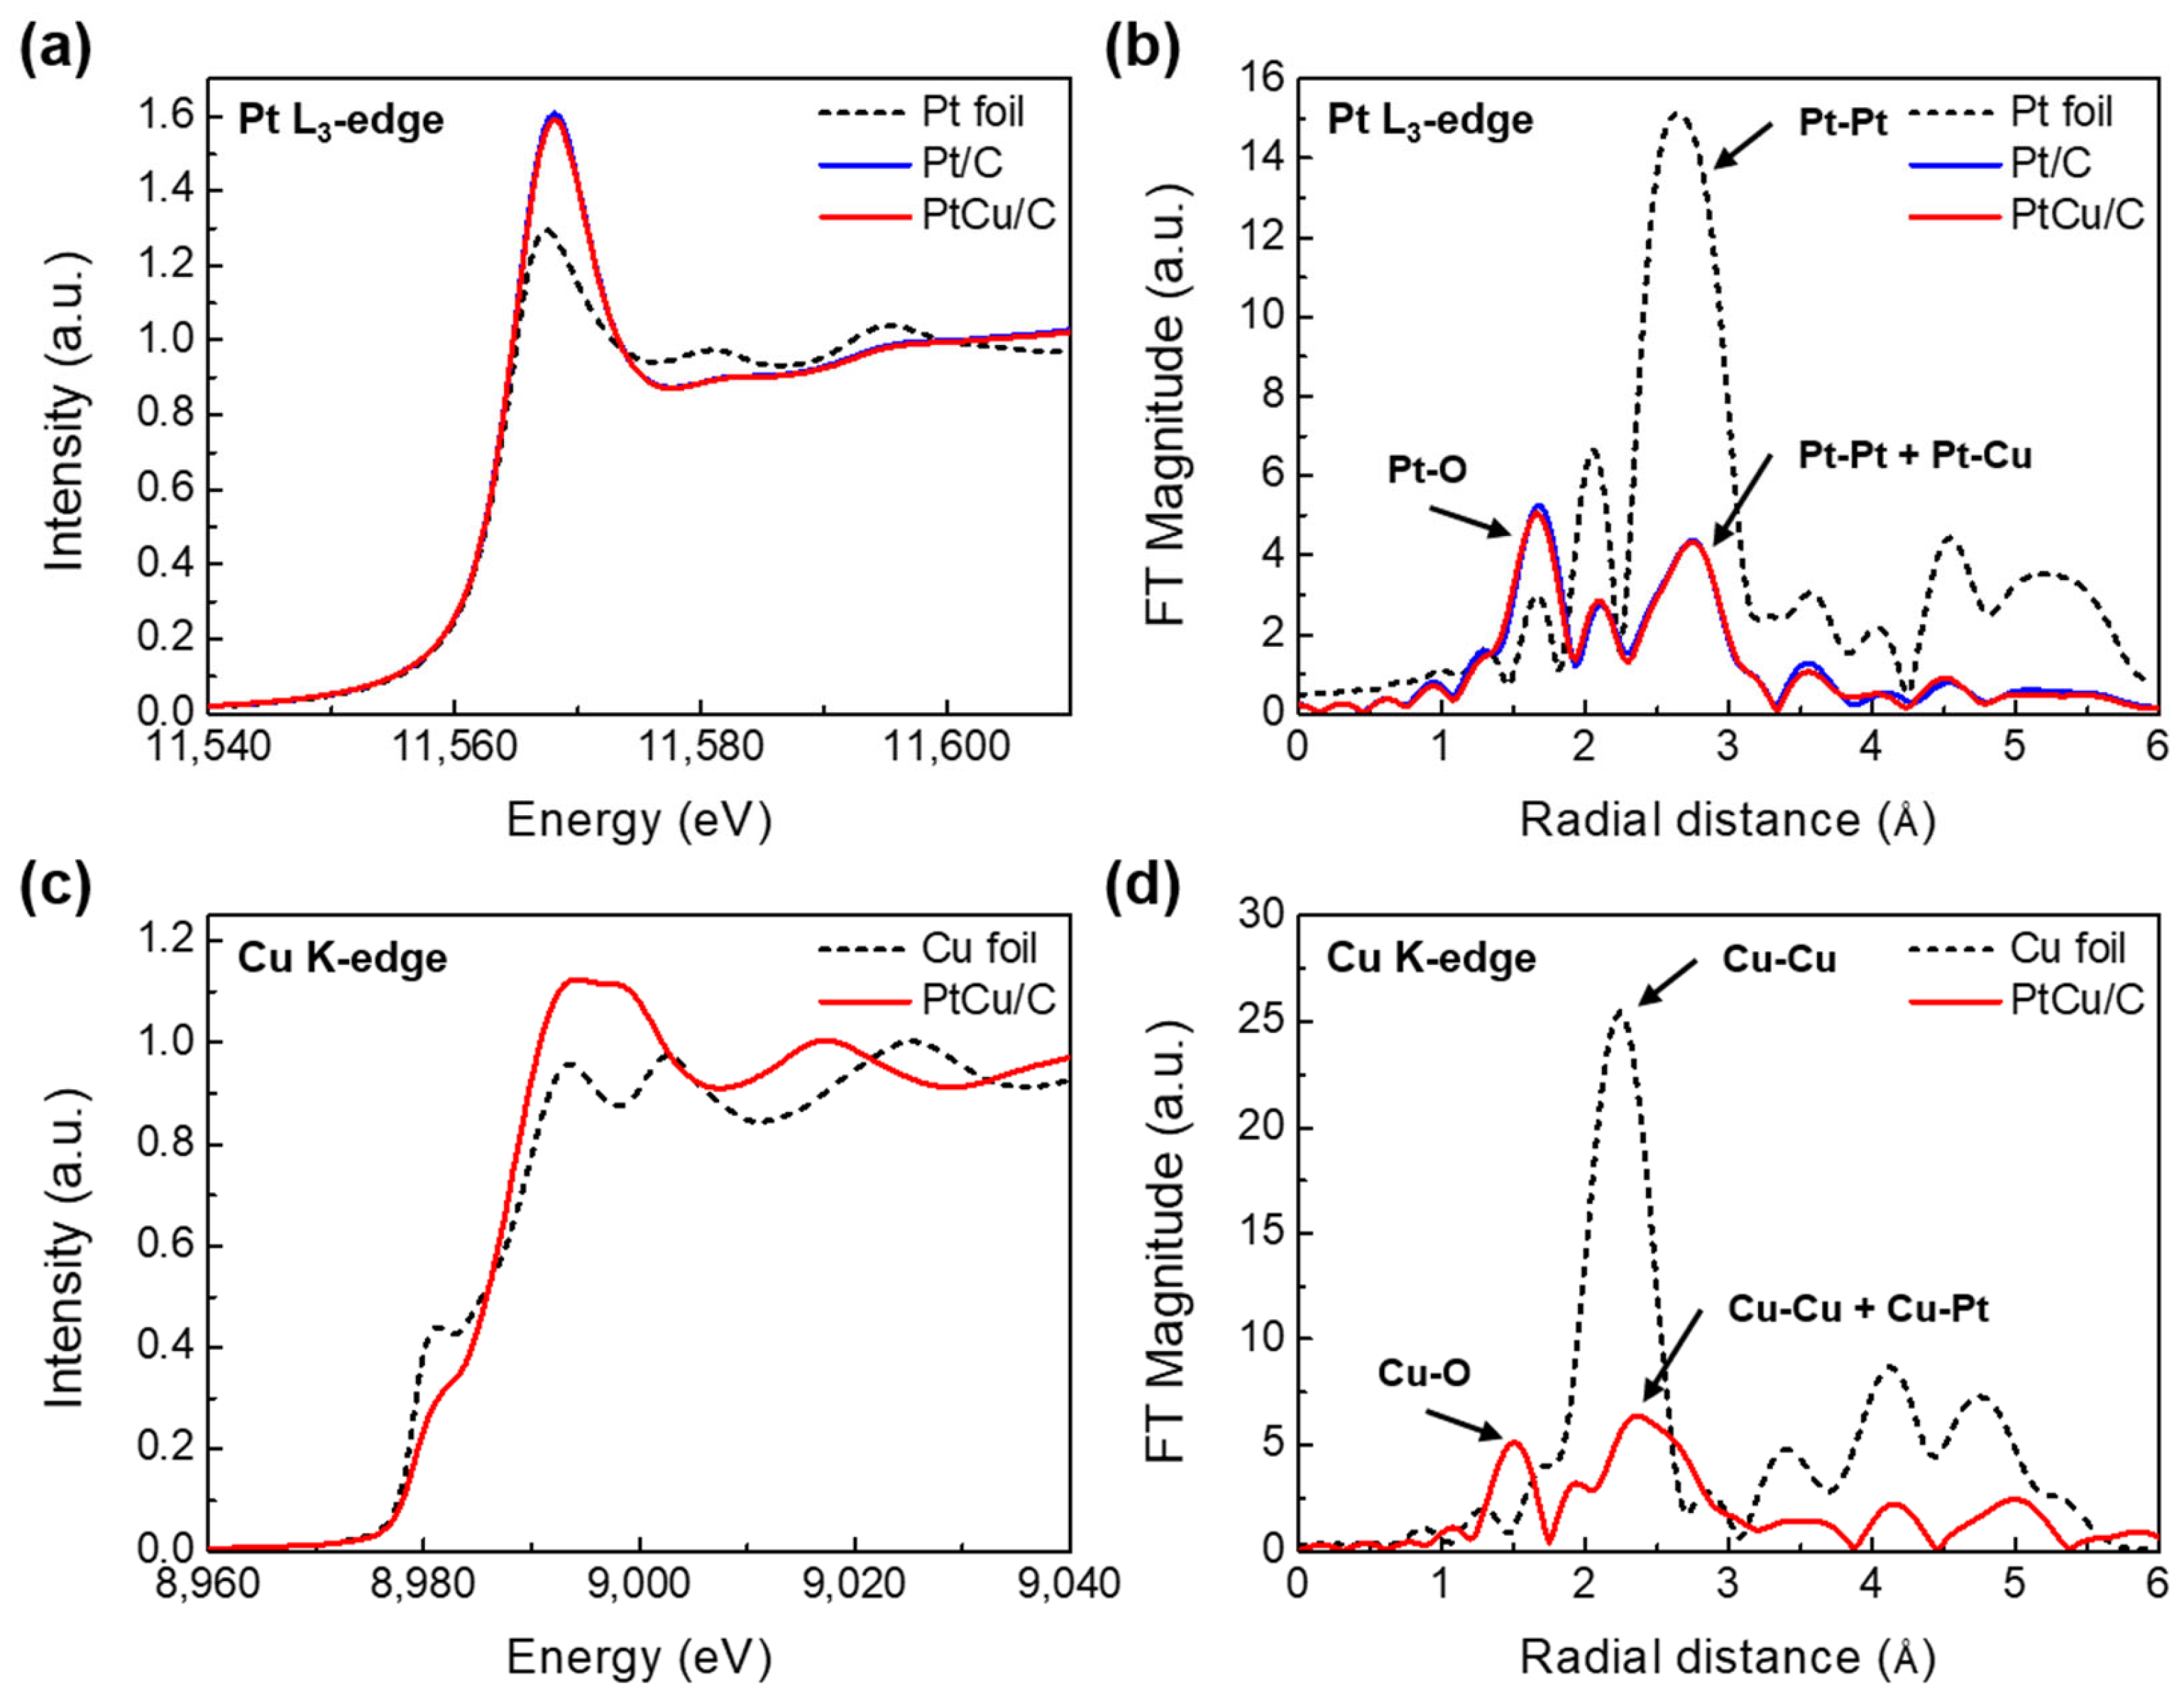
2.1. Physicochemical Characterizations of Pt/C and PtCu/C Catalysts

Figure 1a shows X-ray diffraction (XRD) patterns of 20 wt% Pt/C and PtCu/C catalysts. A broad diffraction peak at approximately 25° was exhibited, which corresponded to the (002) plane of the Vulcan XC-72R carbon support [45]. In the XRD pattern of Pt/C, the main characteristic diffraction peaks at approximately 40°, 46°, and 67° presented face-centered cubic (fcc) Pt peaks corresponding (111), (200), and (220) planes, respectively. The fcc Pt phase peaks of the PtCu/C were located at approximately 41°, 48°, and 70°, respectively. The diffraction peaks of the PtCu/C were similar to those of the Pt/C, whereas the 2θ value of the Pt diffraction peaks were slightly shifted to higher values. In addition, a sharp peak appeared at 21° and was attributed to the diffraction peak of CuPt (JCPDS No. 42-1326). It is noteworthy that no diffraction peaks of the Cu metal phase and oxide/hydroxide phases such as Cu, CuO, and Cu (OH)2 were detected in the XRD measurements, indicating that the PtCu alloy was well formed. The metal amounts loaded on the carbon support for the Pt/C and PtCu/C catalysts were determined as about 20.9 and 23.5 wt%, respectively, by thermogravimetric analysis (TGA), as shown in Figure 1b and Table 1. The mean particle size (dXRD) of the catalysts was calculated using the following Scherrer equation [46]:
d XRD = K λ B c o s θ 220
where K is the Scherrer constant (0.9), λ is the wavelength of the X-ray (0.154 nm), B is the full width at half maximum (FWHM), and θ(220) is the angle at the (220) plane. The calculated particle size of the Pt/C (2.8 nm) from XRD was smaller than that of the PtCu/C (3.9 nm). The lattice parameter (a) of the catalysts was also calculated using the following equation [36]:
a = λ 2 s i n θ 220 × h 2 + k 2 + l 2
where λ is the wavelength of the X-ray (0.154 nm), θ(220) is the angle at the (220) plane, and (hkl) are the (220) Miller indices. The lattice parameter of PtCu/C (3.806 Å) was decreased compared to that of Pt/C (3.938 Å). This is evidence for alloy formation between Pt and Cu through the incorporation of Cu atoms into the lattice of the Pt crystal. The bulk ratio of Pt and Cu of the PtCu/C was estimated by inductively coupled plasma optical emission spectrometry (ICP-OES). The structural information, including the mean particle size, the lattice parameter, metal loading amounts on the carbon support, and the Pt/Cu atomic ratio, of the prepared catalysts are summarized and listed in Table 1.
Figure 2 presents typical high-resolution transmission electron microscopy (HR-TEM) images together with particle size distributions (inset) for the Pt/C and PtCu/C catalysts. It can be found that the Pt and PtCu nanoparticles were uniformly dispersed on the surface of the carbon support through the HR-TEM images. The average particle size (dTEM) of the catalysts was calculated by the following equation using more than 100 different visible particles on HR-TEM images (Figure 2a,c) [33]:
d TEM = n i d i n i
where ni is the number of particles with a diameter of size di. The average particle size of the PtCu/C catalyst was ca. 3.5 ± 1.2 nm, which was slightly larger than that of the Pt/C (ca. 2.5 ± 0.5 nm). As shown in Figure 2b,d, and Table 1, the HR-TEM images of the Pt/C and PtCu/C catalysts showed that the measured interplanar distances are indexed to the (111) and (200) planes of the fcc Pt and PtCu alloy. The decreased interplanar distance for the PtCu/C catalyst implies that Cu atoms incorporated into the lattice of the Pt crystal have a smaller atomic radius than Pt. This is consistent with the analytical results of XRD.
To investigate the electronic structure and surface chemical state of the Pt/C and PtCu/C catalysts, X-ray photoelectron spectroscopy (XPS) was performed. Figure 3 and Table 2 present the high-resolution XPS spectrum of Pt 4f, Cu 2p, and O 1s prepared catalysts. All the binding energies were referenced using the C 1s line at 284.70 eV for calibration. The high-resolution Pt 4f spectrum shows the assigned two peaks corresponding to the doublet Pt 4f7/2 and Pt 4f5/2 states from the spin-orbital splitting. Each peak can be deconvoluted to metallic Pt0, Pt2+, and Pt4+ species in Figure 3a. Compared to Pt/C, the PtCu/C was shifted to lower binding energies in the Pt 4f spectra, indicating the electron transfer from Cu to Pt due to the electronic interaction between Pt and Cu [20,47,48]. Figure 3b shows the high-resolution Cu 2p spectra that present the assigned Cu 2p3/2 and Cu 2p1/2 doublet as Cu0 (932.13 and 951.88 eV) and Cu2+ (934.35 and 954.10 eV) of the PtCu/C catalyst. The metallic Pt (Pt0) is dominant (≈54.3%) in the PtCu/C. The characteristic satellite peaks of 940.10 and 943.73 eV (Cu 2p3/2) and 962.34 eV (Cu 2p1/2) point to the presence of oxidized Cu2+ species near the surface [49,50]. The high-resolution O 1s spectra consisting of three deconvoluted peaks assigned to O2− (530.93 and 530.48 eV), C-O (532.38 and 532.18 eV), and C=O (533.71 and 533.58 eV) bonds did not show substantial differences between the Pt/C and PtCu/C catalysts in Figure 3c. The Pt/Cu atomic ratios determined by the ICP-OES and XPS data are presented in Table 1. The bulk (0.81) and surface (1.38) Pt/Cu molar ratios demonstrate a little difference, indicating that the Cu exists more on the PtCu/C catalyst surface.
Figure 4a,c shows the results of the Pt L3 and Cu K-edge X-ray absorption near-edge structure (XANES) analysis to determine the local electronic structures of Pt and Cu in the prepared catalysts. The white line (WL) intensity at the Pt L3-edge, which is a strong peak above the edge energy position, is related to the electronic transition to the 2p3/2 → 5d orbital state [36]. The WL intensities for the Pt/C and PtCu/C catalysts show greater values than that of the Pt foil. The white line intensity of the Pt L3-edge for PtCu/C was slightly decreased compared to that of the Pt/C, which meant that electrons transferred from Cu to Pt [20,51]. This was also in line with the above mentioned XPS results in Figure 3. Likewise, the WL intensity of the PtCu/C catalyst in the Cu K-edge spectra was higher than that of the Cu foil, indicating a high oxidation state in Figure 4c. The broad peak of the PtCu/C from the Cu K-edge can be the case in alloy formation.
Figure 4b,d compares the Fourier transforms (FTs) of the extended X-ray absorption fine structure (EXAFS) data at the Pt L3-edge and Cu K-edge of Pt/C and the PtCu/C catalysts. The Pt-Pt scattering peak in Pt foil appears in the range of 2–3.5 Å. The peaks at 1–2 Å are attributed to the Pt-O. In order to obtain the structural parameters of the Pt species—including the coordination number (N), interatomic distances (R), and Debye–Waller factor (σ2)—the curve-fitting analysis was performed and the results are tabulated in Table 3. As a result of the curve fitting of FT-EXAFS, the Pt-O shell was located at around 2.00 Å and the Pt-Pt shell was located at around 2.77 Å for both catalysts. In addition, the Pt-Cu shell of the PtCu/C catalyst was located at about 2.68 Å. For PtCu/C, the coordination numbers of Pt-Pt bonds decreased with the formation of the Pt-Cu bonds and the coordination numbers of the Pt-O bonds slightly increased. From the Cu K-edge k3-weighted EXAFS data in Figure 4d, the Cu-Cu scattering peak in Cu foil appears in the range of 1.7–3 Å, and the peaks at 1–1.7 Å are attributed to the Cu-O. The Cu-O, Cu-Pt, and Cu-Cu shells of the PtCu/C were located at around 1.91, 2.66, and 2.62 Å, respectively. The coordination numbers of the Cu-Cu bond decreased with the formation of the Cu-O and Cu-Pt bonds. The Cu-O bond may have been caused by the presence of CuO on the PtCu/C catalyst surface.

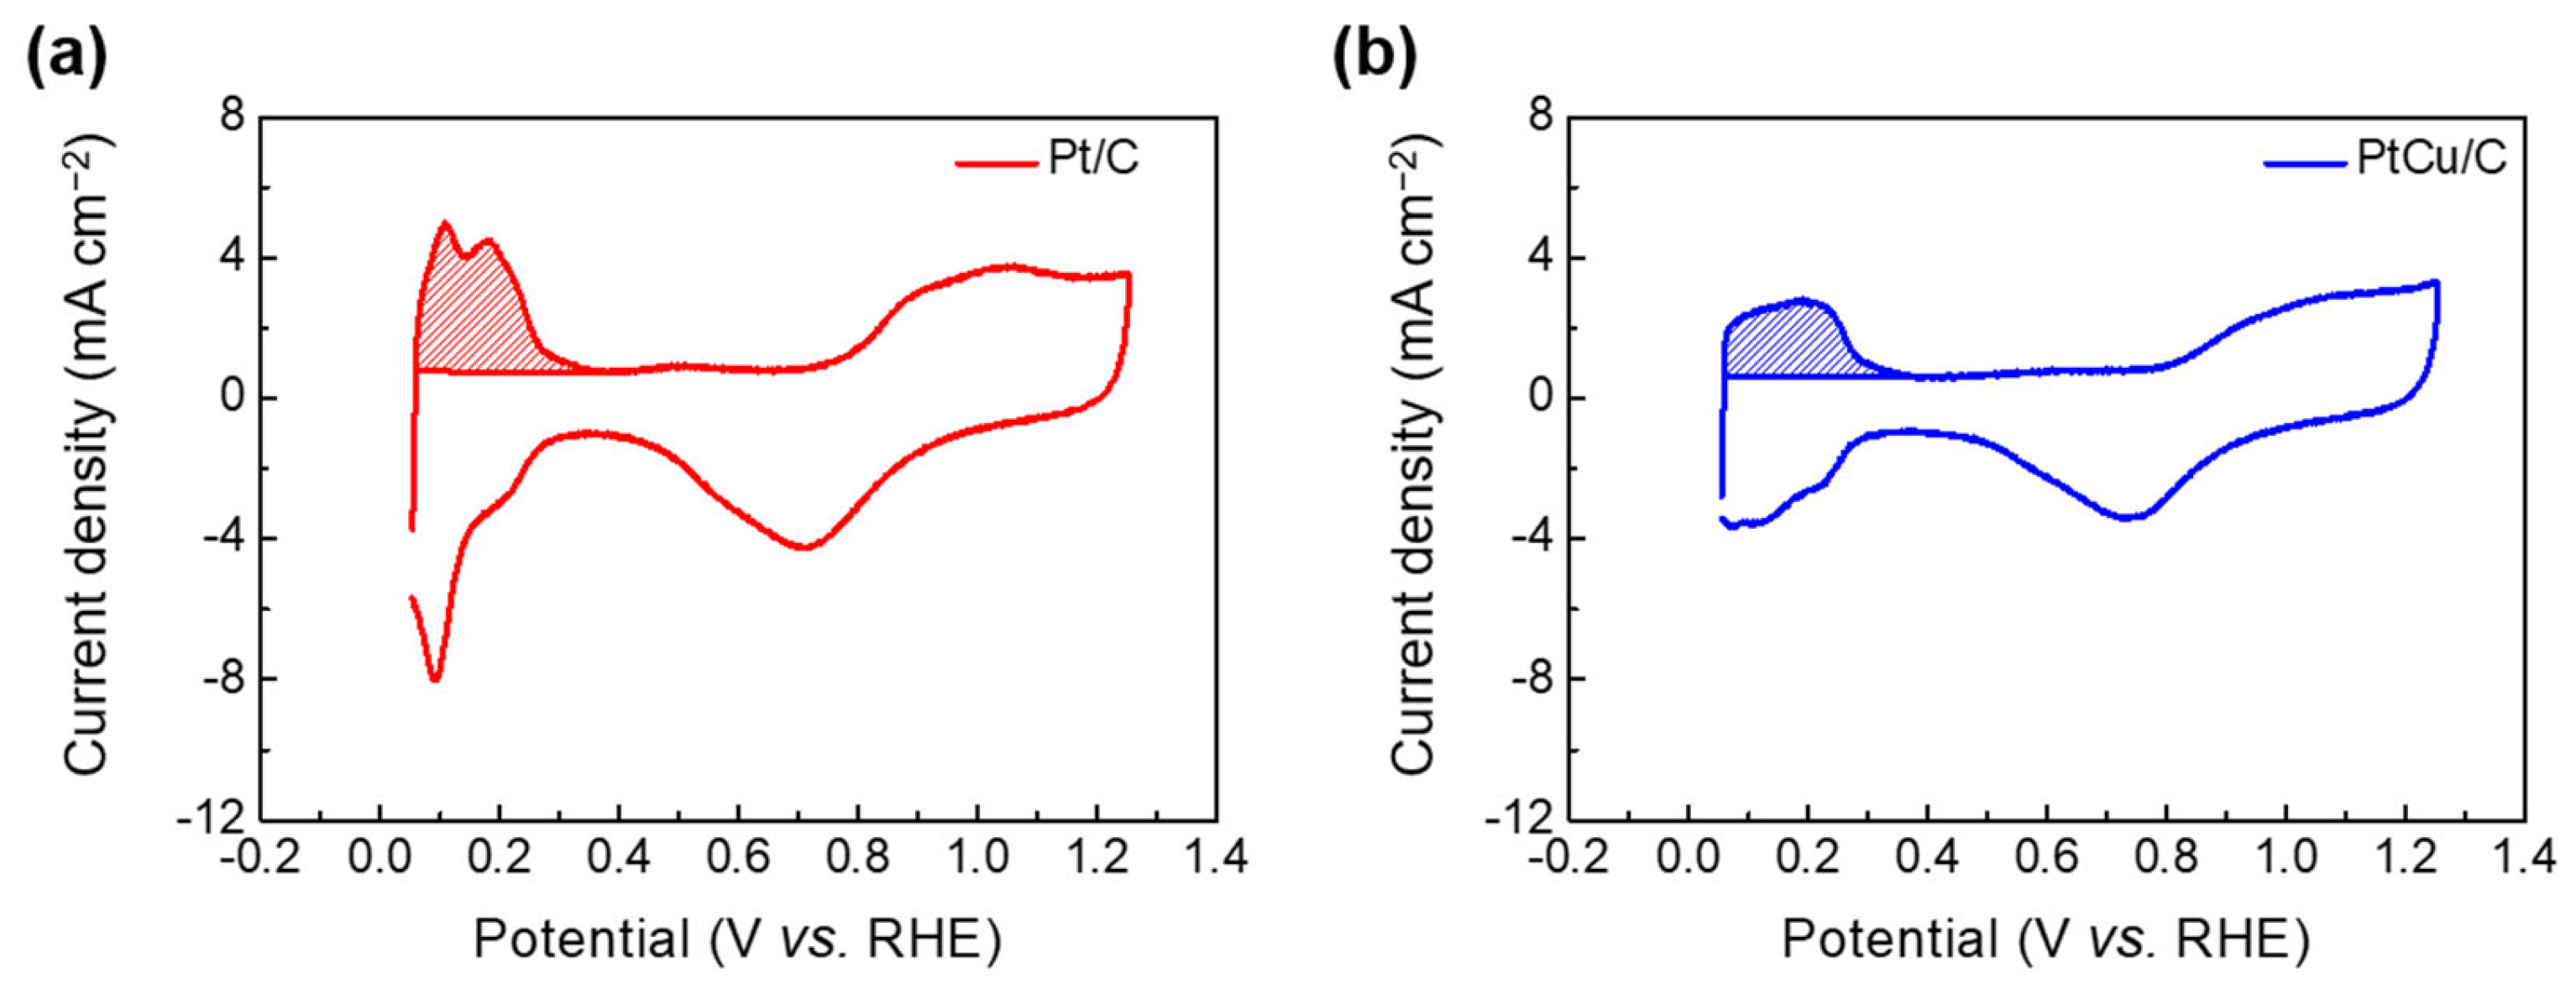
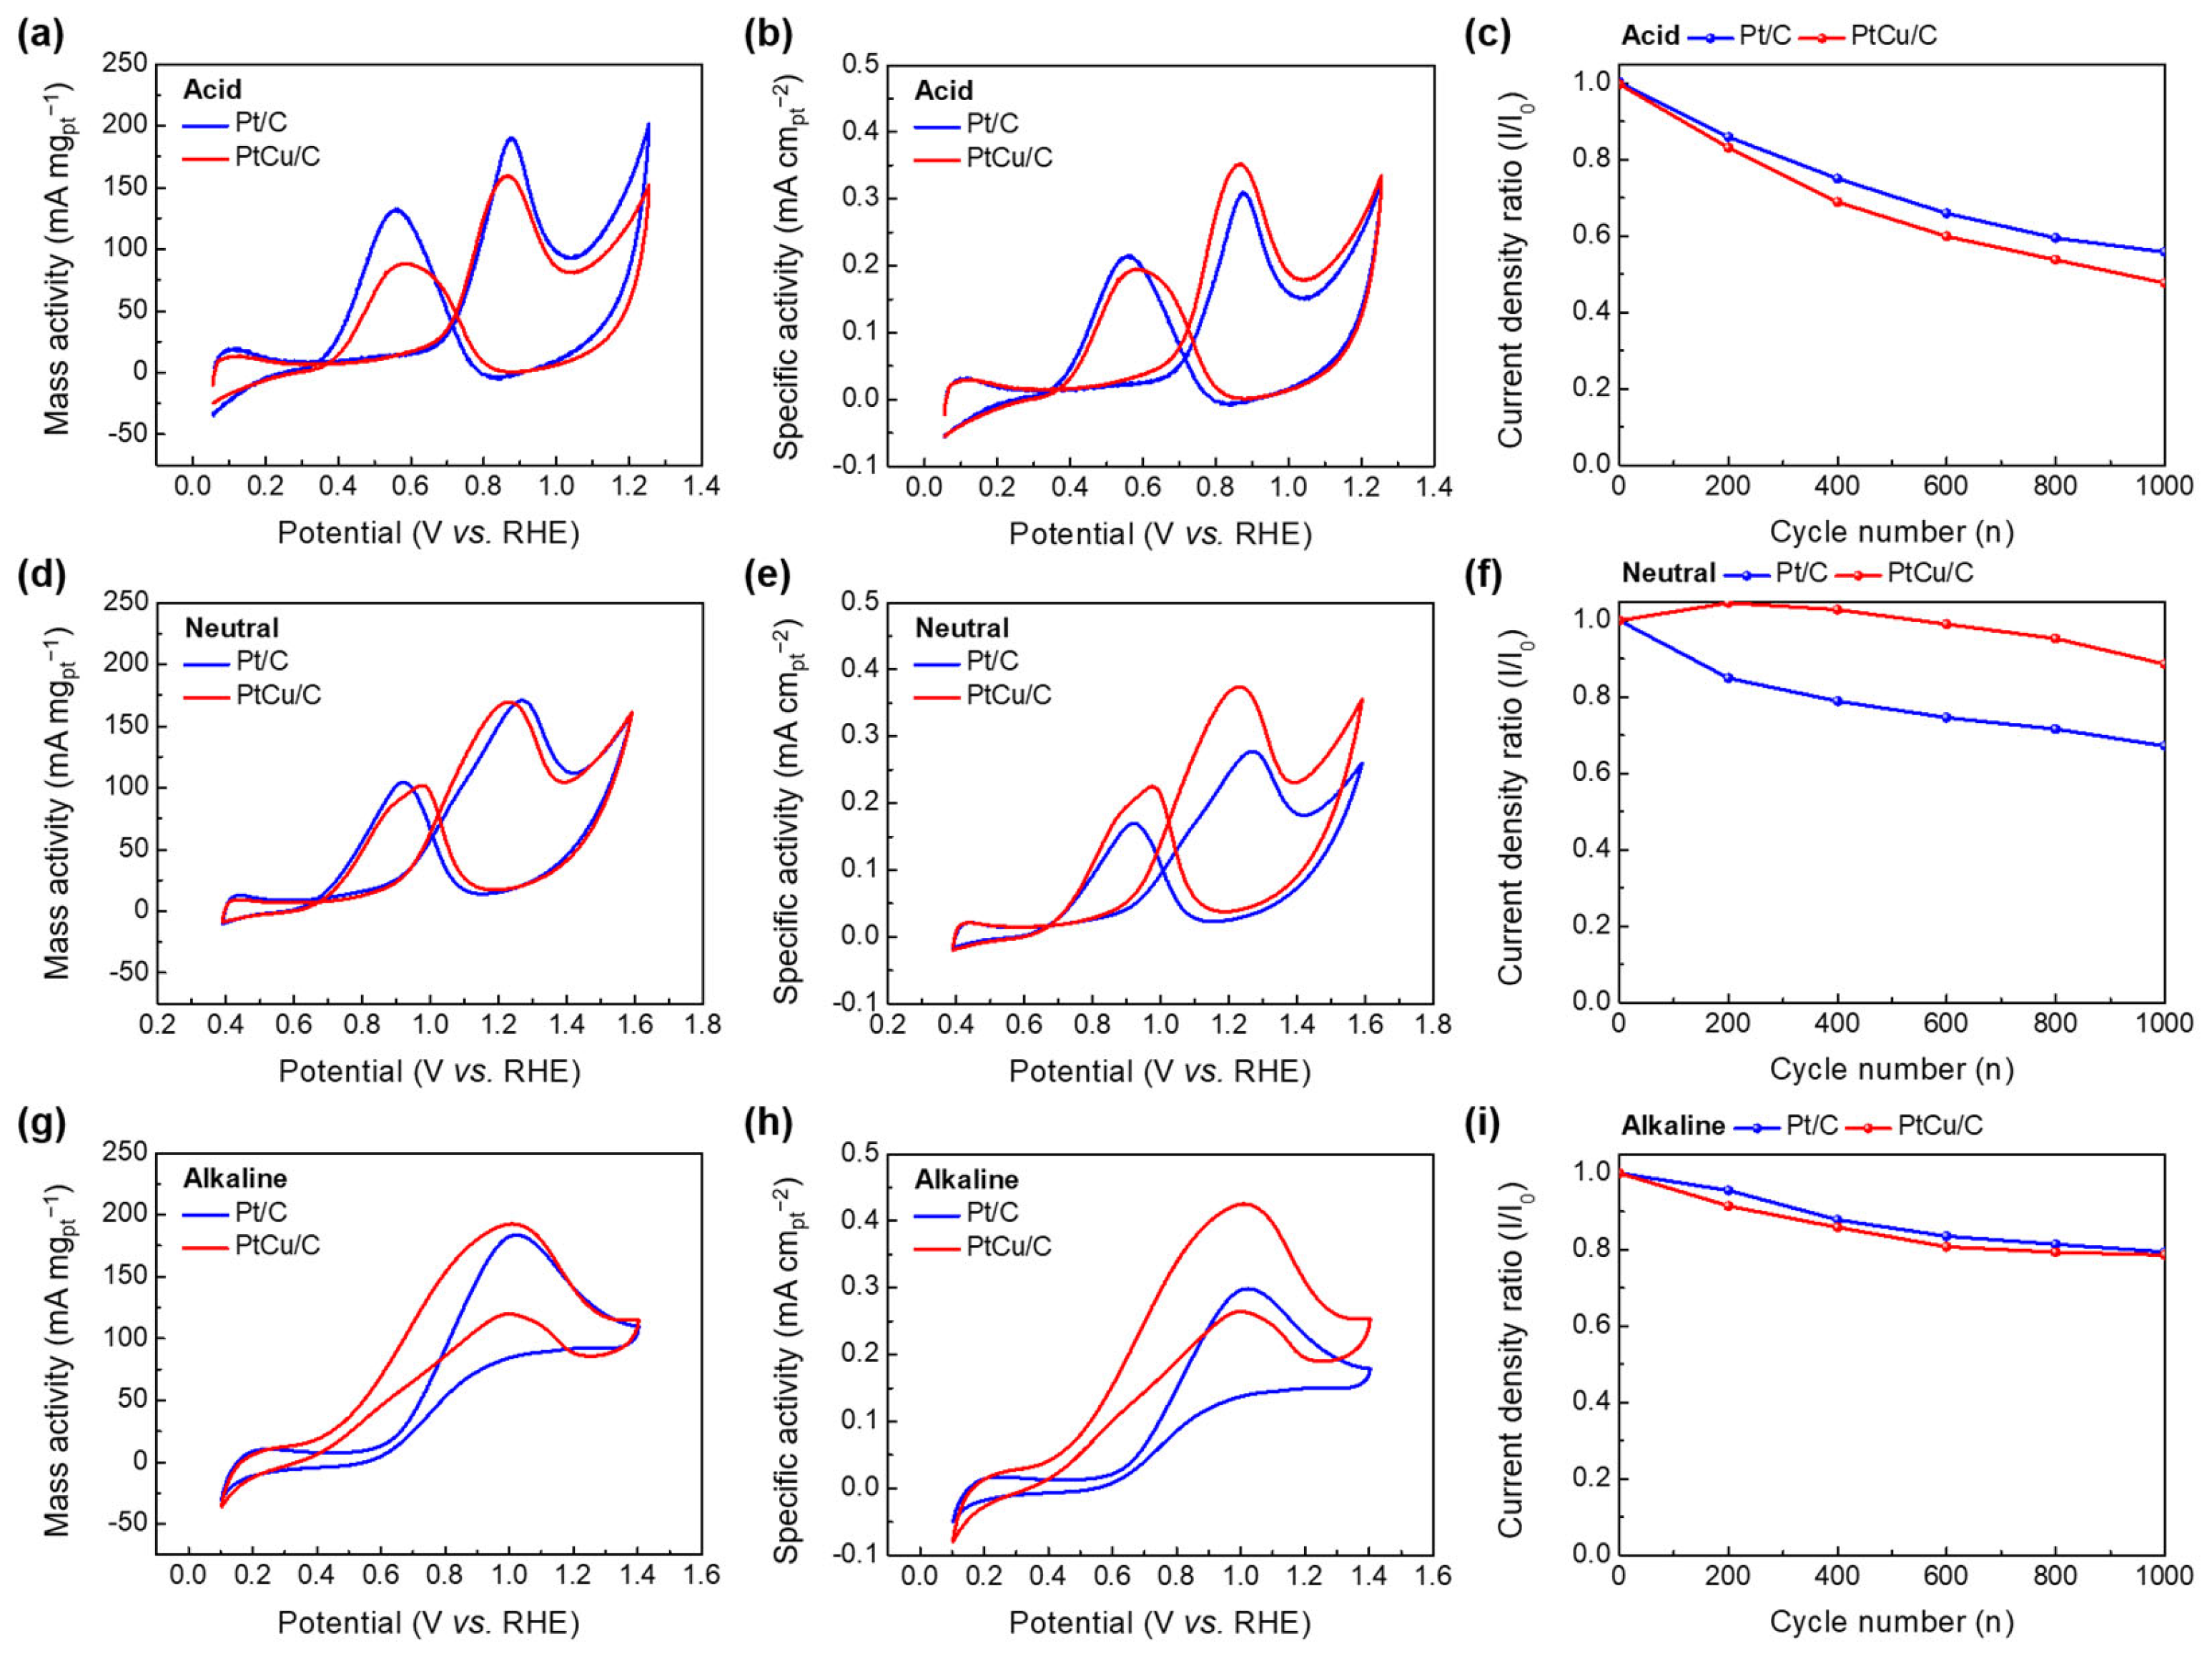
2.2. Electrochemical Performance Measurement of Pt/C and PtCu/C Catalysts

To measure and compare the electrochemical performance of the Pt/C and PtCu/C catalysts, the electrochemical surface area (ECSA) of the catalysts was calculated. Figure 5 shows cyclic voltammetry (CV) curves of the catalysts in an N2-purged 0.5 M H2SO4 electrolyte in an electrochemical half-cell system featuring the catalyst-deposited glassy carbon electrode (geometric area: ca. 0.071 cm2) as a working electrode. Based on the CV curves, we calculated the ECSA using the following equation [52]:
ECSA   m 2 / g P t = Q H q × m g P t
where QH, q, and mgPt are the charge for the hydrogen adsorption-desorption peak area, the monolayer hydrogen desorption charge (0.210 μC cm−2), and the amount of platinum loaded on the electrode, respectively. The ECSA values of the Pt/C and PtCu/C were 61.5 and 45.3 m2 gPt−1, as in Table 4. The decreased ECSA value of the PtCu/C compared to Pt/C may be associated with the PtCu/C having a larger particle size than Pt/C, as obtained from the HR-TEM analysis results in Figure 2.
Considering the ECSA results and Pt loaded amounts, we measured the electrochemical performances for the EGOR using the CV and linear sweep voltammetry (LSV) techniques in an N2-purged 1 M glycerol under different electrolyte solutions (0.5 M H2SO4: pH 0.3, 0.1 M Na2SO4: pH 6, and 0.1 M KOH: pH 13) at room temperature. Figure 6 and Figure S1 exhibit the CV and LSV curves related to mass activity (current divided by Pt mass, mA mgPt−1), and specific activity (current divided by ECSA, mA cmPt−2) of the Pt/C and PtCu/C catalysts at different pH conditions. The electrocatalytic activity parameters of the prepared catalysts are summarized in Table 4. As presented in Figure 6a,b,d,e,g,h and Figure S1 and Table 4, the PtCu/C catalyst significantly demonstrates lower onset potential value and higher mass and specific activities than the Pt/C with an increasing pH. The PtCu/C catalyst also showed EGOR activity comparable to or even better than that of previously reported Pt-based catalysts (as shown in Table S1). These results indicate that the presence of more OH- groups in the reaction environment influences the enhanced glycerol oxidation reactivity in the PtCu/C catalyst. The long-term cycle stability results of the prepared catalysts are displayed in Figure 6c,f,i. To compare the stability, the current density of each cycle (I) was normalized by the initial current density (I0). After 1000 cycles testing, the PtCu/C was more stable in a neutral condition compared to the Pt/C. The Pt/C and PtCu/C showed almost similar catalytic stability in both acidic and alkaline conditions. In addition, as shown in Table 4 and Figure S2, Tafel slope values of Pt/C and PtCu/C tended to decrease with increasing pH. The Tafel slope values of Pt/C and PtCu/C showed the lowest values 160.80 and 107.80 mV dec−1 in high pH condition, respectively. Notably, the PtCu/C exhibited an outstanding catalytic performance compared with conventional Pt/C catalysts in the alkaline condition of high pH.

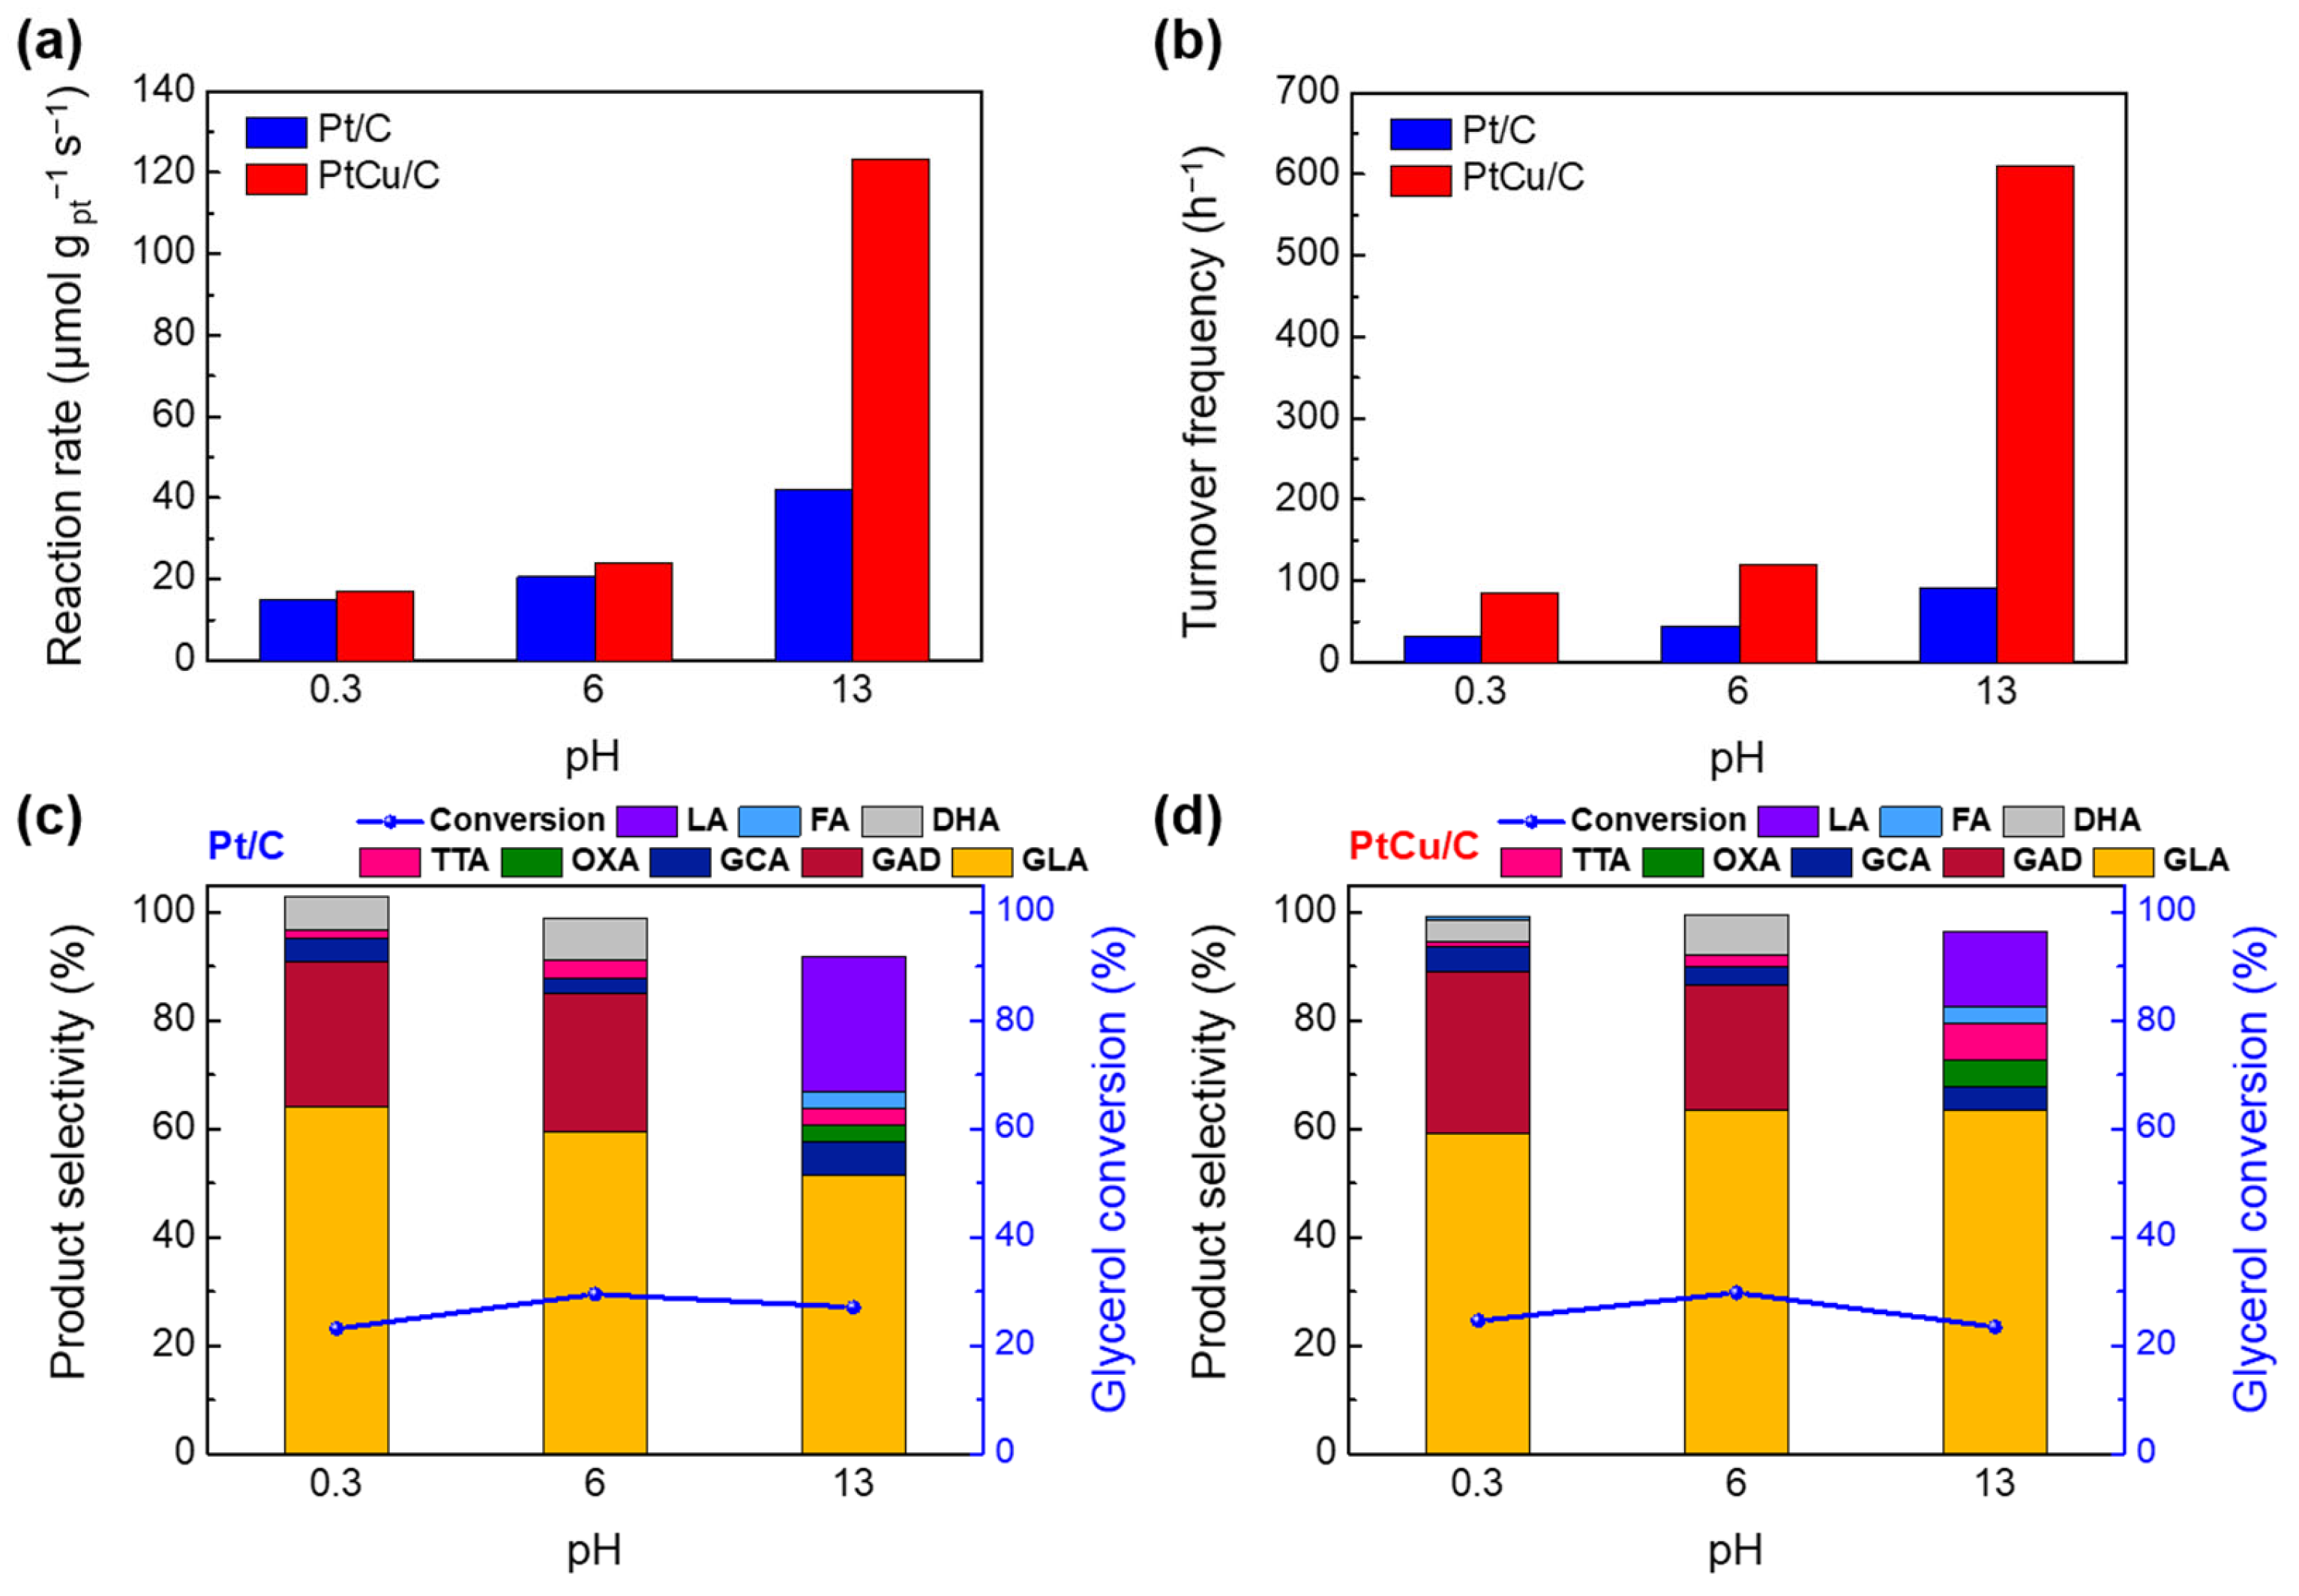
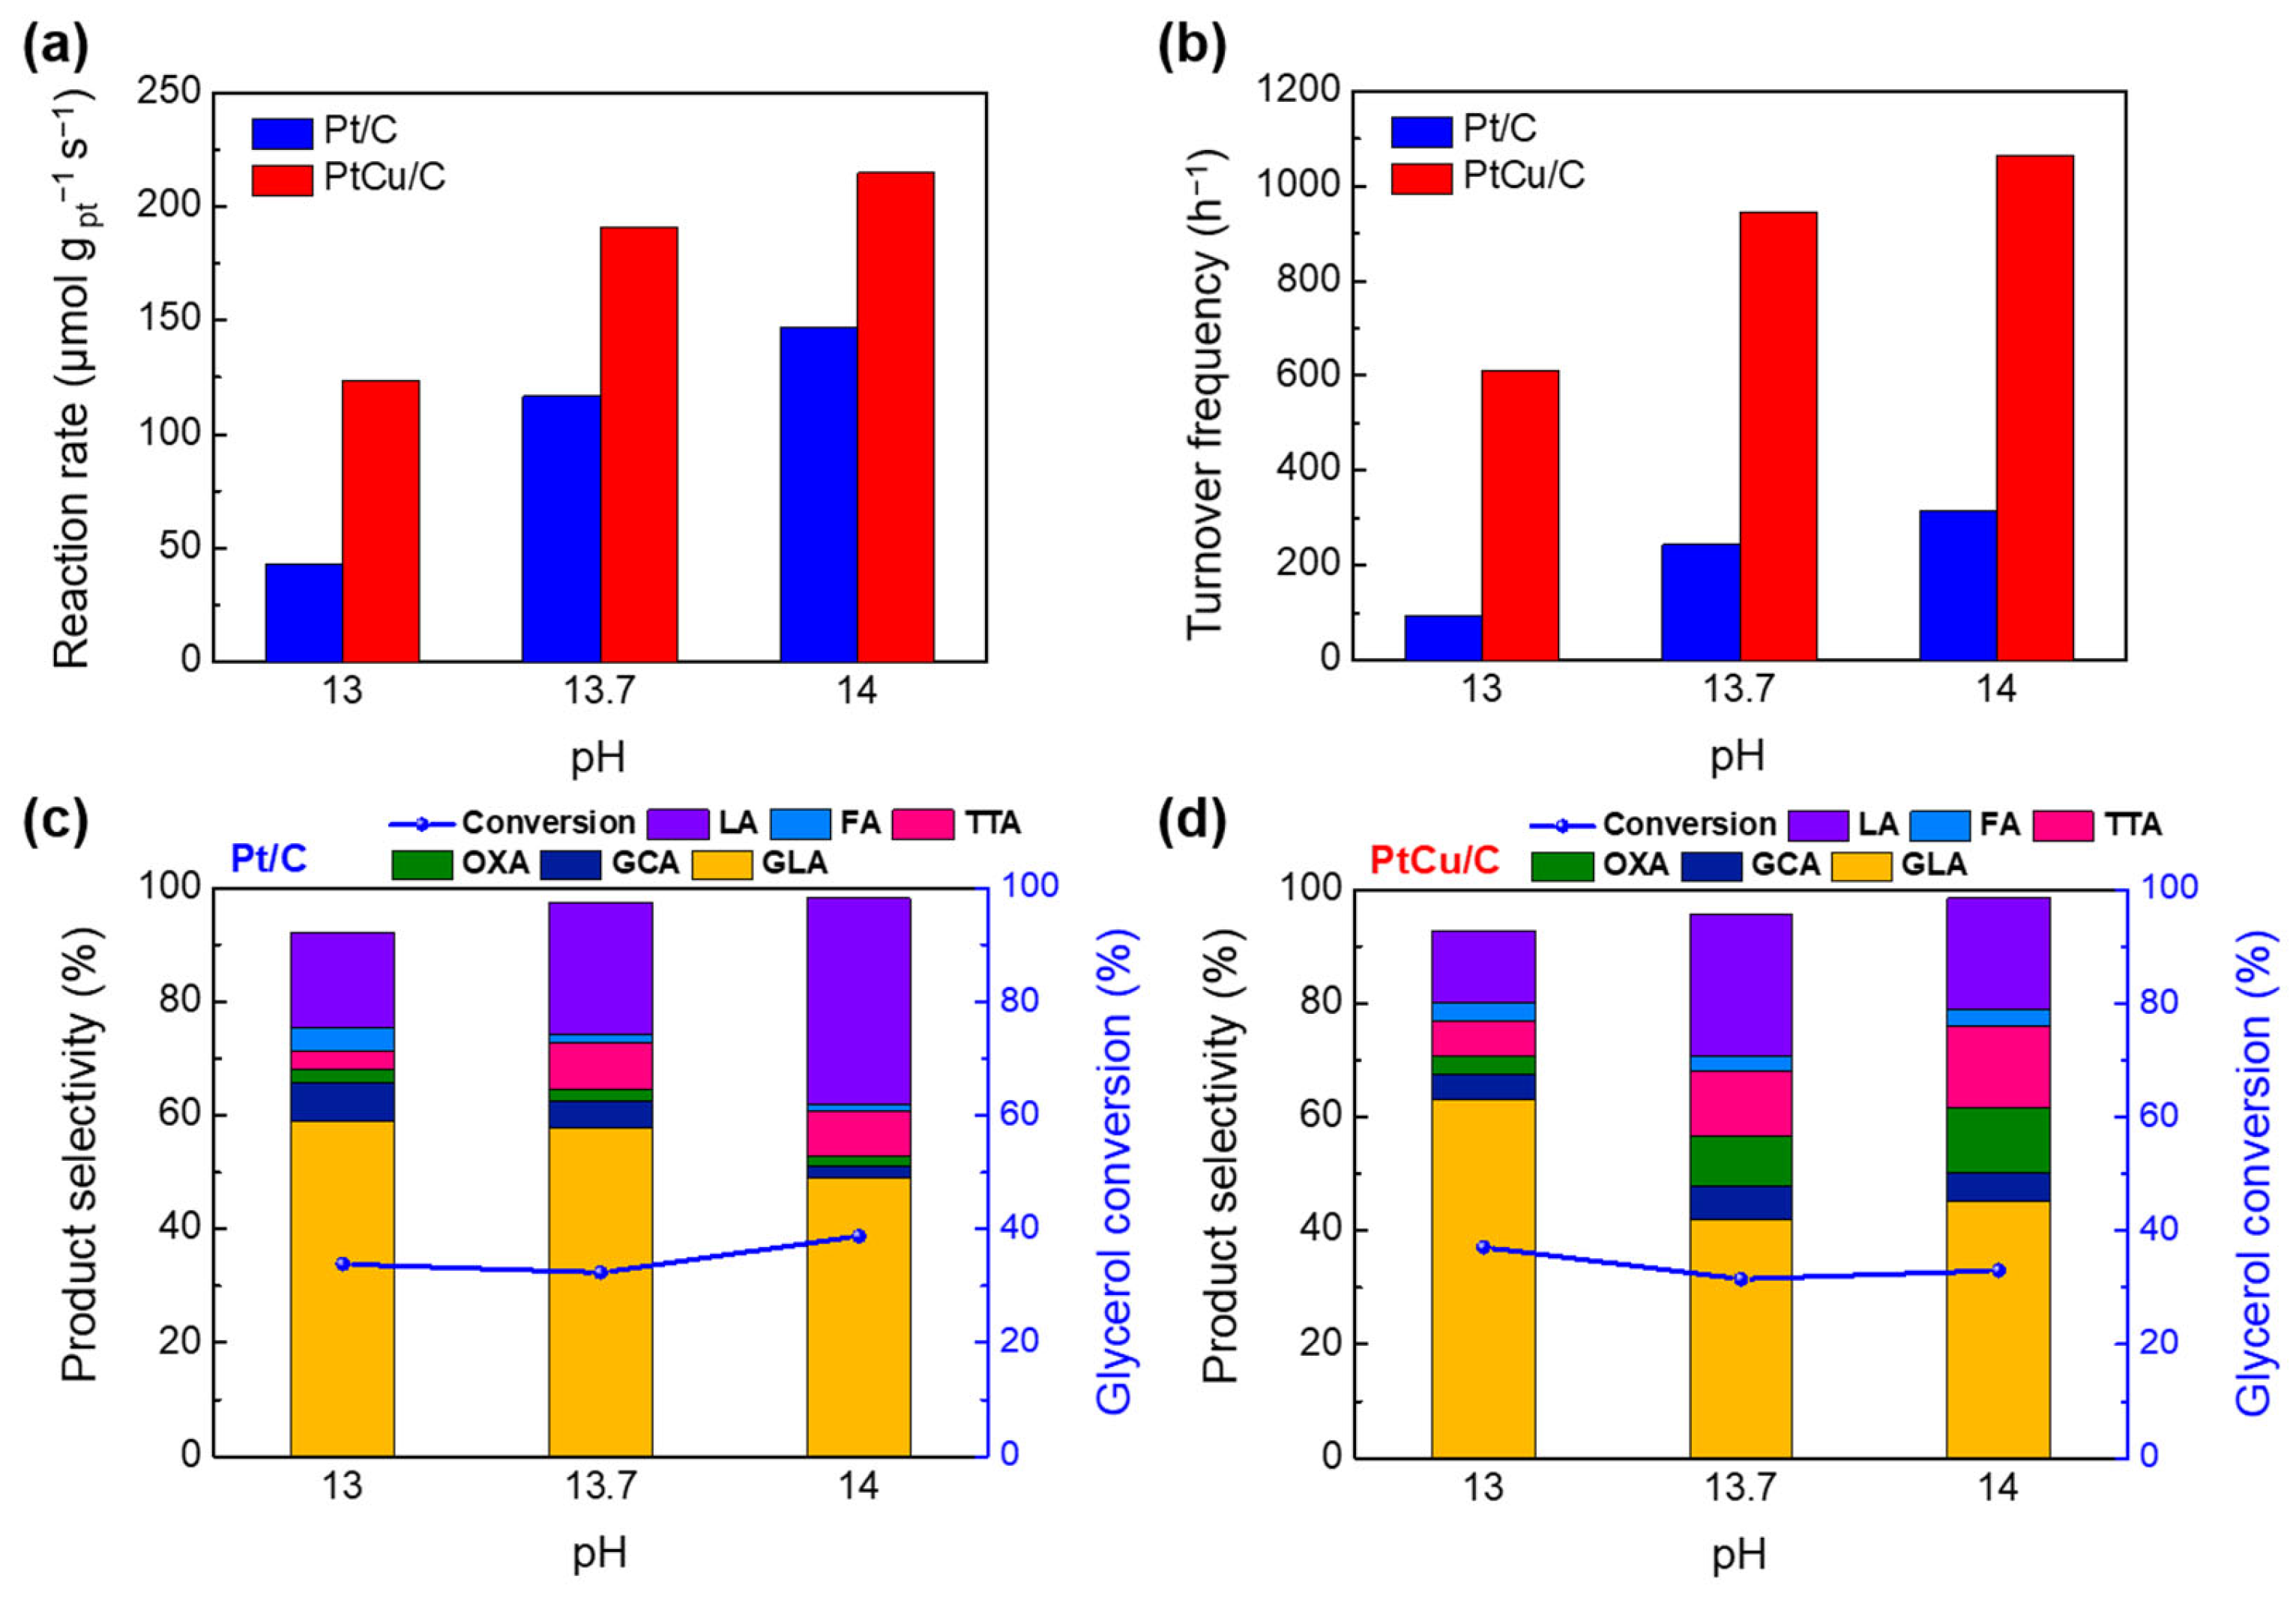
2.3. EGOR Performance Analyses of Pt/C and PtCu/C at Different pH Conditions

To investigate how the reaction performance and chemistry for the EGOR changes with the addition of Cu and a change of pH conditions, we conducted experiments using an electrochemical batch reactor system that consists of a three-electrode system featuring catalyst-coated titanium paper as working electrode (active area: 2 cm2). For an EGOR performance comparison, we used the Pt/C (Pt metal loading: 0.32 mg cm−2) and PtCu/C (Pt metal loading: 0.27 mg cm−2) catalyst-loaded electrodes prepared by a spray coating method. The EGOR experiments were performed in 0.1 M glycerol dissolved in different electrolytes (0.5 M H2SO4: pH 0.3, 0.1 M Na2SO4: pH 6, and 0.1 M KOH: pH 13) at 60 °C. The applied potential in the reactor system was 0.95 V (V vs. RHE) at pH 0.3 and 6, and 1.00 V (V vs. RHE) at pH 13, respectively.
Figure 7a,b presents the calculated reaction rate and turnover frequency (TOF) for electrocatalytic glycerol oxidation over the prepared catalysts. The reaction rate and TOF values were calculated at a glycerol conversion of less than 10.0%. Compared to Pt/C, the reaction rate and TOF for PtCu/C were conditions. Specifically, the reaction rate and TOF of the PtCu/C catalyst at pH 13 were 2.93 and 6.65 times higher than those of Pt/C, respectively. This result demonstrates that the reaction kinetics of PtCu/C is better than that of Pt/C with an increasing pH, which verifies that the Cu species enhances the reaction activity for the EGOR at high pH conditions. To compare a more detailed reaction chemistry with the prepared catalysts, the product selectivity of Pt/C and PtCu/C was examined at a similar conversion level of about 20.0%, as shown in Figure 7c,d. The reaction time in the electrochemical batch reactor was adjusted to about a 20.0% conversion level. At acidic (pH 0.3) and neutral (pH 6) conditions, the Pt/C and PtCu/C catalysts exhibited similar product distributions, producing GAD and GLA chemicals as the main products. Small amounts of GCA, TTA, and DHA were also produced as side product at the conditions. At an alkaline condition (pH 13), GLA was the major product for both catalysts and LA and OXA were additionally produced. Interestingly, in the case of the PtCu/C catalyst at a high pH condition, the selectivities of TTA and OXA tended to increase as the selectivity of LA decreased. This selectivity difference between Pt/C and PtCu/C may be related to the changed reaction pathways of the EGOR by the Cu addition into the Pt catalyst.
In order to know and understand the effect of the Cu addition on Pt in an OH- group-rich environment, we performed additional EGOR experiments at high basic conditions of pH 13, 13.7, and 14 (Figure 8). Comparing the calculated reaction rate and TOF values of Figure 8a,b, the reaction kinetics for the PtCu/C were improved compared to Pt/C by increasing the pH from 13 to 14. At a similar conversion level of about 30.0%, the product selectivity of Pt/C and PtCu/C was also compared at the conditions of pH 13, 13.7, and 14 (Figure 8c,d). As the pH condition increased from 13 to 14, the PtCu/C catalyst produced more TTA and OXA, while the Pt/C catalyst generated LA product from the EGOR. This suggests that the Cu addition on Pt creates a change in the reaction pathways for the EGOR and the Cu species plays a critical role for the catalytic glycerol oxidation in the OH- group-rich environment.
The proposed reaction pathways for the EGOR in the prepared catalysts are presented in Scheme 1. In the reaction pathway of primary alcohol oxidation, glycerol is first oxidized to GAD, which is subsequently oxidized to GLA. GLA is further oxidized to TTA. GLA can also be oxidized into GCA by C-C bond cleavage, which can be further oxidized to OXA. In the reaction pathway of secondary alcohol oxidation, DHA is first produced from glycerol and then DHA can be oxidized to LA, which can be further oxidized to FA by C-C bond cleavage. At acidic and neutral conditions, both Pt/C and PtCu/C catalysts showed similar product distribution, producing the major GAD and GLA chemicals. This result indicates that the Pt/C and PtCu/C catalysts mainly corresponded to the reaction pathway of primary alcohol oxidation at those conditions. In the OH- group-rich environment of a high pH condition, the PtCu/C catalyst generated more oxidized TTA and OXA products compared to the Pt/C catalyst, decreasing the LA selectivity. This means that the Cu addition to Pt followed primary alcohol oxidation pathways more favorable in the OH- group-rich environment than only Pt. The increased catalytic oxidation activity and changed reaction pathways on the PtCu alloy at a high pH condition may be associated with enhanced C-C bond cleavage ability of PtCu alloy and surface CuO species together with facilitating the adsorption of the OH group [18].

3. Materials and Methods

3.1. Materials

For the EGOR, commercial 20 wt% Pt/C (Premetek) and 20 wt% PtCu/C (atomic ratio 1:1, Premetek, State College, PA, USA) catalysts were purchased. To prepare catalyst inks for the electrochemical glycerol oxidation reaction testing, purchased catalysts, 5 wt% Nafion® ionomer solution (D521, Dupont, Wilmington, DE, USA), ethanol (99.9% Samchun Pure Chemical, Seoul, Republic of Korea), and 2-propanol (99.5%, Samchun Pure Chemical) were used. Titanium paper (Beakert, Shanghai, China) was used as a substrate for fabricating a catalyst electrode for electrocatalytic glycerol oxidation batch reactor testing. The chemicals used in the reactant solutions, standards, and mobile phase were glycerol (GLY) (≥99.0%, liquid, Junsei Chemical, Tokyo, Japan), DL-glyceric acid (GLA) (20.0% in water, Tokyo Chemical Industry, Tokyo, Japan), glycolic acid (GCA) (≥98.0%, solid, Sigma-Aldrich), D-(+)-glyceraldehyde (GAD) (≥98.0%, liquid, Sigma-Aldrich, St. Louis, MO, USA), oxalic acid (OXA) (≥99.0%, solid, Sigma-Aldrich), tartronic acid (TTA) (≥97.0%, solid, Sigma-Aldrich), dihydroxyacetone (DHA) (Pharmaceutical secondary Standard; Certified Reference Material, solid, Sigma-Aldrich), DL-lactic acid (LA) (85.0% in water, Tokyo Chemical Industry), formic acid (FA) (85.0%, liquid, Samchun), and 0.005 M H2SO4 (Samchun Pure Chemical) solution; 0.5 M H2SO4 (Samchun Pure Chemical) and 0.1~1 M KOH (Samchun Pure Chemical) solutions were used as a reaction medium for conducting pH controlled experiments, and a 0.1 M Na2SO4 solution was also prepared by dissolving sodium sulfate (≥99.0%, solid, Sigma-Aldrich) in distilled water.

3.2. Methods

3.2.1. Physicochemical Characterization

The crystal structure was examined by X-ray diffraction (XRD, D/Max 2200, Rigaku, Tokyo, Japan). The XRD patterns were recorded using an X-ray diffractometer with a Cu Kα source. Thermogravimetric analysis (TGA, SDT Q600, TA instruments, New Castle, DE, USA) of the catalysts was conducted from 20 °C to 900 °C by ramping the temperature at a rate of 5 °C min−1 under an air atmosphere. The bulk ratio of Pt and Cu of the PtCu/C was determined by inductively coupled plasma optical emission spectrometry (ICP-OES, iCAP 6300 Duo view, Thermo Scientific, Waltham, MA, USA). The morphology and particle size distribution of the catalysts were examined by field-emission transmission electron microscopy (FE-TEM, Tecnai G2 F30 S-Twin, FEI, Hillsboro, OR, USA) at 300 kV. X-ray photoelectron spectroscopy (XPS, Thermo VG Scientific, Waltham, MA, USA) analysis was carried out to measure the surface chemical states using an X-ray photoelectron spectrometer with an Al Kα source. All the binding energies of the XPS spectra were corrected using the carbon line (284.7 eV) as a reference. X-ray absorption spectroscopy (XAS) was carried out on the 7D beamline of the Pohang Accelerator Laboratory (PAL, PLS-II, 3.0 GeV, Republic of Korea). We collected the X-ray absorption near edge structure (XANES) and extended X-ray absorption fine structure (EXAFS) data at the Pt L3-edge and Cu K-edge. The XANES and EXAFS data were fitted using the ATHENA and ARTEMIS software programs, respectively.

3.2.2. Electrochemical Performance Measurement in an Electrochemical Half-Cell System

All the electrochemical performance tests were conducted in a three-electrode half-cell system using a potentiostat (ZIVE MP2A, WonATech, Seoul, Republic of Korea) at room temperature. Pt wire, Ag/AgCl (1 M KCl) or Hg/HgO (1 M NaOH), and catalysts-coated glassy carbon were used as counter, reference, and working electrode, respectively. The catalyst inks were prepared to coat the working electrode with catalysts; 10 mg of Pt/C and PtCu/C were dispersed in mixed solutions of 1 mL of distilled water, 0.2 mL of absolute ethanol, and 40 μL of a 5 wt% Nafion® ionomer solution via ultrasonication for 1 h. For the electrochemical half-cell tests, 4.5 μL of the Pt/C (Pt loading amount of 0.11 mg cm−2) and PtCu/C (Pt loading amount of 0.08 mg cm−2) catalyst inks was loaded onto a glassy carbon (active area of 0.071 cm2), and dried for 5 min. For measurement of the electrochemical surface area (ECSA), cyclic voltammetry (CV) tests were carried out in an N2-purged 0.5 M H2SO4 solution over a potential range of 0.054 to 1.254 V (RHE vs. Ag/AgCl) at a scan rate of 50 mV s−1. The electrocatalytic activity tests of the catalysts in N2-purged 1 M glycerol in acid (0.5 M H2SO4, pH 0.3), neutral (0.1 M Na2SO4, pH 6), and alkaline (0.1 M KOH, pH 13) were examined by CV tests at a scan rate of 50 mV s−1.

3.2.3. Electrocatalytic Glycerol Oxidation Reaction Performance in an Electrochemical Batch Reactor System

For the EGOR test in a batch reactor system, the working electrode was fabricated by spray coating on titanium paper (Beakert) with catalysts. The catalyst inks were prepared by the spray coating method: 30 mg of catalysts were dispersed in mixed solutions of 0.121 mL of distilled water, 0.6 mL of 2-propanol (99.5%, Samchun Pure Chemical), and 0.121 mL of 5 wt% Nafion® ionomer solution via ultrasonication for 2 h. The catalysts coated on titanium paper (active electrode size: 2 cm2) were dried in a convection oven at 60 °C overnight. As a result, the catalyst loaded amount coated on the titanium paper was 0.64 mg cm−2. The EGOR tests were examined in 6 mL of 0.1 M glycerol dissolved in different electrolytes (0.5 M H2SO4, 0.1 M Na2SO4, 0.1, 0.5, and 1 M KOH) at 60 °C with magnetic stirring at 900 rpm. After the EGOR testing with the prepared catalyst electrodes, the liquid reaction mixture was analyzed by high performance liquid chromatography (HPLC, YL9100, YL Instruments, Anyang-si, Republic of Korea) equipped with ultraviolet/visible (UV/Vis, YL9120, YL Instruments) and refractive index (RI, RI-201H, Shodex, Lagos, Nigeria) detectors. An ion-exchange ligand exchange column (Hi-Plex H, Agilent Technologies, Santa Clara, CA, USA) was used with a 0.005 M H2SO4 solution of mobile phase with a flow rate of 0.3 mL min−1. The column oven was set to 60 °C. After the reaction finished, liquid reaction mixtures were filtered with a 0.20 μm syringe filter and analyzed with the HPLC. The amount of consumed glycerol and the selectivities of the reaction products were quantified with an external calibration method.

4. Conclusions

In this study, we investigated the reaction performance and chemistry for the EGOR using Pt/C and PtCu/C catalysts to understand and confirm the effect of Cu addition on Pt by changing the pH condition. Physicochemical analyses, such as XRD, TEM, and XPS, revealed that the Pt and Cu were well alloyed through the incorporation of Cu atoms into the lattice of the Pt crystal and there were more CuO species on the PtCu/C catalyst surface. In the electrochemical performance testing for the EGOR, with an increasing pH, the PtCu/C catalyst exhibited lower onset potential and higher mass and specific activities than the Pt/C. In addition, the reaction rate and TOF for PtCu/C were greatly increased at a high pH compared to Pt/C, demonstrating that the Cu species improves the catalytic reaction activity for the EGOR at a high pH. In the OH- group-rich environment of a high pH condition, the PtCu/C catalyst also generated more oxidized TTA and OXA products than the Pt/C catalyst, verifying that the PtCu alloy follows primary alcohol oxidation pathways more favorably than only Pt. The increased EGOR activity and changed reaction pathways on the PtCu alloy catalyst in the OH group-rich environment may be related to the improved C-C bond breaking ability of the PtCu alloy and surface CuO species together with facilitating the adsorption of the OH group. This research provides the knowledge that optimizing and controlling the reaction pH conditions on metal-based catalysts can be critical factors for designing and developing future EGOR catalysts.

Supplementary Materials

The following supporting information can be downloaded at: https://www.mdpi.com/article/10.3390/catal13050892/s1, Figure S1: LSV curves of the Pt/C and PtCu/C catalysts in 1 M glycerol (a,b) with 0.5 M H2SO4, (c,d) with 0.1 M Na2SO4, and (e,f) with 0.1 M KOH electrolyte (scan rate: 5 mV s−1 at room temperature). Figure S1 (a,c,e) represent mass activity and Figure S1 (b,d,f) show specific activity, respectively; Figure S2: Tafel plot of the Pt/C and PtCu/C catalysts in 1 M glycerol with (a) 0.5 M H2SO4 (acid), (b) 0.1 M Na2SO4 (neutral), (c) 0.1 M KOH (alkaline) and (d) Comparison of the Tafel slope with increasing pH; Table S1: Comparison table of EGOR performances using Pt-based catalysts. References [53,54,55] are cited in the supplementary materials.

Author Contributions

Conceptualization, L.S.O. and H.J.K.; investigation, L.S.O. and J.H.; validation, L.S.O. and J.H.; formal analysis, L.S.O., J.H. and E.L.; data curation, L.S.O., J.H. and E.L.; writing—original draft preparation, L.S.O.; writing—review and editing, W.B.K. and H.J.K.; funding acquisition, W.B.K. and H.J.K.; project administration, H.J.K.; supervision, H.J.K. All authors have read and agreed to the published version of the manuscript.

Funding

This work was supported by the National Research Foundation of Korea (NRF), funded by the Ministry of Science and ICT [grant number: NRF-2020M3H4A1A02084591]. This research was also supported by the Basic Science Research Program through the National Research Foundation of Korea (NRF), funded by the Ministry of Science and ICT [grant number: NRF-2019R1A2C2088174].

Data Availability Statement

Not applicable.

Acknowledgments

We appreciate Jong Hyeok Park (Yonsei University) for the helpful discussions to improve this manuscript.

Conflicts of Interest

The authors declare no conflict of interest.

References

  1. Huber, G.W.; Iborra, S.; Corma, A. Synthesis of Transportation Fuels from Biomass: Chemistry, Catalysts, and Engineering. Chem. Rev. 2006, 106, 4044–4098. [Google Scholar] [CrossRef] [Green Version]
  2. Hu, Y.; He, Q.; Xu, C. Catalytic Conversion of Glycerol into Hydrogen and Value-Added Chemicals: Recent Research Advances. Catalysts 2021, 11, 1455. [Google Scholar] [CrossRef]
  3. Salaheldeen, M.; Mariod, A.A.; Aroua, M.K.; Rahman, S.M.A.; Soudagar, M.E.M.; Fattah, I.M.R. Current State and Perspectives on Transesterification of Triglycerides for Biodiesel Production. Catalysts 2021, 11, 1121. [Google Scholar] [CrossRef]
  4. Tabassum, N.; Pothu, R.; Pattnaik, A.; Boddula, R.; Balla, P.; Gundeboyina, R.; Challa, P.; Rajesh, R.; Perugopu, V.; Mameda, N.; et al. Heterogeneous Catalysts for Conversion of Biodiesel-Waste Glycerol into High-Added-Value Chemicals. Catalysts 2022, 12, 767. [Google Scholar] [CrossRef]
  5. Anitha, M.; Kamarudin, S.K.; Kofli, N.T. The potential of glycerol as a value-added commodity. Chem. Eng. J. 2016, 295, 119–130. [Google Scholar] [CrossRef]
  6. Abdul Raman, A.A.; Tan, H.W.; Buthiyappan, A. Two-Step Purification of Glycerol as a Value Added by Product from the Biodiesel Production Process. Front. Chem. 2019, 7, 774. [Google Scholar] [CrossRef] [Green Version]
  7. Yang, L.; Jiang, Y.; Zhu, Z.; Hou, Z. Selective oxidation of glycerol over different shaped WO3 supported Pt NPs. Mol. Catal. 2022, 523, 111545. [Google Scholar] [CrossRef]
  8. Monteiro, M.R.; Kugelmeier, C.L.; Pinheiro, R.S.; Batalha, M.O.; da Silva César, A. Glycerol from biodiesel production: Technological paths for sustainability. Renew. Sust. Energy Rev. 2018, 88, 109–122. [Google Scholar] [CrossRef]
  9. D’Angelo, S.C.; Dall’Ara, A.; Mondelli, C.; Pérez-Ramírez, J.; Papadokonstantakis, S. Techno-Economic Analysis of a Glycerol Biorefinery. ACS Sustain. Chem. Eng. 2018, 6, 16563–16572. [Google Scholar] [CrossRef]
  10. Chun Minh, A.L.; Samudrala, S.P.; Bhattacharya, S. Valorisation of glycerol through catalytic hydrogenolysis routes for sustainable production of value-added C3 chemicals: Current and future trends. Sustain. Energy Fuels 2022, 6, 596–639. [Google Scholar] [CrossRef]
  11. Dodekatos, G.; Schünemann, S.; Tüysüz, H. Recent Advances in Thermo-, Photo-, and Electrocatalytic Glycerol Oxidation. ACS Catal. 2018, 8, 6301–6333. [Google Scholar] [CrossRef]
  12. Pagliaro, M.V.; Bellini, M.; Bevilacqua, M.; Filippi, J.; Folliero, M.G.; Marchionni, A.; Miller, H.A.; Oberhauser, W.; Caporali, S.; Innocenti, M.; et al. Carbon supported Rh nanoparticles for the production of hydrogen and chemicals by the electroreforming of biomass-derived alcohols. RSC Adv. 2017, 7, 13971–13978. [Google Scholar] [CrossRef] [Green Version]
  13. Fan, L.; Liu, B.; Liu, X.; Senthilkumar, N.; Wang, G.; Wen, Z. Recent Progress in Electrocatalytic Glycerol Oxidation. Energy Technol. 2020, 9, 2000804. [Google Scholar] [CrossRef]
  14. Zhou, Y.; Shen, Y.; Xi, J.; Luo, X. Selective Electro-Oxidation of Glycerol to Dihydroxyacetone by PtAg Skeletons. ACS Appl. Mater. Interfaces 2019, 11, 28953–28959. [Google Scholar] [CrossRef]
  15. Kim, D.; Oh, L.S.; Tan, Y.C.; Song, H.; Kim, H.J.; Oh, J. Enhancing Glycerol Conversion and Selectivity toward Glycolic Acid via Precise Nanostructuring of Electrocatalysts. ACS Catal. 2021, 11, 14926–14931. [Google Scholar] [CrossRef]
  16. Chen, Z.; Liu, C.; Zhao, X.; Yan, H.; Li, J.; Lyu, P.; Du, Y.; Xi, S.; Chi, K.; Chi, X.; et al. Promoted Glycerol Oxidation Reaction in an Interface-Confined Hierarchically Structured Catalyst. Adv. Mater. 2019, 31, e1804763. [Google Scholar] [CrossRef]
  17. Lin, C.; Dong, C.; Kim, S.; Lu, Y.; Wang, Y.; Yu, Z.; Gu, Y.; Gu, Z.; Lee, D.K.; Zhang, K.; et al. Photo-Electrochemical Glycerol Conversion over a Mie Scattering Effect Enhanced Porous BiVO4 Photoanode. Adv. Mater. 2023, 35, e2209955. [Google Scholar] [CrossRef]
  18. Oh, L.S.; Park, M.; Park, Y.S.; Kim, Y.; Yoon, W.; Hwang, J.; Lim, E.; Park, J.H.; Choi, S.M.; Seo, M.H.; et al. How to Change the Reaction Chemistry on Nonprecious Metal Oxide Nanostructure Materials for Electrocatalytic Oxidation of Biomass-Derived Glycerol to Renewable Chemicals. Adv. Mater. 2023, 35, e2203285. [Google Scholar] [CrossRef]
  19. Xiong, L.; Qi, H.; Zhang, S.; Zhang, L.; Liu, X.; Wang, A.; Tang, J. Highly Selective Transformation of Biomass Derivatives to Valuable Chemicals by Single-Atom Photocatalyst Ni/TiO2. Adv. Mater. 2023, 35, e2209646. [Google Scholar] [CrossRef]
  20. Han, J.; Kim, Y.; Jackson, D.H.K.; Chang, H.; Kim, H.W.; Lee, J.; Kim, J.-R.; Noh, Y.; Kim, W.B.; Lee, K.-Y.; et al. Enhanced catalytic performance and changed reaction chemistry for electrochemical glycerol oxidation by atomic-layer-deposited Pt-nanoparticle catalysts. Appl. Catal. B 2020, 273, 119037. [Google Scholar] [CrossRef]
  21. Lee, D.; Kim, Y.; Kwon, Y.; Lee, J.; Kim, T.-W.; Noh, Y.; Kim, W.B.; Seo, M.H.; Kim, K.; Kim, H.J. Boosting the electrocatalytic glycerol oxidation performance with highly-dispersed Pt nanoclusters loaded on 3D graphene-like microporous carbon. Appl. Catal. B 2019, 245, 555–568. [Google Scholar] [CrossRef]
  22. Lima, C.C.; Rodrigues, M.V.F.; Neto, A.F.M.; Zanata, C.R.; Pires, C.T.G.V.M.T.; Costa, L.S.; Solla-Gullón, J.; Fernández, P.S. Highly active Ag/C nanoparticles containing ultra-low quantities of sub-surface Pt for the electrooxidation of glycerol in alkaline media. Appl. Catal. B 2020, 279, 119369. [Google Scholar] [CrossRef]
  23. Zhou, Y.; Shen, Y.; Xi, J. Seed-mediated synthesis of PtxAuy@Ag electrocatalysts for the selective oxidation of glycerol. Appl. Catal. B 2019, 245, 604–612. [Google Scholar] [CrossRef]
  24. Kim, H.J.; Lee, J.; Green, S.K.; Huber, G.W.; Kim, W.B. Selective glycerol oxidation by electrocatalytic dehydrogenation. ChemSusChem 2014, 7, 1051–1056. [Google Scholar] [CrossRef]
  25. Lee, S.; Kim, H.J.; Lim, E.J.; Kim, Y.; Noh, Y.; Huber, G.W.; Kim, W.B. Highly selective transformation of glycerol to dihydroxyacetone without using oxidants by a PtSb/C-catalyzed electrooxidation process. Green Chem. 2016, 18, 2877–2887. [Google Scholar] [CrossRef]
  26. Lee, D.; Kim, Y.; Han, H.; Kim, W.B.; Chang, H.; Chung, T.-M.; Han, J.H.; Kim, H.W.; Kim, H.J. Atomic-layer-deposited SnO2 on Pt/C prevents sintering of Pt nanoparticles and affects the reaction chemistry for the electrocatalytic glycerol oxidation reaction. J. Mater. Chem. A 2020, 8, 15992–16005. [Google Scholar] [CrossRef]
  27. Benipal, N.; Qi, J.; Liu, Q.; Li, W. Carbon nanotube supported PdAg nanoparticles for electrocatalytic oxidation of glycerol in anion exchange membrane fuel cells. Appl. Catal. B 2017, 210, 121–130. [Google Scholar] [CrossRef] [Green Version]
  28. Xie, Y.; Sun, L.; Pan, X.; Zhou, Z.; Zheng, Y.; Yang, X.; Zhao, G. Carbon paper supported gold nanoflowers for tunable glycerol electrooxidation boosting efficient hydrogen evolution. Carbon 2023, 203, 88–96. [Google Scholar] [CrossRef]
  29. Tran, G.-S.; Vo, T.-G.; Chiang, C.-Y. Earth-abundant manganese oxide nanoneedle as highly efficient electrocatalyst for selective glycerol electro-oxidation to dihydroxyacetone. J. Catal. 2021, 404, 139–148. [Google Scholar] [CrossRef]
  30. Han, X.; Sheng, H.; Yu, C.; Walker, T.W.; Huber, G.W.; Qiu, J.; Jin, S. Electrocatalytic Oxidation of Glycerol to Formic Acid by CuCo2O4 Spinel Oxide Nanostructure Catalysts. ACS Catal. 2020, 10, 6741–6752. [Google Scholar] [CrossRef]
  31. Ahmad, M.S.; Ng, K.H.; Chen, C.L.; Kabir, F.; Witoon, T.; Wu, T.Y.; Cheng, C.K. Nitrogen-phosphorous co-doped palladium electrocatalyst for glycerol electro-oxidation reaction (GEOR): An efficient system for mesoxalic acid and dihydroxyacetone production. Fuel 2023, 333, 126471. [Google Scholar] [CrossRef]
  32. Liu, C.; Hirohara, M.; Maekawa, T.; Chang, R.; Hayashi, T.; Chiang, C.-Y. Selective electro-oxidation of glycerol to dihydroxyacetone by a non-precious electrocatalyst—CuO. Appl. Catal. B 2020, 265, 118543. [Google Scholar] [CrossRef]
  33. Lee, S.; Kim, H.J.; Choi, S.M.; Seo, M.H.; Kim, W.B. The promotional effect of Ni on bimetallic PtNi/C catalysts for glycerol electrooxidation. Appl. Catal. A Gen. 2012, 429–430, 39–47. [Google Scholar] [CrossRef]
  34. Kim, H.J.; Choi, S.M.; Green, S.; Tompsett, G.A.; Lee, S.H.; Huber, G.W.; Kim, W.B. Highly active and stable PtRuSn/C catalyst for electrooxidations of ethylene glycol and glycerol. Appl. Catal. B 2011, 101, 366–375. [Google Scholar] [CrossRef]
  35. Simões, M.; Baranton, S.; Coutanceau, C. Enhancement of catalytic properties for glycerol electrooxidation on Pt and Pd nanoparticles induced by Bi surface modification. Appl. Catal. B 2011, 110, 40–49. [Google Scholar] [CrossRef]
  36. Kim, Y.; Kim, H.W.; Lee, S.; Han, J.; Lee, D.; Kim, J.R.; Kim, T.W.; Kim, C.U.; Jeong, S.Y.; Chae, H.J.; et al. The Role of Ruthenium on Carbon-Supported PtRu Catalysts for Electrocatalytic Glycerol Oxidation under Acidic Conditions. ChemCatChem 2017, 9, 1683–1690. [Google Scholar] [CrossRef] [Green Version]
  37. Zhou, Y.; Shen, Y.; Piao, J. Sustainable Conversion of Glycerol into Value-Added Chemicals by Selective Electro-Oxidation on Pt-Based Catalysts. ChemElectroChem 2018, 5, 1636–1643. [Google Scholar] [CrossRef]
  38. Sieben, J.M.; Alvarez, A.E.; Sanchez, M.D. Glycerol electrooxidation on carbon-supported Pt-CuO and PtCu-CuO catalysts. Electrochim. Acta 2023, 439, 141672. [Google Scholar] [CrossRef]
  39. Hu, W.; Knight, D.; Lowry, B.; Varma, A. Selective Oxidation of Glycerol to Dihydroxyacetone over Pt-Bi/C Catalyst: Optimization of Catalyst and Reaction Conditions. Ind. Eng. Chem. Res. 2010, 49, 10876–10882. [Google Scholar] [CrossRef]
  40. Castagna, R.M.; Sieben, J.M.; Alvarez, A.E.; Duarte, M.M.E. Electrooxidation of ethanol and glycerol on carbon supported PtCu nanoparticles. Int. J. Hydrogen Energy 2019, 44, 5970–5982. [Google Scholar] [CrossRef]
  41. Dai, C.; Sun, L.; Liao, H.; Khezri, B.; Webster, R.D.; Fisher, A.C.; Xu, Z.J. Electrochemical production of lactic acid from glycerol oxidation catalyzed by AuPt nanoparticles. J. Catal. 2017, 356, 14–21. [Google Scholar] [CrossRef]
  42. Kwon, Y.; Birdja, Y.; Spanos, I.; Rodriguez, P.; Koper, M.T.M. Highly Selective Electro-Oxidation of Glycerol to Dihydroxyacetone on Platinum in the Presence of Bismuth. ACS Catal. 2012, 2, 759–764. [Google Scholar] [CrossRef]
  43. Jin, X.; Yan, H.; Zeng, C.; Thapa, P.S.; Subramaniam, B.; Chaudhari, R.V. Phase Transformed PtFe Nanocomposites Show Enhanced Catalytic Performances in Oxidation of Glycerol to Tartronic Acid. Ind. Eng. Chem. Res. 2017, 56, 13157–13164. [Google Scholar] [CrossRef]
  44. Nie, R.; Liang, D.; Shen, L.; Gao, J.; Chen, P.; Hou, Z. Selective oxidation of glycerol with oxygen in base-free solution over MWCNTs supported PtSb alloy nanoparticles. Appl. Catal. B 2012, 127, 212–220. [Google Scholar] [CrossRef]
  45. Peng, X.; Chen, D.; Yang, X.; Wang, D.; Li, M.; Tseng, C.C.; Panneerselvam, R.; Wang, X.; Hu, W.; Tian, J.; et al. Microwave-Assisted Synthesis of Highly Dispersed PtCu Nanoparticles on Three-Dimensional Nitrogen-Doped Graphene Networks with Remarkably Enhanced Methanol Electrooxidation. ACS Appl. Mater. Interfaces 2016, 8, 33673–33680. [Google Scholar] [CrossRef]
  46. Chen, D.; Zhao, Y.; Peng, X.; Wang, X.; Hu, W.; Jing, C.; Tian, S.; Tian, J. Star-like PtCu nanoparticles supported on graphene with superior activity for methanol electro-oxidation. Electrochim. Acta 2015, 177, 86–92. [Google Scholar] [CrossRef]
  47. Oh, L.S.; Kim, J.Y.; Kim, H.W.; Han, J.; Lim, E.; Kim, W.B.; Park, J.H.; Kim, H.J. Unveiling the enhanced electrocatalytic activity at electrochemically synthesized Pt-WOx hybrid nanostructure interfaces. Chem. Commun. 2021, 57, 11165–11168. [Google Scholar] [CrossRef]
  48. Lee, D.; Kim, Y.; Kim, H.W.; Choi, M.; Park, N.; Chang, H.; Kwon, Y.; Park, J.H.; Kim, H.J. In situ electrochemically synthesized Pt-MoO3−x nanostructure catalysts for efficient hydrogen evolution reaction. J. Catal. 2020, 381, 1–13. [Google Scholar] [CrossRef]
  49. Mintsouli, I.; Georgieva, J.; Armyanov, S.; Valova, E.; Avdeev, G.; Hubin, A.; Steenhaut, O.; Dille, J.; Tsiplakides, D.; Balomenou, S.; et al. Pt-Cu electrocatalysts for methanol oxidation prepared by partial galvanic replacement of Cu/carbon powder precursors. Appl. Catal. B 2013, 136–137, 160–167. [Google Scholar] [CrossRef]
  50. Zou, X.; Fan, H.; Tian, Y.; Zhang, M.; Yan, X. Chemical bath deposition of Cu2O quantum dots onto ZnO nanorod arrays for application in photovoltaic devices. RSC Adv. 2015, 5, 23401–23409. [Google Scholar] [CrossRef]
  51. Hu, B.; Yuan, J.; Zhang, J.; Shu, Q.; Guan, D.; Yang, G.; Zhou, W.; Shao, Z. High activity and durability of a Pt–Cu–Co ternary alloy electrocatalyst and its large-scale preparation for practical proton exchange membrane fuel cells. Compos. B Eng. 2021, 222, 109082. [Google Scholar] [CrossRef]
  52. Zhou, Z.; Wei, L.; Wang, Y.; Karahan, H.E.; Chen, Z.; Lei, Y.; Chen, X.; Zhai, S.; Liao, X.; Chen, Y. Hydrogen evolution reaction activity of nickel phosphide is highly sensitive to electrolyte pH. J. Mater. Chem. A 2017, 5, 20390–20397. [Google Scholar] [CrossRef]
  53. Habibi, B.; Ghaderi, S. Synthesis, characterization and electrocatalytic activity of Co@Pt nanoparticles supported on carbon-ceramic substrate for fuel cell applications. Int. J. Hydrogen Energy 2015, 40, 5115–5125. [Google Scholar] [CrossRef]
  54. Pupo, M.M.S.; López-Suárez, F.E.; Bueno-López, A.; Meneses, C.T.; Eguiluz, K.I.B.; Salazar-Banda, G.R. Sn@Pt and Rh@Pt core–shell nanoparticles synthesis for glycerol oxidation. J. Appl. Electrochem. 2014, 45, 139–150. [Google Scholar] [CrossRef]
  55. Zuo, Y.; Wu, L.; Cai, K.; Li, T.; Yin, W.; Li, D.; Li, N.; Liu, J.; Han, H. Platinum Dendritic-Flowers Prepared by Tellurium Nanowires Exhibit High Electrocatalytic Activity for Glycerol Oxidation. ACS Appl. Mater. Interfaces 2015, 7, 17725–17730. [Google Scholar] [CrossRef]
Figure 1. (a) XRD patterns of the Pt/C and PtCu/C catalysts with Pt and PtCu characteristic peaks (JCPDS No. 04-0802 and 42-1326) and (b) TGA curves of the Pt/C and PtCu/C catalysts to determine the metal loading amount.
Catalysts 13 00892 g001
Figure 2. TEM images of (a) Pt/C and (c) PtCu/C catalysts with the corresponding particle size distribution (inset). Lattice distances for Pt (111 and 200) and PtCu (111 and 200) planes measured in HR-TEM images of (b) Pt/C and (d) PtCu/C catalysts.
Catalysts 13 00892 g002
Figure 3. XPS spectra of (a) Pt 4f, (b) Cu 2p, and (c) O 1s regions for the Pt/C and PtCu/C catalysts.
Catalysts 13 00892 g003
Figure 4. (a,c) The XANES and (b,d) K3-weighted FT-EXAFS spectra of the Pt/C and PtCu/C catalysts at the Pt L3 and Cu K-edges with the Pt and Cu foil as references.
Catalysts 13 00892 g004
Figure 5. ECSA analysis based on H2 adsorption-desorption area measurement of the Pt/C and PtCu/C catalysts. CV curves of (a) Pt/C and (b) PtCu/C catalysts in 0.5 M H2SO4 at scan rate of 50 mV s−1.
Catalysts 13 00892 g005
Figure 6. CV curves of the Pt/C and PtCu/C catalysts in 1 M glycerol (a,b) with 0.5 M H2SO4, (c,d) with 0.1 M Na2SO4, and (eh) with 0.1 M KOH electrolyte (scan rate: 50 mV s−1 at room temperature). Figure (a,c,e) represents mass activity and Figure (b,d,f) shows specific activity, respectively. Figure (c,f,i) shows a cycle stability plot in 1 M glycerol with increasing pH from 0.3 to 13.
Catalysts 13 00892 g006
Figure 7. Catalytic activity and product analysis of Pt/C and PtCu/C catalysts for the EGOR. (a) Reaction rate and (b) TOF of Pt/C and PtCu/C catalysts in 0.1 M glycerol with increasing pH from 0.3 to 13. Comparison of product selectivity at a similar glycerol conversion level of about 20.0% for the (c) Pt/C and (d) PtCu/C catalysts in 0.1 M glycerol with increasing pH from 0.3 to 13.
Catalysts 13 00892 g007
Figure 8. Comparison of catalytic activity and product analysis of Pt/C and PtCu/C catalysts for the EGOR at high pH conditions. (a) Reaction rate and (b) TOF of Pt/C and PtCu/C catalysts in 0.1 M glycerol with a range of pH from 13 to 14. Comparison of product selectivity at a similar glycerol conversion level of about 30.0% for the (c) Pt/C and (d) PtCu/C catalysts in 0.1 M glycerol with increasing pH from 13 to 14.
Catalysts 13 00892 g008
Scheme 1. Proposed reaction pathways over the Pt/C and PtCu/C catalysts for EGOR.
Catalysts 13 00892 sch001
Table 1. Structural and chemical information of the Pt/C and PtCu/C catalysts characterized by TEM, XRD, TGA, ICP-OES, and XPS analyses.
CatalystMetal Loading 1
(wt%)
Particle Size
(nm)
2θmax 4
(°)
Lattice
Parameter 5
(Å)
Pt/Cu
(Atomic Ratio)
TEM 2XRD 3ICP-OES 6XPS 7
Pt/C20.92.5 ± 0.52.867.13.938--
PtCu/C23.53.5 ± 1.23.969.83.8060.811.38
1 Metal amounts loaded on the carbon support measured by TGA analysis. 2 Average particle size of the catalysts calculated using at least 100 visible particles from TEM images. 3 Mean particle size of the catalysts calculated using the Scherrer equation from the XRD analysis. 4 The 2θ angular position of the Pt (220) reflection peak. 5 Lattice parameter value calculated from the XRD analysis. 6 Pt/Cu atomic ratio (bulk) of catalysts estimated from the ICP-OES analysis. 7 Pt/Cu atomic ratio (surface) of catalysts estimated from the XPS analysis.
Table 2. Summary of the peak assignment, binding energy, and relative area of deconvoluted peaks for the Pt/C and PtCu/C catalysts measured by XPS analysis.
CatalystsBinding Energy (eV)
/Relative Area (%)
Binding Energy (eV)
/Relative Area (%)
Binding Energy (eV)
/Relative Area (%)
Pt/CPt 4f7/2Pt071.15/33.40-O2−530.93/20.40
Pt2+72.38/15.60
Pt4+76.09/6.90C-O532.38/62.10
Pt 4f5/2Pt074.50/26.30
Pt2+75.73/12.30C=O533.71/17.50
Pt4+79.44/5.50
PtCu/CPt 4f7/2Pt071.08/26.10Cu 2p3/2Cu0932.13/35.80O2−530.48/17.10
Pt2+72.29/22.80 Cu2+934.35/30.10
Pt4+76.00/7.00 C-O532.18/65.60
Pt 4f5/2Pt074.43/20.50Cu 2p1/2Cu0951.88/18.50
Pt2+75.64/18.00 Cu2+954.10/15.60C=O533.58/17.20
Pt4+79.35/5.50
Table 3. Summary of the FT-EXAFS fitting parameters for the Pt/C and PtCu/C catalysts at the Pt L3-edge and Cu K-edge.
EdgeCatalystAtom PairCoordination
Number
(N)
R 1
(Å)
ΔE0 2
(eV)
σ 2,3
(10−32)
R-Factor 4
(%)
Pt
L3-edge
Pt foilPt—Pt12.02.77 ± 0.008.2 ± 0.74.8 ± 0.30.0027
Pt/CPt—O2.6 ± 0.52.03 ± 0.0114.8 ± 2.04.2 ± 1.50.0147
Pt—Pt4.2 ± 1.02.77 ± 0.0112.4 ± 2.56.3 ± 1.1
PtCu/CPt—O2.9 ± 0.72.02 ± 0.0213.6 ± 2.75.4 ± 2.30.0124
Pt—Cu0.9 ± 1.52.68 ± 0.1022.4 ± 15.49.6 ± 11.2
Pt—Pt3.0 ± 2.12.77 ± 0.029.6 ± 5.24.7 ± 2.7
Cu
K-edge
Cu foilCu—Cu12.02.54 ± 0.013.84 ± 1.038.4 ± 0.60.0073
PtCu/CCu—O1.8 ± 1.01.91 ± 0.03−4.30 ± 7.793.2 ± 4.00.0102
Cu—Pt2.2 ± 2.32.66 ± 0.03−3.16 ± 8.214.1 ± 4.1
Cu—Cu3.1 ± 2.72.62 ± 0.07−8.05 ± 9.3812.5 ± 7.8
1 Interatomic distance. 2 Edge-energy shift. 3 Debye-Waller factor. 4 R-factor is used to evaluate the goodness of the fitting.
Table 4. Electrochemical performance comparison of the Pt/C and PtCu/C catalysts for EGOR.
CatalystFeed Solution
(1 M Glycerol
in Electrolyte)
ECSA 1
(m2 gPt−1)
Onset
Potential 2
(V vs. RHE)
Tafel
Slope 2
(mV dec−1)
Peak
Potential 3
(V vs. RHE)
Mass
Activity 4
(mA mgPt−1)
Specific
Activity 4
(mA cmPt−2)
Pt/C0.5 M H2SO461.50.45196.500.87181.90 ± 6.100.30 ± 0.01
0.1 M Na2SO40.64175.201.23160.70 ± 13.700.26 ± 0.02
0.1 M KOH0.62160.801.02190.60 ± 9.740.31 ± 0.02
PtCu/C0.5 M H2SO445.30.54133.800.86156.20 ± 3.140.34 ± 0.01
0.1 M Na2SO40.67121.001.20163.20 ± 5.710.36 ± 0.01
0.1 M KOH0.28107.801.01199.80 ± 10.000.44 ± 0.02
1 Electrochemical active surface area calculated by CV polarization curve in Figure 5. 2 Onset potential and Tafel slope determined using a 1M glycerol solution dissolved in different electrolytes. 3 Forward anodic peak potential estimated from maximum current density. 4 Calculated mass activity (current divided by Pt mass) and specific activity (current divided by ECSA).
Disclaimer/Publisher’s Note: The statements, opinions and data contained in all publications are solely those of the individual author(s) and contributor(s) and not of MDPI and/or the editor(s). MDPI and/or the editor(s) disclaim responsibility for any injury to people or property resulting from any ideas, methods, instructions or products referred to in the content.

