1. Introduction
Due to its intricate structure, lignin is a material that is disregarded as a low-value byproduct or cheap source of energy, and its effective utilization rate is less than 2% [
1]. However, considering its high solubility and high oxygen content, lignin is regarded as a good raw material for the production of phenol, which is extensively utilized in the industry and medicine, as well as used as a base for phenolic resins, salicylic acid, and other chemicals [
2]. The main routes for lignin phenol production are chlorination, acid hydrolysis, and oxidation [
3,
4,
5]. During the production process, many poisonous and harmful substances are formed, including formaldehyde, sulfates, and chlorides. This complicates the subsequent treatment, and the procedure will entail a great deal of hazardous chemicals, leading to significant environmental contamination. In contrast, lignin can be successfully depolymerized by pyrolysis technology to yield a high-purity and high-value lysate [
4].
In terms of biomass conversion technology, pyrolysis is the most promising thermochemical conversion method for the large-scale development of biomass raw materials and the production of liquid fuels [
6]. Thermal cracking technology can realize the secondary exploitation of biomass energy, transform it into high-value-added products, and boost the economic benefits by converting efficient resources into gas–liquid–solid three-phase systems with a high-energy conversion rate. However, classic pyrolysis technology still has issues due to lignin’s weak thermal conductivity, its uneven temperature distribution, and the production of a substantial amount of poorly available carbon in place of bio-oil when preparing phenolic compounds from it. It has a water content of 15–30 wt.%, a high oxygen content, and limited availability [
4,
7,
8]. The high thermal conductivity and high stability of alkali metal molten carbonates make them excellent solutions to this issue. In earlier research, our team discovered that melting carbonate can encourage the depolymerization of biomass, with K and Na ions encouraging the depolymerization of lignin and the secondary monomolecular dissociation of methoxyphenyl. Salt pyrolysis can lower carbon dioxide production and carbon emissions [
9,
10,
11].
In our previous papers [
4,
7,
9], it was shown how the molten salt system helped deoxygenate biomass during pyrolysis. However, this approach produced bio-oil phenol products with limited selectivity while containing phenols, aldehydes, acids, and alcohols. The problem wherein functional groups cannot be released in time to participate in the process during lignin depolymerization can be resolved by the inclusion of catalysts, and this can significantly increase the reaction efficiency. It has been demonstrated that catalysts such as Zeolite Y, Termite Hill, and Anthill can improve the quality of bio-oil and lower the activation energy of pyrolysis reactions [
12,
13,
14,
15]. Such catalysts, however, are constrained by their inability to scatter in molten salt systems, which instead lowers the system’s catalytic activity. According to some reports, transition metals such as Ce, Mn, Co, and others can increase the selectivity, which, in turn, encourages the cracking of lignin’s β-O-4 and C–C bonds. Although cobalt-based catalysts are frequently employed to crack biomass, the high oxygen concentration of the resultant bio-oil prevents the use of the catalysts in industrial settings [
16]. Metal oxide catalysts can make the production of short-chain cracking products easier [
17]. Due to its extremely high oxygen exchange and storage capacities, ceria was used in the field of catalysis in an earlier study and demonstrated good chemical stability and coking resistance [
18]. This is useful when heterogeneously using cerium oxide in biomass pyrolysis. It is possible to combine molten salts and cerium oxide nanoparticles, owing to the high dispersion rate and suspension stability of cerium oxide nanoparticles in dense liquids. This in situ catalysis system has a higher contact area than ex situ catalysis, which encourages the cracking of lignin macromolecule fragments, lowers the formation of solid carbon, and increases the production of bio-oil [
19,
20]. Cerium oxide particles, however, tend to gather carbon and coke during in situ catalysis, which affects their floating stability and precipitation. A certain quantity of Fe loading can effectively increase the thermal stability of the catalyst, increase the catalytic efficiency, and effectively improve the quality of the bio-oil by reacting the stored carbon with carbon dioxide. Moreover, Ca, Mg, and Cu are significant for secondary cracking as well as gas-phase reforming.
In this study, the in situ pyrolysis of lignin was conducted using the coupling of ceria and molten salt pyrolysis. Regarding the pyrolysis of lignin, the impacts of pyrolysis temperature, residence duration, catalyst quantity, and other process variables were discussed. Four typical metal loadings—Fe, Cu, Mg, and Ca for catalytic pyrolysis—and the distribution of the products produced during pyrolysis were investigated. The resulting composite catalyst was also evaluated. This report is an essential resource for future research on lignin and the analysis of lysates. Additionally, the mechanism of lignin’s pyrolysis reaction in molten carbonates was established.
2. Results and Discussion
2.1. Effect of Temperature on Product Yield and Monophenol Selectivity
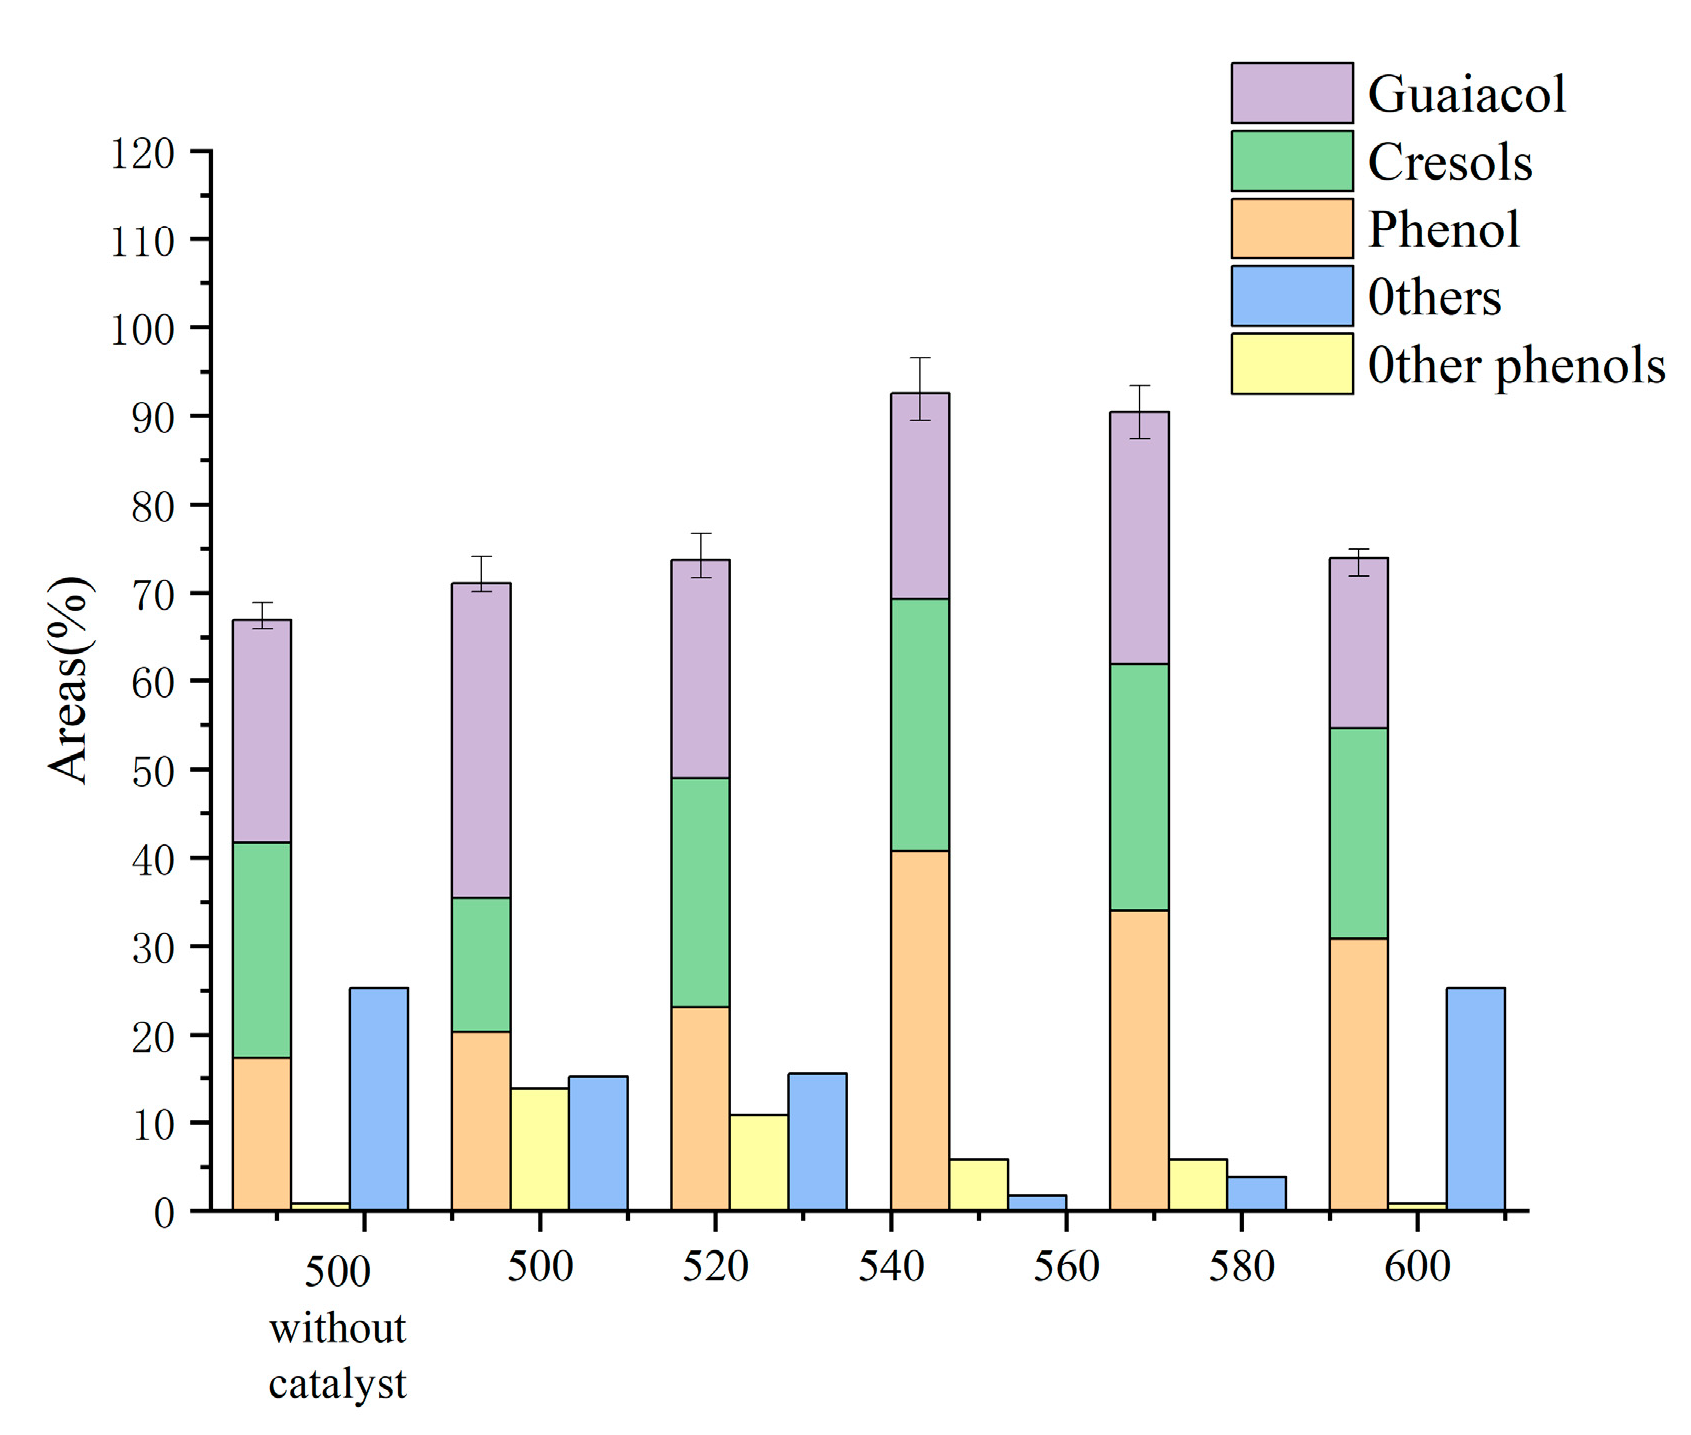
Figure 1 displays the yields of each product in the liquid phase. The yields of phenol and cresol both trended upward and subsequently downward in the 500 °C–600 °C period under investigation, reaching the maximum yields of 40.77 wt.% and 28.55 wt.% at 550 °C, respectively. Contrarily, the guaiacol content in the bio-oil, along with the amounts of acids, ketones, and alcohols, all showed a general trend of lowering, with the highest monophenol level stabilizing at 92.5 wt.%. In
Table 1, it is depicted how 1.5 g of cerium oxide affected the product distribution at various temperatures. As the temperature rose from 500 °C to 600 °C, the syngas product dramatically rose from 17 wt.% to 41.7 wt.%, whereas biochar and bio-oil, which followed the opposite pattern, fell from 43.7 wt.% and 39.3 wt.% to 35.5 wt.% and 22.8 wt.%, respectively. At 575 °C, the moisture content of the bio-oil fell from 80.3 wt.% to 70.8 wt.% before returning to 73.7 wt.%. The primary pyrolysis became more complete as the temperature rose, and numerous secondary pyrolysis events took place, yielding a considerable quantity of syngas.
The oxygen-containing functional groups that emerge during the progressive temperature increase are over-oxidized in the molten salt system, which is followed by decarboxylation and decarboxylation processes and results in the creation of substantial amounts of monophenols and small molecule gases [
21]. In addition, the phenolic hydroxyl groups are easily destroyed in the high-temperature molten salts [
6,
22], enabling the conversion of catechol to phenol. The high temperature enhances the catalytic effect of the metal ions, making the removal of methoxy easier and facilitating the conversion of guaiacol to phenol. The produced bio-oil is lesser useful as a result.
The output of phenol increased somewhat dramatically after the catalyst was added; however, the production of guaiacol significantly decreased. Coke and bio-oil production generally remained constant, with only a slight decline. The production of syngas quickly increased from 17.0 to 26.7 wt.%. The presence of the catalyst lengthened the compounds’ residence duration, and CeO2 accelerated the primary cracking reaction while increasing the production of acids and phenols during the chemical bond breakage process. In turn, methoxy breakage and methyl migration processes resulted in the production of additional phenols and cresols in the following principal cleavage product, guaiacol. Additionally, the removal of phenolic hydroxyl groups leads to an increase in the amount of free oxygen and hydrogen, which significantly raises the generation of small-molecule gases such as methane, carbon dioxide, hydrogen, and carbon monoxide. In terms of overall hydrogen production, in a subsequent study, we examined lignin’s pyrolysis properties at a reaction temperature of 550 °C.
2.2. Effect of Metal Loading on Product Yield and Monophenol Selectivity
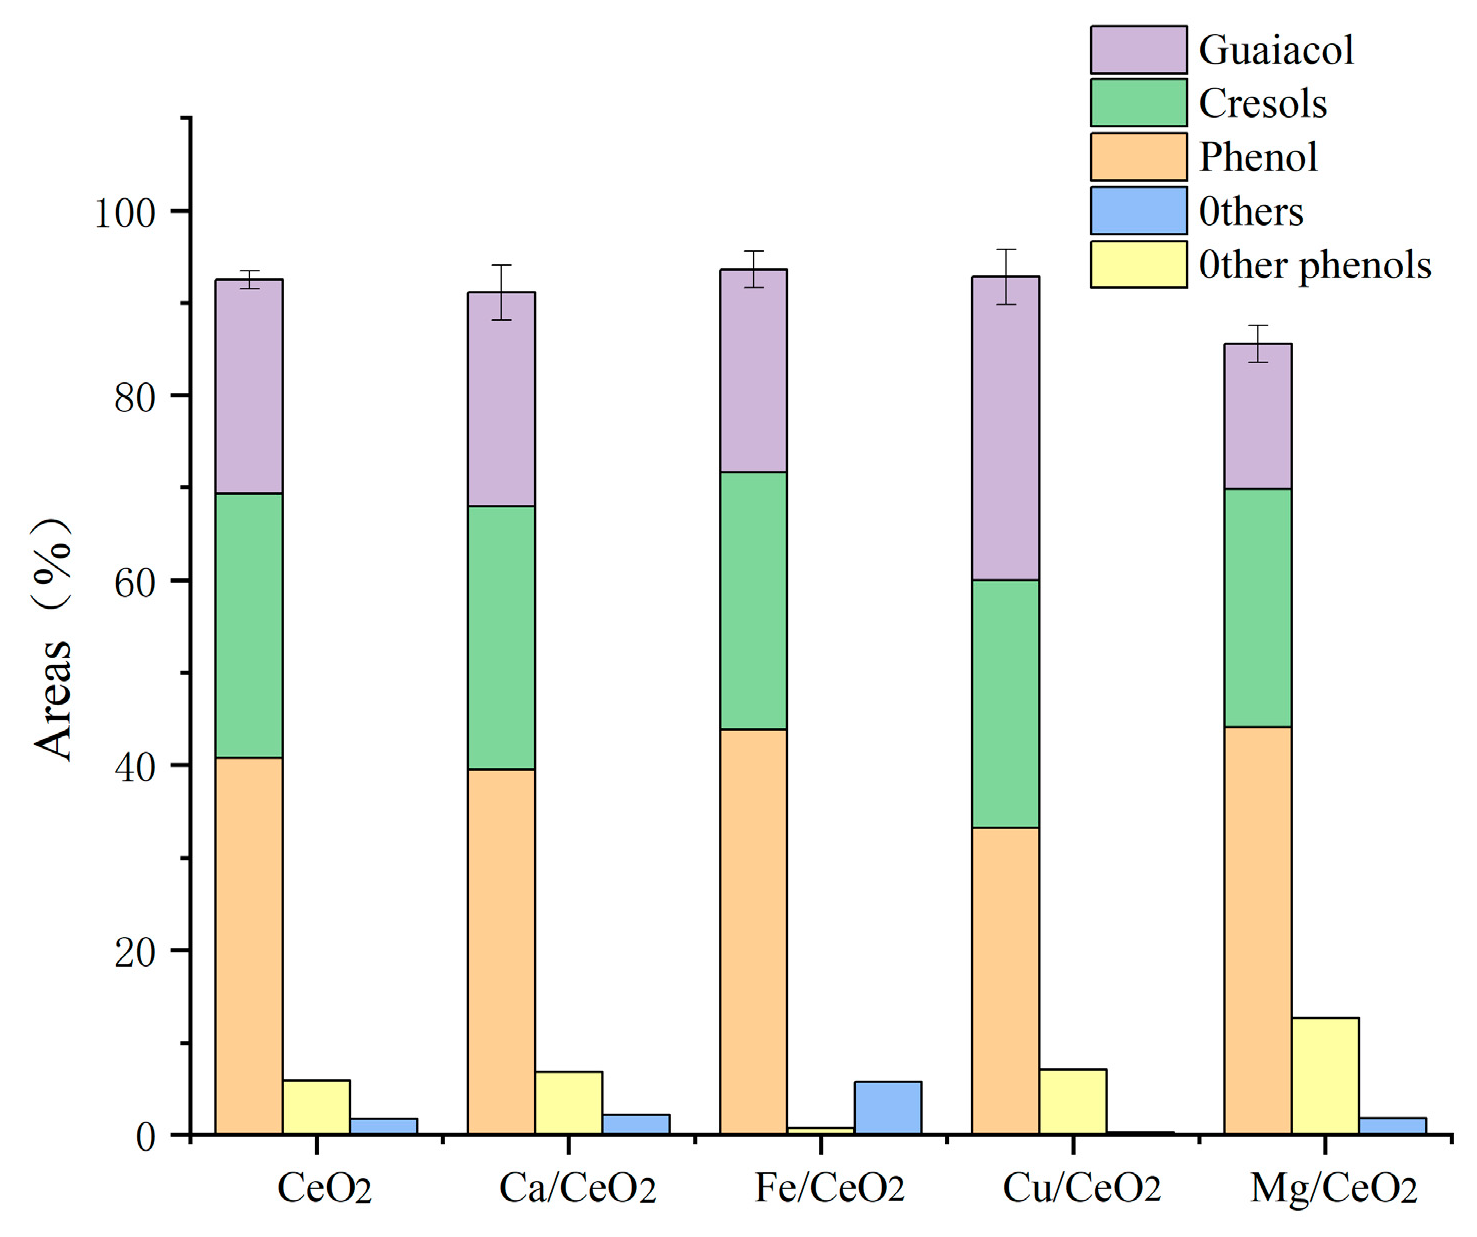
Figure 2 displays the yields of each product in the liquid phase; because of the high-temperature catalytic environment and the biochar covering of the catalytic sites of Ca, the phenolic content of the pyrolysis of the Ca/CeO
2-catalyzed lignin cracking was lower than that of cerium oxide. This was likely to be the result of the reduced catalytic selectivity and the depolymerization of lignin to aromatic hydrocarbons and other substances. The elimination of methoxy, however, was significantly impacted by the presence of Mg metal. However, most of the methoxy was changed to methylene and phenolic hydroxyl groups during the secondary catalysis of methoxy, which reduced the number of monophenols in the liquid-phase product.
The Cα-OH in the β-O-4′ structure was able to undergo a capping reaction owing to the Cu-containing catalysts, avoiding condensation during lignin depolymerization and exhibiting good catalytic activity. The guaiacol concentration was substantially higher than for the other catalysts under the addition of the Cu/CeO2 catalyst, which generated a considerable drop in the phenol content in comparison with the other catalysts stated above. Cu/CeO2 was considered unable to catalyze deoxidation during pyrolysis due to the lack of acidic sites.
In comparison with the unloaded catalyst, the metal loading applied to cerium oxide caused a rather large decrease in the bio-oil yield as well as the water content of the product distribution (
Table 2). While lignin is being depolymerized and deoxygenated, oxygen-containing functional groups are extensively transformed into small molecules of gases such as CO, CO
2, and CH
4, and cerium oxide stores and releases oxygen and carbon dioxide very quickly, inhibiting the formation of water from the reaction of hydrogen and oxygen. By decreasing the acidic sites on the catalyst surface and increasing the system’s acidity, the addition of metal loading promotes the breakdown of branching bonds and the synthesis of gaseous products. The comparatively high carbon dioxide adsorption capacities of Ca/CeO
2 and Mg/CeO
2, on the other hand, allow carbon to remain in the molten salt system while suppressing the hydration gas reaction, leading to a comparatively high yield of water and a significantly decreased gas yield. Based on the conversion of bio-oil and monophenol compounds, Fe/CeO
2 was the best catalyst for the production of monophenols, and, therefore, subsequent experimental studies will be based on the Fe/CeO
2 catalyst.
2.3. Catalyst Characterization
2.3.1. XRD Analysis
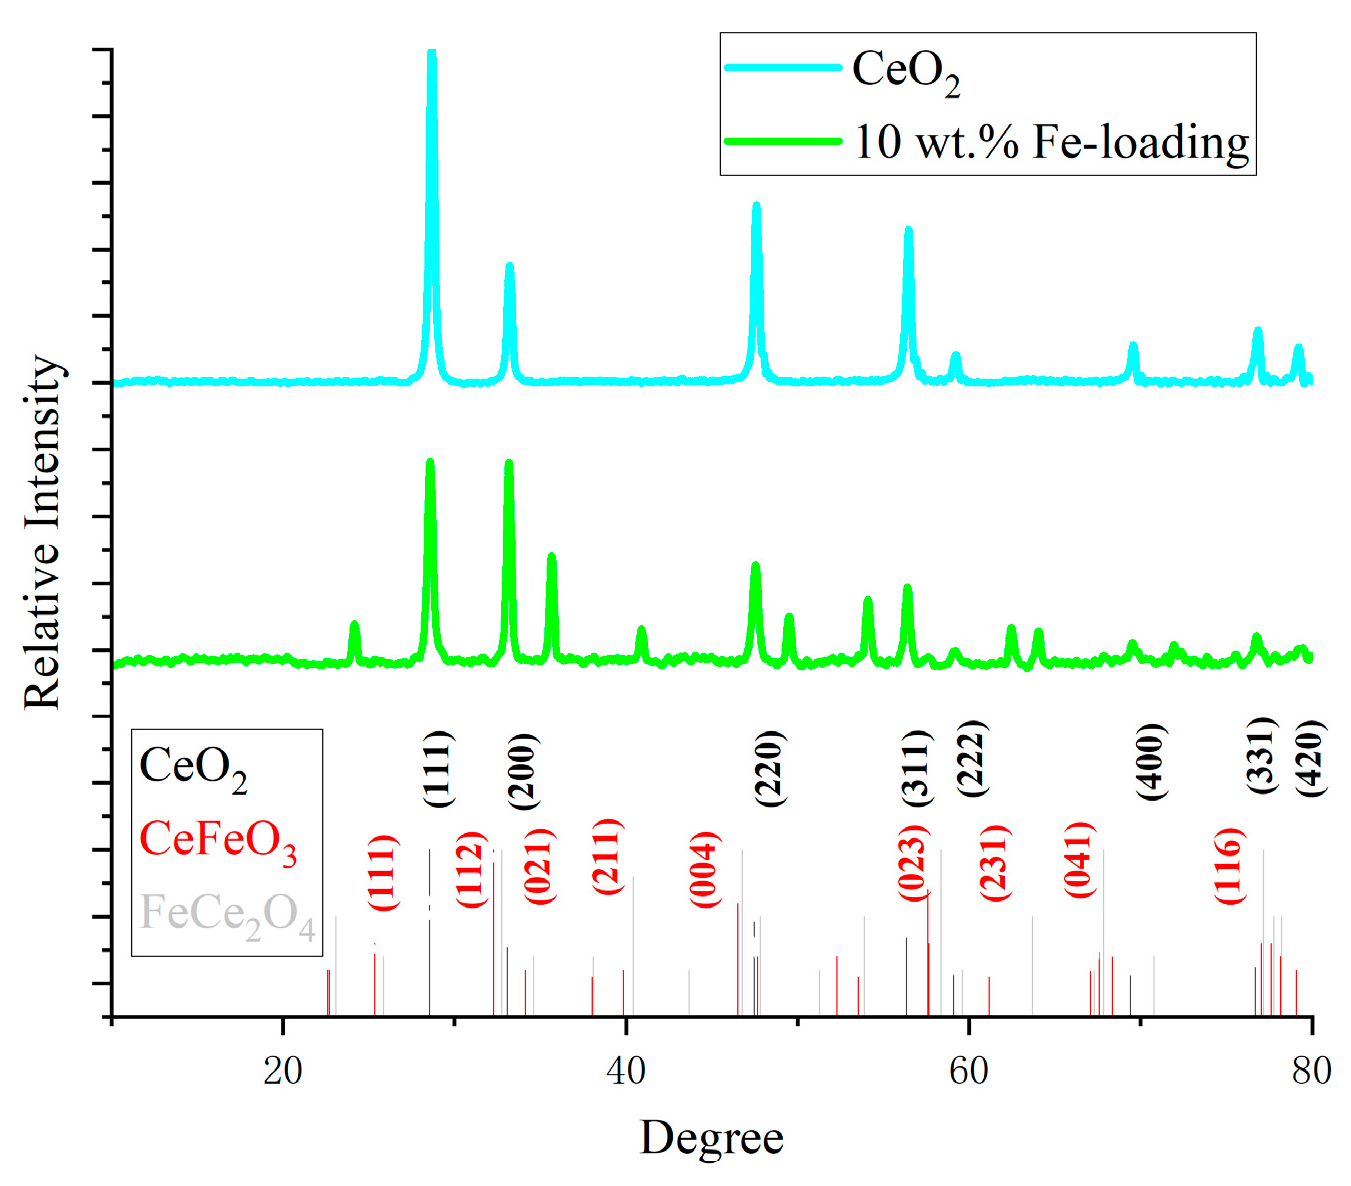
Figure 3 displays the XRD spectra. The characteristic peaks of cerium oxide correspond to the face-centered cubic (111), (200), (220), (311), (222), (400), (331), and (420) crystal planes (see PDF#43-1002). The distinctive peak corresponding to the (111) crystal plane becomes weaker and broader as the Fe concentration rises, indicating an increase in the oxygen vacancies inside the cerium oxide lattice and an improvement in the material’s catalytic efficiency. Fe is primarily found in the loaded catalysts as FeCe
2O
4 and CeFeO
3. CeFeO
3 has distinct peaks primarily at 25°, 32°, 40°, 58°, and 67° (see PDF#22-36-1253). The enhancement of the (112) crystal planes at 32° and the growth of the (111) and (021) crystal planes all point to the formation of CeFeO
3. This finding suggests that the catalyst’s structure has slightly changed and that the heat deflection temperature has risen, increasing the catalyst’s thermal stability in the high-temperature molten salt catalytic system. Among them, CeFeO
3 is the most dominant structure in the catalyst, with excellent oxygen storage capacity and oxygen migration capacity, fast response performance, and high activity, and it is a commonly used catalyst in traditional low-temperature photocatalysis and electrocatalysis. This experiment also proves its effectiveness in high-temperature catalytic pyrolysis processes of lignin.
2.3.2. SEM-EDX
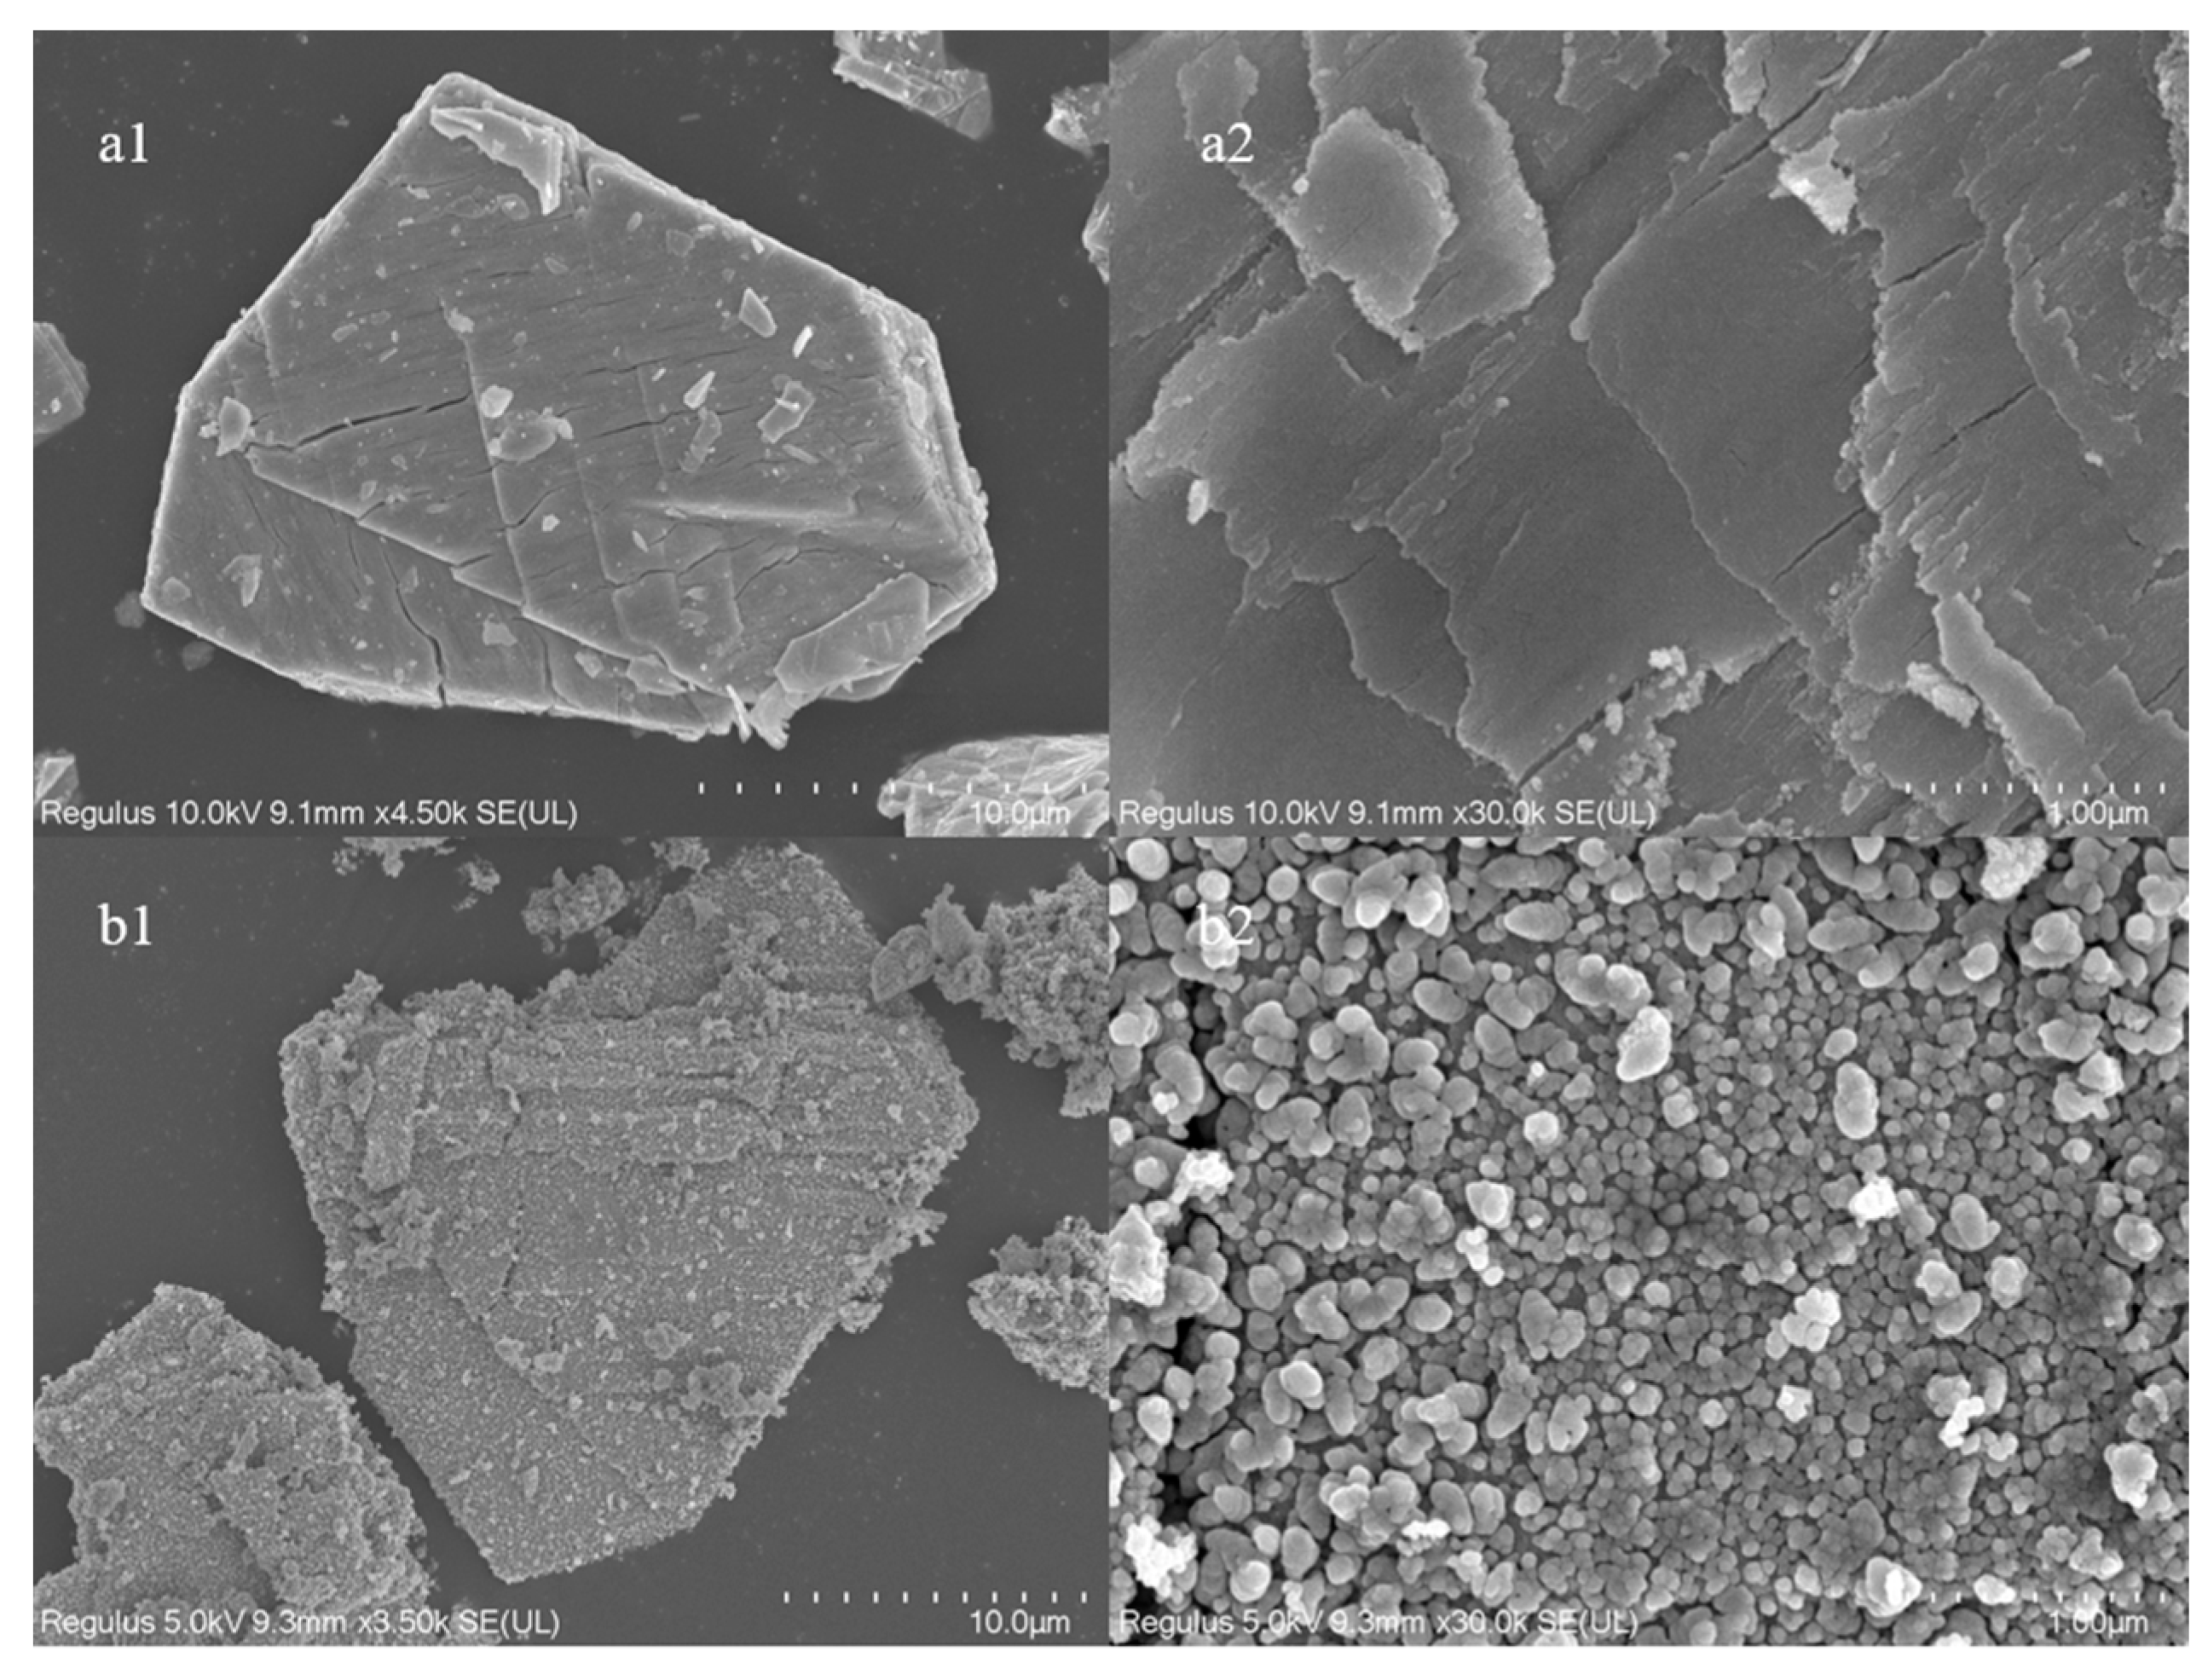
Figure 4 shows the SEM study of the catalyst particles as well as the surface morphology. At 4.5 k magnification, the irregular nanoparticle morphology of cerium oxide without pore structure can be seen. The catalyst surface is flatter and smoother at 30 k magnification. The surface gets rougher, and the loaded catalyst particles have a morphology resembling cerium oxide particles. The catalyst surface is completely covered in dense, uniform, spherical particles without any pore formation, as seen at a magnification of 30 k. This shows that the Fe particles produced during high-temperature roasting are effectively loaded onto the surface of the cerium oxide.
2.3.3. NH3-TPD Analysis
The determination of the acidity of the catalyst is one of the important indicators for the characterization analysis.
Figure 5 displays the outcomes of NH
3-TPD characterization. The two characteristic peaks present in the figure, 140 °C as well as 510 °C, represent the NH
3 desorption peaks of Lewis acid and Bronsted acid of the catalyst, respectively. The catalyst’s Lewis acid site is significantly affected by the iron loading, whereas the Bronsted acid site is less affected (
Table 3). This is because iron was deposited onto the cerium oxide surface during the catalyst production process, which changed the O–Ce–O interaction, increasing the relative oxygen content after oxidation by high-temperature heat treatment.
2.3.4. Carbon Coking of Catalysts
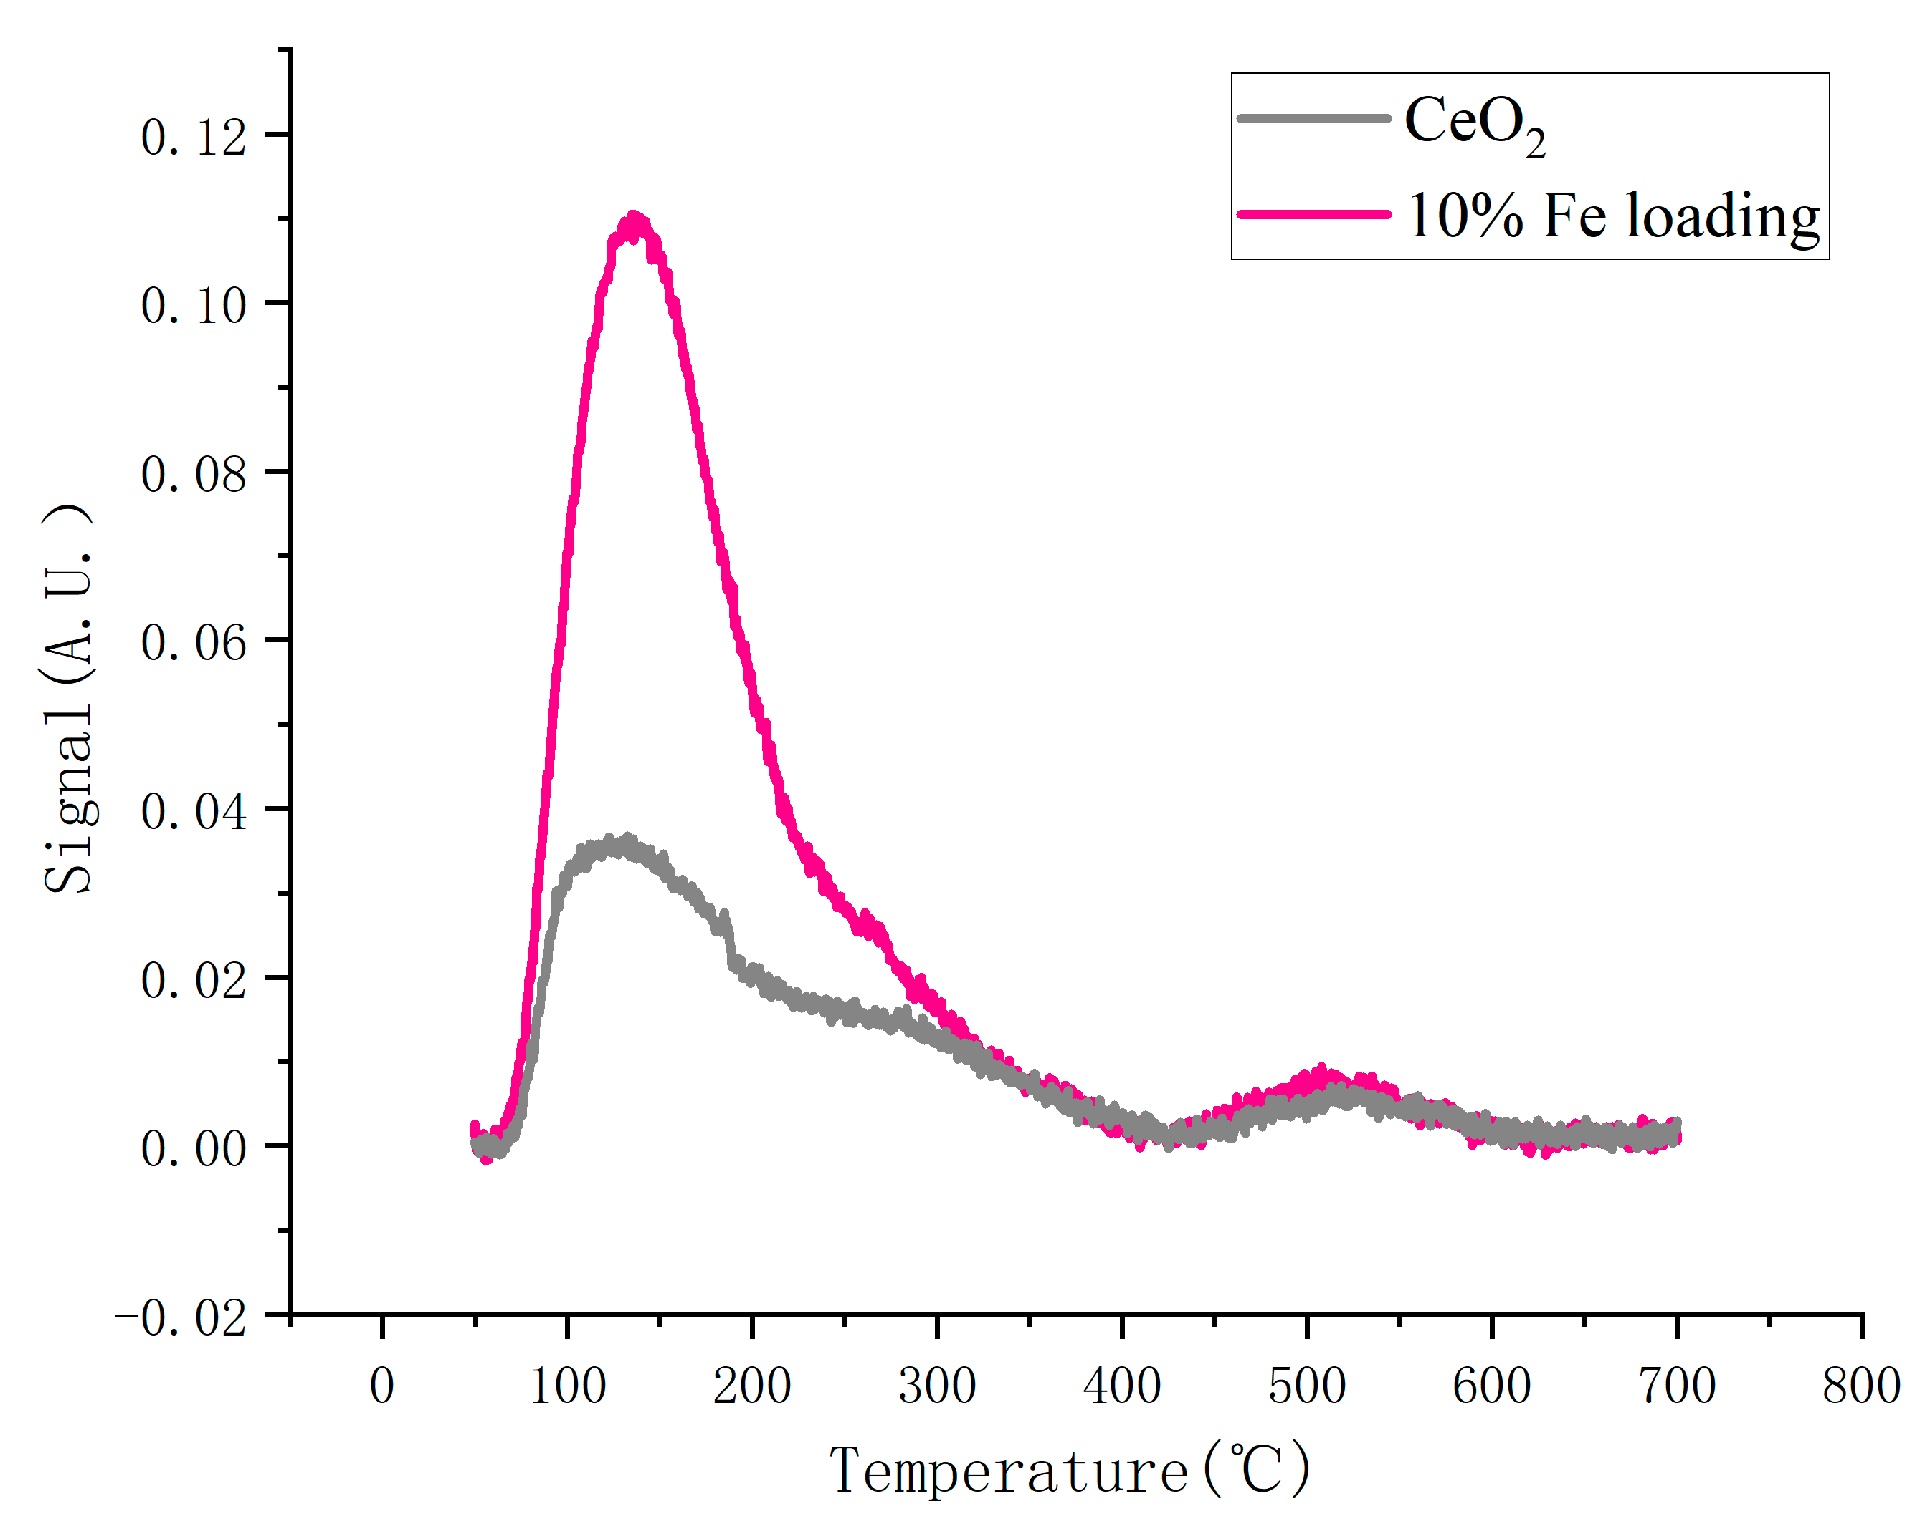
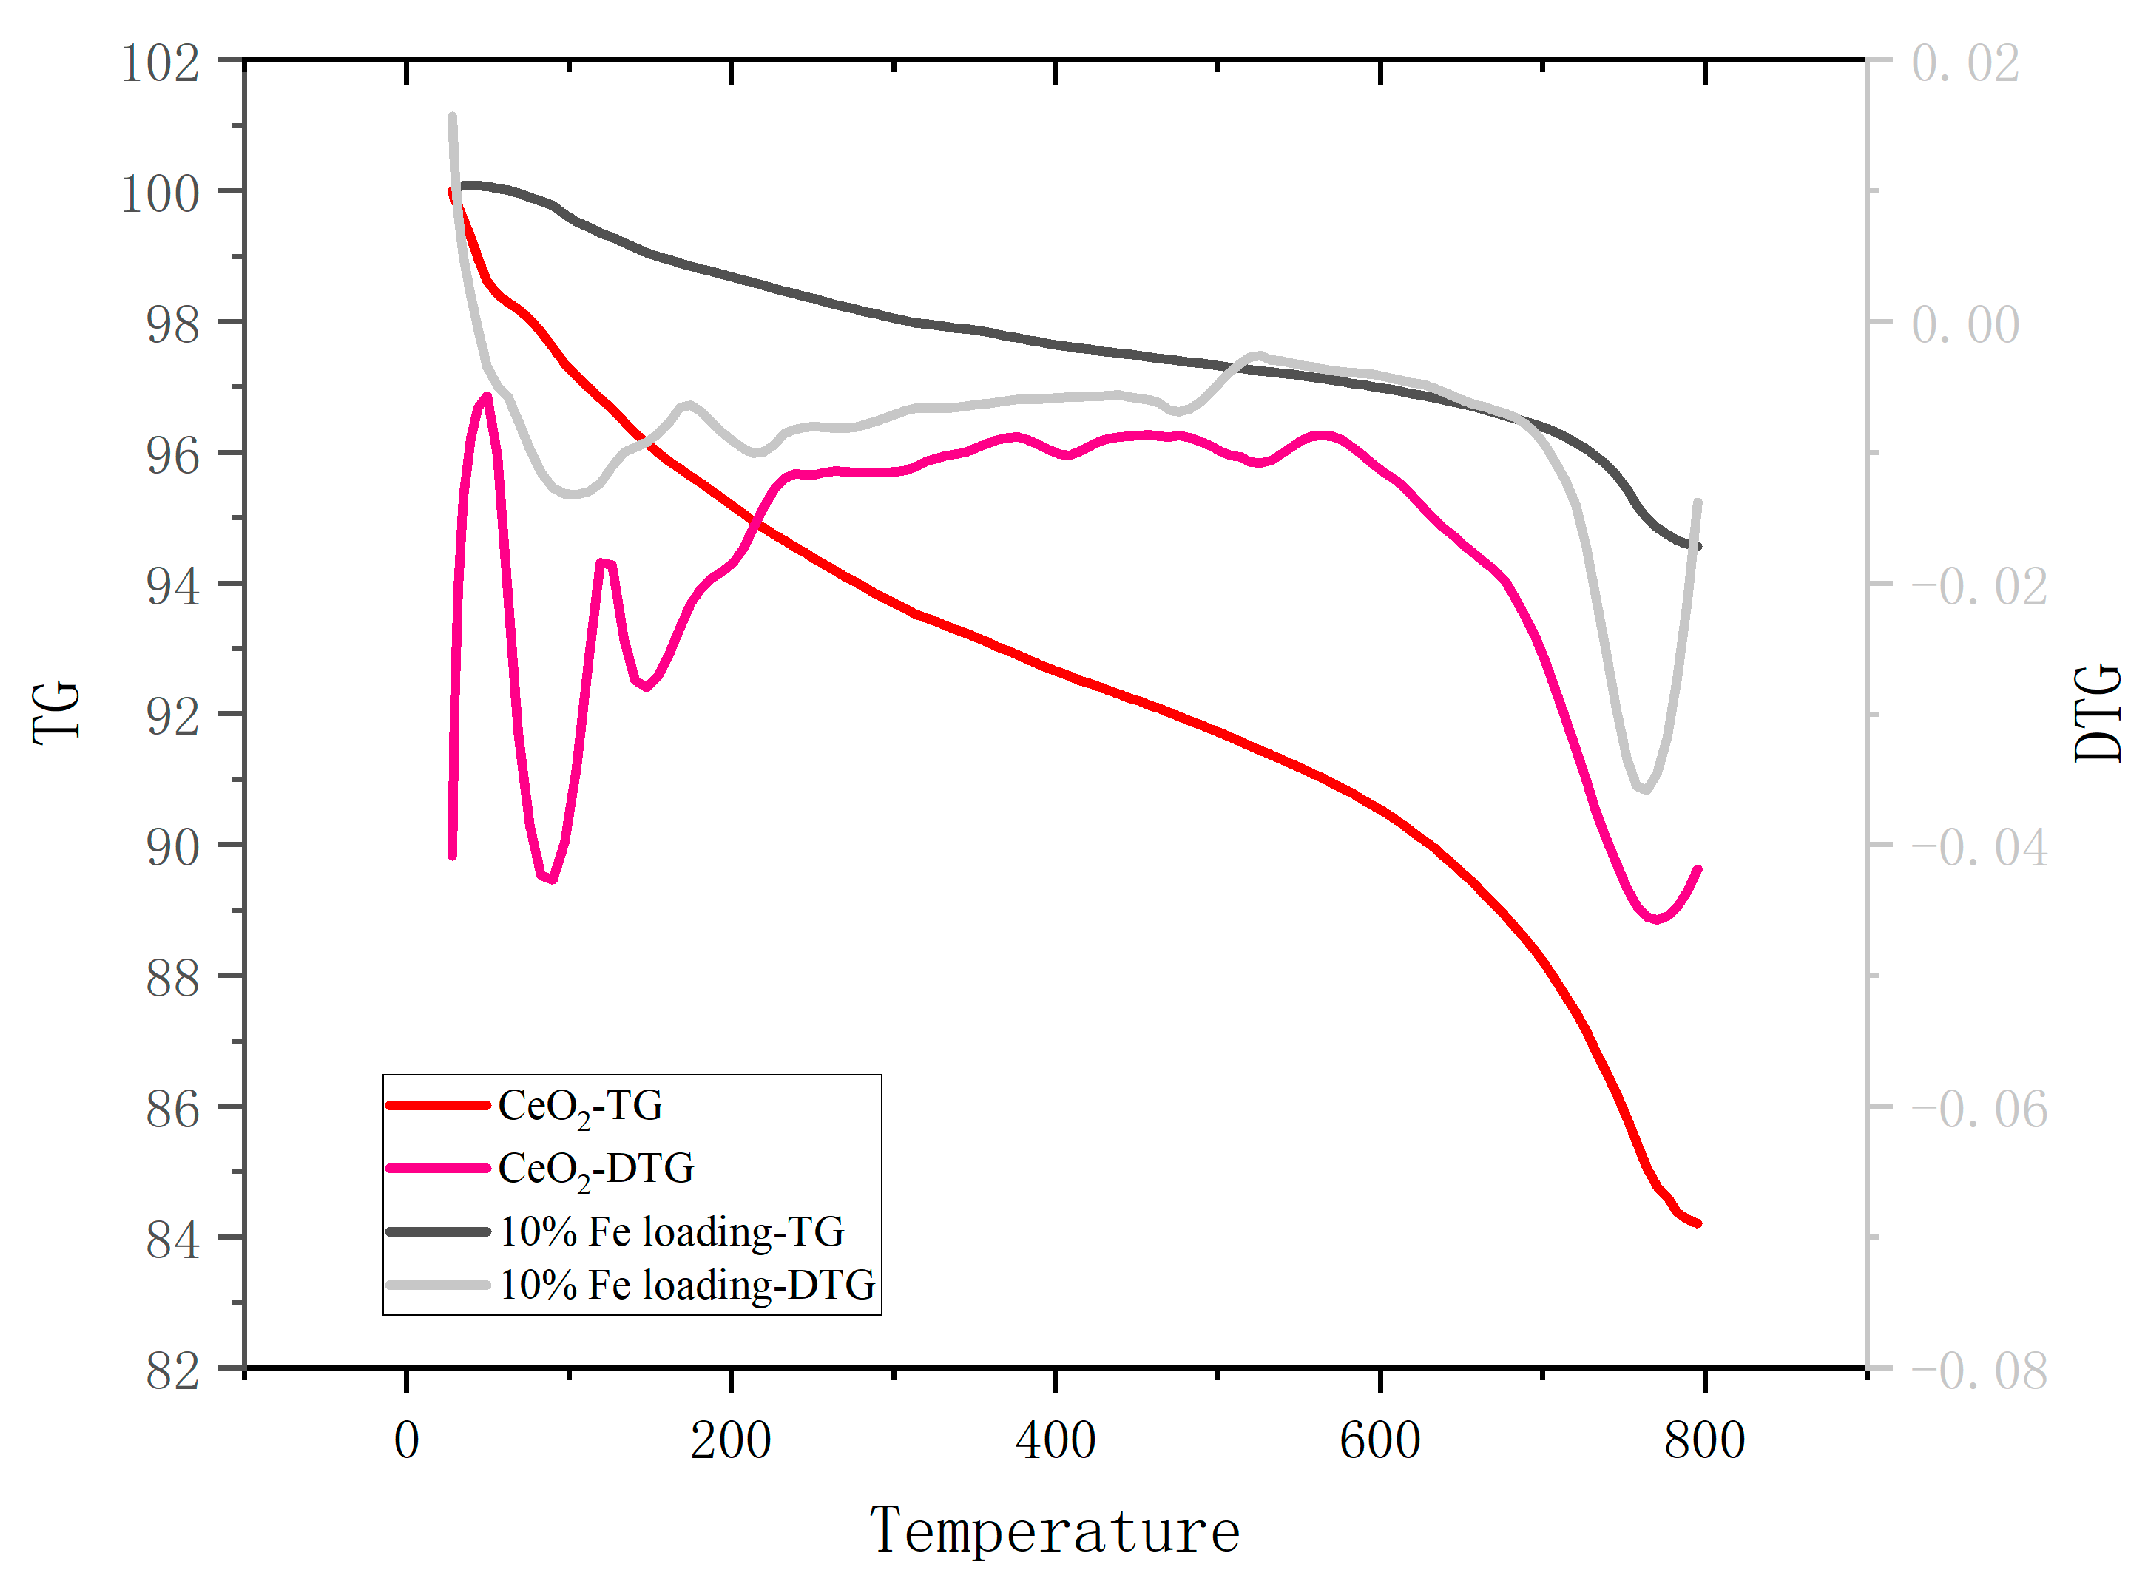
The catalyst deposited on the bottom layer of molten salt after solidification was recovered, and the used catalyst was obtained after acid washing, water washing, and drying. TG analysis was performed on the used catalysts to determine the carbon coking on the catalyst surface, and the results are shown in
Figure 6. The coking catalysts showed significant mass loss in the temperature intervals of 30–150 °C and 700–800 °C. The first stage was mainly for the removal of internal moisture, and the second stage was for the decomposition of the catalyst coking material. The mass loss of cerium oxide was 15.79 wt.%, while the mass loss of the loaded catalyst was 5.44 wt.%, indicating that the carbon coking on the catalyst surface was alleviated to a larger extent. In addition, the pyrolysis characteristic peak of the coke also showed some left shift.
2.4. Effect of Iron Loading on Product Yield and Monophenol Selectivity
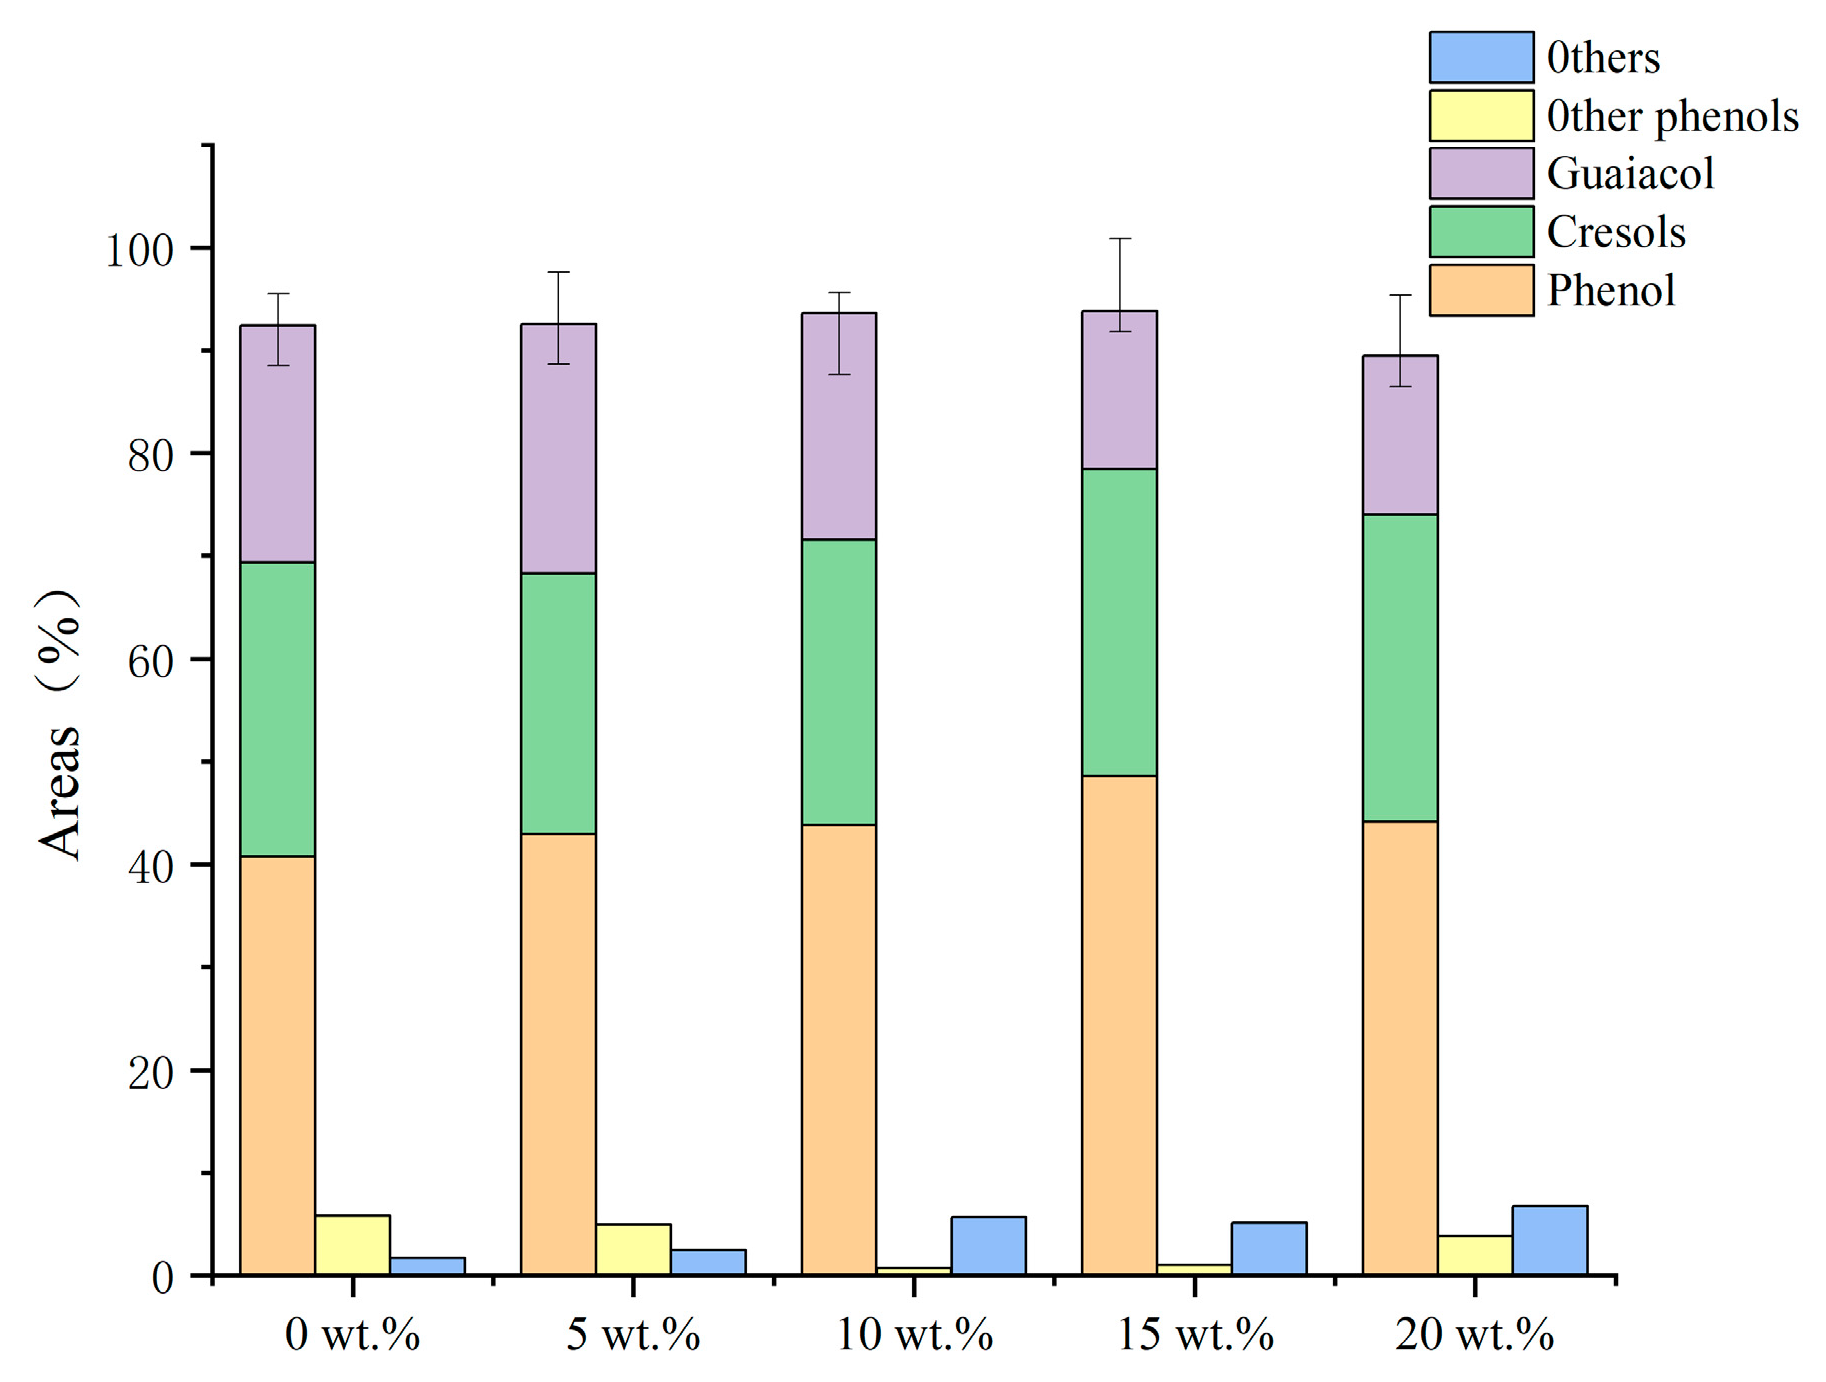
As can be seen in the effect of Fe loading on the product distribution shown in
Table 4, there was a tendency for the syngas to increase as the Fe loading increased, while there was a slight decrease in both bio-oil production and water production.
Figure 7 depicts the distribution of the liquid-phase products. As the loading increased, the phenol yield rose to 48.56 wt.% before starting to fall. The monophenol yield started to drastically decline when the iron loading reached 93.93 wt.% at 15 wt.%. The cresol content sharply decreased following the addition of iron and subsequently marginally increased, in contrast to the guaiacol patterns. The production of monophenols was significantly affected by the addition of Fe, which also increased the removal of oxygen-containing functional groups and prevented the removal of side-chain hydrocarbons, increasing the yield of cresols as a result. The phenolic hydroxyl groups’ bond energy is relatively high and difficult to remove in the conditions of the investigated procedure. The addition of iron caused the free oxygen-containing functional groups to act as electron donors and the phenols to act as electron donors; furthermore, the C–O bond energy of the phenols in the secondary cleavage products was reduced, destroying the phenolic products, while the oxygen-containing functional groups were rapidly oxidized and reduced on the surface of cerium oxide, producing aromatic hydrocarbons, acids, and other substances, which are easily polymerized at high temperatures, leading to the production of coke. The best monophenol synthesis may be attained at a loading of 15 wt.%.
Very small active carbon particles are created during the pyrolysis of lignin molten salts. These carbon particles are easily adsorbed on the catalyst surface during the catalytic process of cerium oxide, covering the active sites of the catalyst. The agglomeration of cerium oxide may result in destroying the dispersal system of cerium oxide in the molten salts and reducing the catalytic activity of cerium oxide. In addition to increasing the oxygen load of the catalyst, enhancing the adsorption and desorption of carbon dioxide, and effectively removing functional groups such as carboxyl and carbonyl groups, the addition of metallic iron can lessen the acidity of the molten salt system and increase cerium oxide’s tolerance to carbon. Moreover, some water is created during the pyrolysis of the molten salts, which is involved in the activation of water vapor. Equations (1) and (2) primarily demonstrate the water vapor activation mechanism. Reactions (2) and (3) complete the activation, after H2O is broken down into carbon dioxide and hydrogen in reaction (1). This process results in a decrease in the water content and increases the purity of the phenol product. According to the experimental data above, excessive loading is detrimental to monophenol production.
2.5. TG of Iron-Loaded Catalyst Coupled with Molten Salts Pyrolysis of Lignin
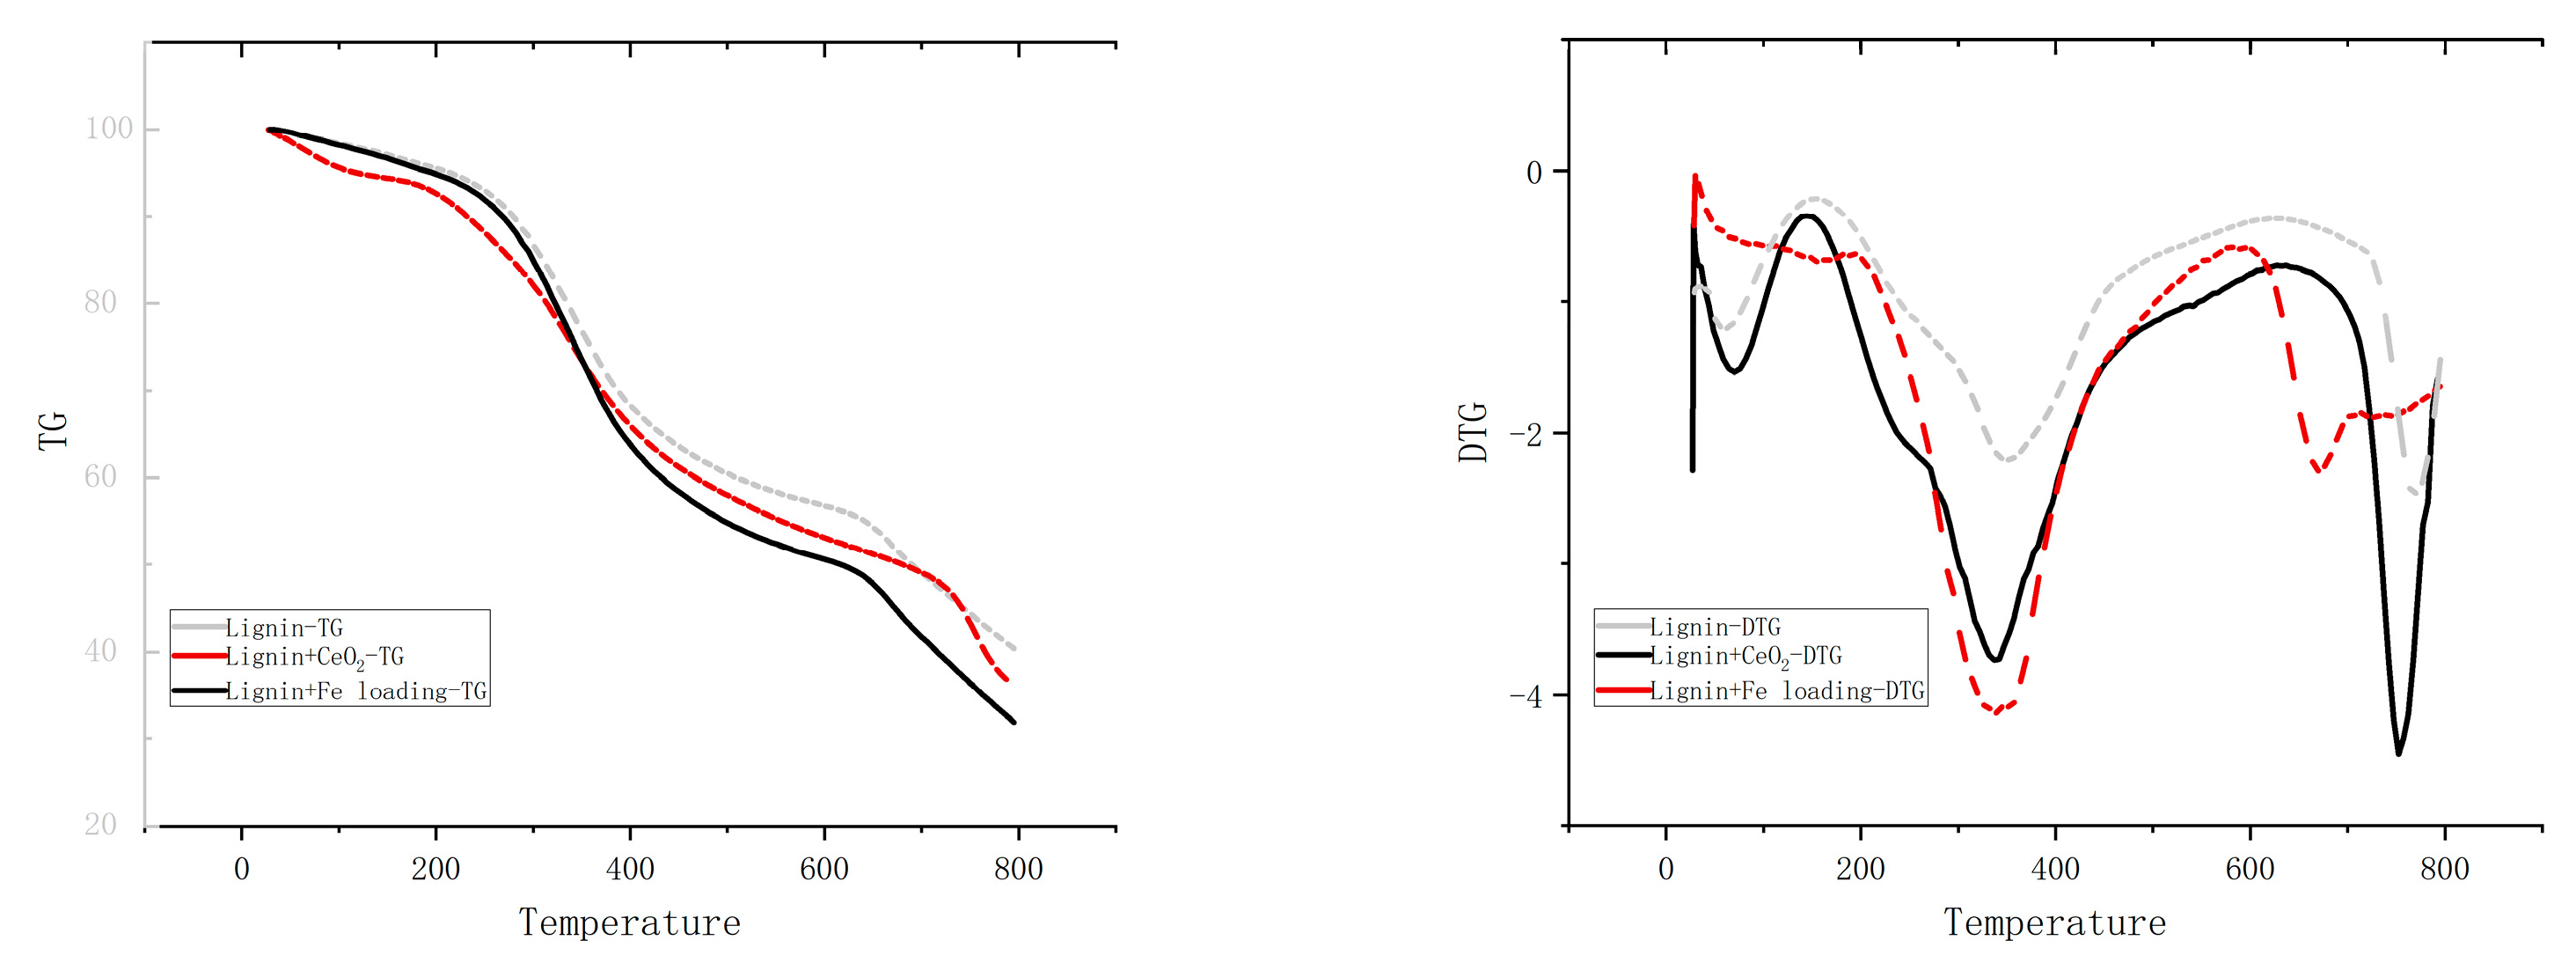
There may be multiple different pathways for primary, secondary, and even higher reactions in the actual reaction of the lignin pyrolysis process.
Figure 8 displays the TG-DTG curves for lignin, lignin + CeO
2, and lignin + Fe/CeO
2 pyrolysis. At around 298 °C, there is a clear shoulder peak where side-chain shedding predominates, and a large number of oxygenated molecules are produced. The highest weight-loss peak occurs at 351 °C, where side-chain breakage (e.g., the breakage of the phenyl C–C bond on phenyl propane) and lignin depolymerization both take place. The highest weight-loss peak appears at 445 °C when methoxy is released and a significant amount of oxygenated chemicals is produced. Then, at around 753 °C, charring starts to occur. Eventually, the pyrolysis of the lignin is largely finished, and the rate of weight loss slows. Cerium dioxide increased the weight-loss peak for methoxy shedding, indicating that the catalyst was more effectively deoxygenated. In contrast, the shoulder peak at 298 °C and the peak at 351 °C were fused in the pyrolysis curve of lignin + Fe/CeO
2. The simultaneous occurrence of side-chain breakage and oxidative depolymerization due to the addition of Fe suggested that a significant amount of water would be produced.
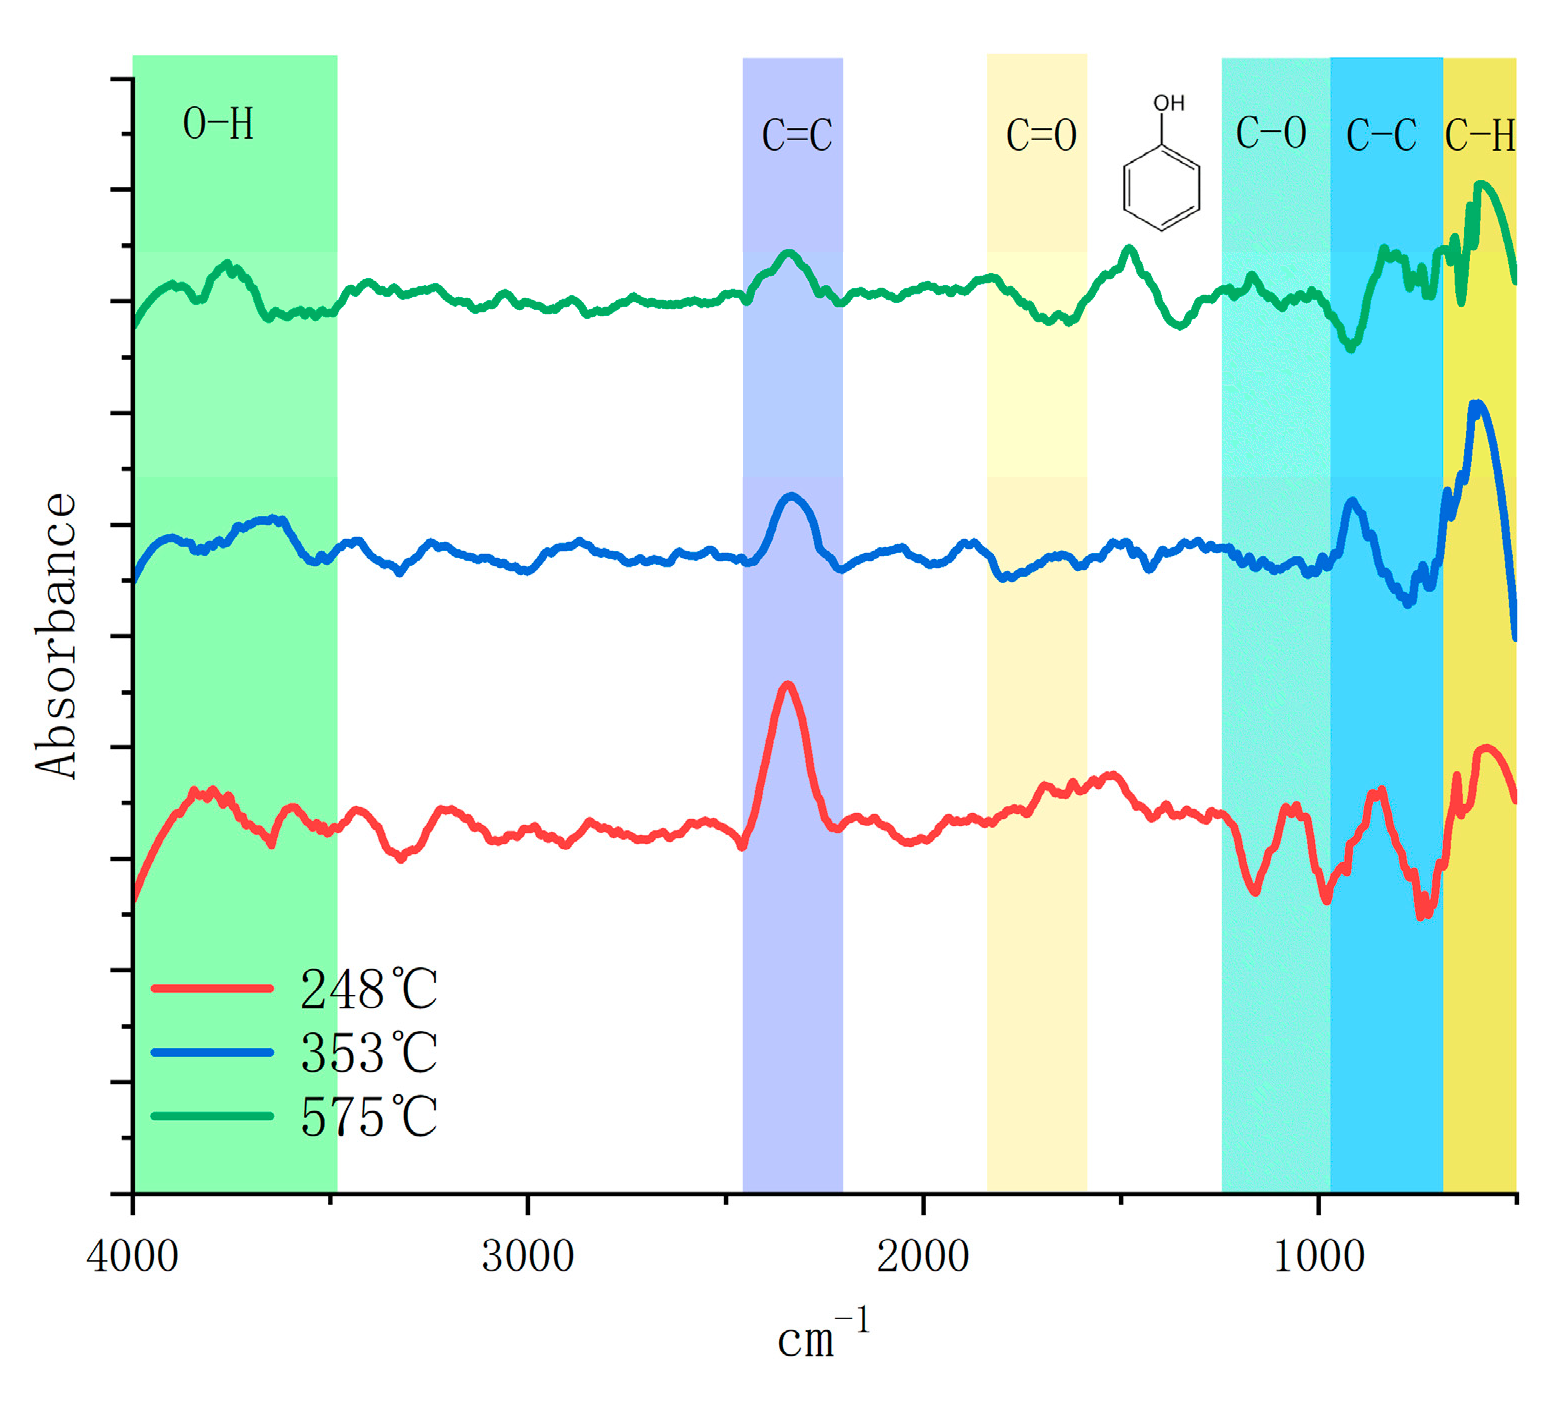
TG−FTIR was applied to the lignin + Fe/CeO
2 sample to examine the impact of the catalyst-coupled molten salt pyrolysis of lignin on the phenolic compounds. The IR spectra at 351 °C and the experimental temperature of 575 °C are displayed in
Figure 9. The vibration peaks in the 2358.32 cm
−1, 2312.08 cm
−1, and 850 cm
−1 bands were the strongest at 248 °C. The C−C and C=C bonds in the side chain started to break, producing a large amount of carbon dioxide and phenolic compounds, while there was also a certain vibration in the 1121 cm
−1 band, indicating that some ketones were also produced in the product. The C−H bond vibration at 770–720 cm
−1 and the methylene vibration at 800 cm
−1 were then amplified at 351 °C, indicating that a significant quantity of lignin depolymerization had taken place. Together with the very low vibration peaks of ketones, the aromatic vibration at 1000−1400 cm
−1 was relatively low, indicating that guaiacol was also severely dissociated and methoxy was destroyed and converted. Apart from the phenolic hydroxyl vibrations at 1400 cm
−1 when the temperature reached 575 °C, all peak vibration intensities were very low, showing that the catalyst had not damaged the aromatic ring structure and that the majority of the liquid-phase products were present in the form of phenols. The pyrolysis of lignin was more complete, and the conversion of the volatile fraction was improved because of the efficient heat transmission of the molten salt.
2.6. Catalyst Evaluation
2.6.1. Repeatability Evaluation
One of the most difficult lignocelluloses to break down is lignin, and pyrolysis often ends at temperatures of 600 °C or higher. The hydroxyl group at the C position in lignin is first oxidized to a carbonyl group, which activates the major chemical bond, the β−O−4′ bond in lignin, and is then further oxidized and broken down into acids and guaiacols under the influence of a catalyst in the cerium oxide molten salt system described above. The methoxy and carboxyl groups are then removed using the molten salt pyrolysis catalyst, where the methoxy is susceptible to methyl migration and produces cresols.
The ability of the catalyst to be recovered was partially assessed by remitting the solid molten salts that were left over after the experiment’s cooling at 550 °C and the removal of the biochar from the surface, collecting the remaining char, and storing it for 2 h before the experiment was repeated. After two repeats, the monophenol yield was consistent and sustained over 90 wt.%, as indicated in
Table 5. There was a significant drop in catalytic activity in later testing, and carbon buildup had a very noticeable impact on the catalyst activity, which must still be considered in subsequent trials to increase the catalyst recovery performance.
2.6.2. Material Account
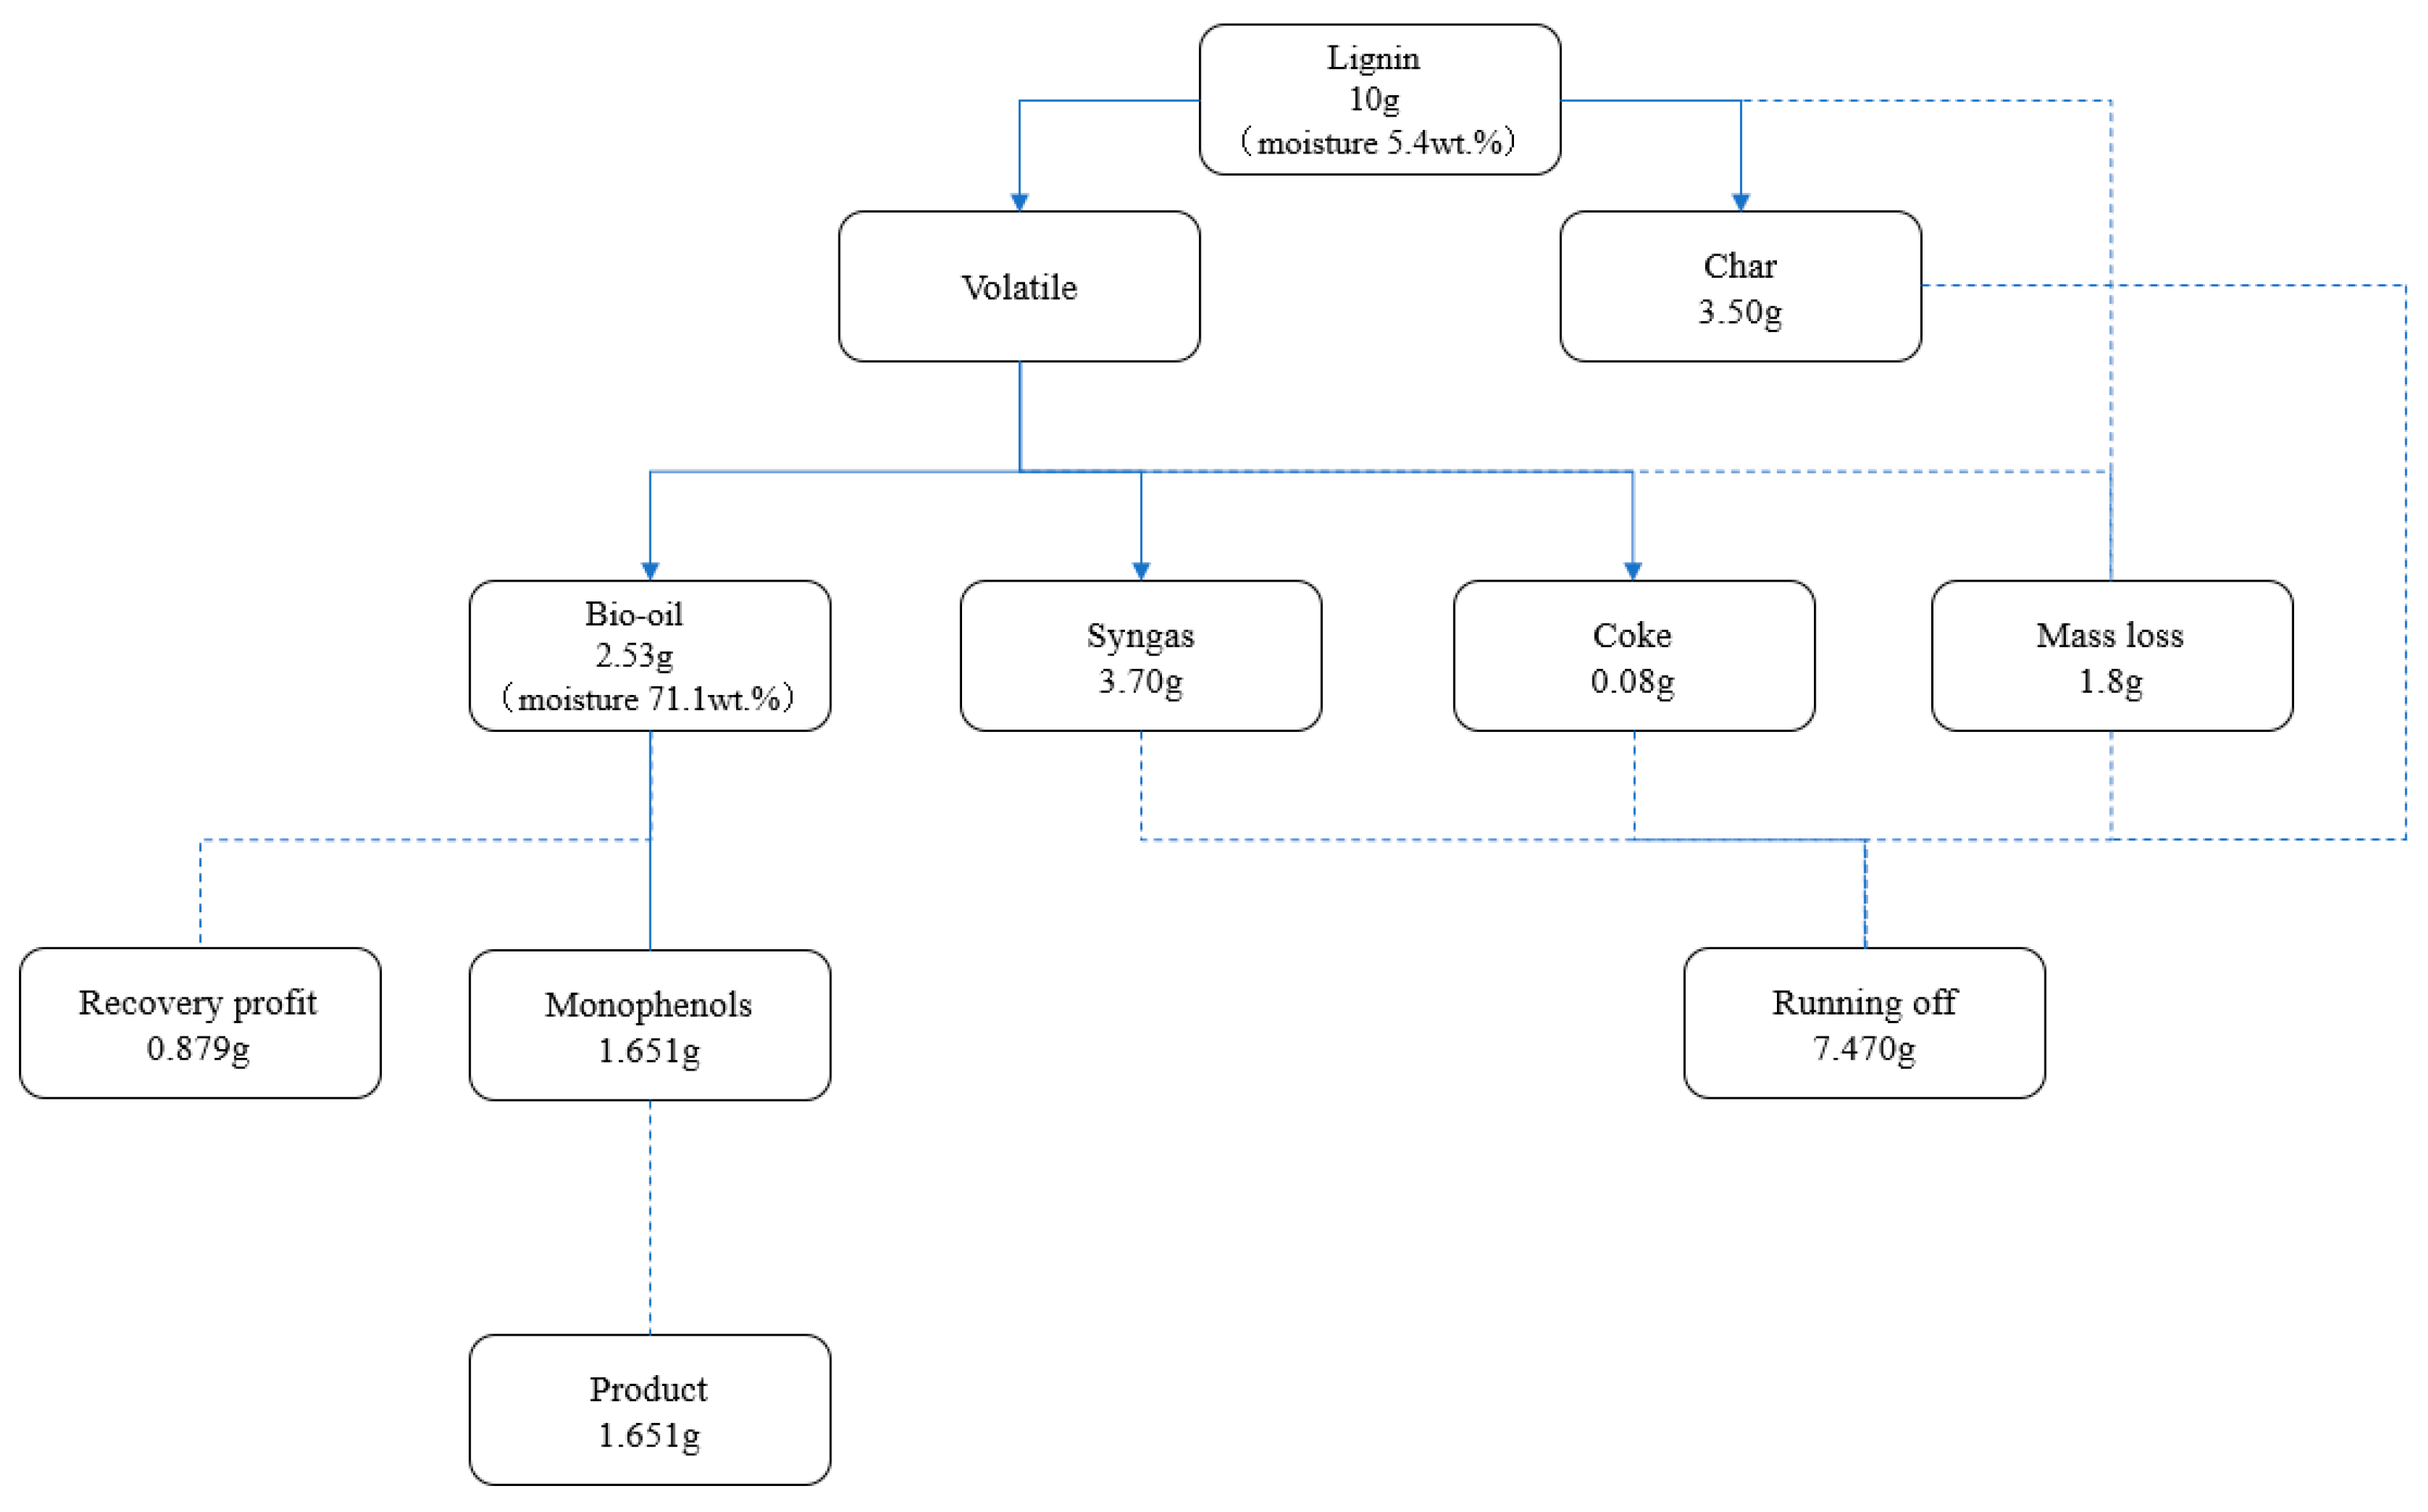
To determine the quantitative relationship between material proportions and material transformations in this process, a material account of the lignin pyrolysis process is required.
Figure 10 uses Equation (4) as a benchmark to evaluate the material conservation of 10% Fe/CeO
2-catalyzed lignin molten salt pyrolysis with monophenols (phenol, cresol) as the primary products.
where
∑Ginput—the total amount of raw material subjected to the reaction
∑Gproduct—the quality of the product obtained
∑Gloss—the total amount of material lost during the reaction
∑Grecovery—the total amount of material recovered from the system
Figure 10.
Material account of lignin pyrolysis process.
Figure 10.
Material account of lignin pyrolysis process.
When 10 g of lignin with a moisture content of 5.4 wt.% is fed into the reaction system, the reaction produces 3.7 g of cracked gas, 2.53 g of cracked oil, and 3.5 g of biochar, which may be recovered by mechanical separation, as well as 0.08 g of coke retained in the molten salts. During the pyrolysis process, there was a mass loss of approximately 1.8 g. This mass loss was mostly concentrated at the reactor’s product outlet, where the temperature of the volatile fraction suddenly dropped and aromatic compounds, such as guaiacol, underwent self-polymerization. As a result, there was some dense tar left in the pipeline that was unable to flow down to the flask with the condensate. By diluting the bio-oil with ethyl acetate extraction and analyzing it with a gas chromatograph, a total of 1.653 g of monophenol substances—all of which are crucial chemical raw ingredients in the synthesis of chemicals—were produced. It is possible to recover the significant amount of phenols and ketones present in the bio-oil for fermentation.
In conclusion, 1.817 g of the ∑Gproduct that was produced by the catalytic pyrolysis of lignin was obtained. ∑Gloss, which included the mass loss, the unusable portion in the gas, the unusable biochar on the molten salts’ surface, and the coke inside the molten salt catalyst system, was approximately 7.30 g. ∑Grecovery, the amount of liquid that could be recycled, was equal to 0.879 g. When combining the catalyst with the molten salt system, the lignin to the monophenol production process is extremely effective at converting lignin into high-value-added products and serves as a useful model for the effective handling and utilization of lignin.
3. Materials and Methods
3.1. Materials
Lithium carbonate (CAS 554-13-2, 99.0 wt.%), anhydrous sodium carbonate (CAS 497-19-8 99.5 wt.%), and potassium carbonate (CAS 584-08-7 99.0 wt.%) were purchased from Aladdin (Shanghai Aladdin Biochemical Technology Co., Ltd., Shanghai, China). Weighed 30 g of lithium carbonate, 30 g of sodium carbonate, and 40 g of potassium carbonate for a total of 100 g of ternary mixed carbonates were dried in an oven for 24 h, calcined in a muffle furnace at 600 °C for 30 min, cooled to room temperature to obtain white lumps, ground and crushed, and placed in a desiccator. A quantity of lignin (CAS:9005-53-2, 98.5%, purchased from Shanghai Titan Scientific Co., Ltd. (Shanghai, China)) was weighed into a surface dish and dried in an oven for 24 h. High-purity nanoscale CeO2 (CAS:1306-38-3, 99.99%) was purchased from Shanghai Macklin Biochemical Co., Ltd. (Shanghai, China), as well as Fe(NO3)3·9H2O (CAS:7782-61-8, 98.5%), Cu(NO3)2·3H2O (CAS:10031-43-3, 99.0%), Ca(NO3)2·4H2O (CAS: 13477-34-4, 99.0%), and Mg(NO3)2·6H2O (CAS: 13446-18-9, 99.0%).
3.2. Catalyst Synthesis
The high-purity nanoscale cerium oxide powder that was purchased underwent pretreatment. The cerium oxide powder was dried in an oven at 105 °C for 24 h. The dry cerium oxide powder was calcined at 600 °C for 4 h to remove the volatile components, establish a stable structure, and improve its mechanical strength. The obtained CeO2 was reductively heated in a hydrogen–argon gas mixture atmosphere at 200 °C.
CeO2 nanoparticles were metal-loaded by the impregnation method. About 1.5 g of pretreated CeO2 was dissolved in anhydrous ethanol and sonicated to obtain a yellow suspension. A specific amount of iron nitrate was weighed and dissolved with deionized water to form an ionic solution, and then the solution was added to the suspension. The mixed suspension was heated while being blended in an oil bath at 75 °C. Then the temperature was raised to 105 °C, and the suspension was condensed and refluxed for 1 h. After that, the mixed suspension was kept in an oven at 105 °C for 24 h before being roasted for 3 h to obtain the Fe-loaded catalyst. The composite catalysts with different loadings could be produced by configuring various iron nitrate solution concentrations. Using the same procedure, Cu, Ca, and Mg metal loadings on CeO2 were also treated.
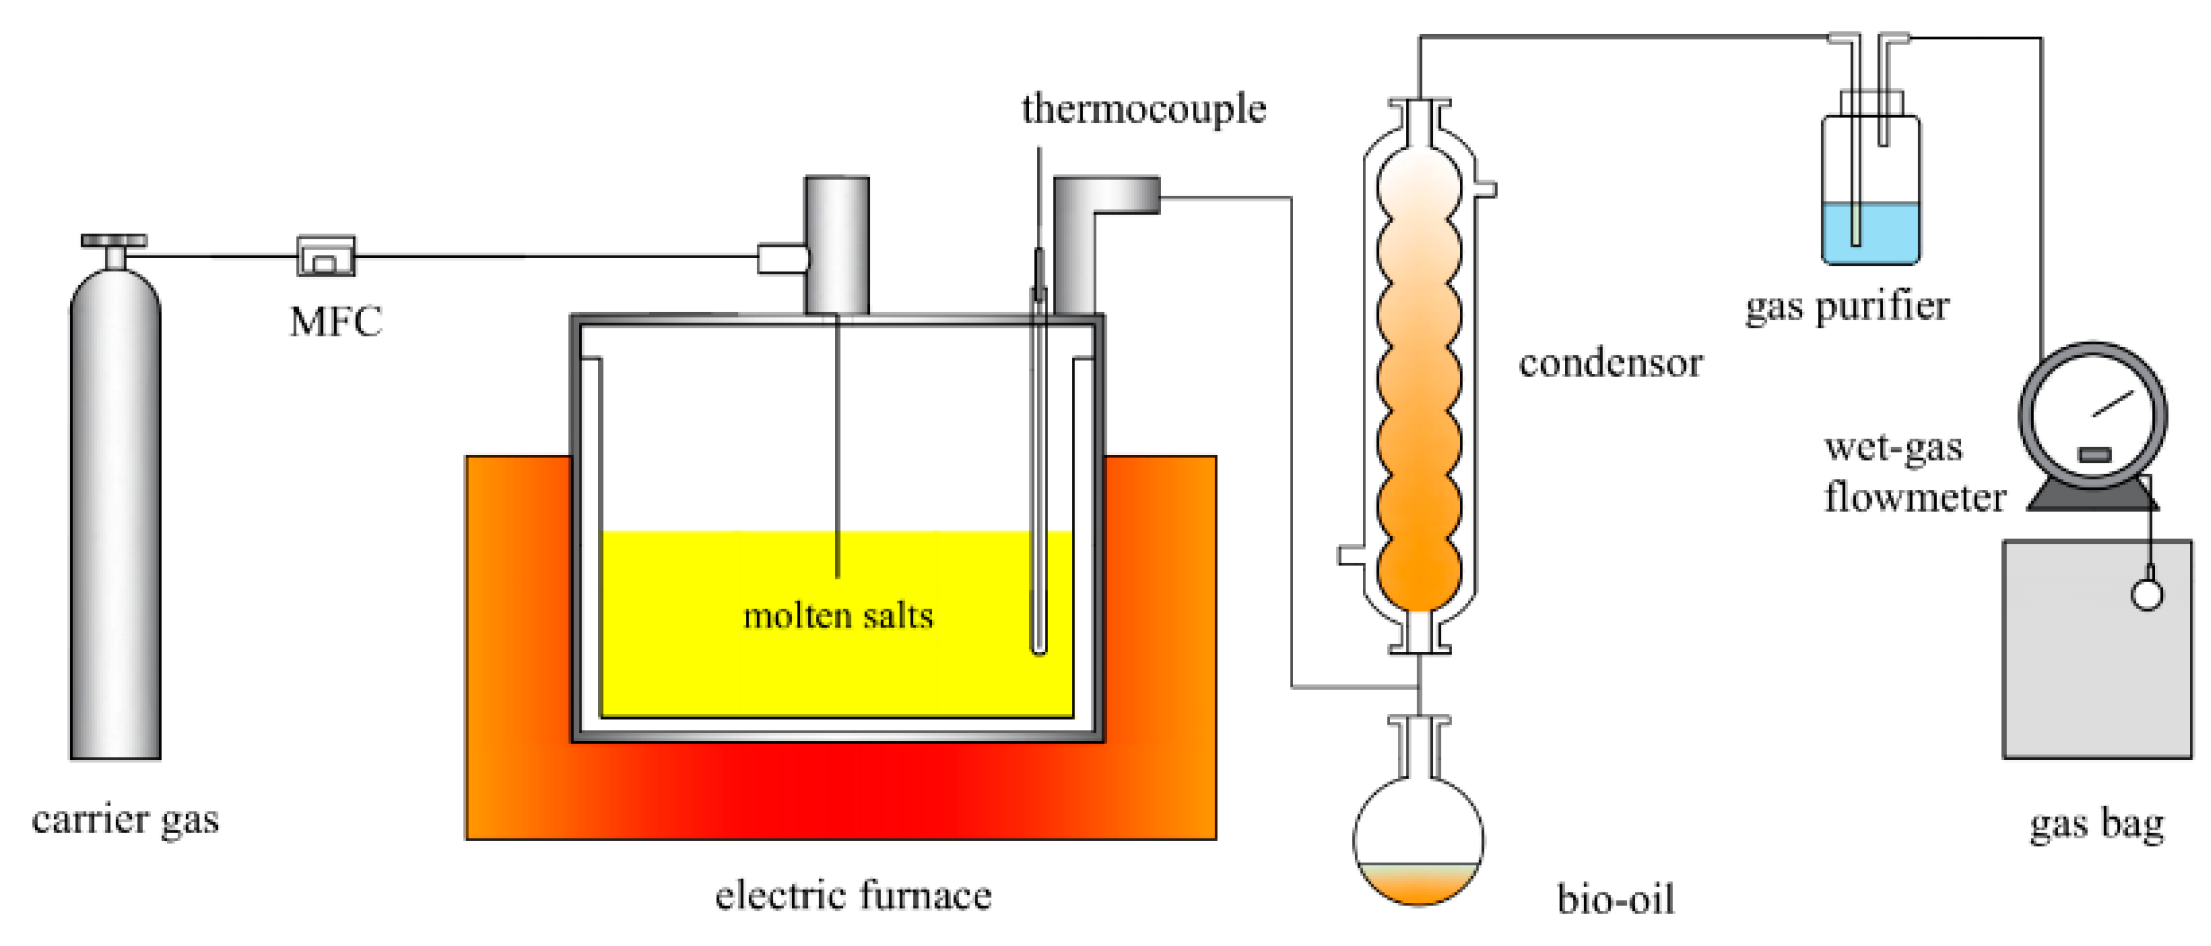
3.3. Pyrolysis System and Conditions
The reaction device is shown in
Figure 11 and contains the carrier gas, reaction, temperature control, and condensation collection system. Pretreated ternary carbonates (100 g) and a catalyst (1.5 g) are added to the reactor. To establish an oxygen-free environment inside the reactor, the nitrogen cylinder is turned on, and the reactor is purged for 30 min. To raise the reactor to the predetermined reaction temperature at a rate of 10 °C/min and maintain it for 30 min, the nitrogen gas supply is cut off. After the condensation cycle is simultaneously activated, the condensation temperature is set to −20 °C. The lignin pellets are poured into the reactor, and the reactor is immediately sealed once the temperatures of the reactor and condensation cycle have reached the desired temperature and can be stabilized. In the reactor, the lignin violently reacts, resulting in a significant gaseous mixture; gas products are collected by gas bags.
The mass of the liquid,
ml, in the round-bottom flask, is measured in m
l after the conclusion of the reaction, and a white mixed solid is produced in the reactor that can produce biochar following processes such as acid washing and water washing. The mass of the biochar is measured in
ms after drying. By difference, the mass of the non-condensable gas,
mg, is determined.
3.4. Analysis Methods
3.4.1. Raw Material Analysis
- (1)
Analysis of industrial components.
Determination of moisture: weigh 1 g ± 0.1 g of lignin and dry in a blast oven at 105 °C ± 2 °C for 2 h, cool to room temperature, and weigh. Repeat until the sample is reduced by no more than 0.0010 g on two consecutive occasions.
Determination of ash: weigh 1 g ± 0.1 g of lignin, increase the temperature to 250 °C ± 10 °C at 5 °C/min and hold for 60 min, then increase the temperature to 550 °C ± 10 °C at 5 °C/min and scorch at this temperature for 2 h. Cool to room temperature and weigh the resulting lignin.
Determination of volatile fraction: weigh 1 g ± 0.1 g of lignin specimen in a pre-cauterized ceramic crucible and send to a muffle furnace pre-heated to a starting temperature of 900 °C for 7 min. Cool to room temperature and weigh the resulting lignin.
- (2)
Elemental analysis.
The elemental content of the experimental lignin was determined using an elemental analyzer (
Table 6). High-purity nitrogen was used as the carrier gas, with nitrogen controlled at 0.15–0.16 MPa and oxygen controlled at 0.2–0.22 MPa, while the cracking and reduction tubes were controlled at 1150 °C and 850 °C, respectively.
3.4.2. Liquid Analysis
A moisture analyzer model 870-KF (Aptar, Mezzovico-Vira, Switzerland) was used in this experiment to measure the lysate. The results were averaged over three measurements made on the same sample.
A certain amount of lignin lysate was extracted with ethyl acetate at a 1:100 ratio, completely blended with an oscillator, and then allowed to stand for 5 min. To create a sample for the organic phase analysis, the upper organic phase was extracted and passed through a 0.22 m filter head. The sample was then analyzed for organic phase chemicals using a gas chromatograph with model number GC7890A-MS5975C (Agilent, Santa Clara, CA, USA). The column was an HP-5MS with high-purity nitrogen at a flow rate of 1 mL/min as the carrier gas, the inlet split ratio set at 20:1, the ion source temperature set at 230 °C, the auxiliary heater temperature set at 150 °C, and the quadrupole temperature set at 280 °C. EI, 70 eV electron bombardment energy, 1200 V electron multiplier voltage, full scan. The parameters for the programmed temperature rise were set to a starting temperature of 50 °C, a rise rate of 3 °C/min, a hold of 200 °C for 2 min, and then a continued rise rate of 5 °C/min to a hold of 280 °C for 2 min.
3.4.3. XRD Physical Phase Analysis
The crystal structure of the catalyst before and after loading was analyzed using a Dutch Panaco X’Pert Pro automatic powder diffractometer with Cu Kα monochromatic radiation, a tube voltage of 30 kV, a tube current of 30 mA, a scan speed of 5°-min−1, a scan range of 0–50°, and a step size of 0.02°.
3.4.4. SEM-EDX
The morphology of the samples was observed through a field emission scanning electron microscope (FE-SEM, HITACHI, Tokyo, Japan, Regulus 8100). The related elemental distribution was analyzed with energy-dispersive X-ray spectroscopy (EDS, Oxford, Shanghai, China, Ultim Max 65).
3.4.5. NH3-TPD Analysis
Place 50–100 mg sample in a reaction tube, warmed up from room temperature to 350 °C at 10 °C/min for dry pretreatment. Purge with He gas (30–50 mL/min) for 1 h, cool to 50 °C. Feed the sample with 10%NH3–He mixture gas (30–50 mL/min) for 1 h. Switch to He gas (30–50 mL/min) for 1 h to remove the weakly physically adsorbed NH3 from the surface. Warm up to 700 °C under He atmosphere at a heating rate of 10 °C/min to desorb NH3, which is detected by TCD.
3.4.6. TG Analysis
The constant ramp rate pyrolysis process of lignin was determined with a TG 209 F3 thermogravimetric analyzer. The initial temperature of the instrument was set at 30 °C, and the temperature was increased to 800 °C, at a heating rate of 25 °C/min. Purge with air as the carrier gas for 50 mL/min.
3.4.7. TG-FTIR Analysis
A 20 mg sample of lignin was placed in the thermogravimetric analysis. The sample was heated from room temperature to 800 °C under a nitrogen atmosphere (a flow rate of 20 mL/min) at a heating rate of 10 °C/min. The volatile fraction from the thermal cracking was fed into the FTIR through a gas transport pipeline for spectroscopy in the wave number range of 800–4000 cm−1 with a resolution of 4 cm−1. The data information was collected and retrieved.
4. Conclusions
To realize the resource utilization of lignin, this study uses purchased lignin as a raw material and a lithium sodium potassium ternary fused carbonate as a medium. We aimed to explore the effect of cerium-based catalysts on catalytic lignin pyrolysis to phenol. The research mentioned above claims that the addition of the catalyst significantly increased the production of monophenols. To address the issues of carbon accumulation and coking, cerium oxide nanoparticles were impregnated with four common metals (Ca, Fe, Cu, and Mg), also aiming to improve secondary lignin cracking and gas-phase reforming. The liquid yield was 25.1 wt.% at 550 °C with 15 wt.% Fe loading, and the amounts of phenol, cresol, and guaiacol were 48.84 wt.%, 29.89 wt.%, and 15.48 wt.%, respectively. The total monophenolic yield reached 0.1817 g/glignin.
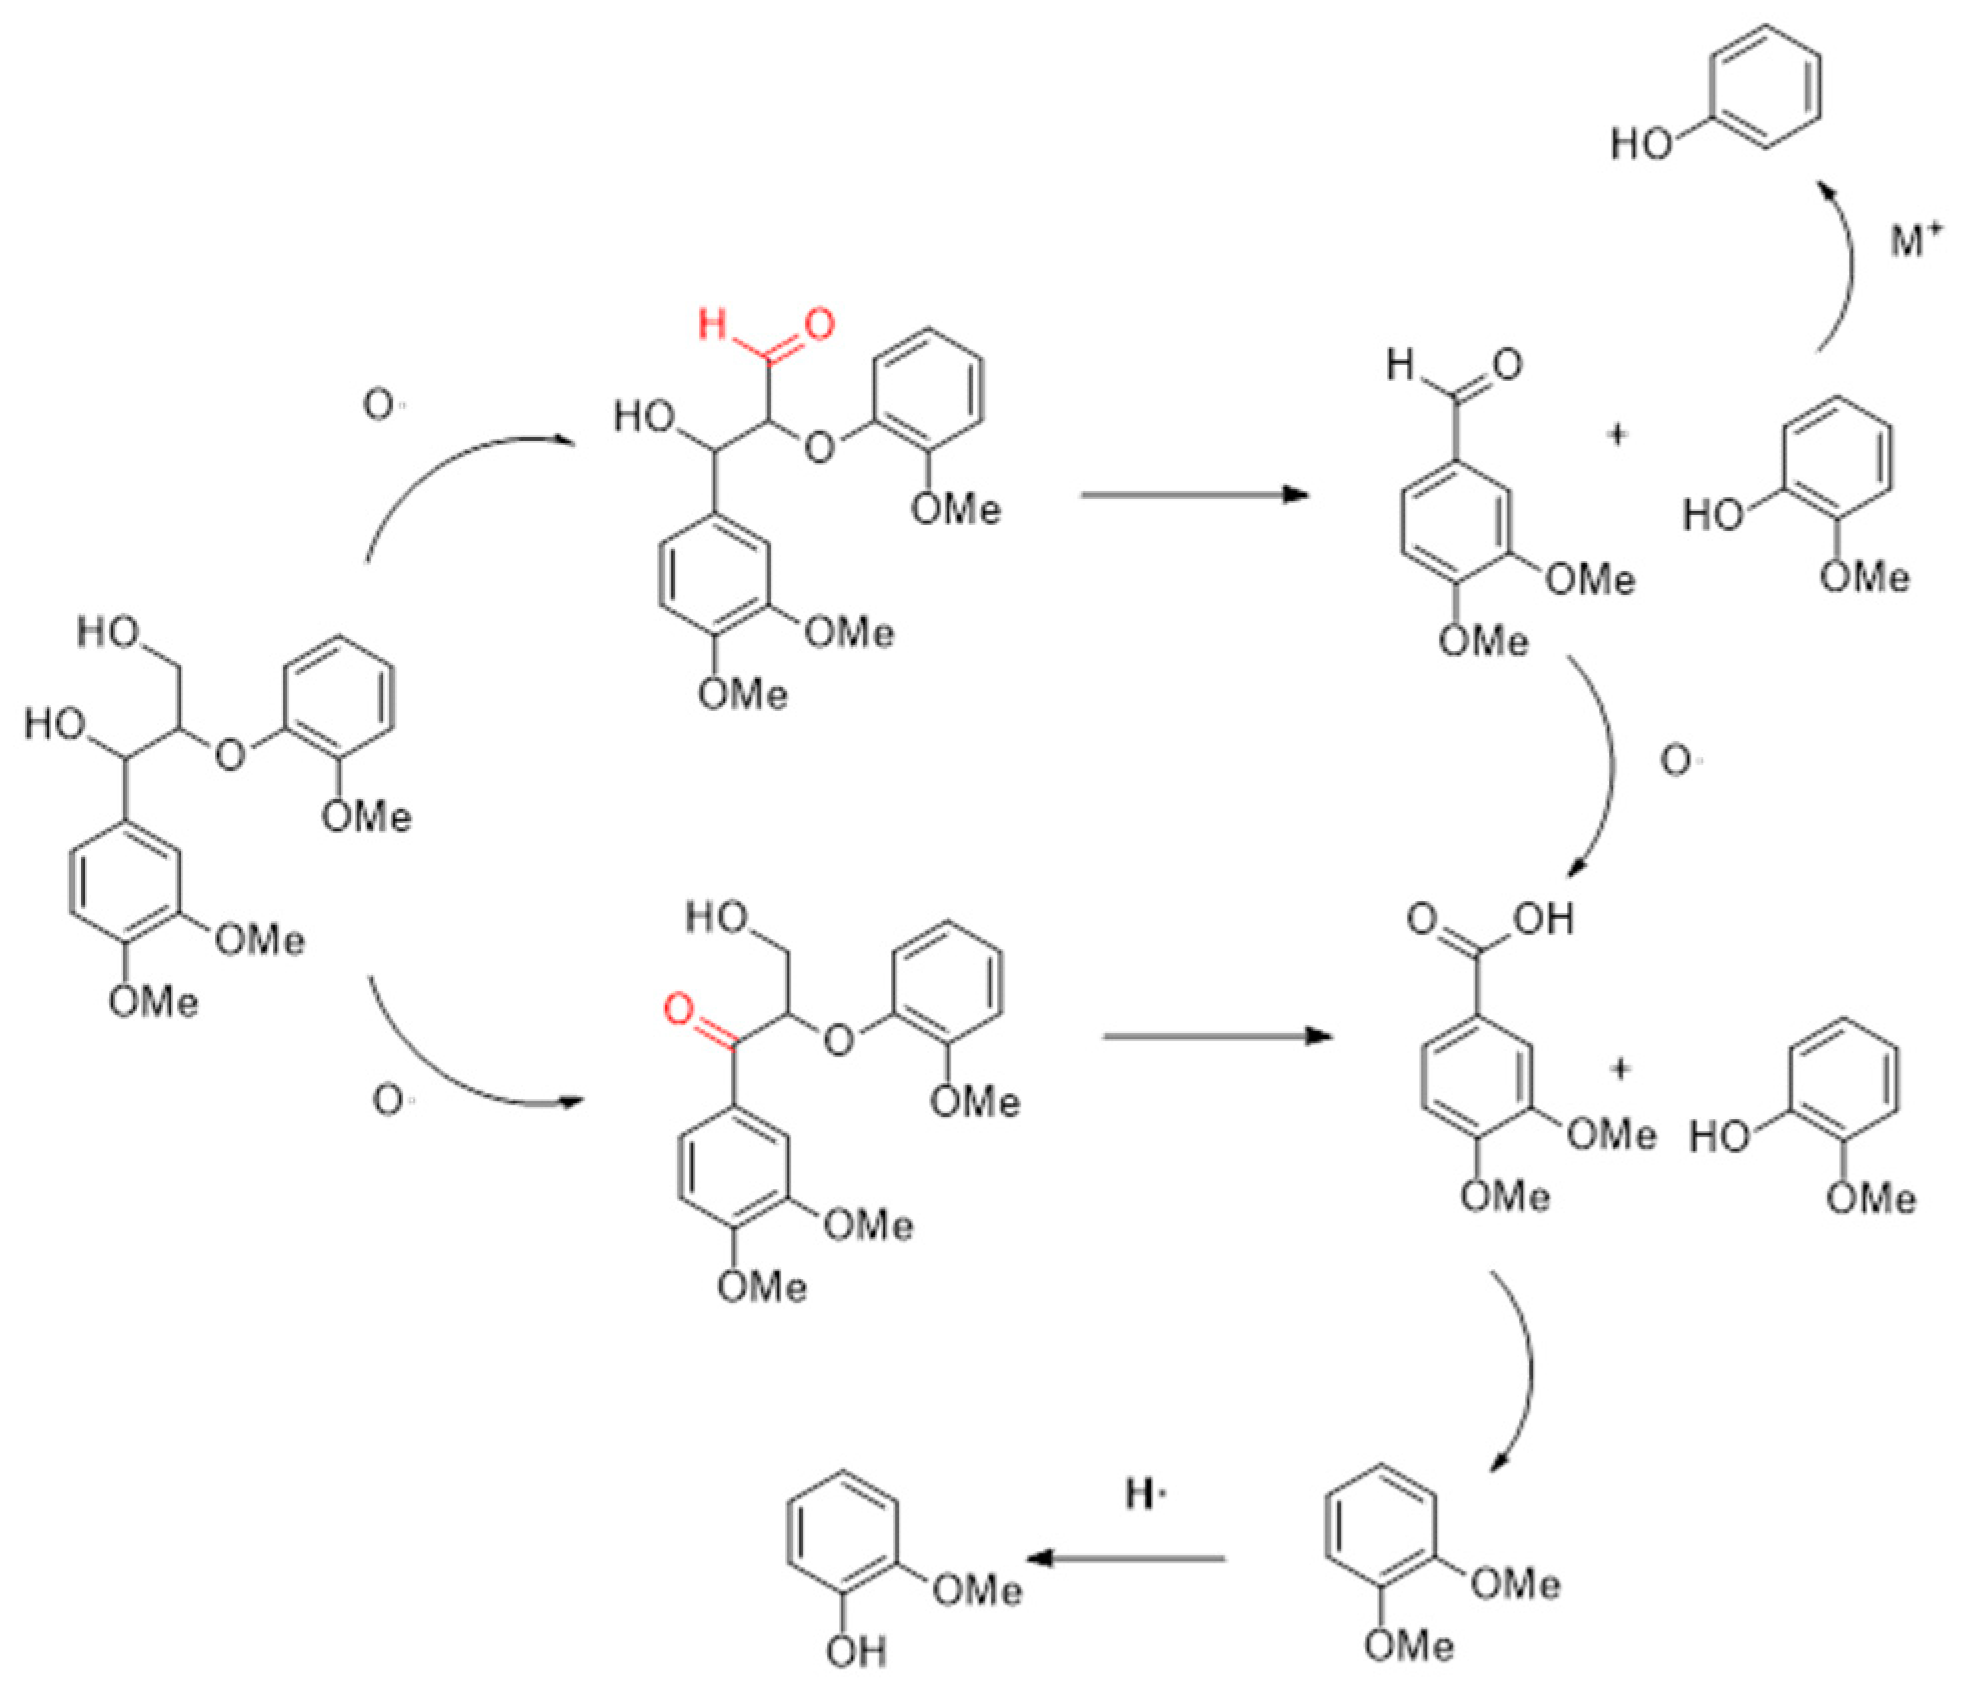
By using TG and TG-FTIR, the temperature of the lignin pyrolysis process was identified. The results reflect with the composition changes the gas–liquid phase products, and the main processes of the catalytic pyrolysis of lignin by cerium-based catalyst coupled with a molten salt system are determined as shown in
Figure 12. First is the breakage of the β-O-4 bond and the oxidation of α-OH, with the former creating mostly aroma aldehydes and phenols and the latter primarily acids and phenols. Methoxy is cracked during the pyrolysis of lignin to create phenolic hydroxyl groups, which are either removed or undergo rearrangement reactions to become methyl groups. Since cerium oxide has a higher oxygen exchange and storage capacity than carbon dioxide, more methoxy is directly removed rather than rearranged to form polyols. More phenol and cresol are formed in the principal cleavage product, guaiacol, as the residence period is prolonged through methoxy breakage and methyl migration processes. The carboxyl groups are easily removed in the presence of molten salts, resulting in large amounts of carbon dioxide, and it is also believed that the reduction of acids in the products supports this conclusion. Free oxygen can be produced during methoxyl migration to further oxidize the aromatic aldehydes to acids. Studies on the composite catalysts’ repeatability and XRD patterns showed that the catalysts’ resistance to crossover and thermal instability had improved to some extent because of the creation of the new crystalline phase CeFeO
3.
In this work, the conversion of lignin was achieved by effectively coupling the removal of oxygen-containing functional groups by molten salts with the catalytic depolymerization of cerium-based catalysts. The current work offers a novel solution for lignin pyrolysis and is crucial to the understanding of lignin. Moreover, it provides a new idea for the rapid conversion of lignin in bulk to achieve effective resource utilization.


