Review

Application of Spectroscopy Techniques for Monitoring (Bio)Catalytic Processes in Continuously Operated Microreactor Systems

1
Faculty of Food Technology and Biotechnology, University of Zagreb, Pierottijeva ul. 6, 10000 Zagreb, Croatia
2
Faculty of Chemical Engineering and Technology, University of Zagreb, Marulićev trg 19, 10000 Zagreb, Croatia
3
Department for Packaging, Recycling and Environmental Protection, University North, Trg dr. Žarka Dolinara 1, 48000 Koprivnica, Croatia
*
Author to whom correspondence should be addressed.
Catalysts 2023, 13(4), 690; https://doi.org/10.3390/catal13040690
Submission received: 10 February 2023 / Revised: 28 March 2023 / Accepted: 29 March 2023 / Published: 31 March 2023
(This article belongs to the Special Issue Microflow (Bio)Catalysis)

Abstract

:
In the last twenty years, the application of microreactors in chemical and biochemical industrial processes has increased significantly. The use of microreactor systems ensures efficient process intensification due to the excellent heat and mass transfer within the microchannels. Monitoring the concentrations in the microchannels is critical for a better understanding of the physical and chemical processes occurring in micromixers and microreactors. Therefore, there is a growing interest in performing in-line and on-line analyses of chemical and/or biochemical processes. This creates tremendous opportunities for the incorporation of spectroscopic detection techniques into production and processing lines in various industries. In this work, an overview of current applications of ultraviolet–visible, infrared, Raman spectroscopy, NMR, MALDI-TOF-MS, and ESI-MS for monitoring (bio)catalytic processes in continuously operated microreactor systems is presented. The manuscript includes a description of the advantages and disadvantages of the analytical methods listed, with particular emphasis on the chemometric methods used for spectroscopic data analysis.

1. Flow Chemistry in Microreactors

Traditionally, most chemical and biochemical syntheses have been carried out in batch reactors. The environmental and economic impact of the chemical, biochemical, and pharmaceutical industries has led to a shift in emphasis to less expensive and more environmentally friendly technologies [1]. One of today’s trends in industrial production is the replacement of the batch process with continuously operated systems [2]. Flow chemistry or continuous processing is based on two or more streams of separate reactants fed at specified flow rates into a single chamber, tube, or microreactor. A reaction occurs at the interface area, and the resulting product is gathered at the reactor system outlet. As described by Hartman [3], flow chemistry has great potential for the research and production of fine chemicals and pharmaceuticals, providing a reduction in research costs of approximately 40% and a reduction in a drug development time of around 90%. The main advantages of flow chemistry reported in the literature are: (i) higher reaction rates due to enhanced mass and heat transfer, (ii) cleaner production due to reduced use of chemicals, (iii) safer reaction conditions due to reduced exposure to potentially toxic chemicals, (iv) rapid and easy optimization of reaction conditions due to the ability to quickly test different reaction conditions, and (v) easy scale-up by connecting the basic processing units in series [4]. A key advantage of flow reactors is their ability to change residence times by changing flow rates while keeping the reactor volume constant. Residence times can be precisely controlled by adjusting the flow rate without the requirement to manipulate several parallel reactors. The thermodynamic properties remain unchanged, and sampling has no effect on the remaining screening criteria [5]. The advantages of the continuously operated reactor system in both chemical and biochemical industries have been extensively reviewed by many authors in recent years [3,6,7,8,9,10].
Common components of flow chemistry equipment are pumps that deliver small amounts of chemicals/reactants into reaction loops, where the reaction takes place and products are generated. An example of a simple microfluidic setup is given in Figure 1.
There has been significant interest in performing flow processes at the microscale [4]. Engineering progress has led to significant advances in small-scale reactors and application models based on microreactors (1 mm) [11]. Microreactors are manufactured from a range of materials including polymers, silicon, metals, stainless steel, glass, and ceramics [12]. When selecting the material for the fabrication of microreactors, functionality, resistance to high pressure and temperature, the selectivity of the reaction mixture, and physical properties of the reaction mixture such as pH, viscosity, and phase should be considered [13,14,15,16]. Technological microfluidics advances have facilitated the manufacture of complicated structures, so microreactors can be built as microcapillaries and chips. Microcapillary reactors are fabricated from tubing of the necessary length and material, whereas chip-based reactors are constructed through micromachining, wet etching, and soft lithography techniques [12]. Depending on the manufacturing process, different surface roughnesses can be achieved in a microchannel. The surface roughness of the channel walls is considered to be one of the most important elements, because as the size of the channel decreases, the influence of roughness on the reaction increases. Depending on the manufacturing technique used, the typical channel roughness ranges from 0.8 to 2.5 μm. The flow in microreactors is mostly laminar at low Reynolds numbers, and phase mixing is mostly controlled by molecular diffusion [17]. Laminar flow conditions ensure a high surface-to-volume ratio and also a large interfacial area, which is very important for multiphase systems. Another important advantage of microreactor systems is simple scale-up, which includes numbering-up (internal and external) of the basic operating units. Numbering-up ensures an increase in throughput from g/h or g/min to kg/h [18], which corresponds to industrial-scale demand. By running processes in a microfluidic device, mass transfer, concentrations, and temperature may be better regulated, and much less reagents can be used. A microfluidic device can screen reaction mechanisms, such as chemical ratios and concentrations, at a faster rate than conventional batch processes. Furthermore, reduced amount of chemicals may be used, which is beneficial for commercial, environmental, and safety purposes [19].
Sample processing, particularly sample digestion and chemical removal, is the longest and most time-consuming step in many analytical techniques, requiring substantial use of chemicals and demanding the highest attention and personal risk from technicians. Therefore, in recent years, substantial attention has been given to eliminating these limitations [20,21]. The downsizing of process equipment has led to the development of micro-total analysis systems (μTAS), also known as lab-on-a-chip devices [22], as shown in Figure 2.
μTAS automate and include the reactant feed area, reaction area, and product separation and detection area on one chip [23]. According to Lee [24], these devices are suitable for use in various scientific fields from chemistry and biotechnology to medicine, because of their fast reaction time, low sample volume requirements, high disposability, and lack of cross-contamination. It is also important to mention that the integration of analytical technology has made microreactors a powerful laboratory tool for reaction and kinetic studies.
The miniaturization trend in different fields of sciences has been driven by significant improvements in material sciences, especially nanotechnology [25]. As described by Gorjikhah et al. [26], nanotechnology is the development and utilization of nanomaterials, nanodevices, and nanosystems by the manipulation of materials on the nanoscale, as well as their application in life disciplines. Nanomaterials are frequently employed in numerous elements of lab-on-a-chip devices. In addition, microfluidic devices are being intensively used for nanoparticle synthesis [27,28,29] and for biotransformation processes with enzymes immobilized on nanoparticles [30,31,32,33]. Because of the small dimensions of microfluidic device channels, reaction conditions may be accurately regulated to ensure homogeneous reaction volumes inside the channel [34]. Nanostructures can be thought of as the building blocks required for innovative biosensing systems that detect DNA, proteins, cells, and so on [25,35]. Furthermore, nanoparticles contribute significantly to precise fluid control and are increasingly being employed in lab-on-a-chip systems. According to Khizar et al. [36], the use of nanoparticle-based micro-systems improves analytical techniques and has a huge impact on research [37] and clinical practice [38]. For the collection and monitoring of biomolecules, nanomaterial-based microfluidic chips with nanopillar, nanowire, gold nanoparticle, magnetic nanoparticle, graphene oxide, nanofibre, and nanoroughened structure are used [39]. The incorporation of various inorganic and organic nanoparticles inside microfluidic devices opens up new possibilities for future sensing applications such as clinical diagnosis, food quality control, and ecological monitoring [40]. Nanoparticles are used as a building element in various microfluidic systems, particularly in new sensing systems [36,40,41]. They are used to change or combine the transducer materials of microfluidic systems, either individually or as matrix, in order to increase several elements of performance such as detection limit, capability, and response stability [36,42].

2. Spectral Analysis Techniques and Chemometrics

Over the years, advanced spectral analysis techniques, such as ultraviolet–visible spectroscopy (UV-Vis), mid-infrared spectroscopy (MIR), near-infrared spectroscopy (NIR), Raman spectroscopy, Fourier-transform infrared spectroscopy (FTIR), nuclear magnetic resonance spectroscopy (NMR), etc., have been rapidly developed and applied in various industries such as agriculture, the food industry, pharmaceuticals, the petrochemical industry, the chemical industry, environmental protection, and medicine. The most important advantages and disadvantages of UV-Vis, NIR, and Raman spectroscopy are listed in Table 1, while the following sections provide detailed information.
The extraction of either physical or chemical information can be achieved through chemometric methods. The aim of chemometrics is to improve the accuracy of the obtained analytical results. Developments in artificial intelligence, big data, cloud computing, and other technologies are making additional contributions to the application of chemometrics [43]. Practical aspects of chemometrics or multivariate analysis include spectral pre-processing, wavelength (variable) selection, data dimension reduction, quantitative calibration, pattern recognition, calibration transfer, calibration maintenance, and multispectral data fusion [44]. Spectral pre-processing helps to remove unnecessary information by correcting the deviations caused by various factors such as interference, light scattering, instrumental drift, etc., and converts the spectrum into the best possible conditions. The choice of the pre-processing algorithm depends on the nature and characteristics of the data [45]. Since spectral data are multivariate and high-dimensional, dimensionality reduction and the extraction of important information is a mandatory step before pre-processing. For exploration and data reduction, principal component analysis (PCA) is one of the most widely applied multivariate methods. A simple scheme on spectral data analysis is given in Figure 3. PCA explores possible similarities and differences among samples to identify clusters or patterns. It is also applied for the reduction in the dimensionality of the spectral data to a smaller number of components, and to determine which variables are important for representing the system [46]. Once the exploratory technique is applied, the spectral data can be modelled using an appropriate pattern recognition technique in which samples are grouped or classified into clusters based on their similarities or common spectral characteristics [45]. The most commonly used classification algorithms are partial least square regression (PLS), partial least square–discriminant analysis (PLS-DA), linear discriminant analysis (LDA), and soft independent modelling by class analogy (SIMCA) [45,46,47,48].
Since the quantification of specific compounds contained in a sample is routine in many laboratories and industries, spectroscopic techniques have also been applied for quantitative purposes. Chemometric regression methods look for a relationship between the spectral data (raw, pre-processed, or a group of selected wavelengths) and some physical/chemical properties of the sample [49,50]. The relationship between the spectral data (predictor or independent variables) and the sample (predicted or dependent variables) is given by a mathematical function. The parameters of this function are estimated from a calibration/training set of samples for which both spectra and the quality parameters of interest have been measured using reference methods. Challenges encountered in this stage include overcoming non-selectivity such as broad and overlapping absorption or emission peaks.
Multivariate techniques can overcome this problem by extracting and combining relevant information contained by multiple variables [51]. Most multivariate calibration methods assume a linear relation between independent and dependent variables. The reason for this could be that many works still use a specific wavelength to quantify a compound. The most straightforward way to estimate model parameters is multiple linear regression (MLR). However, due to multicolinearity problems, the prediction performance may still be very poor [52] and the standard MLR is not appropriate for the creation of regression models. To overcome this problem, principal component regression (PCR) has been proposed. Although PCA scores are used as the predictor matrix to perform multiple linear regression, the PCR algorithm faces many non-informative sources of data variability, which means that the directions of the maximum explained variance may not be relevant for predicting the dependent variables [53]. As an alternative approach to component-based regression, the partial least squares (PLS) algorithm is presented as the most widely used calibration method in chemometrics. PLS regression includes the extraction of a scores set by projecting the data onto a subspace of latent variables that are relevant to solve the calibration problem. In PLS, the covariance between the corresponding scores and the responses is maximized, yielding scores that both describe a significant part of the variance of the data and are correlated with the responses [44,53,54]. However, to achieve accurate and reliable estimations using PCR or PLS models, the selection of an appropriate number of latent variables for describing the data is the most important step. Problems such as underfitting (selection of a low number of components) or overfitting (if too many are captured) could occur, resulting in a model that performs poorly or very well in predicting the samples but with poor performance with the new ones. This risk can be reduced by using an appropriate validation strategy (such as cross-validation), which means selecting the optimal number of latent variables to minimize error during validation [44].
Although multivariate calibration methods assume a linear relationship between predictors and predicted variables, nonlinearity of the data can occur [55,56]. To overcome this problem, nonlinear models, such as artificial neural networks (ANNs), which are defined as self-adaptive and massively parallel machine learning systems, can be used [57]. ANNs represent a model of biological network structures (neurons) with natural characteristics of storing experiential knowledge and making it available for use. The abilities of ANNs include recognizing and reproducing the cause–effect relationships through training for multiple input–output systems, making them efficient to represent even the most complex systems [49,58]. The advantages of using ANNs include universal approximation capability to approximate almost all kinds of nonlinear functions, including quadratic functions. The limitation of using ANNs is that no global optimal solution can be guaranteed [58].
In summary, spectral print represents great potential for qualitative and quantitative analysis in all fields. Chemometric methods have proven to be a reliable technique for the exploratory analysis of multivariate data, as well as for the construction of reliable calibration models suitable for the prediction of quantitative responses and the development of classification strategies for the prediction of qualitative responses, based on the experimental results obtained from samples. Additionally, the implementation of sophisticated computational softwares has brought numerous gains in terms of the use of spectroscopic methods for the prediction of physical/chemical properties of a sample. This is the reason why the application of multivariate calibration models has numerous advantages such as measurement of the variables of interest and potential reduction in time and costs [44].

2.1. Ultraviolet–Visible Spectroscopy

Ultraviolet–visible spectroscopy (UV-Vis), along with NIR, is a spectroscopic technique used in various fields such as agriculture, the food industry, pharmaceuticals, and environmental science [44]. UV-Vis spectroscopy allows to monitor and measure molecule interactions in the specific range of 200–700 nm [59]. The principle of UV-Vis measurements is shown in Figure 4.
This technique investigates phenomena such as absorption, scattering, diffraction, refraction, and reflection occurring between the light and the compound(s) within the sample. UV-Vis light absorption is particularly limited to certain chromophores with defined molecular functional groups and is mainly influenced by their composition and concentration. To correlate the amount of incident light absorbed by the absorbing compound or molecule in a matrix with its concentration and the light path length, the Lambert–Beer law is applied. Lambert–Beer’s law is strictly only valid if some fundamental conditions are fulfilled, for example: the presence of strictly monochromatic measuring light is important; a homogeneous distribution of molecules in the sample is required; the measuring beam should completely pass through the sample; absence of light scattering and of photochemical reactions in the sample; no re-emission of the absorbed light by fluorescence; an ideal acquisition and processing of the intensity values I0 and I (intensity of the measuring beam before (I0)/after (I) passing through the sample) [60].
The position of the maximum of the absorption bands and the intensity of the bands are parameters that characterize the UV-Vis spectrum of a sample. That means that the maxima and intensities of the absorption bands differ with regard to the molecular structure of the compounds, which, in turn, depends on the sample. Furthermore, the amount of light absorbed by the interacting molecules also depends on their concentration in the sample. The full spectrum can then be used for quantitative or qualitative analyses or to determine the physical and chemical characteristics of a sample, as this information is contained in the positions, intensities, and shapes of the bands [59,61,62,63]. In contrast to pure component, the identification and/or quantification of a compound in complex matrices (i.e., food) containing mixtures of different compounds that can absorb in the UV-Vis region generally reveals some broad absorption bands in the recorded spectra, which are often difficult to assign to individual chromophores [44,64].
Most commercially available UV-Vis spectrophotometers are constructed in different configurations and, thus, have different measurement capabilities and sample types and/or different measurement conditions so that solids, liquids, and gases can be analysed. In addition to standard liquid-holding cells for the measurement of the sample absorbance, probes, flow-through transmission cells, and diffuse reflection cells have been also developed for the extension of the use of UV-Vis spectroscopy in quality monitoring and process control as a real-time analytical sensor in biological, pharmaceutical, and food applications [65,66,67,68,69].
UV-Vis is a non-destructive, eco-friendly technique that allows reuse or further processing of samples. It also requires only a small number of samples and simple data analysis with minimal processing, compared to other spectroscopic techniques. Using UV-Vis, it is possible to identify and determine the concentration of a particular molecule in a solid or liquid sample, to measure the colour of a material, and to study chemical reactions or biological processes [70]. There are some disadvantages with applying this technique. Scattering effects, interference from multiple absorbing species, formation of overlapping spectra, and saturation of the spectrum make the identification and quantification of specific compounds difficult, leading to non-reproducible results. The selection of the most suitable sample holder, cuvette material, solvent, and instrument parameters is also required to avoid unnecessary optical interactions, which will, in turn, alter the absorbance value of the sample, causing potentially serious measurement errors. Geometric parameters such as alignment to the same orientation and placement in the same position for every component in the instrument should be considered during measurement [60,70].

2.2. Infrared Spectroscopy

Infrared spectroscopy (IR) is a non-destructive, accessible, and rapid spectroscopic technique, widely applied for the investigations of molecular structures. The term “infrared” comprises three subregions: 770–2500 nm (near-infrared; NIR), 2500–25,000 nm (mid-infrared; MIR), and 25,000–1,000,000 nm (far–IR; FIR). Since the term wavenumber is most often used, the near-infrared region will correspond to 12,820 to 4000 cm−1, mid-infrared is in the wavenumber range from 4000 to 400 cm−1, while far-infrared corresponds to 400 to 33 cm−1 [71].
An IR spectrum is generated by measuring the absorption of electromagnetic radiation due to vibrations within a molecule. Absorption will occur due to the matching of the radiant energy with the energy of a specific molecular vibration. Based on molecular vibrations, the identification and study of the molecule structure can be performed. For instance, the C=O groups of –C=C–C=O and –CH2–CH2–C=O will yield different frequencies, meaning that IR can be used not only for identification but also for the exploring of the chemical bond and environment of the functional group [72]. Due to the presence of fundamental vibrations, the MIR region is mostly used for the molecular structure determination and confirmation of organic compounds. The radiation frequency of this region matches in energy with the natural vibrational frequencies of the bonds in organic molecules. This means that highly specific information can be extracted from the obtained MIR spectrum [69,71,73]. Each molecule has unique levels of vibrational energy, hence MIR can ensure a “fingerprint” of a particular molecule [74]. The characteristic band of a given bond is the bond’s absorption band [75]. Because the corresponding intensity of an absorption band is much lower than that in the mid-infrared region, the limit of detection with NIR is significantly lower (about 0.1% in concentration) compared to the MIR spectroscopy. On the other hand, FIR spectroscopy presents technical difficulties, although it is capable of detecting stretching vibrations of molecules containing heavy atoms, i.e., metalorganic complexes or inorganic molecules [73].
The use of IR spectrometers started in the 1940s. The dispersive spectrometer contained a light source, spectroscope, monochromator, and detector. In order to obtain infrared spectra, the intensity of reference radiation and probing radiation were comparing. The major drawbacks of this instrument were its slow speed and low resolution. These instruments are rarely used nowadays. The introduction of the Fourier-transform infrared (FTIR) technique represents an improvement of the IR instrument. Fourier-transform infrared spectroscopy uses the Fourier transform to convert the raw time domain signals into an easily visualizable IR spectrum that maps the IR radiation absorbed/transmitted over each frequency, creating a molecular fingerprint [76]. The commercial use of FTIR spectrometers started in the mid-1960s, while their wide use began after the mid-1970s [76,77]. The FTIR instrument consists of a light source, Michelson interferometer, detector, and computer. The advantages of using FTIR instruments, in contrast to dispersive spectrometers, include faster speed of analysis due to simultaneously measuring the radiation over a wide range, higher wavenumber resolution, and accurate determination of wavenumbers, which ensures high reproducibility and reliability [77]. In addition to the identification of molecular structure, the advantages of using FTIR spectroscopy include: (i) universality for many different sample types, (ii) sensitivity, with a minimum quantity of sample required, (iii) easy and fast acquisition process, (iv) abundant information regarding spectrum, and (v) relatively low work cost. There are some drawbacks of applying this technique: influences of the working environment such as atmosphere humidity and CO2 can significantly affect the quality of the recorded spectrum and interfere with spectrum interpretation. The difficulty of spectrum interpretation and band assignment increase with the complexity of the sample composition [71,78].

2.3. Near-Infrared Spectroscopy

In recent decades, near-infrared spectroscopy (NIR) has been increasingly used as a monitoring and analytical tool, especially in the food and agricultural industries, but also in the polymer, textile, chemical, and pharmaceutical industries [79,80,81]. According to the definition of The American Society of Testing and Materials (ASTM), the near-infrared region of the electromagnetic spectrum comprises the wavelength range from 780 to 2526 nm [82]. It encompasses both vibrational and electronic spectroscopy, since the absorption bands occurring in the NIR region arise from electronic transmissions as well as those due to overtones and combinations of fundamental vibrations of the XH bonds (X = C, N, O, S) [82,83,84]. Transitions from the fundamental state to higher excited states lead to the emergence of NIR overtone bands. The simultaneous appearance of two or more vibrational transitions leads to NIR combination bands [83]. Since vibrational transitions have a lower probability of occurrence compared to the fundamental transitions, the NIR absorption bands are very weak, which makes this region unique and significantly different from the other regions. Since a number of bands overlap each other, due to overtones and combination modes, the NIR absorption bands are typically broad and overlapping, making the interpretation of NIR spectra difficult [85,86,87]. The overtones and combination modes are also called “forbidden transitions” [84,85,88,89,90]. However, the NIR region is significant because it serves as a highly transmitting window for radiation, making this area unique for different types of applications [84].
NIR analysis is a fast, reliable, cost-effective, and non-destructive multicomponent analysis [91]. Within in-line analysis, no samples need to be collected, no waste is generated, and no complex pre-treatments of samples with solvents or other chemicals is required. All these make NIR a safe, clean, and energy-saving method that fully complies with the principles of green chemistry [92]. The disadvantages of the NIR method include its low sensitivity, which is due to low absorption indexes, resulting in a higher detection limit. As an indirect method, NIR requires the development of a multivariate calibration model as opposed to an appropriate reference method. This limits the accuracy of the NIR method. Additionally, the development of a multivariate calibration model requires a large number of samples in order to include all possible sources of variability in the NIR spectra [83].
Due to its wide range of applications, NIR technology has attracted a number of instrument manufacturers who offer a range of instruments and accessories capable of meeting the requirements for off-line and on/in-line process monitoring [93]. In general, any NIR instrument built to perform reflectance or transmittance measurements includes components such as a radiation source, sample–radiation interaction device, wavelength selector, detector, and data acquisition, treatment, storage, and instrument control device (microcomputer). An example of an experimental setup for NIR measurements is given in Figure 5.
The arrangement of these parts and their particular characteristics depend on the type of measurement (off- or on/in-line) and on the properties, including physical state. In recent years, the development of portable miniaturized bench tops and miniaturized instruments has increased as different industries have different requirements for raw material quality control, on-site quality control monitoring, and process-distributed monitoring. Furthermore, the development of image spectroscopy has led to the improvement of the NIR technique by adding two spatial dimensions to the spectral dimension. Information about a heterogeneous sample increases accordingly, giving access to several of its properties that cannot otherwise be determined from (average) spectral data [94].

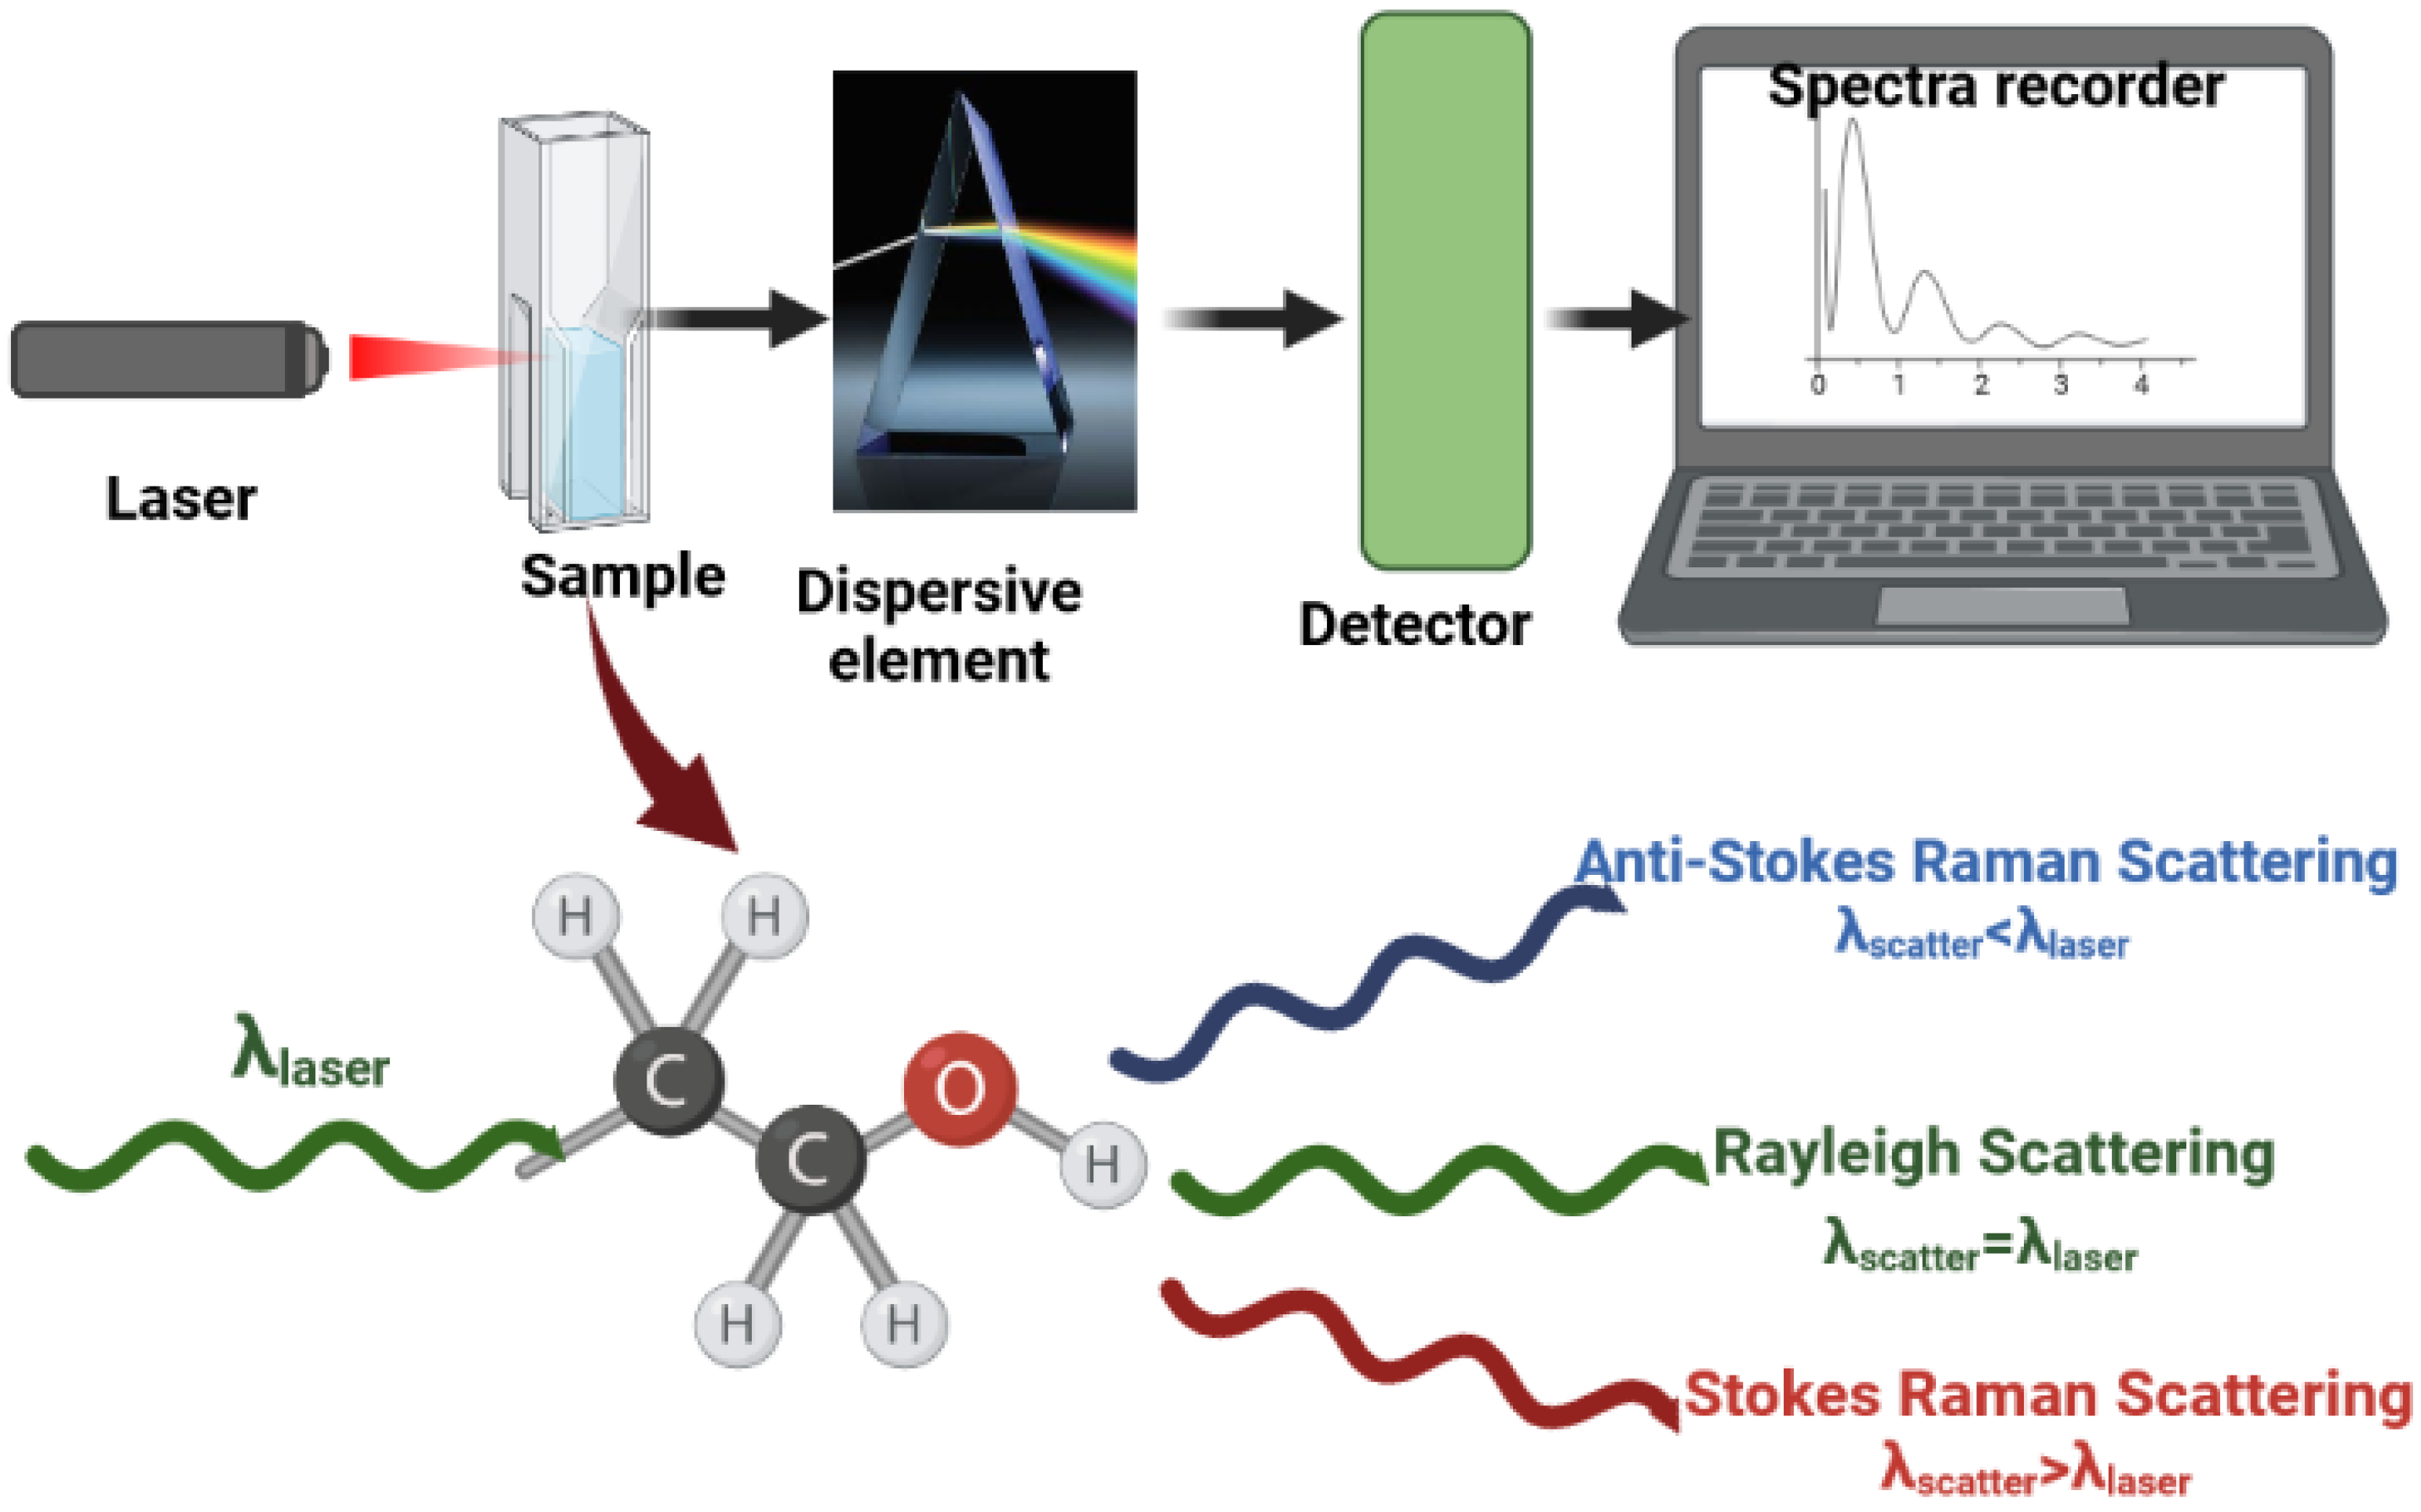
2.4. Raman Spectroscopy

Raman spectroscopy is one of the most versatile tools for the analysis of various materials, both in the laboratory and under field conditions [95,96]. It can be used to measure the chemical composition of complex biological samples such as biofluids, cells, and tissues [96]. Over the years, Raman analysis has evolved to reach several industries such as food and textiles [97,98]. While Raman spectroscopy is now widely used in biology and medicine, its first applications were in physics and chemistry, mainly to study the vibrations and structure of molecules [99].
Raman is an optical technique based on the inelastic scattering of light by molecule vibration [96,100]. When a given material is irradiated with monochromatic light, a large fraction of the beam is scattered without changing the frequency of the photons, so the energy before and after irradiation is the same. The energy of the incident photon interacts with the molecule and creates an energy gap between the two electronic energy levels, i.e., between the ground state and a virtual state [100,101]. The molecule emits a photon and obtains a different vibrational or rotational state. As a result of the energy difference between the final and ground states, there is a shift in the emitted photon frequency [102]. In contrast to inelastic light scattering, light scattering (called Rayleigh) occurs when the energy of the scattered photon matches that of the incoming photon and the involved electron returns to a state that has the same energy as the initial state. Regarding inelastic scattering, the photon’s energy loss is equal to the energy difference between the original and final electron levels. If the outgoing photon has a lower energy than the incoming one, it becomes anti-Stokes scattering; in the opposite case, it is Stokes scattering. The difference in energy between the incoming and the outgoing photon is called the Raman shift. The principle of Raman spectroscopy is shown in Figure 6.
Since the weak scattering signal was an early factor limiting the implementation of Raman spectroscopy, the use of plasmonic effects induced by the presence of metal nanoparticles can enhance the Raman signal. This is known as surface-enhanced Raman spectroscopy (SERS), a technique used for the investigation of the molecular structure at the single-molecular level based on Raman scattering. The use of SERS includes sensing and imaging applications, and analytical and biological applications [100,103,104]. Tip-enhanced Raman spectroscopy (TERS) is a technique also based on the amplification of the Raman signal and often used for analyses of a wide range of biological and chemical samples with a high spatial resolution of a few nanometres [105].
Raman analysis can provide real-time or near real-time molecular information and high-resolution imaging at a relatively low cost. Raman uses light in the visible or near-infrared spectral range, taking advantage of advanced optical microscopy technologies, optical fibres, miniaturized lasers, and photonic devices [96,100]. Additionally, Raman is a non-destructive method based on light scattering, so measurements can be performed with little or no sample preparation. It may be used for work with aqueous solutions since water is weakly scattered and it does not interfere with spectral data [102].
The major drawback of Raman spectroscopy is the relatively low efficiency of inelastic light scattering compared to elastic scattering, fluorescence emission, or absorption of infrared light, leading to relatively long acquisition times (0.1–1 s per spectrum) [96,99]. Another problem is the detection of specific biomolecules; Raman spectra of complex biological samples contain overlapping bands, making it difficult to obtain the signal from only specific molecules [96]. A rather general and neglected problem is the baseline correction of spectra [106,107]. In addition, quantitative analysis of Raman spectra can be unreliable if not compared and validated against well-established methods [108]. Nevertheless, Raman spectroscopy could provide very good insight into the study of many materials, and with the creation of large databases, qualitative Raman analysis will become increasingly reliable [100].

2.5. Nuclear Magnetic Resonance Spectroscopy

Nuclear magnetic resonance (NMR) spectroscopy is a non-destructive technique that uses magnetic fields in order to obtain qualitative and quantitative information on solid, liquid, and gaseous samples [109]. NMR investigates the phenomena of magnetic resonance of atomic nuclei to provide information about their local magnetic fields [110,111]. Since protons and neutrons are spinning nucleons, they are characterized by a nuclear spin quantum number (m), with a range of values from −1/2 to 1/2, according to their magnetic behaviour. Protons and neutrons together form atomic nuclei. The magnetic characteristic of atomic nuclei is described by the nuclear spin (I). I represents the total number of spin states. Each nucleus has its own spin quantum number (m), ranging from −I, −I + 1, …, to I − 1, I. Nuclei are magnetically inactive when they have only one spin state (I = 0); therefore, they cannot be directly detected by NMR experiments [110]. NMR spectrometers are used to perform NMR analysis. These instruments are used for irradiation of the nuclei (with I ≠ 0) of a sample immersed in a strong magnetic field, for detection of the sample’s resonance frequencies, and for measuring the intensities of the corresponding signals. NMR instruments should have the possibility to modify the strong magnetic field B0 and/or the irradiation frequency B1. Conventional instruments use a continuous-wave technique (continuous sample irradiation) while significant improvements are attributed to the development of the Fourier transform-NMR (FT-NMR) technique. The FT-NMR technique means immersion of the sample in a strong, static magnetic field B0 with monochromatic irradiation B1. Consequently, the resulting irradiation will be polychromatic, with frequencies in units kHz and the acquisition time reduced to seconds. Recently, low-field benchtop (desktop) FT-NMR spectrometers have also been developed; they are smaller and cheaper compared to the high-field ones, with the use of permanent magnets instead of superconductive ones [110]. Regarding data analysis, NMR spectroscopy enables the identification of chemical compounds, since NMR spectra contain important aspects regarding the chemical structure. These aspects include composition, constitution, configuration, and conformation, as well as nanostructural aspects of the analyzed compounds. Recording 2D-NMR spectra has also become common in the last 30 years; 2D-NMR spectra are generated from a series of independent 1D-NMR spectra. Although 2D-NMR techniques are commonly used for the determination of the structure, their major drawbacks include longer acquisition time, since multiple 1D-NMR spectra are required to create a 2D spectrum. To overcome this problem, ultrafast 2D (UF-2D) NMR spectroscopy has been developed, reducing the series of experiments to a single experiment only [112,113]. Similar to 2D-NMR, 3D-NMR techniques also show correlation between three 1D NMR spectra. Therefore, with the evolution of multidimensional techniques, parameters such as the sampling method and data processing are of practical importance due to decreasing the overall time of analysis [114,115,116,117].
NMR spectroscopy provides sufficient information on the local environment of the nuclei, with atomic-level resolution. It could be used in different fields including organic chemistry, catalysis, biology, medicine, and industry [111]. The application of low-field benchtop NMR spectrometers may significantly broaden the number of users. It is a fast, linear technique suitable for accurate quantification (below ±1%), allowing complete molecular structure elucidation. Sample preparation is relatively simple, and the obtained results are highly reproducible. However, there are some disadvantages, such as rather low sensitivity for any NMR active nucleus. Relatively large sample amounts are required to prevent very long signal averaging for obtaining significant spectra. The interpretation of NMR spectra can be difficult. The NMR technique is unsuitable for ultra-precise quantifications. Equipment and operating costs are high. The applicability of NMR technology depends on the nature of sample and the type of nuclei it contains. Despite some disadvantages, development in NMR spectroscopy will make this technology accessible for future scientific applications [110,118,119].

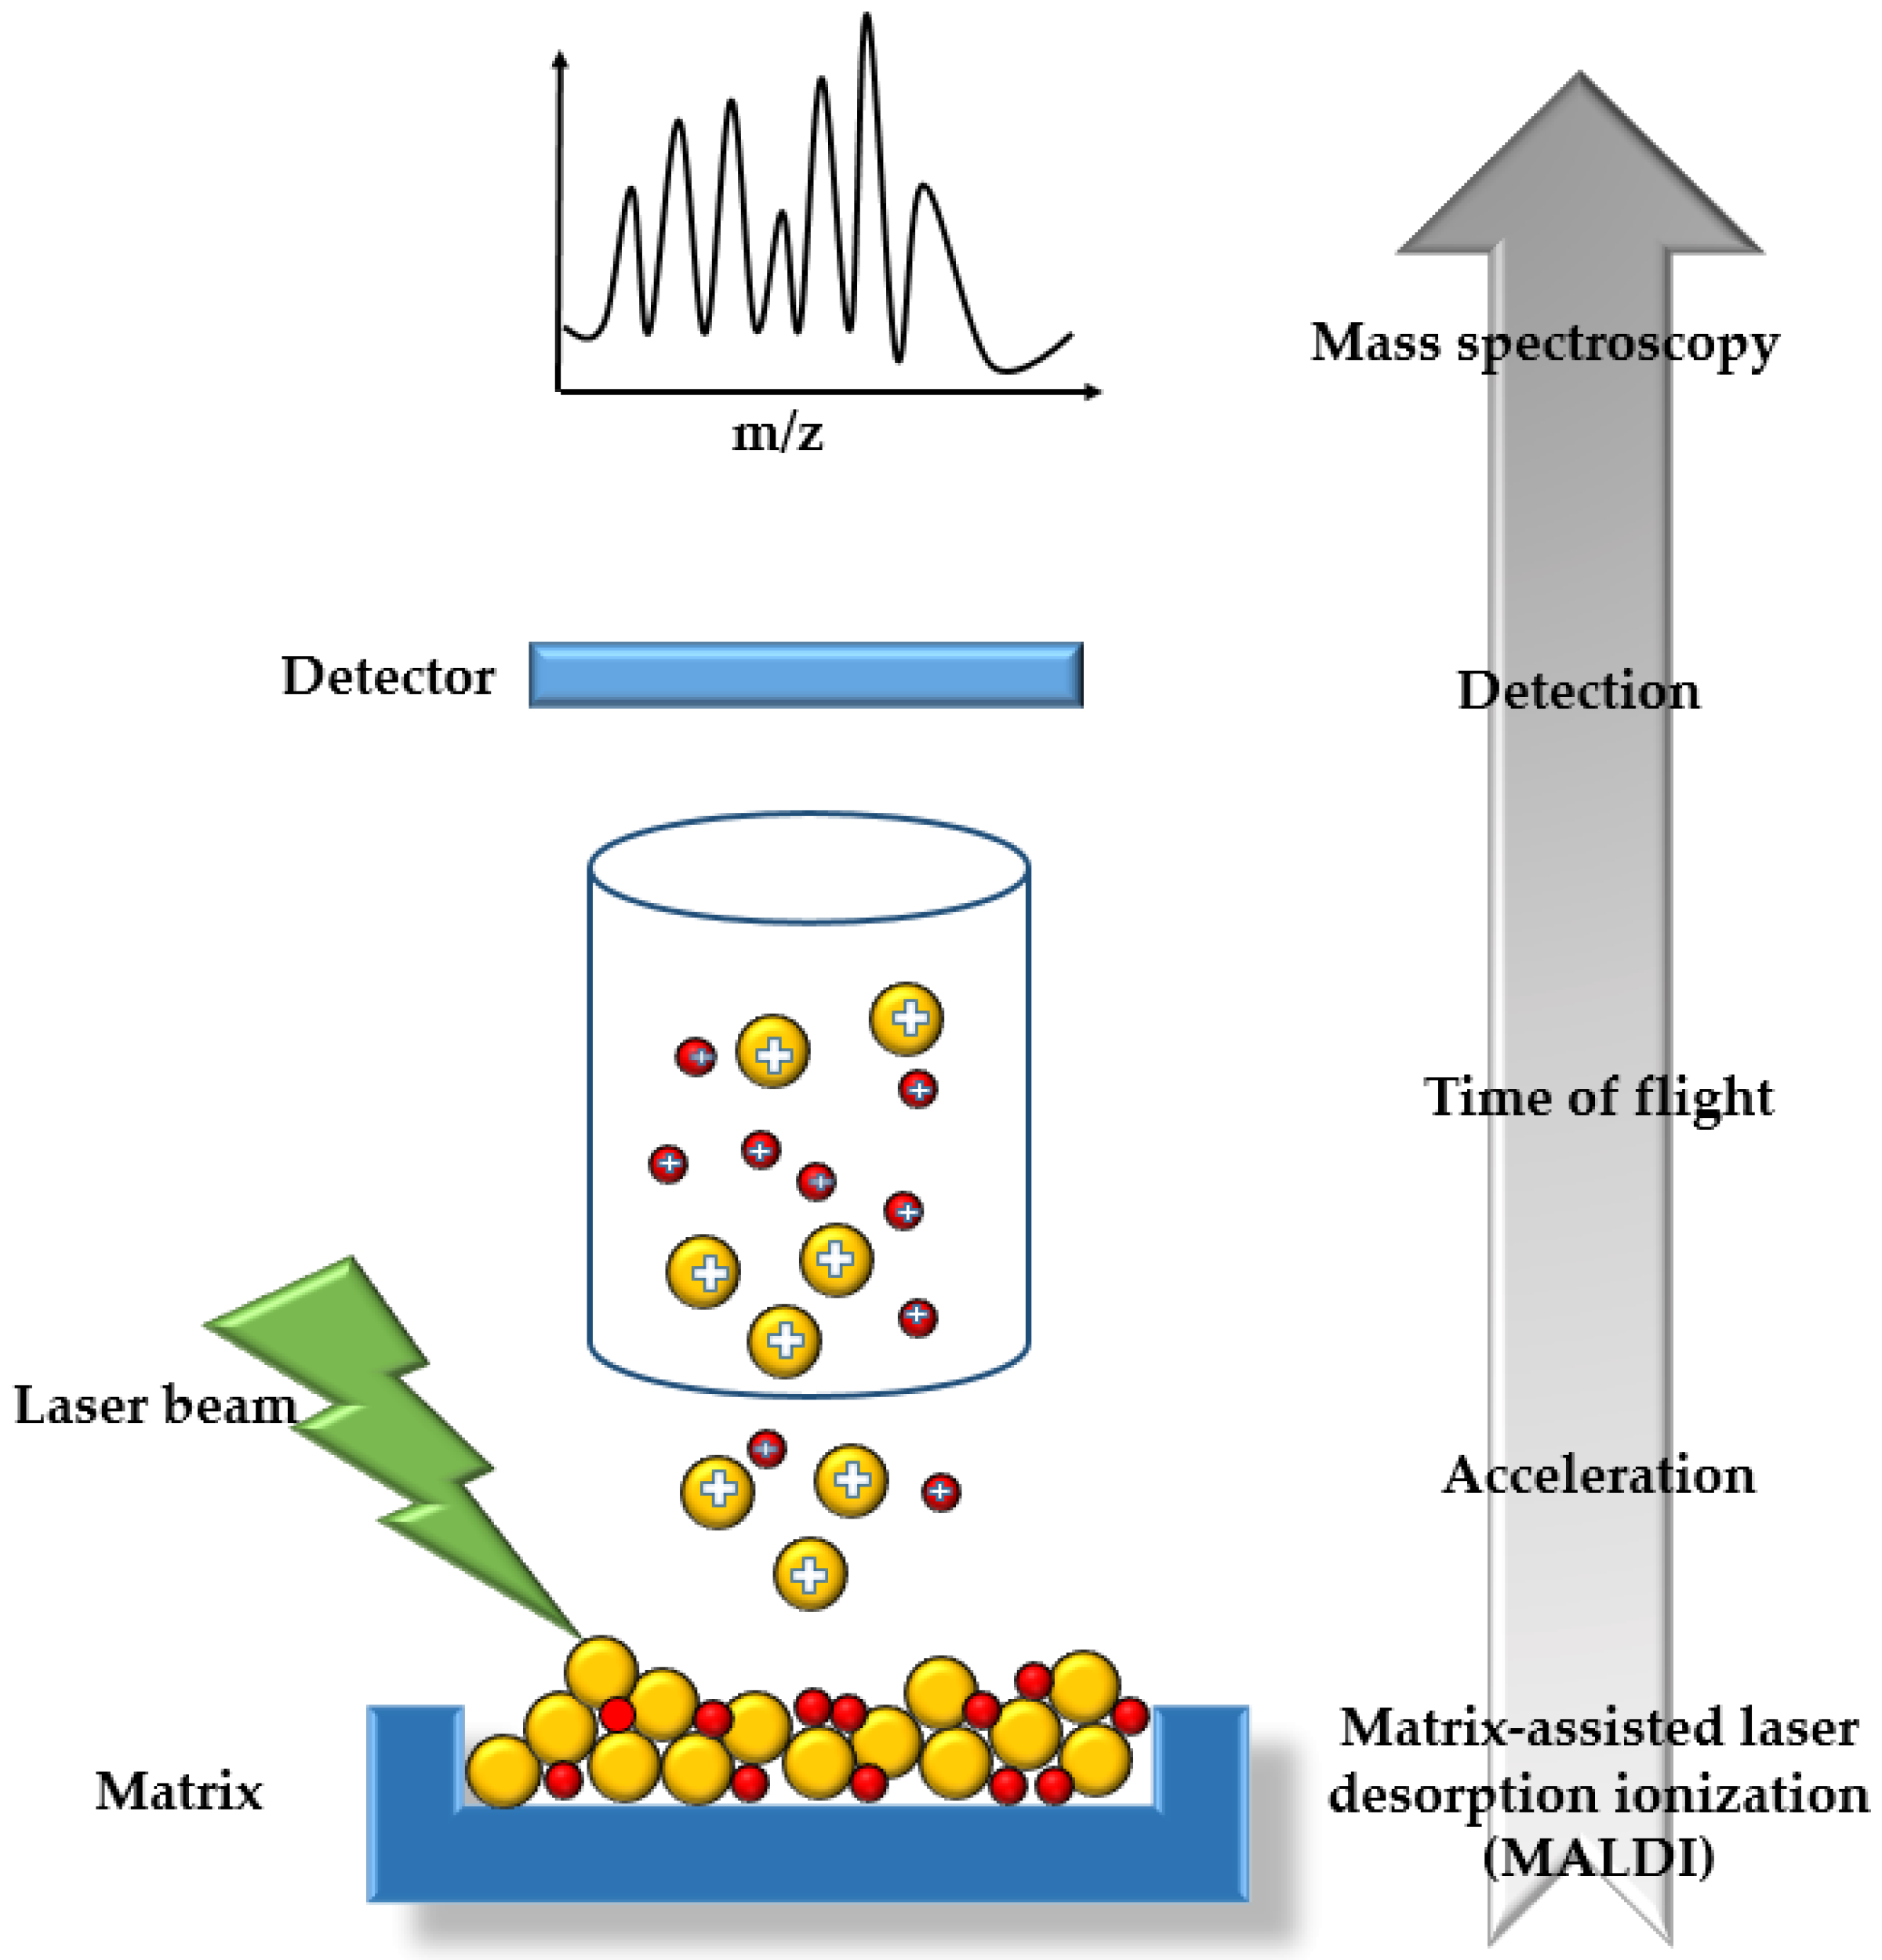
2.6. Matrix-Assisted Laser Desorption Ionization Time-of-Flight Mass Spectrometry

In order to identify the elemental composition and amount of chemical or biologically active compounds, mass spectrometry (MS) is usually applied. This analytical technique relies on measuring the mass-to-charge (m/z) ratios of the analysed samples. Despite the variety of mass spectrometry techniques, the design of all the instruments is similar and includes a source of ions (for ionization of the molecules), an analyser, which is needed for the separation of ions according to the (m/z) ratios, a detector, and a recorder. The signals are graphically displayed as a mass spectrum, which depicts the relative abundance of the signals based on their (m/z) ratios [120,121,122] (Figure 7). During the application of conventional MS techniques, the sample is bombarded with electron beams, resulting in breaking the sample into thousands of charged fragments. The identification of the molecules in the defragmented sample is conducted by correlating the known masses with the resultant patterns of the fragments. This technique, commonly known as “hard ionization”, does not allow preservation of the molecules during ionization [123,124].
Matrix-assisted laser desorption/ionization (MALDI), belongs to the group of “soft ionization“ techniques, developed since the mid-1980s. MALDI is currently used in MS techniques to generate ions by laser radiation, mostly in the UV range. MALDI is often used together with a time-of-flight (TOF) analyzer, under high vacuum conditions and under atmospheric pressure [122]. The basic principles of a TOF analyser include the dispersion of ions of different (m/z) ratios in time, during their flight along a path of known length. The ion detector can register the time of flight and the intensity of the individual ions that reach the ion detector; the lighter ones will arrive earlier at the detector compared to the heavier ions [123]. The molecules are protected from fragmentation during the ionization process by the presence of the matrix, whose role is to mediate the energy transfer to the sample and facilitate ionization and desorption of the molecules. Since molecules cannot absorb laser radiation, the role of the matrix is to ionize the molecules. The matrices are substances capable of absorbing UV radiation well and sublimating easily, and they have a great ability to provide large amounts of ions required for the analyte ionization after desorption [122]. During MALDI ionization, positive and negative ions are formed. Depending on the sample type, various forms of adducts, ions stabilized with metal cations, or ions containing matrix molecules may occur [125]. The intense molecular peak type and a small number of multiply charged ions are the most frequent signals in the MALDI spectra [126].
MALDI-ToF-MS has found application in different scientific fields such as chemistry, biochemistry [127], microbiology [128], biomedicine [129,130], and nanotechnology. It has the ability to concurrently detect thousands of ions such as proteins, peptides, glycans/polysaccharides, lipids, metabolites, and pharmaceuticals [131]. The advantages of MALDI technology include providing essential information about parameters such as molecular weight and polydispersity of the compounds used for the investigation of the synthesis pathways, studying degradation mechanisms, measurement of the additives and impurities, product formulations, and evaluation of the variations in chemical and biological compounds [123,128]. Additionally, the introduction of multimodal imaging into MALDI-MS, as one of the most interesting and promising techniques for the spatial characterization of molecules, facilitates data analysis and provides more informative spectral images [132].

2.7. Electrospray Ionization Mass Spectrometry

Electrospray ionization mass spectrometry (ESI-MS) is a technique used for structural or quantitative studies of metabolites originating from biological samples. ESI-MS is a sensitive, robust, and reliable tool, currently used in more than 95% of all liquid chromatography–mass spectrometry (LC-MS) applications. ESI-MS is capable of analysing small and large molecules of various polarities in complex biological samples. By introducing tandem mass spectrometry (MS/MS) into ESI, complicated sample purification and procedures for derivative formation can be simplified, ensuring rapid analysis and high sample throughput [121,133,134].
Electrospray ionization (ESI) is a soft ionization technique, which means that very little residual energy is retained by the analyte, with the absence of sample fragmentation during ionization by multiple charging [135]. ESI uses electrical energy in order to assist the movement of ions from the solution into the gaseous phase before they are subjected to MS analysis. The intact molecular ions are produced in an ionization chamber, and their transfer from the solution to the gas phase includes the dispersal of charge droplets in a form of a fine spray, solvent evaporation, and ion ejection from the highly charged droplets. Ions are then transffered to the mass analyzer via several ion optics whose role is to focus the ion stream in order to maintain a stable trajectory of the ions. The emitted ions are accelerated to the mass analyzer for separation of the ions based on their m/z values [121,135]. There are many mass analyzers, e.g., magnetic/electric sector mass analyzer, linear quadrupole ion trap, three-dimensional quadrupole ion trap, orbitrap, time-of-flight mass analyzer, and ion cyclotron resonance mass analyzer [136]. They all use static or dynamic magnetic/electric fields, and operate according to the Lorentz force law and Newton’s second law of motion. After they pass through the mass analyzer, the ions arrive at different parts of detector, based on their m/z ratios. After contact with the detector, signals are generated and recorded by a computer. Unlike other mass spectrometers, the ions are detected by measuring the current produced by ions cyclotroning in the presence of a magnetic field [135]. The ESI-MS spectrum presents the relative abundance of ion signals against the m/z ratios. The highest signal is taken as 100% abundance and all the other signals are expressed as a percentage of this. Furthermore, ESI-MS can be applied for quantitative sample analysis, keeping in mind that the selected internal standard should have a similar structure to the investigated analyte [121,133,134]. Additionally, the introduction of mass spectrometry imaging (MSI) enables the development of two-dimensional (2D) image data in order to visualize the distribution information of atoms and molecules on a sample surface [137]. The use of ESI-MS opened up many new application areas for MS and LC–MS analysis. The most important application area is perhaps the analysis of peptides and proteins. Other application areas include drug development in the pharmaceutical industry, food and environmental analysis, and in clinical studies for therapeutic drug monitoring, diagnostic purposes, systematic toxicological analysis, etc. [138].

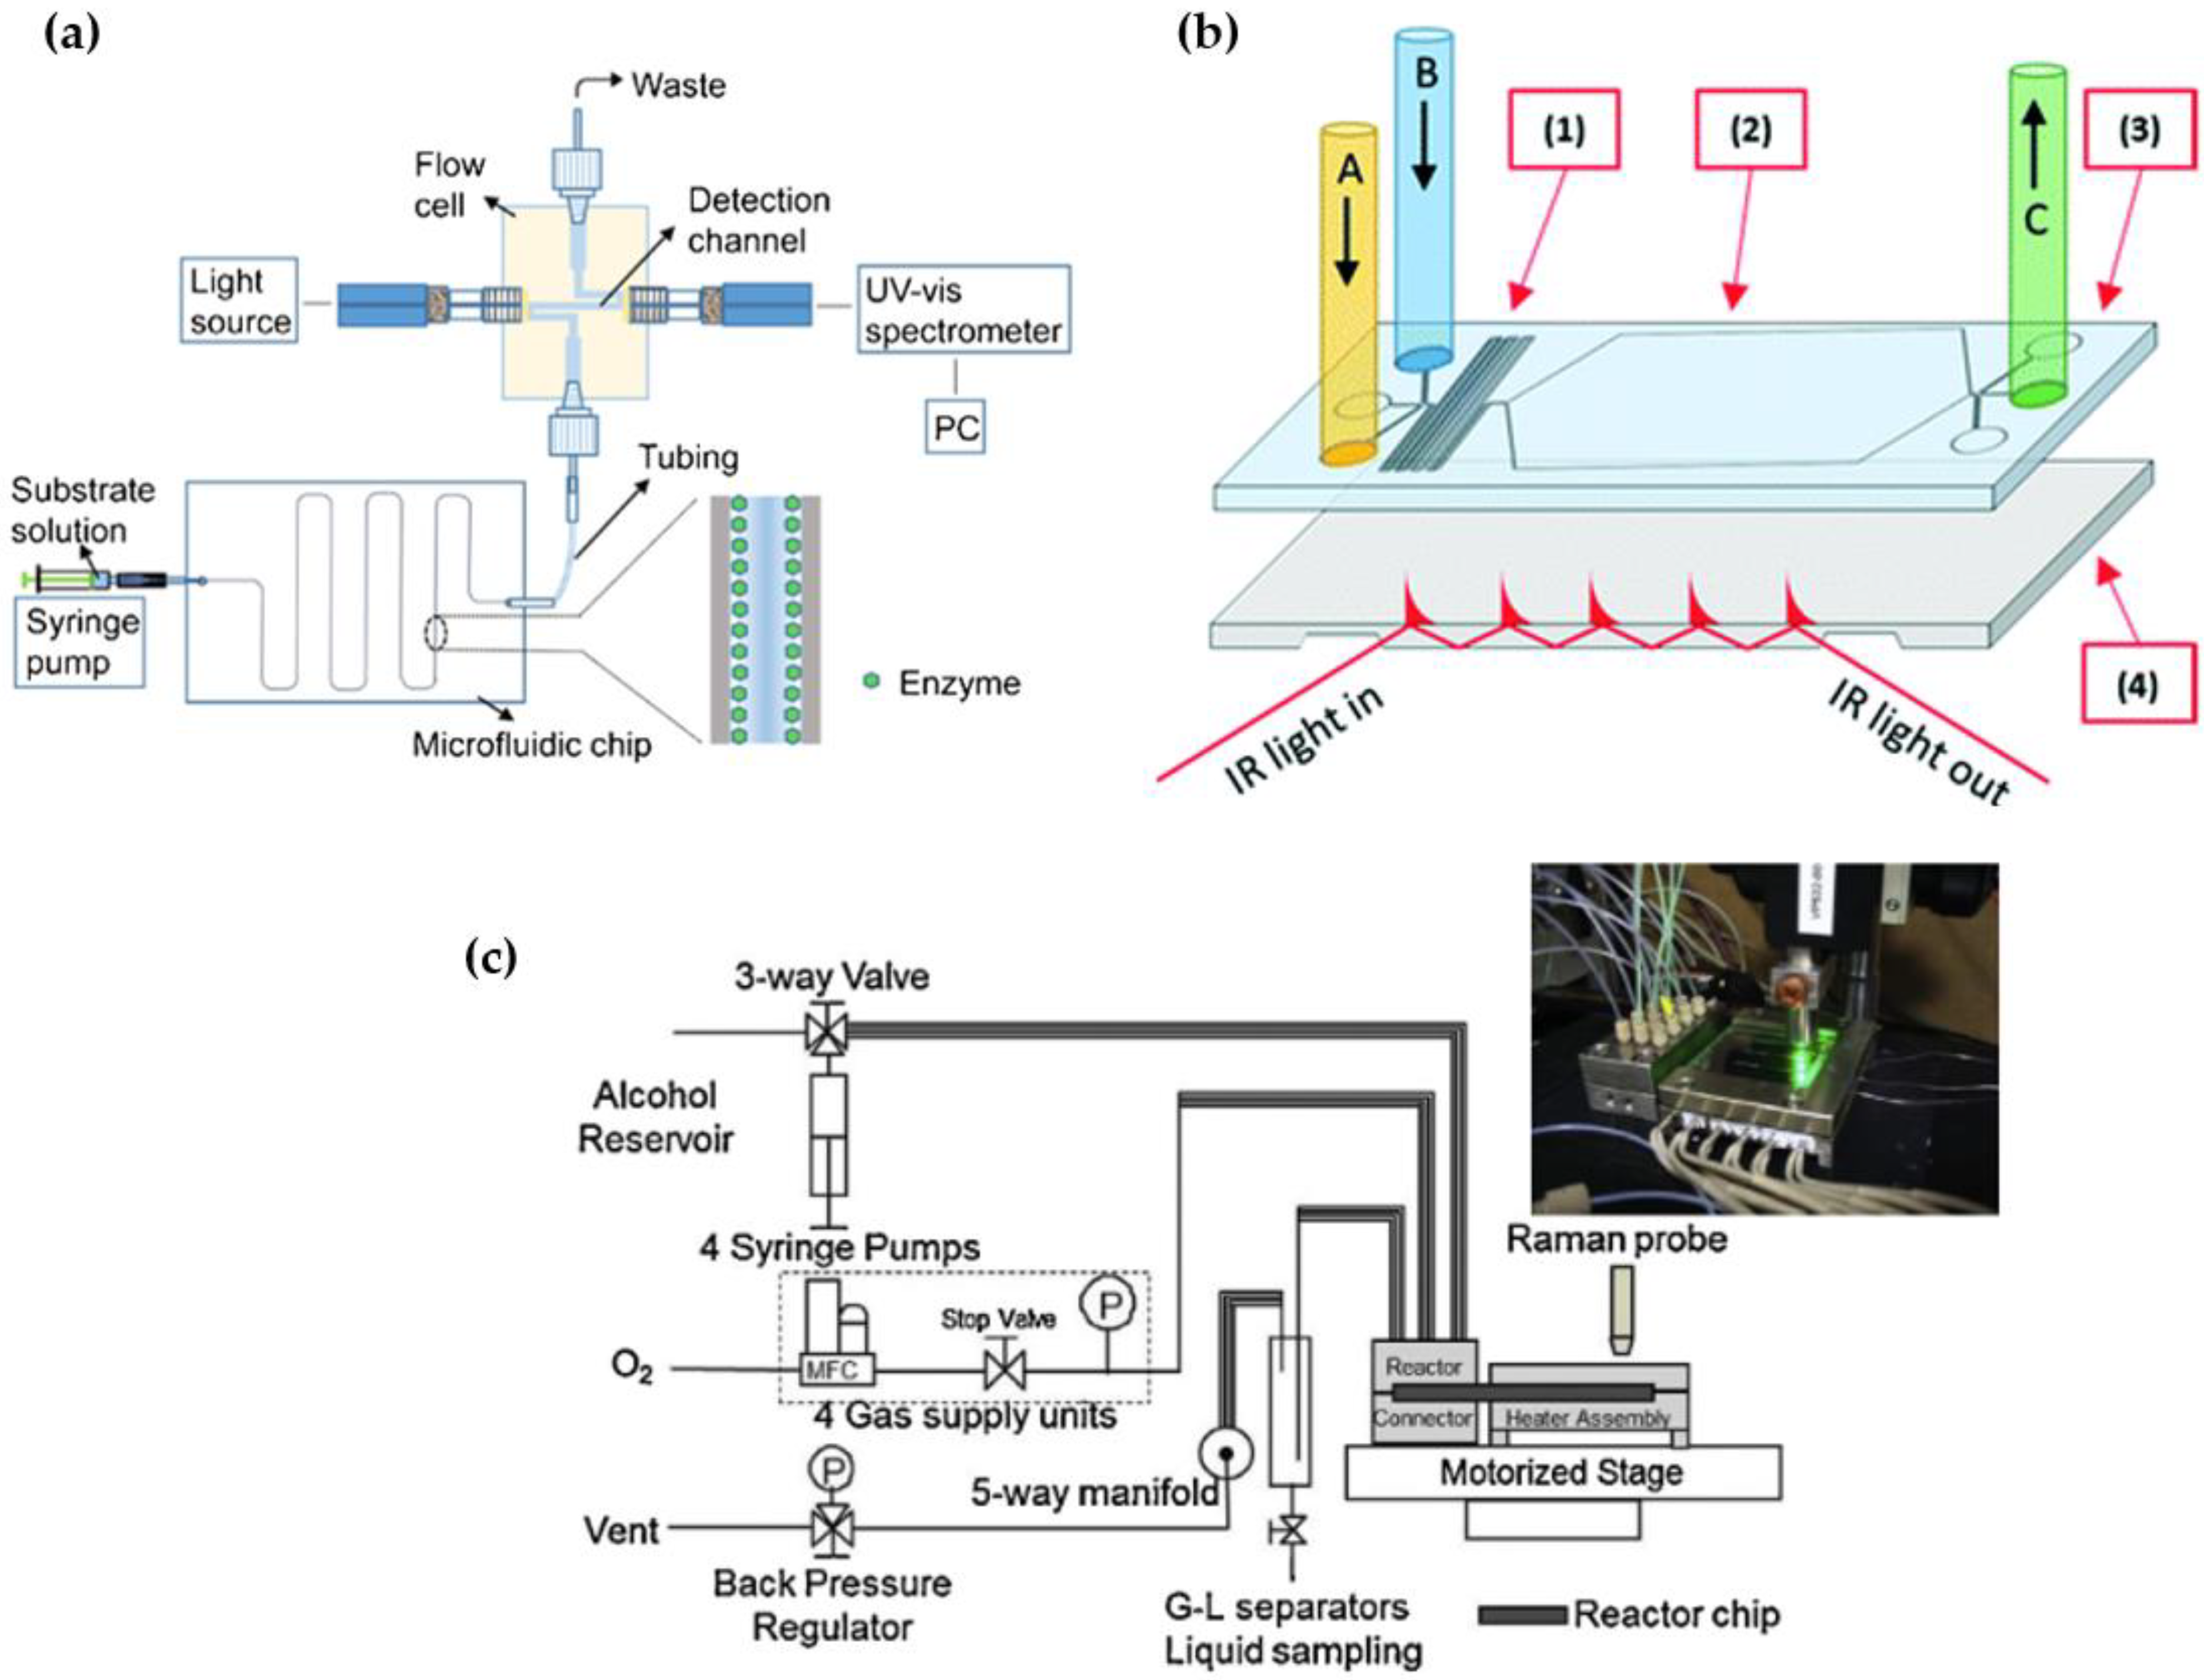
3. Microfluidic Devices Coupled with Spectroscopic Techniques

As mentioned before, microfluidic devices have significant benefits in terms of sample process integration, reduced sample and reagent volumes, and increased analysis rate, whereas spectroscopic methods have high information content, are sensitive, and can be used in quantitative analyses. Therefore, the coupling of microfluidic devices and spectroscopy methods is becoming more common. In recent years, an increasing number of studies have been published highlighting the evident importance of combining spectroscopy methods and continuously operated microreactor systems. There are also several review papers available in the literature that describes the advantages of on-line measurements in microfluidic systems (Figure 8). For example, Yue et al. [69] studied examples of fluorescence, ultraviolet–visible, infrared, Raman, X-ray, and nuclear magnetic resonance spectroscopy for on-line reaction monitoring and catalyst characterization. Li et al. [139] discussed difficulties in the miniaturization of NMR, as well as the dependence and sensitivity of infrared, Raman, and UV-Vis spectrometry, and emphasized the importance of the development of on-line analytical methods for monitoring photocatalytic reactions in continuously operated microfluidic systems. Furthermore, Rizkin et al. [140] analysed the advantages and current challenges of spectroscopic methods for monitoring heterogeneous catalysis processes. An overview of some efficient examples of coupling microfluidic devices and spectroscopic methods for monitoring reactions in microreactors can be found in Table 2.
Table 2. Examples of usage of spectroscopic methods for monitoring processes in microfluidic devices.
MethodMicrofluidic DeviceProcessReference
UV-VisGlass microfluidic chip with three sections, namely reaction zone, gas–liquid separator zone, and collocation and UV-Vis detection chamberGold nanoparticles (AuNP) synthesized using atmospheric-pressure helium plasma as the reducing agent followed by on-site mercury ion detection[141]
3D printed poly(lactic acid)/poly(methyl methacrylate) hybrid microfluidic deviceSilver nanoparticles were synthesized using different concentrations of sodium borohydride while gold nanoparticles were synthesized varying the concentration of trisodium citrate[142]
Polydimethylsiloxane (PDMS) microfluidic dielectrophoretic droplet sorterHigh-throughput label-free chemical identification and enzyme screening. The platform is used to measure ergothionase enzyme activity from monoclonal microcolonies isolated in droplets[143]
Polydimethylsiloxane microfluidic channel coupled with UV-Vis fibre-optic spectrometer and new synthesized colorimetric probeQuantification of F-ions in flow streams[144]
Photonic lab-on-a-chip platform fabricated from polydimethylsiloxaneDetection and quantification of U(IV) concentrations in flow streams[145]
Paper microfluidic device. The device had a total of eight circular reaction zones, 10 mm diameter, printed with 0.7 mm line width in green wax, and six coloured squares as internal standard. This device would allow the measurement of eight separate standard concentrations of the drug on the same paperDetection of decongestant phenylephrine hydrochloride (PHP) in solution[146]
Catalytic microreactor cellIn situ characterization of the activity of the silica-supported platinum (Pt) catalyst toward the dehydrogenation of 1-methyl-1,4-cyclohexadiene[147]
Hollow-core photonic crystal fibre (HC-PCF) microreactorAnalysis of the relationship between bimetallic nanoparticles and their activity on the hydrogenation of azobenzene[148]
Spiral-shaped tubular microreactors inserted inside a channel carved in a flat aluminium plate and wound in a spiral geometryKinetic parameters test of photochromic system AB involving 1,3,3-trimethylindolino-6′-nitrobenzopyrylospiran[149]
NIRMicropillar array constructed on the surface of a poly(ethylene-vinyl acetate) copolymerAscorbic acid detection using this digital microfluidic platform[150]
Microfluidic reactor consisting of: (1) a syringe pump, (2) a tubular microfluidic reactor constructed with polyetheretherketone (PEEK) or stainless steel (SS), and (3) a sample collectorGdF3:Eu theranostic scintillating nanoparticles synthesis[151]
Rectangular glass micro-capillaries in borosilicate glassDistinguish water, ethanol, isopropanol, and ethylene glycol in flow regime[152]
Tubular microreactorQuantification of the diffusion coefficient of aqueous solutions of sodium pentaborate[153]
Microfluidic chip prepared by sandwiching a Y-shaped cut-out silicone plate between two glass platesSimultaneous measurement of the concentrations of acid (HCl and H2SO4), base (NaOH), and produced salt (NaCl and Na2SO4) during neutralization in a microfluidic channel[154]
MicroNIRTubular microreactorIn-line monitoring of the dehydration reaction of D-Fructose into -hydroxymethylfurfural[155]
FTIRPlug-flow microreactorNO oxidation reaction at high temperatures (T > 423 K) catalysed by three zeolite frameworks (high-silica chabazites, MFI, and zeolite beta)[156]
Microreactor setup consisting of coiled 1/16-inch stainless steel capillariesEstimation and modelling of kinetics of dataimine synthesis of benzaldehyde with benzylamine and deprotonation reaction with n-butyllithium[157]
Plate microreactor directly connected to a capillary microreactorExothermic deprotonation reaction of a CH-acidic compound in tetrahydrofuran THF[158]
Punched Y-shape microchannel of 3 cm by 5 mm in 100 μm thick LAMINAR® E9012 dry film photopolymerImaging of the heat and molar concentration fields of all the species included in exothermal chemical reaction (NaOH + HCl → NaCl + H2O) in a microfluidic reactor[159]
IRMicrofluidic device composed of sapphire substrates, thin polyethylene terephthalate (PET) film, a metal chassis, and a heaterFree radical polymerization of styrene in the presence of 2,2′—azobis (isobutyronitrile) (AIBN) as the initiator[160]
Simultaneous
application of UV-Vis and micro-Raman spectroscopies
Microfluidic chip fabricated from three fused silica plates that are thermally fused. The two outer plates form the chip channel depthIn-situ detection and quantification of both the Nd3+ (UV-Vis active) and HNO3 (Raman active) concentrations in the same sample[161]
Photonic lab-on-a-chip platformActinide concentration monitoring along the plutonium uranium refining extraction [162]
Micro-Raman technologyMicrofluidic device with microchannel width of 300 μmConcentration measurements in organic and aqueous segments in microfluidic channel. The two-phase system was comprised of HNO3 as the aqueous phase and 30% (v/v) tributyl phosphate in n-dodecane as the organic phase, which simulated the plutonium uranium reduction extraction (PUREX) process[163]
Microfluidic device with microchannel with following dimensions: width of 300 μm and depth of 250 μmQuantification of nitric acid (HNO3) in solution[164,165]
Raman spectroscopyThe ceramic fixed-bed flow microreactor reactorMixed model molybdate catalysts that contain CoMoO4, Bi2Mo3O12, and Fe2Mo3O12 were investigated in the ammoxidation reaction of propene to acrylonitrile[166]
Optofluidic hollow-core fibre microreactorMonitoring of reactions involving photo-induced electron transfer processes[167]
Silicon-based microfluidic semi-flow deviceInvestigation of bulk-to-bulk (toluene–, diethyl ether–, and xylenes–water) interactions for liquid–liquid immiscible systems[168]
Surface-enhanced Raman scatteringPaper-based (Whatman qualitative
filter paper) microfluidic device
Detection and quantification of the thiram residue[169]
Glass plug-in optofluidic platformGold-catalysed reduction of para-nitrothiophenol by sodium borohydride[170]
Polydimethylsiloxane microfluidic devices fabricated using photo- and soft-lithography techniques. Chip included area for the nanoparticle synthesis and chamber for the Raman spectroscopyA microfluidic device was used to encapsulate single prostate cancer cells and wheat germ agglutinin (WGA)-functionalized SERS nanoprobes in water-in-oil droplets that were subsequently locked into a storage droplet array for spectroscopic investigation[171]
Three-dimensional microfluidic chip. Microfluidic device was based on the integration of a nanoporous polycarbonate track-etched (PCTE) membrane that connects microchannels on two different levels with each otherSeparation and concentration of target molecules present in a complex food sample simultaneously, which shows excellent potential in the rapid detection of a food contaminant[172]
Polydimethylsiloxane spiral shape microfluidic deviceIn-situ patterning of silver nanoparticles on a silicon substrate[173]
2D periodic metal (Cu-Ag) nanostructures inside 3D glass microfluidic channels using all-femtosecond-laser-processingEfficient detection of Cd at levels as low as 10 ppb[68]

3.1. UV-Vis Spectroscopy Monitoring of (Bio)Catalytic Processes in Continuously Operated Microreactor Systems

The screening and optimization of (bio)catalytic reactions in batch systems is usually time-consuming and expensive. Therefore, continuously operated microfluidic systems with integrated in-situ detectors can provide an efficient alternative. Catalytic reactions are effectively characterized when the catalysts in the reactors are continuously monitored in real time. Therefore, in-situ spectroscopy provides the most accurate method for analysing the reaction mechanism and determining the structure–activity link [147]. For example, Navin et al. [176] investigated the kinetics of the 5-(hydroxy-methyl)furfural (HMF) oxidation into 2,5-furandicarboxylic acid (FDCA) catalysed by a nanostructured gold catalyst immobilized on the microfluidic chip walls. The process was monitored using UV-Vis spectroscopy. The absorption of the polymeric microfluidic chip masked the absorption of the reaction process, so it was not possible to analyse the reaction in-situ with a UV-Vis probe. Consequently, UV-Vis spectra were recorded for samples gathered by dividing the microfluidic chip into different zones, which allowed the detection of the concentration changes of the substrate and product over time. Furthermore, Suarnaba et al. [147] developed UV-Vis microspectroscopic systems for in-situ monitoring of a silica-supported platinum catalyst for the dehydrogenation of 1-methyl-1,4-cyclohexadiene to toluene. The authors showed that based on the gathered UV-Vis spectra, it is possible to confirm the catalytic properties of platinum and monitor the toluene formation at temperatures above 100 °C. Lauterbach and Abetz [177] applied in-line UV-Vis spectroscopy with a time resolution of 10 s to monitor the continuous flow polymerization of N,N-dimethylacrylamide (DMA), n-butyl acrylate (nBA), and styrene, enabling productive reaction assessment and accurate customization of polymer products. In addition to chemical catalytic processes, microfluidic devices with on-line measurements are also used to monitor photocatalytic processes. Wang et al. [178] constructed and tested a UV-Vis spectrophotometer on a microreactor with a titanium dioxide photocatalytic film for the on-line detection of photocatalytic degradation of methylene blue and methyl orange, and showed that these systems can efficiently be used for analysing reaction kinetics, monitoring the process in real time, and detecting transient processes of photochemical reactions.
As described by Yue et al. [122], most of the integrated systems are used for homogenous processes, and there are still numerous challenges in the development of on-line measurements in multiphase systems. In recent years, research has been focused on the integration of micro-fluidic technology and UV-Vis spectroscopy to monitor the synthesis of nanoparticles in multiphase systems [123]. For example, Yue et al. [122] carried out gold nanoparticle (AuNPs) synthesis in a segmented flow. Two streams, the first containing the gold precursor (chloroauric acid and polyvinylpyrrolidone) and the second containing the reducing agent (ascorbic acid), were fed into a capillary microreactor in which decane was used as the carrier phase. A cross-type flow-through cell, connected in series with the microreactor, was designed to handle wavelengths from 488 to 635 nm. The results obtained showed that UV-Vis spectra with high temporal resolution (2 ms) can be used to calculate liquid-phase concentration and to analyse segmented flow features. Similarly, Damilos et al. [123] performed AuNP synthesis using chloroauric acid, sodium citrate, and citric acid at 95 °C and 2.3 bar pressure in a two-phase system based on heptane. Continuous UV-Vis spectra were gathered on-line in the range of 200–800 nm. The results suggested that synthesis integrated with on-line monitoring is a new approach for live process quality control. Furthermore, Cai et al. [125] developed a microfluidic set up for the fast and reproducible synthesis of gold nanoparticles with in-line UV-Vis-NIR spectroscopy for process monitoring. Their results showed that by applying advanced analytical methods, it is possible to accurately examine and parametrize the changing geometries of different gold nanoparticle configurations.

3.2. IR Spectroscopy Monitoring of (Bio)Catalytic Processes in Continuously Operated Microreactor Systems

As previously described in the literature [126,127], the major problem with esterification reactions in general is their reversibility. This means that the composition of the mixture can change after the product stream exits the reactor. Therefore, a sensitive measurement technique is required to obtain a detailed understanding of the composition of the reaction mixture in the reactor. As described by Perro et al. [128], traditional IR apparatus may be integrated with microreactors to collect spatially distributed data on chemical reactions at the micro level as soon as a few initial challenges are addressed. Real-time attenuated total reflection (ATR) infrared (IR) spectroscopy coupled with partial least squares regression modelling was used for monitoring ethyl acetate production in a continuously operated millireactor (V = 24.7 mL) with aluminium trifluoromethanesulfonate as a co-catalyst [129,130]. The benefit of ATR spectroscopy over transmission spectroscopy is the shallow penetration of radiation into the material (only a few micrometres), which is advantageous for highly absorbing substances, including water or solids [131]. ATR-FTIR microfluidic cell use for analysis of the intrinsic kinetic parameters of reactions at the solid/liquid interface [132], for the in-situ characterization of processes driven by an external electrical field [133] and for in-situ and spatial reaction monitoring [134], has been described in the literature.
It is important to mention that there is significant effort focussed on the fabrication of modular microreactor systems used for on-line spectroscopy analysis [135]. As described by Lozeman et al. [19], ATR-IR measurement can be performed on a chip by changing the number of layers and polymer materials of the reaction cell and combining them with internal reflective elements. The aforementioned authors analysed the use of polydimethylsiloxane (PDMS) and cyclic olefin copolymer (COC) for the fabrication of two types of modular microfluidic chips that could be efficiently used to perform the Paal–Knorr reaction. The reaction order of the different reaction steps was determined by analysing the IR spectra gathered on-line, confirming the applicability of the fabricated microfluidic device for on-line measurements. Moreover, Tan et al. [136] designed and fabricated a silicon microreactor coupled with an FTIR system to monitor the adsorption and oxidation of carbon monoxide on a platinum/silica dioxide catalyst surface. They demonstrated that it is possible to simultaneously measure the concentration of surface and gas-phase molecules and monitor the whole catalytic bed. Similarly, Daniel et al. [137] analysed CO oxidation over Pt/Al2O3 and Pt/CeO2–Al2O3 catalysts in a microreactor with IR spectroscopy, and concluded that IR spectroscopy in microstructured reactors allows a very short beam path given the small channel sizes and minimises the influence of the gas phase on the IR spectrum.
As mentioned before, the infrared range covers wavelengths from 780 nm to 1 mm, which can be divided into near infrared (800 nm to 2500 nm), mid-infrared (2500 nm to 25 µm), and far infrared (25 µm to 500 µm). NIR spectra are sensitive to changes in hydrogen bonding and can, therefore, be efficiently used for the detection and quantification of any hydrogen bonding between water molecules [138,139]. Bearing this specific property of NIR spectroscopy in mind, Umea et al. [98] efficiently analysed the aqueous acid–base reactions in a microfluidic channel. Three characteristic wavelengths in the absorption band of water (1412, 1442, and 1520 nm for the HCl−NaOH reaction and 1410, 1450, and 1540 nm for the H2SO4−NaOH reaction) were selected to develop a multiple linear regression model (MLR) for connecting the changes in absorbance with changes in concentration. There are also examples available of using NIR and chemometrics for the description of the emulsification process in continuously operated microfluidic devices [31,140]. Data on using NIR for monitoring catalytic processes in microdevices are still limited. For example, Gojun et al. [141] used NIR spectroscopy for on-line monitoring of the glycerol concentration changes during biodiesel synthesis in a microreactor. Their work included the development of a glycerol concentration calibration model based on the data gathered during GC analysis. Due to the high non-linearity of the data, artificial neural network modelling was applied to connect the gathered NIR spectra and GC-measured glycerol concentration.

3.3. Raman Spectroscopy Monitoring of (Bio)Catalytic Processes in Continuously Operated Microreactor Systems

Raman spectroscopy is a well-established method for real-time chemical fingerprinting that uses monochromatic light, often in the visible part of the spectrum. Raman spectroscopy enables the direct on-line detection of analytes in situ when using glass or quartz [111,179,180]. Meanwhile, Raman spectroscopy is efficiently used to monitor and analyse various catalytic processes in microfluidic devices, for example (i) the assessment of catalysts in a gas/liquid/solid reaction taking place in a continuously operated micropacked-bed reactor, where fourteen catalysts containing different combinations of Au, Pd, and Pt supported on TiO2 were tested [175], (ii) for the in-situ analysis of pickering emulsions catalysis of acid-catalysed deacetalization of benzaldehyde dimethyl acetal to form benzaldehyde in a droplet microfluidic system [181], (iii) on-line monitoring of the synthesis of α-phenylethanol [182], (iv) for in-situ detection of trace target molecules interacting with surface-enhanced Raman scattering (SERS) substrate in microfluidic chips [183,184], and (v) monitoring local oxidation events in organic solvents at the level of an individual air bubble armoured with surface-active low-surface energy catalytic particles [185]. All mentioned studies agree that with advancements in UV Raman spectroscopy, the characterization of formerly challenging catalytic processes is becoming more and more applicable and conventional.

3.4. MALDI-TOF MS for (Bio)Catalytic Processes in Continuously Operated Microreactor Systems

As previously described by Buchberger et al. [127], MALDI-TOF MS has the ability to concurrently detect thousands of ions such as those in proteins, peptides, glycans/polysaccharides, lipids, metabolites, and pharmaceuticals. There are numerous examples available in the literature coupling microreactor technology and MALDI-TOF MS for protein identification [186,187,188,189,190,191,192]. Protein digestion is required for effective protein identification, which is critical for the progress of proteome investigations as well as the production of bioactive peptides. Traditionally, protein proteolytical digestion is carried out in solution for several hours (12–24 h) with low enzyme concentrations to avoid the autodigestion of trypsin, which could result in excessive amounts of undesired tryptic fragments and complicate the unambiguous assignment of the studied protein. To speed up the procedure while preventing autodigestion, trypsin immobilization on different carriers has been proposed. Microreactor technology has several key advantages, including drastically reduced reaction time due to the large surface-to-volume ratio and the very intense mass transport typical of micrometric channels. Different immobilization methods have been used over the years to ensure maximum trypsin efficiency, for example (i) monolith trypsin immobilization [187,193,194,195], (ii) DNA-directed trypsin immobilization [188], (iii) packed bed microreactor with immobilized trypsin particles [196], (iv) the application of a nanozeolite-derived matrix [197], and (v) application of trypsin-immobilized superparamagnetic nanoparticles [198]. As a result, small IMERs or chips have been used to efficiently produce the amount of peptides required for MS identification, and different authors state [187,196,197,199] that the digestion products were characterized using matrix-assisted laser desorption/ionization time-of-flight mass spectrometry with sequence coverage range. There is also an example available of the coupling of a microfluidic device to a MALDI-TOF mass spectrometer by integrating an on-chip microreactor unit into a MALDI-TOF standard sample plate [200]. The effectiveness of the described system was illustrated for a variety of systems ranging from simple synthetic chemistry to polymer analysis and enzymatic digestion of peptides and oligonucleotides. Furthermore, Gorbunov et al. [201] developed and evaluated a prototype 96-well on-target UV/TiO2-photocatalytic microreactor setup that integrates drug metabolism simulation and sample preparation directly on a MALDI target.

3.5. ESI-MS for (Bio)Catalytic Processes in Continuously Operated Microreactor Systems

ESI-MS is widely utilized for the fast detection and identification of polar chemical molecules in a wide range of sample matrices. With regard to MALDI-TOF MS, most of the examples regarding the combination of microreactors and ESI-MS currently available in the literature are describing protein detection after protein digestion [202,203,204,205,206]. There are also several examples of using the ESI-MS method for monitoring the polymerization reaction [207,208], where the process efficiency was evaluated based on end group product pattern. Furthermore, Guo et al. [209] presented an application of ESI-MS for monitoring 5-hydroxymethylfurfural synthesis from glucose in a two-phase slug flow microreactor.

4. Conclusions

The concept and use of microfluidic spectroscopic detection devices are briefly presented through selected examples. The microfluidic spectroscopic detection system follows the latest analytical technology development trends and meets today’s detection requirements. The advantages of microfluidic devices for analytical purposes are rapid detection, ease of use, cost-effectiveness, and high precision in detecting low concentrations of hazardous compounds.

Author Contributions

Conceptualization, A.Š. and A.J.T.; methodology, T.J.; software, M.B.; investigation, T.S.C.; writing—original draft preparation, D.V. and T.J.; writing—review and editing, J.G.K. and B.Z. All authors have read and agreed to the published version of the manuscript.

Funding

This research received no external funding.

Data Availability Statement

Not applicable.

Conflicts of Interest

The authors declare no conflict of interest.

References

  1. Rogers, L.; Jensen, K.F. Continuous Manufacturing—The Green Chemistry Promise? Green Chem. 2019, 21, 3481–3498. [Google Scholar] [CrossRef] [Green Version]
  2. Porta, R.; Benaglia, M.; Puglisi, A. Flow Chemistry: Recent Developments in the Synthesis of Pharmaceutical Products. Org. Process Res. Dev. 2016, 20, 2–25. [Google Scholar] [CrossRef] [Green Version]
  3. Hartman, R.L. Flow Chemistry Remains an Opportunity for Chemists and Chemical Engineers. Curr. Opin. Chem. Eng. 2020, 29, 42–50. [Google Scholar] [CrossRef]
  4. Heretsch, P. Modern Flow Chemistry-Prospect and Advantage. Beilstein J. Org. Chem 2023, 19, 33–35. [Google Scholar] [CrossRef]
  5. Van Herck, J.; Junkers, T. Rapid Kinetic Screening via Transient Timesweep Experiments in Continuous Flow Reactors. Chem. Methods 2022, 2, e202100090. [Google Scholar] [CrossRef]
  6. Mohamed, M.G.A.; Kheiri, S.; Islam, S.; Kumar, H.; Yang, A.; Kim, K. An Integrated Microfluidic Flow-Focusing Platform for on-Chip Fabrication and Filtration of Cell-Laden Microgels. Lab Chip 2019, 19, 1621–1632. [Google Scholar] [CrossRef]
  7. Bogdan, A.R.; Dombrowski, A.W. Emerging Trends in Flow Chemistry and Applications to the Pharmaceutical Industry. J. Med. Chem. 2019, 62, 6422–6468. [Google Scholar] [CrossRef]
  8. Britton, J.; Majumdar, S.; Weiss, G.A. Continuous Flow Biocatalysis. Chem. Soc. Rev. 2018, 47, 5891–5918. [Google Scholar] [CrossRef]
  9. Holtze, C.; Boehling, R. Batch or Flow Chemistry?—A Current Industrial Opinion on Process Selection. Curr. Opin. Chem. Eng. 2022, 36, 100798. [Google Scholar] [CrossRef]
  10. Wan, L.; Kong, G.; Liu, M.; Jiang, M.; Cheng, D.; Chen, F. Flow Chemistry in the Multi-Step Synthesis of Natural Products. Green Synth. Catal. 2022, 3, 243–258. [Google Scholar] [CrossRef]
  11. Bojang, A.A.; Wu, H.S. Design, Fundamental Principles of Fabrication and Applications of Microreactors. Processes 2020, 8, 891. [Google Scholar] [CrossRef]
  12. Suryawanshi, P.L.; Gumfekar, S.P.; Bhanvase, B.A.; Sonawane, S.H.; Pimplapure, M.S. A Review on Microreactors: Reactor Fabrication, Design, and Cutting-Edge Applications. Chem. Eng. Sci. 2018, 189, 431–448. [Google Scholar] [CrossRef]
  13. Rogolino, A.; Savio, G. Trends in Additively Manufactured Microfluidics, Microreactors and Catalytic Materials. Mater. Adv. 2021, 2, 845–855. [Google Scholar] [CrossRef]
  14. Abdulla Yusuf, H.; Hossain, S.M.Z.; Aloraibi, S.; Alzaabi, N.J.; Alfayhani, M.A.; Almedfaie, H.J. Fabrication of Novel Microreactors In-House and Their Performance Analysis via Continuous Production of Biodiesel. Chem. Eng. Process. Process Intensif. 2022, 172, 108792. [Google Scholar] [CrossRef]
  15. Vrsaljko, D.; Ćevid, I.; Car, F.; Rahelić, T. Production of Microreactor Systems by Additive Manufacturing Technology. Eng. Power Bull. Croat. Acad. Eng. 2019, 14, 29–34. [Google Scholar]
  16. Domínguez, M.I.; Centeno, M.A.; Martínez, M.; Bobadilla, L.F.; Laguna, Ó.H.; Odriozola, J.A. Current Scenario and Prospects in Manufacture Strategies for Glass, Quartz, Polymers and Metallic Microreactors: A Comprehensive Review. Chem. Eng. Res. Des. 2021, 1, 13–35. [Google Scholar] [CrossRef]
  17. Lv, H.; Yang, Z.; Zhang, J.; Qian, G.; Duan, X.; Shu, Z.; Zhou, X. Liquid Flow and Mass Transfer Behaviors in a Butterfly-Shaped Microreactor. Micromachines 2021, 12, 883. [Google Scholar] [CrossRef]
  18. Dong, Z.; Wen, Z.; Zhao, F.; Kuhn, S.; Noël, T. Scale-up of Micro- and Milli-Reactors: An Overview of Strategies, Design Principles and Applications. Chem. Eng. Sci. X 2021, 10, 100097. [Google Scholar] [CrossRef]
  19. Lozeman, J.J.A.; Elsbecker, T.; Bohnenn, S.; De Boer, H.L.; Krakers, M.; Mul, G.; Van Den Berg, A.; Odijk, M. Modular Microreactor with Integrated Reflection Element for Online Reaction Monitoring Using Infrared Spectroscopy. Lab Chip 2020, 20, 4166–4174. [Google Scholar] [CrossRef]
  20. Culbertson, C.T.; Mickleburgh, T.G.; Stewart-James, S.A.; Sellens, K.A.; Pressnall, M. Micro Total Analysis Systems: Fundamental Advances and Biological Applications. Anal. Chem. 2014, 86, 95. [Google Scholar] [CrossRef] [Green Version]
  21. Sridhar, A.; Kapoor, A.; Kumar, P.S.; Ponnuchamy, M.; Sivasamy, B.; Vo, D.V.N. Lab-on-a-Chip Technologies for Food Safety, Processing, and Packaging Applications: A Review. Environ. Chem. Lett. 2021, 20, 901–927. [Google Scholar] [CrossRef]
  22. Narayanamurthy, V.; Jeroish, Z.E.; Bhuvaneshwari, K.S.; Bayat, P.; Premkumar, R.; Samsuri, F.; Yusoff, M.M. Advances in Passively Driven Microfluidics and Lab-on-Chip Devices: A Comprehensive Literature Review and Patent Analysis. RSC Adv. 2020, 10, 11652–11680. [Google Scholar] [CrossRef]
  23. Patabadige, D.E.W.; Jia, S.; Sibbitts, J.; Sadeghi, J.; Sellens, K.; Culbertson, C.T. Micro Total Analysis Systems: Fundamental Advances and Applications. Anal. Chem. 2016, 88, 320–338. [Google Scholar] [CrossRef] [PubMed]
  24. Lee, N.Y. Recent Progress in Lab-on-a-Chip Technology and Its Potential Application to Clinical Diagnoses. Int. Neurourol. J. 2013, 17, 2. [Google Scholar] [CrossRef] [PubMed] [Green Version]
  25. Ghasemi, A.; Amiri, H.; Zare, H.; Masroor, M.; Hasanzadeh, A.; Beyzavi, A.; Aref, A.R.; Karimi, M.; Hamblin, M.R. Carbon Nanotubes in Microfluidic Lab-on-a-Chip Technology: Current Trends and Future Perspectives. Microfluid. Nanofluidics 2017, 21. [Google Scholar] [CrossRef] [PubMed]
  26. Gorjikhah, F.; Davaran, S.; Salehi, R.; Bakhtiari, M.; Hasanzadeh, A.; Panahi, Y.; Emamverdy, M.; Akbarzadeh, A. Improving “Lab-on-a-Chip” Techniques Using Biomedical Nanotechnology: A Review. Artif. Cells Nanomed. Biotechnol. 2016, 44, 1609–1614. [Google Scholar] [CrossRef] [Green Version]
  27. Uson, L.; Arruebo, M.; Sebastian, V.; Santamaria, J. Single Phase Microreactor for the Continuous, High-Temperature Synthesis of <4 nm Superparamagnetic Iron Oxide Nanoparticles. Chem. Eng. J. 2018, 340, 66–72. [Google Scholar] [CrossRef] [Green Version]
  28. Dobhal, A.; Kulkarni, A.; Dandekar, P.; Jain, R. A Microreactor-Based Continuous Process for Controlled Synthesis of Poly-Methyl-Methacrylate-Methacrylic Acid (PMMA) Nanoparticles. J. Mater. Chem. B 2017, 5, 3404–3417. [Google Scholar] [CrossRef]
  29. Dasankoppa, F.S.; Sholapur, H.N.; Byahatti, A.; Abbas, Z.; Subrata, K. Application of Response Surface Optimization Methodology in Designing Ordispersible Tablets of Antdiabetic Drug. J. Young Pharm. 2020, 12, 173–177. [Google Scholar] [CrossRef]
  30. Imarah, A.O.; Silva, F.M.W.G.; Tuba, L.; Malta-Lakó, Á.; Szemes, J.; Sánta-Bell, E.; Poppe, L. A Convenient U-Shape Microreactor for Continuous Flow Biocatalysis with Enzyme-Coated Magnetic Nanoparticles-Lipase-Catalyzed Enantiomer Selective Acylation of 4-(Morpholin-4-Yl)Butan-2-Ol. Catalysts 2022, 12, 1065. [Google Scholar] [CrossRef]
  31. Bellou, M.G.; Gkantzou, E.; Skonta, A.; Moschovas, D.; Spyrou, K.; Avgeropoulos, A.; Gournis, D.; Stamatis, H. Development of 3D Printed Enzymatic Microreactors for Lipase-Catalyzed Reactions in Deep Eutectic Solvent-Based Media. Micromachines 2022, 13, 1954. [Google Scholar] [CrossRef] [PubMed]
  32. Nagy, C.; Szabo, R.; Gaspar, A. Microfluidic Immobilized Enzymatic Reactors for Proteomic Analyses—Recent Developments and Trends (2017–2021). Micromachines 2022, 13, 311. [Google Scholar] [CrossRef] [PubMed]
  33. Gong, A.; Zhu, C.T.; Xu, Y.; Wang, F.Q.; Tsabing, D.K.; Wu, F.A.; Wang, J. Moving and Unsinkable Graphene Sheets Immobilized Enzyme for Microfluidic Biocatalysis. Sci. Rep. 2017, 7, 4309. [Google Scholar] [CrossRef] [PubMed] [Green Version]
  34. Benković, M.; Valinger, D.; Jurina, T.; Gajdoš Kljusurić, J.; Jurinjak Tušek, A. Biocatalysis as a Green Approach for Synthesis of Iron Nanoparticles—Batch and Microflow Process Comparison. Catalysts 2023, 13, 112. [Google Scholar] [CrossRef]
  35. Rabiee, N.; Ahmadi, S.; Fatahi, Y.; Rabiee, M.; Bagherzadeh, M.; Dinarvand, R.; Bagheri, B.; Zarrintaj, P.; Saeb, M.R.; Webster, T.J. Nanotechnology-Assisted Microfluidic Systems: From Bench to Bedside. Nanomedicine 2021, 16, 237–258. [Google Scholar] [CrossRef]
  36. Khizar, S.; Ben Halima, H.; Ahmad, N.M.; Zine, N.; Errachid, A.; Elaissari, A. Magnetic Nanoparticles in Microfluidic and Sensing: From Transport to Detection. Electrophoresis 2020, 41, 1206–1224. [Google Scholar] [CrossRef]
  37. Khan, N.I.; Song, E. Lab-on-a-Chip Systems for Aptamer-Based Biosensing. Micromachines 2020, 11, 220. [Google Scholar] [CrossRef] [Green Version]
  38. Xiang, Y.; Hu, C.; Wu, G.; Xu, S.; Li, Y. Nanomaterial-Based Microfluidic Systems for Cancer Biomarker Detection: Recent Applications and Future Perspectives. TrAC Trends Anal. Chem. 2023, 158, 116835. [Google Scholar] [CrossRef]
  39. Medina-Sánchez, M.; Miserere, S.; Merkoçi, A. Nanomaterials and Lab-on-a-Chip Technologies. Lab Chip 2012, 12, 1932–1943. [Google Scholar] [CrossRef]
  40. Monošík, R.; Angnes, L. Utilisation of Micro- and Nanoscaled Materials in Microfluidic Analytical Devices. Microchem. J. 2015, 119, 159–168. [Google Scholar] [CrossRef]
  41. Ali, M.A.; Solanki, P.R.; Srivastava, S.; Singh, S.; Agrawal, V.V.; John, R.; Malhotra, B.D. Protein Functionalized Carbon Nanotubes-Based Smart Lab-on-a-Chip. ACS Appl. Mater. Interfaces 2015, 7, 5837–5846. [Google Scholar] [CrossRef] [PubMed]
  42. Zhou, J.; Huang, Y.; Chen, C.; Xiao, A.; Guo, T.; Guan, B.O. Improved Detection Sensitivity of γ-Aminobutyric Acid Based on Graphene Oxide Interface on an Optical Microfiber. Phys. Chem. Chem. Phys. 2018, 20, 14117–14123. [Google Scholar] [CrossRef] [PubMed]
  43. Wang, H.P.; Chen, P.; Dai, J.W.; Liu, D.; Li, J.Y.; Xu, Y.P.; Chu, X.L. Recent Advances of Chemometric Calibration Methods in Modern Spectroscopy: Algorithms, Strategy, and Related Issues. TrAC Trends Anal. Chem. 2022, 153, 116648. [Google Scholar] [CrossRef]
  44. Ríos-Reina, R.; Azcarate, S.M. How Chemometrics Revives the UV-Vis Spectroscopy Applications as an Analytical Sensor for Spectralprint (Nontargeted) Analysis. Chemosensors 2022, 11, 8. [Google Scholar] [CrossRef]
  45. Ríos-Reina, R.; Camiña, J.M.; Callejón, R.M.; Azcarate, S.M. Spectralprint Techniques for Wine and Vinegar Characterization, Authentication and Quality Control: Advances and Projections. TrAC Trends Anal. Chem. 2021, 134, 116121. [Google Scholar] [CrossRef]
  46. Hasbi, N.H.; Bade, A.; Chee, F.P. Pattern Recognition for Ultraviolet and Fourier Transform Data: A Walkthrough of Techniques and Direction. J. Phys. Conf. Ser. 2022, 2314, 012012. [Google Scholar] [CrossRef]
  47. Ballabio, D.; Consonni, V. Classification Tools in Chemistry. Part 1: Linear Models. PLS-DA. Anal. Methods 2013, 5, 3790–3798. [Google Scholar] [CrossRef]
  48. Indahl, U.G. The Geometry of PLS1 Explained Properly: 10 Key Notes on Mathematical Properties of and Some Alternative Algorithmic Approaches to PLS1 Modelling. J. Chemom. 2014, 28, 168–180. [Google Scholar] [CrossRef]
  49. Jurinjak Tušek, A.; Jurina, T.; Čulo, I.; Valinger, D.; Gajdoš Kljusurić, J.; Benković, M. Application of NIRs Coupled with PLS and ANN Modelling to Predict Average Droplet Size in Oil-in-Water Emulsions Prepared with Different Microfluidic Devices. Spectrochim. Acta Part A Mol. Biomol. Spectrosc. 2022, 270, 120860. [Google Scholar] [CrossRef]
  50. Santos, G.R.; Paulino, G.S.P.; Borges, G.P.I.; Santiago, A.F.; da Silvac, G.A. Avanços Analíticos baseados em Modelos de Calibração de Primeira ordem e Espectroscopia UV-VIS para Avaliação da Qualidade da Água: UMA Revisão—Parte 1. Quim. Nova 2022, 45, 314–323. [Google Scholar] [CrossRef]
  51. Lavine, B. A User-Friendly Guide to Multivariate Calibration and Classification, Tomas Naes, Tomas Isakson, Tom Fearn and Tony Davies, NIR Publications, Chichester, 2002, ISBN 0-9528666-2-5, £45.00. J. Chemom. 2003, 17, 571–572. [Google Scholar] [CrossRef]
  52. Becerra, E.; Danchana, K.; Cerdà, V. WinMLR, a Software Program for the Simultaneous Determination of Several Components in Mixtures Using Multilinear Regression Analysis. Talanta 2020, 213, 120830. [Google Scholar] [CrossRef] [PubMed]
  53. Mevik, B.H.; Wehrens, R. The Pls Package: Principal Component and Partial Least Squares Regression in R. J. Stat. Softw. 2007, 18, 1–23. [Google Scholar] [CrossRef] [Green Version]
  54. Mevik, B.H.; Segtnan, V.H.; Næs, T. Ensemble Methods and Partial Least Squares Regression. J. Chemom. 2004, 18, 498–507. [Google Scholar] [CrossRef]
  55. Balabin, R.M.; Safieva, R.Z.; Lomakina, E.I. Comparison of Linear and Nonlinear Calibration Models Based on near Infrared (NIR) Spectroscopy Data for Gasoline Properties Prediction. Chemom. Intell. Lab. Syst. 2007, 88, 183–188. [Google Scholar] [CrossRef]
  56. Balabin, R.M.; Safieva, R.Z.; Lomakina, E.I. Wavelet Neural Network (WNN) Approach for Calibration Model Building Based on Gasoline near Infrared (NIR) Spectra. Chemom. Intell. Lab. Syst. 2008, 93, 58–62. [Google Scholar] [CrossRef]
  57. Valinger, D.; Kušen, M.; Tušek, A.J.; Panić, M.; Jurina, T.; Benković, M.; Radojčić Redovniković, I.; Gajdoš Kljusurić, J. Development of Near Infrared Spectroscopy Models for Quantitative Prediction of the Content of Bioactive Compounds in Olive Leaves. Dev. Near Infrared Spectrosc. Model. Chem. Biochem. Eng. Q 2018, 32, 535–543. [Google Scholar] [CrossRef]
  58. Kundu, P.; Paul, V.; Kumar, V.; Mishra, I.M. Formulation Development, Modeling and Optimization of Emulsification Process Using Evolving RSM Coupled Hybrid ANN-GA Framework. Chem. Eng. Res. Des. 2015, 104, 773–790. [Google Scholar] [CrossRef]
  59. Verma, G.; Mishra, M. Development and Optimization of UV-VIS Spectroscopy—A Review. World J. Pharm. Res. 2018, 7. [Google Scholar] [CrossRef]
  60. Mäntele, W.; Deniz, E. UV–VIS Absorption Spectroscopy: Lambert-Beer Reloaded. Spectrochim. Acta Part A Mol. Biomol. Spectrosc. 2017, 173, 965–968. [Google Scholar] [CrossRef]
  61. Soo, M.H.; Samad, N.A.; Zaidel, A.; Jusoh, M.; Muhamad, Y.M.; Hashim, I.I. Extraction of Plant Based Protein from Moringa Oleifera Leaves Using Alkaline Extraction and Isoelectric Precipitation Method. Chem. Eng. Trans. 2021, 89, 253–258. [Google Scholar] [CrossRef]
  62. Cerdá-Bernad, D.; Baixinho, J.P.; Fernández, N.; Frutos, M.J. Evaluation of Microwave-Assisted Extraction as a Potential Green Technology for the Isolation of Bioactive Compounds from Saffron (Crocus Sativus L.) Floral By-Products. Foods 2022, 11, 2335. [Google Scholar] [CrossRef] [PubMed]
  63. Farag, M.A.; Sheashea, M.; Zhao, C.; Maamoun, A.A. UV Fingerprinting Approaches for Quality Control Analyses of Food and Functional Food Coupled to Chemometrics: A Comprehensive Analysis of Novel Trends and Applications. Foods 2022, 11, 2867. [Google Scholar] [CrossRef]
  64. Cerdà, V.; Phansi, P.; Ferreira, S. From Mono- to Multicomponent Methods in UV-VIS Spectrophotometric and Fluorimetric Quantitative Analysis—A Review. TrAC Trends Anal. Chem. 2022, 157, 116772. [Google Scholar] [CrossRef]
  65. Liauw, M.A.; Baylor, L.C.; O’Rourke, P.E. UV-Visible Spectroscopy for On-Line Analysis. In Process Analytical Technology: Spectroscopic Tools and Implementation Strategies for the Chememical and Pharmaceutical Industries, 2nd ed.; John Wiley & Sons: Hoboken, NJ, USA, 2010; pp. 81–106. [Google Scholar] [CrossRef]
  66. Claßen, J.; Aupert, F.; Reardon, K.F.; Solle, D.; Scheper, T. Spectroscopic Sensors for In-Line Bioprocess Monitoring in Research and Pharmaceutical Industrial Application. Anal. Bioanal. Chem. 2017, 409, 651–666. [Google Scholar] [CrossRef]
  67. Roberts, J.; Power, A.; Chapman, J.; Chandra, S.; Cozzolino, D. The Use of UV-Vis Spectroscopy in Bioprocess and Fermentation Monitoring. Fermentation 2018, 4, 18. [Google Scholar] [CrossRef] [Green Version]
  68. Bai, S.; Serien, D.; Hu, A.; Sugioka, K. 3D Microfluidic Surface-Enhanced Raman Spectroscopy (SERS) Chips Fabricated by All-Femtosecond-Laser-Processing for Real-Time Sensing of Toxic Substances. Adv. Funct. Mater. 2018, 28, 1706262. [Google Scholar] [CrossRef]
  69. Yue, J.; Schouten, J.C.; Alexander Nijhuis, T. Integration of Microreactors with Spectroscopic Detection for Online Reaction Monitoring and Catalyst Characterization. Ind. Eng. Chem. Res. 2012, 51, 14583–14609. [Google Scholar] [CrossRef]
  70. Jurinovich, S.; Domenici, V. Digital Tool for the Analysis of UV-Vis Spectra of Olive Oils and Educational Activities with High School and Undergraduate Students. J. Chem. Educ. 2022, 99, 787–798. [Google Scholar] [CrossRef]
  71. Hong, T.; Yin, J.Y.; Nie, S.P.; Xie, M.Y. Applications of Infrared Spectroscopy in Polysaccharide Structural Analysis: Progress, Challenge and Perspective. Food Chem. X 2021, 12, 100168. [Google Scholar] [CrossRef]
  72. Joshi, R.; Sathasivam, R.; Park, S.U.; Lee, H.; Kim, M.S.; Baek, I.; Cho, B.K. Application of Fourier Transform Infrared Spectroscopy and Multivariate Analysis Methods for the Non-Destructive Evaluation of Phenolics Compounds in Moringa Powder. Agriculture 2022, 12, 10. [Google Scholar] [CrossRef]
  73. Günzler, H.; Gremlich, H.-U. IR Spectroscopy: An Introduction; Wiley-VCH: Weinheim, Germany, 2002; p. 361. [Google Scholar]
  74. Türker-Kaya, S.; Huck, C.W. A Review of Mid-Infrared and Near-Infrared Imaging: Principles, Concepts and Applications in Plant Tissue Analysis. Molecules 2017, 22, 168. [Google Scholar] [CrossRef] [PubMed] [Green Version]
  75. Toyama, T.; Fujioka, J.; Watanabe, K.; Yoshida, A.; Sakuma, T.; Inaba, K.; Imai, T.; Nakajima, T.; Tsukiyama, K.; Hamada, N.; et al. Investigation of Bactericidal Effect of a Mid-Infrared Free Electron Laser on Escherichia Coli. Sci. Rep. 2022, 12, 18111. [Google Scholar] [CrossRef]
  76. Magnussen, E.A.; Zimmermann, B.; Blazhko, U.; Dzurendova, S.; Dupuy–Galet, B.; Byrtusova, D.; Muthreich, F.; Tafintseva, V.; Liland, K.H.; Tøndel, K.; et al. Deep Learning-Enabled Inference of 3D Molecular Absorption Distribution of Biological Cells from IR Spectra. Commun. Chem. 2022, 5, 175. [Google Scholar] [CrossRef] [PubMed]
  77. Stiegler, J.M.; Abate, Y.; Cvitkovic, A.; Romanyuk, Y.E.; Huber, A.J.; Leone, S.R.; Hillenbrand, R. Nanoscale Infrared Absorption Spectroscopy of Individual Nanoparticles Enabled by Scattering-Type near-Field Microscopy. ACS Nano 2011, 5, 6494–6499. [Google Scholar] [CrossRef]
  78. Khan, S.A.; Khan, S.B.; Khan, L.U.; Farooq, A.; Akhtar, K.; Asiri, A.M. Fourier Transform Infrared Spectroscopy: Fundamentals and Application in Functional Groups and Nanomaterials Characterization. In Handbook of Materials Characterization; Springer: Cham, Switzerland, 2018; pp. 317–344. [Google Scholar] [CrossRef]
  79. Palou, A.; Miró, A.; Blanco, M.; Larraz, R.; Gómez, J.F.; Martínez, T.; González, J.M.; Alcalà, M. Calibration Sets Selection Strategy for the Construction of Robust PLS Models for Prediction of Biodiesel/Diesel Blends Physico-Chemical Properties Using NIR Spectroscopy. Spectrochim. Acta Part A Mol. Biomol. Spectrosc. 2017, 180, 119–126. [Google Scholar] [CrossRef]
  80. de Carvalho Rocha, W.F.; Sheen, D.A. Determination of Physicochemical Properties of Petroleum Derivatives and Biodiesel Using GC/MS and Chemometric Methods with Uncertainty Estimation. Fuel 2019, 243, 413–422. [Google Scholar] [CrossRef]
  81. López-Fernández, J.; Moya, D.; Dolors Benaiges, M.; Valero, F.; Alcalà, M. Near Infrared Spectroscopy: A Useful Technique for Inline Monitoring of the Enzyme Catalyzed Biosynthesis of Third-Generation Biodiesel from Waste Cooking Oil. Fuel 2022, 319, 123794. [Google Scholar] [CrossRef]
  82. Reich, G. Near-Infrared Spectroscopy and Imaging: Basic Principles and Pharmaceutical Applications. Adv. Drug Deliv. Rev. 2005, 57, 1109–1143. [Google Scholar] [CrossRef]
  83. Menezes, J.C.; Ferreira, A.P.; Rodrigues, L.O.; Brás, L.P.; Alves, T.P. Chemometrics Role within the PAT Context: Examples from Primary Pharmaceutical Manufacturing. Compr. Chemom. 2009, 4, 313–355. [Google Scholar] [CrossRef]
  84. Ozaki, Y.; Huck, C.W.; Beć, K.B. Near-IR Spectroscopy and Its Applications. Mol. Laser Spectrosc. Adv. Appl. 2018, 11–38. [Google Scholar] [CrossRef]
  85. Siesler, A.H.W.; Ozaki, Y.; Kawata, S.; Heise, H.M. Near-Infrared Spectroscopy. Principles, Instruments, Applications. H. W. Siesler, Y. Ozaki, S. Kawata and H. M. Heise (Eds), Wiley-VCH, Weinheim, 2002, ISBN 3-527-30149-6, 348 Pp, £ 70.00. J. Chemom. 2002, 16, 636–638. [Google Scholar] [CrossRef]
  86. Blanco, M.; Romero, M.A. Near-Infrared Libraries in the Pharmaceutical Industry: A Solution for Identity Confirmation. Analyst 2001, 126, 2212–2217. [Google Scholar] [CrossRef] [PubMed]
  87. Beć, K.B.; Grabska, J.; Huck, C.W. Principles and Applications of Miniaturized Near-Infrared (NIR) Spectrometers. Chem. Eur. J. 2021, 27, 1514–1532. [Google Scholar] [CrossRef]
  88. Workman, J., Jr.; Weyer, L. Practical Guide and Spectral Atlas for Interpretive Near-Infrared Spectroscopy. In Practical Guide and Spectral Atlas for Interpretive Near-Infrared Spectroscscopy, 2nd ed.; CRC Press: Boca Raton, FL, USA, 2012; 326 p. [Google Scholar] [CrossRef]
  89. Jue, T.; Masuda, K. Application of near Infrared Spectroscopy in Biomedicine. In Application of Near Infrared Spectroscopy in Biomedicine; Springer Science & Business Media: Berlin/Heidelberg, Germany, 2013; pp. 1–151. [Google Scholar] [CrossRef]
  90. Czarnecki, M.A.; Morisawa, Y.; Futami, Y.; Ozaki, Y. Advances in Molecular Structure and Interaction Studies Using Near-Infrared Spectroscopy. Chem. Rev. 2015, 115, 9707–9744. [Google Scholar] [CrossRef] [PubMed]
  91. Pinzi, S.; Alonso, F.; García Olmo, J.; Dorado, M.P. Near Infrared Reflectance Spectroscopy and Multivariate Analysis to Monitor Reaction Products during Biodiesel Production. Fuel 2012, 92, 354–359. [Google Scholar] [CrossRef]
  92. Blanco, M.; Alcalá, M.; González, J.M.; Torras, E. A Process Analytical Technology Approach Based on near Infrared Spectroscopy: Tablet Hardness, Content Uniformity, and Dissolution Test Measurements of Intact Tablets. J. Pharm. Sci. 2006, 95, 2137–2144. [Google Scholar] [CrossRef]
  93. Kumaravelu, C.; Gopal, A. A Review on the Applications of Near-Infrared Spectrometer and Chemometrics for the Agro-Food Processing Industries. In Proceedings of the 2015 IEEE Technological Innovation in ICT for Agriculture and Rural Development (TIAR), Chennai, India, 10–12 July 2015; pp. 8–12. [Google Scholar] [CrossRef]
  94. Alcalà, M.; Blanco, M.; Menezes, J.C.; Felizardo, P.M.; Garrido, A.; Pérez, D.; Zamora, E.; Pasquini, C.; Romañach, R.J. Near-Infrared Spectroscopy in Laboratory and Process Analysis. In Encyclopedia of Analytical Chemistry: Applications, Theory and Instrumentation; John Wiley & Sons: Hoboken, NJ, USA, 2012. [Google Scholar] [CrossRef]
  95. Rantanen, J. Process Analytical Applications of Raman Spectroscopy. J. Pharm. Pharmacol. 2010, 59, 171–177. [Google Scholar] [CrossRef]
  96. Kong, K.; Kendall, C.; Stone, N.; Notingher, I. Raman Spectroscopy for Medical Diagnostics—From in-Vitro Biofluid Assays to in-Vivo Cancer Detection. Adv. Drug Deliv. Rev. 2015, 89, 121–134. [Google Scholar] [CrossRef] [Green Version]
  97. Yang, D.; Ying, Y. Applications of Raman Spectroscopy in Agricultural Products and Food Analysis: A Review. Appl. Spectrosc. Rev. 2011, 46, 539–560. [Google Scholar] [CrossRef]
  98. Poornima Parvathi, V.; Parimaladevi, R.; Vasant, S.; Umadevi, M. Graphene Boosted Silver Nanoparticles as Surface Enhanced Raman Spectroscopic Sensors and Photocatalysts for Removal of Standard and Industrial Dye Contaminants. Sens. Actuators B Chem. 2019, 281, 679–688. [Google Scholar] [CrossRef]
  99. Shipp, D.W.; Sinjab, F.; Notingher, I. Raman Spectroscopy: Techniques and Applications in the Life Sciences. Adv. Opt. Photonics 2017, 9, 315–428. [Google Scholar] [CrossRef] [Green Version]
  100. Orlando, A.; Franceschini, F.; Muscas, C.; Pidkova, S.; Bartoli, M.; Rovere, M.; Tagliaferro, A. A Comprehensive Review on Raman Spectroscopy Applications. Chemosensors 2021, 9, 262. [Google Scholar] [CrossRef]
  101. Ida, N. Electromagnetic Waves and Propagation. In Engineering Electromagnetics; Springer: Cham, Switzerland, 2015; pp. 597–663. [Google Scholar] [CrossRef]
  102. Vaškova, H., II. Raman And Infrared Spectroscopy. Int. J. Math. Model. Methods Appl. Sci. A 2011, 5, 1205–1212. [Google Scholar]
  103. Garcia-Rico, E.; Alvarez-Puebla, R.A.; Guerrini, L. Direct Surface-Enhanced Raman Scattering (SERS) Spectroscopy of Nucleic Acids: From Fundamental Studies to Real-Life Applications. Chem. Soc. Rev. 2018, 47, 4909–4923. [Google Scholar] [CrossRef]
  104. Abalde-Cela, S.; Aldeanueva-Potel, P.; Mateo-Mateo, C.; Rodríguez-Lorenzo, L.; Alvarez-Puebla, R.A.; Liz-Marzán, L.M. Surface-Enhanced Raman Scattering Biomedical Applications of Plasmonic Colloidal Particles. J. R. Soc. Interface 2010, 7 (Suppl. S4), S435–S450. [Google Scholar] [CrossRef] [Green Version]
  105. Stöckle, R.M.; Suh, Y.D.; Deckert, V.; Zenobi, R. Nanoscale Chemical Analysis by Tip-Enhanced Raman Spectroscopy. Chem. Phys. Lett. 2000, 318, 131–136. [Google Scholar] [CrossRef]
  106. Liu, H.; Zhang, Z.; Liu, S.; Yan, L.; Liu, T.; Zhang, T. Joint Baseline-Correction and Denoising for Raman Spectra. Appl. Spectrosc. 2015, 69, 1013–1022. [Google Scholar] [CrossRef]
  107. Guo, S.; Bocklitz, T.; Popp, J. Optimization of Raman-Spectrum Baseline Correction in Biological Application. Analyst 2016, 141, 2396–2404. [Google Scholar] [CrossRef] [PubMed] [Green Version]
  108. De Beer, T.R.M.; Vergote, G.J.; Baeyens, W.R.G.; Remon, J.P.; Vervaet, C.; Verpoort, F. Development and Validation of a Direct, Non-Destructive Quantitative Method for Medroxyprogesterone Acetate in a Pharmaceutical Suspension Using FT-Raman Spectroscopy. Eur. J. Pharm. Sci. 2004, 23, 355–362. [Google Scholar] [CrossRef] [PubMed]
  109. Jameson, C.J. Fundamental Intramolecular and Intermolecular Information from NMR in the Gas Phase. In New Developments in NMR; Jackowski, K., Jaszuński, M., Eds.; Royal Society of Chemistry: London, UK, 2016; pp. 1–51. [Google Scholar] [CrossRef] [Green Version]
  110. Tampieri, A.; Szabó, M.; Medina, F.; Gulyás, H. A Brief Introduction to the Basics of NMR Spectroscopy and Selected Examples of Its Applications to Materials Characterization. Phys. Sci. Rev. 2021, 6, 20190086. [Google Scholar] [CrossRef]
  111. Westphal, H.; Warias, R.; Becker, H.; Spanka, M.; Ragno, D.; Gläser, R.; Schneider, C.; Massi, A.; Belder, D. Unveiling Organocatalysts Action–Investigating Immobilized Catalysts at Steady-State Operation via Lab-on-a-Chip Technology. Chem. Cat. Chem. 2021, 13, 5089–5096. [Google Scholar] [CrossRef]
  112. Giraudeau, P.; Frydman, L. Single-Scan 2D NMR: An Emerging Tool in Analytical Spectroscopy. Annu. Rev. Anal. Chem. 2014, 7, 129. [Google Scholar] [CrossRef] [Green Version]
  113. Jacquemmoz, C.; Giraud, F.; Dumez, J.-N. Online Reaction Monitoring by Single-Scan 2D NMR Under Flow Conditions. Analyst 2020, 145, 478–485. [Google Scholar] [CrossRef]
  114. Kazimierczuk, K.; Orekhov, V. Non-Uniform Sampling: Post-Fourier Era of NMR Data Collection and Processing. Magn. Reson. Chem. 2015, 53, 921–926. [Google Scholar] [CrossRef]
  115. Kang, C. Applications of In-Cell NMR in Structural Biology and Drug Discovery. Int. J. Mol. Sci. 2019, 20, 139. [Google Scholar] [CrossRef] [Green Version]
  116. Matlahov, I.; van der Wel, P.C.A. Hidden Motions and Motion-Induced Invisibility: Dynamics-Based Spectral Editing in Solid-State NMR. Methods 2018, 148, 123–135. [Google Scholar] [CrossRef]
  117. Jaroniec, C.P.; MacPhee, C.E.; Bajaj, V.S.; McMahon, M.T.; Dobson, C.M.; Griffin, R.G. High-Resolution Molecular Structure of a Peptide in an Amyloid Fibril Determined by Magic Angle Spinning NMR Spectroscopy. Proc. Natl. Acad. Sci. USA 2004, 101, 711–716. [Google Scholar] [CrossRef] [Green Version]
  118. Oosthoek-De Vries, A.J.; Bart, J.; Tiggelaar, R.M.; Janssen, J.W.G.; Van Bentum, P.J.M.; Gardeniers, H.J.G.E.; Kentgens, A.P.M. Continuous Flow 1H and 13C NMR Spectroscopy in Microfluidic Stripline NMR Chips. Anal. Chem. 2017, 89, 2296–2303. [Google Scholar] [CrossRef] [PubMed] [Green Version]
  119. Smits, J.; Damron, J.T.; Kehayias, P.; McDowell, A.F.; Mosavian, N.; Fescenko, I.; Ristoff, N.; Laraoui, A.; Jarmola, A.; Acosta, V.M. Two-Dimensional Nuclear Magnetic Resonance Spectroscopy with a Microfluidic Diamond Quantum Sensor. Sci. Adv. 2019, 5, eaaw7895. [Google Scholar] [CrossRef] [PubMed] [Green Version]
  120. Glish, G.L.; Vachet, R.W. The Basics of Mass Spectrometry in the Twenty-First Century. Nat. Rev. Drug Discov. 2003, 2, 140–150. [Google Scholar] [CrossRef] [PubMed]
  121. Ho, C.S.; Lam, C.W.K.; Chan, M.H.M.; Cheung, R.C.K.; Law, L.K.; Lit, L.C.W.; Ng, K.F.; Suen, M.W.M.; Tai, H.L. Electrospray Ionisation Mass Spectrometry: Principles and Clinical Applications. Clin. Biochem. Rev. 2003, 24, 3. [Google Scholar]
  122. Pomastowski, P.; Buszewski, B. Complementarity of Matrix- and Nanostructure-Assisted Laser Desorption/Ionization Approaches. Nanomaterials 2019, 9, 260. [Google Scholar] [CrossRef] [Green Version]
  123. Hosseini, S.; Martinez-Chapa, S.O. Principles and Mechanism of MALDI-ToF-MS Analysis. Briefs Appl. Sci. Technol. 2017, 1–19. [Google Scholar] [CrossRef]
  124. Li, D.; Yi, J.; Han, G.; Qiao, L. MALDI-TOF Mass Spectrometry in Clinical Analysis and Research. ACS Meas. Sci. Au 2022, 2, 385–404. [Google Scholar] [CrossRef]
  125. Duncan, M.W.; Roder, H.; Hunsucker, S.W. Quantitative Matrix-Assisted Laser Desorption/Ionization Mass Spectrometry. Brief. Funct. Genomics Proteomics 2008, 7, 355. [Google Scholar] [CrossRef] [Green Version]
  126. Bae, Y.J.; Kim, M.S. A Thermal Mechanism of Ion Formation in MALDI. Annu. Rev. Anal. Chem. 2015, 8, 41–60. [Google Scholar] [CrossRef] [Green Version]
  127. Darie-Ion, L.; Whitham, D.; Jayathirtha, M.; Rai, Y.; Neagu, A.N.; Darie, C.C.; Petre, B.A. Applications of MALDI-MS/MS-Based Proteomics in Biomedical Research. Molecules 2022, 27, 6196. [Google Scholar] [CrossRef]
  128. Gopal, J.; Hasan, N.; Wu, H.F. Fabrication of Titanium Based MALDI Bacterial Chips for Rapid, Sensitive and Direct Analysis of Pathogenic Bacteria. Biosens. Bioelectron. 2013, 39, 57–63. [Google Scholar] [CrossRef] [PubMed]
  129. Manikandan, M.; Hasan, N.; Wu, H.F. Platinum Nanoparticles for the Photothermal Treatment of Neuro 2A Cancer Cells. Biomaterials 2013, 34, 5833–5842. [Google Scholar] [CrossRef] [PubMed]
  130. Torres-Sangiao, E.; Leal Rodriguez, C.; García-riestra, C. Application and Perspectives of Maldi–Tof Mass Spectrometry in Clinical Microbiology Laboratories. Microorganisms 2021, 9, 1539. [Google Scholar] [CrossRef] [PubMed]
  131. Buchberger, A.R.; DeLaney, K.; Johnson, J.; Li, L. Mass Spectrometry Imaging: A Review of Emerging Advancements and Future Insights. Anal. Chem. 2018, 90, 240–265. [Google Scholar] [CrossRef]
  132. Tuck, M.; Grélard, F.; Blanc, L.; Desbenoit, N. MALDI-MSI Towards Multimodal Imaging: Challenges and Perspectives. Front. Chem. 2022, 10, 4688. [Google Scholar] [CrossRef]
  133. Konermann, L.; Ahadi, E.; Rodriguez, A.D.; Vahidi, S. Unraveling the Mechanism of Electrospray Ionization. Anal. Chem. 2013, 85, 2–9. [Google Scholar] [CrossRef]
  134. Daub, C.D.; Cann, N.M. How Are Completely Desolvated Ions Produced in Electrospray Ionization: Insights from Molecular Dynamics Simulations. Anal. Chem. 2011, 83, 8372–8376. [Google Scholar] [CrossRef]
  135. Banerjee, S.; Mazumdar, S. Electrospray Ionization Mass Spectrometry: A Technique to Access the Information beyond the Molecular Weight of the Analyte. Int. J. Anal. Chem. 2012, 2012, 282574. [Google Scholar] [CrossRef] [Green Version]
  136. Murayama, C.; Kimura, Y.; Setou, M. Imaging Mass Spectrometry: Principle and Application. Biophys. Rev. 2009, 1, 131–139. [Google Scholar] [CrossRef] [Green Version]
  137. Shimma, S. Mass Spectrometry Imaging. Mass Spectrom. 2022, 11, A0102. [Google Scholar] [CrossRef]
  138. Kumar, B.R. Application of HPLC and ESI-MS Techniques in the Analysis of Phenolic Acids and Flavonoids from Green Leafy Vegetables (GLVs). J. Pharm. Anal. 2017, 7, 349. [Google Scholar] [CrossRef] [PubMed]
  139. Li, J.; Šimek, H.; Ilioae, D.; Jung, N.; Bräse, S.; Zappe, H.; Dittmeyer, R.; Ladewig, B.P. In Situ Sensors for Flow Reactors—A Review. React. Chem. Eng. 2021, 6, 1497–1507. [Google Scholar] [CrossRef]
  140. Rizkin, B.A.; Popovic, F.G.; Hartman, R.L. Review Article: Spectroscopic Microreactors for Heterogeneous Catalysis. J. Vac. Sci. Technol. A Vacuum Surfaces Film. 2019, 37, 050801. [Google Scholar] [CrossRef] [Green Version]
  141. Li, D.E.; Lin, C.H. Microfluidic Chip for Droplet-Based AuNP Synthesis with Dielectric Barrier Discharge Plasma and on-Chip Mercury Ion Detection. RSC Adv. 2018, 8, 16139–16145. [Google Scholar] [CrossRef] [Green Version]
  142. Bressan, L.P.; Robles-Najar, J.; Adamo, C.B.; Quero, R.F.; Costa, B.M.C.; de Jesus, D.P.; da Silva, J.A.F. 3D-Printed Microfluidic Device for the Synthesis of Silver and Gold Nanoparticles. Microchem. J. 2019, 146, 1083–1089. [Google Scholar] [CrossRef]
  143. Duncombe, T.A.; Ponti, A.; Seebeck, F.P.; Dittrich, P.S. UV-Vis Spectra-Activated Droplet Sorting for Label-Free Chemical Identification and Collection of Droplets. Anal. Chem. 2021, 93, 13008–13013. [Google Scholar] [CrossRef]
  144. Bhat, M.P.; Kurkuri, M.; Losic, D.; Kigga, M.; Altalhi, T. New Optofluidic Based Lab-on-a-Chip Device for the Real-Time Fluoride Analysis. Anal. Chim. Acta 2021, 1159, 338439. [Google Scholar] [CrossRef]
  145. Rodríguez-Ruiz, I.; Lamadie, F.; Charton, S. Uranium(VI) On-Chip Microliter Concentration Measurements in a Highly Extended UV-Visible Absorbance Linearity Range. Anal. Chem. 2018, 90, 2456–2460. [Google Scholar] [CrossRef]
  146. Adbolusattar, I.; Hadi, H. Paper microfluidic device and spectrophotometry methods for colorimetric detection of phenylephrine hydrochloride in pure and pharmaceutical preparations. Bull. Chem. Soc. Ethiop. 2022, 36, 727–736. [Google Scholar]
  147. Suarnaba, E.G.T.; Lee, Y.F.; Yamada, H.; Tagawa, T. Ultraviolet-Visible (UV-Vis) Microspectroscopic System Designed for the in Situ Characterization of the Dehydrogenation Reaction over Platinum Supported Catalytic Microchannel Reactor. Appl. Spectrosc. 2016, 70, 1806–1812. [Google Scholar] [CrossRef]
  148. Ponce, S.; Munoz, M.; Cubillas, A.M.; Euser, T.G.; Zhang, G.R.; Russell, P.S.J.; Wasserscheid, P.; Etzold, B.J.M. Stable Immobilization of Size-Controlled Bimetallic Nanoparticles in Photonic Crystal Fiber Microreactor. Chem.Ing. Tech. 2018, 90, 653–659. [Google Scholar] [CrossRef]
  149. Aillet, T.; Loubiere, K.; Dechy-Cabaret, O.; Laurent, P. Microreactors as a Tool for Acquiring Kinetic Data on Photochemical Reactions. Chem. Eng. Technol. 2016, 39, 115–122. [Google Scholar] [CrossRef]
  150. Ye, W.Q.; Wei, Y.Y.; Wang, D.N.; Yang, C.G.; Xu, Z.R. A Digital Microfluidic Platform Based on a Near-Infrared Light-Responsive Shape-Memory Micropillar Array. Lab Chip 2021, 21, 1131–1138. [Google Scholar] [CrossRef] [PubMed]
  151. Isikawa, M.; Guidelli, E. Microfluidic Synthesis of Theranostic Nanoparticles with Near-Infrared Scintillation: Toward Next-Generation Dosimetry in X-Ray-Induced Photodynamic Therapy. ACS Appl. Mater. Interfaces 2022, 14, 324–336. [Google Scholar] [CrossRef] [PubMed]
  152. Bello, V.; Bodo, E. A NIR-Spectroscopy-Based Approach for Detection of Fluids in Rectangular Glass Micro-Capillaries. Eng. Proc. 2020, 2, 43. [Google Scholar] [CrossRef]
  153. Iiyama, T.; Furuya, M.; Arai, T. Near-Infrared Imaging to Quantify the Diffusion Coefficient of Sodium Pentaborate Aqueous Solution in a Microchannel. Chem. Eng. Sci. 2022, 254, 117630. [Google Scholar] [CrossRef]
  154. Uema, T.; Ohata, T.; Washizuka, Y.; Nakanishi, R.; Kawashima, D.; Kakuta, N. Near-Infrared Imaging in a Microfluidic Channel of Aqueous Acid–Base Reactions. Chem. Eng. J. 2021, 403, 126338. [Google Scholar] [CrossRef]
  155. Galaverna, R.; Ribessi, R.L.; Rohwedder, J.J.R.; Pastre, J.C. Coupling Continuous Flow Microreactors to MicroNIR Spectroscopy: Ultracompact Device for Facile In-Line Reaction Monitoring. Org. Process Res. Dev. 2018, 22, 780–788. [Google Scholar] [CrossRef]
  156. Loiland, J.A.; Lobo, R.F. Oxidation of Zeolite Acid Sites in NO/O2 Mixtures and the Catalytic Properties of the New Site in NO Oxidation. J. Catal. 2015, 325, 68–78. [Google Scholar] [CrossRef] [Green Version]
  157. Fath, V.; Lau, P.; Greve, C.; Kockmann, N.; Röder, T. Efficient Kinetic Data Acquisition and Model Prediction: Continuous Flow Microreactors, Inline Fourier Transform Infrared Spectroscopy, and Self-Modeling Curve Resolution. Org. Process Res. Dev. 2020, 24, 1955–1968. [Google Scholar] [CrossRef]
  158. Fath, V.; Lau, P.; Greve, C.; Weller, P.; Kockmann, N.; Röder, T. Simultaneous Self-Optimisation of Yield and Purity through Successive Combination of Inline FT-IR Spectroscopy and Online Mass Spectrometry in Flow Reactions. J. Flow Chem. 2021, 11, 285–302. [Google Scholar] [CrossRef]
  159. Chevalier, S.; Tourvieille, J.N.; Sommier, A.; Pradère, C. Infrared Thermospectroscopic Imaging of Heat and Mass Transfers in Laminar Microfluidic Reactive Flows. Chem. Eng. J. Adv. 2021, 8, 100166. [Google Scholar] [CrossRef]
  160. Ryu, M.; Kimber, J.A.; Sato, T.; Nakatani, R.; Hayakawa, T.; Romano, M.; Pradere, C.; Hovhannisyan, A.A.; Kazarian, S.G.; Morikawa, J. Infrared Thermo-Spectroscopic Imaging of Styrene Radical Polymerization in Microfluidics. Chem. Eng. J. 2017, 324, 259–265. [Google Scholar] [CrossRef]
  161. Nelson, G.L.; Lines, A.M.; Bello, J.M.; Bryan, S.A. Online Monitoring of Solutions within Microfluidic Chips: Simultaneous Raman and Uv-Vis Absorption Spectroscopies. ACS Sens. 2019, 4, 2288–2295. [Google Scholar] [CrossRef]
  162. Mattio, E.; Caleyron, A.; Miguirditchian, M.; Lines, A.M.; Bryan, S.A.; Lackey, H.E.; Rodriguez-Ruiz, I.; Lamadie, F. Microfluidic In-Situ Spectrophotometric Approaches to Tackle Actinides Analysis in Multiple Oxidation States. Appl. Spectrosc. 2022, 76, 580–589. [Google Scholar] [CrossRef]
  163. Nelson, G.L.; Asmussen, S.E.; Lines, A.M.; Casella, A.J.; Bottenus, D.R.; Clark, S.B.; Bryan, S.A. Micro-Raman Technology to Interrogate Two-Phase Extraction on a Microfluidic Device. Anal. Chem. 2018, 90, 8345–8353. [Google Scholar] [CrossRef]
  164. Lines, A.M.; Nelson, G.L.; Casella, A.J.; Bello, J.M.; Clark, S.B.; Bryan, S.A. Multivariate Analysis to Quantify Species in the Presence of Direct Interferents: Micro-Raman Analysis of HNO3 in Microfluidic Devices. Anal. Chem. 2018, 90, 2548–2554. [Google Scholar] [CrossRef]
  165. Nelson, G.L.; Lines, A.M.; Casella, A.J.; Bello, J.M.; Bryan, S.A. Development and Testing of a Novel Micro-Raman Probe and Application of Calibration Method for the Quantitative Analysis of Microfluidic Nitric Acid Streams. Analyst 2018, 143, 1188–1196. [Google Scholar] [CrossRef]
  166. Engeldinger, J.; Radnik, J.; Kreyenschulte, C.; Devred, F.; Gaigneaux, E.M.; Fischer, A.; Zanthoff, H.W.; Bentrup, U. Probing the Structural Changes and Redox Behavior of Mixed Molybdate Catalysts under Ammoxidation Conditions: An Operando Raman Spectroscopy Study. ChemCatChem 2016, 8, 976–983. [Google Scholar] [CrossRef]
  167. Gentleman, A.S.; Miele, E.; Lawson, T.; Kohler, P.; Kim, S.; Yousaf, S.; Garcia, D.A.; Lage, A.; Grey, C.P.; Baumberg, J.J.; et al. In-Situ Raman Spectroscopy of Reaction Products in Optofluidic Hollow-Core Fiber Microreactors. In Proceedings of the 14th Pacific Rim Conference on Lasers and Electro-Optics (CLEO PR 2020), Sydney, Australia, 3–5 August 2020. [Google Scholar] [CrossRef]
  168. Pinho, B.; Hartman, R.L. Microfluidics with in Situ Raman Spectroscopy for the Characterization of Non-Polar/Aqueous Interfaces. React. Chem. Eng. 2017, 2, 189–200. [Google Scholar] [CrossRef]
  169. Zhu, J.; Chen, Q.; Kutsanedzie, F.Y.H.; Yang, M.; Ouyang, Q.; Jiang, H. Highly Sensitive and Label-Free Determination of Thiram Residue Using Surface-Enhanced Raman Spectroscopy (SERS) Coupled with Paper-Based Microfluidics. Anal. Methods 2017, 9, 6186–6193. [Google Scholar] [CrossRef]
  170. Zhang, Z.; Gernert, U.; Gerhardt, R.F.; Höhn, E.M.; Belder, D.; Kneipp, J. Catalysis by Metal Nanoparticles in a Plug-In Optofluidic Platform: Redox Reactions of p-Nitrobenzenethiol and p-Aminothiophenol. ACS Catal. 2018, 8, 2443–2449. [Google Scholar] [CrossRef]
  171. Willner, M.R.; McMillan, K.S.; Graham, D.; Vikesland, P.J.; Zagnoni, M. Surface-Enhanced Raman Scattering Based Microfluidics for Single-Cell Analysis. Anal. Chem. 2018, 90, 12004–12010. [Google Scholar] [CrossRef] [PubMed] [Green Version]
  172. Krafft, B.; Panneerselvam, R.; Geissler, D.; Belder, D. A Microfluidic Device Enabling Surface-Enhanced Raman Spectroscopy at Chip-Integrated Multifunctional Nanoporous Membranes. Anal. Bioanal. Chem. 2020, 412, 267–277. [Google Scholar] [CrossRef]
  173. Nie, Y.; Jin, C.; Zhang, J.X.J. MicrofluidicIn SituPatterning of Silver Nanoparticles for Surface-Enhanced Raman Spectroscopic Sensing of Biomolecules. ACS Sens. 2021, 6, 2584–2592. [Google Scholar] [CrossRef]
  174. Bi, H.; Fernandes, A.C.; Cardoso, S.; Freitas, P. Interference-Blind Microfluidic Sensor for Ascorbic Acid Determination by UV/Vis Spectroscopy. Sens. Actuators B Chem. 2016, 224, 668–675. [Google Scholar] [CrossRef] [Green Version]
  175. Cao, E.; Brett, G.; Miedziak, P.J.; Douthwaite, J.M.; Barrass, S.; McMillan, P.F.; Hutchings, G.J.; Gavriilidis, A. A Micropacked-Bed Multi-Reactor System with in Situ Raman Analysis for Catalyst Evaluation. Catal. Today 2017, 283, 195–201. [Google Scholar] [CrossRef] [Green Version]
  176. Navin, C.V.; Krishna, K.S.; Theegala, C.S.; Kumar, C.S.S.R. Space and Time-Resolved Probing of Heterogeneous Catalysis Reactions Using Lab-on-a-Chip. Nanoscale 2016, 8, 5546–5551. [Google Scholar] [CrossRef]
  177. Lauterbach, F.; Abetz, V.; Lauterbach, F.; Abetz, V. Continuous Kinetic Sampling of Flow Polymerizations via Inline UV–Vis Spectroscopy. Macromol. Rapid Commun. 2020, 41, 2000029. [Google Scholar] [CrossRef]
  178. Wang, N.; Tan, F.; Zhao, Y.; Tsoi, C.C.; Fan, X.; Yu, W.; Zhang, X. Optofluidic UV-Vis Spectrophotometer for Online Monitoring of Photocatalytic Reactions. Sci. Rep. 2016, 6, 28928. [Google Scholar] [CrossRef]
  179. Hess, C. New Advances in Using Raman Spectroscopy for the Characterization of Catalysts and Catalytic Reactions. Chem. Soc. Rev. 2021, 50, 3519–3564. [Google Scholar] [CrossRef] [PubMed]
  180. Chen, J.; Li, S.; Yao, F.; Bao, F.; Ge, Y.; Zou, M.; Liang, P.; Chen, Q. Progress of Microfluidics Combined with SERS Technology in the Trace Detection of Harmful Substances. Chemosensors 2022, 10, 449. [Google Scholar] [CrossRef]
  181. Vis, C.M.; Nieuwelink, A.E.; Weckhuysen, B.M.; Bruijnincx, P.C.A. Continuous Flow Pickering Emulsion Catalysis in Droplet Microfluidics Studied with In Situ Raman Microscopy. Chem. Eur. J. 2020, 26, 15099–15102. [Google Scholar] [CrossRef] [PubMed]
  182. Liu, J.; Sun, H.; Yin, L.; Yuan, Y.; Xu, M.; Yao, J. On-Line Monitoring on the Micro-Synthesis of α-Phenylethanol by Microfluidic Chip Combined with Surface Enhanced Raman Spectroscopy. Acta Chim. Sin. 2019, 77, 257–262. [Google Scholar] [CrossRef]
  183. Wu, Y.; Jiang, Y.; Zheng, X.; Jia, S.; Zhu, Z.; Ren, B.; Ma, H. Facile Fabrication of Microfluidic Surface-Enhanced Raman Scattering Devices via Lift-up Lithography. R. Soc. Open Sci. 2018, 5, 172034. [Google Scholar] [CrossRef] [Green Version]
  184. Panneerselvam, R.; Sadat, H.; Höhn, E.M.; Das, A.; Noothalapati, H.; Belder, D. Microfluidics and Surface-Enhanced Raman Spectroscopy, a Win–Win Combination? Lab Chip 2022, 22, 665–682. [Google Scholar] [CrossRef]
  185. Dedovets, D.; Zhang, S.; Leng, J.; Pera-Titus, M. Microfluidic Device for Monitoring Catalytic Events on Armored Bubbles. Adv. Mater. Interfaces 2022, 9, 2200759. [Google Scholar] [CrossRef]
  186. Zhu, J.; Wang, F.; Chen, R.; Cheng, K.; Xu, B.; Guo, Z.; Liang, X.; Ye, M.; Zou, H. Centrifugation Assisted Microreactor Enables Facile Integration of Trypsin Digestion, Hydrophilic Interaction Chromatography Enrichment, and on-Column Deglycosylation for Rapid and Sensitive N-Glycoproteome Analysis. Anal. Chem. 2012, 84, 5146–5153. [Google Scholar] [CrossRef]
  187. Meller, K.; Pomastowski, P.; Szumski, M.; Buszewski, B. Preparation of an Improved Hydrophilic Monolith to Make Trypsin-Immobilized Microreactors. J. Chromatogr. B 2017, 1043, 128–137. [Google Scholar] [CrossRef]
  188. Wu, N.; Wang, S.; Yang, Y.; Song, J.; Su, P.; Yang, Y. DNA-Directed Trypsin Immobilization on a Polyamidoamine Dendrimer-Modified Capillary to Form a Renewable Immobilized Enzyme Microreactor. Int. J. Biol. Macromol. 2018, 113, 38–44. [Google Scholar] [CrossRef]
  189. Szymańska, K.; Pietrowska, M.; Kocurek, J.; Maresz, K.; Koreniuk, A.; Mrowiec-Białoń, J.; Widłak, P.; Magner, E.; Jarzebski, A. Low Back-Pressure Hierarchically Structured Multichannel Microfluidic Bioreactors for Rapid Protein Digestion—Proof of Concept. Chem. Eng. J. 2016, 287, 148–154. [Google Scholar] [CrossRef]
  190. Zhong, C.; Yang, B.; Huang, W.; Huang, H.; Zhang, S.; Yan, X.; Lu, Q.; Chen, Z.; Lin, Z. Self-Assembly Synthes Is of Trypsin-Immobilized Monolithic Microreactor for Fast and Efficient Proteolysis. J. Chromatogr. A 2021, 1635, 461742. [Google Scholar] [CrossRef] [PubMed]
  191. Lee, J.; Musyimi, H.K.; Soper, S.A.; Murray, K.K. Development of an Automated Digestion and Droplet Deposition Microfluidic Chip for MALDI-TOF MS. J. Am. Soc. Mass Spectrom. 2008, 19, 964–972. [Google Scholar] [CrossRef] [PubMed] [Green Version]
  192. Jiang, H.; Zou, H.; Wang, H.; Zhang, Q.; Ni, J.; Zhang, Q.; Guo, Z.; Chen, X. Combination of MALDI-TOF Mass Spectrometry with Immobilized Enzyme Microreactor for Peptide Mapping. Sci. China Ser. B Chem. 2000, 43, 625–633. [Google Scholar] [CrossRef]
  193. Peterson, D.S.; Rohr, T.; Svec, F.; Fréchet, J.M.J. High-Throughput Peptide Mass Mapping Using a Microdevice Containing Trypsin Immobilized on a Porous Polymer Monolith Coupled to MALDI TOF and ESI TOF Mass Spectrometers. J. Proteome Res. 2002, 1, 563–568. [Google Scholar] [CrossRef] [PubMed]
  194. Gao, M.; Zhang, P.; Hong, G.; Guan, X.; Yan, G.; Deng, C.; Zhang, X. Novel Monolithic Enzymatic Microreactor Based on Single-Enzyme Nanoparticles for Highly Efficient Proteolysis and Its Application in Multidimensional Liquid Chromatography. J. Chromatogr. A 2009, 1216, 7472–7477. [Google Scholar] [CrossRef]
  195. Szymańska, K.; Ciemięga, A.; Maresz, K.; Pudło, W.; Malinowski, J.; Mrowiec-Białoń, J.; Jarzębski, A.B. Catalytic Functionalized Structured Monolithic Micro-/Mesoreactors: Engineering, Properties, and Performance in Flow Synthesis: An Overview and Guidelines. Front. Chem. Eng. 2021, 3, 70. [Google Scholar] [CrossRef]
  196. Villegas, L.; Pero-Gascon, R.; Benavente, F.; Barbosa, J.; Sanz-Nebot, V. On-Line Protein Digestion by Immobilized Enzyme Microreactor Capillary Electrophoresis-Mass Spectrometry. Talanta 2019, 199, 116–123. [Google Scholar] [CrossRef]
  197. Zhang, Y.; Liu, Y.; Kong, J.; Yang, P.; Tang, Y.; Liu, B. Efficient Proteolysis System: A Nanozeolite-Derived Microreactor. Small 2006, 2, 1170–1173. [Google Scholar] [CrossRef]
  198. Liu, J.; Lin, S.; Qi, D.; Deng, C.; Yang, P.; Zhang, X. On-Chip Enzymatic Microreactor Using Trypsin-Immobilized Superparamagnetic Nanoparticles for Highly Efficient Proteolysis. J. Chromatogr. A 2007, 1176, 169–177. [Google Scholar] [CrossRef]
  199. Ku, K.; Frey, C.; Arad, M.; Ghafourifar, G. Development of Novel Enzyme Immobilization Methods Employing Formaldehyde or Triethoxysilylbutyraldehyde to Fabricate Immobilized Enzyme Microreactors for Peptide Mapping. Anal. Methods 2022, 14, 4053–4063. [Google Scholar] [CrossRef] [PubMed]
  200. Brivio, M.; Fokkens, R.H.; Verboom, W.; Reinhoudt, D.N.; Tas, N.R.; Goedbloed, M.; Van den Berg, A. Integrated Microfluidic System Enabling (Bio)Chemical Reactions with on-Line MALDI-TOF Mass Spectrometry. Anal. Chem. 2002, 74, 3972–3976. [Google Scholar] [CrossRef] [PubMed]
  201. Gorbunov, A.; Bardin, A.; Ilyushonok, S.; Kovach, J.; Petrenko, A.; Sukhodolov, N.; Krasnov, K.; Krasnov, N.; Zorin, I.; Obornev, A.; et al. Multiwell Photocatalytic Microreactor Device Integrating Drug Biotransformation Modeling and Sample Preparation on a MALDI Target. Microchem. J. 2022, 178, 107362. [Google Scholar] [CrossRef]
  202. Zhang, S.; Yuan, H.; Zhao, B.; Zhou, Y.; Jiang, H.; Zhang, L.; Liang, Z.; Zhang, Y. Integrated Platform with a Combination of Online Digestion and 18O Labeling for Proteome Quantification via an Immobilized Trypsin Microreactor. Analyst 2015, 140, 5227–5234. [Google Scholar] [CrossRef]
  203. Foo, H.C.; Smith, N.W.; Stanley, S.M.R. Fabrication of an On-Line Enzyme Micro-Reactor Coupled to Liquid Chromatography–Tandem Mass Spectrometry for the Digestion of Recombinant Human Erythropoietin. Talanta 2015, 135, 18–22. [Google Scholar] [CrossRef] [PubMed]
  204. Sun, L.; Zhu, G.; Dovichi, N.J. Integrated CZE-ESI-MS/MS System with an Immobilized Trypsin Microreactor for Online Digestion and Analysis of Picogram Amounts of RAW 264.7 Cell Lysate. Anal. Chem. 2013, 85, 4187. [Google Scholar] [CrossRef] [Green Version]
  205. Li, Y.; Wojcik, R.; Dovichi, N.J. A Replaceable Microreactor for On-Line Protein Digestion in a Two-Dimensional Capillary Electrophoresis System with Tandem Mass Spectrometry Detection. J. Chromatogr. A 2011, 1218, 2007–2011. [Google Scholar] [CrossRef] [Green Version]
  206. Nissilä, T.; Sainiemi, L.; Franssila, S.; Ketola, R.A. Fully Polymeric Integrated Microreactor/Electrospray Ionization Chip for on-Chip Digestion and Mass Spectrometric Analysis. Sens. Actuators B Chem. 2009, 143, 414–420. [Google Scholar] [CrossRef]
  207. Haven, J.J.; Vandenbergh, J.; Junkers, T. Watching Polymers Grow: Real Time Monitoring of Polymerizations via an on-Line ESI-MS/Microreactor Coupling. Chem. Commun. 2015, 51, 4611–4614. [Google Scholar] [CrossRef]
  208. Haven, J.J.; Baeten, E.; Claes, J.; Vandenbergh, J.; Junkers, T. High-Throughput Polymer Screening in Microreactors: Boosting the Passerini Three Component Reaction. Polym. Chem. 2017, 8, 2972–2978. [Google Scholar] [CrossRef]
  209. Guo, W.; Heeres, H.J.; Yue, J. Continuous Synthesis of 5-Hydroxymethylfurfural from Glucose Using a Combination of AlCl3 and HCl as Catalyst in a Biphasic Slug Flow Capillary Microreactor. Chem. Eng. J. 2020, 381, 122754. [Google Scholar] [CrossRef]
Figure 1. Example of a simple microfluidic setup (Created in BioRender.com).
Catalysts 13 00690 g001
Figure 2. Micro-total analysis system (μTAS) scheme.
Catalysts 13 00690 g002
Figure 3. Basics of spectral data analyses.
Catalysts 13 00690 g003
Figure 4. UV-Vis measurement principle (Created in BioRender.com).
Catalysts 13 00690 g004
Figure 5. Experimental set up for NIR measurements.
Catalysts 13 00690 g005
Figure 6. Raman spectroscopy principle (Created in BioRender.com).
Catalysts 13 00690 g006
Figure 7. MALDI-TOF-MS measurement mechanism.
Catalysts 13 00690 g007
Figure 8. Schematic overview of using microfluidic device coupled with: (a) UV-Vis spectroscopy Reprinted with permission from Ref. [174], (b) IR spectroscopy Reprinted with permission from the Royal Society of Chemistry from Ref. [19] where following symbols were used (1) mixing channels (2) reaction chamber (3) polymer microfluidic chip (4) silicon internal reflection element and (c) Raman spectroscopy Reprinted with permission from Ref. [175].
Catalysts 13 00690 g008
Table 1. The most important advantages and disadvantages of selected spectroscopy methods.
UV-Vis SpectroscopyNIR SpectroscopyRaman Spectroscopy
Advantages
  • Non-destructive
  • Cheap
  • Small amounts of samples needed
  • Minimal data processing
  • Identification and quantification of molecules
  • Fast
  • Inexpensive
  • Non-destructive analysis
  • Provides real-time or near real-time molecular information
  • Non-destructive method
  • No sample preparation
Disadvantages
  • Occurrence of scattering effects while working with suspensions
  • Interference from multiple absorbing species and formation of overlapping spectra
  • pH and temperature dependence of the results
  • Low sensitivity due to low absorption indexes
  • Indirect method, requires the development of a multivariate calibration model
  • Low efficiency of inelastic light scattering compared to elastic scattering
  • Unreliable detection of specific biomolecules
  • Quantitative analysis of Raman spectra must be validated against well-established methods
Disclaimer/Publisher’s Note: The statements, opinions and data contained in all publications are solely those of the individual author(s) and contributor(s) and not of MDPI and/or the editor(s). MDPI and/or the editor(s) disclaim responsibility for any injury to people or property resulting from any ideas, methods, instructions or products referred to in the content.

