Article

Investigating the Performance of Lithium-Doped Bismuth Ferrite [BiFe1−xLixO3]-Graphene Nanocomposites as Cathode Catalyst for the Improved Power Output in Microbial Fuel Cells

1
Nanomaterials Laboratory, Department of Physics, Sharda School of Basic Sciences and Research, Sharda University, Greater Noida 201310, India
2
Centre for Solar Cell and Renewable Energy, Department of Physics, Sharda School of Basic Sciences and Research, Sharda University, Greater Noida 201310, India
3
Biopositive Lab, Department of Life Sciences, Sharda School of Basic Sciences and Research, Sharda University, Greater Noida 201310, India
4
Special Centre for Nanoscience, Jawaharlal Nehru University, New Delhi 110067, India
5
Department of Bio-Technology, Koneru Lakshmaiah Education Foundation, Vaddeswaram 522302, India
6
Ministry of Environment, Forest and Climate Change, Government of India, New Delhi 110003, India
7
Department of Biotechnology, Graphic Era Deemed to be University, Dehradun 248002, India
8
Department of Biotechnology, School of Life Science and Biotechnology, Adamas University, Kolkata 700126, India
9
Division of Research and Innovation, School of Applied and Life Sciences, Uttaranchal University, Dehradun 248007, India
*
Authors to whom correspondence should be addressed.
These authors contributed equally to this work.
Catalysts 2023, 13(3), 618; https://doi.org/10.3390/catal13030618
Submission received: 17 January 2023 / Revised: 11 March 2023 / Accepted: 14 March 2023 / Published: 20 March 2023
(This article belongs to the Special Issue Recent Advances on Nano-Catalysts for Biological Processes II)

Abstract

:
In this study, multifunctional lithium-doped bismuth ferrite [BiFe1−xLixO3]-graphene nanocomposites (x = 0.00, 0.02, 0.04, 0.06) were synthesized by a sol-gel and ultrasonication assisted chemical reduction method. X-ray diffraction and FESEM electron microscopy techniques disclosed the nanocomposite phase and nanocrystalline nature of [BiFe1−xLixO3]-graphene nanocomposites. The FESEM images and the EDX elemental mapping revealed the characteristic integration of BiFe1−xLixO3 nanoparticles (with an average size of 95 nm) onto the 2D graphene layers. The Raman spectra of the [BiFe1−xLixO3]-graphene nanocomposites evidenced the BiFe1−xLixO3 and graphene nanostructures in the synthesized nanocomposites. The photocatalytic performances of the synthesized nanocomposites were assessed for ciprofloxacin (CIP) photooxidation under UV-visible light illumination. The photocatalytic efficiencies of [BiFe1−xLixO3]-graphene nanocomposites were measured to be 42%, 47%, 43%, and 10%, for x = 0.00, 0.02, 0.04, 0.06, respectively, within 120 min illumination, whereas the pure BiFeO3 nanoparticles were 21.0%. BiFe1−xLixO3 nanoparticles blended with graphene were explored as cathode material and tested in a microbial fuel cell (MFC). The linear sweep voltammetry (LSV) analysis showed that the high surface area of BiFeO3 was attributed to efficient oxygen reduction reaction (ORR) activity. The increasing loading rates of (0.5–2.5 mg/cm2) [BiFe1−xLixO3]-graphene composite on the cathode surface showed increasing power output, with 2.5 and 2 mg/cm2 achieving the maximum volumetric power density of 8.2 W/m3 and 8.1 W/m3, respectively. The electrochemical impedance spectroscopy (EIS) analysis showed that among the different loading rates used in this study, BiFeO3, with a loading rate of 2.5 mg/cm2, showed the lowest charge transfer resistance (Rct). The study results showed the potential of [BiFe1−xLixO3]-graphene composite as a cost-effective alternative for field-scale MFC applications.

Graphical Abstract

1. Introduction

The rapid growth in population and a massive increase in the number of industries are two significant factors for water contamination [1]. Microbial fuel cells (MFC) have emerged as a viable alternative technology for harvesting renewable energy through wastewater treatment in the form of electricity, bio-hydrogen generation, and biological oxygen demand (BOD) sensors in recent years [2]. However, to commercialize MFC technology and compete with current advancements, such as anaerobic digesters for wastewater treatment, the cost of device manufacture must be reduced in tandem with an increase in power output. Power generation in MFC is heavily reliant on reduction kinetics at the cathode. As a result, the electron acceptor in the cathode is critical to the power generation in MFC. Because of its high positive redox potential, natural availability, and sustainability, oxygen can be an efficient electron acceptor in MFC instead of unsustainable high redox potential oxidants (ferricyanide, permanganate, persulfate, and dichromate) and poor power producing nitrate and nitrites [3]. The slow nature of the oxygen reduction reaction (ORR) with catalyst-free graphite/carbon electrodes, on the other hand, results in a significant reduction in overpotential, one of the most limiting variables in MFC performance. As a result, introducing new sustainable high-efficiency ORR catalysts has become essential for increased MFC performance. Nobel metals such as platinum (Pt), gold (Au), and palladium (Pd), as well as their alloys, exhibit intriguing catalytic capabilities for ORR augmentation [4]. Pt-based catalysts, for example, are widely utilized in fuel cell technology. However, the high cost, lack of potential stability, and catalyst poisoning hinder its commercial implementation on a broad scale. With little success, significant attempts were made to enhance ORR kinetics at the cathode surface employing low-cost electro-catalysts such as transition metals, metal oxides, macrocycles (phthalocyanine and porphyries), conducting polymers, and carbon nanotubes (CNTs)-supported nanostructures.
Ferrite materials have garnered much attention as a potential cathode catalyst for MFC because it is abundant, inexpensive, safe for the environment, and possess a significant amount of catalytic activity for electrochemical ORR [5]. Mn Fe was reported by Khilari et al. to be a viable alternative to Pt as the cathode catalyst in the MFC. The capacity of MnFe-based air cathodes to absorb or supply a significant amount of charge in a short amount of time was demonstrated in a paper published recently [6]. It contributes to the improved performance of fuel cells (flywheel effect).
Ferrite materials’ weak electrical conductivity, which restricts their efficient electrochemical activity, needs improvement by supplementing conductive carbon materials. To improve the electrochemical ORR performance, several conductive supporting materials (Graphene, Vulcan XC-72, Monarch carbon black 1000, and graphite) were used [7]. However, the ORR activity in these supporting documents was minimal. Ferrite can, thus, be combined with better electron-conducting material, such as graphene, which has superior electronic conductivity, chemical stability, better mechanical strength, high thermal stability, nano-size morphology, and high activated surface area to improve ORR performance. Due to their huge surface area (theoretical value: 2630 m2/g), high conductivity, and simple production procedure, graphene-based materials were recently identified as possible materials for lithium-ion batteries, supercapacitors, biosensors, solar cells, and catalysis. Fuel cells employed graphene with nitrogen and sulfur doping as ORR catalysts [8]. In this scenario, graphene works well in the place of lithium. A far more affordable alternative to lithium, graphene is a two-dimensional network of single or few atomic layers of hexagonal carbon that can be produced at ambient temperature.
Multiferroic BiFeO3 is a promising visible light-responsive photocatalyst because of its narrow band gap (~2.2 eV), chemical stability, and low cost [9,10,11]. There are three essential properties that an excellent photocatalytic decomposer of dyes should have: (i) generation of electron-hole pair by utilizing UV-visible light, (ii) separation of photogenerated electron-hole pair, and (iii) the redox reactions on the surface of the photocatalyst. The drawback of this material is that it has a rapid recombination rate of photogenerated electron-hole pairs.
It is well recognized that doping at A or B sites in BiFeO3 can additionally modify its structural, electronic, and magnetic properties. Researchers described the properties of Li1+-doped BiFeO3 nanostructured materials [12]. The choice of dopant Li1+ on the B site in BiFeO3 nanoparticles ended on the origin of facts, as (i) Li1+ are highly aliovalent compared to the cations Fe3+ in BiFeO3 ceramics and (ii) the ionic radius of Li1+ is close to the ionic radius of Fe3+, which may cause significant lattice distortion. The dopant Li1+ ions in BiFeO3 nanoparticles are magnetically inert, and the massive distortion in the crystal structure hypothetically improves the magnetization of BiFeO3 nanoparticles, even in the low doping concentration deprived of subordinate magnetic impurity phase (i.e., Fe2O3, Fe3O4).
The latest two-dimensional allotrope of crystalline carbon, graphene, has rapidly grown as a rising star in the field of material science due to its high surface area, solid mechanical stability, and better electrical conductivity. Graphene was discovered in 2004, since then the various researchers actively explored the graphene and its properties for various applications such as nano-electronics, catalysts, sensors, and energy conversion [13]. Graphene was introduced in the form of nanoscale substrates in the structure of semiconductor oxides for producing nanocomposites with metal oxides that can cause significant enhancement in the photocatalytic activity of metal oxides carried under visible light irradiation. Additionally, for the modified semiconductor oxide, graphene can affect the band gap energy, band structure, morphology, and particle size because of an idea of obtaining a hybrid in which both the properties of graphene can be combined as intriguing material of paper-shaped and the features of single nano-sized metal oxide particles [14,15]. Due to the significant understanding of the coupling mechanism between semiconductor oxides and graphene, this product was recently comprehensively investigated as a photocatalytic material. Although, not much attention is paid to Li-doped BiFeO3-Graphene nanocomposites and their application in microbial fuel cells. It is hypothesized that Li-doped BiFeO3-Graphene nanocomposites should exhibit good ORR properties with antifouling attributes.
We report the synthesis and physicochemical characterization of Li-doped BiFeO3-graphene nanocomposites (BiFe) followed by their application as cathode catalysts in single-chambered MFCs. The concentration of Li-doped BiFeO3-graphene nanocomposites as catalysts in air cathode MFCs was optimized as the performance of MFCs was evaluated in terms of power production and chemical oxygen demand (COD) elimination and Coulombic efficiency (CE). The [BiFeO3]-graphene composite’s performance is compared to those of [BiFe1−xLixO3]-graphene composites and benchmark Pt/C in terms of ORR activity.

2. Results

2.1. XRD Analysis

The XRD patterns of 5–10-layer graphene, BiFeO3 nanoparticles, and [BiFe1−xLixO3]-graphene nanocomposite are revealed in Figure 1. The XRD patterns of the 5–10 layers of graphene showed the features of the graphite structure, as shown in Figure 1. These XRD peaks were nearly identical to the XRD patterns reported by Seehra et al. in their recent paper exploring the detection and quantification of the 2H and 3R phases [16]. The detection and the quantification of the 2H and 3R phases were based on the intensity of the four Bragg’s lines observed from 2θ = 45° to 47°. The four Bragg’s lines in the region 2θ = 45° to 47° were due to the 2H(100), 3R(101), 2H(101), and 3R(012). The area under the Bragg’ peaks of the two middle 3R(101) and 2H(101) peaks was used to calculate the sample’s comparative concentrations of the 2H/3R phases. The area under the peak’s ratio 2H/3R was close to 60/40 for the sample; it was contingent that the carbon atoms were nearly equally distributed between the 2H and the 3R phases. The sample was best characterized as graphite nanosheets (~10 layers) with a thickness of approximately 10 nm with dozen graphene layers. XRD pattern of BiFeO3 nanoparticles shown in Figure 1 exhibited the expected standard peaks of rhombohedral structure (JCPDS card number 71-2494), indicating the presence of crystalline BiFeO3 phase [17]. The XRD of the [BiFe1−xLixO3]-graphene nanocomposite is also shown in Figure 1. All the diffraction peaks of [BiFe1−xLixO3]-graphene nanocomposites with varying Li content were indexed to the BiFeO3 rhombohedral structure and graphitic (graphene 5–10 layers) nanosheets as well [17]. Additionally, it was observed that all synthesized samples exhibited a similar crystal composition with rhombohedral symmetry, despite the increase in Li content. The BiFeO3 crystallization was influenced by the introduction of graphene and the Li content, as observed by the intensity and broadening of the diffraction peaks. The wide-ranging XRD investigation demonstrated that BiFe1−xLixO3 nanoparticles were intercalated into the graphene nanosheets.

2.2. FESEM Analysis

The field effect scanning electron microscopy (FESEM) technique was used to examine the surface morphology of [BiFe1−xLixO3]-graphene nanocomposite, and their outcome is shown in Figure 2. The FESEM results revealed that BiFe1−xLixO3 particles had a spherical-like morphology (Figure 2a,b), and their sizes were between 50 nm and −130 nm in diameter. With increasing the Li content in [BiFe1−xLixO3]-graphene nanocomposite from 4 to 6%, the size of BiFeO3 nanoparticles was almost similar. However, nanoparticles were agglomerated onto graphene nanosheets with increased Li content, as shown in Figure 2a,b. The BiFe1−xLixO3 nanoparticles displayed relatively substantial agglomeration, which might remain stated to its weak ferromagnetic result. However, the existence of graphene nanosheets over the synthesis progression led to a slight dropping the particle size of the BiFe1−xLixO3 particles, representing well-grown BiFe1−xLixO3 nanoparticles onto the graphene nanosheet. Additionally, the reduction in BiFe1−xLixO3 nanoparticles onto graphene nanosheets was explained by the restricted Bi3+ and Fe3+ ionic motion due to the existence of graphene nanosheets.

2.3. EDXS Analysis

The chemical compositions existing in [BiFe1−xLixO3]-graphene nanocomposite (x = 0.04 and 0.04) samples were identified using energy dispersive X-ray spectroscopy (EDXS), as shown in Figure 2c,d. The EDXS confirmed the presence of Bi, Fe, O, and C for x = 0.04 and 0.06, indicating that no other impurity elements were present in synthesized samples. The EDXS spectrum elemental mapping is shown in Figure 3 for the x = 0.04 and 0.06 samples. The elemental mapping specified the existence of Bi, Fe, O, and C elements in the particular selected expanse, confirming the hybrid formation.

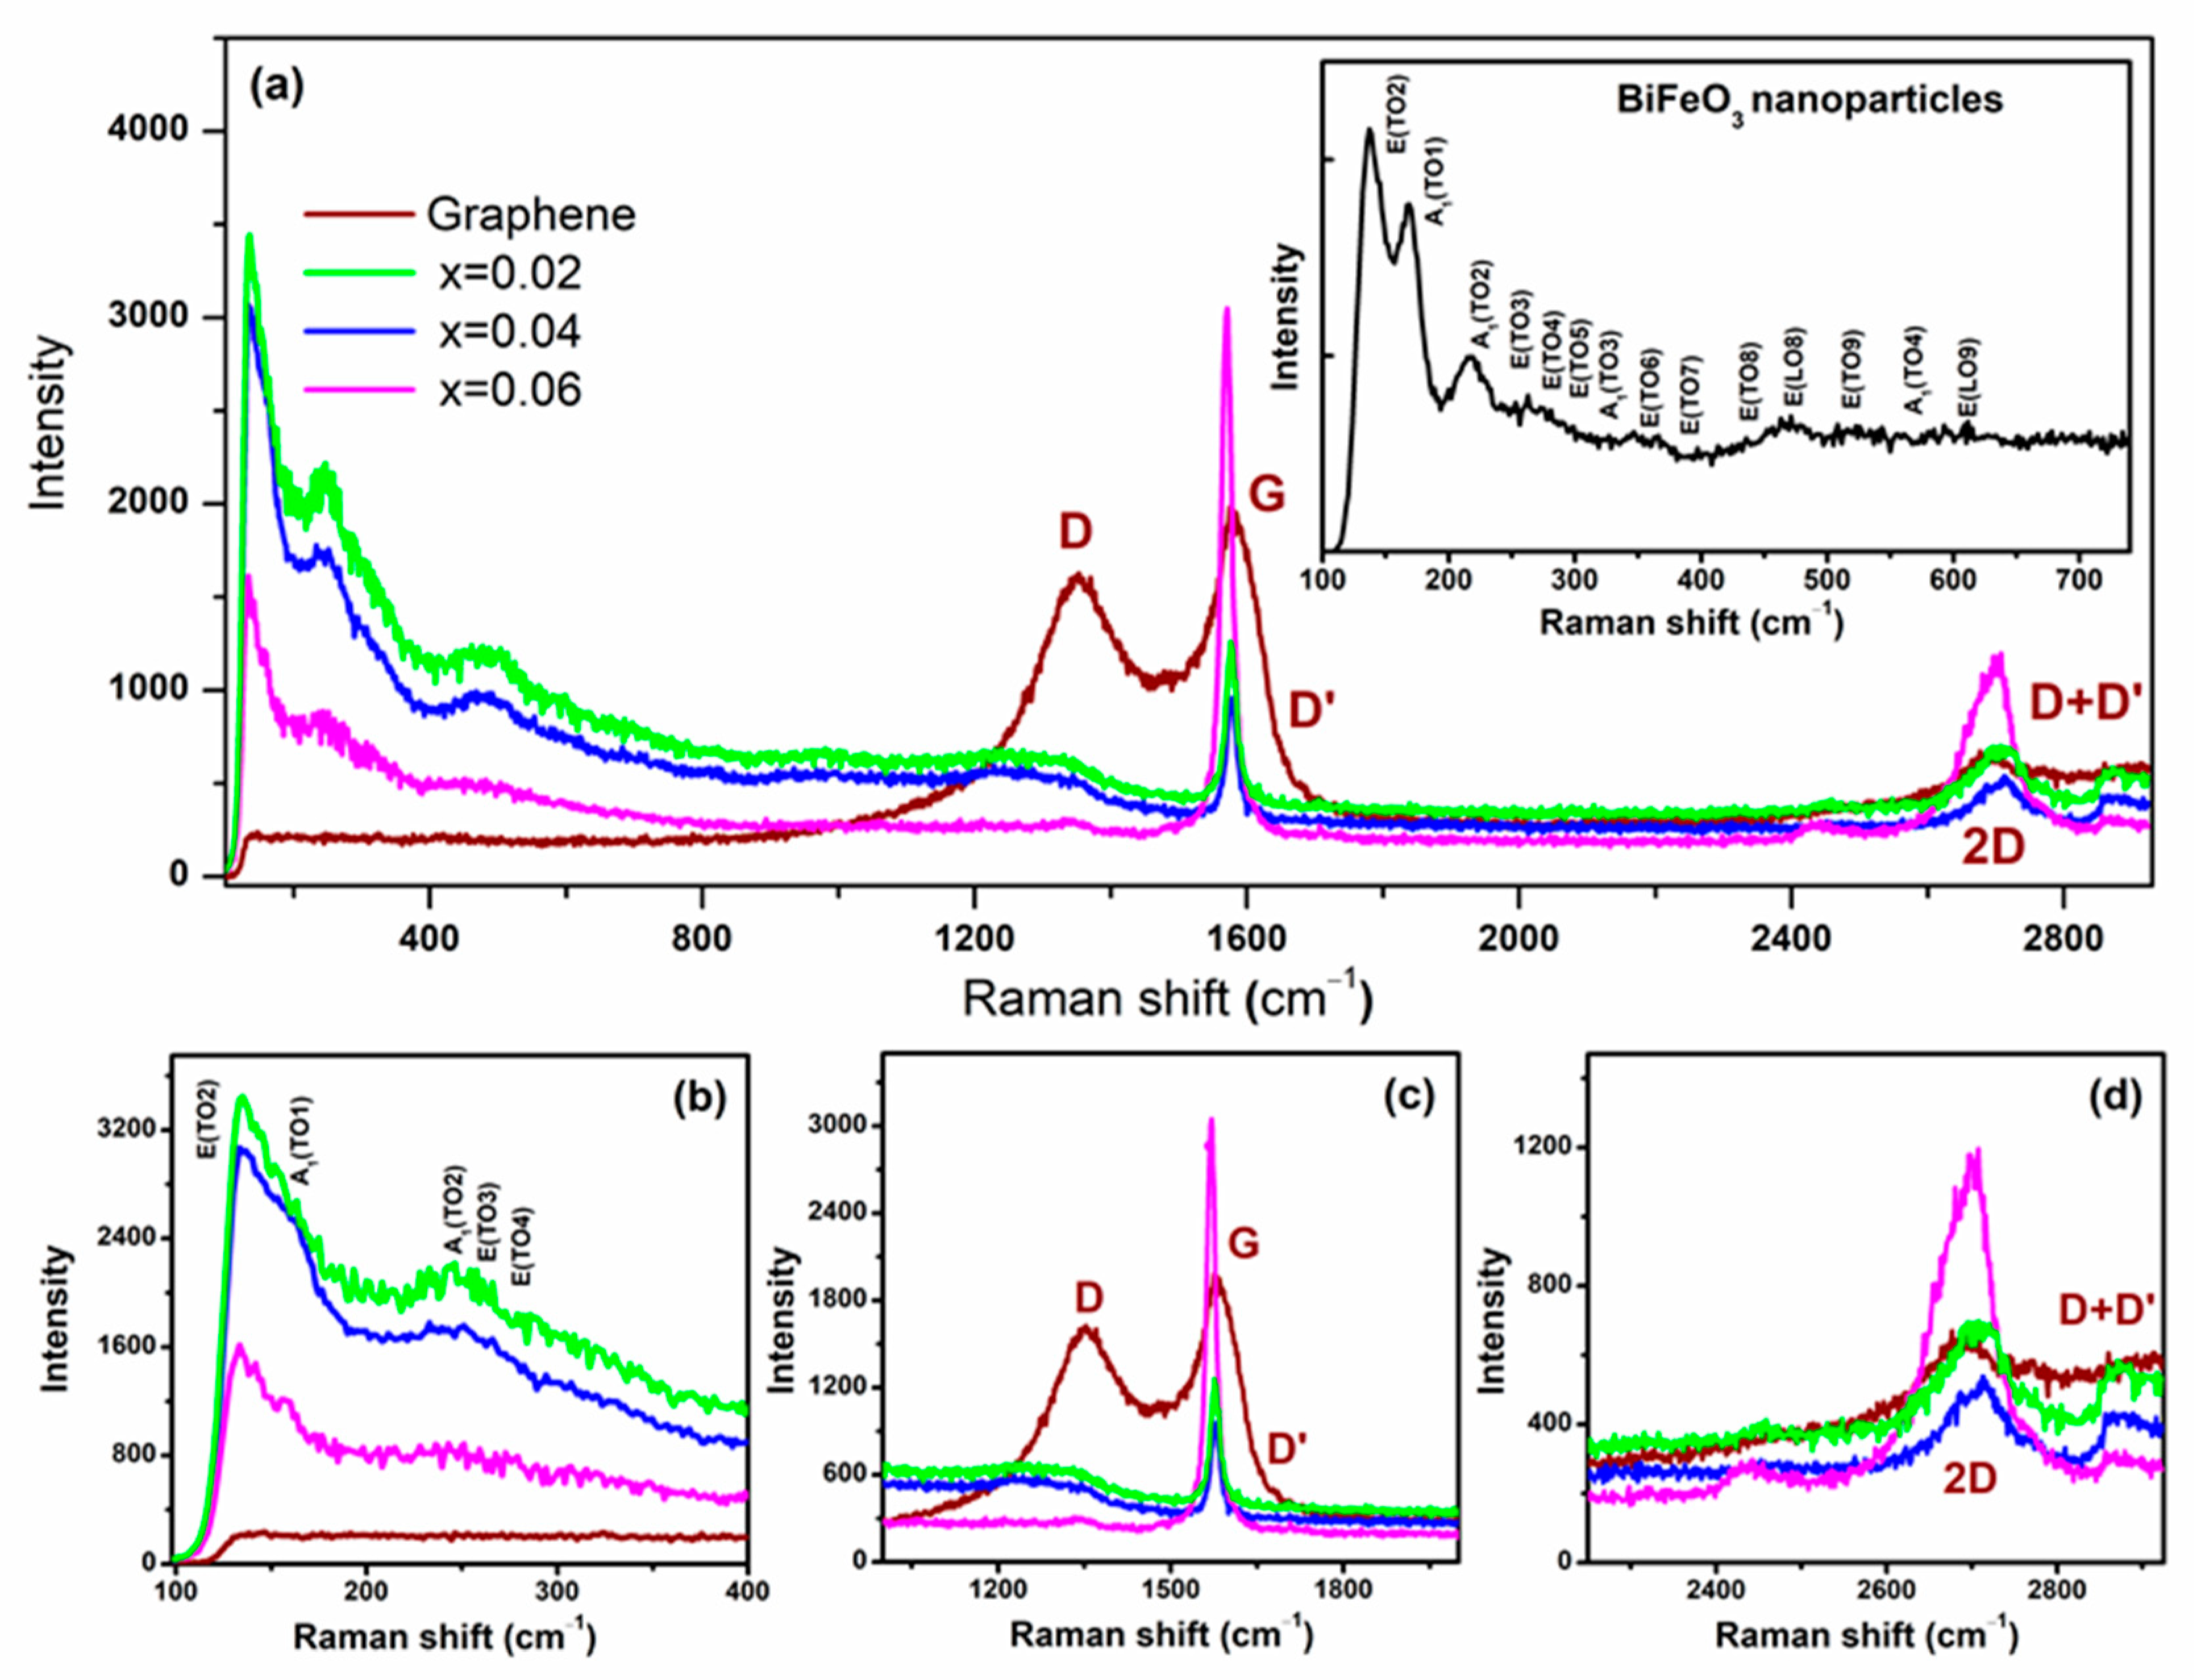
2.4. Raman Spectra Analysis
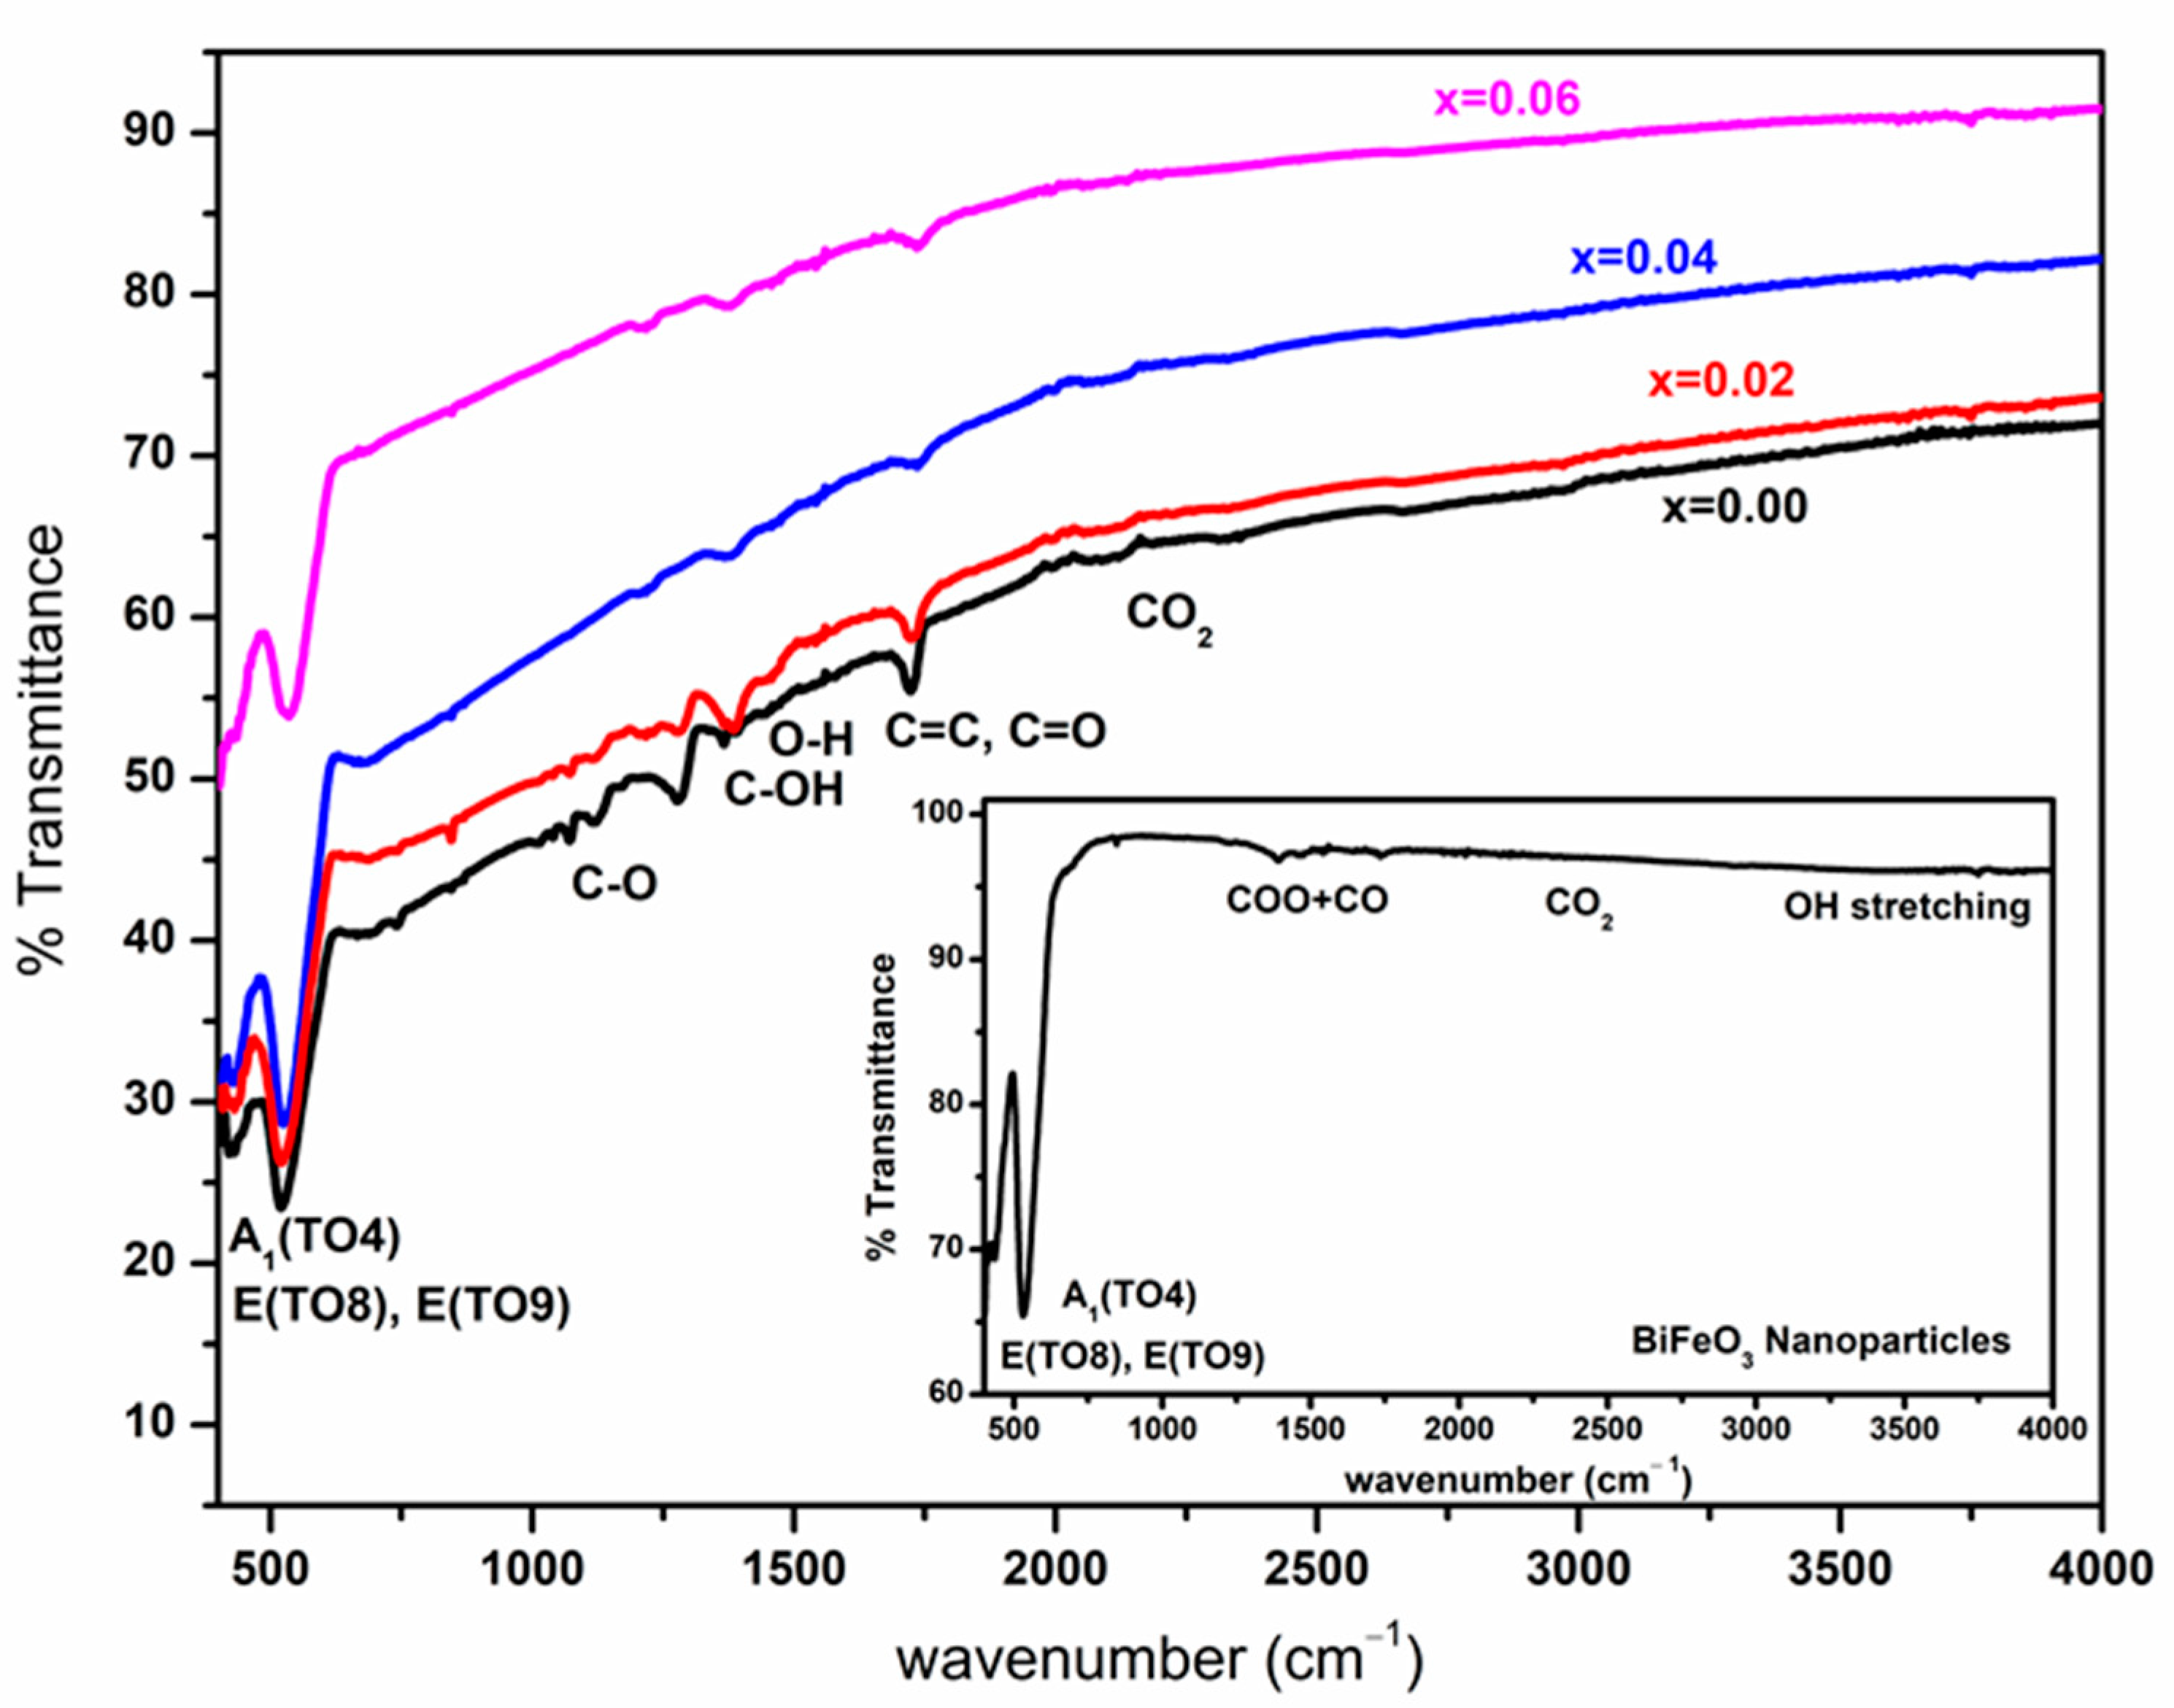
Infrared spectroscopy (IR) is the utmost effective technique in studying the molecular structural properties of oxide materials. The XRD outcomes exhibited distortion in the rhombohedral crystal structure involving the R3c space group for BiFeO3 nanoparticles shown in the inset of Figure 4. As recapitulated, there were 11 TO vibrational modes (three A1(TO) + eight E(TO)) observed in the Raman spectra with BiFeO3 nanoparticles [18,19,20,21]. The Raman spectra showed sensitivity to atomic displacements, and so, the slight shifting and weakened intensity of Raman modes with rising Li1+ concentration in BiFeO3 samples may offer important information regarding lattice distortion, electric polarization, and ionic substitution. The vibration modes of lower wavenumber under 170 cm−1 provided information regarding O motion and Bi atoms showing their intense domination in the modes exceeding 267 cm−1 [18,19,20,21]. The Fe atoms showed prime contribution in modes ranging from 152 cm−1 to 261 cm−1 and contributed to a few higher wavenumber modes. The modes A1(TO1) and E(TO4) governing the Fe–O bond exhibited slight shifting in the higher wavenumber direction with rising Li1+ concentration, demonstrating the entry of the dopants in the Fe site of BiFeO3 nanoparticles. The vibrational frequency of bond Fe/Li-O of BiFe1−xLixO3 nanoparticles was calculated using the band position of modes E(TO1) and E(TO2), respectively, employing ν = (1/2πc)√((K/μ). Symbol ν refers to the wave number, symbol c refers to the velocity of light, symbol K refers to average force constant of the bond Fe/Li. O and the effective mass μ expressed as μ = (MO × [xMLi + (1 − x)MFe])/(MO + [xMLi + (1 − x)MFe]). The symbols MFe, MLi, and MO refer to the atomic weights of Fe, Li, and O, respectively [21]. Using the relation specified here, the effective mass of bonds Fe/Li-O decreased when Li1+ concentration increased, caused by the Li smaller atomic weight compared to the Fe atom. Thus, changes indicated in local structural parameters may be possible only by Li ions incorporation at Fe sites within the BiFeO3 lattice.
The Raman spectra of the 5–10-layer graphene sample are shown in Figure 4, along with the observed peaks mentioned as D, G, D’, 2D, and (D + D′). The vibrational mode D-band nearby 1352 cm−1 and its associated bands 2D and (D + D′) were due to Raman-active defects since the perfect structure of graphite [22]. The vibrational mode G-band nearby 1580 cm−1 represents the graphitic G-band. Raman spectra of [BiFe1−xLixO3]-graphene nanocomposite are displayed in Figure 4a, where the peaks are consistent with BiFeO3 being located in the range of 100–650 cm−1. In addition to the BiFeO3 modes, the D and G modes in the range 1000–1600 cm−1 proved the existence of graphene in the 10% graphene integrated BiFe1−xLixO3 nanoparticles. The observed intensity variation and shift in the D and G bands of [BiFe1−xLixO3]-graphene nanocomposite with increasing Li content suggested that the BiFe1−xLixO3 interfered with the sp2-domains of graphene through the composite synthesis. Such interference can be attributed to defects in graphite nanoflakes. The intensity ratio of Raman D and G bands (ID/IG) was extensively exploited to estimate the excellence of graphene in hybrid materials [22]. Accordingly, the ID/IG ratios were 0.45 for x = 0.06, 0.50 for x = 0.04, 0.51 for x = 0.02, and 0.80 for pure graphene. Therefore, the decreased value of ID/IG for [BiFe1−xLixO3]-graphene nanocomposite with increasing Li content showed a substantial interfacial contact reduction between the BiFe1−xLixO3 and graphene.

2.5. FTIR Analysis

The FTIR spectra observed at room temperature with BiFeO3 nanoparticles are shown in Figure 5. The bonding between inorganic elements resulted in the detection of absorption modes in the 1000 cm−1 range. The three vibration (TO) modes nearing 445 cm−1, 530 cm−1, and 580 cm−1 symbolized as E(TO8), E(TO9), and A1(TO4) ranging between 400 cm−1 and 650 cm−1 were considered as the BiFeO3 characteristics modes. These modes showed conformity with the data of a study previously mentioned herein [20,21]. The vibration bands were observed to be broad because of the absorption peaks of both bonds, Fe-O and Bi-O, being at approximately the same wavenumber. The assignment of wide absorption bands E(TO8) nearing 445 cm−1 and A1(TO4) nearing 575 cm−1 were applied to the bending vibrations for the bond O-Fe-O and stretching vibrations for the bond Fe-O, respectively, observed within FeO6 octahedra. In addition, the assignment of absorbance bands E(TO9) nearing 450 cm−1 and 530 cm−1 were applied to the vibrational modes of Bi-O observed within BiO6 octahedra. The weak wide peak observed nearing 3450 cm−1 represented the stretched vibrations in the O-H group, while two absorption peaks observed nearing 2337 cm−1 and 2362 cm−1 exhibited a relation with the CO2 modes. The reason for this CO2 mode arising may be due to some CO2 trapped within the air ambiance during FTIR characterization. The bands confirmed the presence of a small carbonate phase nearing 856 cm−1 and 1444 cm−1, though XRD patterns could not detect this phase. Several higher wavenumber impurities absorption peaks were observed because of the surface adsorbed organic precursors during the characterization or synthesis process. This large surface-to-volume ratio caused the organic impurities to show the utmost dominating effect in nanoparticles, while in bulk-considered samples, these impurity peaks slowly faded away.
FTIR spectra of [BiFe1−xLixO3]-graphene nanocomposite are displayed in Figure 5, where the peaks were consistent with BiFeO3 located in the range of 400–700 cm−1 with the existence of additional bonds in the range of 800–2000 cm−1 of graphene in the 10% graphene integrated BiFe1−xLixO3 nanoparticles. Analogous to the FTIR spectra of additional oxidized carbon materials such as carbon fiber or amorphous activated carbon, the feeble broad band between 3100 and 3650 cm−1 resembled the existence of the oxygenated groups in the samples [23]. The other bands in the 800–2000 cm−1 were related with the 1396 cm−1 O-H, 1396 cm−1 C-O, 1352 cm−1 C-OH, C=C, C=O around 1700 cm−1, respectively, in [BiFe1−xLixO3]-graphene nanocomposite [22,23]. The intensities of these modes of O–H, C–OH, and C–O groups also varied significantly with the increasing x content. However, oxygen-containing functional groups’ absorption peaks decreased significantly with the Li content in [BiFe1−xLixO3]-graphene nanocomposites.

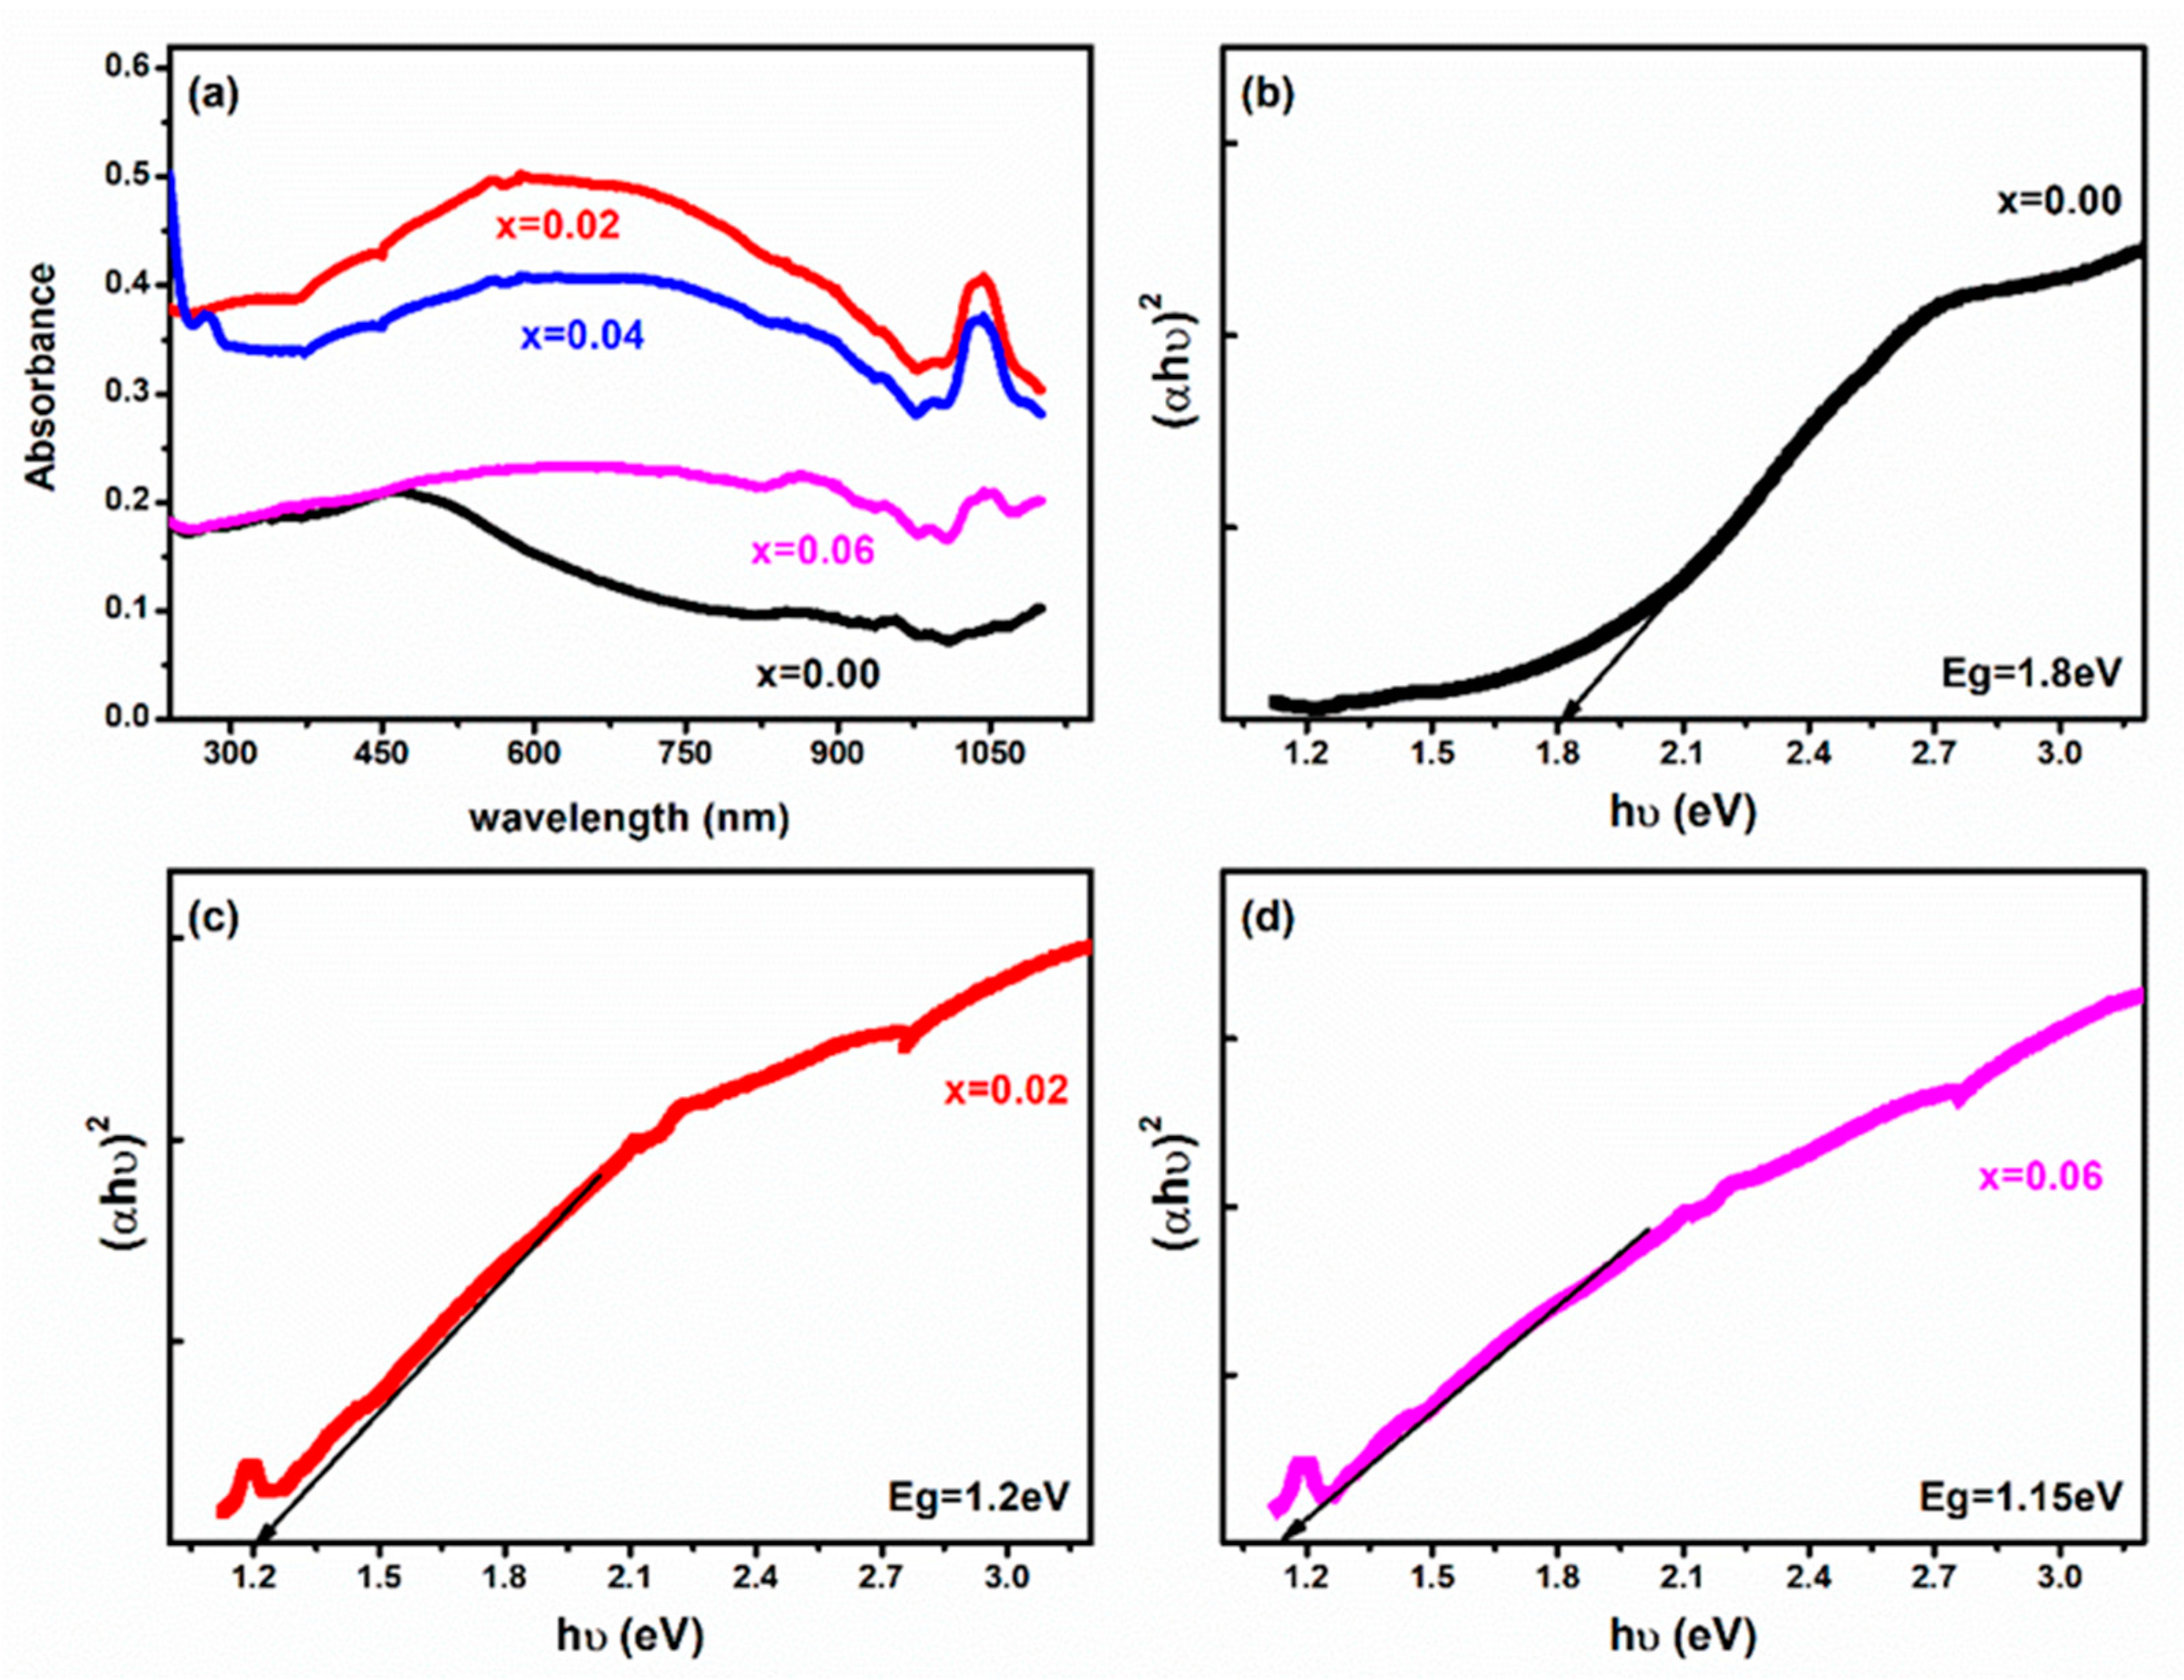
2.6. Optical Properties

The UV-visible absorption spectra of [BiFe1−xLixO3]-graphene nanocomposite (x = 0, 0.02, 0.4 and 0.6) samples are shown in Figure 6. Due to the inherent bandgap absorption, [BiFe1−xLixO3]-graphene nanocomposite exhibited full-spectrum absorption across a wide range of 250–1100 nm. The light absorption of the as-prepared x = 0.02 samples dramatically increased in the region 200–800 nm compared to the x = 0.00 sample. The greater absorption band of the [BiFe1−xLixO3]-graphene nanocomposite implied that more light may be absorbed to create electron-hole pairs and, subsequently, enhance the photocatalytic properties of the [BiFe1−xLixO3]-graphene nanocomposite. A similar type of behavior was observed in BiFeO3/rGO nanocomposites, as reported by Kadi et al. [17]. The band gaps of [BiFe1−xLixO3]-graphene nanocomposite samples were calculated by using the Tauc’s Plot ((αhν)2 vs. hν), as displayed in Figure 6b–d. According to the Tauc’s Plots (ahv)2 = hv − Eg, the estimated optical band gap energies (Eg) were 1.80 eV, 1.7 eV, 1.2 eV, and 1.15 eV, for x = 0.00, 0.02, 0.04, and 0.06 samples, respectively. The optical band gap of pristine pure BiFeO3 nanoparticles was 2.22 eV reported in our previous papers. The addition of graphene and Li content in BiFeO3 nanoparticles changed the band gap from 1.8 eV to 1.15 eV due to the intercalation of graphene sheets with the BiFeO3 nanoparticles and change in the electron density of BiFeO3 with the Li doping. The analysis of absorption data confirmed that the [BiFe1−xLixO3]-graphene nanocomposite has good photocatalytic performance in the presence of UV-visible region of the electromagnetic spectrum.

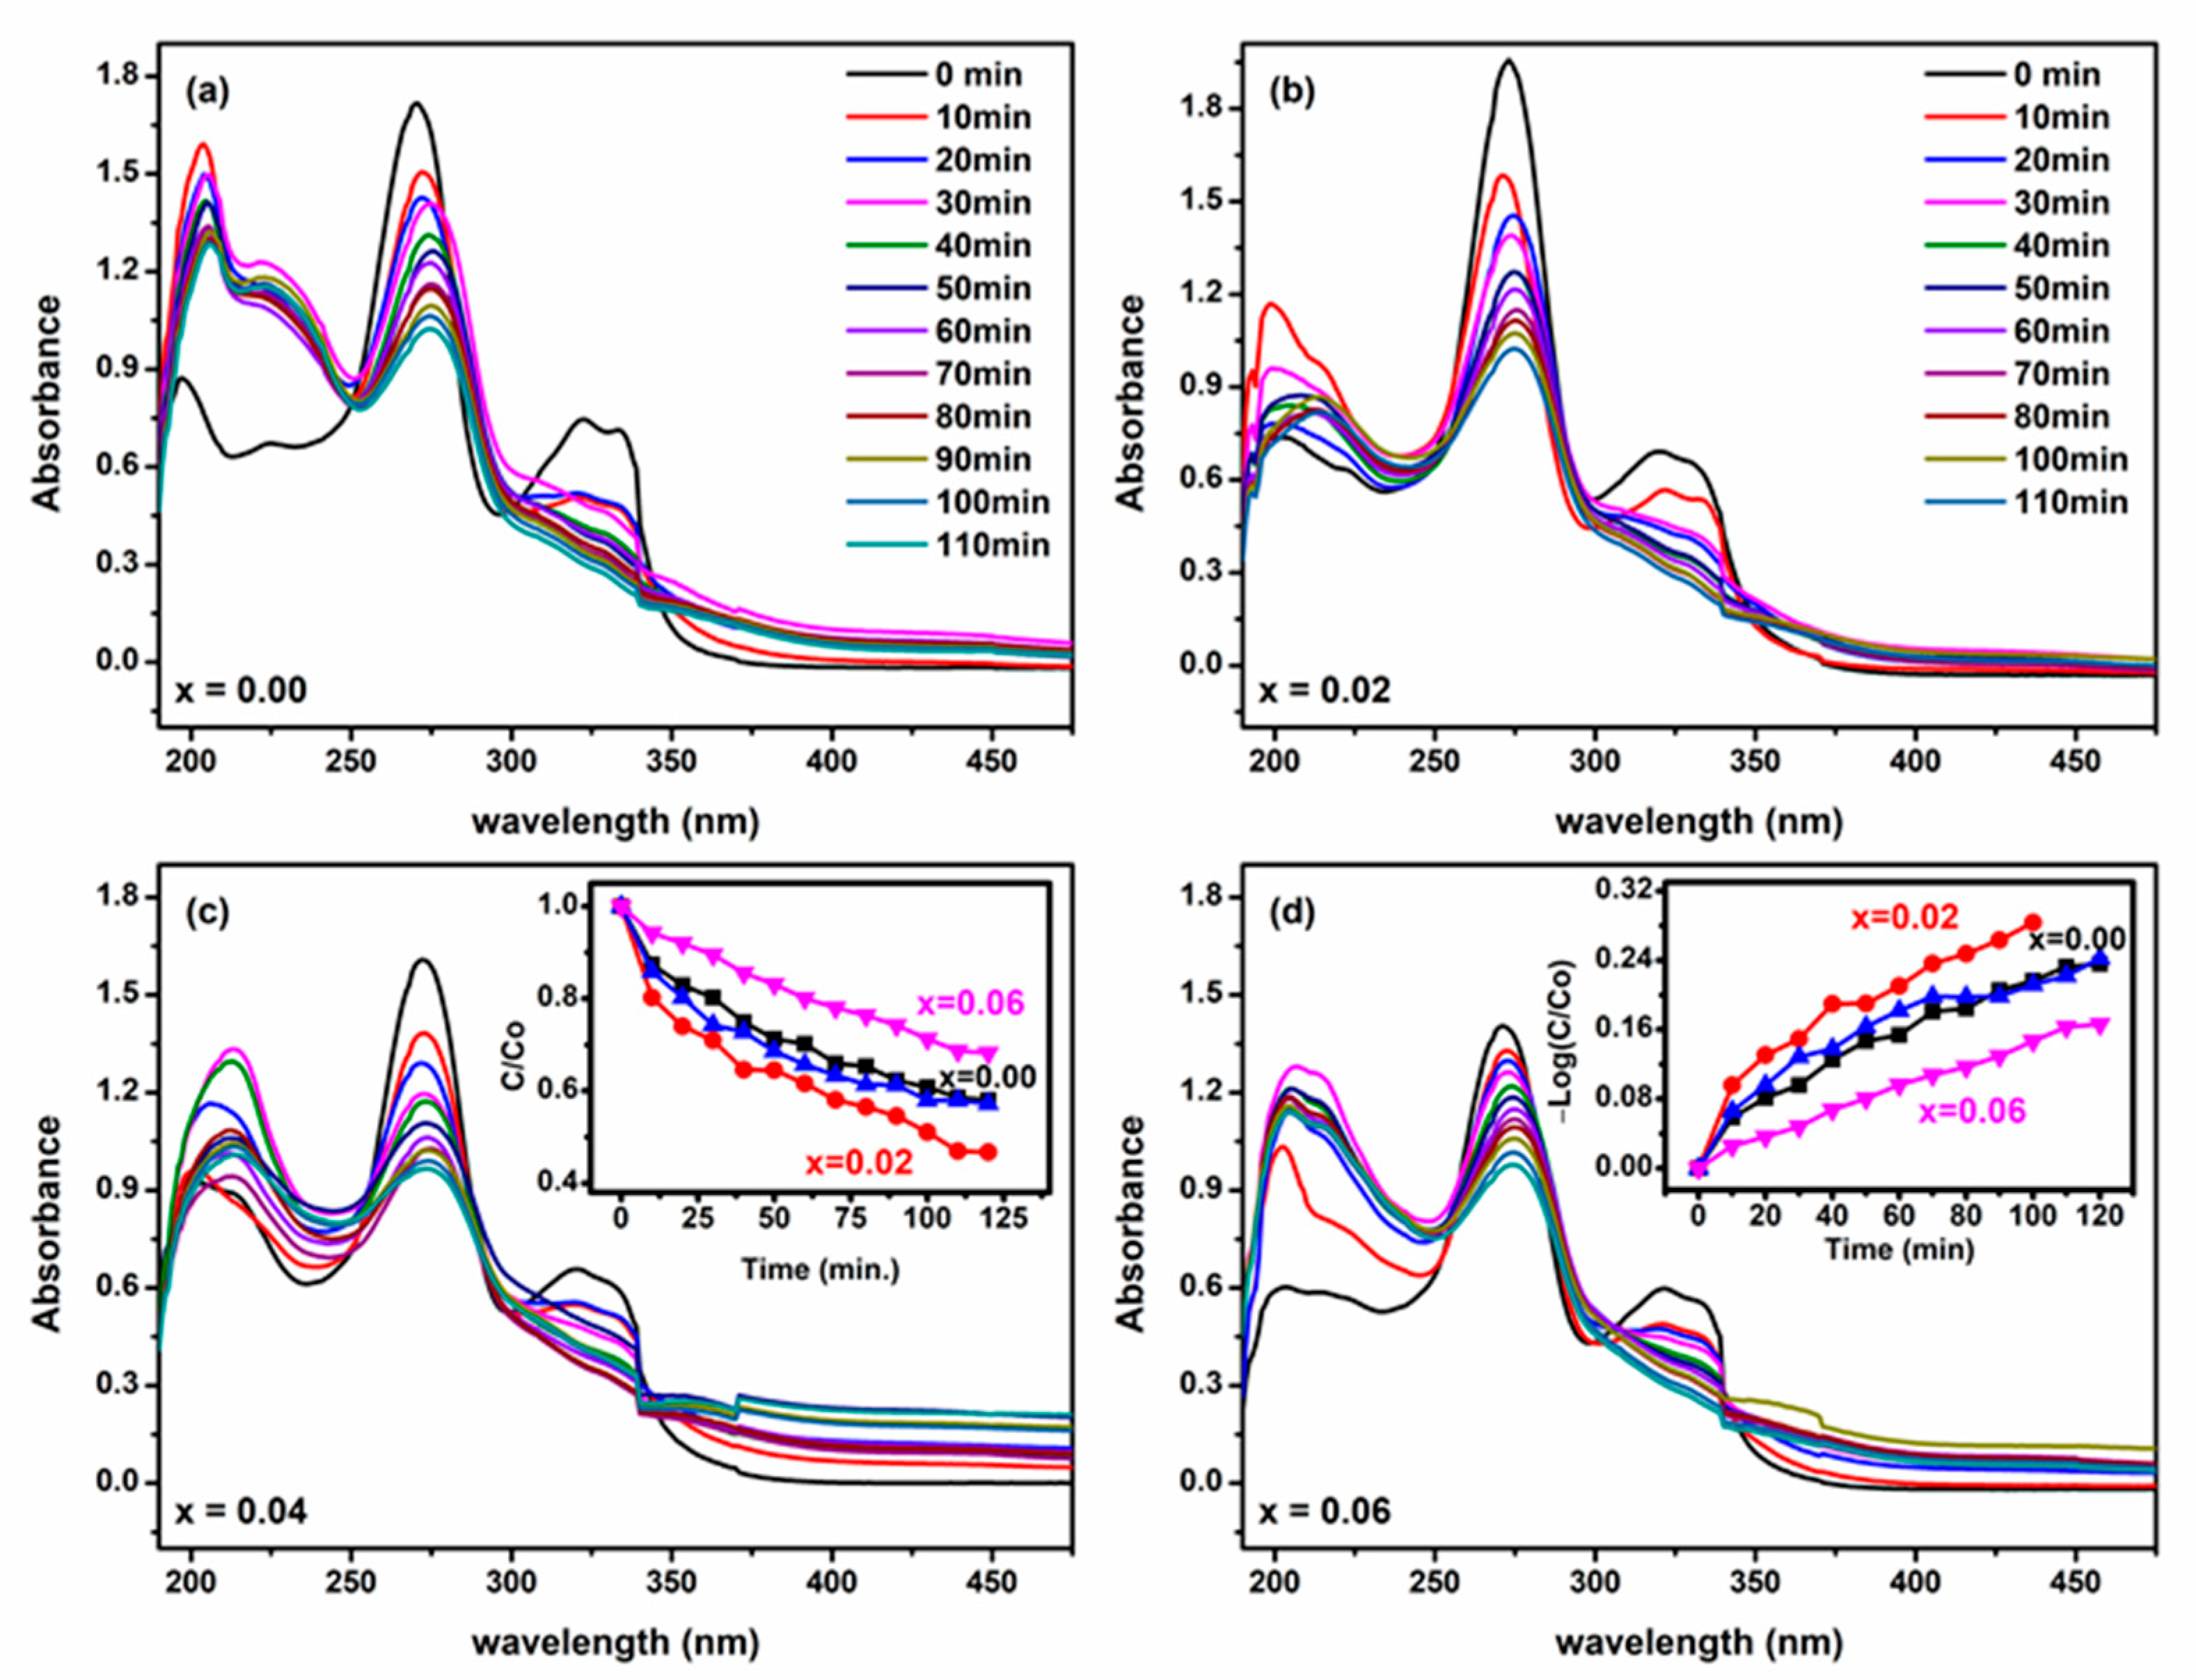
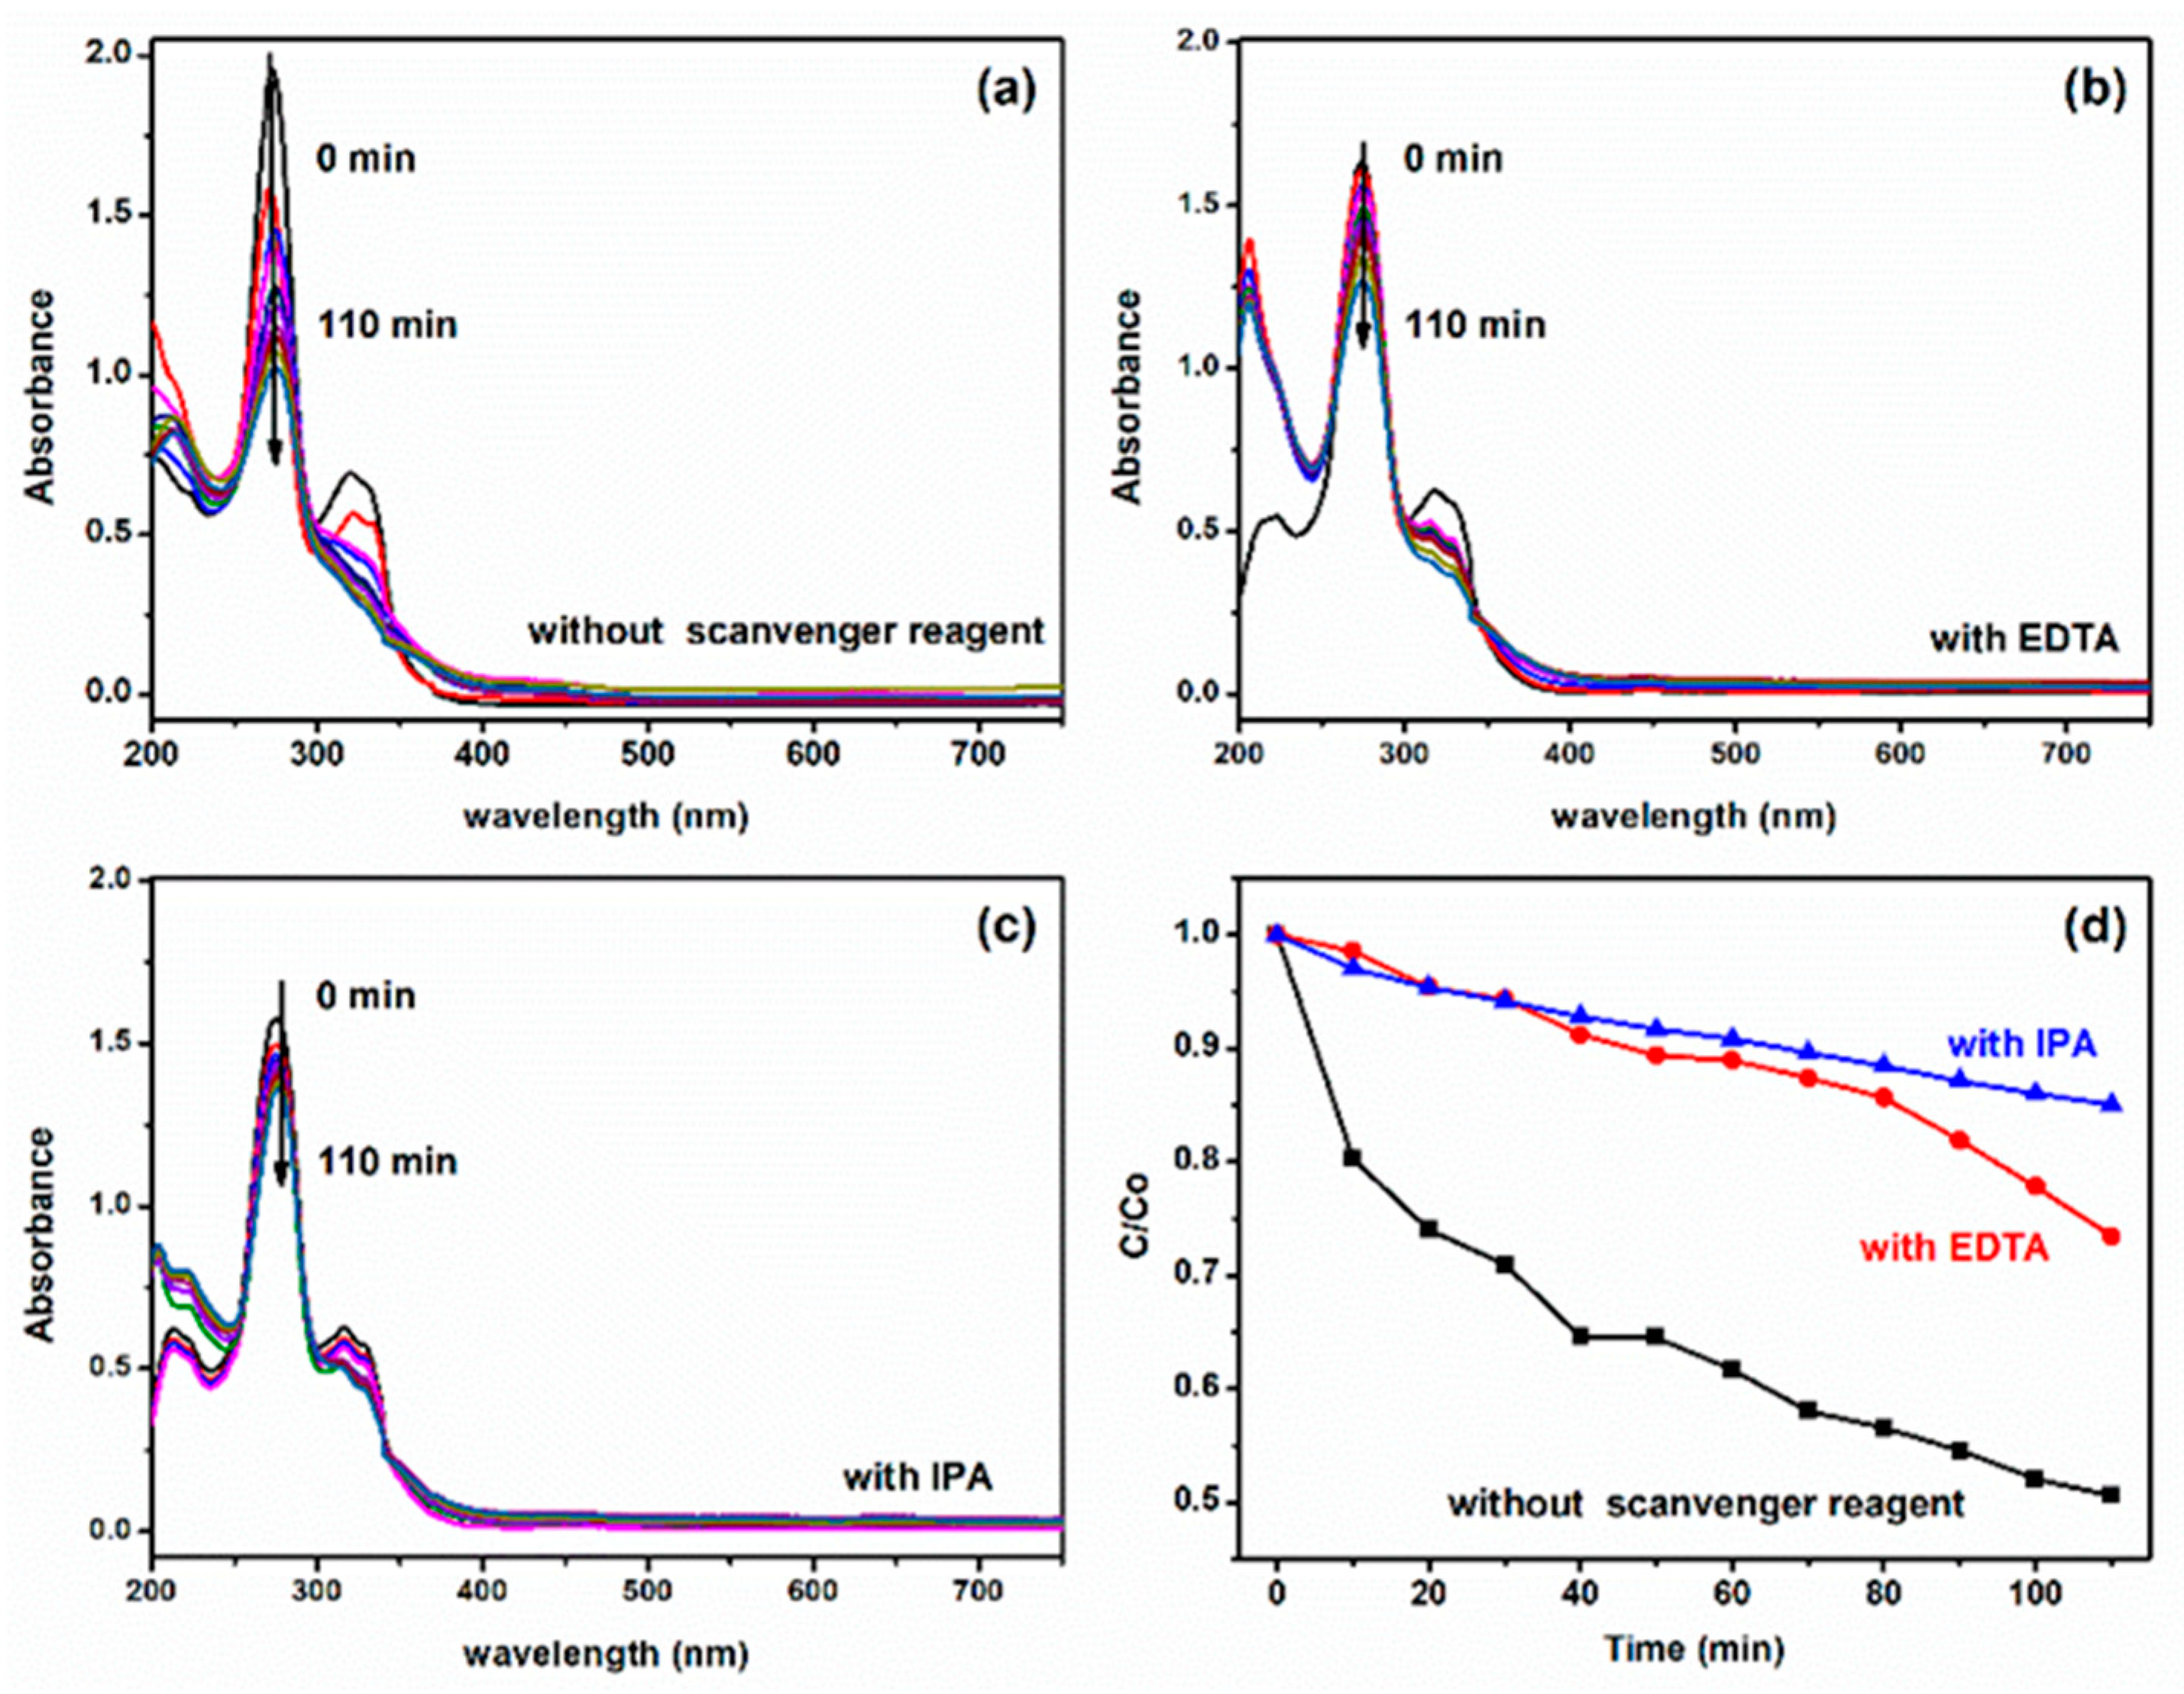
2.7. Photocatalytic Activity

The photocatalytic activity of the [BiFe1−xLixO3]-graphene nanocomposite for the diminishment of CIP under the UV-visible light irradiation below 10 °C temperature conditions was studied and is represented in Figure 7. The CIP degradation was performed in the presence of a 150-watt mercury lamp in a specifically designed photoreactor system that prevented outer heat and light. Figure 7 represents the variations of the absorbance spectra for CIP antibiotics under UV-visible light irradiation using [BiFe1−xLixO3]-graphene nanocomposite photocatalysts. The CIP degradation ability of the catalyst was inconsistent with the change in the value of x from 00.00 to 0.06 in prepared samples. The photocatalytic efficiency was 42% for x = 0.00, 53% for x = 0.02, 42% for x = 0.04, and 31% for x = 0.06 within 110 illuminations. In contrast, the pristine BiFeO3 nanoparticles showed only 21%. The maximum degradation observed for x = 0.02 was obtained, i.e., 53% of the CIP was degraded within only 110 min irradiation time. The photocatalytic performance was more than double that of pure BiFeO3 nanoparticles. The graphene greatly modulated the bandgap of BiFeO3, as discussed in the optical properties, and the covalent bonding between BiFeO3 and graphene was responsible for the enhanced photocatalytic properties. The band gap of the BiFeO3 nanoparticles can be modulated with the graphene oxide and reduced graphene oxide reported by Kadi et al. [17]. The catalytic activity of BiFe1-xLixO3-Graphene nanocomposite sample (x = 0.02) against CIP has been also studied as shown in supplementary materials Figure S1. No significant degradation is observed without light for x = 0.02 sample.
The superior photocatalytic efficiency performance of [BiFe1−xLixO3]-graphene nanocomposite x = 0.02 might be due to some effects such as rapid CIP diffusion into mesopores to the active site, OH production, and reduced light scattering. CIP could also be adsorbed onto the surface of graphene through π–π stacking due to the substantial π-conjugation planes of graphene. The kinetics of the photodegradation reaction was represented by a pseudo-first-order equation as follows: −ln(C/Co) = kt, where Co and C are initial concentration at time zero and at a particular time during photocatalytic reaction and k is the apparent rate constant shown in the inset of Figure 7c,d. As shown in Figure 7d inset, the k value was maximum (0.0024/min) for x = 0.02 sample. For x = 0.02 in [BiFe1−xLixO3]-graphene nanocomposite, a weak interface conjugating was formed between BiFe1−xLixO3 and graphene due to weak Fe-O-C bonding, which restricted the transport of photoproduced electrons upon illumination [17]. This weak interface conjugating then showed an increase in photocatalytic performance at low BiFe1−xLixO3 content.
The photocatalytic activity of [BiFe1−xLixO3]-graphene nanocomposite (x = 0.02) for the degradation of CIP with or without trapping agents was completed under a 110 min exposure to UV-visible light. Figure 8 shows the photo-activity of x = 0.02 photocatalysts under UV light in the presence of trapping agents EDTA as h+ scavenger and IPA as OH scavenger during the subsequent 110 min duration (10 min intervals). The CIP concentration was reduced by adding [BiFe1−xLixO3]-graphene nanocomposite (x = 0.02) photocatalysts with EDTA or IPA, but the rate of degradation was not the same as without trapping results. Both scavenger agents captured the active species during the photocatalytic reaction and, due to this, the antibiotic degradation process decreased. In absorption curves, it was demonstrated that the addition of IPA with photocatalysts, the degradation activity was highly reduced, which revealed the role of .OH radicals. However, the .OH radicals were not only responsible for CIP degradation. The addition of EDTA with catalysts also showed the reduction in photodegradation of CIP, which shows the participation of h+ during the photocatalytic activity. During the trapping experiment, it was observed that saturation condition also occurred after some time intervals, which verified the role of O2 radicals in CIP degradation.
The comparative kinetic graphs of x = 0.02 photocatalysts for CIP degradation, without using a trapping agent and in the presence of trapping agents (EDTA and IPA), verified the significant role of active species in a photocatalytic reaction, as shown in Figure 8. The results showed that holes and superoxide oxygen radicals were mainly responsible for CIP degradation. We have also completed the studied on the structural properties of the catalysts before and after photocatalytic activity. The XRD and the FTIR results of the [BiFe1−xLixO3]-graphene nanocomposite are represented in supplementary materials Figures S2 and S3. No structural changes have been observed after the photocatalytic activity for the x = 0.02 sample.

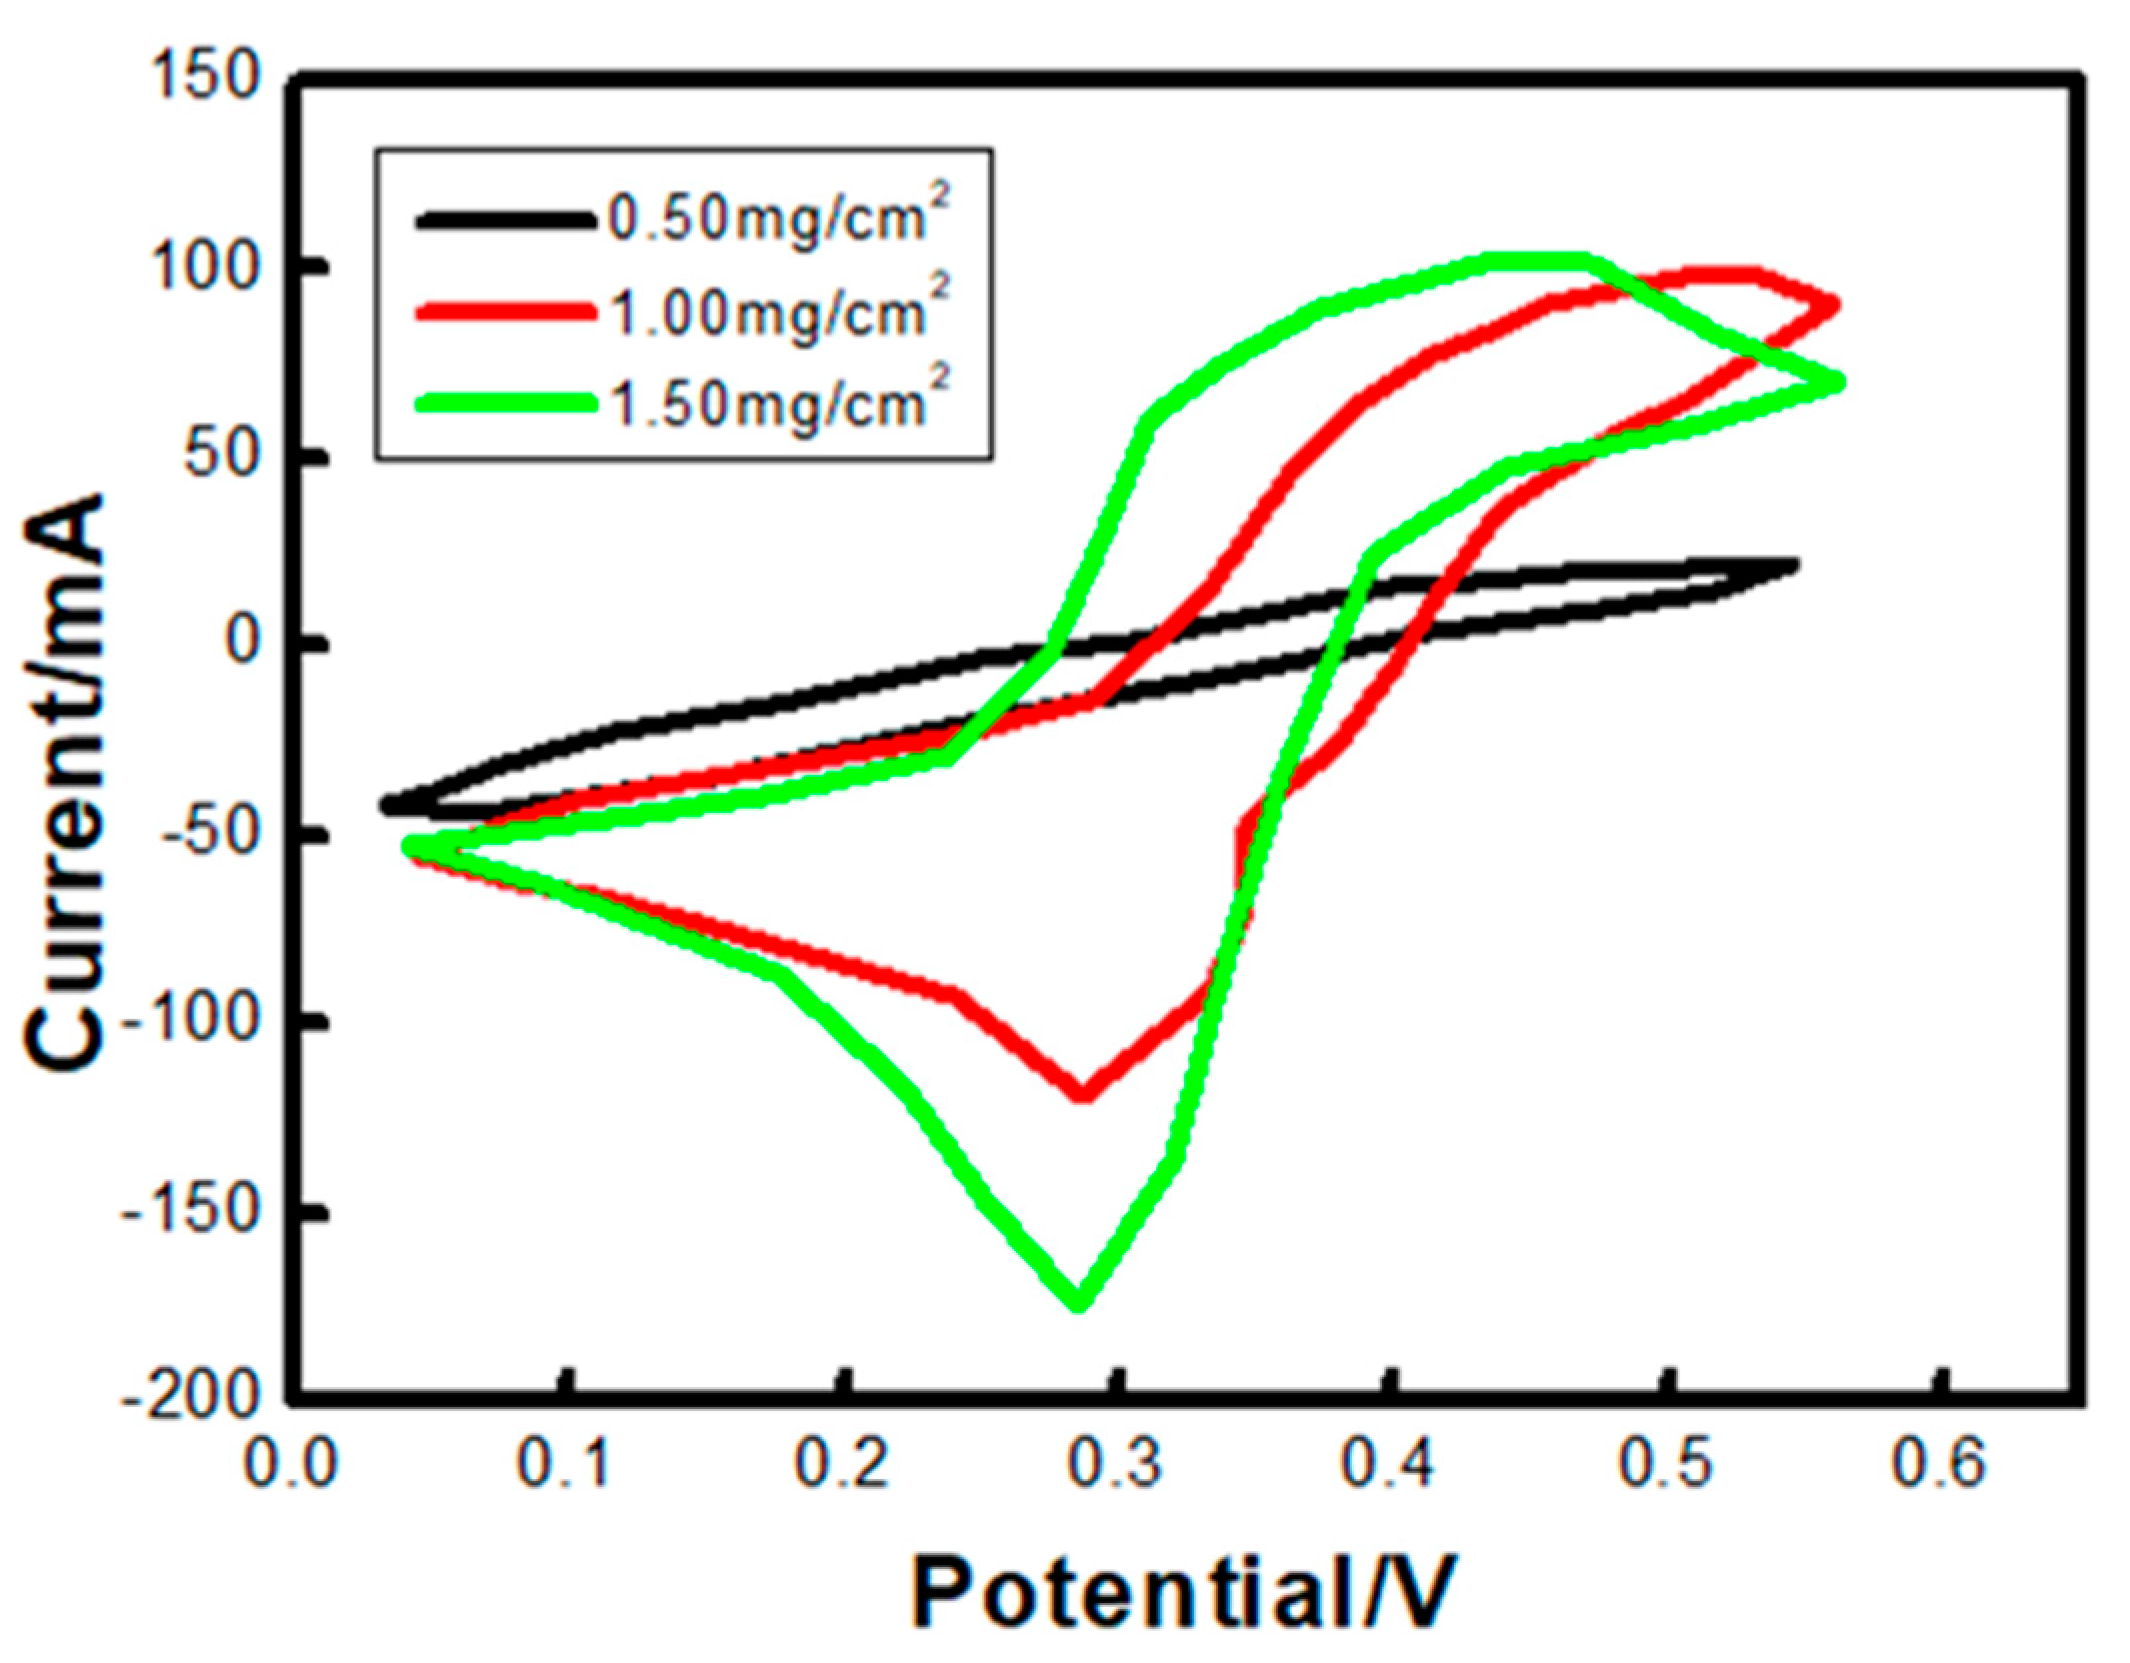
2.8. Electrochemical ORR Activity of [BiFe1−xLixO3]-graphene Composite Electrodes

Various electrochemical approaches, including CV, can be used to examine the mechanism of the ORR. For the reduction of O2 to OH2, two separate ORR processes were discovered, and both routes competed with one another. These two mechanisms were (i) a four-electron process that directly combined oxygen with electrons and protons (Equation (1)), which, when coupled with anode oxidation, produced water as the end product, and (ii) a less efficient two-step process, a two-electron pathway involving the hydrogen peroxide ion (HO2) as an intermediate (Equation (2)), followed by either two-electron reduction in HO2 (Equation (3a)) or disproportionation in the reaction medium (BiFe favors the four electron ORR route and prevents corrosive peroxide production).
O2 + 4H+ + 4e ⇒ 2H2O
O2 + 2H2O + 2e ⇒ H2O2 + 2OH2
2HO2 + H2O + 2e ⇒ 3OH2
2HO2 ⇒ 4OH2 + O2
By performing CV in an air-saturated 1.0 M KCl solution, one could examine the ORR activity of the as-synthesized [BiFe1−xLixO3]-graphene composite catalyst-coated cathode. The composite catalyst [BiFe1−xLixO3]-graphene displayed a distinct oxygen reduction peak at 0.28 V, as shown in Figure 9, in the presence of a dissolved saturated solution. However, no peak was observed in N2 saturated solution.
The identical oxygen reduction peaks for as-synthesized [BiFe1−xLixO3]-graphene composites were discovered to be at 0.28 V. The shift of the oxygen reduction peak to a less negative potential might be due to an increase in the overpotential. With the large active surface area, low diffusion resistance to protons, and easy electrolyte penetration through 1.5 mg/cm2 of [BiFe1−xLixO3]-graphene, the composite catalyst [BiFe1−xLixO3]-graphene can be considered useful composite catalyst. The higher current that was observed and the lower negative potential were both caused by the ORR. Again, the separation between the cathodic and anodic peaks was found to be the maximum for the less concentration of the [BiFe1−xLixO3]-graphene electrode (0.35 V).

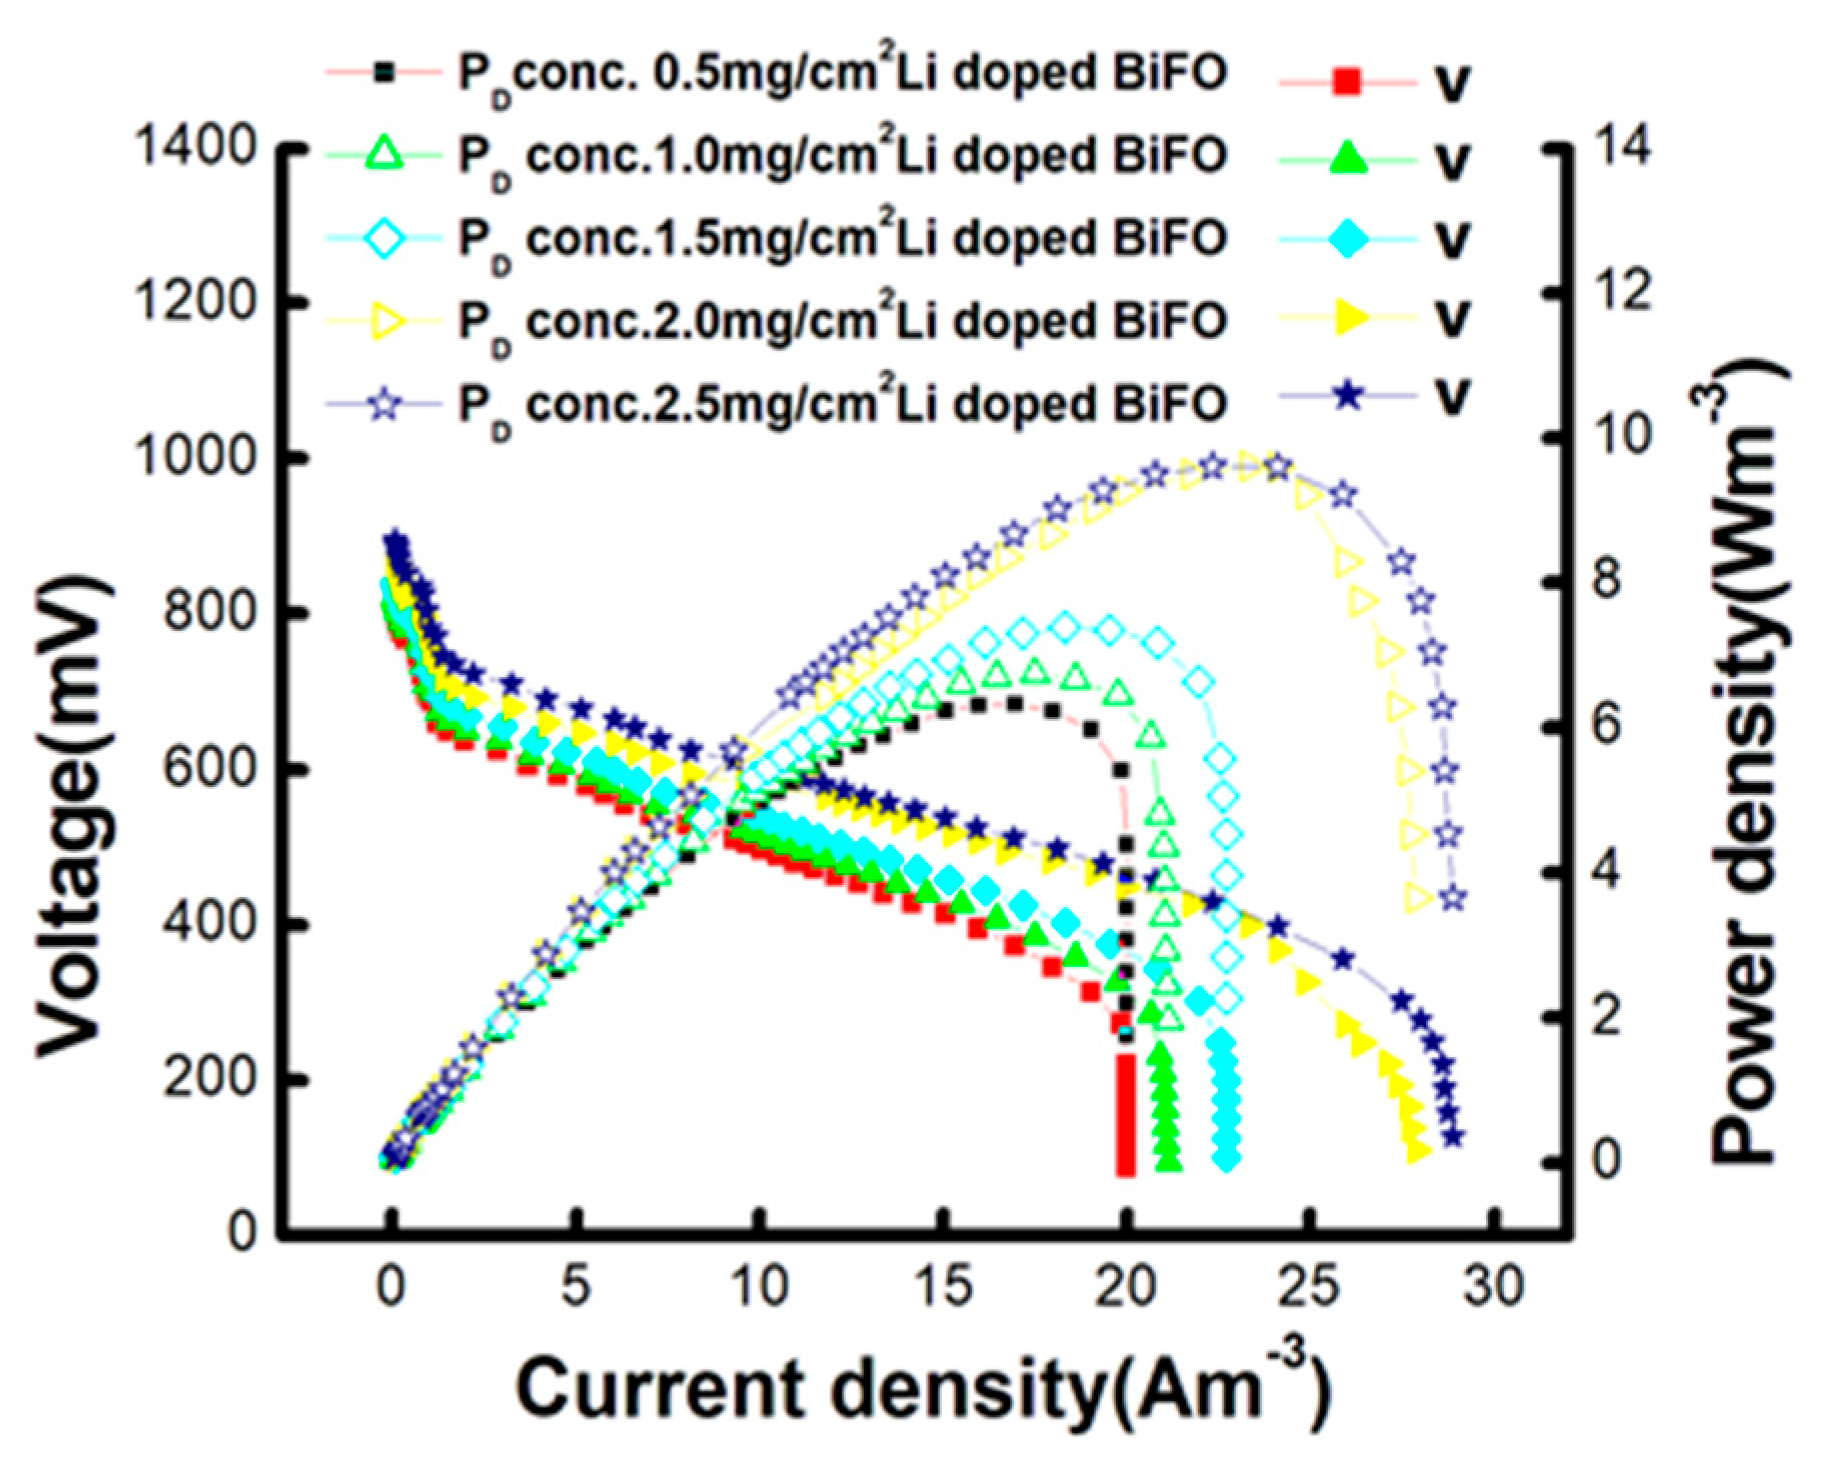
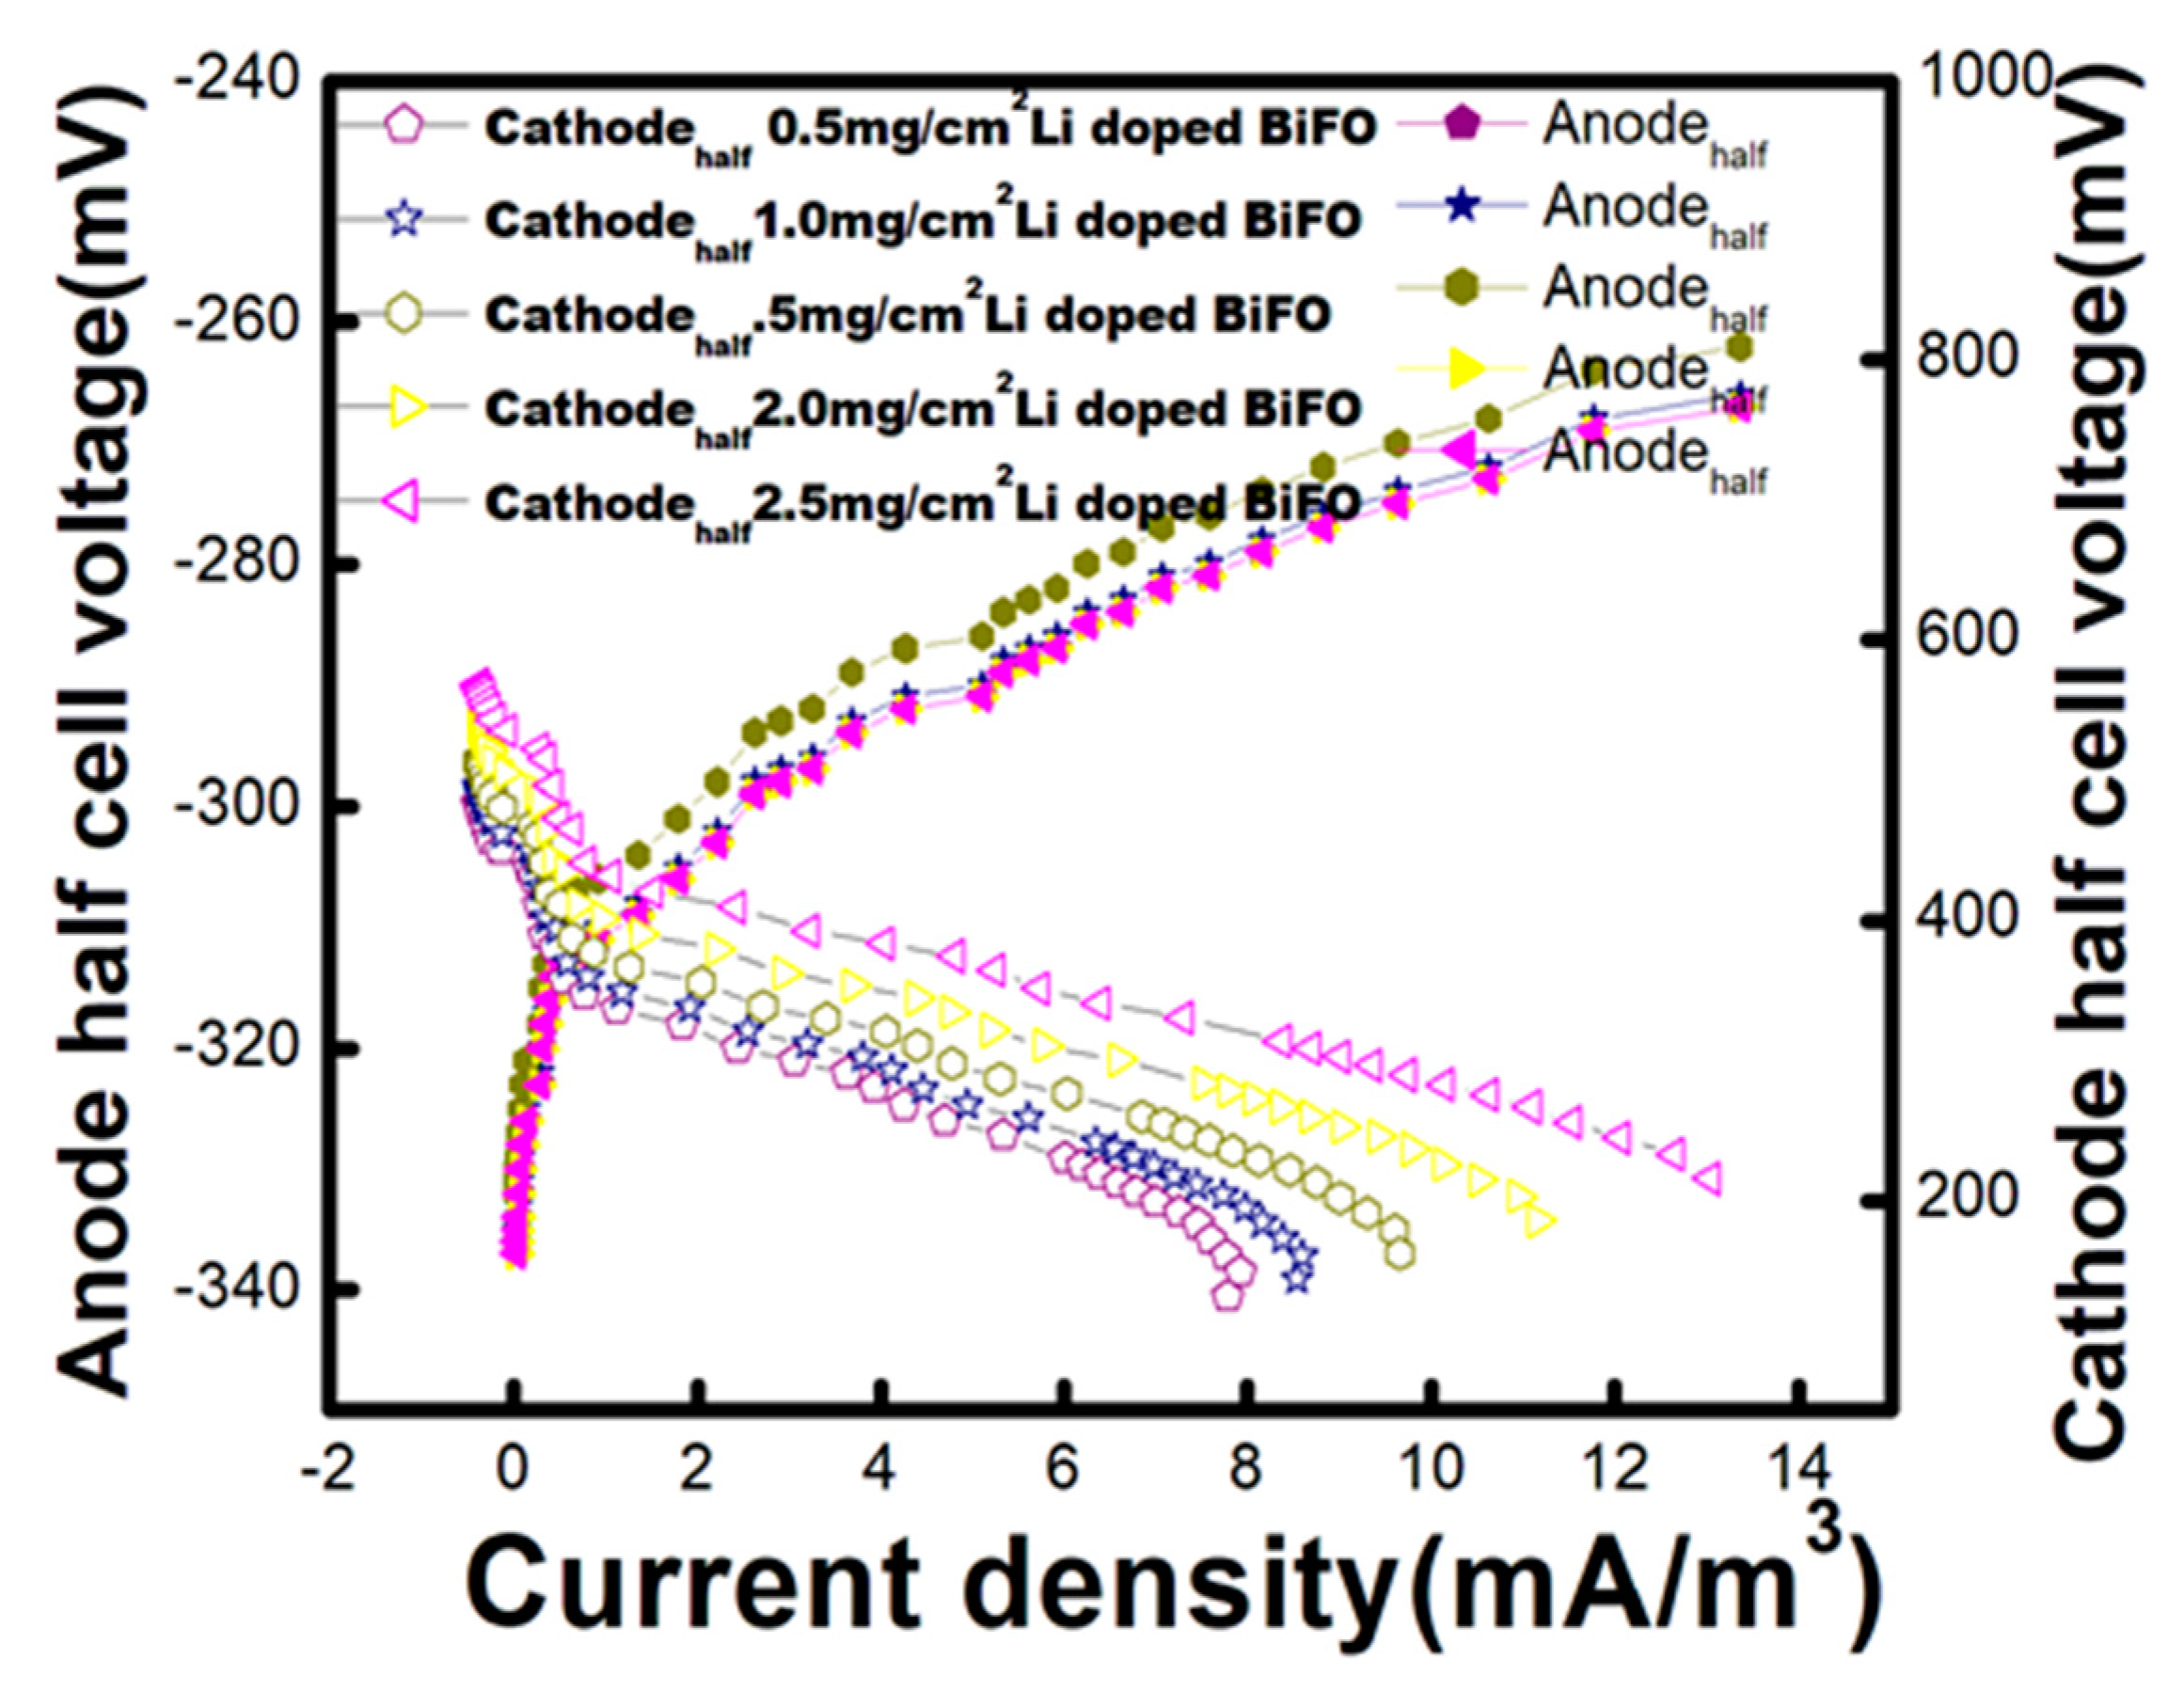
2.9. Power Generation from M.F.C. Having [BiFe1−xLixO3]graphene Composite Loaded Cathode

The five single-chambered MFCs were operated in a fed-batch mode where each cycle was operated for 36 h (±2 h). The pH of the synthetic wastewater was maintained at 7.0 ± 0.2. For an initial 1 h, synthetic acetate wastewater was initially supplied into the anaerobic anodic chamber of the MFC without any inoculation [24]. In the absence of inoculum, no current generation was observed. An anodic half-cell potential of ±191 mV with respect to the Ag/AgCl reference electrode was recorded, indicating the absence of biotic response in the anode chamber. An anaerobic culture at Sharda University, Greater Noida, was used to inoculate the anodic chamber [25]. The optical density of the Pseudomonas aeruginosa PA1_NCHU used in these experiments was 0.5. The MFC was run under closed-circuit mode (Rext = 100 Ω) at an ambient temperature (34 ± 2 °C). Following inoculation, the anodic half-cell potential started to drop, as anodophiles were donating electrons to the anode to continue their respiration. The anodic and cathodic half-cell potential was measured using reference electrodes in MFCs. All MFCs plateaued at around −264 ± 5 mV (vs. Ag/AgCl) against an external resistance of 100 Ω. The performance of the anodic half-cell was stabilized after four cycles.
By impregnating 0.5, 1.0, 1.5, 2.0, and 2.5 mg/cm2 of BiFe1−xLixO3 to the graphene-loaded cathode, the impact of the loading of BiFe1−xLixO3 to graphene (constant conc. of 3 mg/cm2) was investigated on the production of power in MFC. After the MFC attained a constant maximum in their OCP, polarization investigations were carried out. By changing the external resistance from 30 Ω to 90 kΩ, the corresponding polarization curves of the MFC, as illustrated in Figure 10, were produced. It was discovered that power generation dropped as external resistance increased, which is normal fuel cell behavior [26]. Additionally, it was discovered that with MFCs using a catalyst-free cathode, the potential drop occurred extremely quickly at reduced external resistance [27].
An amount of 2.5 mg/cm2 BiFe1−xLixO3 was found to be most effective with maximum OCP (965 mV) and Pdmax (8.2 W/m3). However, only a 1.24% improvement was shown when the amount of BiFe1−xLixO3 was increased from 2.0 to 2.5 mg/cm2 cathode catalyst. So, 2.0 mg/cm2 cathode catalyst can be considered as optimized concentration to make the process sustainable. Higher catalyst concentration might increase thickness of cathode, consequently increases resistance owing to the nonconductive nature of BiFe1−xLixO3. MFC having cathode loaded with 2.0 mg/cm2 [BiFe1−xLixO3]-graphene composite produced 8.1 W/m3. This results showed that an increase in catalyst composite beyond On the contrary, the lowest volumetric power density (Pd, max) of the MFC cathode using just graphene without ORR catalyst [without BiFe1−xLixO3, i.e., catalyst-free] was 0.57 W/m3 (not shown in the figure). The Pd max of the MFC was recorded to 5.77, 6.37, and 6.32 W/m3, respectively, by loading 0.5, 0.1, and 1.5 mg cm2 BiFe1−xLixO3 into graphene [28] (Figure 9). A significant improvement (more than twice as much) in the Pd, max was demonstrated by increasing the BiFe1−xLixO3 catalyst amount from 0 to 0.5 mg cm2. The maximum open circuit potential (OCP), CE, and COD elimination efficiency were tested. As the amount of BiFe1−xLixO3 loaded into the graphene increased, the internal resistance dropped. It can be concluded that the BiFe1−xLixO3 content in the composite electrode substantially impacted the MFC’s ability to generate electricity [29]. The increased oxygen reduction kinetics at the cathode surface was responsible for the decrease in internal resistance with BiFe1−xLixO3 loading. Graphene is a good choice compared to other forms of carbon because of its higher surface area, and superior electronic conductivity. Therefore, the combined impact of the BiFe1−xLixO3, high crystallinity, and superior electrochemical characteristics may be used to explain the high Pdmax found in the current work (ORR activity and excellent charge transport) [30].
A noticeable change in the cathodic half-cell potential was observed with various catalyst loadings BiFe1−xLixO3 in the MFC’s air cathode. The shift in cathodic potential relative to the anodic half also impacted MFC power output (Figure 11). The rapid fall in cathodic potential in the case of the catalyst-free cathode might be due to poor reaction kinetics. Because of the intense ORR activity of BiFe1−xLixO3 and the better electrical characteristics of graphene, similar current density from the [BiFe1−xLixO3]-graphene can be observed [31]. The cathodic half-cell potential was also measured in the cases of BiFe1−xLixO3-based electrodes. It was discovered to rise with time, in contrast to numerous other cathodes where the cell potential falls over time [32]. The rise in catholyte pH in the presence of the cation exchange membrane (CEM) was responsible for increased cathodic half-cell potential. This is due to the catholyte’s migration of other cations (such as Na+ and K+) rather than protons. In a recent study, Cheng et al. and Qian et al. found that MnO2 performed better than control ORR in alkaline conditions. Since most cation species were transferred from the anode to the cathode due to the concentration gradient, the pH imbalance is an observable phenomenon in the case of MFC [33].

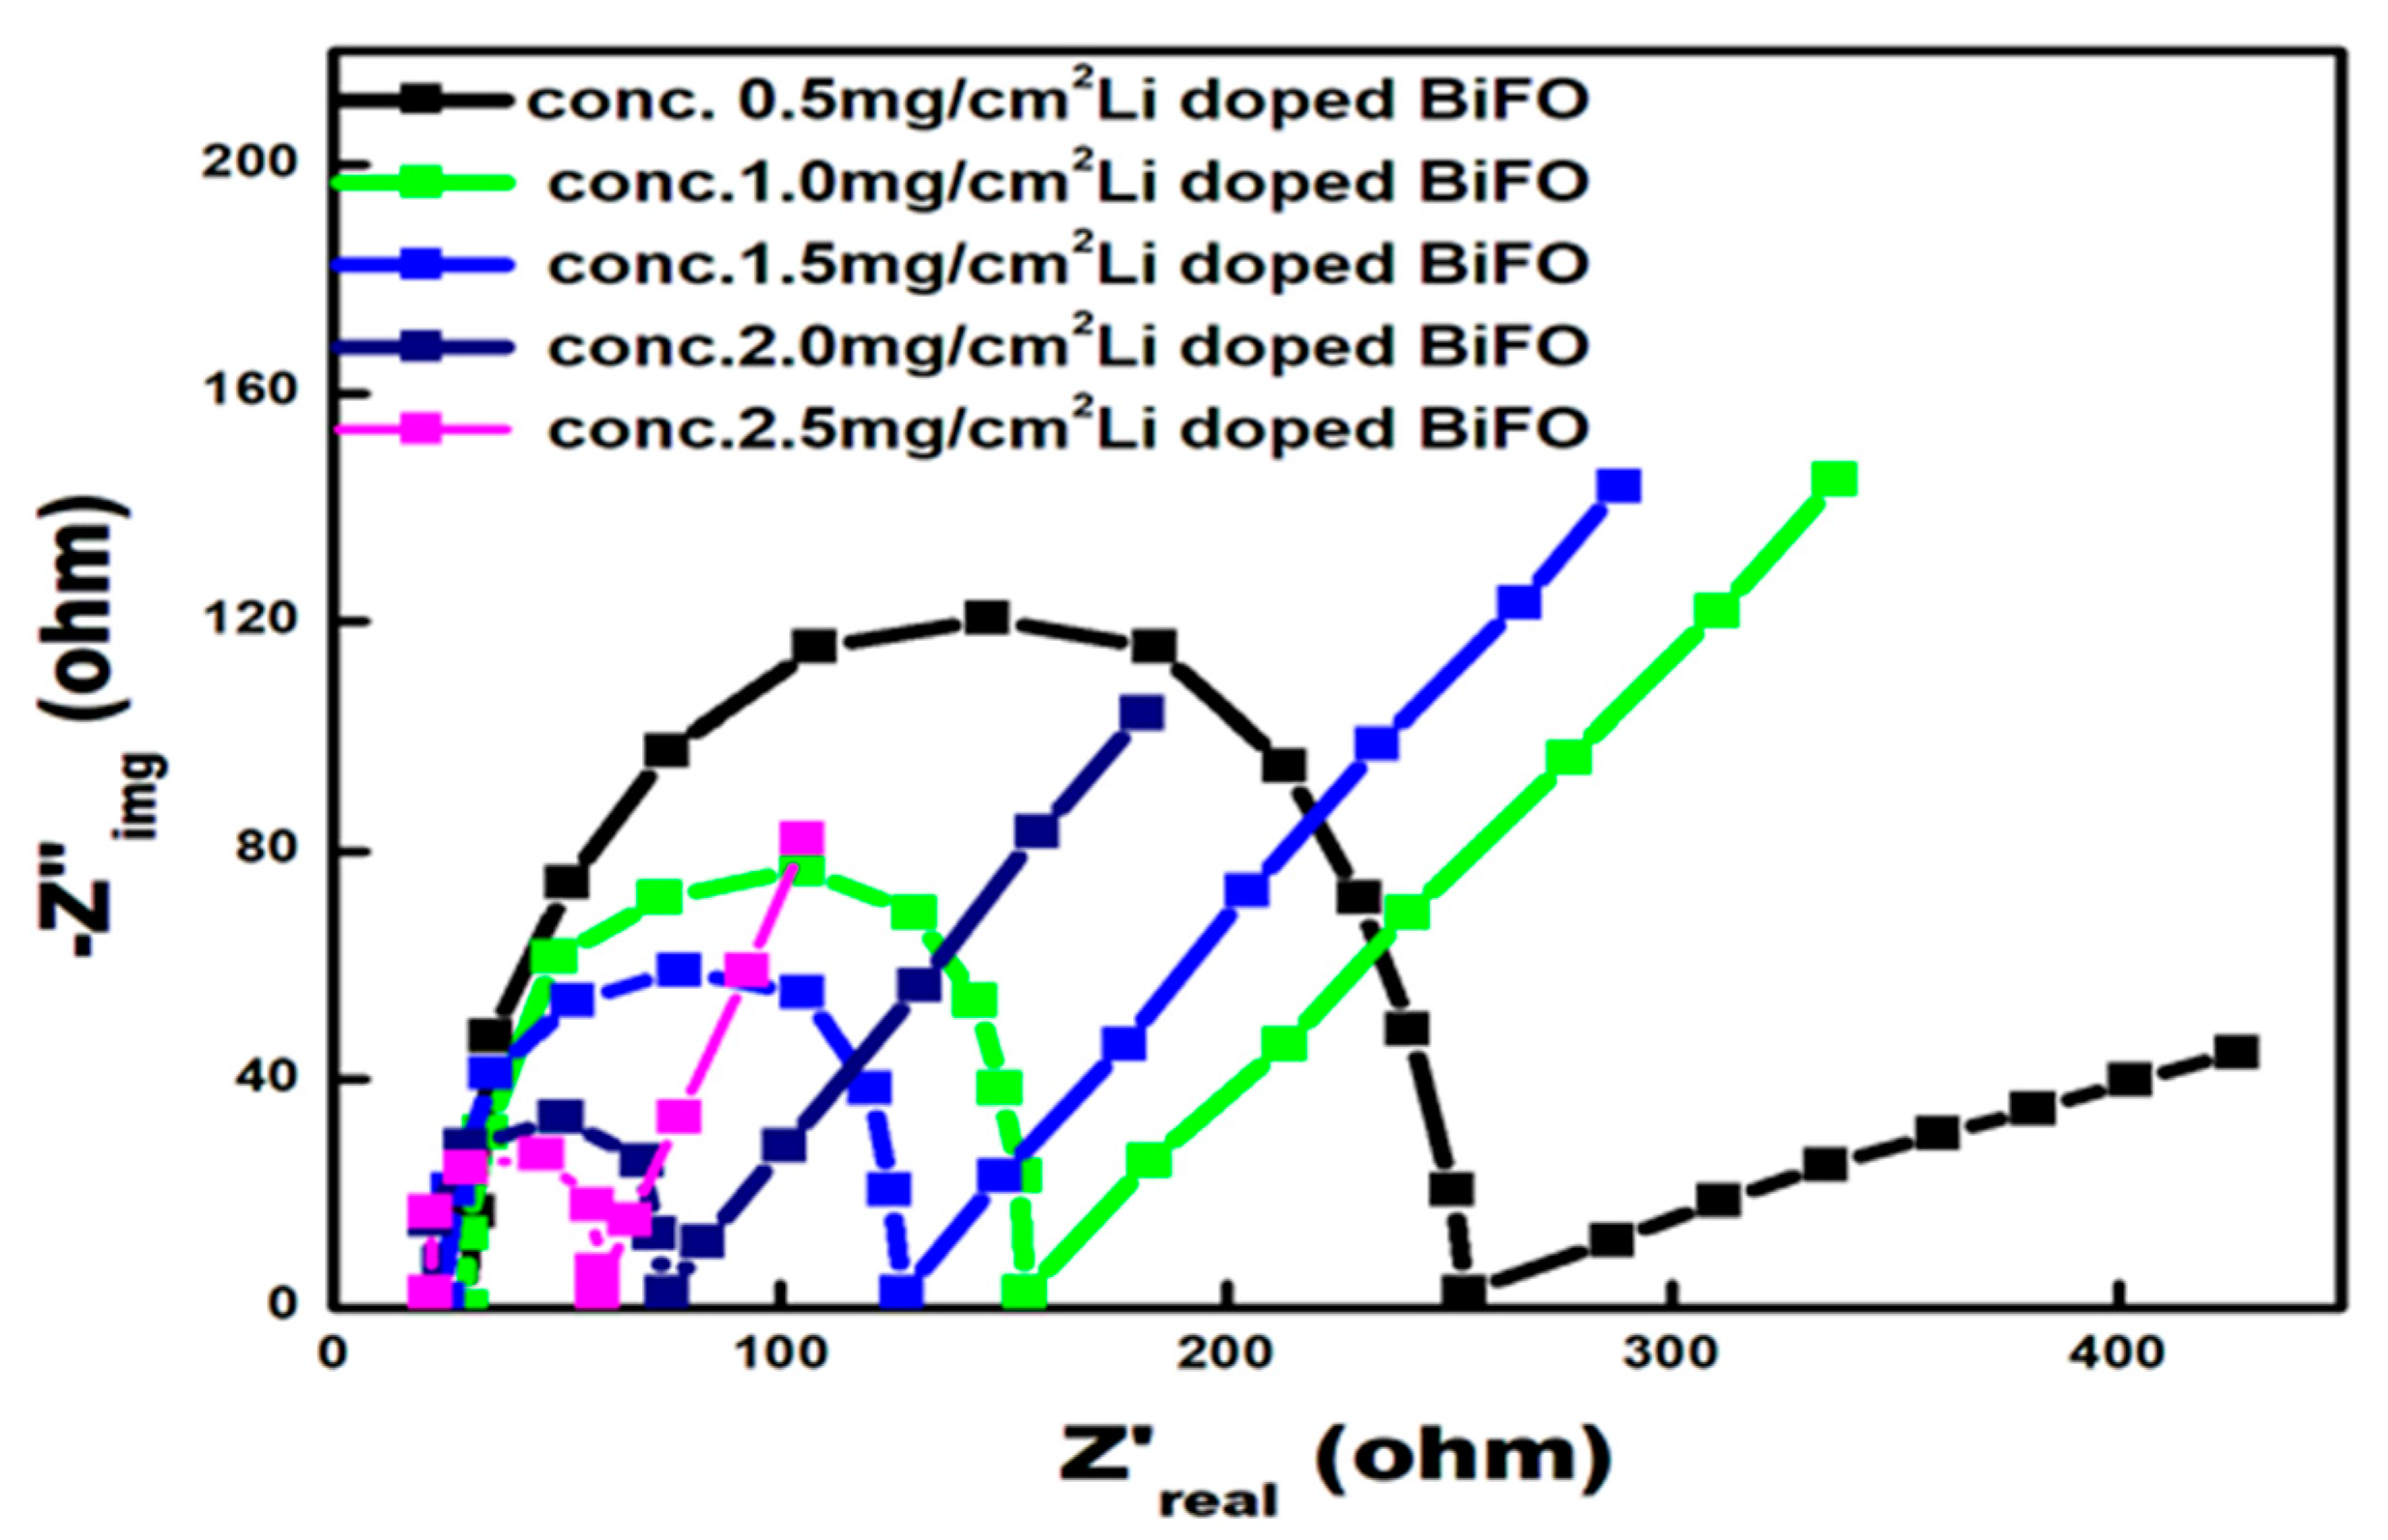
2.10. EIS Analysis for Charge Transfer Resistance

The charge transport behavior of electroactive materials at the electrode/electrolyte interface is frequently assessed using EIS analysis. The interfacial electrochemical characteristics of the electrode are often studied using Nyquist plots (imaginary component vs. actual component of impedance). Figure 12 shows the Nyquist plots for the anode on the 8 weeks of operations with different catalyst-loaded cathodes. The Nyquist plot had a semicircle and a linear portion, representing charge-transfer and diffusion resistance, respectively. This implies that the electrochemical reaction on the biofilm was mix-controlled by the charge transfer and diffusion step. The experimental spectra were fit into equivalent circuits to evaluate the impedance data. The BioLogic SP-150 potentiostat was used to record the EIS data. The Nyquist plots of graphite sheet cathode coated with various electrocatalysts are shown in Figure 11. Each plot had a clearly defined semicircle in the higher frequency range, followed by a straight line in the lower frequency range. The diameter of the semicircles may be used to determine each electrode’s charge transfer resistance (Rct). The interfacial contact between the catalyst and reactant or electrolyte directly correlates with the Rct value. It was discovered that the measured Rct value followed the order of BiFe1−xLixO3 loaded graphene-based cathode with 0.5 mg/cm2 (257.29 Ω), 1 mg/cm2 [BiFe1−xLixO3] (163 Ω). 1.5 mg/cm2 [BiFe1−xLixO3] (126.3 Ω); 2 mg/cm2 [BiFe1−xLixO3] (80.6 Ω); and 2.5 mg/cm2 [BiFe1−xLixO3] (78.0 Ω). The concentration of 2.5 mg/cm2 [BiFe1−xLixO3]-graphene electrode had superior charge transport, as evidenced by a lower Rct value. According to the most significant reduction current achieved from the [BiFe1−xLixO3]-graphene composite, the oxygen reduction rate increased by the quicker electron transport (Figure 11). The higher ORR activity and better charge transport property from the [BiFe1−xLixO3]-graphene composite were thought to be due to the two-dimensional platform structure of graphene, which makes it an excellent supporting matrix for [BiFe1−xLixO3] with much higher connectivity. The compounds closely linked to graphene also had strong adsorption capacities and were anticipated to provide excellent choices for adsorbent materials with catalysts. Additionally, the [BiFe1−xLixO3] on which the electrochemical reduction in oxygen occurred can benefit from the strong electrical conductivity of graphene, granted by its 2D planar p-conjugation structure. This enhanced the electrochemical performance. The Rct obtained from the impedance spectra and the reduction in internal resistance were consistent (Figure 12). These EIS results corroborated the earlier results.

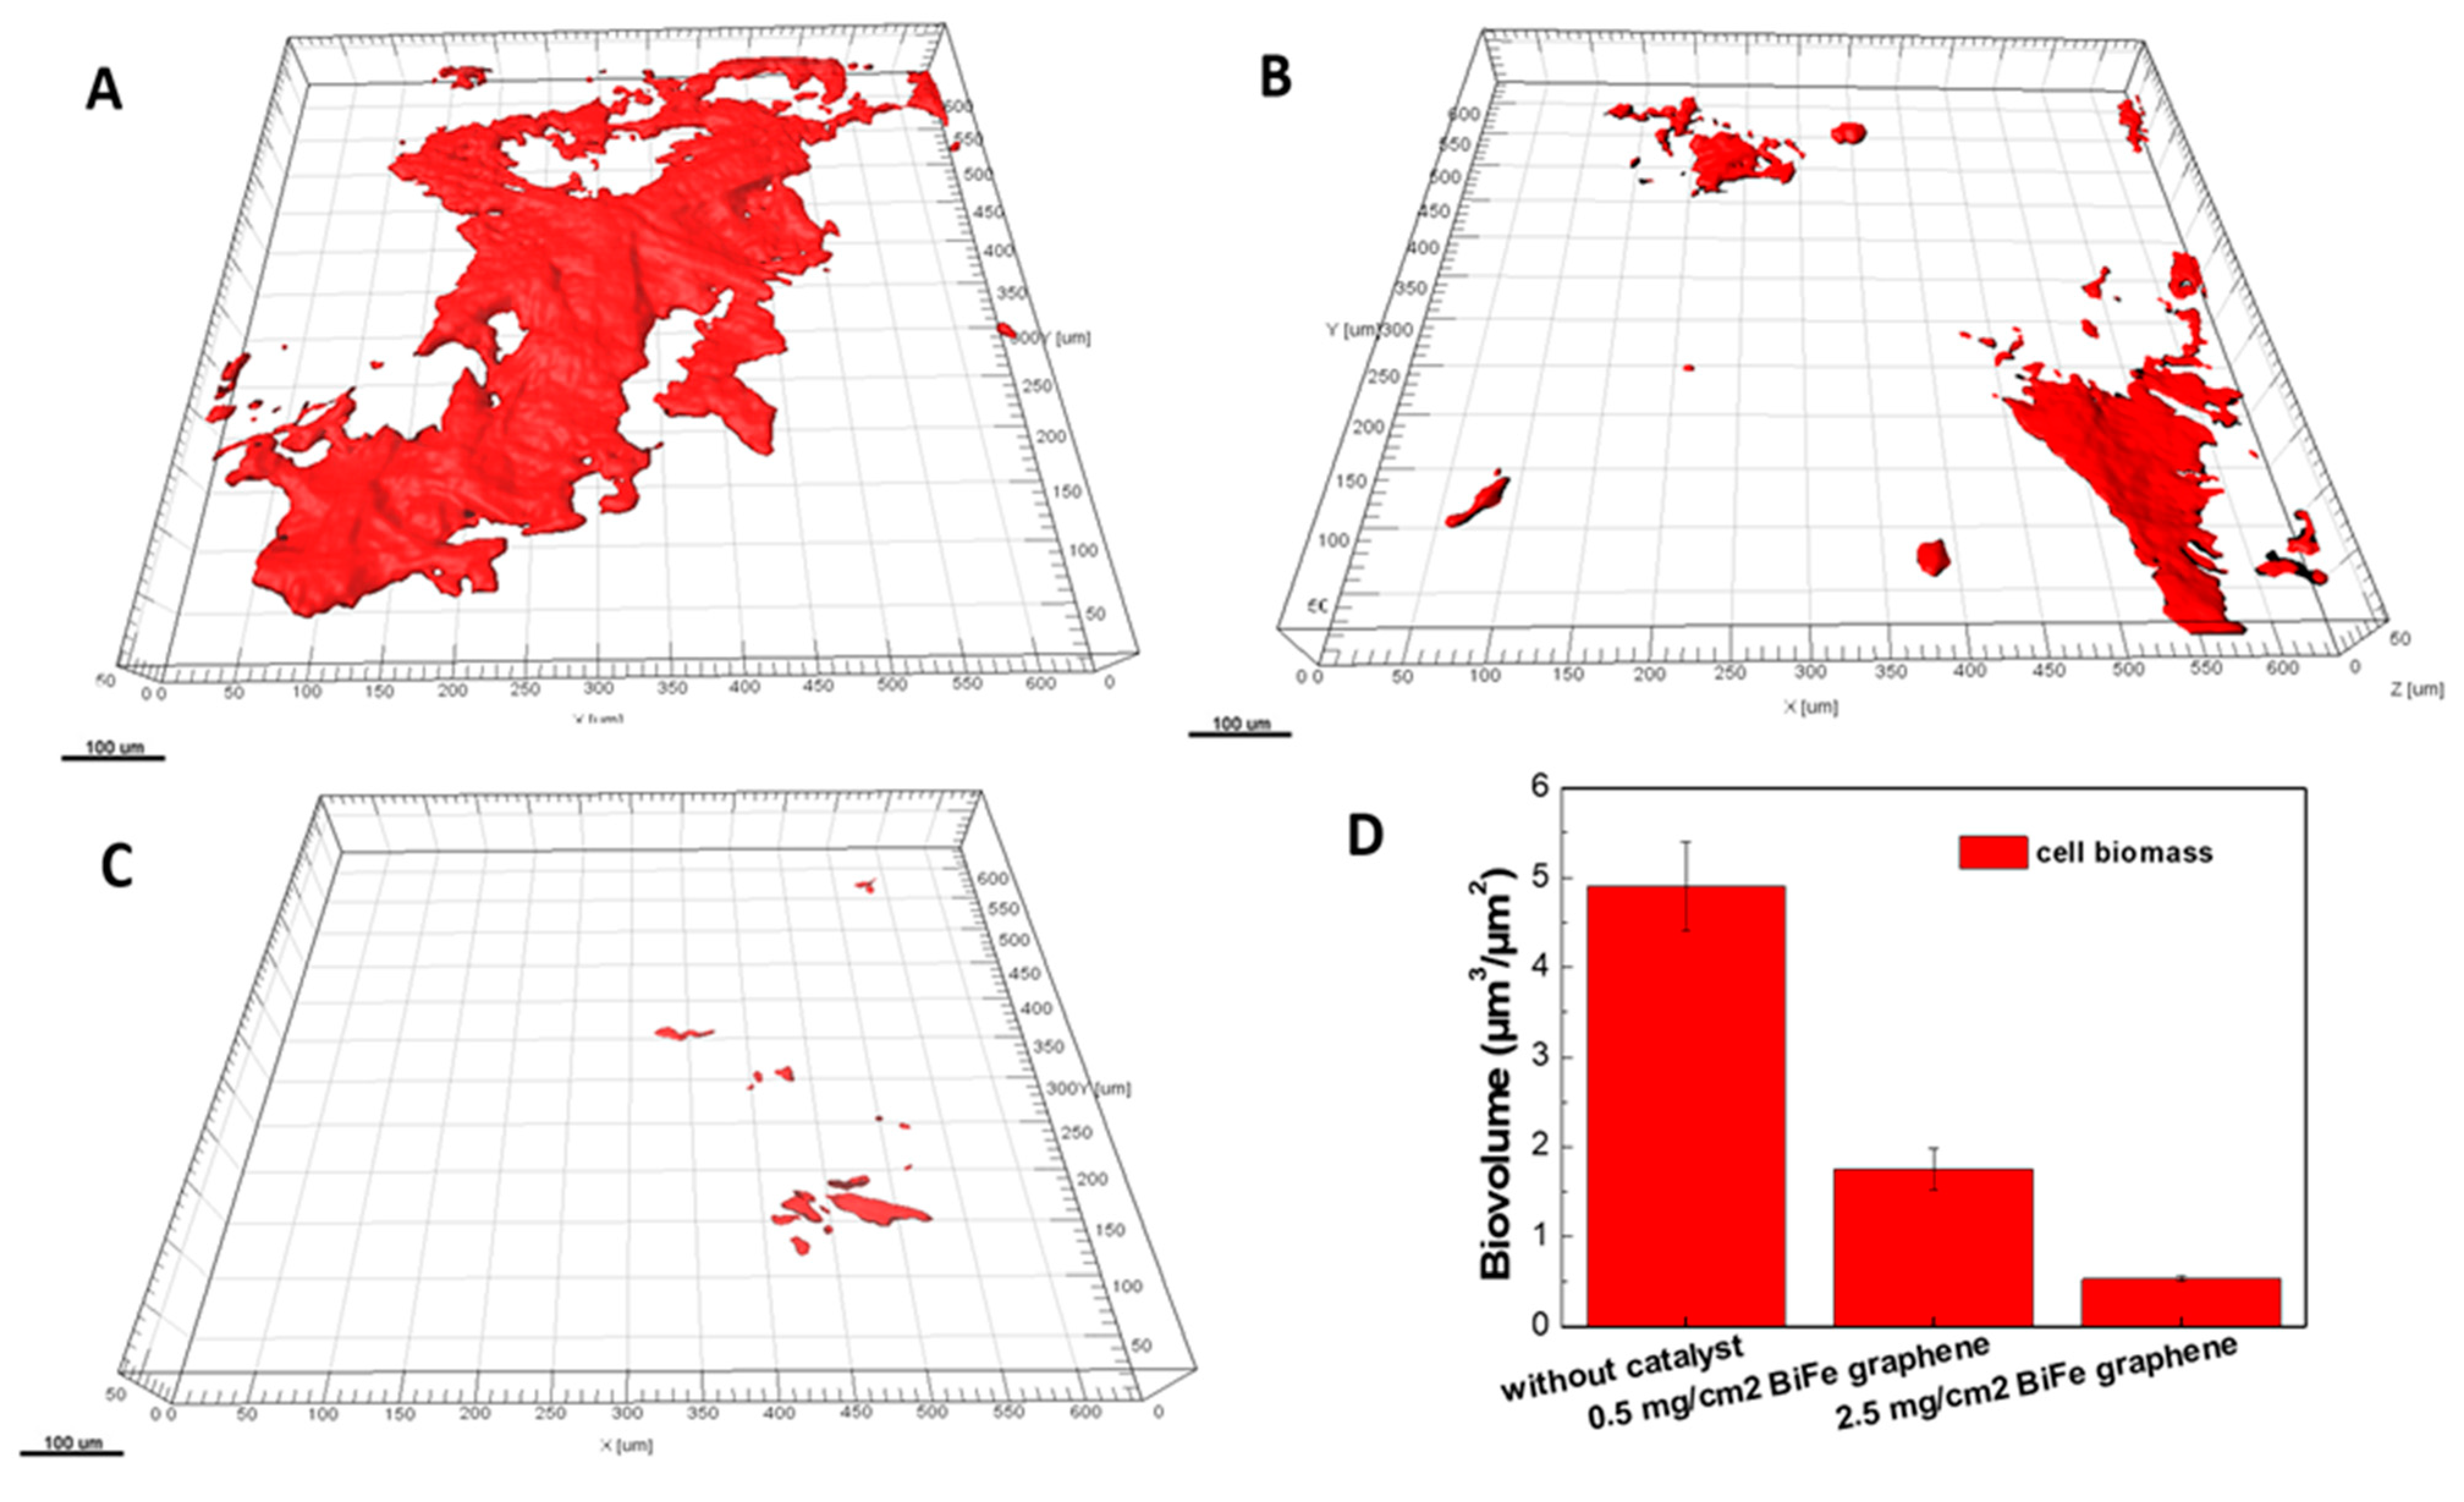
2.11. Evaluation of Biofouling on the Different Concentrations of [BiFe1−xLixO3]-Loaded Graphene Composite Cathode Surface

The ORR on the cathode produces H2O as the end product. The moisture presence on the cathode often causes biofouling after the long-term operation of MFCs [30]. The present study evaluated the extent of microbial fouling using propidium iodide dye-based CLSM technique [31]. Using CLSM, the biofilm development and its constituent parts on the various graphite electrode surfaces were studied [32]. Figure 13 depicts biofouling formation’s quantifiable outcomes on various concentration of [BiFe1−xLixO3]graphene composite cathodes after the end of the 36th batch operation of MFCs. The cathode was removed, cut into pieces, and stained aseptically. Furthermore, those pieces were subjected to a CLSM study [33]. The data in Figure 13 were computed using the COMSTAT program. Compared to the 2.5 and 0.5 mg/cm2 [BiFe1−xLixO3]graphene composite cathode, noticeably higher biomass of cells was seen on the MFC having cathode without a catalyst composite with an average biovolume of 4.93 m3/m2 (Figure 13A). The biovolume of the cell biomass as fouled cathode for the 0.5 mg/cm2 and 2.5 mg/cm2 [BiFe1−xLixO3]graphene composite cathode were measured to be 1.73 m3/m2 and 0.539 m3/m2, respectively (Figure 13B,C). The IMARIS 3D pictures confirmed the findings of the COMSTAT analysis. From the IMARIS picture, it can be observed that the catalyst without catalyst composite had a substantial amount of cell biomass present on the surface of the cathode without a catalyst; in contrast, the 0.5 mg/cm2 [BiFe1−xLixO3]-graphene composite (b) and 2.5 mg/cm2 [BiFe1−xLixO3]-graphene composite cathode (c) had less cell biomass (Figure 13). This result indicated that [BiFe1−xLixO3]-graphene composite could be useful in removing unwanted biofilm. Overall results suggest that [BiFe1−xLixO3]-graphene composite can be utilized as multifunctional material, an efficient ORR catalyst, and antifouling agent suitable for MFC cathode application.
MFC was proven to be a successful wastewater treatment method producing power. The MFC’s efficiency suggests the elimination of COD from wastewater treatment. High COD elimination (using substrate or waste) demonstrated the mixed microflora’s helpful role in wastewater treatment along with effective ORR to complete electrochemical reaction. The COD removal in MFC increased by adding [BiFe1−xLixO3] to graphene. The highest stable COD removal of 78.5% was achieved at 2.5 mg cm2 [BiFe1−xLixO3]. [BiFe1−xLixO3] and [BiFe1−xLixO3]-graphene showed a further rise in CO.D. removal capacity to 82.9% and 83.7%, respectively, with 2 and 2.5 mg cm2 [BiFe1−xLixO3]. The greatest CE from the MFC with the 2.5 mg/cm2 [BiFe1−xLixO3]-graphene composite cathode (11.5%), indicating that the [BiFe1−xLixO3]-loaded composite played a significant role in cathodic reduction, which, in turn, improves the anodic oxidation kinetics. The enhanced COD removal during wastewater treatment and energy output through the bioelectrochemical system were thought to result from the MFC’s more significant protons and electrons consumption.

3. Materials and Methods

3.1. Synthesis of [BiFe1−xLixO3]-Graphene Nanocomposite

To synthesize nano BiFe1−xLixO3 nanoparticles, Bi(NO3)3·5H2O, Fe(NO3)3·9H2O, LiNO3, and tartaric acid (C6H6O7) were used as stating chemicals. All the chemicals were purchased from Sigma Aldrich and were of analytical grade. Graphene (5–10 layers, thickness 5–10 nm, and size X-Y 5–10 μm) was purchased from Ad Nano. In a sol-gel method for nano BiFeO3 nanoparticles, appraised amount of Fe(NO3)3·9H2O and Bi(NO3)3·5H2O were dissolved in (DI) deionized water [21]. Bi(NO3)3·5H2O forms bismuth hydroxide in water; so, Bi(NO3)3·5H2O was first disintegrated in 50–60 mL deionized water with continuous stirring and 14–80 mL dilute nitric acid was added to obtain a strong crystal clear solution followed by addition of Fe(NO3)3·9H2O solution. Then, the stoichiometric quantity of C6H6O7 was added to it, so that the nitrates could be completely combusted. The crystal clear yellow-colored solution was vigorously stirred upon a hot plate for ~12 hrs at 60–80 °C. This transparent solution was dried up on the stirrer for 48 h at 60–80 °C to obtain a fluffy gel. Thus, fluffy gel obtained from a hot plate was sintered at 55 °C for about 2 h in an air environment. After the sintering process, the powder was grounded into mortar and pestle.
Similarly, nanoparticles of BiFe1−xLixO3 samples were prepared by following the steps mentioned above of the sol-gel method. An estimated amount of lithium nitrates was added to the precursor crystal clear solution, and all other synthesis conditions were kept the same. The synthesis of [BiFe1−xLixO3]-graphene nanocomposites was completed by the sonication method [17]. The calculated amount of [BiFe1−xLixO3] and graphene 5–10 layers were mixed in 100 mL ethanol. The ready solution was set aside in a probe sonicator with a titanium horn 6 mm and a frequency of 20–25 watts (Labmann Pro650). The settings for synthesizing nanocomposites of probe sonicator were pulse rate (3 s on/off), power 130 watts with the cut-off temperature 45 °C. The prepared solution was vigorously sonicated under similar situations for the next 15 min. The resulting dark solution was filtered and dried in an oven at 60 °C for 12 h to obtain [BiFe1−xLixO3]-graphene nanocomposite.

3.2. Characterization of [BiFe1−xLixO3]-Graphene Nanocomposite

The [BiFe1−xLixO3]-graphene nanocomposites were structurally characterized by an X-ray diffractometer (XRD, MiniFlex 600, Rigaku, Japan). The room temperature measurements were completed using a CuKα radiation source (λ = 1.5406 Å, operated at 40 kV and 40 mA) in the scan range 5° to 80° with the step size 0.02° and scan rate 2 degrees/min. Field effect scanning electron (FESEM) microscopic images were recorded using a Nova Nano FESEM-450 (Boynton Beach, FL, USA) operated at 10–15 kV. The elemental mapping of the [BiFe1−xLixO3]-graphene nanocomposite was also completed using the EDXS in the FESEM attachment. Raman spectroscopy measurements were completed in the backscattering configuration using the LabRAM HR, HORIBA system (Montpellier, France) with a charge-coupled device detector and excitation source LASER 532 nm. LASER power was set aside below 10 mW to evade any sample heating effect. The characteristic vibrational and rotational modes were characterized by Fourier transformed infrared (FTIR) spectroscopy performed on a spectrum BX-II spectrophotometer (PerkinElmer, Waltham, MA, USA) with a spectral resolution of 1 cm−1. The room temperature FTIR measurements of [BiFe1−xLixO3]-graphene nanocomposite were completed in the reflectance method range of 400–4000 cm−1. The optical properties of [BiFe1−xLixO3]-graphene nanocomposite were analyzed by using a LABMAN-900S UV–visible spectrometer (Labman Scientific Instruments Pvt. Ltd., Chennai, India). To find out the photocatalytic degradation of CIP antibiotic, a 150 watt Hg bulb (Make-Lelesil Innovative Systems, India-400604, Medium Pressure lamp with built-in resister and quartz glass outer sell) was set aside in a water circulating container positioned in a quartz container of the capacity 500 mL at persistent temperature (under 10 °C) and incessant stirring. An equivalent quantity of samples was collected to observe antibiotic degeneration with time under ultraviolet-visible light. After the centrifugal process, all samples were passed through UV-visible absorbance spectra to determine their CIP (ciprofloxacin) degradation efficiency comparative data.

3.3. Electrochemical Study for [BiFe1−xLixO3]-Graphene Composite-Loaded Cathode

Electrochemical analysis of as-synthesized [BiFe1−xLixO3]-graphene composite and composite catalysts was performed by cyclic voltammetry (CV) with a BioLogic SP-150 electrochemical analyzer. The as-synthesized [BiFe1−xLixO3] and composite catalysts were electrochemically analyzed using cyclic voltammetry (CV) with the electrochemical analyzer. For all experiments, [BiFe1−xLixO3]-graphene composite-coated graphite sheet, Pt wire, and Ag/AgCl (KCl saturated; +197 mV) were used as the working, counter, and reference electrodes, respectively. CV was measured in 1 M KCl at a 10 mV scan rate from 0.0 to 0.6 V [34]. Before the experiment, the KCl solution was oxygenated by air bubbling for 30 min.

3.4. Construction of MFC

The experimental study used nine identical sMFCs. The 110 mL anode contained cuboidal chambers made of transparent polyacrylic material with exterior dimensions of 7 × 8 × 3.5 cm3. One port was for the electrode terminal, while the other was for sampling and the reference electrode (Ag/AgCl, saturated KCl; +197 mV, Equiptronics, India). The anode chamber had two ports at the top [25]. The other ports were sealed with clamped tubes to provide an anaerobic atmosphere. Before the experiment, the sMFC was cleaned with 70% alcohol and placed in the UV chamber for 30 min. The terminal was created by welding a stainless-steel wire to a carbon felt anode with a working surface area of 16 cm2. Concealed copper wires were used to interconnect the external resistance to complete the circuit. An amount of 16 cm2 of graphite sheet was used as cathode material. A membrane cathode assembly (MCA) and an anode compartment were the components that made up the MFC [35]. The anodes were placed evenly apart from the MCA, maintaining the same inter-electrode spacing (2.5 cm). Different concentrations of BFO in [BiFe1−xLixO3]-graphene composite-based catalyst were loaded on the cathode using a spraying gun. Furthermore, the catalyst-loaded cathode was applied to the membrane to create the membrane cathode assembly (MCA) [36].

3.5. Inoculum and Anolyte Preparation

As a parent inoculum, anaerobic mixed microbial consortia were collected from a nearby septic tank from pH-neutral bottom sludge. Dewatered anaerobic sludge with a pH of 7.4 and a VSS of 25.54 g/L was taken from the bottom of a septic tank, pre-treated with heat, and then, used as an anodic inoculum. The inoculum sludge was first sieved using a 1 mm sieve. The anaerobic inoculum was heated (kept at 105 °C) for 15 min as part of the heat-shock pre-treatment process, it inoculum was bioaugmented with isolated electroactive bacteria Pseudomonas aeruginosa (GenBank accession number OQ619033) from the soil of Sharda university. Acetate medium was made using the ingredients recommended. The enhanced culture that resulted was injected with feed. The culture could produce a much greater output and efficiently transport electrons to the carbon cloth electrodes. These MFCs were run in fed-batch mode with repeating cycles (each cycle lasting 36 to 38 h) at room temperature, which was about 37 °C. After choosing an appropriate pre-treated inoculum, the starting anolyte pH was adjusted using a weak acid or base solution to the desired values for multiparameter optimization.

3.6. Performance Evaluation of MFCs

The operating voltage (OV) of the MFCs was measured using a data collection system, and the COD values of the anolyte were measured using a COD measuring instrument set. The sMFCs were kept in open circuit mode before the polarisation study to ensure MFCs could attain their maximum open circuit potential (OCP). Polarisation curves were plotted by changing the external resistance of the closed circuit using a variable resistance box (range 90 kΩ–20 Ω) in discrete increments and measuring the accompanying voltage drop. On average, 5 to 7 min were needed to get a steady reading during the polarization study. The coulombic efficiency, volumetric power density, and current density were determined as described elsewhere [37]. A three-electrode setup with a bioanode and Ag/AgCl as the working, counter, and reference electrodes were utilized for electrochemical tests. The identical electrode design was used to conduct MFC’s electrochemical impedance spectroscopy (EIS). EIS was conducted using a sinusoidal perturbation of 5 mV across a frequency range of 100 kHz to 1 Hz [37]. The volumetric current density was calculated as id = V/RA, where V (mV) was measured cell potential, R (Ω) was external resistance, and A (cm3) was the working volume of anolyte. Volumetric power density in MFC was calculated from P (W/m3) = VI/A, where I (Amp) was the measured cell current. The coulombic efficiency (CE) was estimated (Equation (4)) by integrating the measured current relative to the theoretical current based on consumed COD.
C E = M s I t b F b e s v A n c = 8 I t b F v A n c
where ‘F’ = Faraday constant (96,485 C/mol), ‘I’ = current generation at a particular external resistance (close circuit mode), ‘∆c’ = COD load removed in gram/L, ‘ v A n ’ = anolyte volume or substrate volume (L), and tb is batch time duration (s).

4. Conclusions

A facile, profitable, and energy-saving method was used to produce the [BiFe1−xLixO3]-graphene nanocomposites. The wide-ranging XRD investigation demonstrated that BiFe1−xLixO3 nanoparticles were intercalated into the graphene nanosheets. The FTIR and Raman spectra of the [BiFe1−xLixO3]-graphene nanocomposites evidenced the existence of both [BiFe1−xLixO3] and graphene nanostructures in the synthesized nanocomposites. The photocatalytic activity of [BiFe1−xLixO3]-graphene nanocomposites against the CIP was 2.5 times higher than that for pure BiFeO3 nanoparticles. The seeming rate constant of [BiFe1−xLixO3]-graphene nanocomposites for x = 0.02 was ~1.4 times greater than that of pristine BiFeO3 nanoparticles. The high photocatalytic activity of the [BiFe1−xLixO3]-graphene nanocomposites was described by harvesting the UV-visible light in a wide wavelength range, high surface area, and mesostructured nature. The maximum power density measured was 8.2 W/m3. The 2 mg/cm2 cathode catalyst was an optimum condition for achieving maximum power output. Future research must pay close attention to scaling up efficient cathode-based research. An efficient electrode assembly is essential for practical use, and cathode development is a critical step in that direction. However, the current coulombic efficiency is insufficient for extensive commercial use. In addition to investigating the usage of waste materials in the manufacturing of cathode electrodes, research is required to discover the best strategy to handle the current issues.

Supplementary Materials

The following supporting information can be downloaded at: https://www.mdpi.com/article/10.3390/catal13030618/s1, Figure S1: Catalytic degradation of CIP by using [BiFe1−xLixO3]-graphene nanocomposites without light irradiation for x = 0.02 sample; Figure S2: XRD of [BiFe1−xLixO3]-graphene nanocomposite before and after photocatalytic activity; Figure S3: FTIR transmittance spectra of [BiFe1−xLixO3]-graphene nanocomposite before and after photocatalytic activity.

Author Contributions

Conceptualization, S.C., S.P. and R.C.S.; experiment, T.P., A.K., B.T., S.C. and S.P.; writing—original draft preparation, S.C., S.P. and S.S.; writing—review, P.K.D., P.K.G. and A.S.M.; editing, D.L., K.K.C. and J.A.; supervision, S.C., S.P., A.S.M. and R.C.S. All authors have read and agreed to the published version of the manuscript.

Funding

S.C. received funding from the Science and Engineering Research Board (SERB), File Number TAR/2019/000210, Govt. of India, and expresses gratitude to them for their help in accomplishing the current research work. S.P. duly acknowledges the grant received from Sharda University seed grant project (SUSF2001/01). Life Sciences Research Board, Defense Research and Development Organization and Department of Science and Technology contributed to this study.

Data Availability Statement

Not applicable.

Conflicts of Interest

The authors have no known financial or personal interest that might have influenced this article.

References

  1. Di Paola, A.; García-López, E.; Marcì, G.; Palmisano, L. A Survey of Photocatalytic Materials for Environmental Remediation. J. Hazard. Mater. 2012, 211–212, 3–29. [Google Scholar] [CrossRef]
  2. Obileke, K.; Onyeaka, H.; Meyer, E.L.; Nwokolo, N. Microbial Fuel Cells, a Renewable Energy Technology for Bio-Electricity Generation: A Mini-Review. Electrochem. Commun. 2021, 125, 107003. [Google Scholar] [CrossRef]
  3. Li, F.; Sharma, Y.; Lei, Y.; Li, B.; Zhou, Q. Microbial Fuel Cells: The Effects of Configurations, Electrolyte Solutions, and Electrode Materials on Power Generation. Appl. Biochem. Biotechnol. 2010, 160, 168–181. [Google Scholar] [CrossRef] [PubMed]
  4. Wang, H. Chapter 9—Noble Metals. In Membrane-Based Separations in Metallurgy; Jiang, L.Y., Li, N., Eds.; Elsevier: Amsterdam, The Netherlands, 2017; pp. 249–272. ISBN 978-0-12-803410-1. [Google Scholar]
  5. Liu, Z.; Wu, H.; Ren, W.; Ye, Z.-G. Piezoelectric and Ferroelectric Materials: Fundamentals, Recent Progress, and Applications. In Reference Module in Chemistry, Molecular Sciences and Chemical Engineering; Elsevier: Amsterdam, The Netherlands, 2022; ISBN 978-0-12-409547-2. [Google Scholar]
  6. Khilari, S.; Pandit, S.; Varanasi, J.L.; Das, D.; Pradhan, D. Bifunctional Manganese Ferrite/Polyaniline Hybrid as Electrode Material for Enhanced Energy Recovery in Microbial Fuel Cell. ACS Appl. Mater. Interfaces 2015, 7, 20657–20666. [Google Scholar] [CrossRef]
  7. Pantea, D.; Darmstadt, H.; Kaliaguine, S.; Roy, C. Electrical Conductivity of Conductive Carbon Blacks: Influence of Surface Chemistry and Topology. Appl. Surf. Sci. 2003, 217, 181–193. [Google Scholar] [CrossRef]
  8. Dong, S.; Feng, J.; Fan, M.; Pi, Y.; Hu, L.; Han, X.; Liu, M.; Sun, J.; Sun, J. Recent Developments in Heterogeneous Photocatalytic Water Treatment Using Visible Light-Responsive Photocatalysts: A Review. RSC Adv. 2015, 5, 14610–14630. [Google Scholar] [CrossRef]
  9. Ponraj, C.; Vinitha, G.; Daniel, J. A Review on the Visible Light Active BiFeO3 Nanostructures as Suitable Photocatalyst in the Degradation of Different Textile Dyes. Environ. Nanotechnol. Monit. Manag. 2017, 7, 110–120. [Google Scholar] [CrossRef]
  10. Haruna, A.; Abdulkadir, I.; Idris, S.O. Photocatalytic Activity and Doping Effects of BiFeO3 Nanoparticles in Model Organic Dyes. Heliyon 2020, 6, e03237. [Google Scholar] [CrossRef] [PubMed] [Green Version]
  11. Niu, F.; Gao, T.; Zhang, N.; Chen, Z.; Huang, Q.; Qin, L.; Sun, X.; Huang, Y. Hydrothermal Synthesis of BiFeO3 Nanoparticles for Visible Light Photocatalytic Applications. J. Nanosci. Nanotechnol. 2015, 15, 9693–9698. [Google Scholar] [CrossRef]
  12. Shirolkar, M.M.; Hao, C.; Dong, X.; Guo, T.; Zhang, L.; Li, M.; Wang, H. Tunable multiferroic and bistable/complementary resistive switching properties of dilutely Li-doped BiFeO3 nanoparticles: An effect of aliovalent substitution. Nanoscale 2014, 6, 4735–4744. [Google Scholar] [CrossRef]
  13. Tiwari, S.K.; Sahoo, S.; Wang, N.; Huczko, A. Graphene Research and Their Outputs: Status and Prospect. J. Sci. Adv. Mater. Devices 2020, 5, 10–29. [Google Scholar] [CrossRef]
  14. Yokomizo, Y.; Krishnamurthy, S.; Kamat, P. Photoinduced Electron Charge and Discharge of Graphene–ZnO Nanoparticle Assembly. Catal. Today 2013, 199, 36–41. [Google Scholar] [CrossRef]
  15. Soltani, T.; Lee, B.-K. Sono-Synthesis of Nanocrystalized BiFeO3/Reduced Graphene Oxide Composites for Visible Photocatalytic Degradation Improvement of Bisphenol A. Chem. Eng. J. 2016, 306, 204–213. [Google Scholar] [CrossRef]
  16. Seehra, M.S.; Geddam, U.K.; Schwegler-Berry, D.; Stefaniak, A.B. Detection and quantification of 2H and 3R phases in commercial graphene-based materials. Carbon 2015, 95, 818–823. [Google Scholar] [CrossRef] [PubMed] [Green Version]
  17. Kadi, M.W.; Mohamed, R.M.; Ismail, A.A. Facile Synthesis of Mesoporous BiFeO3/Graphene Nanocomposites as Highly Photoactive under Visible Light. Opt. Mater. 2020, 104, 109842. [Google Scholar] [CrossRef]
  18. Hermet, P.; Goffinet, M.; Kreisel, J.; Ghosez. Raman and Infrared Spectra of Multiferroic Bismuth Ferrite from First Principles. Phys. Rev. B 2007, 75, 220102. [Google Scholar] [CrossRef]
  19. Bielecki, J.; Svedlindh, P.; Tibebu, D.T.; Cai, S.; Eriksson, S.G.; Börjesson, L.; Knee, C.S. Structural and magnetic properties of isovalently substituted multiferroic BiFeO3: Insights from Raman spectroscopy. Phys. Rev. B 2012, 86, 184422. [Google Scholar] [CrossRef] [Green Version]
  20. Chen, P.; Xu, X.; Koenigsmann, C.; Santulli, A.C.; Wong, S.S.; Musfeldt, J.L. Size-Dependent Infrared Phonon Modes and Ferroelectric Phase Transition in BiFeO3 Nanoparticles. Nano Lett. 2010, 10, 4526–4532. [Google Scholar] [CrossRef]
  21. Chauhan, S.; Arora, M.; Sati, P.C.; Chhoker, S.; Katyal, S.C.; Kumar, M. Structural, vibrational, optical, magnetic and dielectric properties of Bi1−xBaxFeO3 nanoparticles. Ceram. Int. 2013, 39, 6399–6405. [Google Scholar] [CrossRef]
  22. Seehra, M.S.; Narang, V.; Geddam, U.K.; Stefaniak, A.B. Correlation between X-ray Diffraction and Raman Spectra of 16 Commercial Graphene-Based Materials and Their Resulting Classification. Carbon 2017, 111, 380–384. [Google Scholar] [CrossRef] [Green Version]
  23. Xian, T.; Yang, H.; Di, L.; Ma, J.; Zhang, H.; Dai, J. Photocatalytic reduction synthesis of SrTiO3-graphene nanocomposites and their enhanced photocatalytic activity. Nanoscale Res. Lett. 2014, 9, 1–9. [Google Scholar] [CrossRef] [Green Version]
  24. Cui, Y.; Rashid, N.; Hu, N.; Rehman, M.S.U.; Han, J.-I. Electricity Generation and Microalgae Cultivation in Microbial Fuel Cell Using Microalgae-Enriched Anode and Bio-Cathode. Energy Convers. Manag. 2014, 79, 674–680. [Google Scholar] [CrossRef]
  25. Sharma, K.; Pandit, S.; Thapa, B.S.; Pant, M. Biodegradation of Congo Red Using Co-Culture Anode Inoculum in a Microbial Fuel Cell. Catalysts 2022, 12, 1219. [Google Scholar] [CrossRef]
  26. Rossi, R.; Cario, B.P.; Santoro, C.; Yang, W.; Saikaly, P.E.; Logan, B.E. Evaluation of Electrode and Solution Area-Based Resistances Enables Quantitative Comparisons of Factors Impacting Microbial Fuel Cell Performance. Environ. Sci. Technol. 2019, 53, 3977–3986. [Google Scholar] [CrossRef] [PubMed] [Green Version]
  27. Application of Graphene in Electronic Devices|Encyclopedia MDPI. Available online: https://encyclopedia.pub/entry/29675 (accessed on 9 December 2022).
  28. Schulze, M.C.; Neale, N.R. Half-Cell Cumulative Efficiency Forecasts Full-Cell Capacity Retention in Lithium-Ion Batteries. ACS Energy Lett. 2021, 6, 1082–1086. [Google Scholar] [CrossRef]
  29. Open Circuit Potential (OCP). Pine Research Instrumentation Store; Pine Research Instrumentation: Durham, NC, USA, 2019. [Google Scholar]
  30. Kolajo, O.O.; Pandit, C.; Thapa, B.S.; Pandit, S.; Mathuriya, A.S.; Gupta, P.K.; Jadhav, D.A.; Lahiri, D.; Nag, M.; Upadhye, V.J. Impact of Cathode Biofouling in Microbial Fuel Cells and Mitigation Techniques. Biocatal. Agric. Biotechnol. 2022, 43, 102408. [Google Scholar] [CrossRef]
  31. Vempaty, A.; Kumar, A.; Pandit, S.; Gupta, M.; Mathuriya, A.S.; Lahiri, D.; Nag, M.; Kumar, Y.; Joshi, S.; Kumar, N. Evaluation of the Datura Peels Derived Biochar-Based Anode for Enhancing Power Output in Microbial Fuel Cell Application. Biocatal. Agric. Biotechnol. 2023, 47, 102560. [Google Scholar] [CrossRef]
  32. Pandit, S.; Khanna, S.; Mathuriya, A.S. Analysis of Pyridine-2-Carbaldehyde Thiosemicarbazone as an Anti-Biofouling Cathodic Agent in Microbial Fuel Cell. Appl. Microbiol. Biotechnol. 2023, 107, 459–472. [Google Scholar] [CrossRef]
  33. Chauhan, S.; Kumar, A.; Pandit, S.; Vempaty, A.; Kumar, M.; Thapa, B.S.; Rai, N.; Peera, S.G. Investigating the Performance of a Zinc Oxide Impregnated Polyvinyl Alcohol-Based Low-Cost Cation Exchange Membrane in Microbial Fuel Cells. Membranes 2023, 13, 55. [Google Scholar] [CrossRef]
  34. Khilari, S.; Pandit, S.; Ghangrekar, M.M.; Das, D.; Pradhan, D. Graphene Supported α-MnO2 Nanotubes as a Cathode Catalyst for Improved Power Generation and Wastewater Treatment in Single-Chambered Microbial Fuel Cells. RSC Adv. 2013, 3, 7902–7911. [Google Scholar] [CrossRef]
  35. Kumar, A.; Narayanan, S.S.; Thapa, B.S.; Pandit, S.; Pant, K.; Mukhopadhyay, A.K.; Peera, S.G. Application of Low-Cost Plant-Derived Carbon Dots as a Sustainable Anode Catalyst in Microbial Fuel Cells for Improved Wastewater Treatment and Power Output. Catalysts 2022, 12, 1580. [Google Scholar] [CrossRef]
  36. Sharma, K.; Singh, V.; Pandit, S.; Thapa, B.S.; Pant, K.; Tusher, T.R. Isolation of Biosurfactant-Producing Bacteria and Their Co-Culture Application in Microbial Fuel Cell for Simultaneous Hydrocarbon Degradation and Power Generation. Sustainability 2022, 14, 15638. [Google Scholar] [CrossRef]
  37. Tripathi, B.; Pandit, S.; Sharma, A.; Chauhan, S.; Mathuriya, A.S.; Dikshit, P.K.; Gupta, P.K.; Singh, R.C.; Sahni, M.; Pant, K.; et al. Modification of Graphite Sheet Anode with Iron (II, III) Oxide-Carbon Dots for Enhancing the Performance of Microbial Fuel Cell. Catalysts 2022, 12, 1040. [Google Scholar] [CrossRef]
Figure 1. XRD patterns of graphene 5–10 layers, BiFeO3 nanoparticles, and [BiFe1−xLixO3]-graphene nanocomposite.
Catalysts 13 00618 g001
Figure 2. FESEM images of the [BiFe1−xLixO3]-graphene nanocomposite (a) x = 0.04 and (b) x = 0.06. EDXS Analysis of the [BiFe1−xLixO3]-graphene nanocomposite (c) x = 0.04 and (d) x = 0.06.
Catalysts 13 00618 g002
Figure 3. The energy dispersive X-ray spectroscopy image of [BiFe1−xLixO3]-graphene nanocomposite. (aa4) x = 0.04 and (bb4) x = 0.06.
Catalysts 13 00618 g003
Figure 4. (a) Room temperature Raman spectra of [BiFe1−xLixO3]-graphene nanocomposite. The inset of (a) shows the Raman spectra of BiFeO3 nanoparticles. (bd) Magnified Raman Spectra of the [BiFe1−xLixO3]-graphene nanocomposite.
Catalysts 13 00618 g004
Figure 5. FTIR transmittance spectra of [BiFe1−xLixO3]-graphene nanocomposite. The inset shows the FTIR transmittance spectra of BiFeO3 nanoparticles.
Catalysts 13 00618 g005
Figure 6. (a) UV-visible absorption spectra of [BiFe1−xLixO3]-graphene nanocomposite. (bd) Tauc Plot ((αhν)2 vs. hν) of [BiFe1−xLixO3]-graphene nanocomposite.
Catalysts 13 00618 g006
Figure 7. Photocatalytic degradation of CIP by using [BiFe1−xLixO3]-graphene nanocomposites. (a) x = 0.00, (b) x = 0.02, (c) x = 0.04 and (d) x = 0.06. Inset (c) and (d) shows the C/Co vs. time and −Log(C/Co) vs. time of CIP degradation with [BiFe1−xLixO3]-graphene nanocomposites.
Catalysts 13 00618 g007
Figure 8. Photocatalytic degradation of CIP in the presence and absence of trapping agents (EDTA and IPA) with BiFe1−xLixO3-graphene nanocomposite (x = 0.02). (a) Absence of trapping agents, (b) with EDTA and (c) with IPA, (d) C/Co vs. time curves.
Catalysts 13 00618 g008
Figure 9. Cyclic voltammograms of [BiFe1−xLixO3]-graphene composites loaded electrodes in air saturated 1 M KCl solution.
Catalysts 13 00618 g009
Figure 10. Polarization curve with open circuit potential and power density measurements at variable external resistance (Rext). The voltage and power density data points are presented as solid and open symbols. A fixed quantity of graphene (0.3 gm/cm2) was loaded to different conc. of BiFe1−xLixO3 support for the comparison.
Catalysts 13 00618 g010
Figure 11. Polarization data for anode and cathode half-cell. The anode and cathode half-cell data points are presented as solid and open symbols. A fixed quantity of graphene (0.3 gm/cm2) was loaded to different conc of BiFe1−xLixO3 support for the comparison (0.5–2.5 mg/cm2).
Catalysts 13 00618 g011
Figure 12. Nyquist plot of the MFC with different concentration of [BiFe1−xLixO3]-loaded graphene composite cathode concentrations.
Catalysts 13 00618 g012
Figure 13. IMARIS 3-D images of biofilms on different concentrations of [BiFe1−xLixO3]graphene composite cathode. Biomass cell can be seen as red clumps. (A). cathode surface without catalyst; (B). 0.5 mg/cm2 cathode catalyst; (B,C) 0.5 mg/cm2 cathode catalyst. (D) the biovolume of microbial fouling on different catalyst loading cathode surface. Every image is a perspective that measures several 600 µm by 600 µm.
Catalysts 13 00618 g013
Disclaimer/Publisher’s Note: The statements, opinions and data contained in all publications are solely those of the individual author(s) and contributor(s) and not of MDPI and/or the editor(s). MDPI and/or the editor(s) disclaim responsibility for any injury to people or property resulting from any ideas, methods, instructions or products referred to in the content.

